Oregon Investment Council December 3, 2014 9:00 AM PERS Headquarters 11410 S.W. 68 th Parkway Tigard, OR 97223 Dick Solomon Chair John Skjervem Chief Investment Officer Ted Wheeler State Treasurer
Transcript
Oregon
Investment
Council
December 3, 2014
9:00 AM
PERS Headquarters
11410 S.W. 68th Parkway
Tigard, OR 97223
Dick Solomon
Chair
John Skjervem
Chief Investment Officer
Ted Wheeler
State Treasurer
OREGON INVESTMENT COUNCIL
2015 Schedule
Meetings Begin at 9:00 am
PERS Headquarters Building 11410 S.W. 68th Parkway
Tigard, OR 97223
Wednesday, February 4, 2015
Wednesday, March 4, 2015
Wednesday, April 29, 2015
Wednesday, June 3, 2015
Wednesday, July29, 2015
Wednesday, September 16, 2015
Wednesday, October 28, 2015
Wednesday, December 9, 2015
Dick Solomon Katy Durant Rukaiyah Adams Keith Larson Ted Wheeler Steve Rodeman Chair Vice-Chair Member Member State Treasurer PERS Director
OREGON INVESTMENT COUNCIL
Agenda
December 3, 2014
9:00 AM
PERS Headquarters
11410 S.W. 68th
Parkway
Tigard, OR 97223
Time A. Action Items Presenter Tab
9:00-9:05 1. Review & Approval of Minutes Dick Solomon 1
10:15-10:50 5. OPERF Alternative Portfolio Ben Mahon 5
Annual Review Investment Officer
10:50-11:25 6. OPERF Opportunity Portfolio John Hershey 6
Annual Review Director of Alternative Investments
Dick Solomon Katy Durant Rukaiyah Adams Keith Larson Ted Wheeler Steve Rodeman Chair Vice-Chair Member Member State Treasurer PERS Director
OIC Meeting Agenda
December 3, 2014
Page 2
11:25-11:45 7. OPERF Q3 Performance Review Jim Callahan 7
Callan Associates, Inc.
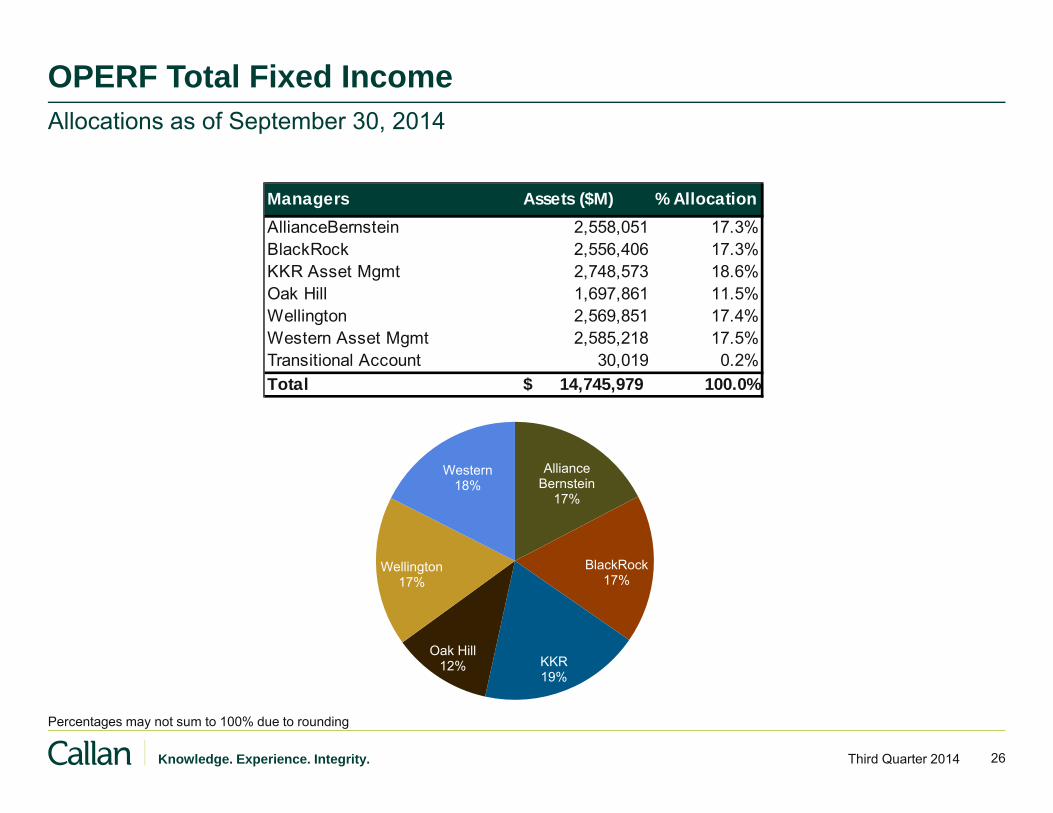
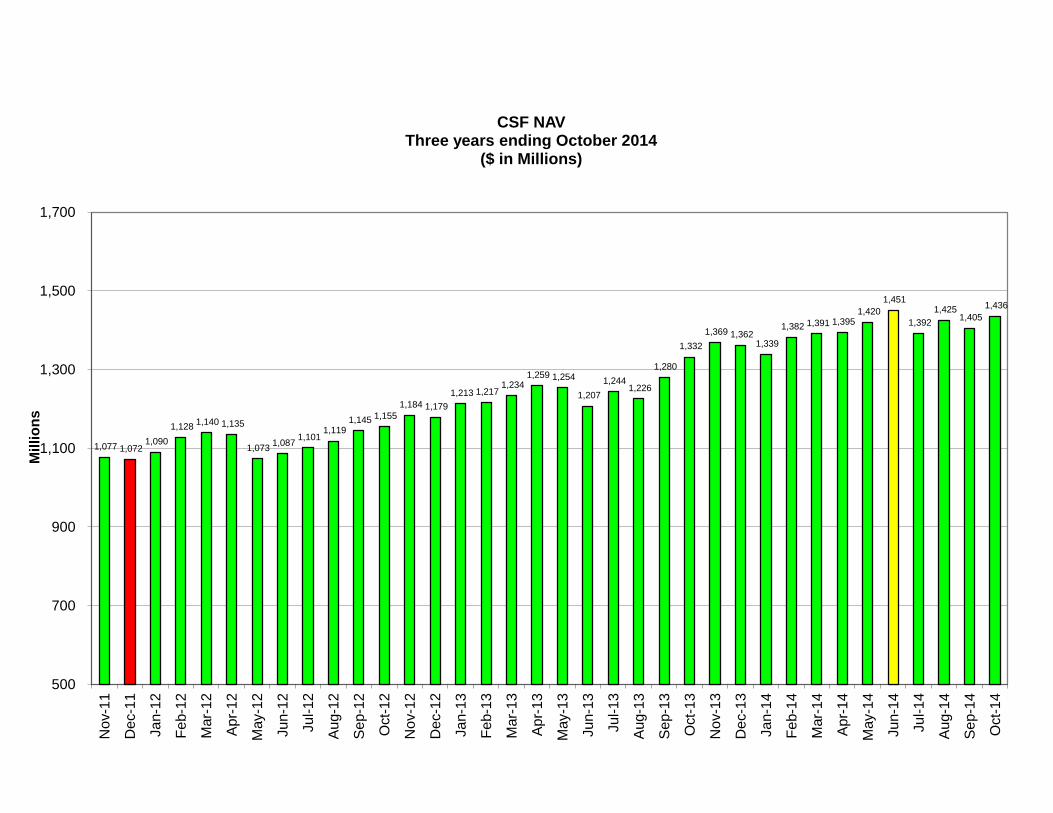
11:45-11:50 8. Asset Allocations & NAV Updates John Skjervem 8
a. Oregon Public Employees Retirement Fund
b. SAIF Corporation
c. Common School Fund
d. HiEd Pooled Endowment Fund
9. Calendar — Future Agenda Items 9
10. Other Items Council
Staff
Consultants
C. Public Comment Invited
15 Minutes
TAB 1 – REVIEW & APPROVAL OF MINUTES
December 03, 2014 Regular Meeting
OST Committee Reports – Verbal
JOHN D. SKJERVEM CHIEF INVESTMENT OFFICER INVESTMENT DIVISION
PHONE 503-378-4111 FAX 503-378-6772
STATE OF OREGON OFFICE OF THE STATE TREASURER
350 WINTER STREET NE, SUITE 100 SALEM, OREGON 97301-3896
OREGON INVESTMENT COUNCIL NOVEMBER 5, 2014 MEETING MINUTES
Members Present: Rukaiyah Adams, Paul Cleary, Katy Durant, Dick Solomon, Ted Wheeler
Member Participating by Phone: Keith Larson
Staff Present: Darren Bond, Austin Carmichael, Karl Cheng, Michael Cox, Garrett Cudahey, Debra Day, Scott Harra, John Hershey, Julie Jackson, Perrin Lim, Tom Lofton, Ben Mahon, Mike Mueller, Paola Nealon, Tom Rinehart, Priyanka Shukla, John Skjervem, Michael Viteri
Consultants Present: David Fann and Tom Martin (TorreyCove); Allan Emkin, David Glickman, John Linder and Dillon Lorda (PCA); Jim Callahan, Uvan Tseng, and Janet Becker-Wold (Callan)
Legal Counsel Present: Dee Carlson and Deena Bothello, Oregon Department of Justice
The November 5, 2014 OIC meeting was called to order at 9:00 am by Dick Solomon, Chair.
I. 9:02 am Review and Approval of Minutes MOTION: Treasurer Wheeler moved approval of the September 24, 2014 meeting minutes. Ms. Durant seconded the motion, which then passed by a 5/0 vote.
COMMITTEE REPORTS John Skjervem, CIO gave an update on the following committee actions taken since the September 24, 2014 OIC meeting:
Private Equity Committee – 2014: October 27, 2014 Advent Latin America PE Fund VI, L.P. up to $100 million October 27, 2014 Black Diamond Capital Management IV, L.P. $200 million October 27, 2014 Francisco Partners IV, L.P. up to $200 million -- OPERF
up to $25 million -- CSF
Alternatives Portfolio Committee – 2014: October 13, 2014 Sheridan Production Partners Fund III $250 million
Opportunity Portfolio Committee – 2014: NONE
OREGON INVESTMENT COUNCIL NOVEMBER 5, 2014 MEETING MINUTES
Page 2
Real Estate Committee – 2014: NONE
II. 9:03 am Oregon Short Term Fund – Annual Review Garrett Cudahey, Investment Officer presented the annual review of the Oregon Short Term Fund (OSTF), which included submission of the OSTF annual audited financial statements. Mr. Cudahey also sought approval for revisions to Investment Policy 4.02.03, the OSTF Portfolio Rules, which would allow asset-backed securities (ABS) as OSTF-eligible.
MOTION: Ms. Adams moved approval of the staff recommendation. Ms. Durant seconded the motion, which then passed on a 5/0 vote.
III. 9:20 am Oregon Savings Growth Plan – 457 Plan Investment Options Karl Cheng, Investment Officer recommended creating an Environmental Social Governance (ESG) option within the Oregon Savings Growth Plan using the TIAA-CREF Social Choice Equity Fund.
The Oregon Savings Growth Plan (the “Plan” or “OSGP”) is the State of Oregon’s 457 deferred compensation plan. OSGP is a voluntary supplemental retirement plan that provides eligible state and local government employees the opportunity to defer a portion of their current salary on a pre-tax or after-tax (Roth) basis. These deferrals are invested in various investment options until participants draw funds at retirement. The Plan offers an array of specific equity and fixed income investment options, a suite of target-date retirement funds (which in aggregate are considered one investment option) and a self-directed brokerage option. The plan has approximately 25,000 participants and assets totaling over $1.63 billion as of June 30, 2014.
With support and assistance from the Oregon State Treasury investment division, the OIC is responsible for oversight of the Plan’s investment program. Oversight of the Plan’s administrative operation is the responsibility of the Oregon Public Employees Retirement System Board with support from the OSGP manager. Additional oversight is provided by a seven-member Deferred Compensation Advisory Committee established under ORS 243.505.
MOTION: Treasurer Wheeler moved approval of the staff recommendation. Ms. Adams seconded the motion, which then passed on a 5/0 vote.
IV. 9:30 am OIC Investment Beliefs John Skjervem, OST Chief Investment Officer and Allan Emkin with PCA provided an update on the Investment Beliefs project and presented proposed changes to the OIC’s existing set of Investment Beliefs. The proposed changes were discussed, and further revisions were requested for consideration at the December OIC meeting.
V. 10:00 am 2015 OIC Meeting Calendar The proposed 2015 OIC meeting calendar was presented as follows:
Meetings Begin at 9:00 am
PERS Headquarters Building 11410 S.W. 68th Parkway
Tigard, OR 97223
OREGON INVESTMENT COUNCIL NOVEMBER 5, 2014 MEETING MINUTES
Page 3
Wednesday, February 4, 2015
Wednesday, March 4, 2015
Wednesday, April 29, 2015
Wednesday, June 3, 2015
Wednesday, July 29, 2015
Wednesday, September 16, 2015
Wednesday, October 28, 2015
Wednesday, December 9, 2015
MOTION: Ms. Adams moved approval of the proposed 2015 meeting dates. Treasurer Wheeler seconded the motion, which then passed on a 5/0 vote.
VI. 10:15 am SAIF Annual Review Mike Mueller, OST Deputy Chief Investment Officer introduced John Gilkey and Gina Manley with SAIF Corporation who then gave an update on SAIF, its operating condition and financial profile. The OST-managed SAIF investment portfolio has performed well over the past decade, and as of September 30, 2014, approached an all-time high market value of $4.7 billion. Over the most recent five-year period, SAIF’s investment portfolio generated an average annual return of 6.7 percent, exceeding its corresponding 6.1 percent policy benchmark return. Over the trailing 10-year period, and on an average, annual basis, the fund has returned 5.9 percent versus its 5.5 percent policy benchmark return.
VII. 10:30 am OPERF Public Equity Review Michael Viteri, Senior Investment Officer and Jim Callahan with Callan Associates presented the annual OPERF public equity review. In OPERF’s domestic equity portfolio, consistent excess returns from traditional, discretionary active management have been difficult to achieve. In this highly efficient segment of the market, staff proposed complementing the portfolio’s existing and long-standing overweight to small cap stocks with a systematic, low cost bias or “tilt” toward value stocks. Historically, size (i.e., small cap) and value factors have generated statistically significant excess returns; moreover, exposure to these two factors – rather than stock picking prowess – often explains much or all of active managers’ “alpha” over time. Accordingly, staff believes that strategies engineered to effect low cost factor tilts have, net of fees, a higher probability of long-term outperformance than traditional strategies based on discretionary active management methodologies. To facilitate restructuring OPERF’s domestic equity portfolio consistent with the rationale described above, Staff also recommended changes to OIC Policy 04.05.01 – Strategic Role of Public Equity Securities within OPERF. These changes include removing the portfolio’s active/passive target, reducing its strategic small cap overweight target from 100% to 70% and introducing a strategic target (and accompanying range) for a new, value factor tilt. MOTION: Treasurer Wheeler moved approval of the staff recommendation. Ms. Durant seconded the motion, which then passed on a 5/0 vote.
VIII. 11:20 am Asset Allocation & NAV Updates Mr. Skjervem reviewed asset allocations and NAV’s across OST-managed accounts for the period ended September 30, 2014.
OREGON INVESTMENT COUNCIL NOVEMBER 5, 2014 MEETING MINUTES
Page 4
IX. 11:22 am Calendar-Future Agenda Items Mr. Skjervem presented a revised schedule of future OIC meetings and associated agenda topics.
X. 11:22 am Other Items On behalf of current and past OIC members, Chairman Solomon expressed appreciation for the many contributions and long service of Paul Cleary, who is retiring from his Executive Director role at PERS on November 30, 2014. Mr. Cleary then introduced his successor, Steve Rodeman, and extended his own thanks to fellow OIC members and OST staff for their collective efforts on behalf of PERS and its many thousand individual beneficiaries.
11:35 am Public Comments Rob Sisk with SEIU thanked the OIC for its approval of the TIAA-CREF Social Choice Equity Fund as a new option within the State’s 457 voluntary investment program.
Mr. Solomon adjourned the meeting at 11:37 am.
Respectfully submitted,
Julie Jackson Executive Support Specialist
TAB 2 – INVESTMENT BELIEFS &
STATEMENT OF INVESTMENT OBJECTIVES AND
POLICY FRAMEWORK FOR OPERF UPDATES
Oregon Investment Council
Statement
of
Investment and Management Beliefs
Adopted: October 30, 2013
Revised: December 3, 2014
Page 2 of 6
Contents
Preamble
1. The OIC Sets Policy and is Ultimately Responsible for the Investment Program
2. Asset Allocation Drives Risk and Return
3. The Equity Risk Premium Will Be Rewarded
4. Private Market Investments Can Add Significant Value and Represent a Core OIC/OST
Competency
5. Capital Markets Have Inefficiencies That Can Be Exploited
6. Costs Directly Impact Investment Returns and Should Be Monitored and Managed Carefully
7. Fair and Transparent Capital Markets are Essential for Long-Term Investment Success
Preamble
This Statement of Investment and Management Beliefs enumerates fundamental investment and
management principles that guide the Oregon Investment Council (“Council” or “OIC) in
performing its fiduciary and statutory obligations which include establishing policies for the
investment and management of “investment funds” as defined in Oregon Revised Statue
293.701(2). The Oregon State Treasurer, largely through the Investment Division of the Office
of the State Treasurer (“Treasurer” or “OST”), provides staff support for the Council and, as the
Council’s statutorily designated “investment officer” (together with such other persons
determined qualified by the Council to conduct investment and management functions on its
behalf), invests and manages in accordance with Council policy those moneys made available by
the Council for such purposes. The Treasurer may also adopt additional policies governing its
investment and management functions. The OIC and OST recognize that their respective
authority to establish and implement such policies is grounded in and bounded by fiduciary and
statutory foundations to their authority which charge them with exercising a duty of exclusive
loyalty to fund beneficiaries by ensuring that related moneys are invested as efficiently and
productively as possible while adhering to applicable standards of prudent judgment and care.
Accordingly, the following statements and accompanying OIC policies are intended to be in
harmony with and promote the fulfillment of such obligations.
Page 3 of 6
1.) THE OIC SETS POLICY AND IS ULTIMATELY RESPONSIBLE FOR THE
INVESTMENT PROGRAM
A. The OIC is a policy-setting council that largely delegates investment
management activities to the OST and qualified external fiduciaries.
The OIC sets strategic policy and tasks both OST staff and external
managers with policy implementation.
B. The OIC has authority to set and monitor portfolio risk. Both short-
term and long-term risks are critical.
The OIC must weigh the short-term risk of principal loss against the long-
term risk of failing to meet return expectations.
C. To exploit market inefficiencies, the OIC must be contrarian, innovative
and opportunistic in its investment approach.
The OIC must prepare for and accept periods of extreme price/valuation
volatility and/or related market dislocations and endeavor to act
expeditiously during such periods if and when deemed advantageous.
D. Internal incentive structures should be carefully evaluated to ensure
proper alignment with specific investment objectives.
Evaluation criteria should be based (in large part) on decisions over which
staff members have clear authority and control.
Total portfolio results (in addition to individual asset class returns) should
be considered, and the evaluation period should be consistent with an
appropriate investment horizon or market cycle.
E. Adequate resources are required to successfully compete in global
capital markets.
Staffing levels and operating budgets should be determined by capability
requirements using benchmark assessments comprised of other well
respected organizations of similar size and portfolio complexity.
The benefits of OIC member and OST staff continuity should also be
recognized.
Page 4 of 6
2.) ASSET ALLOCATION DRIVES RISK AND RETURN
A. Asset allocation is the OIC’s primary policy tool for managing the
strategies that may provide enhanced diversification and /or unique sources of return
potential outside of relative to the OIC formally approved other asset classes. included in
the OIC’s approved policy mix. The Portfolio may be populated with Opportunity
Portfolio’s objectives are pursued by investing in strategies that fall outside the
boundaries of “strategic” or approved policy mix allocations including new or innovative
investment approaches strategies across a wide range of potential investment
opportunities with no limitation as to asset classes or strategies that may be used. The
Opportunity Portfolio investment program seeks to achieve its investment objective by
investing in strategies that fall outside the OIC’s previously identified asset classes
because of the expected time horizon, tactical nature of the investment, or some other
unique aspects which must be clearly defined in the written recommendation provided to
the OICand with few limitations or constraints.
Oregon Investment Council (OIC): Oregon Revised Statute (ORS) 293.706 establishes
the OIC, which consists of five voting members, four of whom are appointed by the
Governor and subject to Senate confirmation (the Treasurer serves by position, and is not
subject to confirmation). The members appointed by the Governor must be qualified by
training and experience in the field of investment or finance. In addition, the Director of
the Public Employees Retirement System is an ex-officio member of the OIC. ORS
293.721 and 293.726 establish the OIC’s investment objectives and standardstandards of
judgment and care for the OIC: : “Moneys in the investment funds shall be invested and
reinvested to achieve the investment objective of the investment funds, which is to make
the moneys as productive as possible, subject to the prudent investor standard.”.
Oregon Public Employees Retirement Fund (OPERF): Holds the assets of beneficiaries
of the Oregon Public Employees Retirement System (PERS). PERS is a statewide-state-
wide, defined benefit retirement plan for units of state government, political subdivisions,
community colleges, and school districts. PERS is administered under ORS chapters
237, 238, 238A, and applicable provisions of the Internal Revenue Code by the Public
Employees Retirement Board (PERB). Participation by state government units, school
districts, and community colleges is mandatory. Participation by most political
subdivisions is optional but irrevocable if elected. All system assets accumulated for the
payment of benefits may legally be used to pay benefits to any of the plan members or
beneficiaries of the system. PERS is responsible for administrating the management of
the plan’s liability and participant benefits.
Oregon Short Term Fund (OSTF): The state’s commingled cash investment pool
managed internally by Treasury staff. The OSTF includes all excess state agency cash, as
required by law, as well as cash invested by local governments on a discretionary basis.
The OSTF is invested in accordance with investment guidelines recommended by the
state’s Oregon Short Term Fund Board and approved by the OIC.
Overweight: A stock, sector or capitalization exposure that is higher than the
corresponding exposure in a given asset class benchmark, such as the Russell 3000 Index.
Page 22 of 24
Private Equity: Venture Economics (VE) uses the term to describe the universe of all
venture investing, buyout investing and mezzanine investing. Fund -of fund-funds
investing and secondaries are also included in this term’s broadest term.interpretation.
VE is not using the term to include angel investors or business angels, real estate
investments or other investing scenarios outside of the public market. See also
Alternative InvestmentsAlternatives.
Real Estate: Investments in land and/or buildings.
Real Estate Investment Trusts (REIT): A real estate portfolio managed by an investment
company for the benefit of the trust unit holders. Most REIT units are publically and
exchange traded.
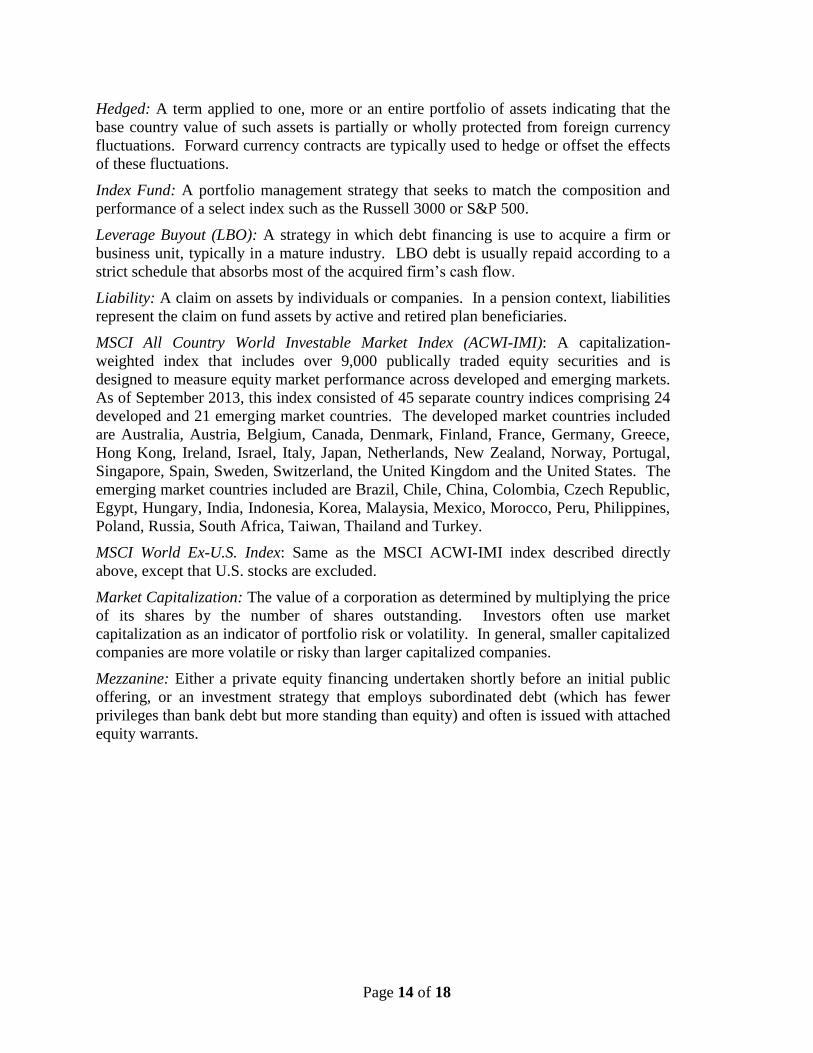
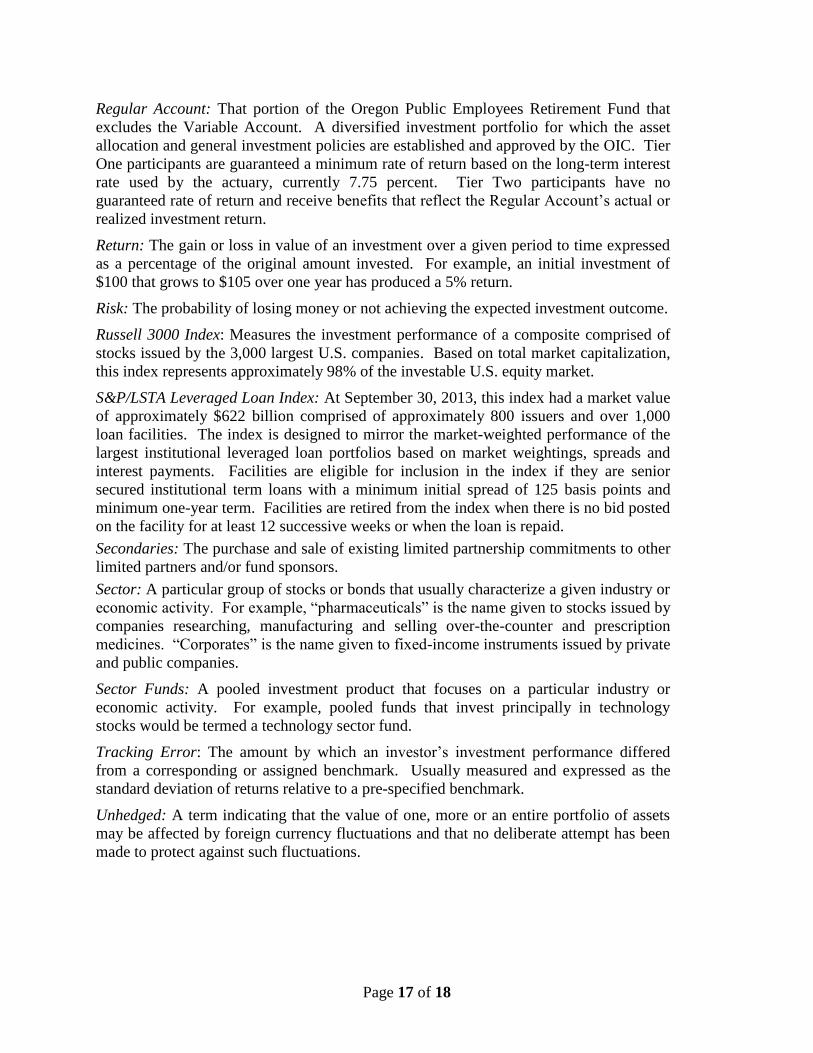
Regular Account: That portion of the Oregon Public Employees Retirement Fund that
excludes the Variable Account. A diversified investment portfolio, with an OIC
established for which the asset allocation. and general investment policies are established
and approved by the OIC. Tier One member funds in the regular accountparticipants are
guaranteed a minimum rate of return based on the long-term interest rate used by the
actuary. The rate is, currently 8 percent per year and will move to 7.75 percent effective
January 1, 2014.. Tier Two member funds in the regular accountparticipants have no
guaranteed rate of return. Tier Two regular accounts and receive whatever is available for
distributionbenefits that reflect the Regular Account’s actual or realized investment
return.
Return: The gain or loss in value of an investment over a given period to time expressed
as a percentage of the original amount invested. For example, an initial investment of
$100 that grows to $105 over one year has earnedproduced a 5% return.
Risk: A statistical measure of the possibility of losing or not gaining value. May also be
expressed as theThe probability of losing money or not achieving anthe expected
investment outcome.
Risk-diversifying: Reducing risk without reducing expected returns by combining assets
with returns that move in opposite directions over a given time period thereby reducing
the total portfolio risk. A decline in the price of one asset is offset by the increase in the
price of another asset in the portfolio. In laypersons term’s, this is often described as
putting your eggs into more than one basket.
Russell 3000 Index: Measures the investment performance of a composite comprised of
stocks issued by the 3,000 largest U.S. companies based. Based on total market
capitalization, whichthis index represents approximately 98% of the investable U.S.
equity market.
Page 23 of 24
S&P/LSTA Leveraged Loan Index: The S&P/LSTA Leveraged Loan Index (At
September 30, 2013, this index had a market value of approximately $622 billion with
791 issuers comprised of approximately 800 issuers and over 1,012facilities at September
30, 2013) mirrors000 loan facilities. The index is designed to mirror the market-
weighted performance of the largest institutional leveraged loansloan portfolios based
uponon market weightings, spreads and interest payments. Facilities are eligible for
inclusion in the index if they are senior secured institutional term loans with a minimum
initial spread of 125 basis points and term ofminimum one -year. term. Facilities are
retired from the index when there is no bid posted on the facility for at least 12 successive
weeks or when the loan is repaid.
Secondaries: The buyingpurchase and sellingsale of pre-existing limited partnership
commitments to private equity fundsother limited partners and/or fund sponsors.
Sector: A particular group of stocks or bonds that usually characterize a given industry or
economic activity. For example, “pharmaceuticals” is the name given to stocks ofissued
by companies researching, manufacturing and selling over-the-counter and prescription
medicines. “Corporates” is the name given to fixed-income instruments issued by
private and public companies.
Sector Funds: A pooled investment product with investments that focusfocuses on a
particular industry or economic activity. For example, pooled funds that invest
principally in technology stocks would be termed a technology sector fund.
Tracking Error: When using an indexing or any other benchmarking strategy theThe
amount by which thean investor’s investment performance of the portfolio differed from
that of thea corresponding or assigned benchmark. In reality, no indexing strategy can
perfectly match the performance of the index or benchmark, and the tracking error
quantifies the degree to which the strategy differed from the index or benchmark. Usually
definedmeasured and expressed as the standard deviation of returns relative to a pre-
specified benchmark.
Unhedged: A term applied to aindicating that the value of one, more or an entire
portfolio of non-domestic stocks or bonds that isassets may be affected by the changes in
the value of domestic and foreign currencies. currency fluctuations and that no deliberate
attempt has been made to protect against such fluctuations.
Page 24 of 24
Value Added: As used in real estate, may include office, retail, industrial and apartment
properties, but may target structured investments in alternative property types such as
hotels, student housing, senior housing, and specialized retail uses. The Portfolios or
strategies that are positioned as Value Added portfolio isare expected to produce returns
between Core and Opportunistic portfolios but may experience greater vacancy or
interest rate risk than the Core portfolio./strategies. For example, a Value Added
propertiesproperty may exhibit some “institutional” qualities such as being well located
within localgood location and regional markets, and be of high quality design and
construction quality, but may need redevelopment, or significant leasing improvements to
achieve stabilized investmentand enhance its value. Value Added investments may also
include development opportunities with balanced risk/return profiles.
Value Stock: Stocks that appear to be undervalued for reasons other that low potential
earnings growth. Value stocks usually have low price-to-earnings ratios, low price-to-
book ratios and a high dividend yield.
Variable Account: The Variable Annuity Program allowed active PERS members to
placeallocate a portion of their yearly employee contributions exclusively withinto a
domestic equity portfolio. No such contributions were allowed after December 31, 2003.
Active members who participated in the Variable Program had part of their member
account balance invested in the regular account Regular Account and part invested in the
variable account.Variable Account. Unless a member explicitly elected to participate in
the Variable Program, all of thethat member’s employee contributions went intowere
invested in the regular account.Regular Account. This “primary” election allowed
members to place 25 percent, 50 percent, or 75 percent of their employee contributions in
the variable account. Variable accountAccount. Variable Account balances increase or
decrease depending on the investment performance of the variable fund;, and individual
participant accounts are credited for whatever isany amount (gain or loss) available for
distribution, whether it is a gain or a loss.. The OIC only setsOIC’s asset allocation
policy atpurview only applies to the Regular Account level, since the OIC cannot control
historical employee directedthe investment optionsoption elections of Variable Program
participants.
Venture Capital: Independently managed, dedicated pools of capital that focus on equity
or equity-linked investments in privately held, high growth companies. Outside of the
United States, the term venture capital is used as a synonym for all types of alternative or
private equity.
Vintage Year: The group of funds whosecalendar year in which an investment fund’s first
closing occurred in the same year. occurs. For example, the 1995 vintage year for
venture capital funds of vintage year 1995 were closed to additional investorsincludes all
venture capital funds that held a first closing in 1995.
- end -
TAB 3 – CEM BENCHMARKING
CEM Benchmarking, Inc. (CEM)
2013 OPERF Cost Study
Purpose
To present the OPERF investment cost analysis performed by CEM for both the calendar
and five-year period ended 31 December 2013.
Background
Beginning in 2003, Treasury staff provided the OIC an independent assessment of the
various costs paid for the management of OPERF (e.g., management fees, custody fees,
consulting fees, staff costs, etc.), and how those costs (and the resultant performance)
compare to other institutional investors.
CEM is recognized as the key, independent, third-party provider of cost analysis to
defined benefit and defined contribution plans. Using their unique database, CEM has
provided defined benefit fund sponsors with insights into their cost, return, risk and
liability performance since 1990. Their database includes 163 U.S. funds (including 52
U.S. public funds), valued at approximately $2.8 trillion.
Similar to previous years’ analyses, staff provided CEM with updated OPERF cost and
operating data. For the calendar year ended December 31, 2013, OPERF’s total
investment management costs (including oversight, custodial and other costs) were
approximately 77 basis points, consistent with the 78 bps reported for calendar year 2012.
OPERF’s custom peer group for benchmarking purposes is comprised of 16 funds
ranging in asset size from $22 billion to $80 billion. In terms of asset size, the median
fund in this peer group was $42 billion, and within the peer group, OPERF was the 13th
largest fund. Based on CEM’s analysis and benchmarking, OPERF’s total costs were
lower than “expected” by approximately $25 million.
Recommendation
None, information only. Report findings will be presented by CEM.
Oregon Public Employees Retirement FundInvestment Benchmarking ResultsFor the 5 year period ending December 2013
Bruce Hopkins CEM Benchmarking Inc
December 3, 2014
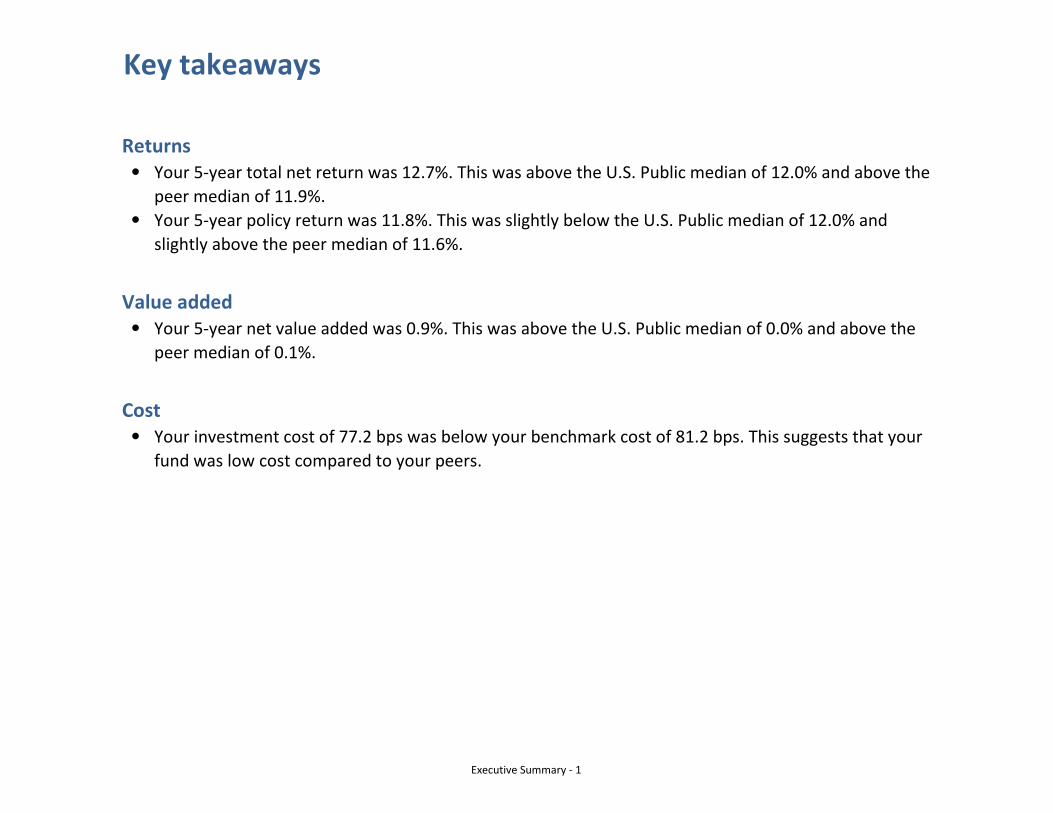
Key takeaways
Returns•
•
Value added•
Cost•
Your 5-year total net return was 12.7%. This was above the U.S. Public median of 12.0% and above the
peer median of 11.9%.
Your 5-year policy return was 11.8%. This was slightly below the U.S. Public median of 12.0% and
slightly above the peer median of 11.6%.
Your 5-year net value added was 0.9%. This was above the U.S. Public median of 0.0% and above the
peer median of 0.1%.
Your investment cost of 77.2 bps was below your benchmark cost of 81.2 bps. This suggests that your
fund was low cost compared to your peers.
Executive Summary - 1
Participating assets ($ trillions)
* The graph for 2013 reflects both received and expected data.
This benchmarking report compares your cost and return performance to CEM's
extensive pension database.
• 163 U.S. pension funds participate. Totalparticipating U.S. assets were $2.8 trillion. • 79 Canadian funds participate with assets totaling
$548 billion.
• 53 European funds participate with aggregate
assets of $1.7 trillion. Included are funds from the
Netherlands, Norway, Sweden, Finland, Ireland,
Denmark and the U.K.
• 3 Asia-Pacific funds participate with aggregate
assets of $62 billion. Included are funds from
Australia and New Zealand.
The most meaningful comparisons for your returns
and value added are to the U.S. Public universe which
consists of 52 funds.
0.0
1.0
2.0
3.0
4.0
5.0
6.0
7.0
8.0
93 95 97 99 01 03 05 07 09 11 13*
Asia-Pacific
Europe
Canada
United States
Executive Summary - 2
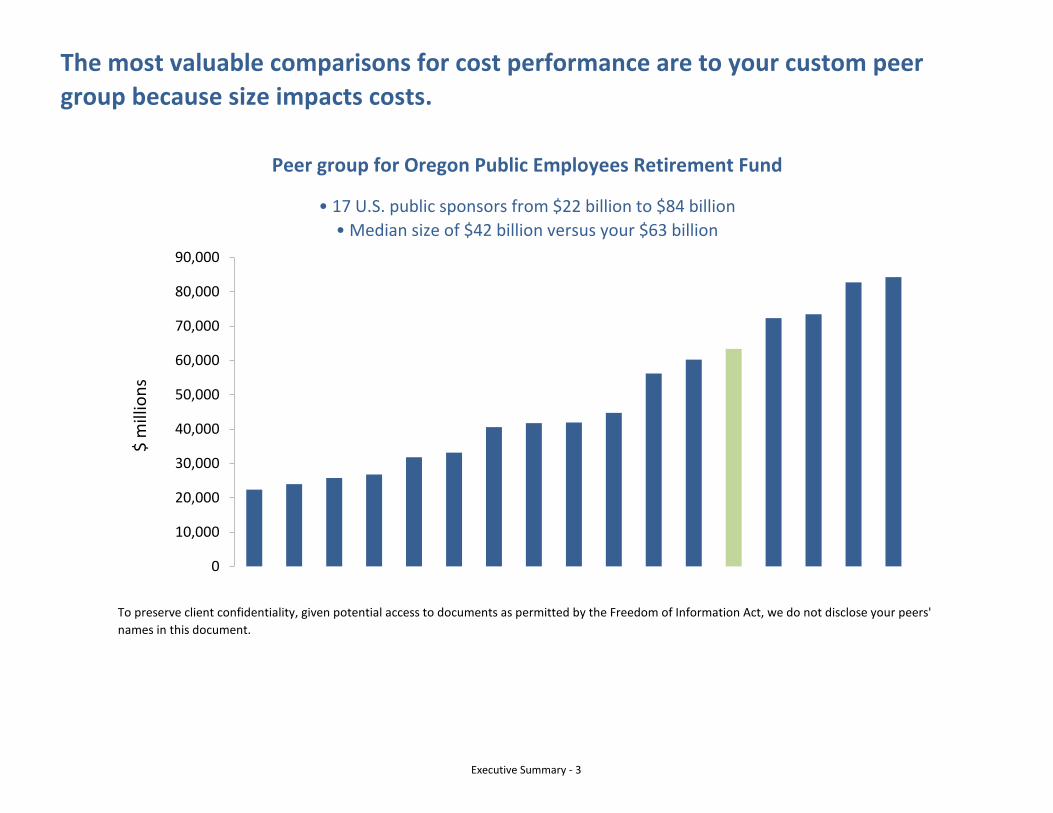
The most valuable comparisons for cost performance are to your custom peer
group because size impacts costs.
Peer group for Oregon Public Employees Retirement Fund
• 17 U.S. public sponsors from $22 billion to $84 billion
• Median size of $42 billion versus your $63 billion
To preserve client confidentiality, given potential access to documents as permitted by the Freedom of Information Act, we do not disclose your peers'
names in this document.
0
10,000
20,000
30,000
40,000
50,000
60,000
70,000
80,000
90,000
$ m
illio
ns
Executive Summary - 3
What gets measured gets managed, so it is critical that you measure and compare
the right things:
Why do total returns differ from other funds? What was the
impact of your policy mix decisions versus implementation
decisions?
Are your implementation decisions (i.e., the amount of active
versus passive management) adding value?
Are your costs reasonable? Costs matter and can be managed.
2. Net value added
3. Costs
1. Returns
Executive Summary - 4
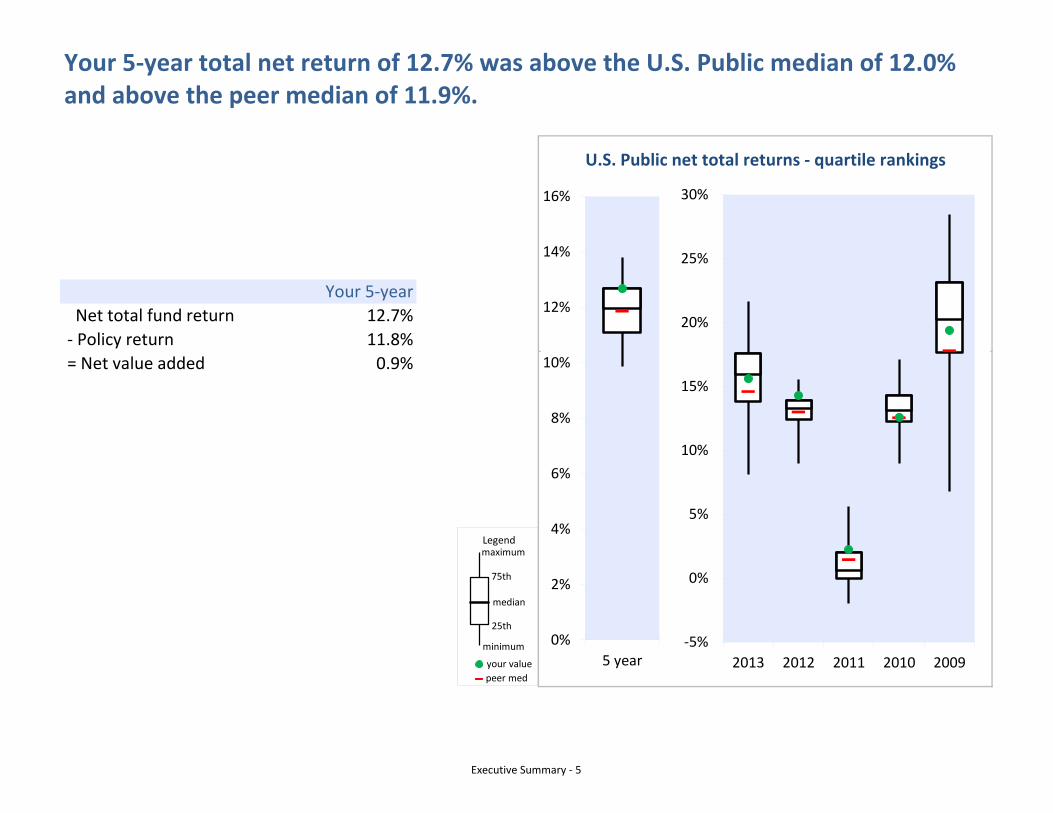
Your 5-year
Net total fund return 12.7%
- Policy return 11.8%
= Net value added 0.9%
Your 5-year total net return of 12.7% was above the U.S. Public median of 12.0%and above the peer median of 11.9%.
U.S. Public net total returns - quartile rankings
0%
2%
4%
6%
8%
10%
12%
14%
16%
5 year-5%
0%
5%
10%
15%
20%
25%
30%
2013 2012 2011 2010 2009
Legend
your value
median
maximum
75th
25th
peer med
minimum
Executive Summary - 5
• Long term capital market expectations
• Liabilities
• Appetite for risk
To enable fairer comparisons, the policy returns of all participants except your fund were
adjusted to reflect private equity benchmarks based on lagged, investable, public-market
indices.
Your 5-year policy return of 11.8% was slightly below the U.S. Public median of
12.0% and below the peer median of 11.6%.
U.S. Public policy returns - quartile rankingsYour policy return is the return you could have earned
passively by indexing your investments according to
your policy mix.
Having a higher or lower relative policy return is not
necessarily good or bad. Your policy return reflects
your investment policy, which should reflect your:
-5%
0%
5%
10%
15%
20%
25%
30%
2013 2012 2011 2010 2009
0%
2%
4%
6%
8%
10%
12%
14%
5 year
Legend
your value
median
maximum
75th
25th
peer med
minimum
Executive Summary - 6
Differences in policy returns are caused by differences in benchmarks and policy mix.
1. The hedge fund benchmark is the average benchmark return reported by U.S. participants. The private equity benchmark is the average of the default private
equity benchmark returns applied to U.S. participants.
Diversified Priv. Eq.- Fund of Funds 3 25,200 ² excluded ³ 25,203
Other Private Equity 174 11,306 ¹ 13,053 ³ 11,480
Overlay Programs 47 608 0 655
Total asset management costs 487,320 76.9bp
Oversight, custodial and other costs ⁴Oversight of the fund 1,532
Trustee & custodial 100
Consulting and performance measurement
Audit 235
Other 226
Total oversight, custodial & other costs 2,093 0.3bp
Total investment costs 489,413 77.2bp
Your investment costs were $489.4 million or 77.2 basis points in 2013.
Internal Management External Management ¹ PE cost derived from the
partnership level detail you
provided. Costs are based on
partnership contract terms.
² Default underlying costs
added to provided top-layer
costs for fund of funds.
³ Total cost excludes
carry/performance fees for
real estate, infrastructure,
hedge funds and private
equity. Performance fees are
included for the public market
asset classes.
⁴ Excludes non-investment
costs, such as PBGC premiums
and preparing checks for
retirees.
Executive Summary - 11
Your costs decreased slightly between 2009 and 2013.
Trend in your investment costsYour reduction in costs is primarily due to a
reduction in private equity fees. This reduction
could reflect a maturing, as opposed to growing
private equity program. The amount on which
private equity fees are based is usually the
commitment amount during commitment period
and net asset value afterwards.
0bp
10bp
20bp
30bp
40bp
50bp
60bp
70bp
80bp
90bp
100bp
2009 2010 2011 2012 2013
Public Assets (ex.Hedge funds)
18.4 18.1 18.1 18.1 17.8
Private Assets &Hedge Funds
68.2 65.7 53.1 60.0 59.0
Oversight 2.0 1.7 0.4 0.3 0.3
Total Cost 88.5 85.5 71.6 78.5 77.2
Co
st in
bas
is p
oin
ts
Trend in your investment costs
Executive Summary - 12
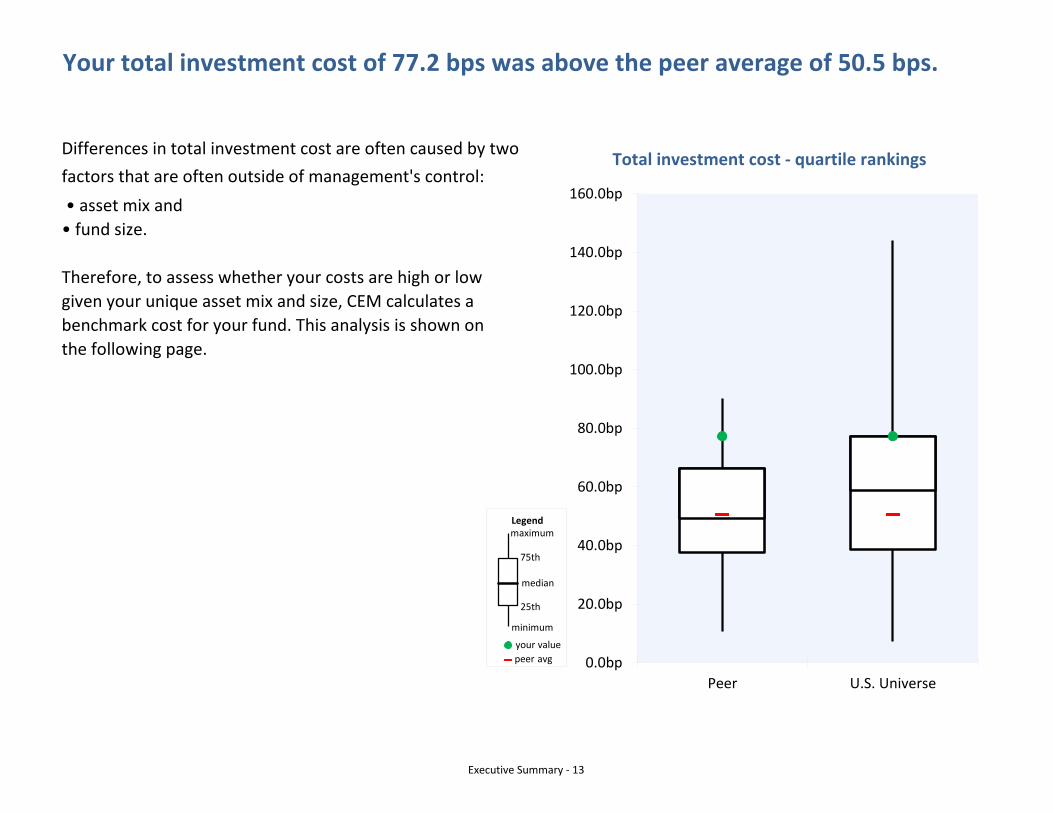
Your total investment cost of 77.2 bps was above the peer average of 50.5 bps.
Total investment cost - quartile rankingsDifferences in total investment cost are often caused by twofactors that are often outside of management's control: • asset mix and
• fund size.
Therefore, to assess whether your costs are high or low
given your unique asset mix and size, CEM calculates a
benchmark cost for your fund. This analysis is shown on
the following page.
0.0bp
20.0bp
40.0bp
60.0bp
80.0bp
100.0bp
120.0bp
140.0bp
160.0bp
Peer U.S. Universe
Legend
your value
median
maximum
75th
25th
peer avg
minimum
Executive Summary - 13
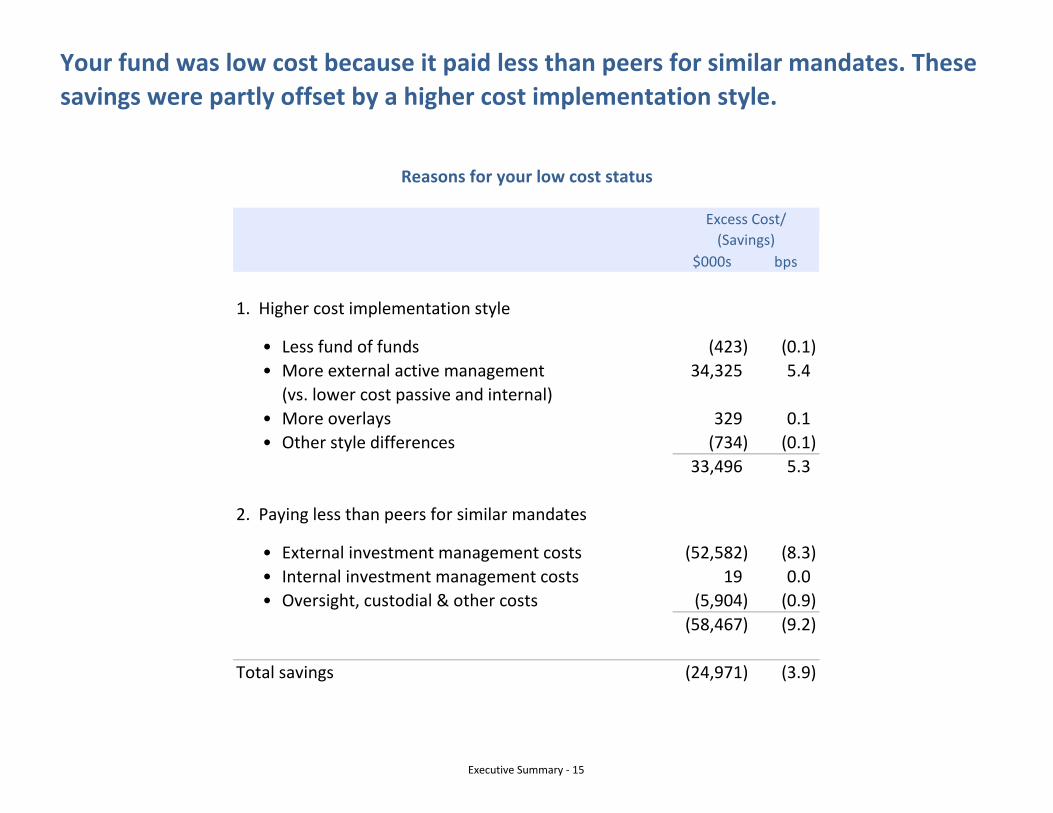
$000s basis points
Your total investment cost
Your benchmark cost
Your excess cost (24,971) (3.9) bp
Benchmark cost analysis suggests that, after adjusting for fund size and asset mix,
your fund was low cost by 3.9 basis points in 2013.
489,413 77.2 bp
514,384 81.2 bp
Your benchmark cost is an estimate of what your cost
would be given your actual asset mix and the median
costs that your peers pay for similar services. It
represents the cost your peers would incur if they had
your actual asset mix.
Your total cost of 77.2 bp was below your benchmarkcost of 81.2 bp. Thus, your cost savings was 3.9 bp.
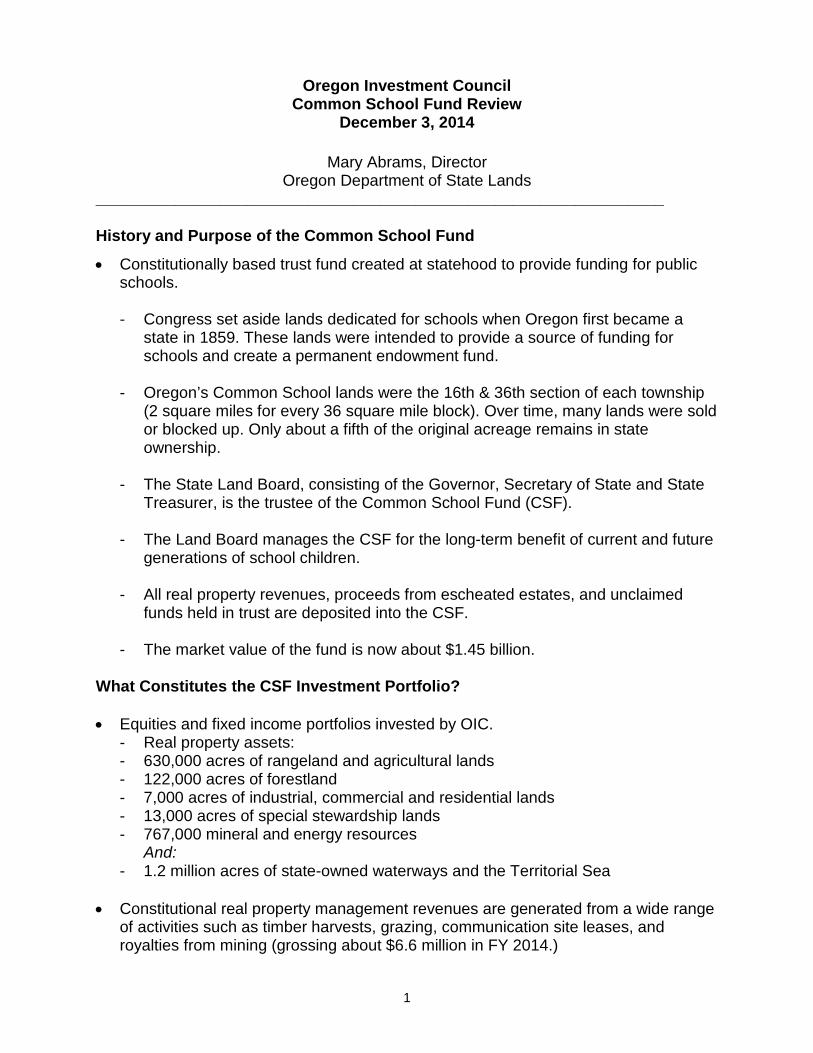
• Constitutionally based trust fund created at statehood to provide funding for publicschools.
- Congress set aside lands dedicated for schools when Oregon first became astate in 1859. These lands were intended to provide a source of funding for schools and create a permanent endowment fund.
- Oregon’s Common School lands were the 16th & 36th section of each township (2 square miles for every 36 square mile block). Over time, many lands were sold or blocked up. Only about a fifth of the original acreage remains in state ownership.
- The State Land Board, consisting of the Governor, Secretary of State and State Treasurer, is the trustee of the Common School Fund (CSF).
- The Land Board manages the CSF for the long-term benefit of current and future generations of school children.
- All real property revenues, proceeds from escheated estates, and unclaimed funds held in trust are deposited into the CSF.
- The market value of the fund is now about $1.45 billion.
What Constitutes the CSF Investment Portfolio?
• Equities and fixed income portfolios invested by OIC.- Real property assets:- 630,000 acres of rangeland and agricultural lands- 122,000 acres of forestland- 7,000 acres of industrial, commercial and residential lands- 13,000 acres of special stewardship lands- 767,000 mineral and energy resources
And: - 1.2 million acres of state-owned waterways and the Territorial Sea
• Constitutional real property management revenues are generated from a wide rangeof activities such as timber harvests, grazing, communication site leases, androyalties from mining (grossing about $6.6 million in FY 2014.)
2
• Because of compliance with the federal Endangered Species Act, timber harvests have been significantly reduced, and in fact were an expense to the CSF in FY 2013 instead of revenue-generating. Ownership of the Elliott State Forest cost the fund about $3 million.
• Statutorily dedicated proceeds include receipts from unclaimed property and revenues from submerged and submersible lands. - Unclaimed property until claimed by true owner ($40 – 60 million per year) Safety deposit box contents Unclaimed payroll checks, utility deposits Dormant bank accounts
- Submerged and submersible lands (nearly $3 million per year) Waterway leases for uses such as houseboats, docks and fiber optic cables
• Starting in 2017, 40 percent of marijuana tax proceeds will go into the CSF – we
estimate the first few years (about $3.6 million) will translate to about $50,000 for schools per year.
Recent Distributions • In 2013 and 2014, the total distribution to schools totals nearly $104 million, which is
only about 1 percent of the total education budget.
Issues/Recent Developments Distribution Policy • The Land Board adopted a new distribution policy in April 2009.
• The distribution policy calls for a distribution of 4% of the average of the three prior
calendar year ending balances of the fund. • In recent years, the Board has adopted resolutions altering this policy: in June 2009
calling for a one-time 5% distribution to help with the 2009-2011 budget deficit; and an additional $12 million in this current biennium.
Elliott State Forest • The Land Board in October 2011 approved a new Forest Management Plan
designed to increase harvest levels while conserving fish and wildlife habitat using take-avoidance strategies for threatened or endangered species.
3
• In January 2012, Cascadia Wildlands, the Audubon Society of Portland, and theCenter for Biological Diversity filed suit regarding habitat in state forests, includingthe Elliott, for the marbled murrelet, a seabird protected by the Endangered SpeciesAct. The lawsuit halted or deferred some timber sales until it was settled in February2014. The terms of the settlement of the case indefinitely scaled back timber harvestlevels and associated revenues.
• Because the Elliott is now losing money for the CSF, the Department of State Landbegan the Elliott State Forest Alternatives Project, which sought public and technicalinput into alternative ownership and management scenarios for the forest. The reportwill be presented to the Land Board on Dec. 9, at which time the Department hopesfor direction from the board on how to proceed with various options.
Real Estate Asset Management Plan
In addition to the investment portfolio assets managed by the OIC, the Common School Fund has a real property asset component that has been managed historically by the DSL. In 2012, the State Land Board adopted a revised asset management plan. The REAMP guides how CSF lands are managed, particularly with respect to maximizing their value to the Common School Fund over the long term. The CSF real estate portfolio is currently valued at $500 - $570 million. However the forest revenue issues discussed previously are resulting in a decline in the real property value of the asset. The Department has used the plan to set management direction, and includes specific implementation activities (e.g. criteria for divesting of non-performing tracts) to achieve the overall goal of increasing returns to the CSF. The concept is to reinvest receipts from land sales in higher-performing properties. In FY 2014, land sales (including three parcels in the Elliott State Forest) generated $4.6 million.
Portland Harbor Superfund Site
DSL owns 75 parcels of submerged and submersible lands with the Portland Harbor Superfund site. Several of these parcels have been leased during various periods of time since 1939. We are participating in the both the allocation process and Natural Resources Damage Assessment (NRDA) process. The draft Remedial Investigation/Feasibility Study (RI/FS) was just released. A final Record of Decision is expected from the Environmental Protection Agency in 2017. What liability, if any, the state has is unknown at this time.
Oregon Schools Benefitfrom Common School Fund
“Every education advocate should understand the
Common School Fund.”
Mary Abrams, DirectorDepartment of State Lands
DEPARTMENT OF STATE LANDS FACT SHEET
COMMON SCHOOL FUND
School District Distribution Equal to*
Astoria $167,985 2 full-time teachers
Bend $1,410,473 16 full-time teachers
Coos Bay $270,706 3 full-time teachers
Eugene $1,711,668 19 full-time teachers
Hood River $335,199 4 full-time teachers
Medford $1,186,527 13.5 full-time teachers
Pendleton $283,646 3 full-time teachers
Portland $4,427,154 50 full-time teachers
2014 Common School Fund DistributionsA sampling of districts and their distributions
* Based on the annual statewide average of $88,339 per teacher for salary and benefits;figures are rounded
$50.8 million earmarked for state’s 197 K-12 districts in 2014
Since Oregon became a state in 1859, a little-known fund – the Common School Fund – has provided hundreds of millions of dollars for Oregon public schools.
Common School Fund distributions are considered local revenue in the state funding formula, and the dollars are not insignificant. In a district such as Eugene, their share in 2014 ($1,711,668) would support 19 full-time teaching positions. In Bend, 16. And in Medford, 13.5.
State Land Board oversees Common School Fund
The act of Congress admitting Oregon to the Union in 1859 granted sections 16 and 36 of every township for the use of schools. Nearly 3.4 million acres – roughly the size of Connecticut – came under state ownership.
Our “land-rich, cash-poor” state quickly sold many schoollands, as state officials felt private ownership of these lands would yield more for schools through property taxes and other economic benefits. As a result, only a fifth of Oregon’s original acreage – about 760,000 acres – remains in state ownership.
The State Treasurer and Oregon Investment Council invest the Common School
Fund, which exceeded its performance target over the three-year period ending in 2013, earning a 9 percent average annual return. The
value of the fund fluctuates with changing market con-ditions, and is now valued
at $1.3 billion. Historically, about 4 percent of the fund
has been distributed to school districts annually.
“Protecting and enhancing the Common School Fund is arguably the most important thing we do as a state agency,” says Mary Abrams, director of the Department of State Lands, the administrative arm of the Land Board.
Inputs into the fund include revenues from state-owned lands and waterways, and from estates that escheat to the state from people who die without a will and known heirs. All unclaimed property (money) the state receives is held in the Common School Fund until the rightful owner is located.
Goal is to grow the fund significantly over time
As the Common School Fund grows, so do distributions to Oregon school districts. Since 2000, distributions have ranged from a low of $13 million in 2004 to a high of $55.4 million in 2008. Distributions in the 2013-15 biennium will total $105 million.
The Department of State Lands is strategically manag-ing the fund’s real estate assets to increase revenues to schools. Divesting of non-producing lands, investing in high-quality lands, and ensuring that state land leases reflect market values are among the agency’s strategies, says Abrams.
“Every dollar helps Oregon schools – it’s just that simple,” she says. “My goal is for every education advocate across the state to understand the Common School Fund and the Department of State Lands’ role in supporting Oregon’s schoolchildren from generation to generation.”
Oregon Department of State Lands775 Summer St. NE, Suite 100
distributions cannot benefit current students at the disadvantage of future
students, or vice-versa.
The Land Board’s 2012 Real Estate Asset Management
Plan calls for a more aggressively managed
real estate portfolio. The plan emphasizes
“strategic investment and reinvestment in industrial/
commercial/residential lands to increase land
values and Common School Fund revenues over the ten-
year life of the plan.”
Fiscal Year 2014 (July 1, 2013 – June 30, 2014)
DSL by the Numbers
Ensuring a legacy for
Oregonians and their
public schools through sound
stewardship of lands,
waterways, unclaimed
property, estates and
the Common School Fund.
DEPARTMENT OF STATE LANDS FACT SHEET
Common School Fund
The Department of State Lands (DSL) was first established in 1878 as the Office of the Clerk of the State Land Board. The agency is the administrative arm of the board, managing land and other resources dedicated to the Common School Fund. The Land Board, Oregon’s oldest board, is composed of the Governor, Secretary of State and State Treasurer. Oregon’s Constitution directs the board to manage state trust lands to generate revenue for Oregon public schools.
In 1957 the Legislature passed the Uniform Unclaimed Property Act and assigned the Land Board and DSL the responsibility of safeguarding lost financial assets until claimed by rightful owners.
Beginning in 1967, DSL began implementing the state’s removal-fill law which protects natural waterways and wetlands for purposes of navigation, fisheries, commerce and recreation. The agency assumed Oregon’s wetlands conservation program as a result of the 1989 Wetlands Conservation Act.
The agency has four program areas and serves as the state partner for the South Slough National Estuarine Research Reserve in Charleston, the first of 28 reserves throughout the United States.
For the 2013-15 biennium, DSL has 104 employees:
• Director’s Office (5 staff)• Common School Fund Property (27 staff)• Aquatic Resource Management (26 staff)• Business Operations and Support Services (30 staff)• South Slough Reserve (16 staff)
The agency’s 2013-15 Legislatively Adopted Budget is $43.7 million. No General Funds are used for operations, only Other Funds and Federal Funds.
$325,591,960
$143,084,501
$50,779,254
CSF Revenues/Receipts
CSF Investment Earnings
Distribution to Schools
$1.45 billionAs of June 30,2014
Market Value
Common School Fund Property
Real PropertyEstimated total value of Common School Fund land assets: $518– $570 million
Rangelands/Ag Lands 630,437 acresNo. of active authorizations 218Gross revenues $804,337
Forestlands 122,092 acresNo. of active authorizations 126Gross revenues $3,573,367
Industrial/Commercial/ Residential 7037 acresNo. of active authorizations 88Gross revenues $1,582,070
Special Stewardship Lands 13,212 acresNo. of active authorizations 27Gross revenues $46,443
Mineral and Energy Resources 767,092 acresNo. of active authorizations 20Gross revenues $560,091
Land Sales $4,623,559
Trust Property
Unclaimed PropertyGross Receipts $63,863,439Claims Paid $23,261,206No. of Claims Paid 13,277
Estates AdministrationNo. of estates handled 284Funds pending permanent escheat to Common School Fund $6,692,114
Oregon Department of State Lands775 Summer St. NE, Suite 100 Salem, Oregon 97301-1279
(503) 986-5200 | www.oregonstatelands.us11/14
South Slough National Estuarine Research ReserveNo. of acres managed 5,927No. of research projects 19No. of education/interp. programs 225No. of training workshops 36No. of program participants 7,610No. of visitors at interp. center 3,745
Wetland Mitigation Banks No. of approved banks 25No. of credits available as of 6-30-14 165No. of credits sold in FY 2014 51
Removal-Fill Mitigation FundNo. of permits using program 17Credits sold 2.75Funds collected $260,476New project funding (2 projects) $529,258
Technical Assistance for Certified Industrial SitesNo. of sites 22
State-Owned Waterways 1,264,558 acresNo. of active authorizations 4,500Gross revenues $2,873,586
TAB 5 – OPERF ALTERNATIVE PORTFOLIO
OPERF Alternatives Portfolio 2014 Plan and Review
Ben Mahon, Alternatives Investment Officer December 3, 2014
Table of Contents
Alternatives Portfolio 2014 Plan and Review
I. Alternatives Portfolio Background/Objectives II. Recent Investment Activity III. Commitments and Market Values IV. Portfolio Snapshot V. Annual Cash Flow Activity VI. Portfolio Activity VII. Portfolio Initiatives VIII. Portfolio Structure/Relationships Vision IX. Portfolio Pacing X. Strategy Review XI. Relative Risk & Return Expectations
2
Alternatives Portfolio Background/Objectives
Alternatives Portfolio 2014 Plan and Review
Alternatives Portfolio Background: Alternatives Portfolio approved at January 26, 2011 OIC meeting Portfolio seeded July 1, 2011 with three investments from the Opportunity Portfolio Target allocation increased from 5% to 10% (0-10% range) at June 26, 2013 OIC
meeting
Alternatives Portfolio Objectives:
Seek “real assets” and “real return” strategies Source of diversification for OPERF Less correlated returns, diversifying risk premias Seek hedges against inflation Benchmark: CPI + 4%
3
Recent Investment Activity
Alternatives Portfolio 2014 Plan and Review
During 2014, OIC approved $1.4 billion in commitments across ten funds Six of the commitments were new relationships; four were “re-ups” Commitments comprise a diverse set of investment strategies
4
INVESTMENT NAME
AUTHORIZED
DATE
FIRST OPERF
DRAWDOWN
COMMITMENT
AMOUNTMariner International Infrastructure Finance Company Fund, L.P. 1/9/2014 3/27/2014 $50,000,000
Alterna Capital Management Fund II, L.P. 2/13/2014 4/14/2014 $100,000,000
Source: State State. Data as of September 30, 2014. $ in millions.
**Hedge Fund target weight includes 5% allocation to "Other."
Annual Cash Flow Activity
Alternatives Portfolio 2014 Plan and Review 7
As anticipated early in the life of a long-term investment program, cash outflows haveoutweighed cash inflows by a meaningful amount
Portfolio Activity
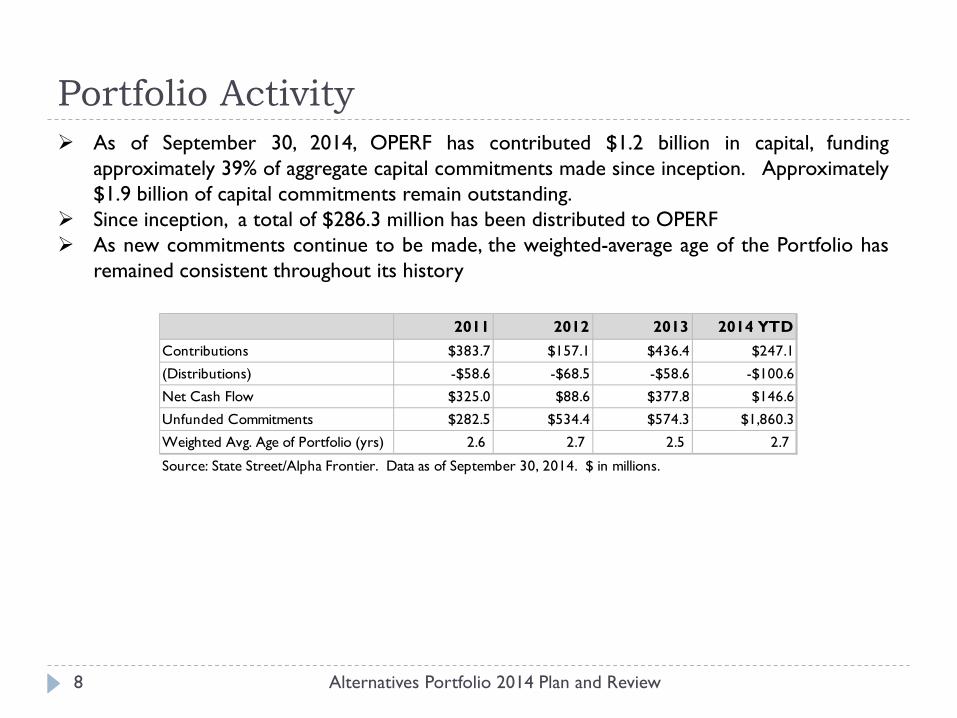
Alternatives Portfolio 2014 Plan and Review 8
As of September 30, 2014, OPERF has contributed $1.2 billion in capital, funding approximately 39% of aggregate capital commitments made since inception. Approximately $1.9 billion of capital commitments remain outstanding.
Since inception, a total of $286.3 million has been distributed to OPERF As new commitments continue to be made, the weighted-average age of the Portfolio has
Weighted Avg. Age of Portfolio (yrs) 2.6 2.7 2.5 2.7
Source: State Street/Alpha Frontier. Data as of September 30, 2014. $ in millions.
Portfolio Initiatives
Alternatives Portfolio 2014 Plan and Review 9
Progress-to-date Committed $2.1 billion over past two years; $3.2 billion cumulatively since inception Portfolio exposures are balanced and within target ranges “Second inning” of portfolio development. Look to develop anchor positions
complemented by specialists/next generation relationships. No shortage of deal flow! Issue has been discriminating among opportunities.
Co-investment
Staff and consultant commencing project to determine best approach for co-investment program Create a shortlist of potential co-investment partners, developing a framework
for implementation Assess additional resource (both internal and external) requirements
Reporting
TorreyCove reporting initiated June 2013 State Street’s Alpha Frontier product onboarding complete
Portfolio Initiatives, cont.
Alternatives Portfolio 2014 Plan and Review 10
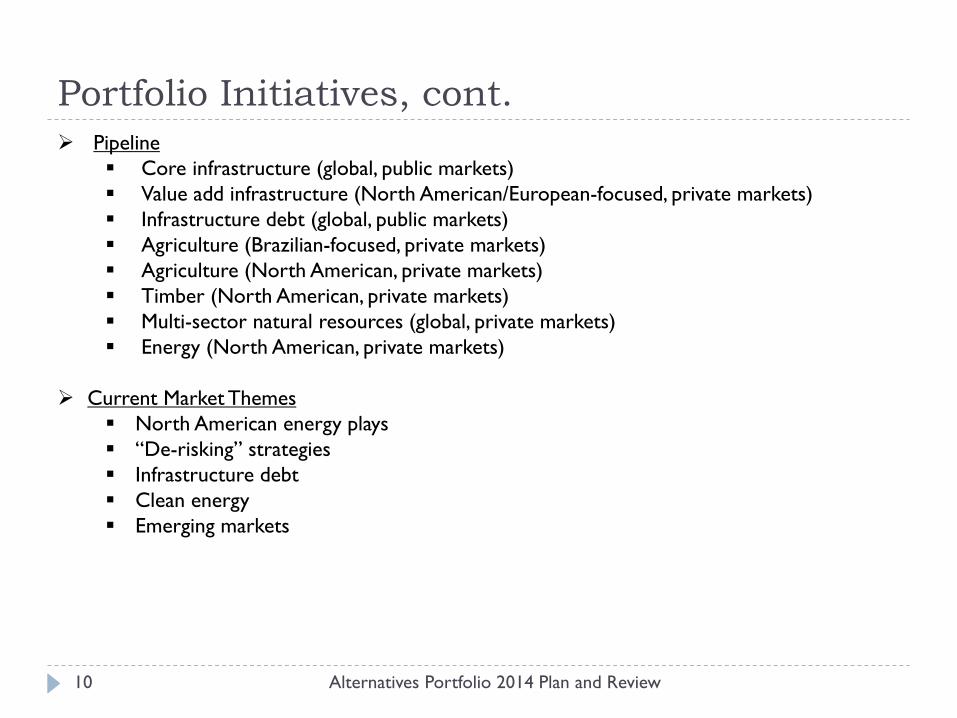
Pipeline Core infrastructure (global, public markets) Value add infrastructure (North American/European-focused, private markets) Infrastructure debt (global, public markets) Agriculture (Brazilian-focused, private markets) Agriculture (North American, private markets) Timber (North American, private markets) Multi-sector natural resources (global, private markets) Energy (North American, private markets)
Current Market Themes North American energy plays “De-risking” strategies Infrastructure debt Clean energy Emerging markets
Portfolio Structure/Relationships
Alternatives Portfolio 2014 Plan and Review 11
Total OPERF Alternatives Since inception IRR* 6.6% CPI +4% index 6.1%
$347.0 million NAV $585.4 million NAV $349.7 million NAV
Number of Relationships / Managers
Alinda Alterna EnCap Flatrock GIP Highstar Mariner LS Power Reservoir Stonepeak
*Performance as of June 30, 2014. Source: TorreyCove. Market values as of September 30, 2014. Source: State Street.
Infrastructure Natural
Resources Hedge Funds
• Envision 10-12 relationships • Larger manager and
investable universe, so average commitment larger
• Envision 14-16 relationships • Smaller manager and
investable universe, so average commitment smaller
$1.3 billion NAV $7.0 billion target $3.2 billion committed
• Envision 4-6 relationships
• Maintain HF beta and style premia-oriented manager bias
Goals: • Target 30 relationships • Use for priority setting • Assess current targets – are
they reasonable?
Portfolio Pacing
Alternatives Portfolio 2014 Plan and Review
2015 Plan $1.5 – $2.0 billion in commitments Based on balanced portfolio allocation, not driven by need to fill an exposure Implies total commitments of $4.6 – $5.2 billion by year end
Longer-term pacing Staff has been measured, given entry point risk, research, education and resources
required At current pace, will not reach target allocation for several years Can deploy “liquid strategies” such as hedge funds and listed commodities/natural
resources more quickly than “illiquid strategies” such as infrastructure and privatenatural resources
Remain cognizant of exposures while aiming for vintage year diversification
13
Strategy Review
Alternatives Portfolio 2014 Plan and Review
Illiquid (“private market”) strategies: Infrastructure Essential, relatively inelastic demand assets that underpin economic and social activities Market segments: midstream energy (pipelines, storage, transmission), power
Investment stages: greenfield/development, brownfield Target portfolio ~30% of Alternatives Portfolio or ~$2.1 billion in NAV Current authorized commitments of $1.2 billion Target return on underlying assets of 8-18%: wide range depending on type, stage and
leverage Base return provided through long-term agreements, with additional sources of
return though improvements to operations/management Current income a significant component of total return
Concerns Fees, particularly on committed capital Shortage of experienced managers gives fee leverage to established GPs Entry point risk driven by increased investor interest Ability to co-invest, which could be most cost effective way of reducing fees
14
Strategy Review
Alternatives Portfolio 2014 Plan and Review
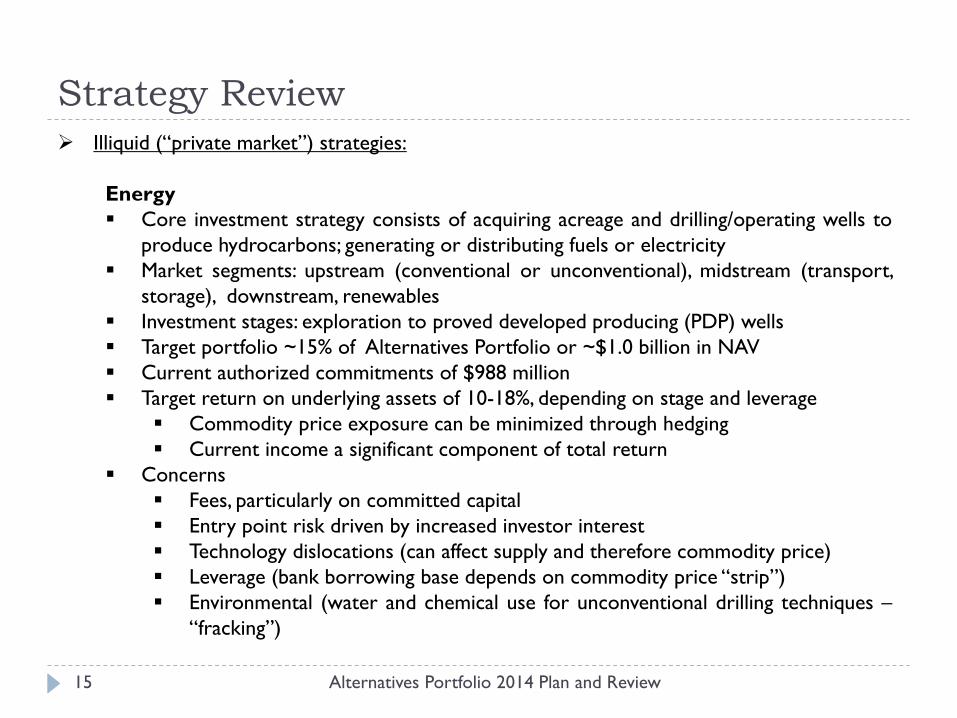
Illiquid (“private market”) strategies:
Energy Core investment strategy consists of acquiring acreage and drilling/operating wells to
produce hydrocarbons; generating or distributing fuels or electricity Market segments: upstream (conventional or unconventional), midstream (transport,
storage), downstream, renewables Investment stages: exploration to proved developed producing (PDP) wells Target portfolio ~15% of Alternatives Portfolio or ~$1.0 billion in NAV Current authorized commitments of $988 million Target return on underlying assets of 10-18%, depending on stage and leverage
Commodity price exposure can be minimized through hedging Current income a significant component of total return
Concerns Fees, particularly on committed capital Entry point risk driven by increased investor interest Technology dislocations (can affect supply and therefore commodity price) Leverage (bank borrowing base depends on commodity price “strip”) Environmental (water and chemical use for unconventional drilling techniques –
“fracking”)
15
Strategy Review
Alternatives Portfolio 2014 Plan and Review
Illiquid (“private market”) strategies:
Metals and Mining Core investment strategy consists of investing in companies or projects, with rights to
extract resources Market segments: precious, base, energy, bulk and industrial metals Investment stages: feasibility, project finance, off-takes, equity in producing mines Target portfolio ~7.5% of Alternatives Portfolio or ~$519 million in NAV Current authorized commitments of $225 million Target total net return of 10-20%, depending on stage and leverage Concerns
Entry point risk driven by increased investor interest Commodity price volatility Shortage of experienced managers, particularly in later stages Global demand shifts (emerging market demand, in particular China) Counterparty risk (on debt and off-take transactions)
16
Strategy Review
Alternatives Portfolio 2014 Plan and Review
Illiquid (“private market”) strategies:
Agriculture, Timberland, and Water Investment in the ownership, lease and/or management of income-producing
timberland or agriculture land Market segments: water rights, row crops, permanent crops, mature groves, plantations,
related infrastructure Investment stages: brownfield, greenfield, conversion Target portfolio ~7.5% of Alternatives Portfolio or ~$519 million in NAV Current authorized commitments of $250 million. Target total net return of 5-12%, depending on stage and leverage
Returns driven by biological growth and lease payments and income generated by harvesting a commodity
Concerns Entry point risk driven by increased investor interest Small investable universes, with limited ability to create new investment
opportunities Commodity price volatility Ability to co-invest, which could be most cost effective way of reducing fees Shortage of experienced managers, particularly in water and agriculture
17
Strategy Review
Alternatives Portfolio 2014 Plan and Review
Liquid (“capital markets”) strategies:
Commodity/Natural Resource Strategies Core investment strategy consists of exposure to raw materials or agricultural
products Market segments: energy, metals, agriculture, and soft commodities Investment stages: passive index, active management, absolute return Strategies expressed through futures contracts, listed equities, physical commodities Target portfolio ~15% of Alternatives Portfolio or ~$1.0 billion in NAV Current authorized commitments of $200 million. Target total net return of 6-10% Concerns
Volatility Open interest (inflow of index funds) Index construction Limited number of institutional long-only managers Many specialized managers Contango (negative “carry”) markets Underlying emerging market demand (drives spot prices) Correlation with existing assets
18
Strategy Review
Alternatives Portfolio 2014 Plan and Review
Liquid (“capital markets”) strategies:
Hedge Fund Strategies Focused on diversifying risk premia using hedge fund techniques (i.e., value, carry,
driven, global macro, managed futures Target portfolio ~25% of Alternatives Portfolio or ~$1.7 billion in NAV Current authorized commitments of $350 million Target total net return of Libor plus 4-6% Concerns
Fees, headline risk, business/operational risk Sourcing truly complementary strategies Alignment of interests, transparency, custody Risk management Realization of low correlations
19
Relative Risk & Return Expectations
Alternatives Portfolio 2014 Plan and Review 20
TAB 6 – OPERF OPPORTUNITYPORTFOLIO
OPERF Opportunity Portfolio
2013/2014 Review
John Hershey, Director of Alternative Investments
December 3, 2014
Table of Contents
Opportunity Portfolio 2014 Review 2
I. Strategy review
Objectives
Strategies of interest
II. 2013-2014 YTD Review
New investments
Cash flows
Portfolio snap shot
Performance
Active funds review
Opportunity Portfolio strategy
Opportunity Portfolio 2014 Review 3
Opportunity Portfolio objectives:
Opportunistic/dislocation oriented
Less correlated returns
Innovation oriented
Not a “strategic” allocation
Strategies of interest: Dislocation oriented
Regulatory Capital Arbitrage
Structured credit
Mortgages
Less correlated oriented
Drug royalty streams
Insurance and reinsurance related
Intellectual property
Innovation oriented
Currencies
Trade finance
Legal settlements
Strategic partnerships
“Club Deals”
Tactical/opportunistic partnerships
New investments/pipeline
2013/2014
Opportunity Portfolio 2014 Review 4
2013 (commitment dates):
Blackstone Tactical Opportunities ($250mm – May)
Content Partners ($50mm – Dec)
2014 (commitment dates):
TPG TAO ($250mm – Jan)
Galton Mortgage ($50mm – Jul)
Blackstone Tactical Opportunities ($250mm – Aug)
Current Pipeline:
Orbimed Royalties II ($75mm – Dec)
Lone Star Residential Fund I ($100mm – Dec)
TPG European Specialty Lending ($100mm – Q1’15)
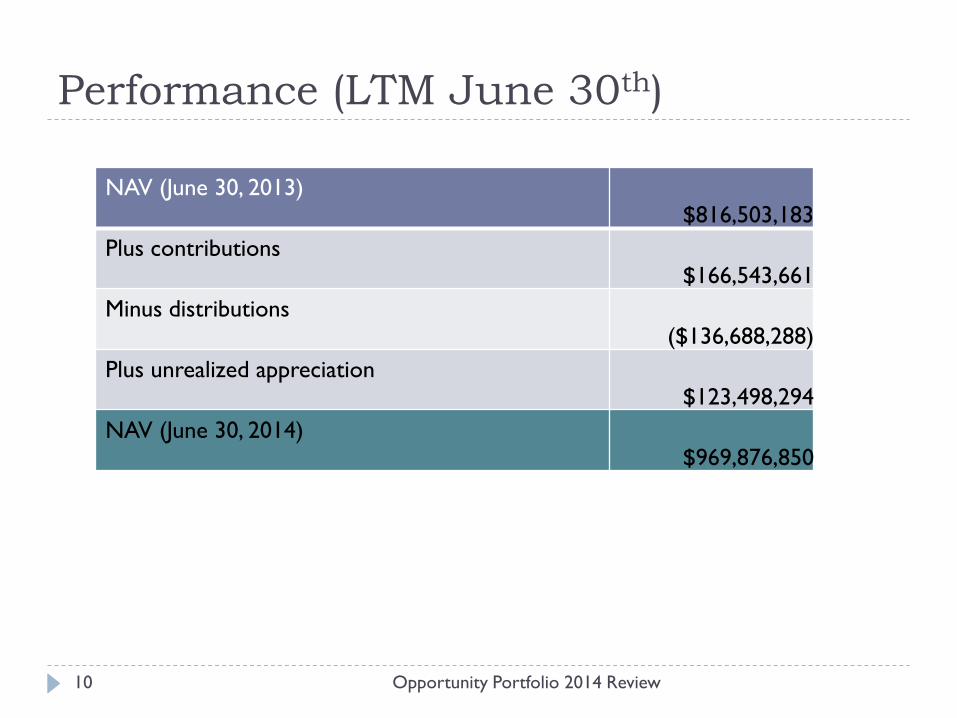
Commitments and cash flows Inception to June 2014
Opportunity Portfolio 2014 Review 5
Portfolio (FMV 6/30/14)
Opportunity Portfolio 2014 Review 6
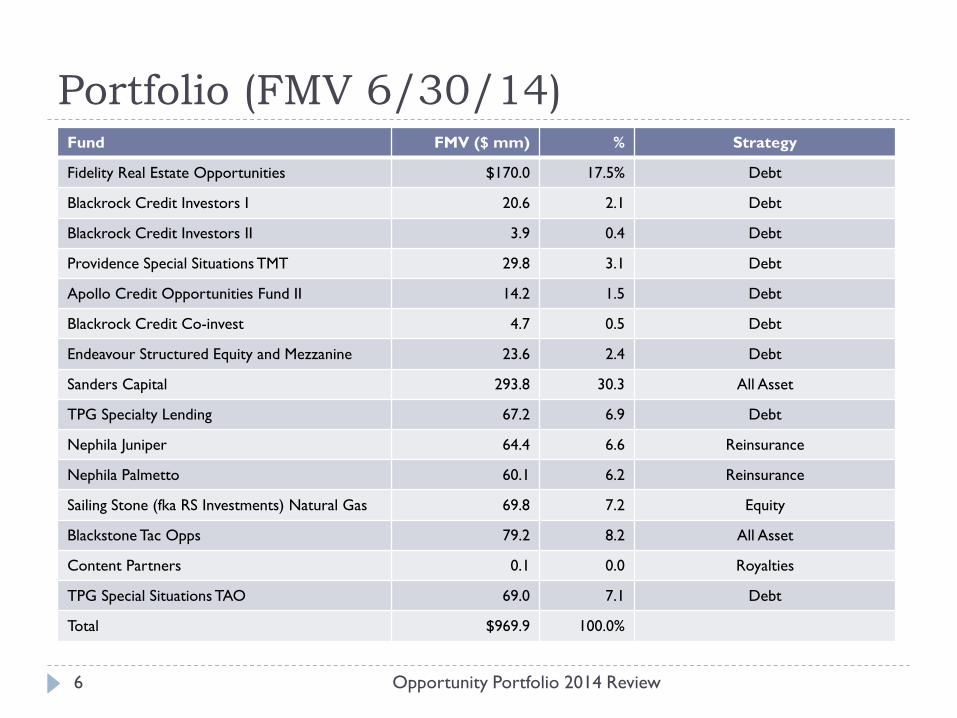
Fund FMV ($ mm) % Strategy
Fidelity Real Estate Opportunities $170.0 17.5% Debt
Blackrock Credit Investors I 20.6 2.1 Debt
Blackrock Credit Investors II 3.9 0.4 Debt
Providence Special Situations TMT 29.8 3.1 Debt
Apollo Credit Opportunities Fund II 14.2 1.5 Debt
Blackrock Credit Co-invest 4.7 0.5 Debt
Endeavour Structured Equity and Mezzanine 23.6 2.4 Debt
Sanders Capital 293.8 30.3 All Asset
TPG Specialty Lending 67.2 6.9 Debt
Nephila Juniper 64.4 6.6 Reinsurance
Nephila Palmetto 60.1 6.2 Reinsurance
Sailing Stone (fka RS Investments) Natural Gas 69.8 7.2 Equity
IRR since Q2/2006 inception (source: Staff/Torrey Cove) 8.8% 8.0%
Time weighted returns (source: State Street)
YTD (June) 12.4% 8.6%
1 year 19.1% 17.6%
2 years 18.7% 8.3%
3 years 11.8% 12.8%
4 years 14.4% 16.6%
5 years 17.1% 8.8%
7 years 8.1% na
Active funds review
Opportunity Portfolio 2014 Review 12
Fidelity Real Estate Opportunities Fund
Strategy OTC real estate debt
Performance ~8.0% net IRR since inception (4/07); 7.4% YTD through 9/30
Outlook 5.5% current yield; 7.4% Yield-to-worst
Endeavour Structured Equity and Mezzanine Fund I
Strategy Middle market mezzanine debt
Performance 8.7% net IRR since inception (Q1/09)
Outlook 12% current yield (including PIK); target total return 10-12%
Active funds review
Opportunity Portfolio 2014 Review 13
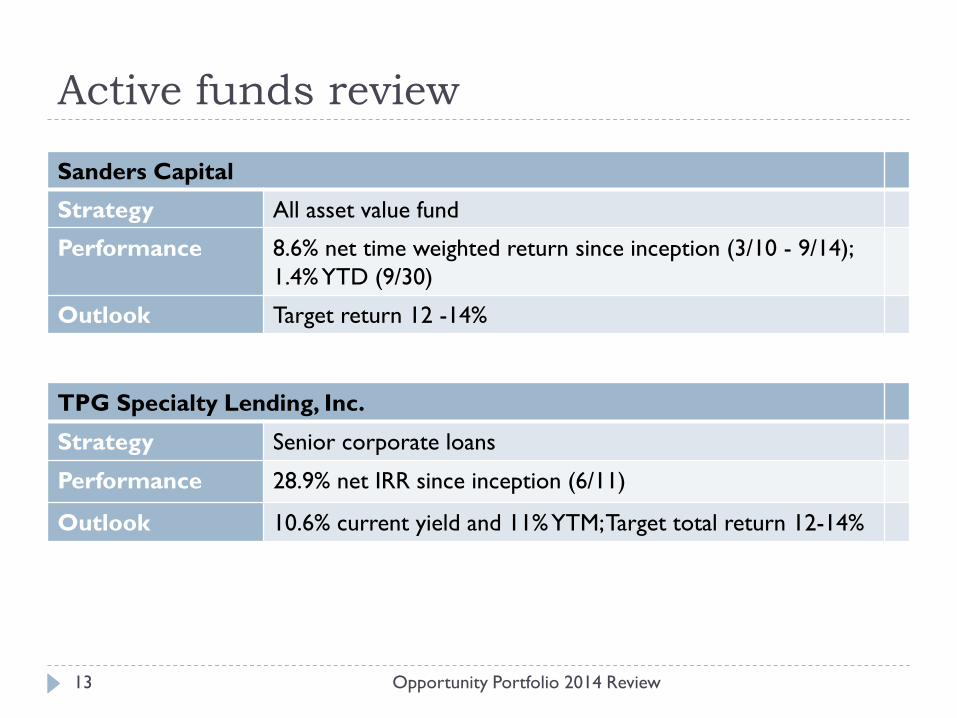
Sanders Capital
Strategy All asset value fund
Performance 8.6% net time weighted return since inception (3/10 - 9/14);
1.4% YTD (9/30)
Outlook Target return 12 -14%
TPG Specialty Lending, Inc.
Strategy Senior corporate loans
Performance 28.9% net IRR since inception (6/11)
Outlook 10.6% current yield and 11% YTM; Target total return 12-14%
Active funds review
Opportunity Portfolio 2014 Review 14
Nephila Palmetto
Strategy Catastrophe Risk Reinsurance
Performance 7.5% net TW return since inception (1/12); 5.1% YTD (9/30)
Outlook Target total return T-bills + 8-10%
Nephila Juniper
Strategy Catastrophe Risk Reinsurance
Performance 10.4% net TW return since inception (1/12); 7.0% YTD (9/30)
Outlook Target total return T-bills + 10-15%
Active funds review
Opportunity Portfolio 2014 Review 15
Sailing Stone Natural Gas Strategy
Strategy Natural Gas E&P
Performance 9.3% net time weighted return since inception (11/12); 4.0%
YTD (9/30)
Outlook Target total return 15-20%
Blackstone Tactical Opportunities
Strategy All assets
Performance NM (less than one year)
Outlook Target total return 15-20%
Active funds review
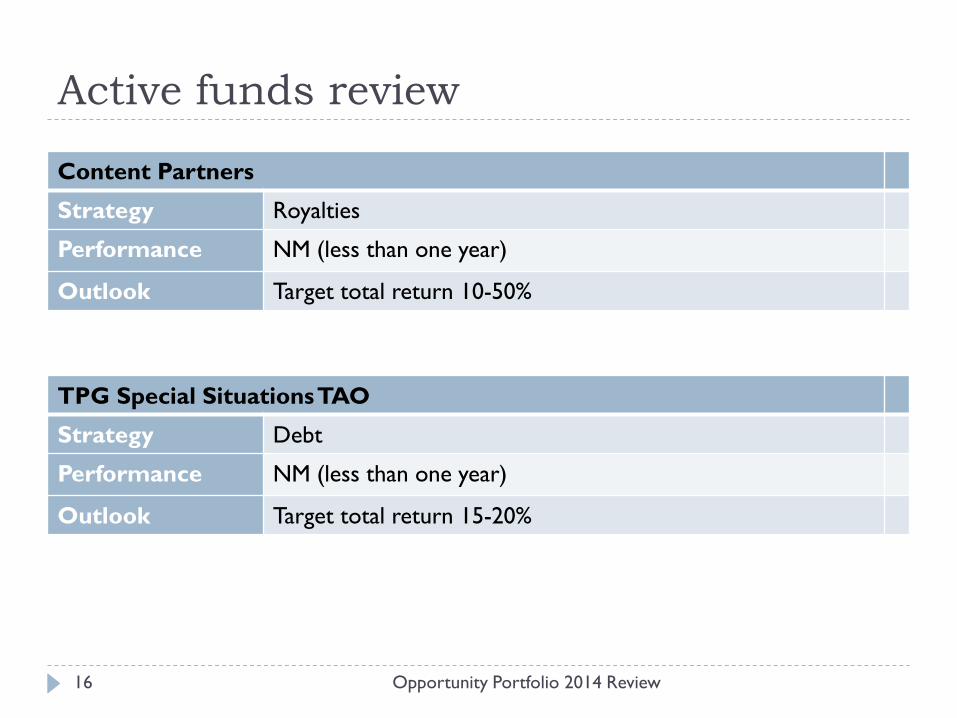
Opportunity Portfolio 2014 Review 16
Content Partners
Strategy Royalties
Performance NM (less than one year)
Outlook Target total return 10-50%
TPG Special Situations TAO
Strategy Debt
Performance NM (less than one year)
Outlook Target total return 15-20%
TAB 7 – OPERF Q3 PERFORMANCE REVIEW
Oregon Investment Council
Third Quarter 2014 Performance Review
December 3, 2014
2Knowledge. Experience. Integrity. Third Quarter 2014
-10%
-8%
-6%
-4%
-2%
0%
2%
4%
6%
8%
Quarterly Real GDP Growth (20 Years)
Economic Commentary
● US GDP grew at a 3.5% annualized rate, building on the strength of a revised 4.6% gain in the second quarter. Domestic demand is fueling the growth, helped along by steady job creation, a healthy increase in disposable income, and an elevated mood among consumers.
● The labor market continued to improve. The unemployment rate was 5.9% in September, the lowest level since 2008. The labor force participation rate, while at its lowest level since early 1978, was largely unchanged over the quarter, registering at 62.7%.
● Inflation remained benign. Headline and Core (excluding food and energy) CPI increased 1.8% year-over-year as of September 30. While CPI readings are slightly below the Fed’s target of 2%, deflation risks in the US do not appear to be a concern.
3Knowledge. Experience. Integrity. Third Quarter 2014
Market Summary
● Global volatility pummeled the markets atsummer’s end. Intensified conflicts in EasternEurope and the Middle East, the UmbrellaRevolution in Hong Kong, and the alarmingresurgence of Ebola cast a pall over themarkets.
● U.S. equities (as measured by the S&P 500Index) managed a positive return as economicdata in the U.S., including housingimprovements, declining unemployment, andtempered inflation, have instilled confidence.
● The Fed continued on the path towardeliminating its quantitative easing (QE)program. October’s purchase totaled $15billion, down from $25 billion in September.Short-term rates remained stable, as the Fedonce again pegged the federal funds anddiscount rates at 0.00%–0.25% and 0.75%,respectively.
● While the U.S. economy gained traction, newsfrom Europe and Japan was far bleaker witheuro zone GDP barely positive in the secondquarter and Japan's economy suffering itsworst contraction since 2009 with secondquarter GDP shrinking by an annualized 7.1%(in the wake of a sales tax hike from 5% to8%).
4Knowledge. Experience. Integrity. Third Quarter 2014
Market Summary
for Periods Ended September 30, 2014Periodic Table of Investment Returns
Russell:3000 Index
0.0%
Russell:3000 Index
17.8%
Russell:3000 Index
23.1%
Russell:3000 Index
15.8%Russell:3000 Index
8.4%
S&P:500
1.1%
S&P:500
19.7%S&P:500
23.0%
S&P:500
15.7%
S&P:500
8.1%
Russell:2000 Index
(7.4%)
Russell:2000 Index
3.9%
Russell:2000 Index
21.3%
Russell:2000 Index
14.3%
Russell:2000 Index
8.2%
MSCI:ACWI x US (Net)
(5.3%)
MSCI:ACWI x US (Net)
4.8%
MSCI:ACWI x US (Net)
11.8%MSCI:ACWI x US (Net)
6.0%MSCI:ACWI x US (Net)
7.1%
MSCI:Emer Markets
(3.4%)
MSCI:Emer Markets
4.7%MSCI:Emer Markets
7.6%
MSCI:Emer Markets
4.8%
MSCI:Emer Markets
11.0%
IndexBarclays:Aggregate
0.2%
IndexBarclays:Aggregate
4.0%
IndexBarclays:Aggregate
2.4%
IndexBarclays:Aggregate
4.1%
IndexBarclays:Aggregate
4.6%
ML:High Yield CP Idx
(1.9%)
ML:High Yield CP Idx
7.1%
ML:High Yield CP Idx
10.9%
ML:High Yield CP Idx
10.3%
ML:High Yield CP Idx
8.1%
NFI-ODCE Val Gross
3.2%
NFI-ODCE Val Gross
12.4%NFI-ODCE Val Gross
12.3%
NFI-ODCE Val Gross
12.4%
NFI-ODCE Val Gross
7.1%
3 Month T-Bill
0.0%
3 Month T-Bill
0.0%
3 Month T-Bill
0.1%
3 Month T-Bill
0.1%
3 Month T-Bill
1.6%
Last Quarter Last Year Last 3 Years Last 5 Years Last 10 Years
5Knowledge. Experience. Integrity. Third Quarter 2014
US Equity
● Third quarter returns were muted (Russell 3000: +0.0%) given declines of 2.0% in July and 2.1% in September, bookending a 4.2% rally in August.
● Large cap stocks led the way (Russell 1000: +0.7%), and large growth companies overtook value (Russell 1000 Growth: +1.5%, Russell 1000 Value: -0.2%). Small cap (Russell 2000: -7.4%) and mid cap (Russell Mid-Cap Index: -1.7%) stocks landed in the red; value lost to growth in both capitalizations.
Rolling 1-Year Relative Returns (versus Russell 1000)
Russell 1000 Growth Russell 1000 Value
Source: Russell Investment Group
6Knowledge. Experience. Integrity. Third Quarter 2014
US Equity Overview
● Within the Russell 3000, Energy (-9.1%) sank with falling oil and natural gas prices and Utilities was the only other sector to post a sharp negative return (-4.9%). Technology (+3.6%) and Health Care (+4.5%) posted the strongest gains from a sector perspective.
7Knowledge. Experience. Integrity. Third Quarter 2014
MSCI ACWI ex-USA
MSCI EAFE
MSCI Emerging Markets
MSCI Europe
MSCI Japan
MSCI Pacific ex-Japan
-2.30%
-7.00%
-5.88%
-5.19%
-3.36%
-5.90%
Non-US Equity
● Relatively attractive yields offered in the US and expectations for higher rates in the third quarter, propelled the dollar higher versus most currencies.
● The dollar gained 7% versus the euro and 8% versus the yen and appreciated versus most emerging markets currencies as well. This major strength in the US dollar pushed non-US equity returns well into negative territory.
● Broadly representing both developed and emerging stocks, the MSCI ACWI ex-US declined 5.2%.
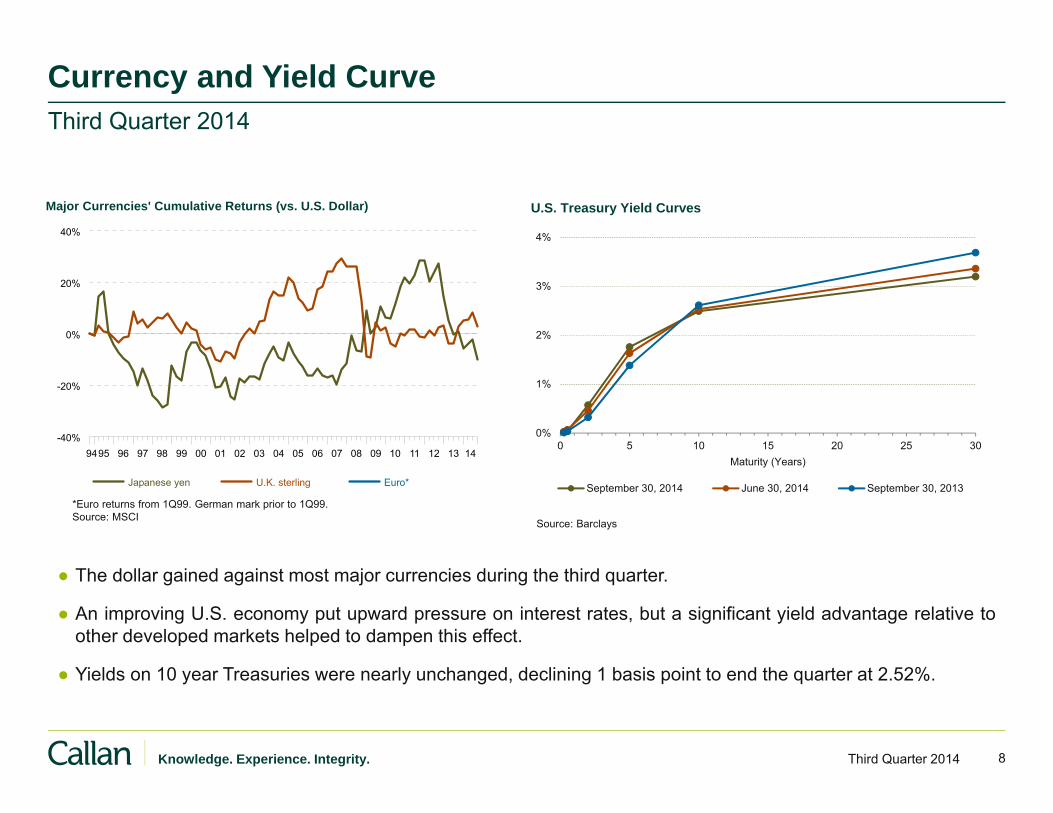
● The dollar gained against most major currencies during the third quarter.
● An improving U.S. economy put upward pressure on interest rates, but a significant yield advantage relative toother developed markets helped to dampen this effect.
● Yields on 10 year Treasuries were nearly unchanged, declining 1 basis point to end the quarter at 2.52%.
*Euro returns from 1Q99. German mark prior to 1Q99.Source: MSCI Source: Barclays
● Yield spreads reversed course and began to widen across most non-Treasury sectors. The Barclays Aggregate landed just above zero at 0.2% for the quarter. The markets were abuzz after Janus Capital Group surprised investors with the news Bill Gross was joining the firm and departing PIMCO.
● High yield corporate bonds were one of the worst performers in the US fixed income market, reversing a previous trend of strong returns. The Barclays Corporate High Yield Index fell 1.9%.
OPERF Total Regular AccountPerformance Summary for the Third Quarter 2014
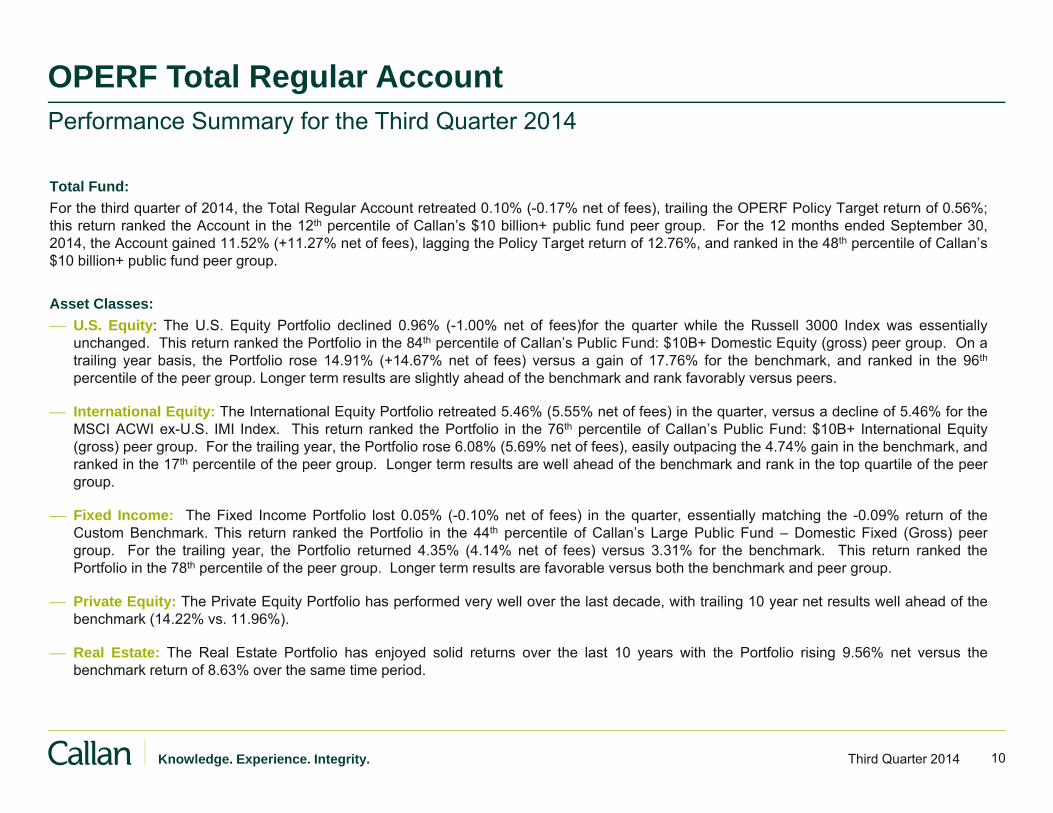
Total Fund:For the third quarter of 2014, the Total Regular Account retreated 0.10% (-0.17% net of fees), trailing the OPERF Policy Target return of 0.56%;this return ranked the Account in the 12th percentile of Callan’s $10 billion+ public fund peer group. For the 12 months ended September 30,2014, the Account gained 11.52% (+11.27% net of fees), lagging the Policy Target return of 12.76%, and ranked in the 48th percentile of Callan’s$10 billion+ public fund peer group.
Asset Classes: U.S. Equity: The U.S. Equity Portfolio declined 0.96% (-1.00% net of fees)for the quarter while the Russell 3000 Index was essentially
unchanged. This return ranked the Portfolio in the 84th percentile of Callan’s Public Fund: $10B+ Domestic Equity (gross) peer group. On atrailing year basis, the Portfolio rose 14.91% (+14.67% net of fees) versus a gain of 17.76% for the benchmark, and ranked in the 96th
percentile of the peer group. Longer term results are slightly ahead of the benchmark and rank favorably versus peers.
International Equity: The International Equity Portfolio retreated 5.46% (5.55% net of fees) in the quarter, versus a decline of 5.46% for theMSCI ACWI ex-U.S. IMI Index. This return ranked the Portfolio in the 76th percentile of Callan’s Public Fund: $10B+ International Equity(gross) peer group. For the trailing year, the Portfolio rose 6.08% (5.69% net of fees), easily outpacing the 4.74% gain in the benchmark, andranked in the 17th percentile of the peer group. Longer term results are well ahead of the benchmark and rank in the top quartile of the peergroup.
Fixed Income: The Fixed Income Portfolio lost 0.05% (-0.10% net of fees) in the quarter, essentially matching the -0.09% return of theCustom Benchmark. This return ranked the Portfolio in the 44th percentile of Callan’s Large Public Fund – Domestic Fixed (Gross) peergroup. For the trailing year, the Portfolio returned 4.35% (4.14% net of fees) versus 3.31% for the benchmark. This return ranked thePortfolio in the 78th percentile of the peer group. Longer term results are favorable versus both the benchmark and peer group.
Private Equity: The Private Equity Portfolio has performed very well over the last decade, with trailing 10 year net results well ahead of thebenchmark (14.22% vs. 11.96%).
Real Estate: The Real Estate Portfolio has enjoyed solid returns over the last 10 years with the Portfolio rising 9.56% net versus thebenchmark return of 8.63% over the same time period.
Quarter Year Years Years YearsTotal Public Equity (3.38%) 10.11% 17.68% 11.03% 7.51%
MSCI ACWI IMI Net (2.83%) 10.70% 16.74% 10.32% 7.57% CAI Global Equity Broad Sty le (2.41%) 11.66% 18.68% 11.31% 8.39%
Domestic Equity (1.00%) 14.67% 22.46% 15.53% 8.30% Russell 3000 Index 0.01% 17.76% 23.08% 15.78% 8.44% CAI Pub Fund:10+ Dom Eq (0.77%) 16.97% 22.72% 16.03% 8.61%
International Equity (5.55%) 5.69% 13.44% 7.58% 8.40% MSCI ACWI ex-US IMI Index (5.46%) 4.74% 11.88% 6.30% 7.32% CAI Pub Fund:10+ Intl Eq (5.00%) 5.55% 12.64% 6.97% 7.49%
Total Fixed Income (0.10%) 4.14% 5.48% 6.76% 6.03% Custom FI Benchmark (15) (0.09%) 3.31% 4.58% 4.70% 4.93% Large Public Fund - Dom. Fixed (0.13%) 6.65% 4.88% 6.28% 5.63%
Total Real Estate (19) 2.38% 12.27% 12.90% 10.17% 9.56%Total Real Estate ex REITs (20) 3.73% 12.43% 12.12% 8.65% 9.77% NCREIF Property Index Qtr Lag 2.91% 11.21% 11.32% 9.67% 8.63% Public Plan - Real Estate 1.79% 10.75% 11.67% 11.18% 7.07%
Total Private Equity (21) 4.61% 21.50% 13.24% 16.81% 14.22% Russell 3000 + 300 BPS Qtr Lag 5.64% 28.91% 19.91% 22.81% 11.96%
Total Alternative 4.25% 7.97% 2.61% - - CPI + 4% 0.77% 5.58% 5.54% 6.08% 6.37%
OPERF Public EquityAsset Distribution as of September 30, 2014
September 30, 2014Market Value % of Total Fund
International Equity $13,719,545,767 19.61%
International Market Oriented (Core) $7,176,060,134 10.26%Northern Trust Non - US Equity 285,890,471 0.41%Arrowstreet Capital, L.P. 1,199,141,449 1.71%Lazard Asset Management 958,383,092 1.37%Pyramis Global Advisors 1,081,370,771 1.55%Wells Cap International CEF 323,987,299 0.46%Lazard International CEF 360,885,130 0.52%AQR Capital Management 1,040,551,659 1.49%SSgA MSCI World ex US Net Index 1,925,850,264 2.75%
International Value $1,792,457,536 2.56%Acadian Asset Management 913,936,916 1.31%Brandes Investment Partners 878,520,621 1.26%
International Growth $1,400,637,746 2.00%TT International 669,942,228 0.96%Walter Scott Management 730,589,633 1.04%UBS Global Asset Mgmt Americas 105,886 0.00%
International Small Cap $1,348,103,267 1.93%DFA International Small Cap 277,735,812 0.40%Harris Associates 267,314,071 0.38%Pyramis Select Small Cap 342,694,921 0.49%Victory Capital Management 219,125,640 0.31%EAM International Micro Cap 100,209,717 0.14%DFA International Micro Cap 141,023,107 0.20%
Emerging MarketsGenesis Emerging MarketsArrowstreet Emerging MarketsBlackRock Tiered Emerging MarketsWestwood Global Inv estmentWilliam Blair and CompanyDFA Emerging Market Small CapWilliam Blair Emerging Mkt Small Cap
Large Cap Growth $2,974,248,486 4.25%Delaware Investment Advisors 724,604,144 1.04%Wells Capital Management 957,884,135 1.37%BlackRock Russell 1000 Growth 1,291,760,207 1.85%
Large Cap Value $3,101,860,306 4.43%Aronson, Johnson & Ortiz 1,146,731,183 1.64%MFS Institutional 1,110,945,547 1.59%BlackRock Russell 1000 Value 844,183,576 1.21%
Small Cap Growth $273,373,861 0.39%Next Century Small Cap 88,525,382 0.13%Next Century MicroCap Growth 66,016,607 0.09%EAM MicroCap Growth 118,831,872 0.17%
Small Cap Value $713,684,604 1.02%AQR Capital Management, LLC 194,272,464 0.28%Boston Company Asset Management 223,412,034 0.32%DFA MicroCap Value 179,454,054 0.26%Callan US Microcap Value 116,546,053 0.17%
Market Oriented $5,911,615,627 8.45%PIMCO 533,716,339 0.76%P i L C C (li id i )Russell Fundamental LC OST managed 1,220,945,853 1.75%NT Domestic Equity (liquidating) 7,352 0.00%Wanger Asset Management 694,918,617 0.99%Wellington Mgmt - Domestic Equity 349,236,449 0.50%Russell 2000 Synthetic - OST managed 316,793,690 0.45%S&P 500 - OST managed 1,701,556,532 2.43%S&P 400 - OST managed 453,146,791 0.65%OST Risk Premia Strategy 641,294,004 0.92%
OtherTransitional & Closed Accounts 1,529,815 0.00%Shott Capital Management 116,404,577 0.17%
Lg Public Fund - Domestic Fixed (Gross)Annualized Five Year Risk vs Return
2 3 4 5 6 73%
4%
5%
6%
7%
8%
9%
10%
11%
Total Fixed Income
Oregon Custom FI Benchmark
Standard Dev iationR
etur
ns
Current Benchmark = 40% Barclay s Capital U.S. Aggregate Bond, 40% Barclay s Capital U.S. 1-3 Gov t/Credit Bond Index,15% S&P/LSTA Lev eraged Loan Index, and 5% Bof A ML High Yield Master II Index Ov erlay Program begins 10/31/2005,
OPERF Total Fixed Income Characteristics as of September 30, 2014
Current Benchmark = 40% Barclay s Capital U.S. Aggregate Bond, 40% Barclay s Capital U.S. 1-3 Gov t/Credit Bond Index,15% S&P/LSTA Lev eraged Loan Index, and 5% Bof A ML High Yield Master II Index Ov erlay Program begins 10/31/2005,
Fixed Income Portfolio CharacteristicsRankings Against CAI Core Bond Plus Styleas of September 30, 2014
(2)
0
2
4
6
8
10
12
Av erage Effectiv e Coupon OADuration Life Yield Rate Conv exity
OPERF Total Fixed Income Risk Analysis as of September 30, 2014
Current Benchmark = 40% Barclay s Capital U.S. Aggregate Bond, 40% Barclay s Capital U.S. 1-3 Gov t/Credit Bond Index,15% S&P/LSTA Lev eraged Loan Index, and 5% Bof A ML High Yield Master II Index Ov erlay Program begins 10/31/2005,
Rolling 12 Quarter Tracking Error vs Oregon Custom FI Benchmar
Trac
king
Erro
r
0%
1%
2%
3%
4%
5%
6%
7%
8%
9%
2009 2010 2011 2012 2013 2014
Total Fixed IncomeLg Public Fd - Dom Fixed
0 1 2 3 4 5 6(2 )
(1 )
0
1
2
3
4
5
6
Total Fixed Income
Tracking Error
Exc
ess
Ret
urn
Risk Analysis vs Lg Public Fund - Domestic Fixed (Gross)Five Years Ended September 30, 2014
TOTAL OPERF 100% 69,137,321$ 100.0% -$ 69,137,321$ 100.0% 775,269$ 69,912,590$
1Targets established in June 2013. Interim policy benchmark consists of: 41.5% MSCI ACWI Net, 23.5% Custom FI Benchmark, 20% Russell 3000+300bps (1 quarter lagged),