37
Organ donation challenges in the UK Paul Murphy National Clinical Lead for Organ Donation United Kingdom

Organ donation challenges in the UK
Paul Murphy
National Clinical Lead for Organ Donation
United Kingdom

609 611 624 637 652 705780 772 786 829
200288
335373
436
507
540 510578
584
0
200
400
600
800
1000
1200
1400
1600
2007-8 2008-9 2009-10 2010-11 2011-12 2012-13 2013-14 2014-15 2015-16 2016-17
Donation after Brain-stem Death
Donation after Circulatory Death
UK Deceased Organ Donation
75% more donors
56% more transplants

Organ donation challengesDeceased donors pmp, 2015

Who Outcome measure
Society and individuals 80% consent / authorisation
NHS hospitals and staff
(donation)
26 deceased donors per million
population
NHS hospitals and staff
(transplantation)
5% improvement in organ
utilisation
NHSBT and
Commissioners
74 deceased donor transplants
per million population
Current UK strategy
Taking Organ Transplantation to 2020
‘Should any of these groups fail to respond, the aims of this strategy will not be fully achieved.’

Who Outcome measure Progress
Society and individuals 80% consent / authorisation 63.0%
NHS hospitals and staff
(donation)
26 deceased donors per million
population
21.8 pmp
NHS hospitals and staff
(transplantation)
5% improvement in organ
utilisation
-0.4%
NHSBT and
Commissioners
74 deceased donor transplants
per million population
57.3 pmp
Current UK strategy
Taking Organ Transplantation to 2020

International refusal rates
In 2016/17, 1172 / 3144
families said no.
A family refusal rate of
20% → 343 additional
donors

Factors associated with consent in the UK

Impact of patient’s known wishes
Odds ratio
0.1 1 10 100

NHS organ donor register

NHS organ donor registerImpact on family consent

NHS organ donor registerImpact on family consent
Achieving a
consent rate of
80% through the
ODR alone
would require
over 84% of the
population to be
on it.

Impact of a trained requestor
Odds ratio
0.1 1 10 100

Effect of trained requestor in DBD
http://www.odt.nhs.uk/deceased-donation/best-practice-
guidance/consent-and-authorisation/#nhsbtbestpractice

Countdown to organ donationchanges in Wales:
Human Transplantation (Wales)
Act 2013

UK consent rates by countryApril 2014 – Jun 2017
England (opt-in)
Population 55 million
Wales (opt-out)
Population 3 million

Impact of deemed consent in WalesSequential analysis in DBD donors

Impact of deemed consent in WalesSequential analysis in DCD donors

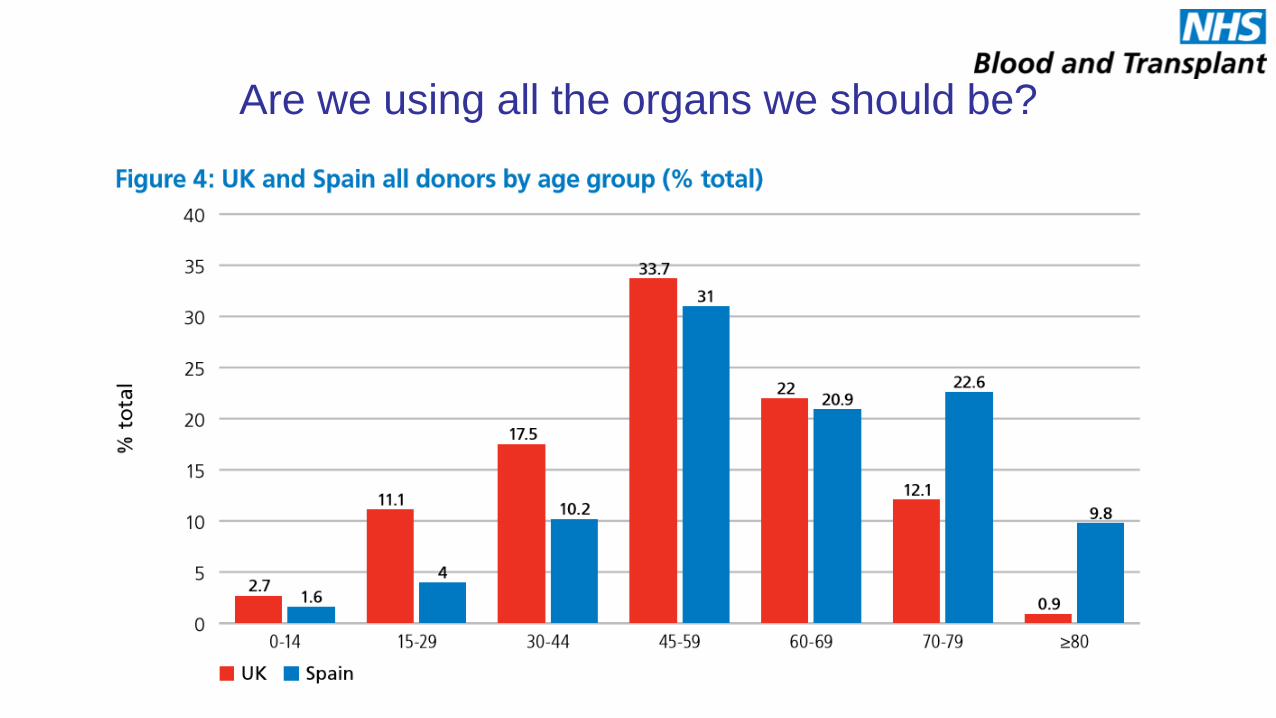
Are we using all the organs we should be?

Are we using all the organs we should be?
Strategic objective: 35%
0.00
0.05
0.10
0.15
0.20
0.25
0.30
0.35
0.40
0.45
hea
rt t
ran
spla
nts
/ D
BD
do
no
rheart transplants / DBD donor, 2013
Are we using all the organs we should be?

Expanding the donor pool

Ethicus study
End of life Categories (% patients)
Unsuccessful
CPR
Brain
death
Treatment
limitation
Treatment
withdrawal
Active
shortening of
dying process
Northern
Denmark, Finland, Ireland,
Netherlands, Sweden, UK
10.2 3.2 38.2 47.4 0.9
Central
Austria, Belgium, Czechia,
Germany, Switzerland
17.9 7.6 34.1 33.8 6.5
Southern
Greece, Israel, Italy, Portugal,
Spain, Turkey
30.1 12.4 39.6 17.9 0.1
Range between countries 5 - 48 0 - 15 16 - 70 5 - 69 0 - 19
End-of-Life Practices in European Intensive Care Units
Sprung et al, 2003. JAMA 290: 790-797.

Expanding the donor pool
Does variation in the management
of patients with catastrophic brain
injury explain these differences?

Expanding the donor poolHospital Episode Statistics
0
200
400
600
800
Apr-13
May-13
Jun-13
Jul-13 Aug-13
Sep-13
Oct-13
Nov-13
Dec-13
Jan-14
Feb-14
Mar-14
Apr-14
May-14
Jun-14
Jul-14 Aug-14
Sep-14
Oct-14
Nov-14
Dec-14
Jan-15
Feb-15
Mar-15
N. of deaths from identified conditions <80 (excl. A&E), Total (HES)
All in-patient deaths
Deaths from acute neurological conditions in patients < 80years,
(excluding ED)

Expanding the donor poolHospital Episode Statistics
0
200
400
600
800
Apr-13
May-13
Jun-13
Jul-13 Aug-13
Sep-13
Oct-13
Nov-13
Dec-13
Jan-14
Feb-14
Mar-14
Apr-14
May-14
Jun-14
Jul-14 Aug-14
Sep-14
Oct-14
Nov-14
Dec-14
Jan-15
Feb-15
Mar-15
Deaths on ICU
All in-patient deaths
Deaths from acute neurological conditions in patients < 80years,
(excluding ED)

27
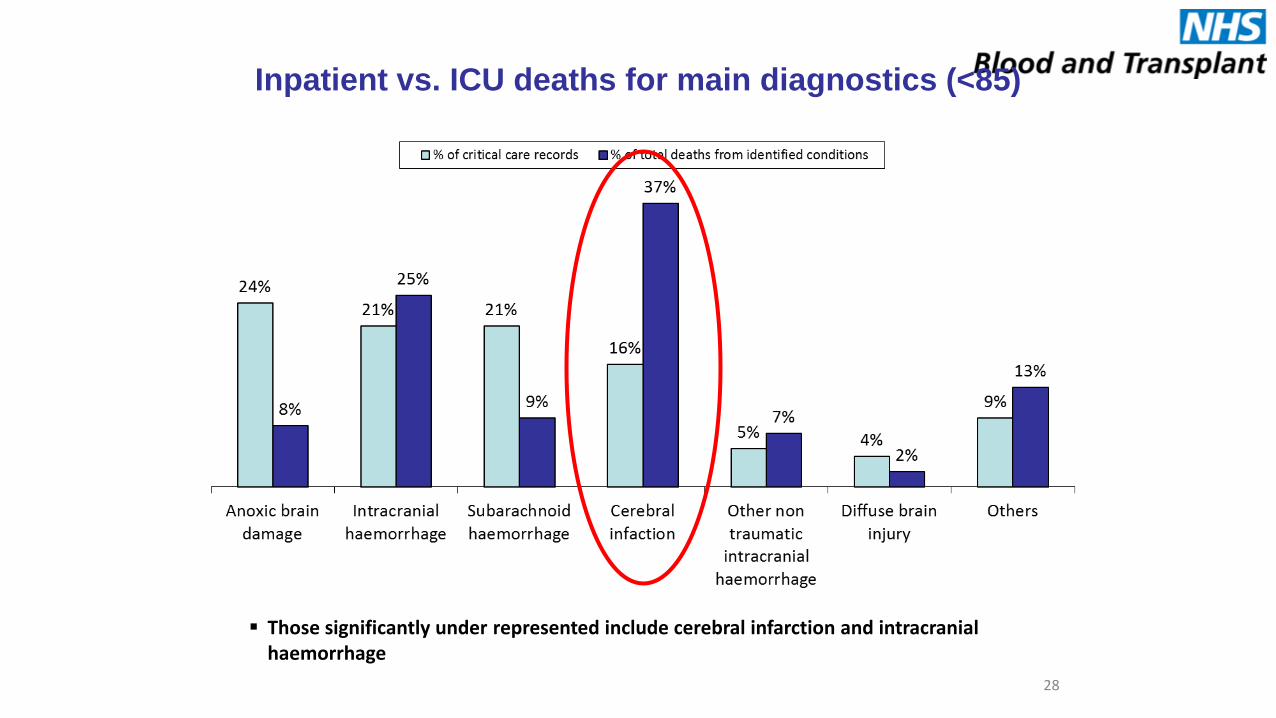
Inpatient vs. ICU deaths for main diagnostics (<85)
▪ Two diagnostics have a larger proportion of deaths while in critical care than expected based on proportion of deaths: anoxic brain damage and subarachnoid haemorrhage
28
Inpatient vs. ICU deaths for main diagnostics (<85)
▪ Those significantly under represented include cerebral infarction and intracranial haemorrhage

29
Effect of age on location of death
33% 21% 15% 11% 7% 3%
Xx% % of deaths in critical care
The proportion of deaths from the 26 identified IDC-10 codes that occurred in Critical Care, according to HES data is small (13% on average) and varies by age group (33% for 0-59)
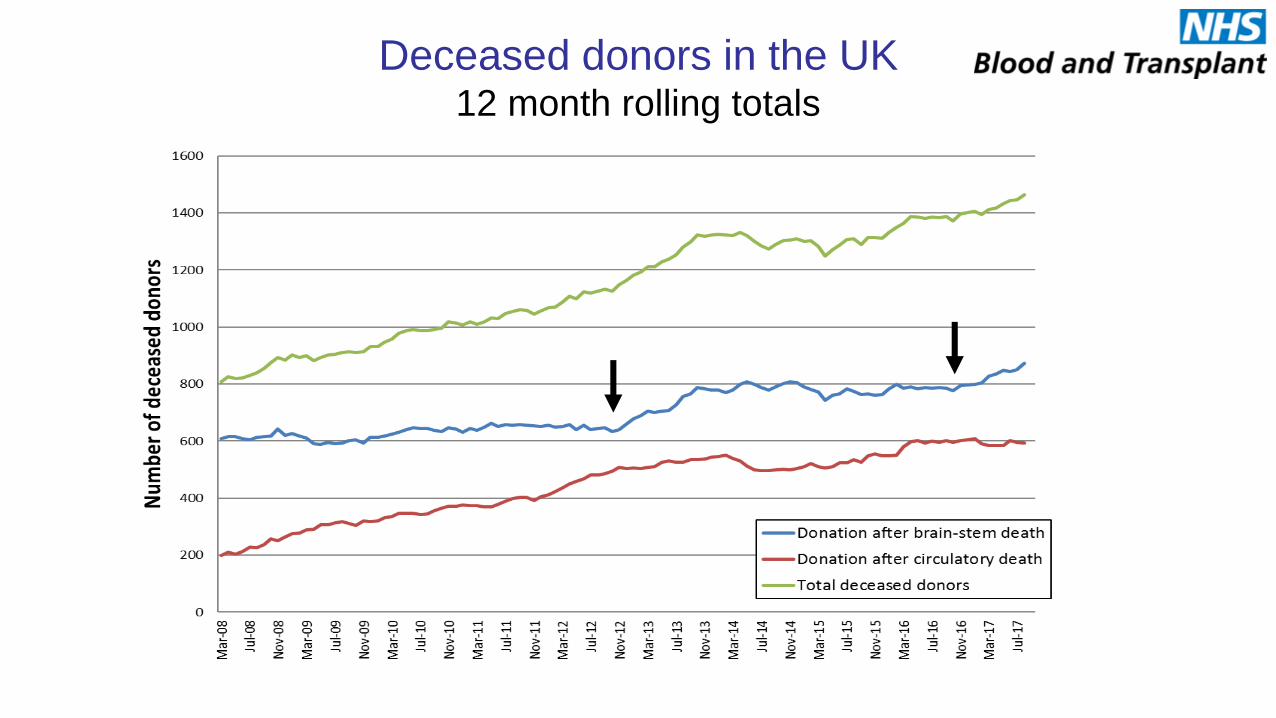
Deceased donors in the UK12 month rolling totals


1. We recommend determining prognosis from repeated
examinations over time to establish greater confidence
and accuracy.
2. We recommend applying these guidelines in the early
stages of DBI treatment in order to maintain physiologic
stability, even when early limitation of aggressive care is
being considered. Such early implementation prevents
unwarranted deterioration and allows sufficient opportunity
for prognostic evaluation, care planning, and consideration
of organ donation
3. We recommend using a 72-h observation period to
determine clinical response and delaying decisions
regarding withdrawal of life-sustaining treatment in the
interim.
US Neurocritical Care Society
Guidance

Organ Donation Challenges in the UKSummary
• Conversion
– Family refusal
• More effective requesting
• Legislative reform?
– Organ utilisation
• Improved donor assessment / optimisation
• More consistent decision making
• Novel technologies for DCD
• Expansion of the donor pool
– More an issue for Intensive Care Medicine

International Donation RatesRelationship with legal framework for consent
0
5
10
15
20
25
30
35
40
45d
on
ors
pe
r m
illio
n p
op
ula
tio
n, 2
01
5 Opt – in
Opt-out

Opt-out in the UK
Population Opt-in (%) Opt-out (%)
England 55,026,327 19,469,284 (35) 31,086 (0.06)
Northern Ireland 1,851,621 742,939 (40) 223 (0.01)
Scotland 5,373,000 2,404,631 (45) 2,028 (0.04)
Wales 3,099,086 1,178,651 (38) 175,615 (6)
Total 65,350,034 23,795,505 (36) 208,952 (0.03)
Source: NHSBT, as of 25th May 2017

Increasing Donor NumbersDonor identification and referral
0
10
20
30
40
50
60
70
80
90
100
Re
ferr
al ra
te (
%)
DBD DCD
There were 893 missed
DCD referrals in the
UK in 2016/17

Expanding the donor pool
• Different standards for neurological
determination of death (worrying)
• Lower incidence of brain injury
(complacent)
• Better outcomes from treatment
(arrogant)
• Different approach to the end of life
care in patients with catastrophic
brain injury (intriguing)
Does treatment limitation or
withdrawal account for these
differences?


