Organic and Conventional Farming: a Comparison Analysis through the Italian FADN Federica Cisilino e Fabio A. Madau [email protected]Paper prepared for presentation at the I Mediterranean Conference of Agro-Food Social Scientists. 103 rd EAAE Seminar ‘Adding Value to the Agro-Food Supply Chain in the Future Euromediterranean Space’. Barcelona, Spain, April 23 rd - 25 th , 2007 Copyright 2007 by [Federica Cisilino e Fabio A. Madau]. All rights reserved. Readers may make verbatim copies of this document for non-commercial purposes by any means, provided that this copyright notice appears on all such copies.
Transcript
Organic and Conventional Farming: a Comparison Analysis through the Italian FADN
Paper prepared for presentation at the I Mediterranean Conference of Agro-Food Social Scientists. 103rd EAAE Seminar ‘Adding Value to the Agro-Food Supply Chain in the Future Euromediterranean Space’. Barcelona, Spain, April 23rd - 25th, 2007 Copyright 2007 by [Federica Cisilino e Fabio A. Madau]. All rights reserved. Readers may make verbatim copies of this document for non-commercial purposes by any means, provided that this copyright notice appears on all such copies.
Organic and Conventional Farming: a Comparison Analysis through the Italian FADN1
FEDERICA CISILINO* - FABIO A. MADAU**
INEA - National Institute of Agricultural Economics
Abstract. This paper shows some results arisen from a wider research on economic and environmental sustainability of organic farming. It focuses on organic and conventional farming comparison through an investigation of Italian FADN data. In order to identify some of the main differences between organic and conventional farms a “distance analysis” has been carried out. The study aims to highlight some of the main characteristics of those two groups of farms to better address differences (if any) in production technology, costs and revenues. Furthermore it shows the findings of a non-parametric efficiency analysis on the Italian olive-growing farms. The purpose is to estimate difference in efficiency and productivity between organic and conventional olive producers. Results reveal that looking at the average values on Invested Areas, conventional farms’ Gross Production is significantly higher than the organic ones, as the Net Margin, as the Net Product and Costs. The average values on Total Labour Force instead, shown that, even if conventional farms still have higher values than organic ones, the “distance” become shorter. That means that the two groups are quite similar and that, even if organic farms still produce a lower “economic value”, they better compensate productive factors, especially in terms of Labour Force. Regards to efficiency analysis, we found that organic olive-growing farms are more able in using their disposable resources (with reference to their own frontier), and the higher efficiency permits them to compensate the lower productivity with respect to the conventional farms.
c/o Department of Economics and Woody Plants System Via Enrico de Nicola 1, 07100 – SASSARI Phone: (+39) 079 229259 Fax: (+39) 079 229356 E-mail: [email protected]
������������������������������������������������
This research is carried out from the project “La Sostenibilità dell'Agricoltura Biologica. Valutazioni economiche, ambientali e sulla salute umana (SABIO)” coordinated by Carla Abitabile (INEA) and financed by the Italian Ministry of Agriculture and Forestry Policies. The views expressed are those of the authors and do not necessarily reflect the views of INEA.
1
Organic and Conventional Farming: a Comparison Analysis through the Italian FADN
1. Introduction
Organic agriculture is a production method that allow to apply low environmental impact
techniques, since it does not employ chemical products that could affect both the final product and
the environment. In spite of the great increase of organic production in Italy in the last decade, it has
to be notice that this practice has not been developed following an homogenous way both in terms
of territory (geo-distribution) and cultivations. In fact, crops prevails on all the other production’s
typologies and some Regions (South and Islands) lead on the other in terms of cultivated areas.
Moreover, the organic production is mainly located to the South Italy, while processing activities
are mainly located to the North. Finally, the consumption of organic products is higher in the North.
Except for few farms that start from the very beginning to produce organic, the main ones switch
trough the organic method from the conventional practice (Scardera, Zanoli, 2002).
The aim of this paper is to analyse two groups of farms respectively constituted by organic and
conventional farms. It is an evidence that productivity in the organic process are generally lower
than in the conventional farming (Offermann and Nieberg, 2000). It is clear that presence of
inadequate efficiency and productivity levels could be a disincentive for farmers to shift towards
organic farming1 . As a consequence - living aside the environmental and health externalities
generated by this practice - development of organic farming could be invalidated if individual farms
do not reach adequate efficiency levels. This would imply that organic farms must tend to be
efficient both on the productive and on the economic sides. In the light of this consideration, an
important research issue is the comparison of productive and economic performances between
organic and conventional farms. A crucial point is evaluating the “distance” between the two
������������������������������������������������1 Several studies have found that financial subsidies and not profitability represent the main incentive to farmers to switch towards organic farming (Pietola and Oude Lansink, 2001).
2
practices by the structural and efficiency sides as to obtain useful information about convenience or
otherwise of adopting an organic technique. Our study is a part of a wider research aimed to
compare Italian organic and conventional farms and their sustainability in a long run. Specifically,
the present work focuses on the following two objectives: the first part of this paper presents a brief
literature overview of the most recent statistical methodologies applied to address the selection of
similar farms to be compared. The results of the procedure applied to the Italian FADN sample is
then presented. The study try to provide evidence of heterogeneity or homogeneity among farms
(organic and conventional) through the analysis of some key economic variables. The second
purpose aims to evaluate differences in efficiency between organic and conventional farming by a
technical point of view. More specifically, this paper shows some findings of a case study that takes
into specific consideration the Italian olive-growing sector. Trough a non-parametric approach
(Data Envelopment Analysis), analysis evaluates which technique is more able in using their
disposable productive inputs.
2. Comparing Organic and Conventional Farms: Methodologies and Selection Criteria
The comparative analysis introduces some problems related to methodological issues. Some
researchers argue about the effective reasonableness of the comparison itself, because it is carried
out on two systems characterized by: a) high differences as far as the productive techniques are
concerned; b) different technical-productive paradigm, admitted that it is possible to define a
peculiar one for each group; c) heterogeneity inside, mostly because conventional farming is a mix
of agronomic techniques, some of those quite similar to the organic ones. With respect to this last
aspect, conventional farming could be considered as the most widespread production system in a
territory or, as well, all the other kind of productive techniques which can be considered as
alternatives to the organic ones (Offermann and Nieberg, 2000). Even if the choice is dictated by
the analysis’ object, it is known that there is the risk to argue about not homogenous systems,
neither from the technological point of view, neither from the management one. It is then necessary
3
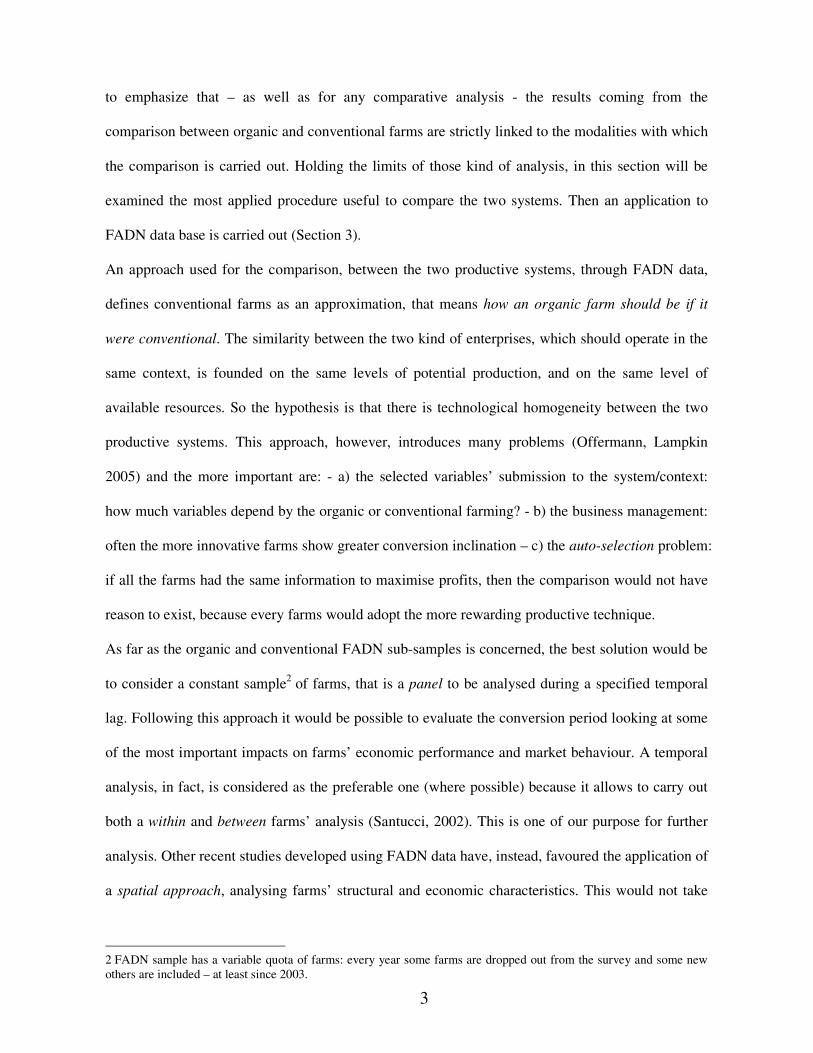
to emphasize that – as well as for any comparative analysis - the results coming from the
comparison between organic and conventional farms are strictly linked to the modalities with which
the comparison is carried out. Holding the limits of those kind of analysis, in this section will be
examined the most applied procedure useful to compare the two systems. Then an application to
FADN data base is carried out (Section 3).
An approach used for the comparison, between the two productive systems, through FADN data,
defines conventional farms as an approximation, that means how an organic farm should be if it
were conventional. The similarity between the two kind of enterprises, which should operate in the
same context, is founded on the same levels of potential production, and on the same level of
available resources. So the hypothesis is that there is technological homogeneity between the two
productive systems. This approach, however, introduces many problems (Offermann, Lampkin
2005) and the more important are: - a) the selected variables’ submission to the system/context:
how much variables depend by the organic or conventional farming? - b) the business management:
often the more innovative farms show greater conversion inclination – c) the auto-selection problem:
if all the farms had the same information to maximise profits, then the comparison would not have
reason to exist, because every farms would adopt the more rewarding productive technique.
As far as the organic and conventional FADN sub-samples is concerned, the best solution would be
to consider a constant sample2 of farms, that is a panel to be analysed during a specified temporal
lag. Following this approach it would be possible to evaluate the conversion period looking at some
of the most important impacts on farms’ economic performance and market behaviour. A temporal
analysis, in fact, is considered as the preferable one (where possible) because it allows to carry out
both a within and between farms’ analysis (Santucci, 2002). This is one of our purpose for further
analysis. Other recent studies developed using FADN data have, instead, favoured the application of
a spatial approach, analysing farms’ structural and economic characteristics. This would not take
������������������������������������������������
2 FADN sample has a variable quota of farms: every year some farms are dropped out from the survey and some new others are included – at least since 2003.
4
into account the possible effects coming from a change in business management, as well as those
necessary to evaluate the effective convenience to convert (evaluation of cost-oppurtunity).
Some studies match groups of farms ensuring only that group averages are similar, while some
others select a group of comparable farms for each organic farm. Furthermore, some studies use an
aggregated measure of similarity which allow to rank conventional farms and then select a number
of most similar farms (Offermann, 2004). These differences make comparison across countries
difficult (Lee, Fowler, 2002) so a proposal of guidelines for harmonisation have been developed
(EU-CEEOFP). The comparison analysis that could have been adopted can be summarize as
follows: a) comparison between groups of similar farms: averages inside groups are similar; b)
comparison between two farms considered as the most representative of their farm type; c)
comparison between organic and conventional farms classified as similar thanks to a weighting
system of selection; d) comparison between farms based on “minum similar criterion”, where the
conventional farms selected have specific minimum requirements; e) comparison between two
groups of farms with similar characteristics as far as productive system, dimension and localization
is concerned. The debate on farms’ selection process for comparison is still open, however, it has
been followed some of the main guidelines shown in recent studies (Nieberg et al., 2005) and
seminars (IFOAM, 2005). According to these researchers, organic and conventional farms to be
compared have to achieve the following requirements:
- similar environmental conditions (land fertility, climate…);
- same localization (Region);
- same equipment of productive factors;
- same business typology (farm type)
The selection of the comparison groups of farms have been done by selecting those that fall within a
set of criteria (indicators) that submit the requirement to be independent from the system of
production, following the main guidelines for harmonization (Offerman, Nieberg, 2000). As a result,
a group of conventional farms of 799 farms have been selected. The two FADN sub-sample have
5
though the same number of farms, as for each organic farm have been selected the most similar one
with respect to some selection criteria (Section 3).
3. The distance between organic and conventional farms: an application to FADN data base
The reference population (universe) is the Italian FADN data base (2003)3, the statistical unit (basic
unit) coincides with the research unit, that is the farm. The FADN sample counts 14,811 units, the
organic farms sub-sample consists of 799 units. It is necessary to point out the peculiarity of the
organic sample, which is affected by the so called “auto-selection” biased. This has to be taken into
great account while reading the analysis’ results, because it has an influence on the variability of the
whole system and affected the carried out analysis.
FADN (Farm Accountancy Data Network) is an important informative source4 of micro-economic
data for the agricultural sector. It gathers structural and economic data for a large sample of farms
(an average of about 17,000 Italian farms/year represent the 31% of the total European sample)5.
The European Union universe of farms is a set of farms of at least 1 hectare, while the Italian one
establish a limit in terms of ESU (> 2 ESU since 1985 until 2001; > 4 ESU since 2002). The value
of one ESU is defined as a fixed number of EUR/ECU of Farm Gross Margin. Both the economic
dimension unit and the technical and economic orientation are based on the standard gross margin
of the production activities. The concept of Standard Gross Margin (SGM)6 is used to determine the
economic size of farms, which is expressed in terms of European Size Units (ESU). This concept is
also used in the Farm Structure Survey organised by Eurostat. The selection of farms have been
������������������������������������������������3 FADN is the only harmonised source, at European level, that includes technical, financial and economic data on farming. It is not the official statistical source of information on financial/economic aspects of the organic agriculture, nevertheless it has been widely used in several national and international studies. 4 Farm Accountancy Data Network (FADN) was founded by Reg. (EC) n. 79/65 and Reg. CEE 797/85, 2328/91, 950/97. FADN is managed for Italy by the National Institute of Agricultural Economics (INEA). 5 The field of observation of Italian FADN refers to those farms that are defined “commercial”, meaning with this that firm’s management is the main entrepreneur’s activity. A commercial farm is defined as a farm which is large enough to provide a main activity for the farmer and a level of income sufficient to support his or her family. In order to be classified as commercial, a farm must exceed a minimum economic size. 6 SGMs are expressed in European Currency (EUR/ECU).
6
based on a stratified sampling method based on firm’s geographical location, technical and
economic orientation and economic dimension unit. The variables used for stratification are in fact:
- TEO7: The classification used for selection is based on 67 principal farm type categories.
- ESU8:�The classification used for selection is based on 7 farm size categories.
- Region9: The classification for selection is based on 21 Italian Regions and on 3 district areas
(North, Centre, South and Islands).
Every cell containing a specific number of organic farms have been filled up with those
conventional farms that shown the best requirements. The choice of variables for the selection of
comparable conventional farms have been restricted to non-system dependent factors. Some
indicators have been considered to select those conventional farms that could be defined similar to
the organic ones in terms of production potential, resources endowment, land area, farm type. In
particular, the selecting procedure have been carried out following three steps: 1) evaluation of the
selection variables using FADN data (data availability in the Italian FADN data base); 2) set-up of
the selection indicators for the submission of conventional farms; 3) data processing for the
effective conventional farms’ selection. Data processing on FADN Data base have considered the
following indicators: a) Indicator for similar natural and production condition: Altitude zone; b)
Indicator for similar localization: Region; c) Indicators for similar endowment with production
factors: CA/TA (Cultivated Area/Total Area), FLF/TLF (Familiar Labour Force Units/Total Labour
Force Units), Machinery and Equipment; d) Indicators for similar farm type: SGM (Standard Gross
Margin). Those indicators have been compared simultaneously and lead to select the most similar
conventional farm for each organic one observed.
Living the issues related to the environmental impact of organic farming versus conventional of the
productive process10, the comparison has been developed through the analyses of some of the most
������������������������������������������������7 TEO stands for Technical and Economic Orientation. 8 ESU stands for European Size Unit. 9 FADN Regions (NUTS). 10 The SABIO project carried out the analysis about the environmental impact through a set of indicators based on land productivity, technical practices employed and energy.
7
important structural and economic characteristics of farms. Organic FADN sub-sample (2003)
represents the 5.4% of the total sample and it is distributed as shown in Table 3.1. Organic farms
are mainly concentrated in the South of Italy with 400 farms where the 48.8% are Specialized in
Permanent Crops.
Table 3.1. Organic farms by type of farming (Technical Economic Orientation) and District - % N. FARMS / DISTRICT TYPE OF FARMING North % Centre % South and Isl. % Total % Specialist field crops 18 2,3 59 7,4 47 5,9 124 15,5 Specialist horticulture 3 0,4 2 0,3 4 0,5 9 1,1 Specialist permanent Crops 47 5,9 58 7,3 195 24,4 300 37,5 Specialist grazing livestock 63 7,9 43 5,4 80 10,0 186 23,3 Specialist granivore 2 0,3 4 0,5 3 0,4 9 1,1 Mixed cropping 17 2,1 26 3,3 34 4,3 77 9,6 Mixed livestock 1 0,1 8 1,0 5 0,6 14 1,8 Mixed crops-livestock 11 1,4 37 4,6 32 4,0 80 10,0 Total 162 20,3 237 29,7 400 50,1 799 100,0
Source: Own data processing on FADN data (2003).
Some of the main structural characteristics of the two groups of farms taken into account are shown
in Tables 3.2. and 3.3. The results give evidence of the fact that, on average, organic farms are
wider than conventional ones in terms of cultivated areas for all the type of farming processed. This
is confirmed both with respect to the total sample and to the non-comparison sample as well.
Organic farms field crops’ specialized and horticulture specialized invest greater areas than
conventional ones. As far as the dimension of breedings is concerned, some differences are found
for the specialist grain-growing, but, on average, the dimension of the two groups of farms
compared is equivalent (37.11 and 36.40) with values attested both under the total sample and the
non-comparison sample ones. The Standard Gross Margin turns out on average with same level for
organic farms and conventional farms, being the same for comparison and non comparison sample.
Furthermore, these values achieve the total sample one.
A low intensity of employment is registered for conventional farms, both in terms of Total Labour
Force and of Family Labour Force as shown in Table 3.3.
8
Table 3.2. Organic and Conventional sub-samples: Cultivated Areas (CA), Grown Cattle Unit (GCU) and Economic Dimension (SGM) by type of farming (Technical Economic Orientation) – Averages. CA - Cultivated Area organic conventional non comp Total Specialist field crops 72.48 63.50 49.00 50.30 Specialist horticulture 89.39 33.18 4.22 5.29 Specialist permanent Crops 25.02 21.95 14.49 15.68 Specialist grazing livestock 65.65 61.66 49.25 51.16 Specialist granivore 148.57 20.99 21.91 25.49 Mixed cropping 53.76 51.94 29.27 31.83 Mixed livestock 76.84 46.66 48.62 50.21 Mixed crops-livestock 61.05 55.26 43.19 45.75 total 51.24 44.42 32.71 34.34 GCU - Grown Cattle Unit organic conventional non comp Total Specialist field crops 6.36 2.20 3.66 3.71 Specialist horticulture 0.06 - 0.14 0.14 Specialist permanent Crops 1.30 0.46 0.60 0.64 Specialist grazing livestock 62.75 63.33 82.32 79.77 Specialist granivore 649.14 2,605.57 612.64 670.44 Mixed cropping 15.20 18.53 5.11 6.39 Mixed livestock 70.64 74.75 322.84 292.52 Mixed crops-livestock 37.11 36.40 74.47 68.01 SGM – Standard Gross Margin organic conventional non comp Total Specialist field crops 56.28 57.89 52.13 52.47 Specialist horticulture 326.26 314.80 98.78 102.91 Specialist permanent Crops 52.83 53.17 41.66 43.16 Specialist grazing livestock 52.48 51.17 70.11 67.69 Specialist granivore 228.86 261.86 115.45 122.85 Mixed cropping 62.35 52.70 39.39 41.36 Mixed livestock 53.07 44.88 101.91 95.49 Mixed crops-livestock 34.38 39.07 50.80 48.39 total 57.42 57.13 56.56 56.64
Source: Own data processing on FADN data (2003).
Table 3.4. introduces some economic variables as average values. It would be useful to process data
by type of farming in order to highlight differences between the main technical economic
orientation (and this is our purpose for the next future). In any case, it is possible to notice that
looking at the average values on Cultivated Areas, conventional farms’ Gross Production is
significantly higher than the organic ones, as the Net Margin, as the Net Product and Costs. The
average values on Total Labour Force instead, shown that, even if conventional farms still have
higher values than organic ones, the “distance” become shorter. That means that the two groups are
9
quite similar and that, even if organic farms still produce a lower “economic value”, they better
compensate productive factors, especially in terms of Labour Force.
Table 3.3. Organic and Conventional sub-samples: Total Labour Force (TLF) by type of farming (Technical Economic Orientation) – Averages. TLF - Total Labour Force organic conventional non comp Total Specialist field crops 1.84 1.56 1.61 1.62 Specialist horticulture 8.73 4.19 3.09 3.16 Specialist permanent Crops 2.20 2.10 1.95 1.97 Specialist grazing livestock 2.07 1.91 2.05 2.04 Specialist granivore 6.41 8.49 2.83 3.10 Mixed cropping 3.18 2.36 1.92 2.01 Mixed livestock 2.14 1.91 2.94 2.83 Mixed crops-livestock 1.79 1.89 1.86 1.85 total 2.29 2.07 1.99 2.01 FLF - Family Labour Force organic conventional non comp Total Specialist field crops 1.07 1.01 1.03 1.03 Specialist horticulture 1.68 2.29 1.41 1.42 Specialist permanent Crops 0.97 0.99 1.01 1.01 Specialist grazing livestock 1.50 1.56 1.55 1.55 Specialist granivore 1.30 1.24 1.48 1.47 Mixed cropping 1.17 1.08 1.09 1.09 Mixed livestock 1.38 1.61 1.54 1.53 Mixed crops-livestock 1.49 1.45 1.34 1.36 total 1.20 1.21 1.19 1.19
Source: Own data processing on FADN data (2003).
Table 3.4a. Most important balance sheet elements: comparison between organic and conventional farms – Average values on Cultivated Area (CA) and on Total Labour Force (TLF) (continue to the next page). On CA - Cultivated Area organic conventional non comp Total Land Capital 20,472.37 23,182.59 62,551.88 58,158.01 Exercise Capital 4,432.38 8,601.35 31,372.70 28,690.94 Machinery and Equipment power 8.55 9.89 20.79 19.54 Chartering 29.83 39.82 204.78 186.44 New Investments 416.23 866.52 13,414.65 12,036.50 Gross Production (PLV) 3,920.41 9,121.73 30,204.33 27,649.08 Variable Costs 1,647.43 4,912.72 15,526.90 14,205.56 Gross Margin (Valore Aggiunto) 2,339.59 4,294.83 13,075.27 12,022.45 Fixed Costs 1,058.57 1,959.80 5,596.38 5,155.40 Net Margin (Reddito Netto) 1,359.19 2,416.27 9,286.20 8,487.96 Net Product (Prodotto Netto) 2,175.75 3,735.36 12,894.64 11,822.29
10
Table 3.4b. Most important balance sheet elements: comparison between organic and conventional farms – Average values on Cultivated Area (CA) and on Total Labour Force (TLF). On TLF – Total Labour Force organic conventional non comp Total Land Capital 376,629.08 340,459.52 346,628.19 347,913.85 Exercise Capital 57,497.09 49,648.91 52,398.05 52,524.82 Gross Production (PLV) 53,200.17 56,027.65 47,571.60 48,331.41 Gross Margin (Valore Aggiunto) 32,491.30 40,021.54 28,947.84 29,736.38 Net Margin (Reddito Netto) 20,756.03 29,015.86 19,339.40 19,937.83 Net Product (Prodotto Netto) 29,925.09 35,880.01 24,938.28 25,797.57
Source: Own data processing on FADN data (2003).
4. Efficiency analysis and data
Technical efficiency (TE) is defined as the measure of the ability of a firm to obtain the best
production from a given set of inputs (output-increasing oriented), or as a measure of the ability to
use the minimum feasible amount of inputs given a level of output (input-saving oriented) (Greene,
1980; Atkinson and Cornwell, 1994)11. In case of input-oriented approach, TE represents a cost
efficiency measures that reflects the degree of reduction of input use in order to obtain the same
output level.
4.1 - The analytical framework
Several procedures have been proposed in literature to estimate efficiency12. Data Envelopment
Analysis (DEA) is a non-parametric approach to estimate efficiency originally proposed by
Charnes et al. (1978) and based on the Farrell’s model (1957). DEA consents the estimation of
efficiency in multi-output situations and without assuming a priori functional form for frontier
production (Roland and Vassdal, 2000). Solving a linear programming problem, DEA calculates
efficiency by comparing each production unit against all other units. The best practice frontier is
represented by a piecewise linear envelopment surface. Therefore, TE scores arisen from DEA are
invariant to technology, because obtained trough comparisons among an observation and each
others and not with respect to an estimated frontier.
������������������������������������������������
11 When firm operates in a constant return of scale area the two measures coincide (Fare and Lovell, 1978). 12 See Førsund et al. (1980), Bauer (1990) and Pascoe (2001) for more detailed information about the parametric techniques and their applications. A survey of applications in agriculture is shown in Battese (1992).
11
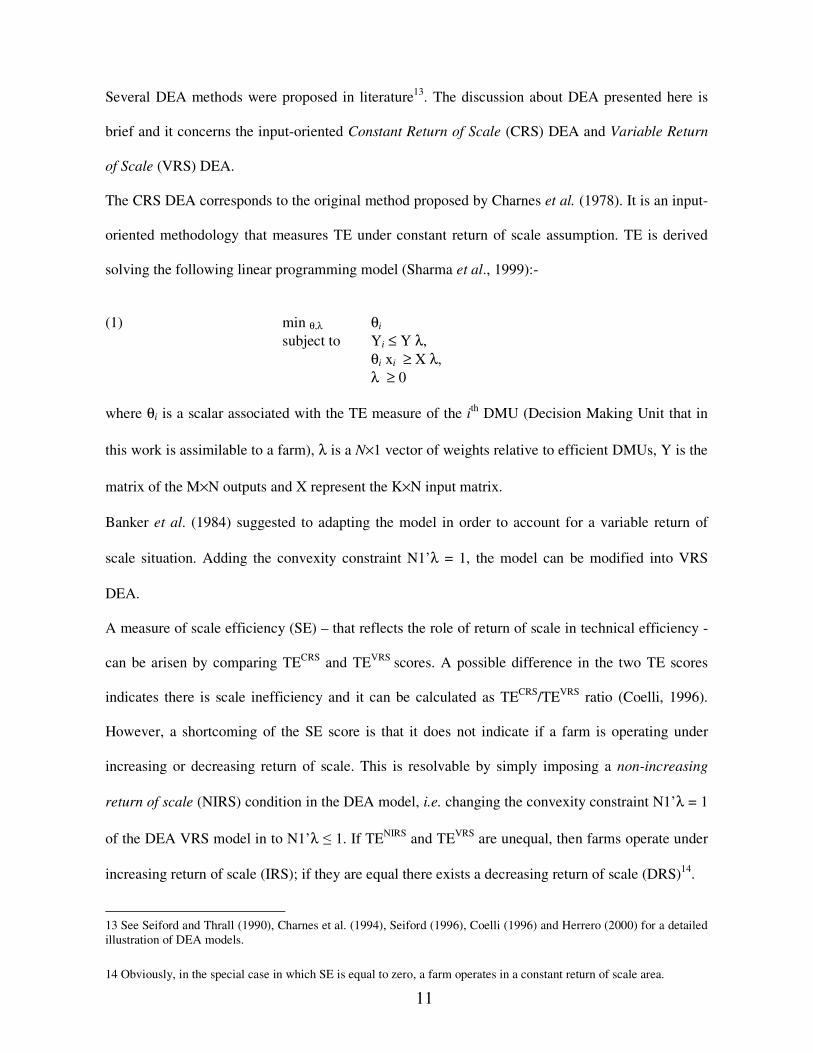
Several DEA methods were proposed in literature13. The discussion about DEA presented here is
brief and it concerns the input-oriented Constant Return of Scale (CRS) DEA and Variable Return
of Scale (VRS) DEA.
The CRS DEA corresponds to the original method proposed by Charnes et al. (1978). It is an input-
oriented methodology that measures TE under constant return of scale assumption. TE is derived
solving the following linear programming model (Sharma et al., 1999):-
(1) min θ,λ θi
subject to Yi ≤ Y λ, θi xi ≥ X λ, λ ≥ 0
where θi is a scalar associated with the TE measure of the ith DMU (Decision Making Unit that in
this work is assimilable to a farm), λ is a N×1 vector of weights relative to efficient DMUs, Y is the
matrix of the M×N outputs and X represent the K×N input matrix.
Banker et al. (1984) suggested to adapting the model in order to account for a variable return of
scale situation. Adding the convexity constraint N1’λ = 1, the model can be modified into VRS
DEA.
A measure of scale efficiency (SE) – that reflects the role of return of scale in technical efficiency -
can be arisen by comparing TECRS and TEVRS scores. A possible difference in the two TE scores
indicates there is scale inefficiency and it can be calculated as TECRS/TEVRS ratio (Coelli, 1996).
However, a shortcoming of the SE score is that it does not indicate if a farm is operating under
increasing or decreasing return of scale. This is resolvable by simply imposing a non-increasing
return of scale (NIRS) condition in the DEA model, i.e. changing the convexity constraint N1’λ = 1
of the DEA VRS model in to N1’λ � 1. If TENIRS and TEVRS are unequal, then farms operate under
increasing return of scale (IRS); if they are equal there exists a decreasing return of scale (DRS)14.
������������������������������������������������
13 See Seiford and Thrall (1990), Charnes et al. (1994), Seiford (1996), Coelli (1996) and Herrero (2000) for a detailed illustration of DEA models.
14 Obviously, in the special case in which SE is equal to zero, a farm operates in a constant return of scale area.
12
4.2 - The data
Olive is a typical Mediterranean plant. In this contest only some data are illustrated as to put on
evidence the importance of this cultivation and of olive oil production in the Mediterranean basin
and in Italy. In the 2004/2005 more than 98% of world oil production came from Mediterranean
countries (IOO, 2006). Especially, olive oil production into the European Union amounted to about
2.5Mt that corresponded to 78.2% of world production. Italy follows the Spain as the main producer
in the world (29% and 32% the quote of world production for Italy and Spain respectively). In 2004
Italian land area cultivated with olive amounted to 1.2Mha (third country in the Mediterranean area
after Spain and Tunisia) and the olive production was equal to 4.5Mt. In our analysis, DEA was
applied on a sample of 115 organic and 114 conventional Italian olive-growing farms. The two sub-
samples were selected according to the criteria described in the paragraph 2. The choice of utilizing
a sample composed by an equal number of farms in the two groups was driven in order to have a
substantial homogeneity between organic and traditional farms as regards structural, environmental
and management aspects. This approach is a well-know procedure in these sort of studies that
consists to compare “average for groups of organic farms (…) with averages for conventional
farms differentiated by region, type, size and other characteristics” (Lampkin, 1994, p. 33).
According to Offermann and Nieberg (2000) this methodology presents the advantage of
minimizing risk of including external aspects (“non-system determined”) that can affect results
because comparability is guaranteed by the fact that organic and conventional farms show a similar
“potential” endowment. Concerning the variables used in DEA, they were defined as follows:
Output (Y) represents the value of production (in euro) by each farm; Land (x1) is the total amount
of UAA (in Ha) on which olive is grown; Labour (x2) represents the total amount of used labour (in
man-hours) used; Machineries (x3) is the annual utilisation of machineries (in euro); Capital (x4) is
the total amount of fixed capital and it represents the value (in euro) of investment in building;
Technical inputs (x5) is the expenditure (in euro) on fertilizers, pesticides and other technical inputs;
Other expenditures (x6) is the value (in euro) of the other expenditures by each farm.
13
5. Empirical results
Efficiency measures carried out using the Deap 2.1 program created by Coelli (1996).
In a first step, analysis was conduct refereeing TE to a unique production frontier for organic and
conventional farms, i.e. under the hypothesis of technological homogeneity between the two
agronomic methods. In this case, efficiency measures can be directly comparable as to evaluate
which technique reveals a better overall capacity in using their disposable inputs. Results indicate
that, under CRS assumption, the average technical efficiency score is 0.422 for organic olive-
growing farms and 0.467 for conventional farms (Table 5.1). Assuming a VRS technology the
average TE amounts to 0.543 and 0.568 for organic and conventional farms respectively15. This
difference would indicate that conventional olive-growing farmers use their inputs more efficiently
than conventional ones. However, the difference between the TEVRS means are not significant,
implying that the two type of farmers show a similar ability in using farm resources16. On the
contrary, scale efficiency is significantly different in conventional olive-growing’s favour (0.837 vs.
0.796). This evidence suggests that the influence of farm size issue on technical inefficiency is more
relevant in organic farms than in conventional ones. Adjusting the scale of the operation, organic
farms could improve their efficiency by about 20%, while the margin would be 16,3%% for
conventional farms. In other terms, the search for an optimal scale would become a priority
particularly for organic farmers. Imposing the NIRS condition to (1), it carries out that the most of
the farms exhibit an increasing return of scale in both sub-samples (93% of the organic and 90% of
the conventional farms). Therefore, cost inefficiency of olive-growing farms could be reduced by
exploiting economies of size in a scale increase direction. Experience suggests that a probable cause
of this lack in adjusting scale could be identified in the difficulty in implementation of new
technique such as organic farming, tendentially based on high-labour intensity and on low-capital
������������������������������������������������
15 Under a VRS assumption, a good 17 conventional farms lie on frontier production (14,9% of the sample), while only 9 organic show a full efficiency (7,9% of the sample). 16 In a case study on Sardinian olive-growing farms, Idda et al. (2004) found that organic farms (TEVRS = 0.676) were significantly more efficient than conventional ones (TEVRS = 0.623)
14
intensity. As in all such innovations, the introduction of a new technique could require time in the
learning of how to employ it (Nelson and Winter, 1982). As time passes, organic farms may
gradually optimize their size and improve scale efficiency.
Table 5.1. Overall technical efficiency and scale efficiency from DEA Efficiency TECRS TEVRS SE ORGANIC FARMS
Mean* 0,473 0,581 0,833 s.d. (0,238) (0,270) (0,178) Productivity (�) 0,988 0,977 (*) p-values for t-test on difference between means: TECRS = 1.56E-04; TEVRS = 7.63E-05; SE = 0.422)
Empirical findings show that organic farms are using a less productivity technology than
conventional farms (0.766 vs. 0.977 with the DEA VRS model for organic and conventional farms
respectively). On the contrary, the estimated specific TE indicate that organic olive-growers are
sensitively more efficient (0.709) than conventional ones (0.581), relative to their own frontier
technology.
Since, overall TE is not significantly different between the two olive-growing techniques, it implies
that the organic farmers are able to compensate for their technical disadvantage – i.e. less
productivity - with higher (specific) efficiency in input use. In other terms, the organic farmers
substantially achieve a similar overall TE with respect to the conventional ones due to a more
rationale use of their own inputs rather than from a more productivity.
16
These results would seem surprising, were it not for the fact that this pattern stands out in other
study on organic farming efficiency (Tzouvelekas et al., 2001a; 2002a and 2002b; Oude Lansink et
al., 2002)18. According to Tzouvelekas et al., 2001a, the rationale underlining for olive-growing
farms is that producer’s belief that productivity in organic farming is not elevated could force them
to pay more attention in input use, such as to over-make up them for the productivity deficit.
Furthermore, the higher specific efficiency seen in organic olive-growing could be a logical
consequence of the fact that farmers under consideration were producers who had knowingly and
actively chosen the organic method. They, therefore, have the right technical and professional skill
for using efficiently the technical inputs. On the other hand, although the organic farms observed
show more efficiency than the conventional ones, their overall efficiency is effectively not
completely satisfactory. This would suggest that there exist ample margin for the increasing of
managerial and technical skills as to improve performance in organic olive-growing in order to
compensate adequately the gap (with respect to conventional practice) in terms of productivity.
6. Conclusions
Recent developments in agriculture have stirred up interest in the concept of “sustainable” farming
systems. Still it is difficult to determine the extent to which certain agricultural practices can be
considered sustainable or not. Aiming at identifying the necessary attributes with respect to
sustainability, this paper focused on estimating “distance” between organic and conventional
farming in Italy. Firstly, through the analysis of some key economic variables, a sample of organic
and conventional farms, collected from the Italian FADN data base, have been analysed in order to
highlight some of the main structural and economic differences. Secondly, it has been applied an
efficiency analysis on a sample of olive-growing farms in order to estimate which technique reveals
greater efficiency and productivity levels. What emerges from this study is that organic farms are
������������������������������������������������
18 Other studies – e.g. the analyses of Tzouvelekas et al. 2001b on cotton farms and Madau (2006) on Italian cereal farms – found that organic farming does not reach to compensate the less productivity with a more efficiency in their inputs using.
17
mostly concentrated in the south of Italy and that they are wider than conventional ones in terms of
cultivated areas, on average, at national level (regional results may lead to different results because
of their peculiar characteristics). The economic variables analysed show that the average values on
Cultivated Areas, conventional farms’ Gross Production is significantly higher than the organic
ones, as the Net Margin, as the Net Product and Costs. The average values on Total Labour Force
instead, show that, even if conventional farms still have higher values than organic ones, the
“distance” become shorter. That means that the two groups are quite similar and that, even if
organic farms still produce a lower “economic value”, they better compensate productive factors,
especially in terms of Labour Force.
With regards to efficiency analysis on olive-growing farms, we found that: 1) organic farmers
reveal a specific a greater technical efficiency than conventional ones; 2) it is substantially
sufficient to compensate the less productivity of organic farms with respect to the conventional
farms; 3) the role of scale inefficiency is more relevant in organic olive-growing farms than in the
conventional ones.
This study represents only a partial contribution and that the results cannot lead to generalization.
More empirical research needs to be done to provide further information on the “distance” between
organic and conventional farming with respect the whole agricultural system. Prior research with
FADN Italian data have shown that an established group of organic farms can be as profitable as a
conventional farms under certain circumstances (Scardera, Trione, 2003). However, organic
farming systems require a transition period before they are fully established after a changeover from
conventional farming (conversion period). This aspect have not been yet analysed, but it is on our
purpose to develop further analysis in order to better understand some of the main mechanisms that
characterized organic farms acting in the global market.
18
REFERENCES
Atkinson, S.E., Cornwell, C. (1994). Estimation of Output and Input Technical Efficiency Using a Flexible Functional
Form and Panel Data, International Economic Review 35: 245-255.
Banker R.D., Charnes A., Cooper, W.W. (1984). Some Models for Estimating Technical and Scale Inefficiency in Data Envelopment Analysis, Management Science 30: 1078-1092.
Battese G. (1992). Frontier Production Functions and Technical Efficiency: A Survey of Empirical Applications, Agricultural Economics 7: 185-208
Bauer, P.W. (1990). Recent Developments in Econometric Estimation of Frontiers, Journal of Econometrics 46: 39-56.
Carillo F., Doria P., Marino D., Scardera A. (2005). Struttura e risultati economici delle aziende biologiche: un’analisi tipologica attraverso l’utilizzo della banca dati RICA, INEA, Roma.
Charnes A., Cooper W.W., Rhodes E. (1978). Measuring the Efficiency of Decision Making Units, European Journal of Operational Research, Vol. 2: 429-444
Charnes A., Cooper W.W., Seiford L.M. (1994), Data Envelopment Analysis: Theory, Methodology and Application, Dordrecht, Boston e Londra, Kluwer Academics.
Cichitelli G., Herzel A., Montanari G. E. (1992). Il campionamento statistico, Il Mulino, Bologna.
Cisilino F. (2003). L’analisi della rappresentatività del campione RICA nel periodo 1990-2000 in INEA. Analisi comparativa delle fonti statistiche e ricognizione delle procedure di rilevazione delle statistiche agricole, Rapporto RICA, INEA, Regione Veneto.
Cisilino F. (2005) La rappresentatività dei dati campionari: criteri e metodi di in INEA. La rete contabile agricola nazionale RICA: da rete di assistenza tecnica a fonte statistica, Quaderni “I metodi Rica” WP INEA, Roma.
Cisilino F. (2005). Il campione RICA probabilistico: che cosa è cambiato nel 2003 in INEA. La rete contabile agricola nazionale RICA: da rete di assistenza tecnica a fonte statistica, Quaderni “I metodi Rica” WP INEA, Roma.
Coelli T. (1996). A Guide to DEAP Version 2.1: A Data Envelopment Analysis (Computer) Program, CEPA Working Paper 96/8, Armidale, University of New England.
Doria P., Scardera A. (2005). The FADN and the Analysis of Organic Farming: the Italian Perspective, in Towards a European Framework for Organic Market Information. Proceedings of the Second EISfOM European Seminar, Brussels, November 10 & 11, 2005. Research Institute of Organic Agriculture FiBL, Frick, Switzerland. http://orgprints.org
Färe, R., Lovell, C.A.K. (1978). Measuring the Technical Efficiency of Production. Journal of Economic Theory 19: 150-162.
Farrell M.J. (1957). The Measurement of Productive Efficiency, Journal of the Royal Statistical Society, A 120 part 3: 253-290.
Førsund F.R., Lovell C.A.K., Schmidt P. (1980). A Survey of Frontier Production Functions and of their Relationship to Efficiency Measurement, Journal of Econometrics 13: 5-25.
Greene W.H. (1980). On the Estimation of a Flexible Frontier Production Model, Journal of Econometrics, 13: 101-115.
Hamm U., Zanoli R. (2006) The need for a long-term strategy for data collection on organic markets. Paper presented at Joint Organic Congress, Odense, Denmark, May 30-31, 2006.
Herrero I. (2000). DEA: A Review of Some of the Main Papers. In Pascoe S., Fousakis P., Herrero I., Juliussen V., Mardle S., Roland B.E., Vassdal T. (eds.). Technical Efficiency in EU Fisheries: Methodological Report. TEMEC Working Paper I, University of Portsmouth.
Idda L., Furesi R., Madau F.A., Rubino C. (2004). L’olivicoltura in Sardegna. Aspetti economici e prospettive alla luce di un’analisi aziendale. Quaderni di Economia e Politica Agraria n. 2 della Sezione di Economia e Politica Agraria (Università di Sassari), Sassari, Tipografia Editrice Giovanni Gallizzi.
Lampkin N. (2005). EISFOM recommendations concerning farm financial data in Towards a European Framework for Organic Market Information. Proceedings of the Second EISfOM European Seminar, Brussels, November 10 & 11, 2005. Research Institute of Organic Agriculture FiBL, Frick, Switzerland.
19
Lampkin N.H. (1994). Researching Organic Farming Systems., in Lampkin N.H., Padel S. (a cura di). The Economics of Organic Farming. An International Perspective. Wallingford: CAB International.
Lee H., Fowler S. (2002). A critique of methodologies for the comparison of organic and conventional farming systems in Powell et al. (eds), UK Organic Research 2002: Proceedings of the COR Conference, 26-28 March 2002, Aberystwyth, pp. 281-284.
Madau F.A. (2006). Technical Efficiency in Organic Farming: Evidence from Italian Cereal Farms, Agricultural Economics Review 7 (forthcoming)
Marino D., Scardera A. (1998). Struttura e risultati economici delle aziende biologiche della RICA, in Santucci F.M. (editor). L’agricoltura biologica tra PAC e mercato, Quaderni dell’Istituto di Economia Politica Agraria di Perugina, n. 25, Perugina.
Meier B. (2005). Organic Sampling and Weighting in Farm Accountancy Data Networks – a discussion note on Standard Gross Margins and calibration in Towards a European Framework for Organic Market Information. Proceedings of the Second EISfOM European Seminar, Brussels, November 10 & 11, 2005. Research Institute of Organic Agriculture FiBL, Frick, Switzerland.
Nelson R.R., Winter S.G. (1982). The Schumpterian Trade-off Revisited. American Economic Review 72: 114-132.
Nieberg H., Offermann F. (2003) Economic aspects of Organic Farming – The Profitability of Organic Farming in Europe in OECD (eds.) Organic Agrculture: Sustainability, Markets and Policies: 141-151,
Offermann F. (2004). Comparing organic and conventional farm incomes in FADN – Issues in international harmonisation and quality assurance, Proceedings 1st EISFOM Seminar 26-27 April 2004, Berlin.
Offermann F., Lampkin N. (2005) Organic Farming in FADNs – Comparison Issues and Analysis, in Towards a European Framework for Organic Market Information. Proceedings of the Second EISfOM European Seminar, Brussels, November 10 & 11, 2005. Research Institute of Organic Agriculture FiBL, Frick, Switzerland.
Offermann F., Nieberg H. (a cura di) (2000). Economic Performance of Organic Farms in Europe. Organic Farming in Europe. Economics and Policy, Volume 5. Hohenheim, Universität Hohenheim.
Oude Lansink A., Pietola K., Backman S. (2002). Efficiency and Productivity of Conventional and Organic Farms in Finland 1994-1997, European Review of Agricultural Economics 29: 51-65.
Pascoe, S., Fousakis, P., Herrero, I., Juliussen, V., Mardle, S., Roland, B.E., Vassdal, T. (eds.). Technical Efficiency in EU Fisheries: Methodological Report, TEMEC Working Paper I, University of Portsmouth.
Pietola K.S., Oude Lansink A. (2001). Farmer Response to Policies Promoting Organic Farming Technologies in Finland. European Review of Agricultural Economics 28: 1-15.
Recke G.; Willer H.; Lampkin N., Vaughan A. (2004). Development of a European Information System for Organic Markets - Improving the Scope and Quality of Statistical Data. Proceedings of the 1st EISfOM European Seminar, held in Berlin, Germany, 26-27 April, 2004. FiBL-Report. Research Institute of Organic Agriculture (FiBL), CH-Frick. http://orgprints.org
Richter T. (2006). The need for a European harmonised data collection on private organic consumption – methodological and economic issues. Paper presented at Joint Organic Congress, Odense, Denmark, May 30-31, 2006. http://orgprints.org
Rippin M.; Vitulano S., Zanoli R., Lampkin N. (2006). Synthesis and final recommendations on the development of a European Information System for Organic Markets, Deliverable D6 of the European Project EISfOM QLK5-2002-02400. Report, Institute of Rural Sciences, University of Wales. http://orgprints.org
Rippin M.; Willer H.; Lampkin N., Vaughan A. (2006). Towards a European Framework for Organic Market Information. Proceedings of the Second EISfOM European Seminar, Brussels, November 10 & 11, 2005. Research Institute of Organic Agriculture FiBL, Frick, Switzerland Eds. http://orgprints.org
Roland B.E., Vassdal T. (2000): Estimation of Technical Efficiency using DEA, in Pascoe S., Fousakis P., Herrero I., Juliussen V., Mardle S., Roland B.E., Vassdal T. (a cura di): Technical Efficiency in EU Fisheries: Methodological Report, TEMEC Working Paper I, University of Portsmouth.
Scardera A., Trione S. (2003). Struttura e risultati economici delle aziende biologiche con allevamento – analisi della banca dati 2000, WP n.1, Research Project La zootecnia biologica in Italia: situazioni attuali e prospettive. Tipologie d’imprese, trasformaizioni necessarie e possibili, incentivi pubblici e di mercato, domanda di ricerca, Ministero delle Politiche Agricole e Forestali, Roma.
20
Scardera A., Zanoli R. (eds.) (2002). L’agricoltura biologica in Italia, Metodologie di analisi e risultati dell’utilizzo dei dati RICA”, INEA, Quaderni “I metodi RICA”, Roma.
Seiford L.M (1996). Data Envelopment Analysis: The Evolution of the State of the Art (1978-1995). Journal of Productivity Analysis 7: 99-138.
Seiford L.M., Thrall R.M. (1990). Recent Developments in DEA. Journal of Econometrics 46: 7-38.
Sharma K.R. - Leung P. - Zaleski H. (1999). Technical, Allocative and Economic Efficiency in Swine Production in Hawaii: a Comparison of Parametric and Non Parametric Approaches. Agricultural Economics, 20: 23-35.
Tzouvelekas V., Pantzios C.J., Fotopoulos C. (2001a). Technical Efficiency of Alternative Farming Systems: the Case of Greek Organic and Conventional Olive-growing Farms, Food Policy 26: 549-569.
Tzouvelekas V., Pantzios C.J., Fotopoulos C. (2001b). Economic Efficiency in Organic Farming: Evidence From Cotton Farms in Viotia, Greece, Journal of Agricultural & Applied Economics 33: 35-48.
Tzouvelekas V., Pantzios C.J., Fotopoulos C. (2002a). Measuring Multiple and Single Factor Technical Efficiency in Organic Farming, British Food Journal 104: 591-609.
Tzouvelekas V., Pantzios C.J., Fotopoulos C. (2002b). Empirical Evidence of Technical Efficiency Levels in Greek Organic and Conventional Farms, Agricultural Economics Review 3: 49-60.
Vrolijk H. C. J. (2005). Sampling of organic farms in the Dutch FADN: Lessons learned in Towards a European Framework for Organic Market Information. Proceedings of the Second EISfOM European Seminar, Brussels, November 10 & 11, 2005. Research Institute of Organic Agriculture FiBL, Frick, Switzerland.