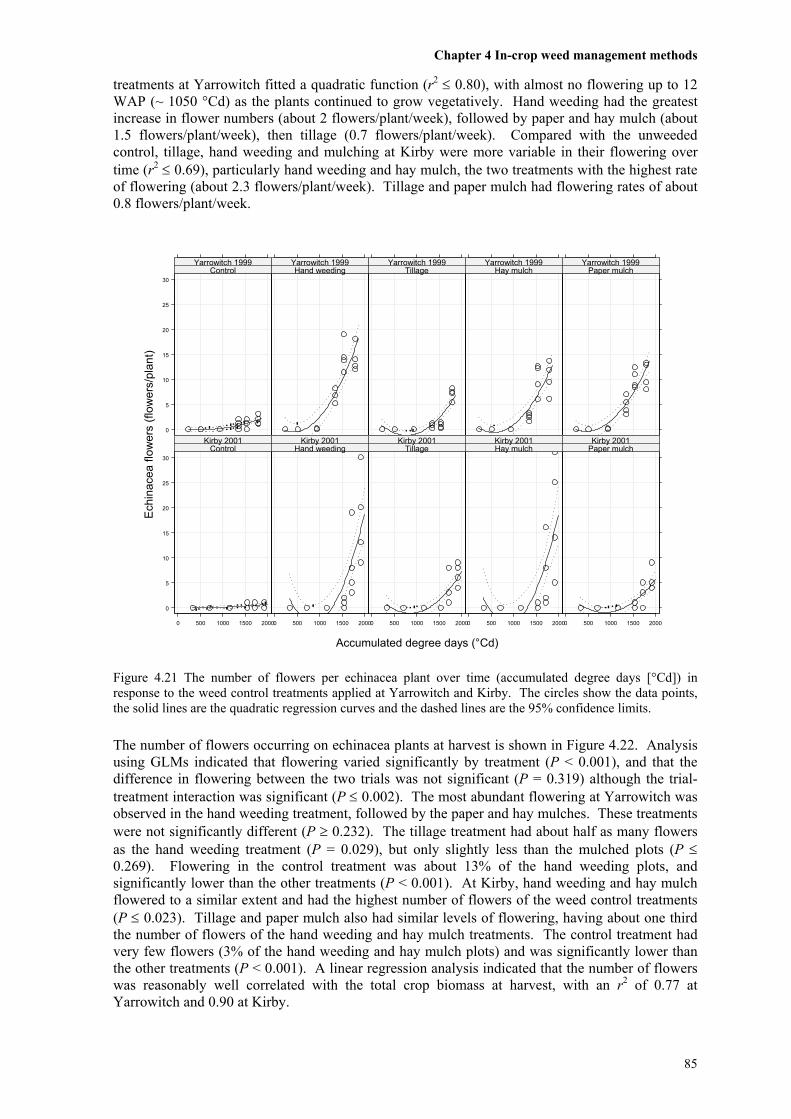
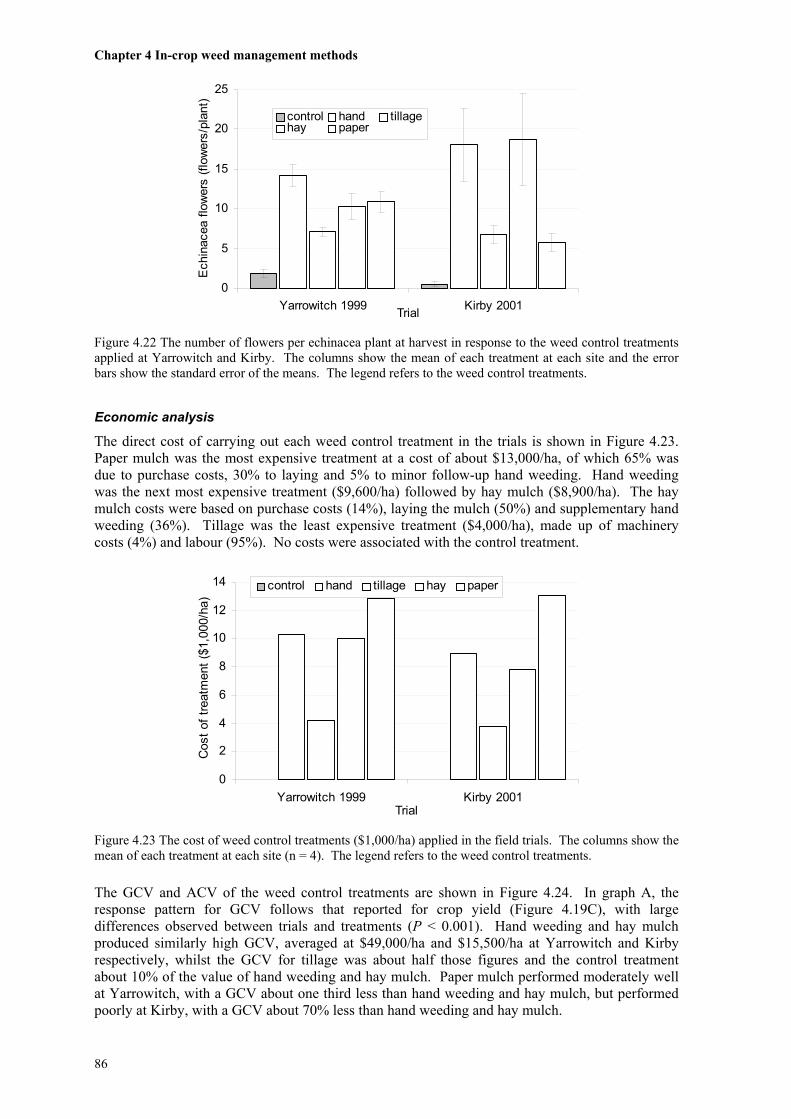
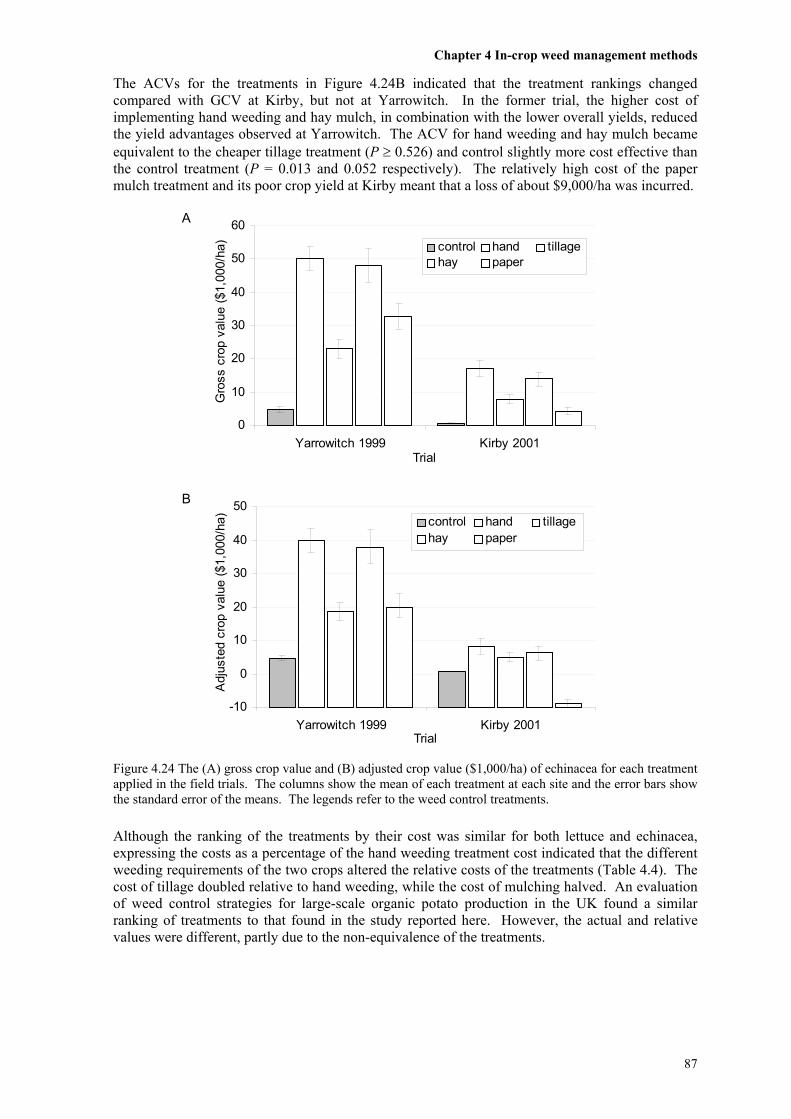
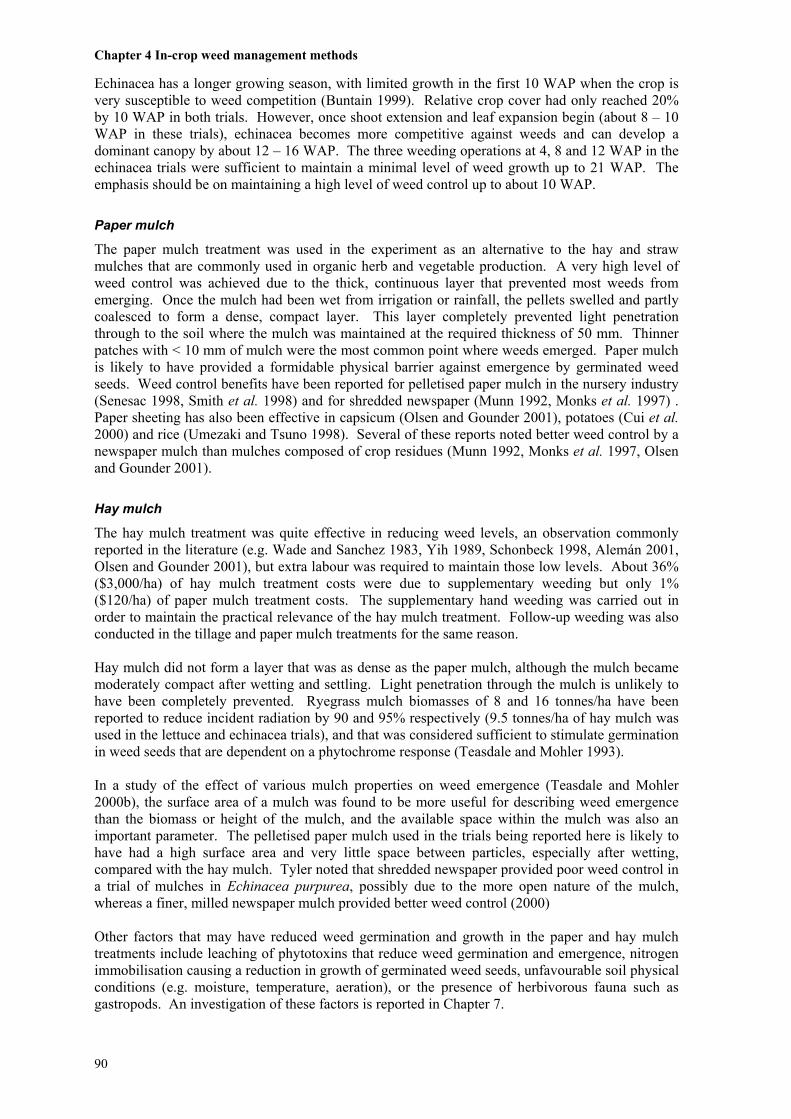
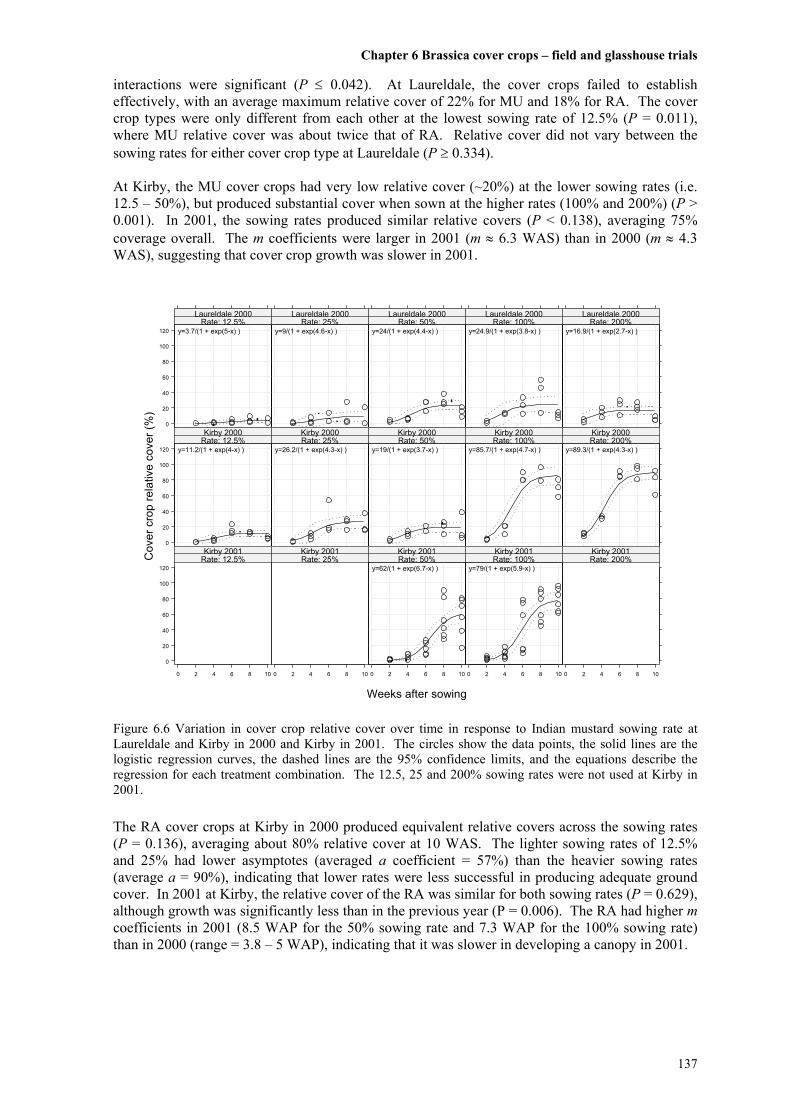
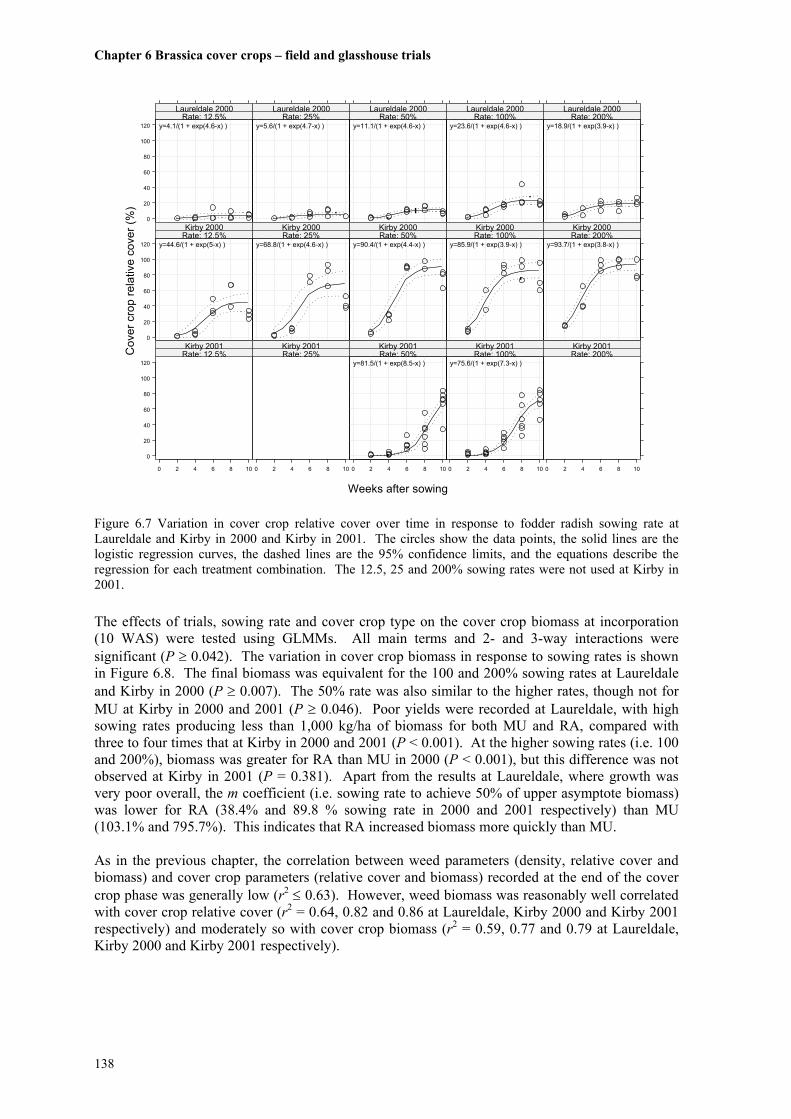
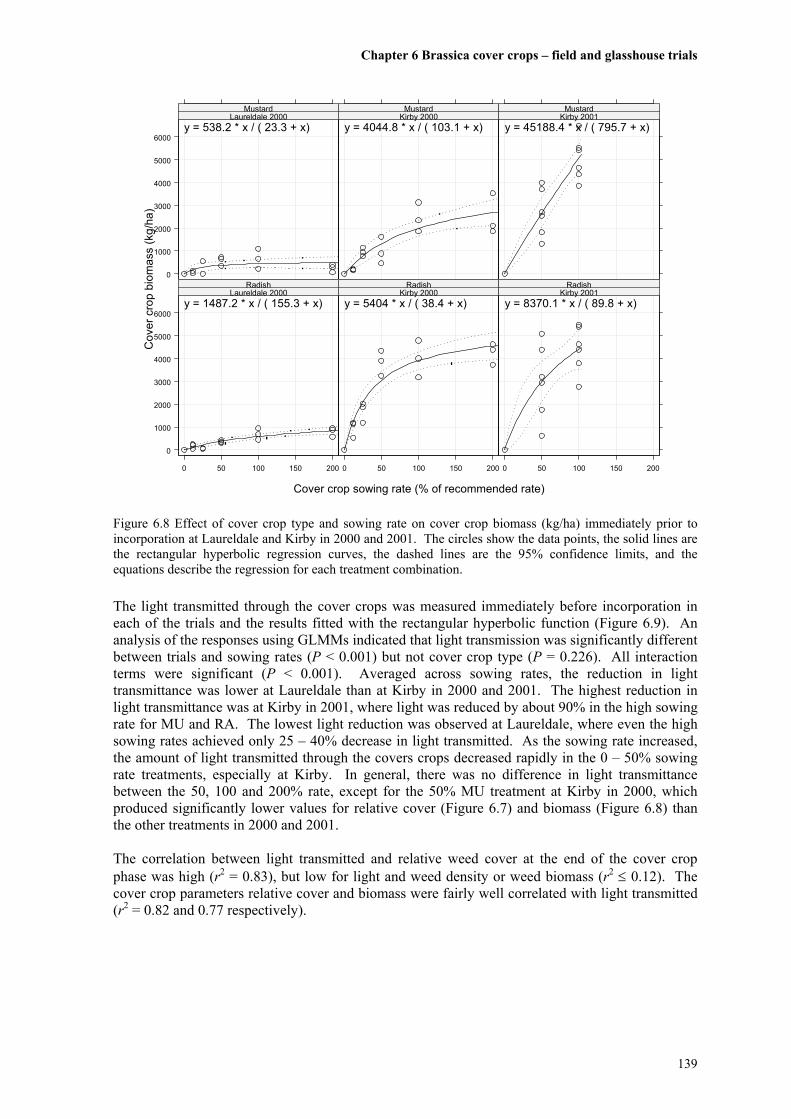
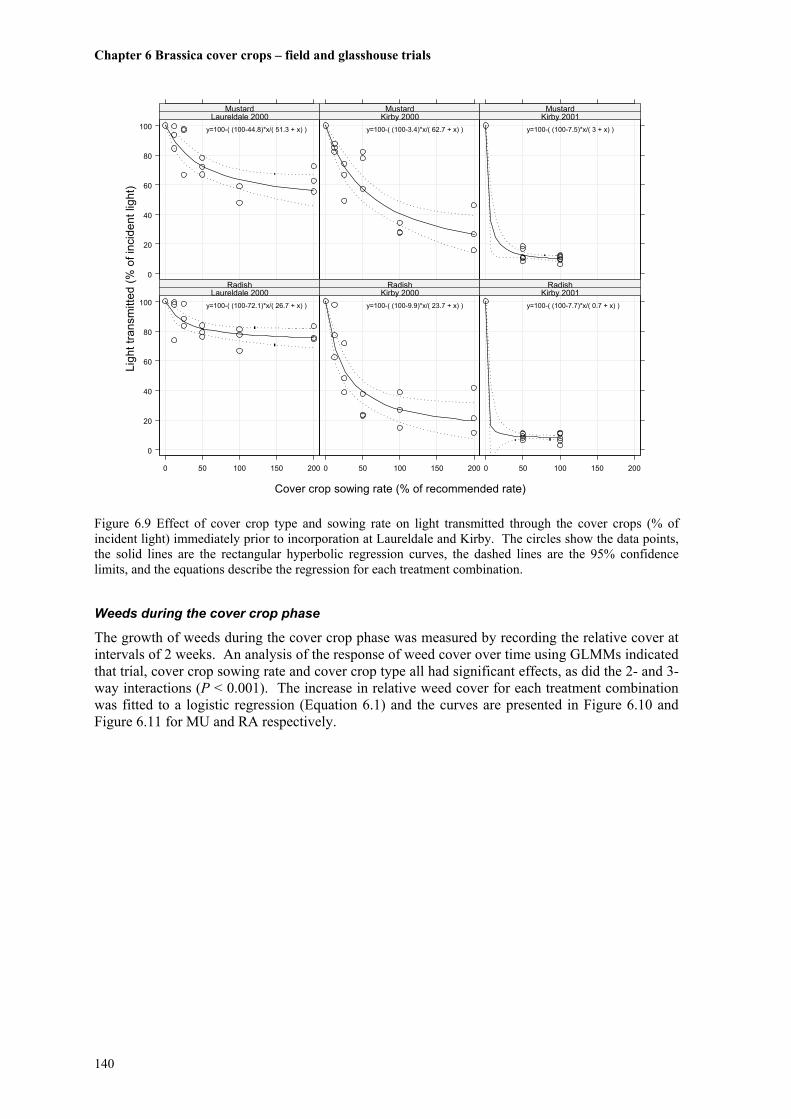
Title page Sustainable Weed Management in Organic Herb and Vegetable Production Paul Erik Kristiansen BSc (Monash), GradDipHortSc (New England), GradCertGIS (Qld) A thesis submitted for the degree of Doctor of Philosophy of the University of New England June 2003
Transcript
Title page
Sustainable Weed Management in
Organic Herb and Vegetable Production
Paul Erik Kristiansen BSc (Monash), GradDipHortSc (New England), GradCertGIS (Qld)
A thesis submitted for the degree of Doctor of Philosophy
of the University of New England
June 2003
ii
Declaration I certify that the substance of this thesis has not already been submitted for any degree and is not currently being submitted for any other degrees or qualifications. I certify that any help received in preparing this thesis, and all sources used, have been acknowledged in this thesis. Paul Erik Kristiansen
iii
Dedication
This thesis is dedicated to my parents, Laurel and Olaf Kristiansen, who have always provided enormous friendship, love and support, and have encouraged me to strive for my goals, whatever those goals may be. The example they have set for how to live a caring and enjoyable life has been their greatest gift.
iv
Acknowledgements My principal supervisor, Associate Professor Brian Sindel, provided friendly support and guidance throughout my studies, encouraged me to follow my interests and pushed my thinking further. My co-supervisor, Associate Professor Robin Jessop, gave me many useful insights into the research process and provided a solid base for developing ideas. Their continual support and patience during the project has been greatly appreciated. Numerous current and previous staff and students in Agronomy and Soil Science (AgSS) have assisted me with administrative, technical and academic support during my studies, including Dan Alter, Graeme Blair, Nelly Blair, Greg Chamberlain, Jim Cook, Gary Cluley, Majid Danesh, Heiko Daniel, Michael Fittler, Blair Grace, Chris Guppy, Ildi Hall, Carolyn Harper, Anne Hoult, Keith Hutchinson, Stephen Johnson, Liz Jones, Nicole Jones, Masayo Kawaguchi, Harry Kibbler, Kathy King, Kaara Klepper, Leanne Lisle, Peter Lockwood, Allan Mitchell, Jim Scott, Jen Smith, John Stanley, Acram Taji, Ursula Taylor, Gerd Thiessen, Jeremy Whish and Zulkarnain. Each person has made a valuable contribution to the research project, making the task easier and more enjoyable. A special thanks to Dave Edmonds, Mick Faint and George Henderson for their help. I would like to thank the following for assistance with the national survey: * the (anonymous) organic growers who responded to the survey, * organic industry organisations BFA, NASAA, OHGA and ORGAA, * participants in the pilot study, * Ian Reeve (Institute for Rural Futures, UNE), Stephen Johnson (AgSS, UNE), Geoff Kaine
(Marketing and Management, UNE) and Roy Rickson (Griffith University) for providing helpful guidance and suggestions on a number of methodological issues,
* Ian Davies (School of Mathematics, Statistics and Computer Science, UNE) and Ian Reeve for statistical assistance, and
* Lisa Curley (AgSS, UNE) and Julie Nicholson for data entry. Assistance with field trials at Yarrowitch was provided by Peter Green, Marlay Brown, Phillip Brown and Katie Brown prior to Subiaco Herbs going into liquidation. Peter Green continued to provide considerable technical advice in subsequent years and I am extremely grateful for his enthusiastic and skilled contribution. Later field trials were conducted with the reliable and thorough assistance of Kevin Saunders, Faye Miller and Olaf Kristiansen. The university's Rural Properties staff, Chris Brodbeck and Norm Thomas, provided access to the field site and crucial assistance from time to time. Wal Whalley (Botany, UNE) is thanked for his excellent grass identification skills. Seed for the brassica cover crops was gratefully received from AgSeed Research and AusWest Seeds. Agronomic advice relating to these cover crops was enthusiastically provided by Kate Light (AgSeed Research) and Col Lamrock (AusWest Seeds). Meteorological data was kindly provided by Peter Burr (Curriculum Centre, UNE), Helen Mason (Upper Yarrowitch Pastoral Company) and Wendy Warner (NSW State Forests). Their generosity is appreciated. Invaluable statistical and programming support was provided Ian Davies and Duncan Mackay (AgSS, UNE). Their keen interest and high level of integrity motivated me to develop new skills. Ian Davies is especially thanked for his patience and on-going support during the life of the project. Thanks also to Meridy Kadel and Bruce Tier in the Animal Genetics and Breeding Unit, UNE for assistance with ASREML. Chris Alenson (Organic Retailers & Growers Association, Melbourne), Paolo Bárberi (Scuola Superiore di Studi Universitari e Perfezionamento Santa Anna, Pisa, Italy), Andrew Bishop (DPIWE Tasmania), Viv Burnett (DNRE Victoria), Craig Henderson (DPI Queensland), Latarnie McDonald (NSW Agriculture), Robyn Neeson (NSW Agriculture), Karen O'Malley (NSW Agriculture) and Els Wynen (Eco Landuse Systems, Canberra) provided useful advice and/or specific information during my studies. Thanks also to Rob Fletcher and Brett Reisenleiter
v
(University of Queensland) and Chris Penfold (University of Adelaide) for very generous help in obtaining relevant literature. Financial assistance was provided by the Rural Industries Research and Development Corporation and the University of New England and is very gratefully acknowledged. My parents, Laurel and Olaf Kristiansen, also provided financial support to fill the gaps. All other support is minor compared to the hours, days, weeks, months and years endured by my great family, Julie, Alex, Finn and Ned, as I pursued my studies. In particular, my debt to Julie (my wonderful wife, soul mate and best buddy) is enormous. I am very thankful that she postponed her career for so long and provided unstinting love and support while I ‘played on the tractor’. Thank you for everything, you are truly magnificent.
vi
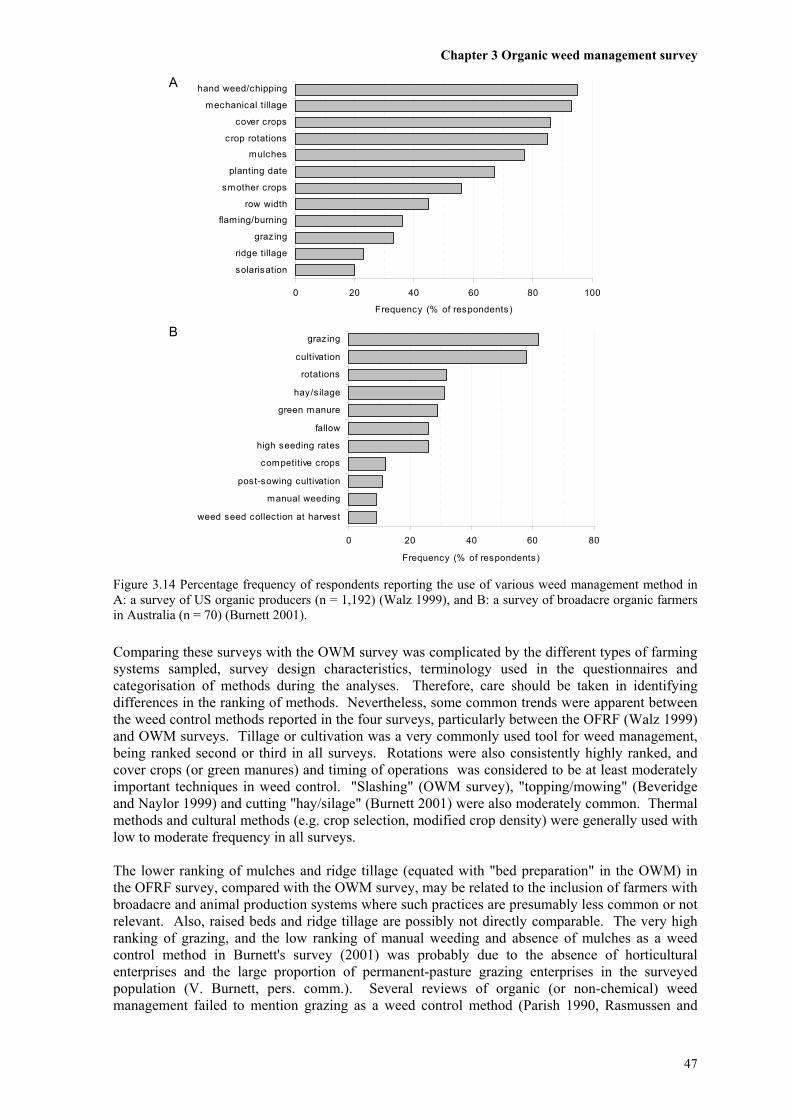
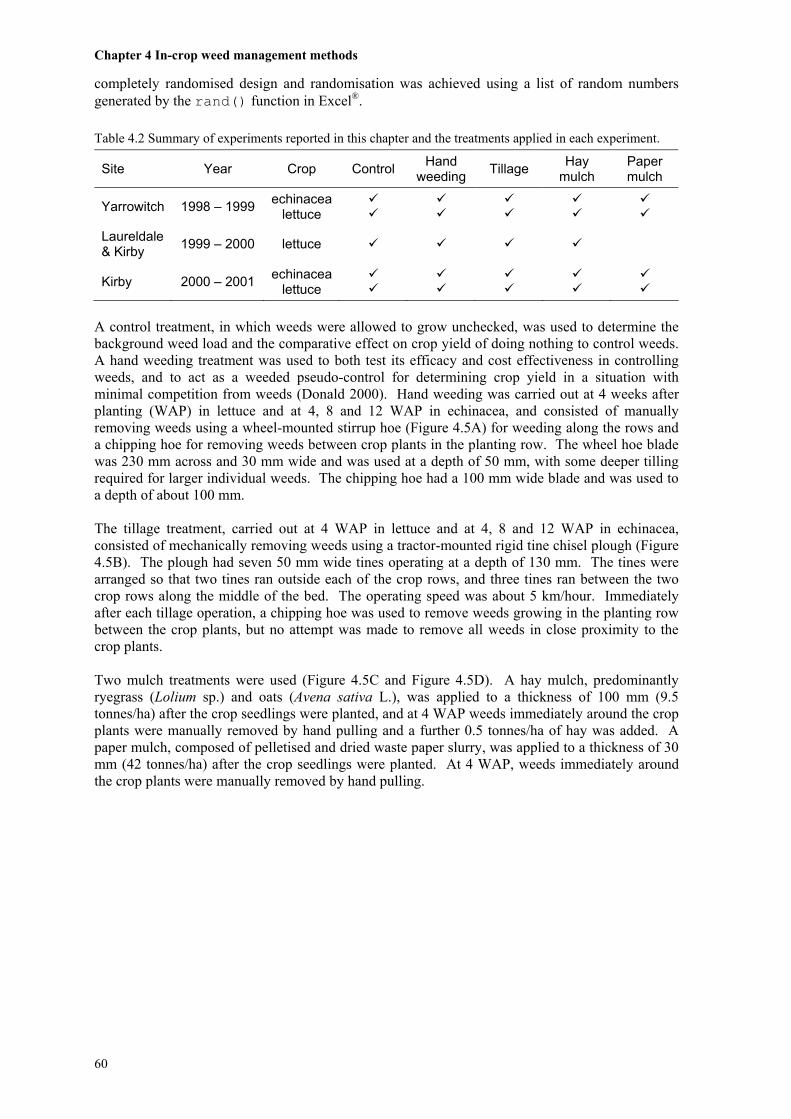
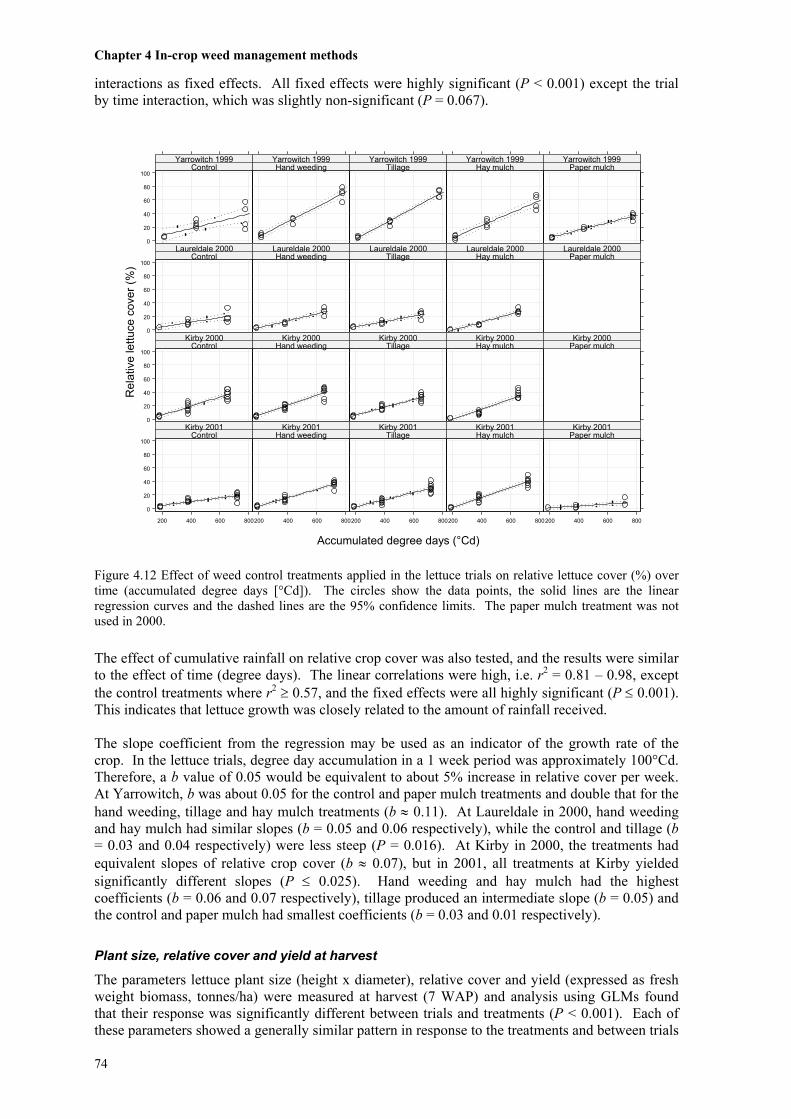
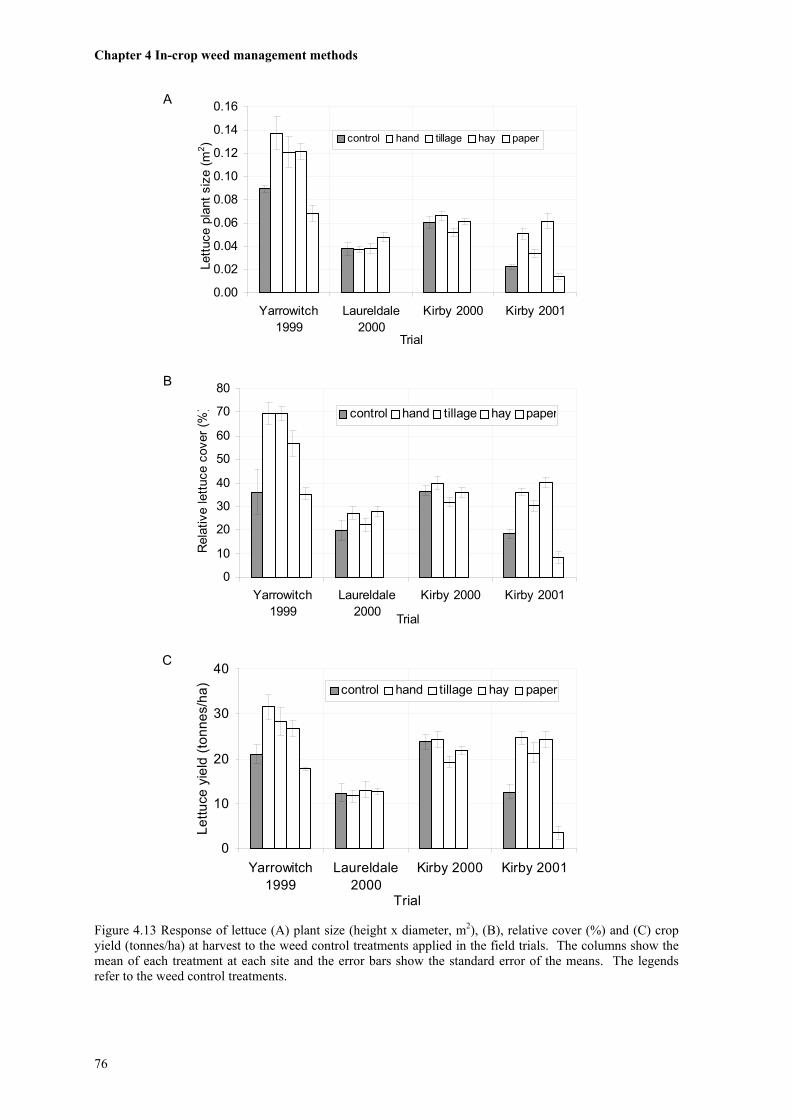
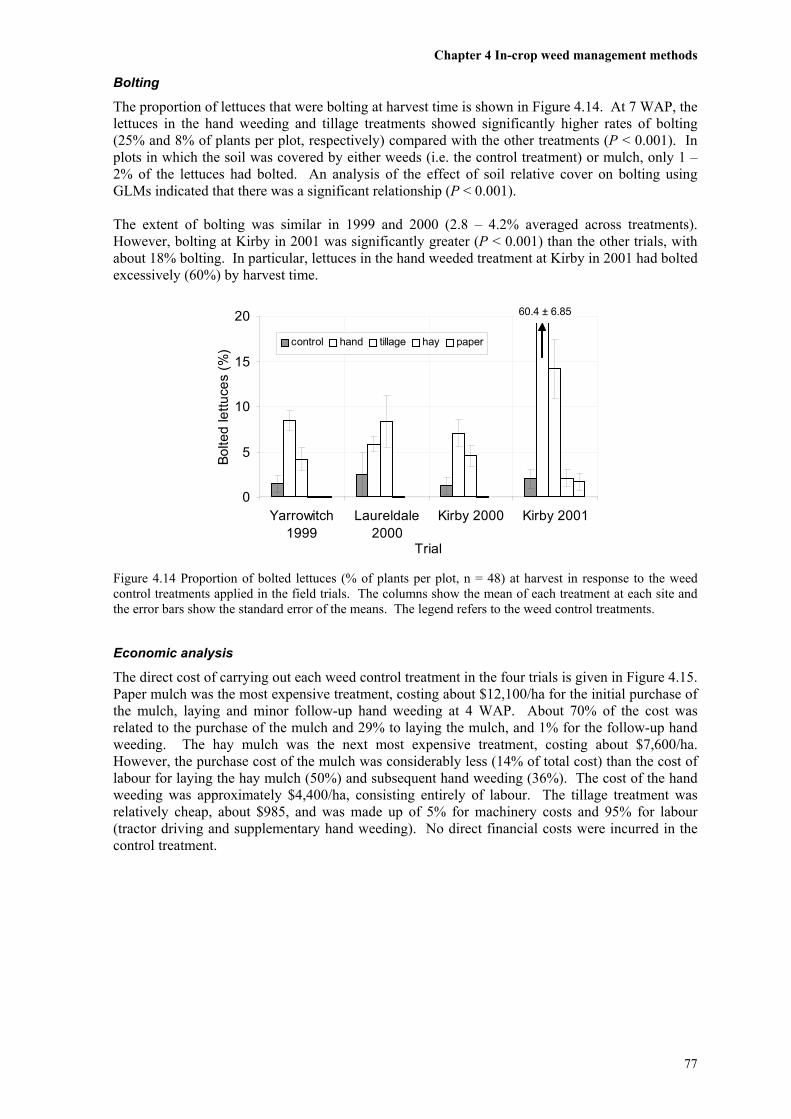
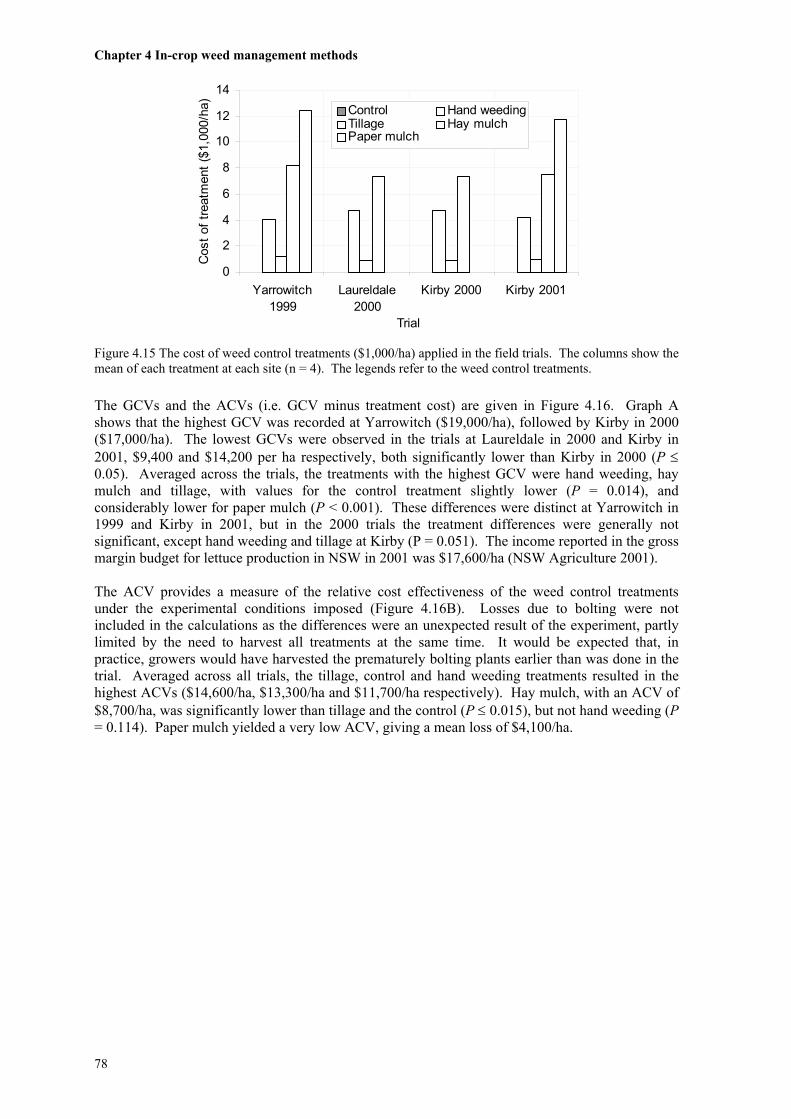
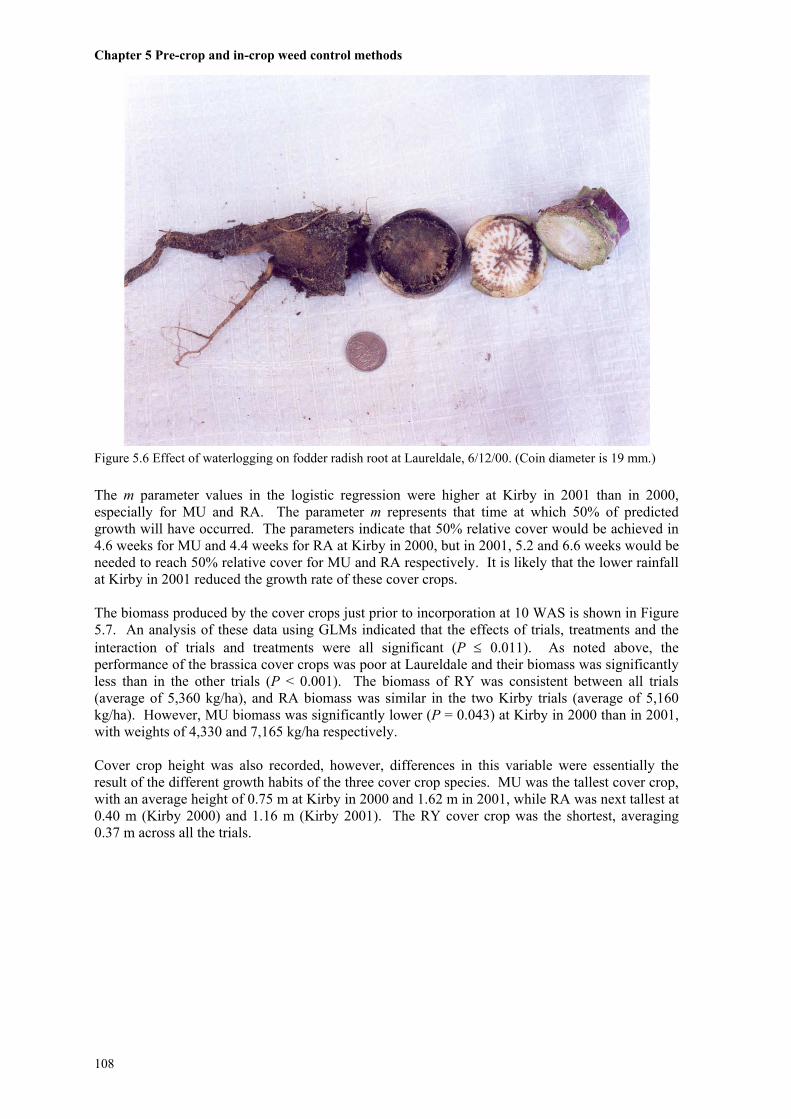
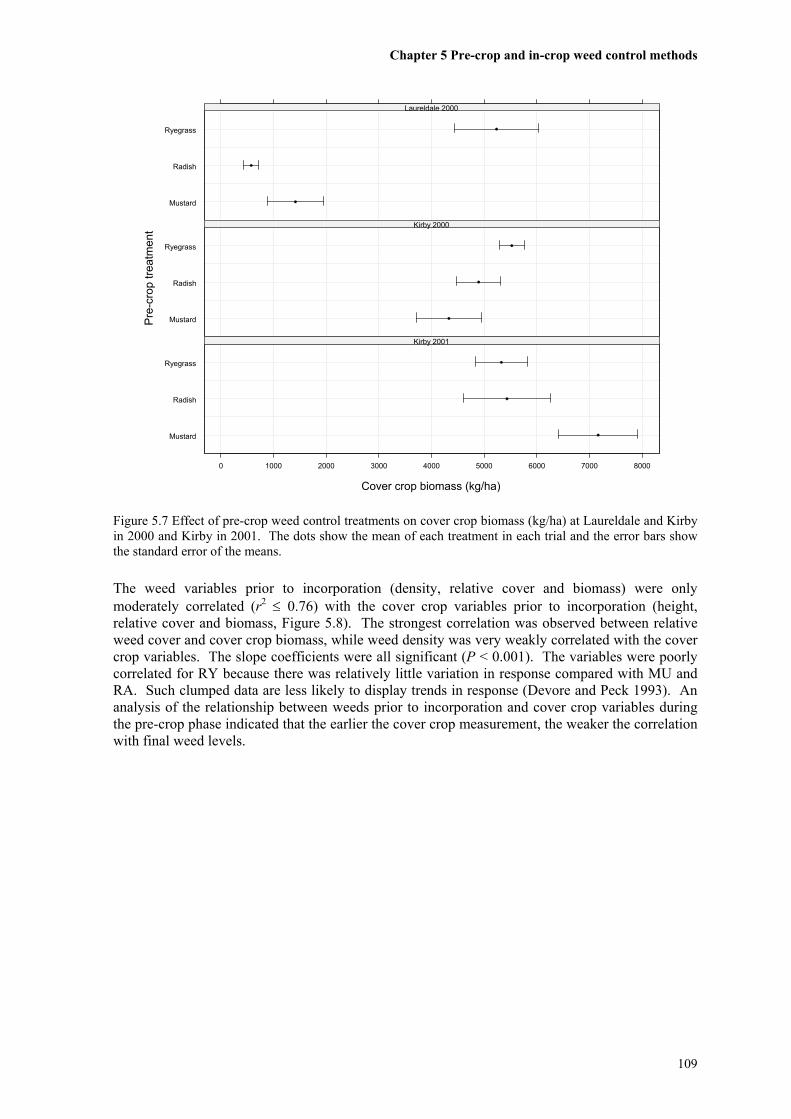
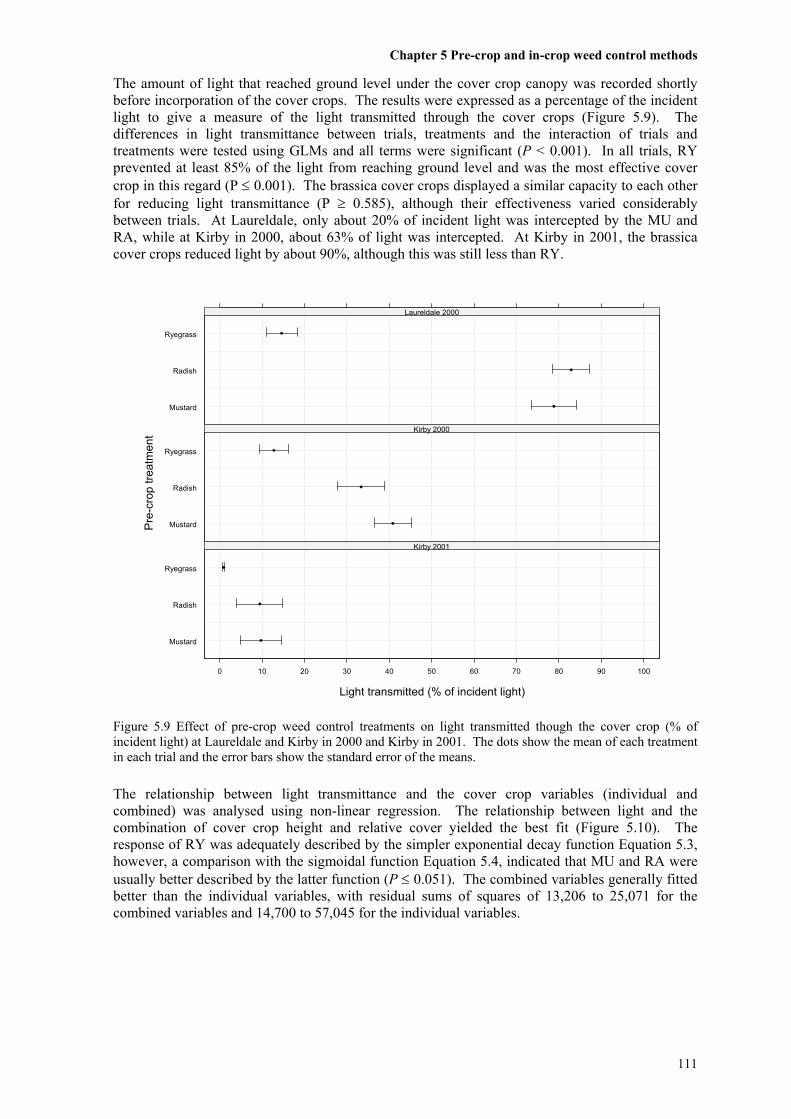
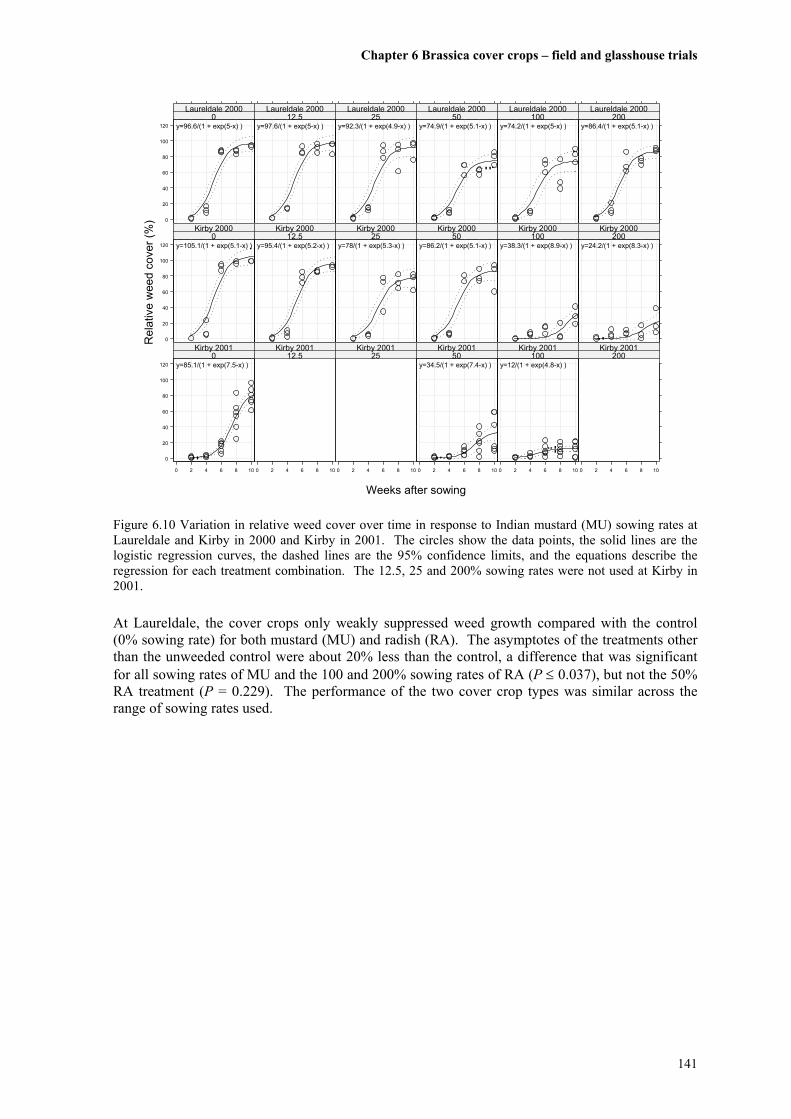
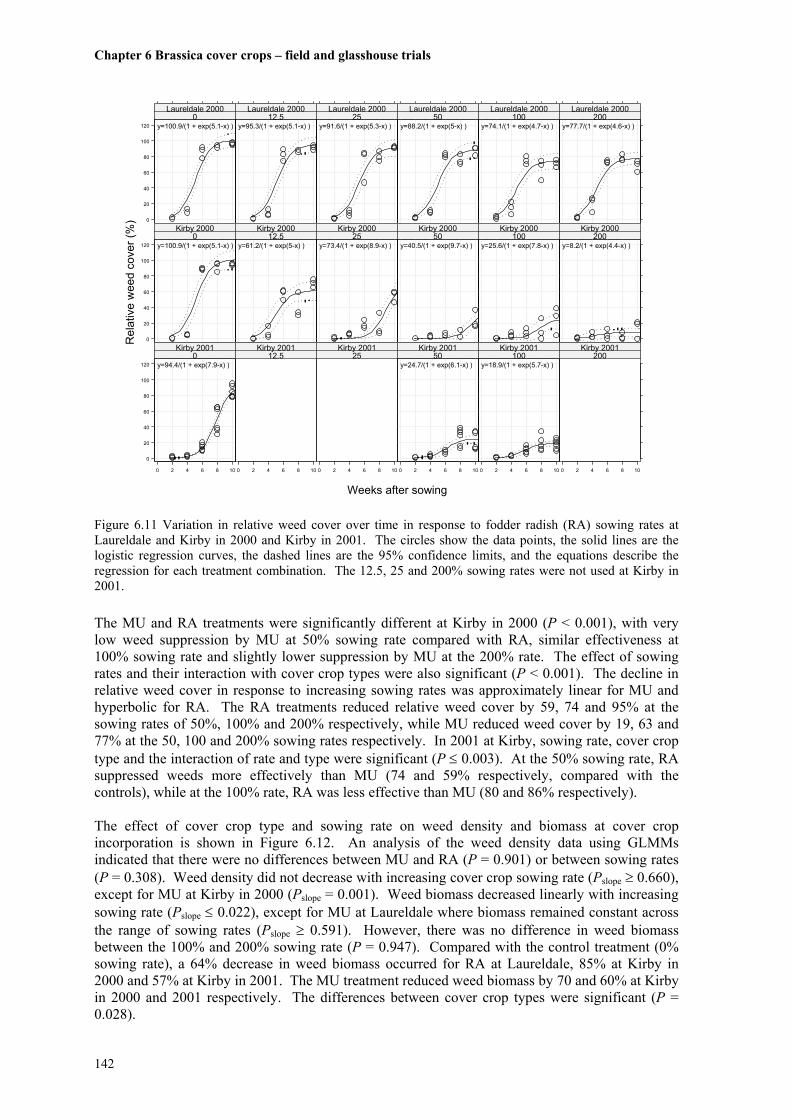
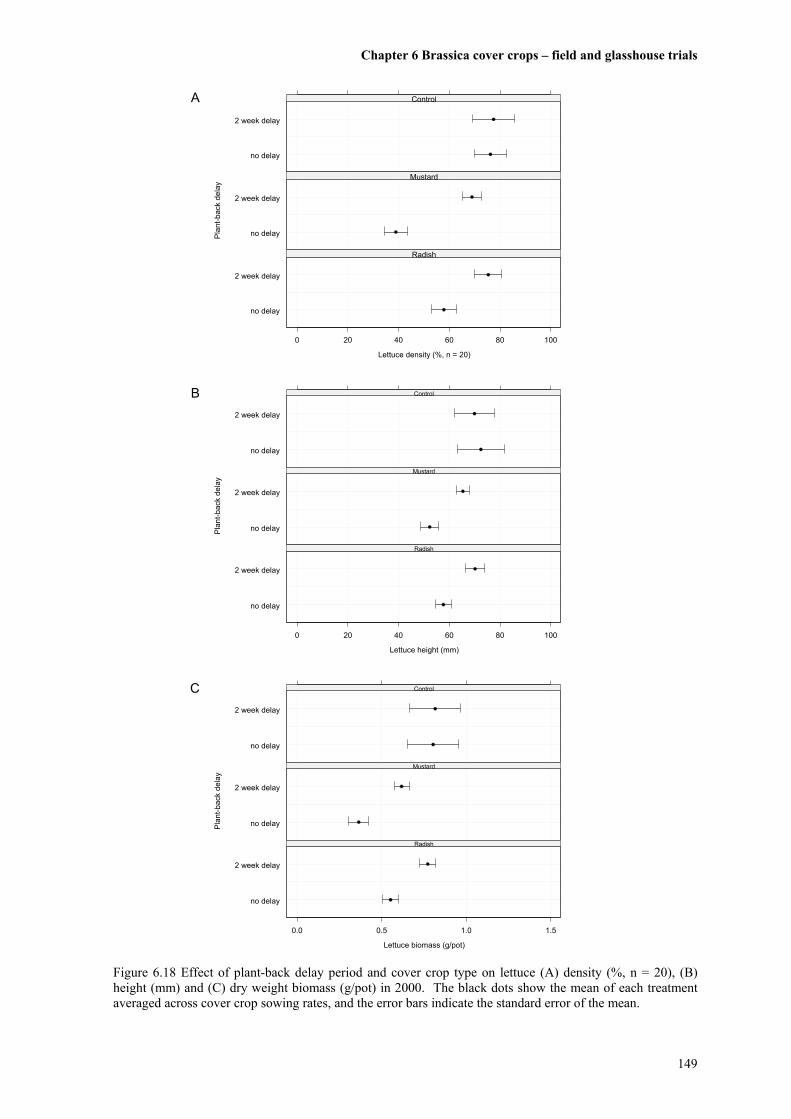
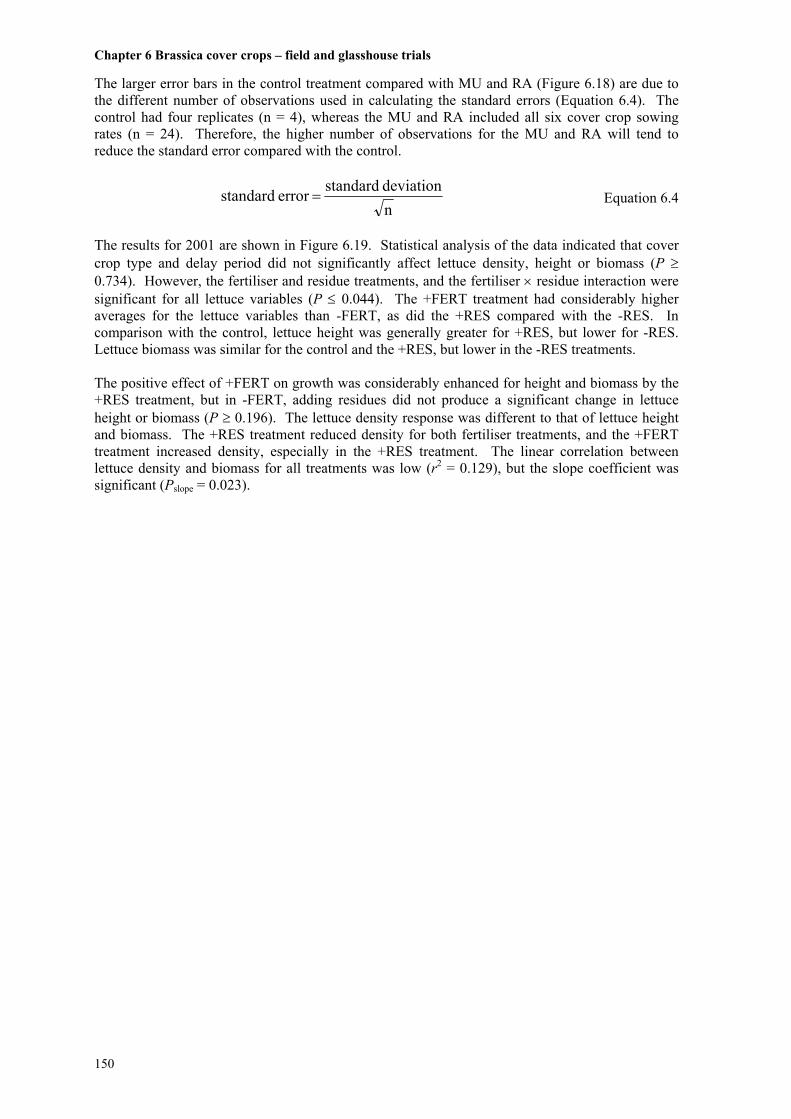
Abstract Weed management is a major constraint in organic production. It can be expensive and time-consuming and severe crop yield losses may be incurred when weeds are not adequately controlled. Research on organic weed management (OWM) in herb and vegetable production is increasing internationally, although very little work has been done in Australia to assess current OWM knowledge among growers, and to test the efficacy and cost effectiveness of the weed management practices used by organic growers. The project described here sought to fill these knowledge gaps by reviewing the existing industry and scientific literature, conducting a national mail survey of organic growers regarding OWM attitudes and practices, and by carrying out field and glasshouse experiments investigating a range of pre- and in-crop weed control methods. A mail survey of 219 organic herb and vegetable producers in Australia (43% return rate) indicated that respondents were very concerned about weed control, had smaller farms and less experience than other organic growers, and were mostly troubled by perennial weeds with persistent underground parts and some heavy seeding annuals. Growers used hand weeding mostly, and mulches, tillage, rotations, cover crops and slashing were also common. With more experience, growers were less concerned about weeds and there was a shift from physical to cultural weed control methods. Respondents were not primarily motivated by the cost of a weed control method, but were more concerned with effectiveness. The survey produced new data that will be useful for planning research in Australian organic agriculture. The field and glasshouse trials evaluated the effect of various weed control techniques on weed growth (density, relative ground cover and biomass), crop growth (size, relative cover, biomass and flowering) and cost effectiveness of the treatments. The pre-crop treatments were a bare fallow (rotary hoed), a green fallow (unweeded) and three different cover crops; Indian mustard (Brassica juncea [L.] Czern. cv. Fumus F-L71), fodder radish (Raphanus sativus L. cv. Weedcheck) and Italian ryegrass (Lolium multiflorum Lam. cv. Conquest). Hand weeding, tillage, hay mulch, pelletised paper mulch and an unweeded control treatment were used for the in-crop treatments and the test crops were lettuce (Lactuca sativa L.) and echinacea (Echinacea purpurea Moench. [L.]), selected for their contrasting growth habit, growing season length and wholesale value. In the field, the cover crops and bare fallow controlled weeds effectively during the pre-crop phase compared with the unweeded green fallow, but did not affect weed and lettuce growth in the following in-crop phase and there was no interaction between pre- and in-crop treatments. Reducing the delay between the pre- and in-crop phases from four weeks to one day did not affect weed and lettuce growth. The brassica cover crops performed poorly when they failed to establish adequately or when sowing rates were too low. Cover crops reduced pre-crop weed levels by suppressing weed growth rather than weed emergence, while the bare fallow also lowered weed emergence. Weed control was positively correlated with reduced light transmission by the cover crops, but competition for nutrients and water was not correlated with weed suppression. In glasshouse trials, brassica cover crops grown and incorporated in pots had a positive effect on subsequent lettuce seedling growth when extra fertiliser was added during the cover crop phase, but not when no fertiliser was added. These results indicate that nutrients, rather than inhibitory phytotoxins, were determining plant growth in the species tested. In-crop weed management in lettuce (smaller plant size, shorter season, lower value than echinacea) was cost effectively achieved using cheaper weeding methods such as tillage. The unweeded control was also cost effective, indicating that good weed control prior to planting could be sufficient to achieve reasonable yields in lettuce. More expensive methods such as hand weeding and hay mulching produced low weed levels and good yields, but were less cost effective. Paper mulch provided excellent weed control, but was very expensive and severely reduced crop yields. More bolting occurred in bare, tilled plots (hand weeding and tillage) than covered, undisturbed plots (mulches and weedy control). The increased bolting was related to higher soil temperature maxima and diurnal fluctuations in the disturbed plots.
vii
For echinacea (larger plant size, longer season, higher value), cheaper in-crop weeding methods (e.g. tillage, unweeded control) had poor weed suppression and low crop yields, while the more expensive weeding methods, hand weeding and hay mulch, controlled weeds well and were cost effective. Paper mulch controlled weeds very well but, again, had lower yields and was therefore not cost effective. The poor crop yields under paper mulch were investigated further and found to be caused by nutrient immobilisation, particularly nitrogen. Leaf nutrient analyses indicated that nitrogen was limiting in lettuce (though not echinacea) in the field, and mulch nutrient analyses showed that the carbon:nitrogen ratios were 39:1 and 171:1 for hay and paper mulch respectively. A pot trial showed that lettuce growth was inhibited by paper mulch but not unmulched (bare soil) or hay mulch treatments, i.e. similar results to the field trials. In the pots, the inhibition by the paper mulch was not overcome by additional nitrogen fertiliser, indicating that the extra nitrogen was also immobilised, whereas the unmulched and hay mulch treatments had positive lettuce growth responses to additional nitrogen fertiliser. Bioassays using aqueous mulch extracts showed that paper mulch extract was only weakly inhibitory to lettuce and echinacea seedlings, while hay mulch extract was extremely inhibitory, the reverse of what would have been expected had allelopathy been responsible for the results in the field. This result suggests then that paper mulch phytotoxins were not responsible for lower crop yields. More generally, these findings highlight the limits to extrapolating bioassays results to the field. This research has provided a glimpse of the attitudes of organic herb and vegetable growers to weeds and the practices and principles used in managing weeds in Australia, and has highlighted several important advantages and disadvantages of currently used OWM methods in the field.
viii
Contents
Title page.............................................................................................................................................................i Declaration .........................................................................................................................................................ii Dedication ........................................................................................................................................................ iii Acknowledgements ...........................................................................................................................................iv Abstract .............................................................................................................................................................vi Contents.......................................................................................................................................................... viii Chapter 1 Introduction........................................................................................................................................1
1.1 Project overview ......................................................................................................................................1 1.2 Thesis format ...........................................................................................................................................2
Chapter 2 Literature review................................................................................................................................3 2.1 Overview of organic agriculture ..............................................................................................................3 2.2 Weeds in organic production ...................................................................................................................5 2.3 Organic weed management ......................................................................................................................7 2.4 Organic herb and vegetable production .................................................................................................12 2.5 Summary ................................................................................................................................................15
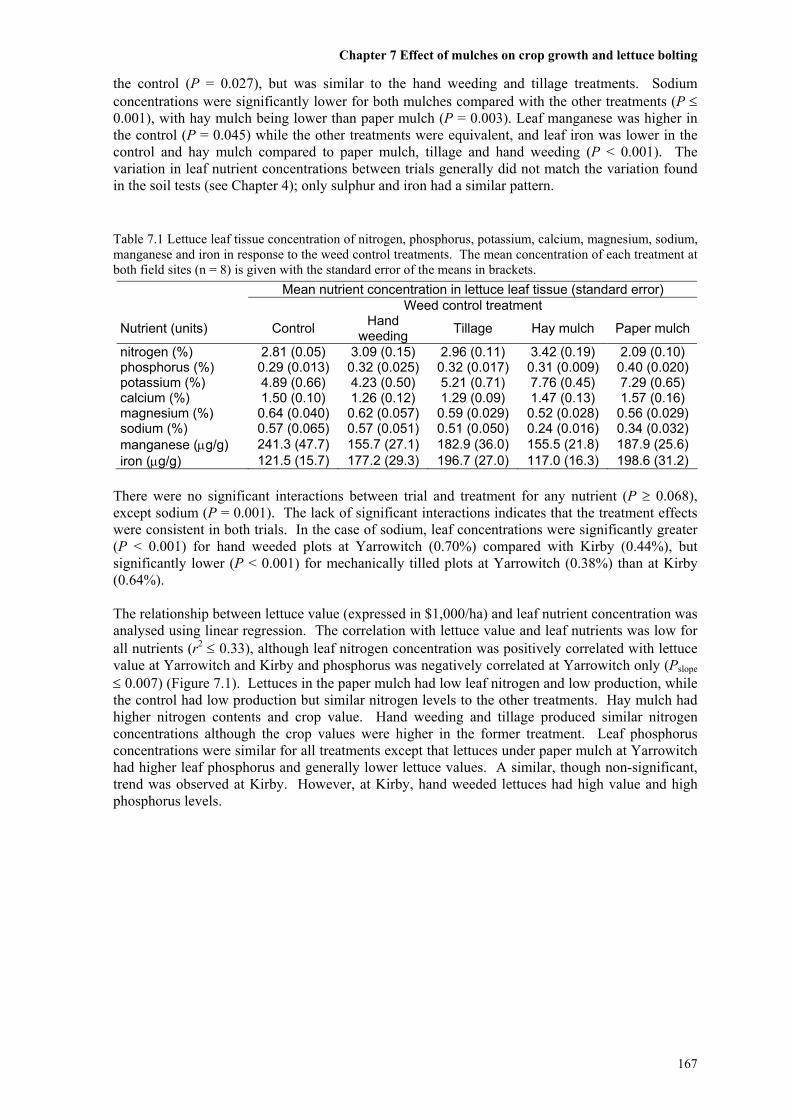
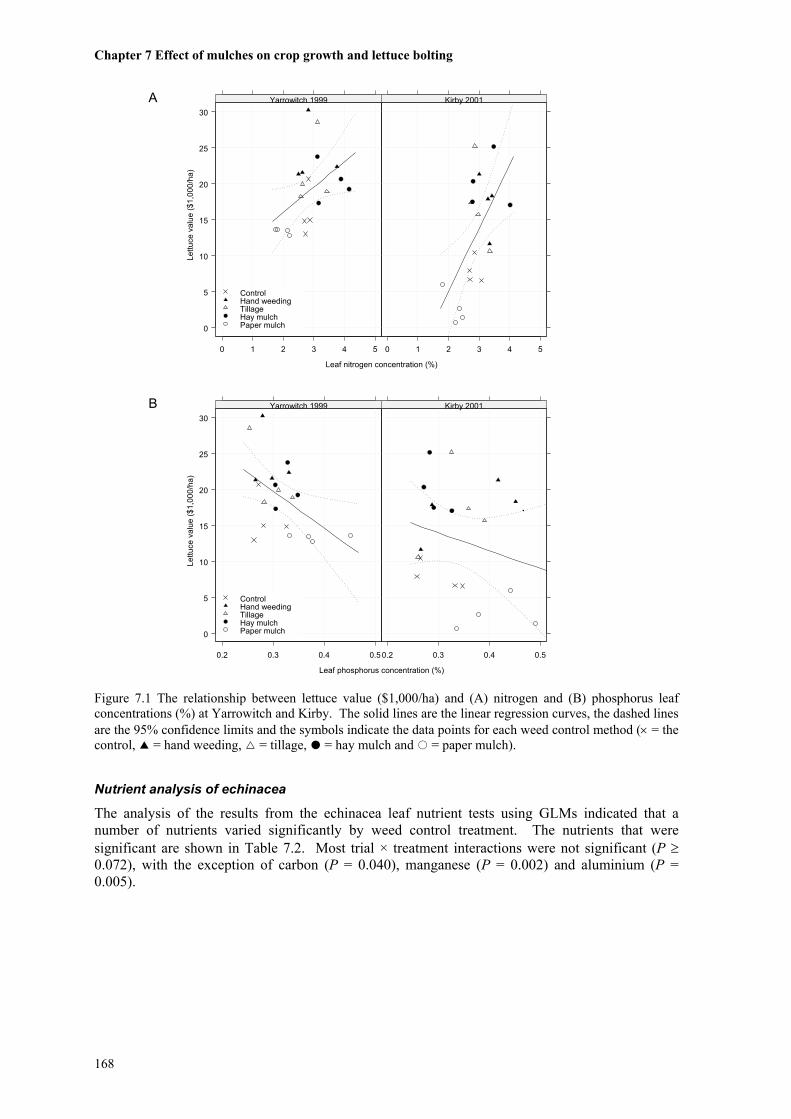
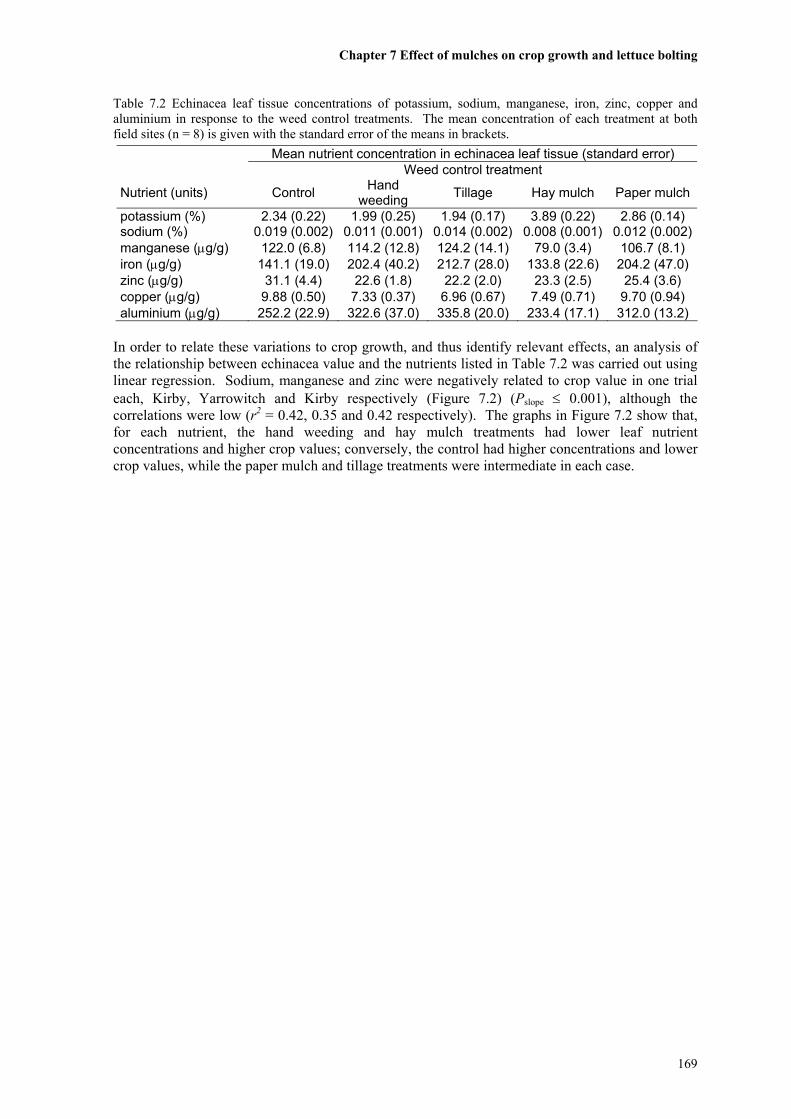
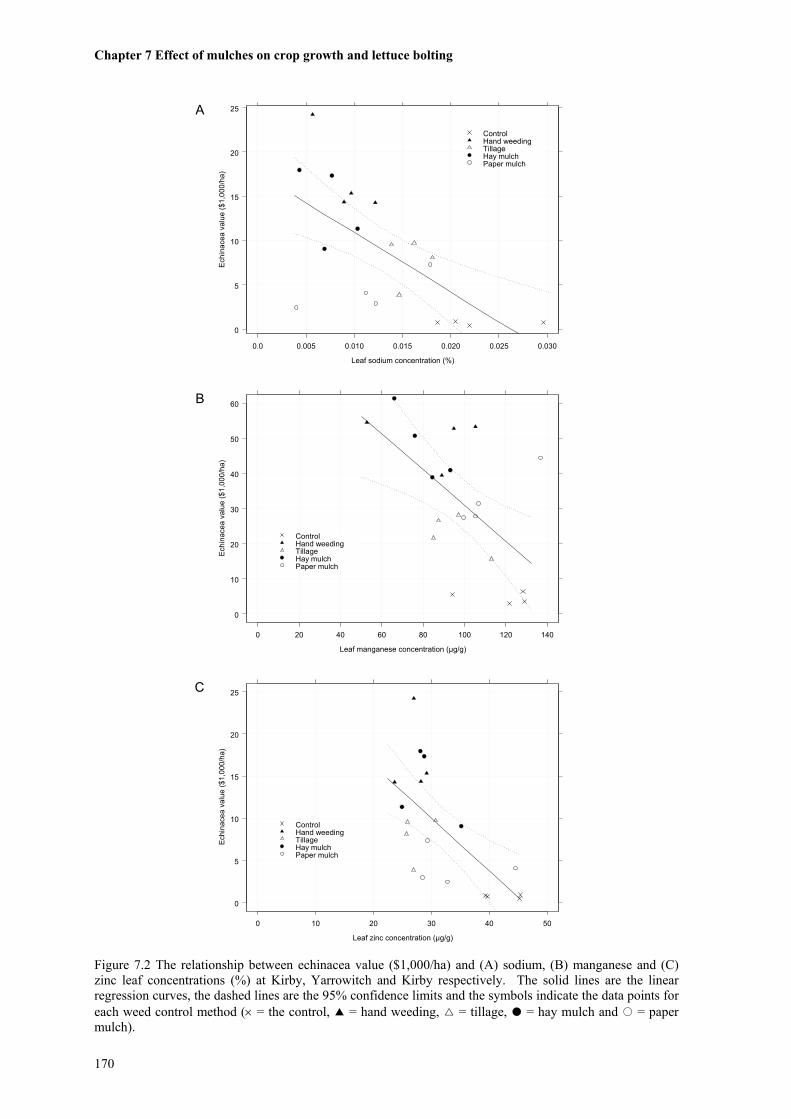
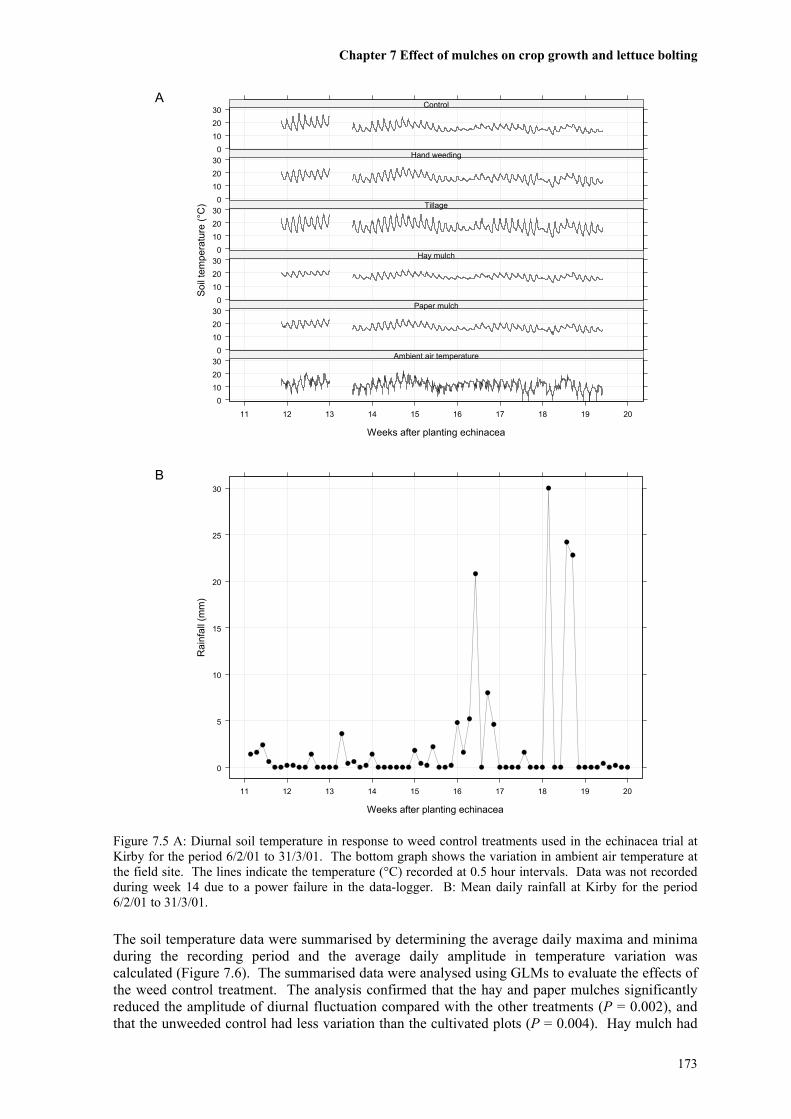
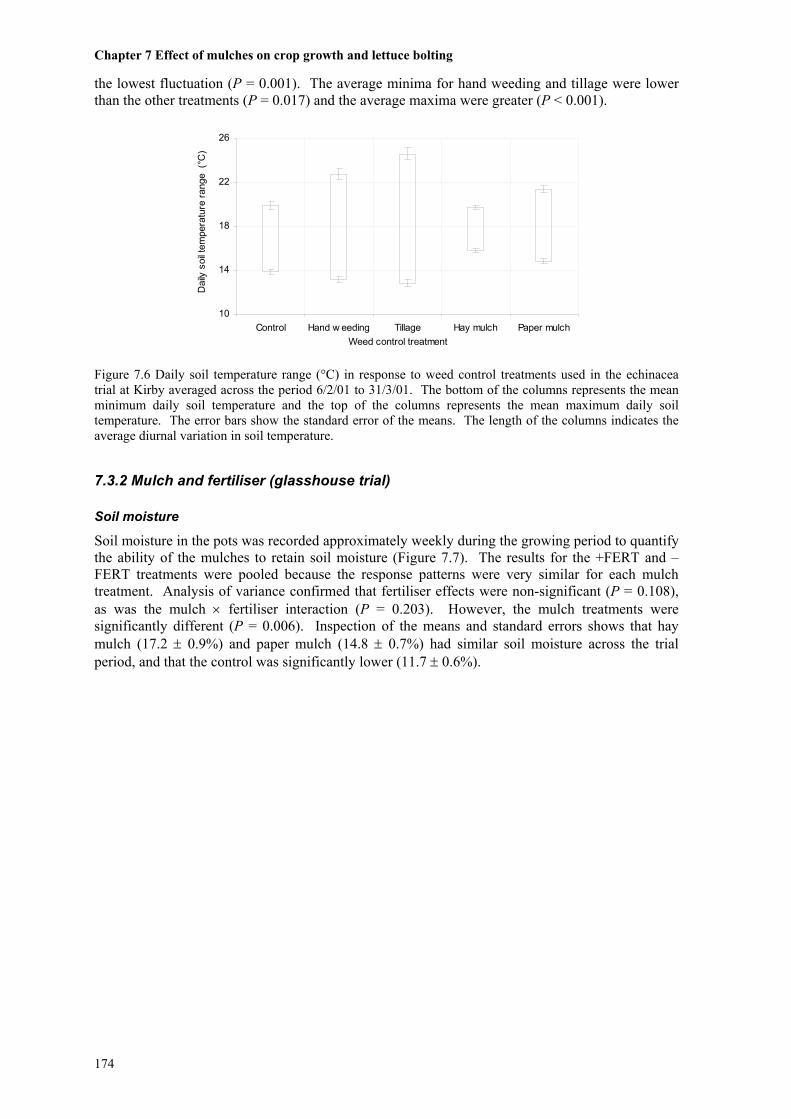
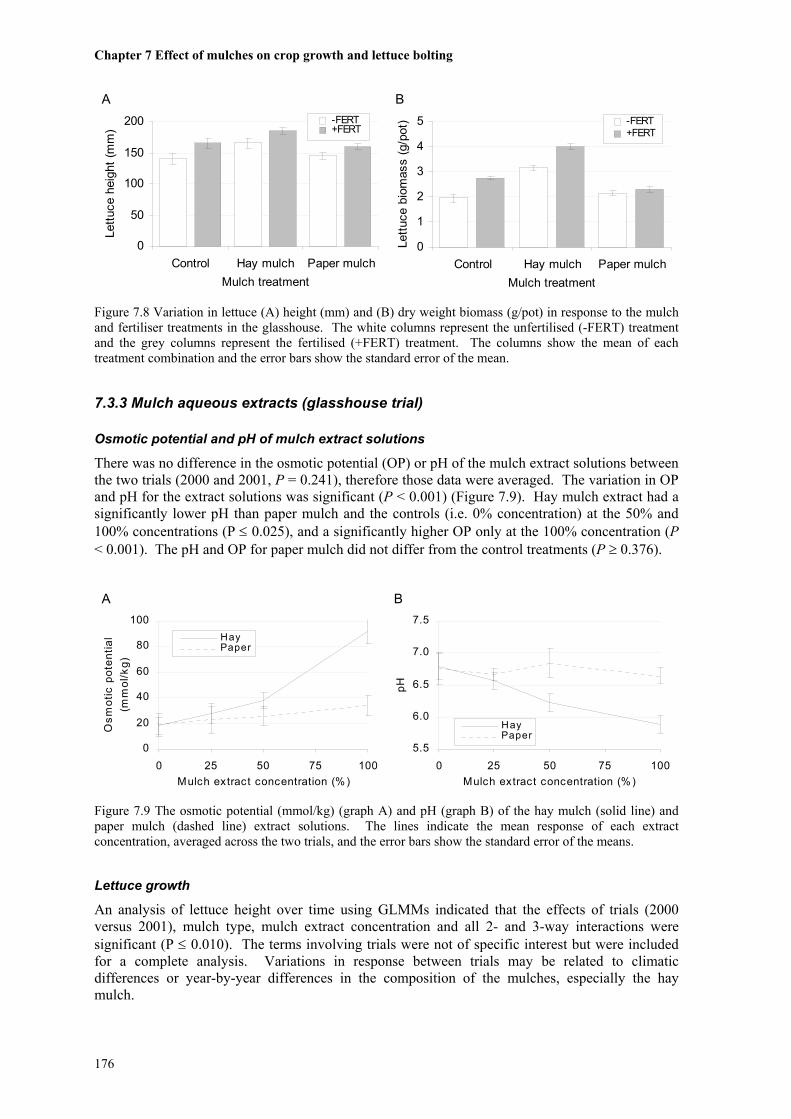
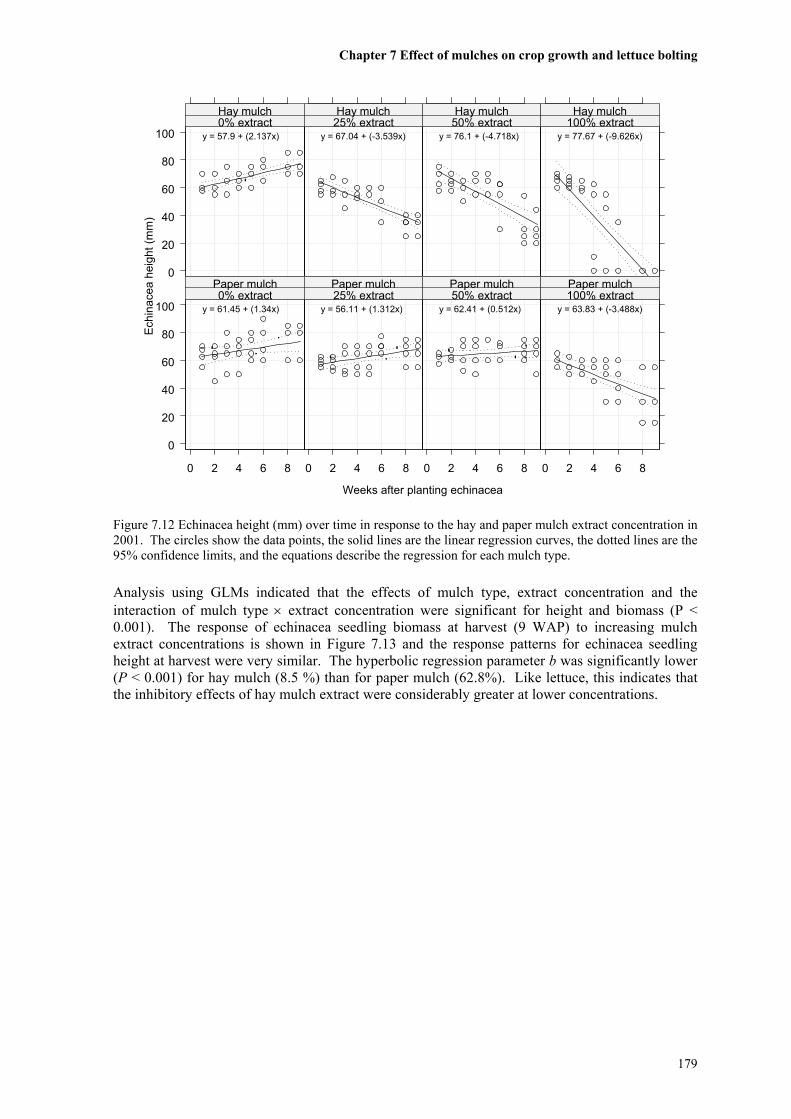
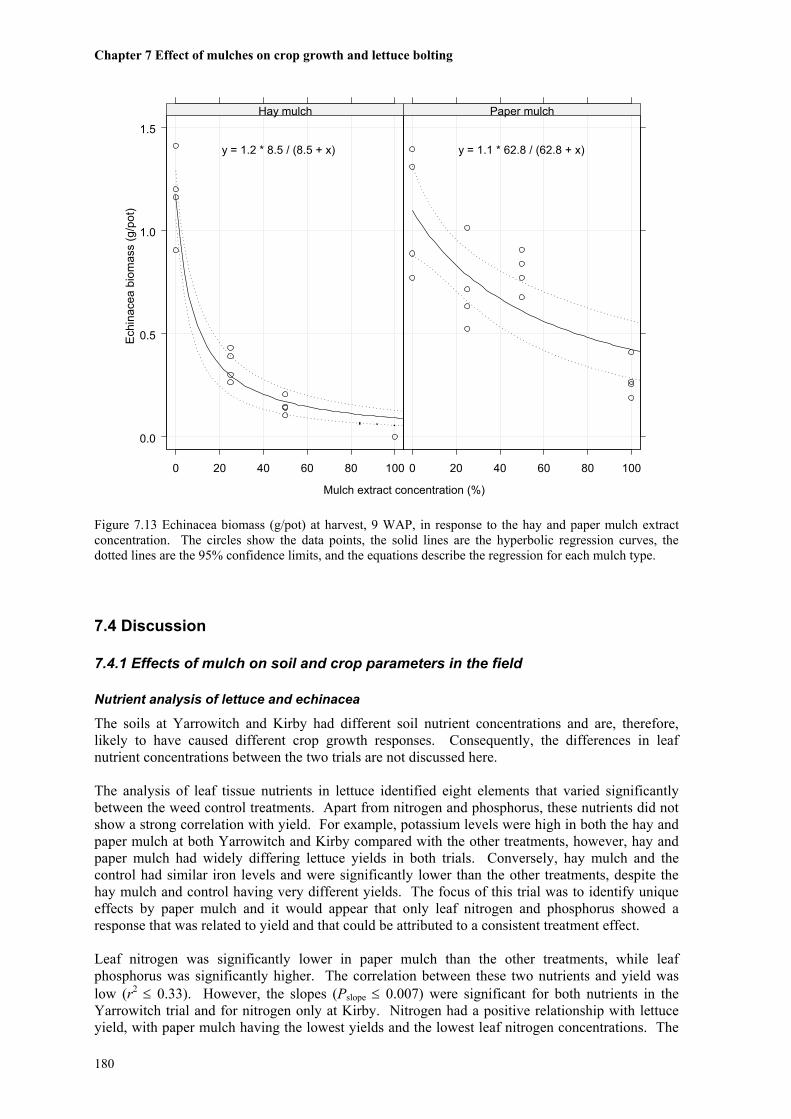
Chapter 7 Effect of mulches on crop growth and lettuce bolting...................................................................160 7.1 Introduction..........................................................................................................................................160 7.2 Methods ...............................................................................................................................................163 7.3 Results..................................................................................................................................................166 7.4 Discussion............................................................................................................................................180 7.5 Conclusions..........................................................................................................................................185
Chapter 8 General conclusion ........................................................................................................................186 8.1 Introduction..........................................................................................................................................186 8.2 Findings from the research...................................................................................................................186 8.3 Development of new information and ideas ........................................................................................189 8.4 Future research.....................................................................................................................................190
Appendix 1 Personal communications ................................................................................................219 Appendix 2 Survey materials ..............................................................................................................219 Appendix 3 Publications and reports...................................................................................................224
1
Chapter 1 Introduction
1.1 Project overview
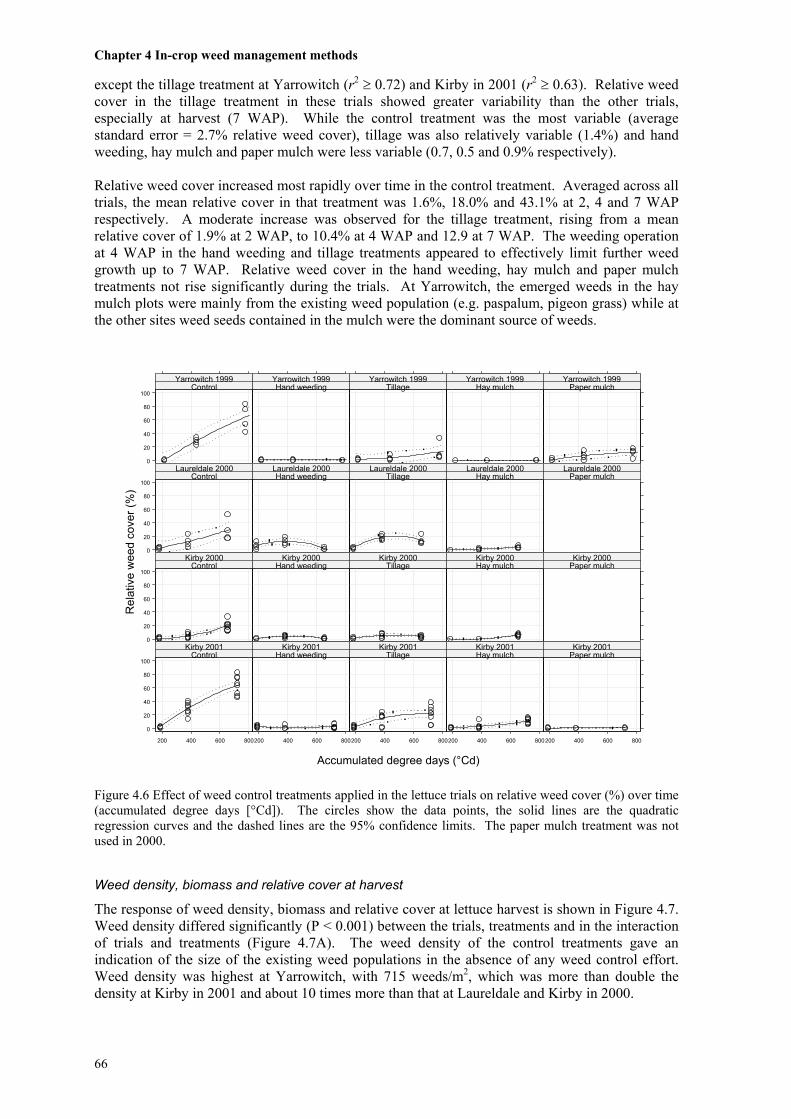
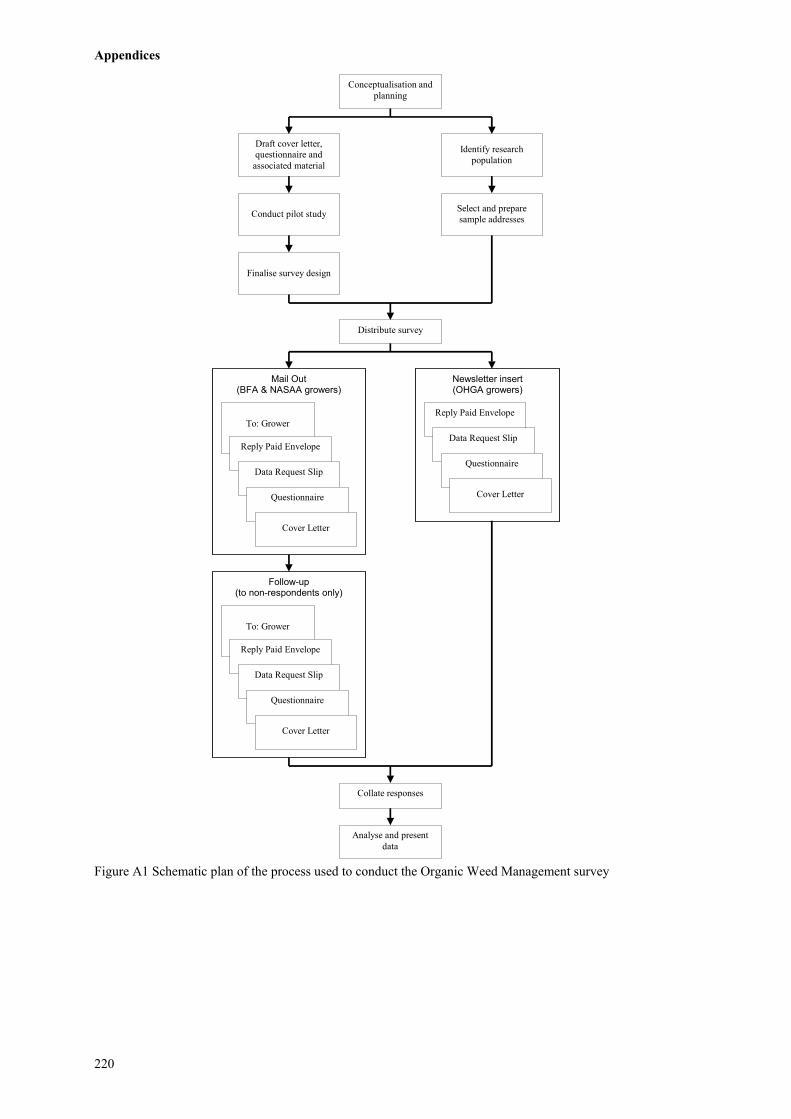
The demand for organic goods has grown steadily in recent years as concerns about food quality and the environmental impacts of agriculture have gained more attention. In response to this demand, the area under organic cultivation and the number of growers practising organic farming has increased. Weed management is one of the most important obstacles to adopting and prospering in organic production. This is considered to be a result of the labour-intensive nature of organic weed control and the potentially severe yield losses incurred by growers who fail to manage weeds adequately. The rapid growth in the number of organic farmers has meant that many of these growers are relatively inexperienced in organic techniques. The existing shortage of widely available information about the principles and practices of organic weed management (OWM), partly due to an historically marginal role played by organics over the latter part of the 20th century, emphasises the need for documenting and researching OWM. The project reported in this thesis was initiated by Subiaco Herbs, a family farming operation in the New England region of New South Wales which had recently converted from conventional sheep grazing to organic medicinal herb production. They were experiencing a situation common to many entering the organic farming business – a large proliferation of weeds, high labour costs for manual weeding and serious crop losses. The farmers approached the nearby University of New England (UNE) and a collaborative research project proposal was developed. Funding was sought and successfully obtained from the Rural Industries Research and Development Corporation (RIRDC), an Australian federal government funding agency, and the project was initiated. Although the initial proposal was for a study on weed management in organic herb production, RIRDC widened the scope to also include vegetable production. About 75% of organic growers are in the horticultural sector, with 24% producing vegetables, 20% producing herbs and about 4% producing either vegetables or herbs as well as other commodities (Hudson 1996). The design of the on-farm field trials was developed using a participatory research (PR) approach (Shennan et al. 1991, Dorward et al. 1997). Initial meetings were held with the managers and general staff of Subiaco Herbs to discuss their experiences, concerns and expectations. Priorities identified by the farmers and their staff included determining which weed control methods were the most effective and which methods were the cheapest. In addition, the issues of when and why various methods were effective and/or cost effective were also raised. Research options were constrained by practical factors such as the tools and implements available on-farm and the need to apply treatments in accordance with typical commercial production practices. Subsequently, discussions were held with researchers in universities and government agencies who were experienced in weed science and agronomy, particularly regarding methodological approaches, issues of interest to the weed science community and setting boundaries to the research. Several iterative cycles were carried out between consultations with the industry partner and meetings with research advisors. A national mail survey of organic herb and vegetable growers regarding weed management practices and attitudes was conducted prior to the PR activities. Early results from the survey were analysed and the findings incorporated into the research planning process. Popular weeding methods identified in the survey were included as treatments to ensure wider relevance to other growers. A research plan for the field trials was compiled based on the foregoing consultations, survey results and a review of the literature. Further trials in controlled environment settings were designed to investigate the effects of organic materials, such as mulches and cover crop residues, on weed suppression and crop growth. These trials were planned in response to the scientific literature and as a result of earlier trials, rather than as a direct outcome of the PR process. It was initially intended that all field trials would be carried out at Yarrowitch, on the organically certified farm of the industry partner. However, three weeks after the commencement of the first
Chapter 1 Introduction
2
series of field trials, Subiaco Herbs went into liquidation. The established trials were allowed to continue through to harvest, but it was not feasible to carry out experiments at that site in subsequent years. A full review of the results by the partner could not be done at the end of the first season and, therefore, a second PR cycle was not carried out in the following growing season. Attempts were made to secure an alternative organically certified property for the trials, but budgetary and logistical constraints were prohibitive. Consequently, field trials over the following two years were conducted at two farms operated by UNE.
1.2 Thesis format
Following this introductory chapter, a review of the literature is presented. Detailed literature reviews covering specific issues are provided in each research chapter in order to make the chapters more self-contained. To avoid repetition, the literature review in Chapter 2 focuses on organic agriculture, the importance of weed management in organic farming, specific weeding methods used in organics, and the agronomy of the test crops used in the trials. Chapter 3 describes the methods and results of the mail survey of OWM in herb and vegetable production. Chapters 4 and 5 report on an agronomic and economic evaluation of weed control methods applied during “in-crop” and “pre-crop” phases respectively, with the latter chapter also analysing the interaction between pre- and in-crop weed control methods. The experiments reported in Chapter 6 assessed the effects of brassica1 cover crops more closely, while Chapter 7 reports on the mechanisms underlying the crop growth responses to the hay and paper mulches. Botanical names and authorities for plant taxa mentioned in the text are based on the International Plant Names Index (TPNP 2003). An integrative conclusion is presented in Chapter 8. The conclusion describes the key findings from each chapter, provides a review of their implications for growers and weed scientists and identifies future research needs arising from this work. The objectives of the research were to: * gain an understanding of the current weed management principles and practices in organic herb
and vegetable production, * evaluate the relative cost and effectiveness of various weed control methods used in organic herb
and vegetable production in the Northern Tablelands of New South Wales, * investigate the effects of fallowing and cover crops on weed and crop growth, and their
interaction with in-crop weed management, and * determine how cover crops and mulches modify crop growth.
1 The term “brassica” (without capitalisation or italics) is used throughout the thesis to refer to species of the family Brassicaceae.
3
Chapter 2 Literature review
2.1 Overview of organic agriculture
2.1.1 History, current status and future trends in organic agriculture
Agriculture began organically. For many centuries, humans farmed without synthetic biocides or inorganic fertilisers, relying on organic fertilisers derived from plants and animals, and protecting crops and animals from pests and diseases using naturally occurring (or minimally processed) materials. Most inputs would have been sourced from on the farm or locally. However, in the past century, agriculture (in the developed world at least) began placing greater reliance on external inputs from distant sources and highly processed materials for crop and animal protection. One exception to that trend was the form of production now known as organic agriculture. Since the early part of the 20th century, a small number of growers around the world have been successfully developing and refining farming systems that don’t rely on synthetic biocides or inorganic fertilisers. These organic producers have persevered and prospered by maintaining a network of farmer-based industry groups, sharing information at field days and through organic-relevant books, newsletters and journals, and producing goods that were highly sought-after (Wynen 1992, Walz 1999). Very little governmental or commercial support was provided for many years, and all knowledge about organic agricultural practices was gained through the private enterprise of farmers and their grassroots organisations (Niggli 2002). Rather than receive broader support, organic farming has historically been subject to marginalisation and cynicism (FAO 1999, Walz 1999). During the past two or three decades the situation has begun to change. Increasing concerns about food quality, farm worker health, rural development, and the environmental impacts of farming systems, for example, have focused the attention of policy makers, consumers, researchers and farmers on alternative productions systems, including organics (Wynen 1998, Peterson 2000). Australian sales of organic goods have risen by 20 – 30% annually and similar increases are being experienced worldwide (Kinnear 2000a). Estimates in 1998 of the global market for organic products suggested $13 billion to $13.5 billion annually, and medium term growth rates of up to 40% per annum were predicted, depending on the commodity sector and location (ITC 1999). In response, there has been an increase in government spending on research (Derrick 1997, Griggs 2000), and industry development (Centre for Tropical Agriculture 1999, Horsley 2000) in organic agriculture. However, it has recently been noted that the amount spent on research and development beneficial to Australian organic farmers falls well short of the research levies collected from those growers (Wynen 2003a). In parallel with the growing demand, there has been an increase in the number of growers and the amount of organically certified land. Organic production in Australia is estimated to be valued at $200 – 250 million annually (Crothers 2000), produced by about 1,800 farmers (RIRDC 2003) on over 10.5 million ha of land (Yussefi and Willer 2003), and annual growth of 40% is expected between 2001 and 2006 (RIRDC 2003). Although Australia has the largest area of organically certified land in the world, this land is composed mainly of large properties grazing beef cattle at very low intensity on natural tropical and sub-tropical grasslands. As a percentage of total agricultural land, western Europe has about 2.4% certified organic and Australia 1.7% (Yussefi and Willer 2003).
2.1.2 Definition and description of organic agriculture
Numerous definitions have been used to describe organic agriculture, including those of organic certifying bodies (IFOAM 2002), national government agencies (AQIS 2001) and other participants in the organic industry (Lampkin 1990). Differences in specific aspects of organic production exist around the world (e.g. Japan and the USA) and between sectors within the
Chapter 2 Literature review
4
industry (e.g. bio-dynamics and ordinary organics). Organic agriculture is not simply a system where certain inputs, especially synthetic biocides and inorganic fertilisers, are prohibited. It is, instead, a system that focuses on the ecological and biological aspects of farming systems to achieve management goals (FAO 1999). Increasingly, social and environmental factors are being highlighted in the organic agriculture movement, in addition to the longer-standing emphasis on production methods (Lines-Kelly and Mason 2001, Scialabba and Hattam 2002). A recent report by the United Nations Food and Agriculture Organisation (FAO) presented a useful general summary of organic production.
“Organic agriculture is a production management system that aims to promote and enhance ecosystem health, including biological cycles and soil biological activity. It is based on minimizing the use of external inputs, and represents a deliberate attempt to make the best use of local natural resources.” (Bruinsma 2003)
“Organic” farming is the term most commonly used for certified, non-chemical agriculture in Australia, North America, the United Kingdom and elsewhere. In many parts of Europe, the terms “ecological” or “biological” agriculture are used instead (Lampkin 1990). They are considered here to be equivalent to organics. Bio-dynamic agriculture is an extension of organic farming, with a range of specialised husbandry practices based on the teachings of Rudolph Steiner (1974). Organic farmers commonly seek certification in order to promote and sell their produce as genuinely organic, although in some situations where direct sales between the farmer and consumer are possible, formal certification may not be necessary. Certification organisations inspect and audit farms to ensure that growers are complying with a range of standards which define suitable crop and animal husbandry practices and which list permitted, restricted or prohibited inputs (Bruinsma 2003). In Australia, Australian Quarantine and Inspection Service (AQIS), a federal government agency, publishes certification standards for organic production and processing in the National Standard for Organic and Bio-Dynamic Produce (AQIS 2001). Australian certification bodies also have their own published standards that conform to, or are more stringent than, the National Standard. The first certifying agencies were established in the late 1980s to provide a system of certification and also to act as a focus for networking, sharing knowledge and ideas between growers, and to foster industry development (Denham 1997, McFarlane 1997, Rubin 1997). To claim organic status for export produce, the farmer must be certified by an AQIS accredited certification body. Overseas, there is a wide range of certification agencies operating on all continents with the largest based in Europe and North America. When starting to produce certified organic goods, a property and its manager(s) normally undergo a compulsory transition period. This period is called “conversion” and usually lasts between 12 months and 3 years, depending on previous land use and the levels of chemical residues present at the initial audit. Goods produced during the conversion period may be labelled as “in conversion”, but must not be labelled as organic until the end of the transition period and full organic status has been achieved (AQIS 2001). The conversion period is commonly reported to be difficult for growers because they are developing new farming skills, the farming system is relatively unstable, yields are often lower and the premium prices gained for fully organic goods are yet not available (MacRae et al. 1990, Wynen 1992, Kelly et al. 2000). In the medium-term, however, yields begin to increase as the system becomes more stable and grower skills improve, premiums become available and cash incomes increase (Wynen 1992, Bruinsma 2003). The word “conventional” will be used to refer to the mainstream farming systems in which synthetic biocides and/or inorganic fertilisers are used (Reganold et al. 2001, Mäder et al. 2002). It is acknowledged that conventional agricultural systems vary widely in the level of external inputs used, their off-farm impacts, the quality of their produce, and the extent to which ecological and biological functions are fostered within the system.
Chapter 2 Literature review
5
2.2 Weeds in organic production
2.2.1 Weeds are a key constraint
Weeds are considered to be notoriously difficult to control in organic agriculture. Surveys of organic growers in many countries, over a span of more than a decade, have regularly indicated that weeds are a prime constraint, especially during conversion (Baker and Smith 1987, Peacock 1990, Beveridge and Naylor 1999, Walz 1999, Burnett 2001, Zinati 2002). Anecdotal reports from organic farmers and the certification bodies confirm that weed control can be a key impediment in adopting, converting to and succeeding in organic production (A. Monk, pers. comm. and R. May, pers. comm.). The conversion period can be particularly difficult because of a lack of experience (Wynen 1992) and significant changes in weed population dynamics (Ngouajio and McGiffen 2002). Researchers carrying out organic farming trials also commonly report major problems with weed management (Morgan 1990, Groeneveld et al. 1997, Clark et al. 1998, Buntain 1999, Welsh et al. 1999, Hippe et al. 2000, McCoy 2001, Porter et al. 2003). Reviews of organic research needs rank weed control as one of the top production issues requiring further study (Wynen 1997, Köpke 1999, Willer and Zerger 1999). Other agronomic factors that constrain organic agriculture include maintaining soil fertility and managing pests and diseases. Important off-farm limitations in organic production such as accessing sufficient certified inputs (e.g. manure, compost, seeds and seedlings), post-harvest handling and processing, and marketing issues are commonly cited by growers and researchers (Alenson 1997, Rasmussen 1998, Walz 1999, Willer and Zerger 1999, Zinati 2002). A contrary finding regarding the impact of weeds in organic production was reported in a survey of organic growers in north-eastern USA (Lockeretz 1997). In a ranking of farmer perceptions about the disadvantages of organic methods, the proposition that it is "harder to control weeds" was 8th (5% of respondents) out of 11 listed disadvantages. However, the most often reported disadvantage was "requires more labour" (40%), and it is possible that much of the labour was consumed in weed management. Despite the large amount of research and development money spent on herbicide-dominated weed management in conventional agricultural systems, mainstream growers also report that weeds can be a significant problem (Young and Hingston 1993, Lees and Reeve 1994, Sindel 1996, Ayres and Kemp 1998, Reeve et al. 2000). In one report, a large percentage (34 – 62% depending on location) of grain farmers felt that weed problems were worse or unchanged from five years ago (Jones et al. 2000). Henderson and Bishop (2000) stated, however, that weeds are generally given a low priority in conventional vegetable production in Australia and that weed management costs are not a large percentage of total variable expenses.
2.2.2 Weeding costs and labour
“We're weeding 12 hours a day, 6 days a week. It would be 7 days but we need to irrigate every so often.” – organic herb grower, Canada (Schimpf and Lundberg-Schimpf 1998)
Compared with conventional production, labour costs in organic farming tend to be greater. The extra on-farm labour on organic properties is usually considered to be due to the higher requirements for weeding (Stonehouse et al. 1996, Clark et al. 1999, Nilsson et al. 2000) and spreading compost and mulches (Schonbeck 1998, Clark et al. 1999). Factors such as labour cost, farm size, prevailing weed density, crop value and access to premium prices can affect the cost effectiveness of weeding methods (Melander 1998a, van Elzakker and Caldas 1999, Alemán 2001, Porter et al. 2003). In a vegetable farming systems trial in California, Klonsky and Livingston (1994) found that weed control costs in an organic system were lower than or similar to 2- and 4-year conventional rotation systems (11.5, 14.0 and 10.9% respectively).
Chapter 2 Literature review
6
While there are numerous reports from overseas which consider the economics of weeding management in organic agriculture, very little research has been conducted on the relative cost of weed control in organic production in Australia. Separating costs that are directly and exclusively concerned with weed control (e.g. labour for hand weeding) from indirect and non-exclusive costs (e.g. cover cropping) is difficult. Estimates of the proportion of total costs attributed with weed management range from 10 – 30% in broadacre organic agriculture, to 30 – 50% in intensive organic horticulture (E. Wynen, pers. comm.), and even up to 70% in some horticultural systems (Eggins 1998). Buntain (1999) calculated that weed control costs in organic echinacea (Echinacea purpurea Moench. [L.]) were about 60% of total variable costs. In contrast, Henderson and Bishop (2000) indicated that proportional costs of weed management in conventional vegetable production ranged from 1 – 5% for some crops including potato (Solanum tuberosum L.), sweet corn (Zea mays L. var. saccharata [Sturt.] Bailey) and up to 10 – 22% for onion (Allium cepa L.) and lettuce (Lactuca sativa L.). Although the need to reduce labour requirements on a farm-by-farm basis may be an economically sensible strategy, the higher labour requirements of organic farming may stimulate regional employment in rural areas, especially in association with the greater crop diversification spreading the workloads though the year (Wynen 2003b).
2.2.3 Lack of information
With the number of organic growers increasing, many of the new farmers may have little experience in farming generally or in organic farming specifically, with people moving from urban to rural areas or conventional farmers undergoing conversion (Anderson 1990, Lockeretz 1995, Hudson 1996). This growing cohort of less experienced producers will require information about organic weed management principles and practices and the strategies for implementing them. Technical details sought by growers include plant and animal species selection, rotation sequences, and cover crop and inter-crop management (Marshall 1992, Alenson 1997, Wynen 1998). Although the basic principles of organic farming can be introduced from other regions or other countries, expertise based on local conditions is usually important for developing suitable management solutions (Wynen 1998, Lockeretz 2002). Expertise in OWM could traditionally be found amongst longer-term practitioners and within industry groups (Denham 1997, Padel 2001). More recently, there has been a growth in the number of publications and other sources relating to organics, including weed management. A review of these resources was presented by Kristiansen et al. (in press) and is reproduced in Appendix 4. There are a number of published resources outlining organic research priorities that are relevant to Europe (Krell 1997, Isart and Llerena 1999, Willer and Zerger 1999) and the US (Lipson 1997, Walz 1999). Such resources do not appear to be readily available in Australia apart from occasional remarks in Dumaresq et al. (1997). The recent "Development Strategic Plan for the Australian Organic Industry" process has also highlighted some general research concerns (Virtual Consulting Group 2000).
2.2.4 Weeds may be beneficial
In spite of the overwhelming number of reports highlighting the negative impacts of weeds in organic farming, some organic growers (especially those with more experience) and others report that weeds have several benefits to the farming system (Joedodibroto et al. 1979, Patriquin 1988, Wynen 1992, Li 1996, Finckh et al. 2000, Liebman 2001, Robson et al. 2002). Some of the benefits ascribed to weeds include: * direct economic uses – industrial materials, medicinal plants, food for stock; * soil biological impacts – increasing macropore numbers, providing diverse habitats for soil
microbes; * soil nutrient impacts – accessing nutrients in the sub-soil, storing minerals to reducing leaching,
providing green manure;
Chapter 2 Literature review
7
* soil structural impacts – loosening heavy or compacted soil and sub-soil, providing ground cover to reduce erosion and surface crusting;
* water conservation – reducing leaching and run-off; and * ecological impacts – indicating underlying soil conditions (e.g. pH, drainage), providing habitat
and resources for beneficial invertebrates. These potential benefits need to be considered in light of the possible crop losses or contamination that may occur if certain weeds are not effectively controlled.
2.3 Organic weed management
2.3.1 Overview of OWM research and methods
The Australian organic National Standards state that “the reliance on substances rather than management practices for the control of pests and diseases is not in accordance with the principal aims of organic agriculture” (AQIS 2001). This clearly signifies that an ecological approach to weed management is necessary, based on skilled farm management rather than using external inputs. A number of reviews of organic and non-chemical weed management have been published (Andres and Clement 1984, Altieri and Liebman 1988a, Patriquin 1988, Morgan 1989, Ascard 1990, Geier 1990, Liebman and Janke 1990, Parish 1990, Marshall 1992, Popay et al. 1992, Lee 1995, Rasmussen and Ascard 1995, Liebman and Gallandt 1997, Bond and Lennartsson 1999, Kropff et al. 2000, Bond and Grundy 2001, Bàrberi 2002). There is considerable overlap in the type of material presented in these reviews, however, there are some notable omissions in content. Certain OWM methods such as tillage are normally covered in detail, while other methods such as hand weeding and grazing receive little or no attention, particularly in the more recent reviews. Organic agriculture has traditionally relied on the integration of pasture and cropping phases for weed control, crop protection and fertility management (Balfour 1948, Köpke and Geier 1999). In addition, the land area occupied by mixed farms and pasture systems heavily dominates the organic industry (Robson et al. 2002, Yussefi and Willer 2003). It is therefore surprising that grazing is not mentioned in many reviews of OWM. Similarly, hand weeding receives little attention in reviews despite being a frequently used weed control in organic agriculture (Walz 1999) and for farmers in developing countries (Chatizwa 1997). Some recent research on hand weeding has been published (see section 2.3.2 below), although reviewers seem to be less concerned with that form of weed control. Derrick (1997) reviewed research on organic agriculture in Australia in 1996. This review had only three references to weeds: two asserting that research into weed management was needed (Wynen 1988a, Hudson 1996) and the other briefly mentioning farmer weed management practices (i.e. heavy grazing and higher seeding rates) from a survey (Dumaresq and Derrick 1990). However, since then, a number of trials on organic and non-chemical weed management have been conducted in Australia. Griggs’ (2000) review of organic research in Australia lists a number of projects in which weed management is being investigated, including projects in Tasmania on intensive organic vegetable production systems and organic systems technology transfer, and in Victoria on weed management for organic grain crops. In a broadacre systems trial in South Australia, results showed that novel tillage implements were effective for in-crop weed control, although timing (i.e. weed growth stage) and soil moisture levels were critical (Penfold and Miyan 1996), and that rotations with ley pastures and green manures could be beneficial for weed control (Penfold and Miyan 1998). Bishop et al. (2002) noted that weed control techniques such as brush weeders and flame weeders provided relief from labour intensive hand weeding. Publications with practical guidelines to assist growers have also been developed. Some provide general information about OWM in a range of farming situations (Lampkin 1990, Merfield 2002) while others focus on weed control in specific farming types such as vegetables (Peet 1996) and herbs (Whitten 1999). A number of authors have focussed on the relationship between soil
Chapter 2 Literature review
8
conditions and weed populations, suggesting that many weeds can be controlled by modifying soil management practices (Pfeiffer 1970, McCaman 1994, Walters 1996). In addition, a growing body of research on organic and non-chemical weed management is appearing in the proceedings from biennial conferences of the International Federation of Organic Agriculture Movements (e.g. Alföldi et al. 2000, Thompson 2002) and the European Weed Research Society Physical and Cultural Weed Control Working Group (Cloutier 2000, 2002). The topics which receive most attention in these publications are tillage and flame weeding, while research on cover crops, miscellaneous cultural techniques, weed ecology and modelling is less frequently reported. Principles in OWM
Most publications reviewing organic and non-chemical weed management not only list and describe a range of physical and cultural weed control methods, but they also emphasise the underlying strategies or principles that need to be applied when using the various methods. A knowledge of the biological characteristics of the prevailing weeds (e.g. morphology, phenology, perenniality, reproductive strategies) and their ecological parameters (e.g. competitive ability, spatial distribution, response to weeding methods) is crucial for designing efficient weed management systems (Altieri and Liebman 1988b, Turner et al. 1999, Rasmussen et al. 2000). Management opportunities for reducing weed levels or their impact on crops may be found by manipulating the availability and capture of resources and by disrupting niches and lifecycles (Baker 1974, Bastiaans et al. 2000, Baumann et al. 2000, van Elsen 2000). The principle of using a diverse range of methods, rather than relying on a few techniques has been asserted, for example in Liebman and Gallandt’s (1997) “many little hammers” approach, in contrast to wielding a single large hammer such as herbicides or tillage. Reliance on a limited number of methods should be avoided so that the selection pressure on weeds that are resistant to a given control methods is reduced (Cussans 1995, Liebman and Davis 2000). A related strategy is the adoption of a whole-farm planning approach in which various farming activities are integrated, especially through a strategic rotation program (MacRae et al. 1990, Robson et al. 2002). Preventing weeds, rather than reacting to existing populations, can be achieved by reducing inputs to and increasing outputs from the weed propagule bank in the soil (Geier 1990, Kropff et al. 1997, Melander and Rasmussen 2000). Strategies to manage weed propagule numbers include killing newly emerged seedlings, depleting seed banks by bare fallowing, preventing seed set in weeds and limiting weed dispersal between parts of the farm. Maintaining a longer-term outlook, rather than focussing only on the current or up-coming season, indicates a recognition of the importance of both prevention and integration (Bastiaans et al. 2000, Jones and Medd 2000). Practices in OWM
Without recourse to herbicides, organic growers rely on a large suite of strategies and tools to manage weeds. Altieri and Liebman (1988b) suggested two main ways to control weeds, (a) direct control, where the weeds are physically suppressed or removed, and (b) indirect control which gives the crop a competitive advantage over the weeds using cultural or management techniques. Organic farms, or conventional farms using crop rotations rather than monoculture, tend to have higher levels of weed diversity (Stevenson et al. 1997, Hald 1999, Ngouajio and McGiffen 2002). In dealing with species-rich weed communities, indirect methods are likely to be more effective (Altieri and Liebman 1988b, Bàrberi 2002), although the effectiveness of weed control treatments will be specific to the crops tested, growing conditions and weeds present (Cousens and Mortimer 1995). The organic National Standards in Australia list the following practices for OWM: choice of appropriate species and varieties, biological control, rotations, bio-dynamic measures, solarisation, tillage, mulching, mowing, grazing, and flame/steam weeding (AQIS 2001). Although the list mostly includes direct control methods, the Standards also refer to cultural methods such as stimulating soil fertility, growing green manure crops, and using careful sowing and cultivation techniques. Surprisingly, hand weeding is not mentioned (AQIS 2001). Several other methods
Chapter 2 Literature review
9
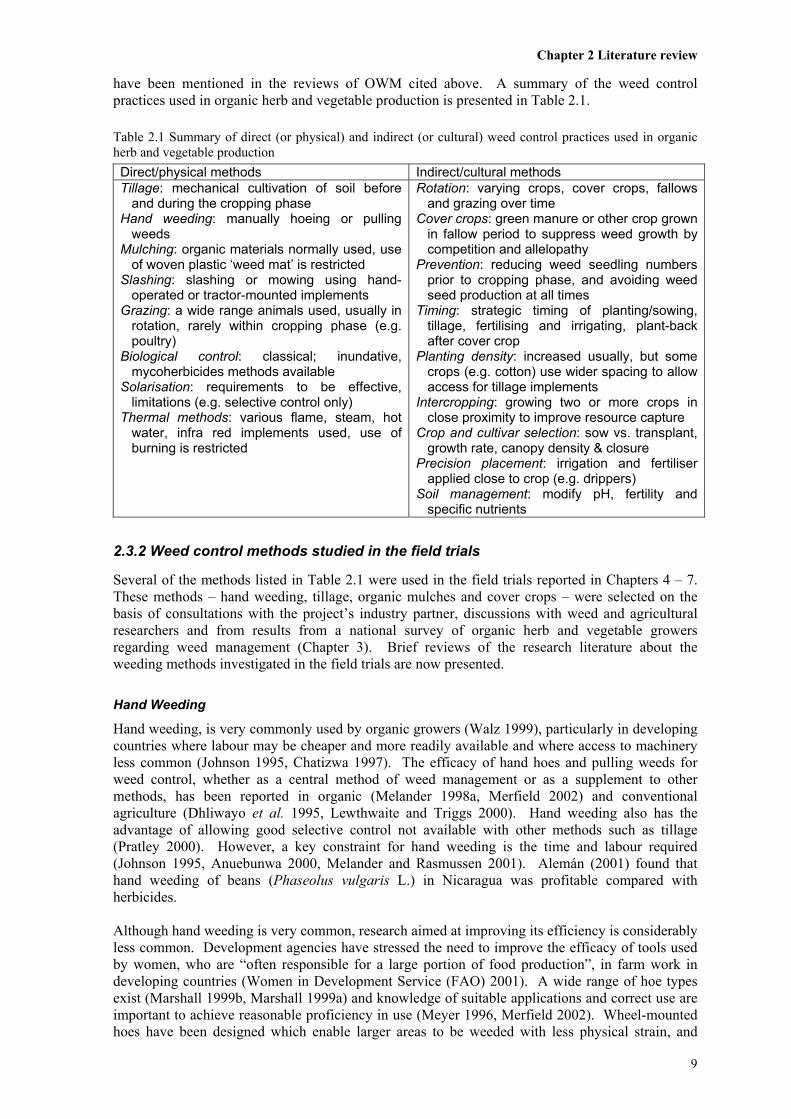
have been mentioned in the reviews of OWM cited above. A summary of the weed control practices used in organic herb and vegetable production is presented in Table 2.1. Table 2.1 Summary of direct (or physical) and indirect (or cultural) weed control practices used in organic herb and vegetable production Direct/physical methods Indirect/cultural methods Tillage: mechanical cultivation of soil before
and during the cropping phase Hand weeding: manually hoeing or pulling
weeds Mulching: organic materials normally used, use
of woven plastic ‘weed mat’ is restricted Slashing: slashing or mowing using hand-
operated or tractor-mounted implements Grazing: a wide range animals used, usually in
rotation, rarely within cropping phase (e.g. poultry)
Biological control: classical; inundative, mycoherbicides methods available
Solarisation: requirements to be effective, limitations (e.g. selective control only)
Thermal methods: various flame, steam, hot water, infra red implements used, use of burning is restricted
Rotation: varying crops, cover crops, fallows and grazing over time
Cover crops: green manure or other crop grown in fallow period to suppress weed growth by competition and allelopathy
Prevention: reducing weed seedling numbers prior to cropping phase, and avoiding weed seed production at all times
Timing: strategic timing of planting/sowing, tillage, fertilising and irrigating, plant-back after cover crop
Planting density: increased usually, but some crops (e.g. cotton) use wider spacing to allow access for tillage implements
Intercropping: growing two or more crops in close proximity to improve resource capture
Crop and cultivar selection: sow vs. transplant, growth rate, canopy density & closure
Precision placement: irrigation and fertiliser applied close to crop (e.g. drippers)
Soil management: modify pH, fertility and specific nutrients
2.3.2 Weed control methods studied in the field trials
Several of the methods listed in Table 2.1 were used in the field trials reported in Chapters 4 – 7. These methods – hand weeding, tillage, organic mulches and cover crops – were selected on the basis of consultations with the project’s industry partner, discussions with weed and agricultural researchers and from results from a national survey of organic herb and vegetable growers regarding weed management (Chapter 3). Brief reviews of the research literature about the weeding methods investigated in the field trials are now presented. Hand Weeding
Hand weeding, is very commonly used by organic growers (Walz 1999), particularly in developing countries where labour may be cheaper and more readily available and where access to machinery less common (Johnson 1995, Chatizwa 1997). The efficacy of hand hoes and pulling weeds for weed control, whether as a central method of weed management or as a supplement to other methods, has been reported in organic (Melander 1998a, Merfield 2002) and conventional agriculture (Dhliwayo et al. 1995, Lewthwaite and Triggs 2000). Hand weeding also has the advantage of allowing good selective control not available with other methods such as tillage (Pratley 2000). However, a key constraint for hand weeding is the time and labour required (Johnson 1995, Anuebunwa 2000, Melander and Rasmussen 2001). Alemán (2001) found that hand weeding of beans (Phaseolus vulgaris L.) in Nicaragua was profitable compared with herbicides. Although hand weeding is very common, research aimed at improving its efficiency is considerably less common. Development agencies have stressed the need to improve the efficacy of tools used by women, who are “often responsible for a large portion of food production”, in farm work in developing countries (Women in Development Service (FAO) 2001). A wide range of hoe types exist (Marshall 1999b, Marshall 1999a) and knowledge of suitable applications and correct use are important to achieve reasonable proficiency in use (Meyer 1996, Merfield 2002). Wheel-mounted hoes have been designed which enable larger areas to be weeded with less physical strain, and
Chapter 2 Literature review
10
greater selectivity between crop and weed than a conventional hand hoe (Wilkie and Plane 2000). Other recent developments in hand weeding technology include self-propelled and tractor-drawn platforms on which people lie while moving along crop rows and weed by hand (Leinonen and Närkki 2000, Bond and Grundy 2001, Bishop et al. 2002). Groeneveld et al. (1997) conducted a preliminary trial in the Netherlands to test whether supplementary hand weeding to prevent weed seed production during the first years of an organic rotation was profitable in the longer term. Between 0 and 150 hours/ha of extra hand weeding was incurred, depending on the crop, compared with an industry standard hand weeding regime. A medium-term reduction in weed density was expected for the intensive treatment, but further results have not been published. Tillage
Tillage is one of the main techniques used in OWM (Beveridge and Naylor 1999, Walz 1999). It can reduce the need for hand weeding by 75% (Ascard and Fogelberg 2002), although the effectiveness and selectivity of tillage can be variable (Bond and Grundy 2001). The use of tillage for weed control during a cropping phase has been assessed thoroughly in a number of reviews, particularly two recent reports covering tillage implement types and their operating conditions (Merfield 2002, Tillett and Home 2002). Various types of implements are available to farmers, including tines, discs, mouldboards, brushes and fingers; they may be powered from a power-take-off shaft or simply drawn behind the tractor; and the tines may have a range of attachments such as chisels, sweeps and knives. Weeds are controlled by cutting, removal of the plant followed by desiccation, seed burial and stimulating germination for subsequent control (Pratley 2000). Factors which affect the efficacy and selectivity of tillage implements include speed, depth, existing weeds, soil moisture levels and timing in relation to weed growth stage (Welsh et al. 1997). Accuracy is an important constraint, inversely related to operating speed, and positively related to operator experience (Oriade and Forcella 1999, Welsh et al. 1999). Precision guidance systems are currently under development, although they are not widely adopted commercially yet (Tillett et al. 2002, Søgaard and Olsen 2003) and Leake (1996) has suggested that high precision tillage may only be economically viable in high value crops. Damage to soil is also a key limitation of the overuse of tillage (Norfleet et al. 1996, Penfold and Miyan 1996). Several studies have been conducted which compare tillage implements and the results generally vary depending on the specific conditions of the trial (Rasmussen and Svenningsen 1995, Pullen and Cowell 1997, Reddiex et al. 2001). Tillett and Home (2002) state that such comparative trials may have limited value for generalising the results to other situations, although detailed studies of the performance parameters of individual implements may be worthwhile, suggesting mechanisms of weed kill, influence of tillage on the crop and soil movement studies as possible areas for research. Weed seed banks and weed floristics are known to be affected by the type of tillage system (Stevenson et al. 1997, Bàrberi et al. 1998a, Bàrberi and Lo Cascio 2001). Mulch
In regard to mulches, the Australian organic National Standards states that “solid non-woven plastic or synthetic material sheets for mulching are prohibited. Mulching materials must be free from substances [e.g. carpet underlay impregnated with insecticides] not permitted under this Standard” (AQIS 2001). Woven plastic material, such as weed matting, is permitted for restricted, short-term use only. Shade cloth (Sutton 1998) and weed matting (Monks et al. 1997) have been used in conventional vegetable production, and weed matting has been tested in organic peach (Prunus persica [L.] Batsch.) orchards (Zimmerman 2002), but few examples were identified in the literature about the use of these synthetic mulches for organic herb and vegetable growing (Birkeland and Døving 2000, Chandran et al. 2001, Radics and Székelyné Bognár 2002). On the other hand, a broad range of organic mulch materials has been investigated in organic and non-chemical weed control research (Table 2.2), and suggested for use in organic guides (Roads 1989, Bennett 1993, Whitten 1999). In addition to suppressing weeds, organic mulches have other benefits such as conserving soil and moisture, reducing fluctuations in soil temperature, adding
Chapter 2 Literature review
11
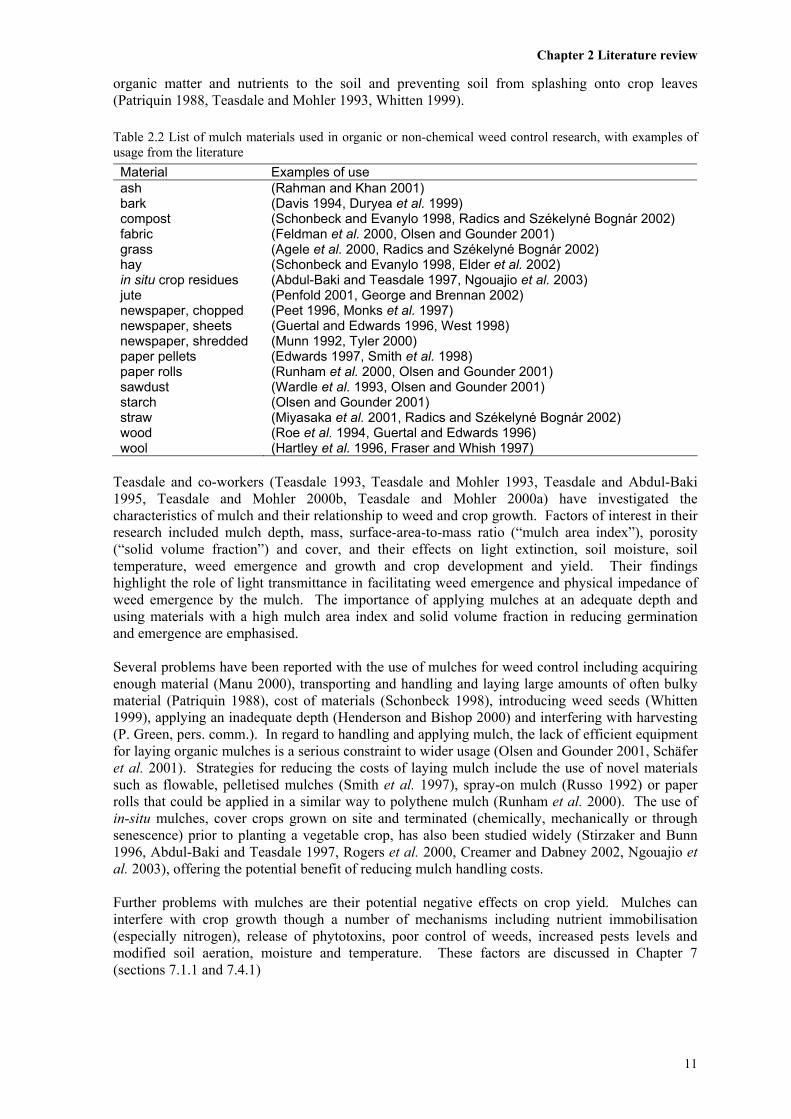
organic matter and nutrients to the soil and preventing soil from splashing onto crop leaves (Patriquin 1988, Teasdale and Mohler 1993, Whitten 1999). Table 2.2 List of mulch materials used in organic or non-chemical weed control research, with examples of usage from the literature Material Examples of use ash (Rahman and Khan 2001) bark (Davis 1994, Duryea et al. 1999) compost (Schonbeck and Evanylo 1998, Radics and Székelyné Bognár 2002) fabric (Feldman et al. 2000, Olsen and Gounder 2001) grass (Agele et al. 2000, Radics and Székelyné Bognár 2002) hay (Schonbeck and Evanylo 1998, Elder et al. 2002) in situ crop residues (Abdul-Baki and Teasdale 1997, Ngouajio et al. 2003) jute (Penfold 2001, George and Brennan 2002) newspaper, chopped (Peet 1996, Monks et al. 1997) newspaper, sheets (Guertal and Edwards 1996, West 1998) newspaper, shredded (Munn 1992, Tyler 2000) paper pellets (Edwards 1997, Smith et al. 1998) paper rolls (Runham et al. 2000, Olsen and Gounder 2001) sawdust (Wardle et al. 1993, Olsen and Gounder 2001) starch (Olsen and Gounder 2001) straw (Miyasaka et al. 2001, Radics and Székelyné Bognár 2002) wood (Roe et al. 1994, Guertal and Edwards 1996) wool (Hartley et al. 1996, Fraser and Whish 1997)
Teasdale and co-workers (Teasdale 1993, Teasdale and Mohler 1993, Teasdale and Abdul-Baki 1995, Teasdale and Mohler 2000b, Teasdale and Mohler 2000a) have investigated the characteristics of mulch and their relationship to weed and crop growth. Factors of interest in their research included mulch depth, mass, surface-area-to-mass ratio (“mulch area index”), porosity (“solid volume fraction”) and cover, and their effects on light extinction, soil moisture, soil temperature, weed emergence and growth and crop development and yield. Their findings highlight the role of light transmittance in facilitating weed emergence and physical impedance of weed emergence by the mulch. The importance of applying mulches at an adequate depth and using materials with a high mulch area index and solid volume fraction in reducing germination and emergence are emphasised. Several problems have been reported with the use of mulches for weed control including acquiring enough material (Manu 2000), transporting and handling and laying large amounts of often bulky material (Patriquin 1988), cost of materials (Schonbeck 1998), introducing weed seeds (Whitten 1999), applying an inadequate depth (Henderson and Bishop 2000) and interfering with harvesting (P. Green, pers. comm.). In regard to handling and applying mulch, the lack of efficient equipment for laying organic mulches is a serious constraint to wider usage (Olsen and Gounder 2001, Schäfer et al. 2001). Strategies for reducing the costs of laying mulch include the use of novel materials such as flowable, pelletised mulches (Smith et al. 1997), spray-on mulch (Russo 1992) or paper rolls that could be applied in a similar way to polythene mulch (Runham et al. 2000). The use of in-situ mulches, cover crops grown on site and terminated (chemically, mechanically or through senescence) prior to planting a vegetable crop, has also been studied widely (Stirzaker and Bunn 1996, Abdul-Baki and Teasdale 1997, Rogers et al. 2000, Creamer and Dabney 2002, Ngouajio et al. 2003), offering the potential benefit of reducing mulch handling costs. Further problems with mulches are their potential negative effects on crop yield. Mulches can interfere with crop growth though a number of mechanisms including nutrient immobilisation (especially nitrogen), release of phytotoxins, poor control of weeds, increased pests levels and modified soil aeration, moisture and temperature. These factors are discussed in Chapter 7 (sections 7.1.1 and 7.4.1)
Chapter 2 Literature review
12
Cover crops and fallowing
The use of cover crops (or green manures) is a common practice among organic growers (Ridgely 1996, Beveridge and Naylor 1999), being the most common soil fertility management practice (72%) reported in a survey of organic farmers in the USA, and the fourth most common weed control method (58%) (Walz 1999). Cover crops provide a range of benefits in addition to controlling weeds including improving soil fertility and structure, conserving soil moisture and reducing erosion (Sustainable Agriculture Network 1998). A large variety of plant species is used as cover crops, with cereals, legumes and mixtures of these being particularly common (Gardner and Morgan 1993). Other plants used include buckwheat (Fagopyrum esculentum Moench) (Schonbeck et al. 1991) and various Brassicaceae species (Eberlein et al. 1998, Krishnan et al. 1998). A discussion of the mechanisms by which cover crops control weeds is given in Chapter 5 (sections 5.1 and 5.4) and a focus on cover crops in the Brassicaceae is presented in Chapter 6 (sections 6.1 and 6.4). Briefly, weed suppression by cover crops and their residues may be achieved by resource competition (e.g. light, water, nutrients), allelopathy, niche disruption or a combination of these factors (Sustainable Agriculture Network 1998, Liebman and Davis 2000). In order to be effective, covers ideally should be sown heavily, establish well, grow rapidly to cover the ground, have a high competitive ability to acquire resources and produce phytotoxins (Schonbeck et al. 1991, Bàrberi et al. 1998b, Masiunas 1998). Continuing weed suppression by the cover crop after termination is widely reported (Blum et al. 1997, Ngouajio et al. 2003), although some researchers report a lack of follow-on effects (Johnson et al. 1993, Masiunas et al. 1995). Issues that influence the on-going weed control effects are weed suppression during the cover crop phase, biomass produced by the cover crop, residue management strategy (e.g. incorporation, surface mulching), and the time elapsed between crops (Whitworth 1995, Smeda and Weller 1996, Teasdale 1996). The variable weed suppression by cover crops reported within trials and between studies suggests the need for further research (Lee 1995). These variations are likely to be due to soil type, soil fertility, moisture availability and weed species (de Haan et al. 1997), as well as management factors (Teasdale 1998). Green fallowing (allowing the existing weeds to grow) and bare fallowing (tilling the soil periodically between cropping phases) instead of growing a cover crop are alternative land management options between cropping phases. Green fallowing can provide increased biodiversity by allowing numerous plant species to grow, and thus provide habitat for associated fauna (Patriquin 1988) and improve soil fertility and organic matter content (Smestad et al. 2002). However, it is possible that green fallowing will cause an increase in weed seed production, depending on weeds present and the stage at which the fallow is terminated, which has negative consequences for later years (Cousens and Mortimer 1995, Jones and Medd 1997). Bare fallowing using shallow cultivation or flame weeding may allow one or more successive cohorts of weeds to emerge and be killed, leading to an overall reduction in the weed seed bank (Johnson and Mullinix 1998, Watkinson et al. 2000, Caldwell and Mohler 2001).
2.4 Organic herb and vegetable production
Intensive horticultural crop production accounts for almost 50% of organic farming enterprises in Australia. Nearly one quarter of Australian organic growers produce vegetables, one fifth produce herbs and about 4% produce either vegetables or herbs as well as other commodities (Hudson 1996). As in organic farming generally, weed management is a major problem in organic herb and vegetable production (Clark et al. 1998, Buntain 1999). However, several factors distinguish intensive horticultural cropping from other organic farming systems such as broadacre cropping, grazing or orchard enterprises, creating different conditions for developing suitable OWM systems. Distinguishing factors may include smaller cropping areas, potentially higher crop values, shorter duration crops, higher disturbance levels and higher input levels (Hartmann et al. 1988, Stirzaker 1999, ABS 2000). As a consequence, OWM strategies in herbs and vegetables are more likely to have a greater reliance on methods that are more suited to intensive production such as hand
Chapter 2 Literature review
13
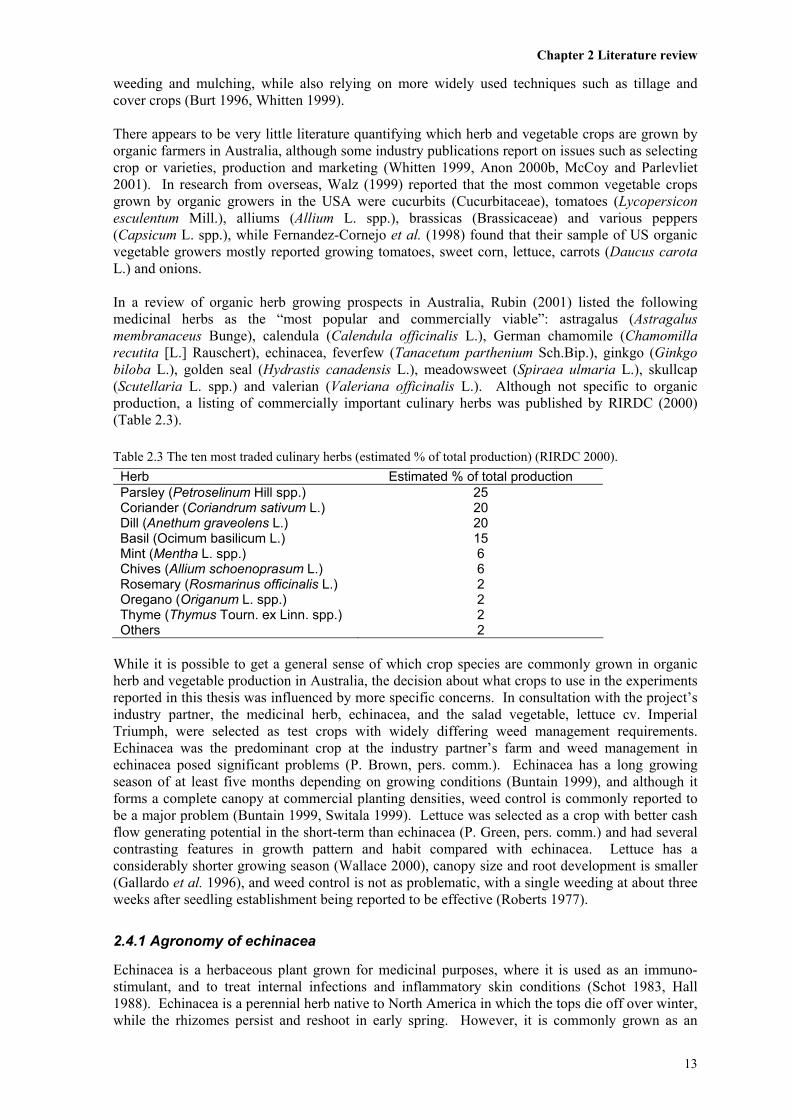
weeding and mulching, while also relying on more widely used techniques such as tillage and cover crops (Burt 1996, Whitten 1999). There appears to be very little literature quantifying which herb and vegetable crops are grown by organic farmers in Australia, although some industry publications report on issues such as selecting crop or varieties, production and marketing (Whitten 1999, Anon 2000b, McCoy and Parlevliet 2001). In research from overseas, Walz (1999) reported that the most common vegetable crops grown by organic growers in the USA were cucurbits (Cucurbitaceae), tomatoes (Lycopersicon esculentum Mill.), alliums (Allium L. spp.), brassicas (Brassicaceae) and various peppers (Capsicum L. spp.), while Fernandez-Cornejo et al. (1998) found that their sample of US organic vegetable growers mostly reported growing tomatoes, sweet corn, lettuce, carrots (Daucus carota L.) and onions. In a review of organic herb growing prospects in Australia, Rubin (2001) listed the following medicinal herbs as the “most popular and commercially viable”: astragalus (Astragalus membranaceus Bunge), calendula (Calendula officinalis L.), German chamomile (Chamomilla recutita [L.] Rauschert), echinacea, feverfew (Tanacetum parthenium Sch.Bip.), ginkgo (Ginkgo biloba L.), golden seal (Hydrastis canadensis L.), meadowsweet (Spiraea ulmaria L.), skullcap (Scutellaria L. spp.) and valerian (Valeriana officinalis L.). Although not specific to organic production, a listing of commercially important culinary herbs was published by RIRDC (2000) (Table 2.3). Table 2.3 The ten most traded culinary herbs (estimated % of total production) (RIRDC 2000). Herb Estimated % of total production Parsley (Petroselinum Hill spp.) 25 Coriander (Coriandrum sativum L.) 20 Dill (Anethum graveolens L.) 20 Basil (Ocimum basilicum L.) 15 Mint (Mentha L. spp.) 6 Chives (Allium schoenoprasum L.) 6 Rosemary (Rosmarinus officinalis L.) 2 Oregano (Origanum L. spp.) 2 Thyme (Thymus Tourn. ex Linn. spp.) 2 Others 2
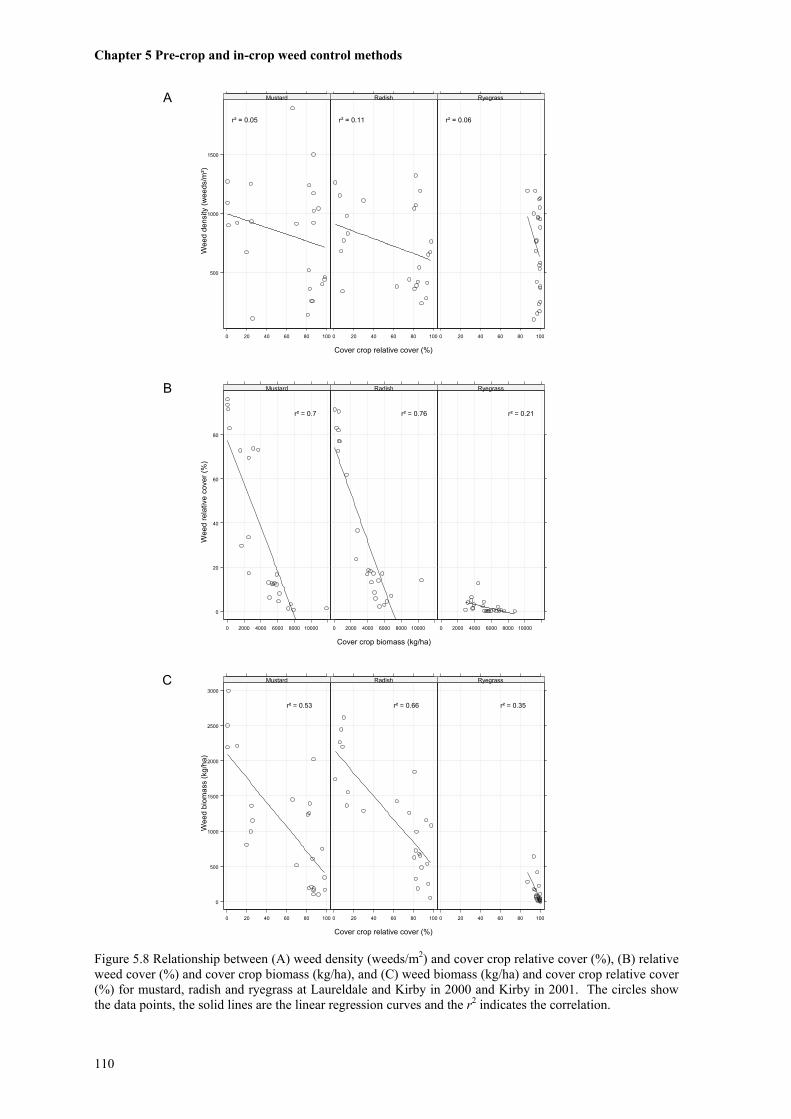
While it is possible to get a general sense of which crop species are commonly grown in organic herb and vegetable production in Australia, the decision about what crops to use in the experiments reported in this thesis was influenced by more specific concerns. In consultation with the project’s industry partner, the medicinal herb, echinacea, and the salad vegetable, lettuce cv. Imperial Triumph, were selected as test crops with widely differing weed management requirements. Echinacea was the predominant crop at the industry partner’s farm and weed management in echinacea posed significant problems (P. Brown, pers. comm.). Echinacea has a long growing season of at least five months depending on growing conditions (Buntain 1999), and although it forms a complete canopy at commercial planting densities, weed control is commonly reported to be a major problem (Buntain 1999, Switala 1999). Lettuce was selected as a crop with better cash flow generating potential in the short-term than echinacea (P. Green, pers. comm.) and had several contrasting features in growth pattern and habit compared with echinacea. Lettuce has a considerably shorter growing season (Wallace 2000), canopy size and root development is smaller (Gallardo et al. 1996), and weed control is not as problematic, with a single weeding at about three weeks after seedling establishment being reported to be effective (Roberts 1977).
2.4.1 Agronomy of echinacea
Echinacea is a herbaceous plant grown for medicinal purposes, where it is used as an immuno-stimulant, and to treat internal infections and inflammatory skin conditions (Schot 1983, Hall 1988). Echinacea is a perennial herb native to North America in which the tops die off over winter, while the rhizomes persist and reshoot in early spring. However, it is commonly grown as an
Chapter 2 Literature review
14
annual (Figure 2.1) or short-term perennial (up to three or four years) horticultural crop. When grown as an annual crop and transplanted in autumn or spring, echinacea has a long growing season of between five and 10 months, depending on growing conditions (Switala 1999). When transplanted as seedlings, echinacea has an initial period of very slow growth lasting about two to three months, after which the growth rate accelerates and canopy closure may be achieved at about 3.5 months (P. Green, pers. comm., Buntain 1999). Echinacea’s root system is comprised of several rhizomes (10 – 20 mm diameter) with numerous smaller lateral and fibrous roots (Butler 1997). The roots are the most sought after by herbalists, with a higher concentration of active compounds, although the flowering tops also harvested and sold (Switala 1999).
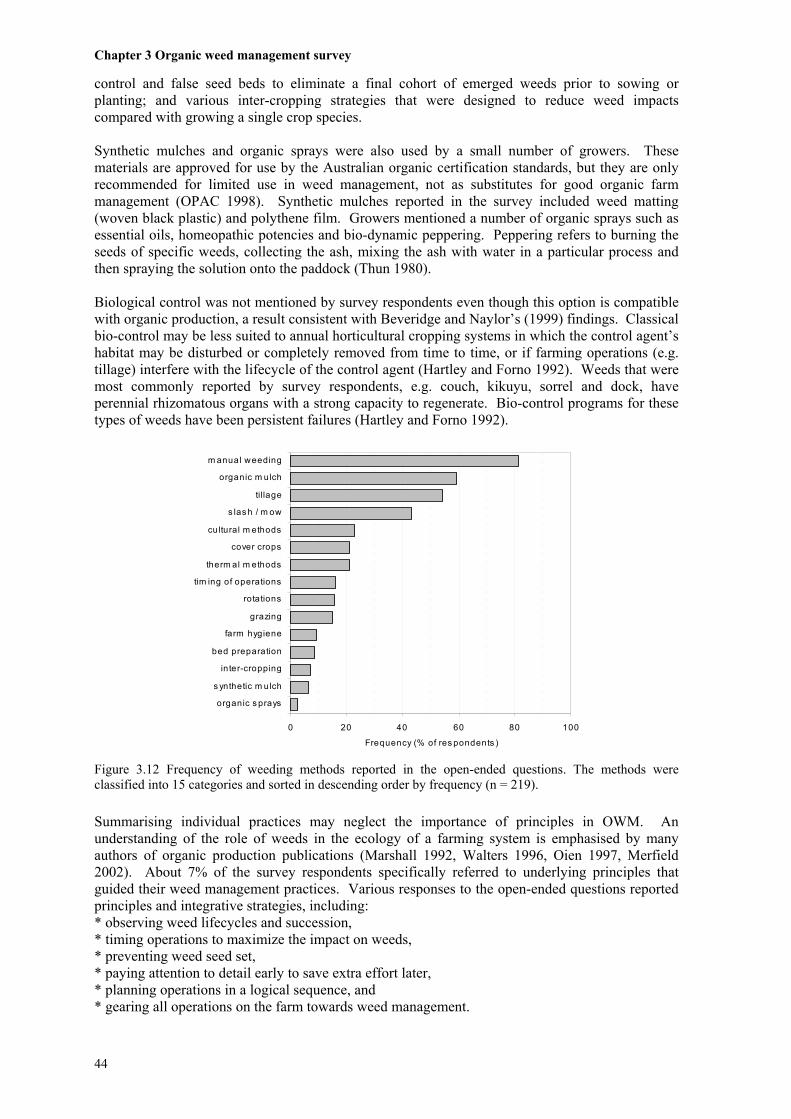
Figure 2.1 Organic echinacea (Echinacea purpurea Moench. [L.]) crop grown in the New England region of New South Wales, Australia. Weed control is commonly reported to be the biggest problem in echinacea production, and non-chemical weed control methods in particular are highly sought after due to the demand by processors for raw product that is free from biocide contamination (Galambosi 1993, Buntain 1999, Switala 1999). Inadequate weed control early in the growing season may lead to almost complete crop losses (P. Brown, pers. comm.). Planting into a weed-free bed is important, as is the use of transplants (rather than direct seeding) to hasten crop growth and canopy development (Whitten 1999). Maintaining a weed-free bed until canopy closure is very labour intensive, and the combinations of mulching and hand weeding or tillage and hand weeding are usually recommended (Douglas 1993, Butler 1997, Switala 1999, Whitten 1999). Costs associated with weed management in echinacea range from $4,300 (Switala 1999) to $5,240/ha (Butler 1997).
2.4.2 Agronomy of lettuce
Lettuce is a common salad vegetable grown in Australia and overseas. Several types of lettuces are available; crisphead, butterhead, cos (or romaine) and non-heading (or leafy) varieties (Hartmann et al. 1988). Lettuce grows well in temperate climates (Kinsela 1985), with summer production limited to areas with lower temperatures, such as those at higher elevations (Hartmann et al. 1988) (Figure 2.2). The crop does not tolerate frost or high temperatures, with the latter being associated
Chapter 2 Literature review
15
with premature flowering or bolting (Hartmann et al. 1988). A further discussion of the mechanisms of bolting is presented in Chapter 7 (sections 7.1.2 and 7.4.1).
Figure 2.2 Organic lettuce (Lactuca sativa L.) crop grown in the New England region of New South Wales, Australia. Lettuce has a short growing season, commonly reaching maturity in about six to 10 weeks from sowing, depending on the type, with transplants requiring less time in the field (Kinsela 1985, Wallace 2000). It grows quickly from transplanting to harvest, but does not reach canopy closure across the whole planting bed due to the small size of the mature plants and planting densities commonly used (Titley 2000). Although Roberts (1977) found that effective weed control in conventional lettuce production could be achieved with a single weeding without soil disturbance three weeks after 50% crop emergence, he also reported that the presence of weeds at moderate (or greater) densities throughout the growing season led to almost complete crop loss (Roberts 1977). Others studies have also found that lettuces are poor competitors and vulnerable to inundation by weeds (Grundy et al. 1999a). In organic lettuce production, weeds are reported to be of less concern than pest, disease and fertility management (Davies 2001). Indirect weed management methods suggested in the literature include using transplants rather than seed to reduce the effects of weed competition (Titley 2000) and growing cover crops prior to a lettuce crop (Schonbeck et al. 1991, Ngouajio et al. 2003). Direct weed control during the cropping phase is commonly achieved with hand weeding (Lampkin 1990) and tillage (Schonbeck et al. 1991, Bleeker and van der Weide 2000). Lampkin (1990) notes that the higher value of salad vegetable crops such as lettuce make the increased labour costs justifiable. An estimate of costs associated with managing weeds in organic lettuce production was not identified, although some estimates in Australia are in the order of 30 – 50% of total production costs for intensive horticulture generally (E. Wynen, pers. comm.), and possibly as high as 70% (Eggins 1998). In conventional lettuce production, Henderson and Bishop (2001) indicated that weed control remains a significant proportion (about 20%) of pre-harvest variable costs.
2.5 Summary
Organics is a small but growing part of agriculture in Australia and internationally. Industry development has been achieved by farmers and farmer groups, essentially without financial and research support from government or business organisations. Rapid growth in recent years has created an influx of new, less experienced growers and increased the demand for information about organic farming practices.
Chapter 2 Literature review
16
Weeds are a major constraint in organic agriculture and failure to effectively manage weeds, especially during the conversion period to full organic status, can cause severe crop losses and threaten the financial viability of farms. The expensive, labour intensive nature of weed management is a key aspect of the problem faced by organic herb and vegetable growers. However, very little research on weed management in organic herb and vegetable production has been carried out in Australia. A growing body of overseas research on OWM has been investigating several key weed control methods such as tillage, flame weeding and cover crops, and determining the impact of organic practices on weed population dynamics. Some of this research seeks to compare the relative effectiveness of different methods (e.g. tillage versus mulch) or different applications of a certain method (e.g. disc plough versus chisel plough), while other research has sought to understand the mechanisms by which various methods are able to control weeds. The findings are often subject to variation due to site- and crop-specific conditions and the broader economic context. There is also a lack of information about current organic industry practices in Australia, the effectiveness of methods used to manage weeds, and the cost effectiveness of commonly used weed control techniques in differing circumstances. Much of the knowledge about OWM resides with experienced organic farmers and this information is circulated within the industry organisations. However, the wider lack of readily available information is an impediment to industry development. Therefore, there is a need to document the current OWM principles and practices in Australia and to evaluate the efficacy and cost effectiveness of commonly used weeding methods. Associated with the need for information about OWM, there is a lack of information about the crop species commonly grown in organic herb and vegetable production and the species of weeds commonly encountered. This lack of data can hinder attempts by industry organisations and funding agencies to develop relevant research priorities for organic growers (Wynen 1992). In light of the knowledge gaps in the literature, the issues of farmer perceptions and behaviour regarding OWM, and the agronomic and economic effectiveness of OWM methods were investigated and are reported in the following chapters of the thesis. By developing a better understanding of the current knowledge about OWM and testing some of the weed management practices in a particular local setting, it is possible to provide information to less experienced organic growers (and interested conventional growers) about the benefits and limitations of a range of organic weed control methods, thereby assisting them with decisions about what techniques are suitable to their situation. Arising from the descriptive and applied research sections of the project, a number of issues relating to the effects of cover crops and mulches on weed crop growth are explored in more detail in the final experimental chapters.
17
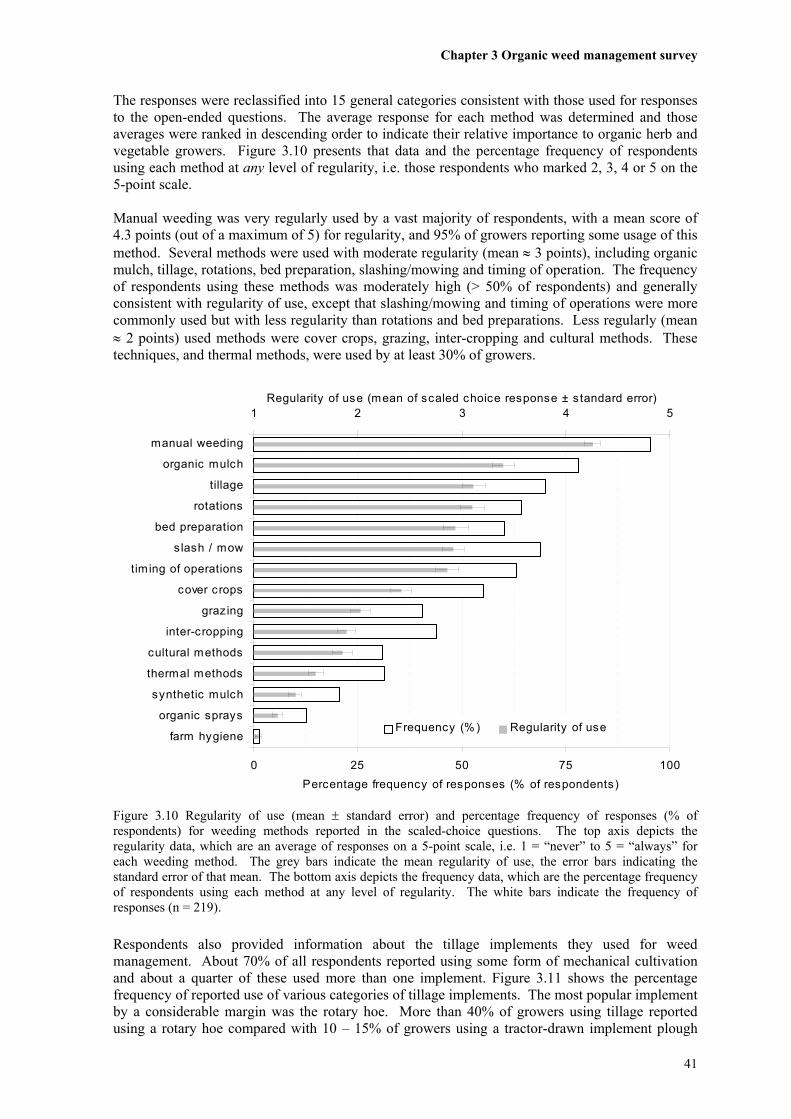
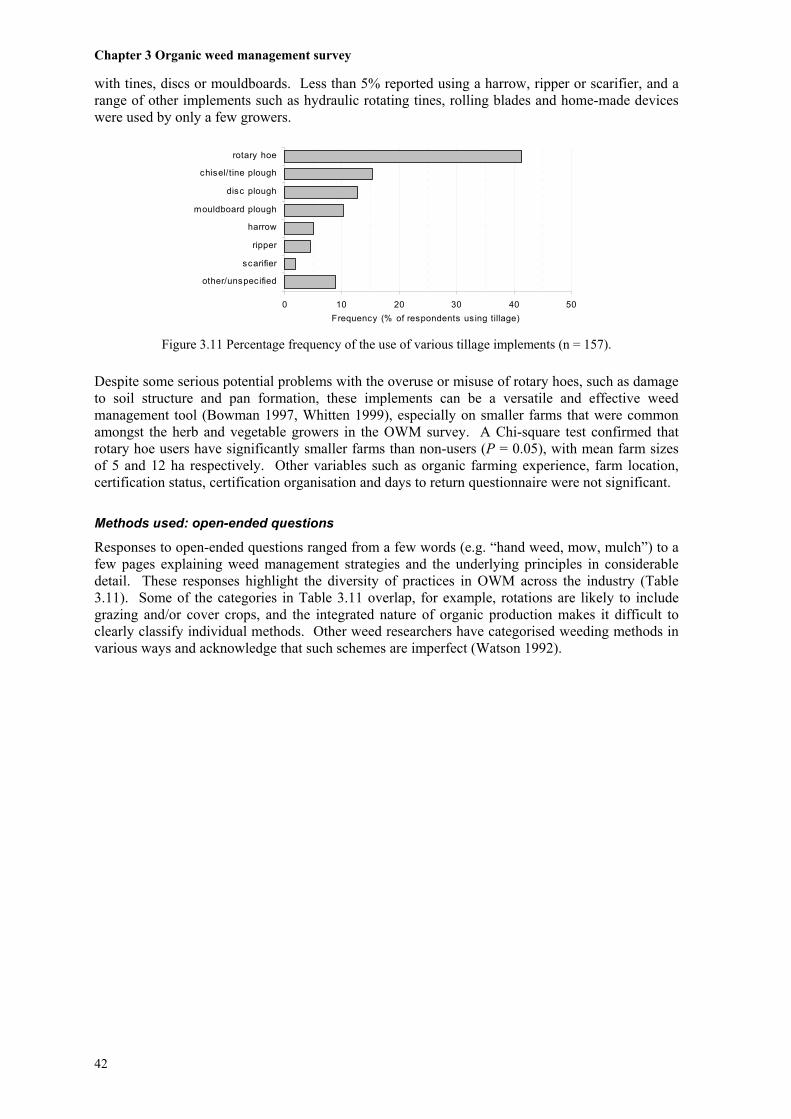
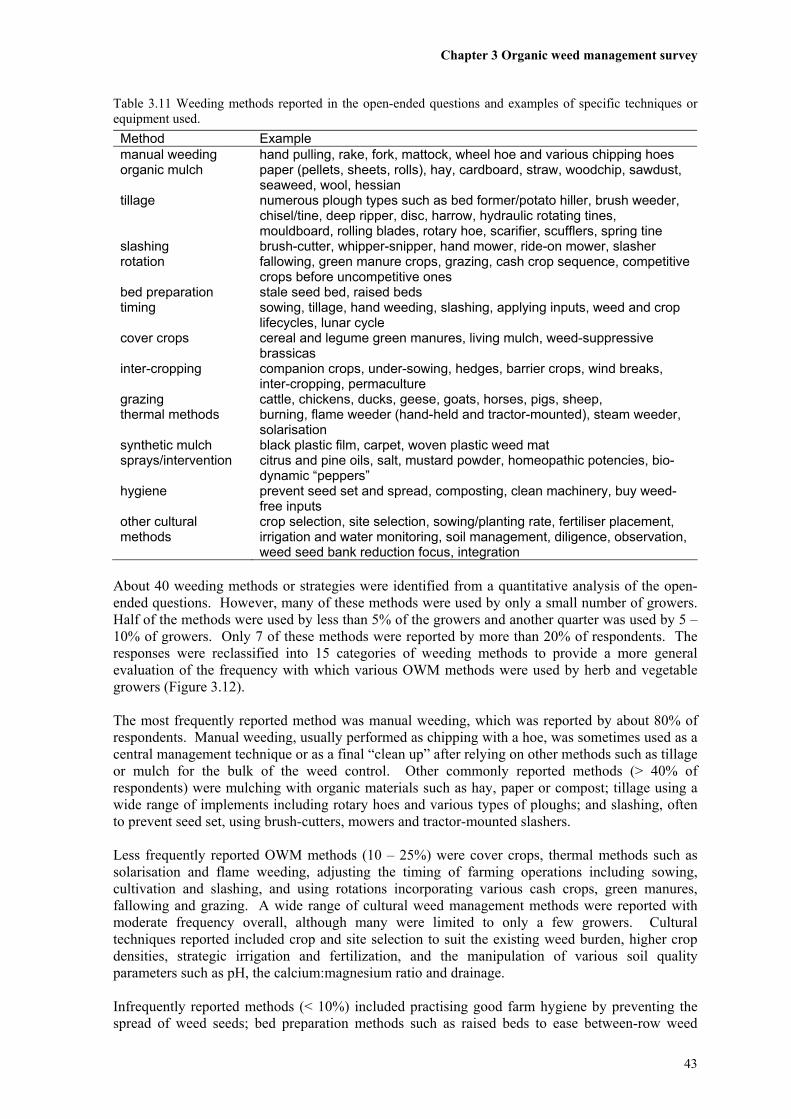
Chapter 3 Organic weed management survey
3.1 Introduction
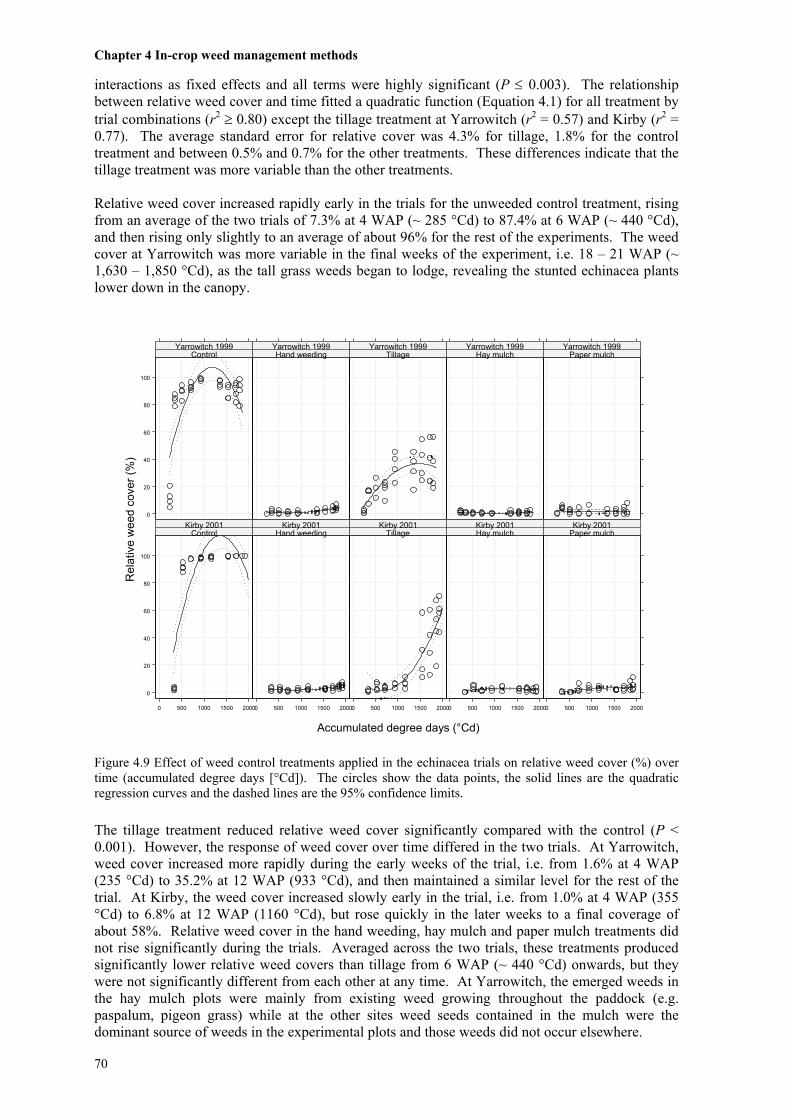
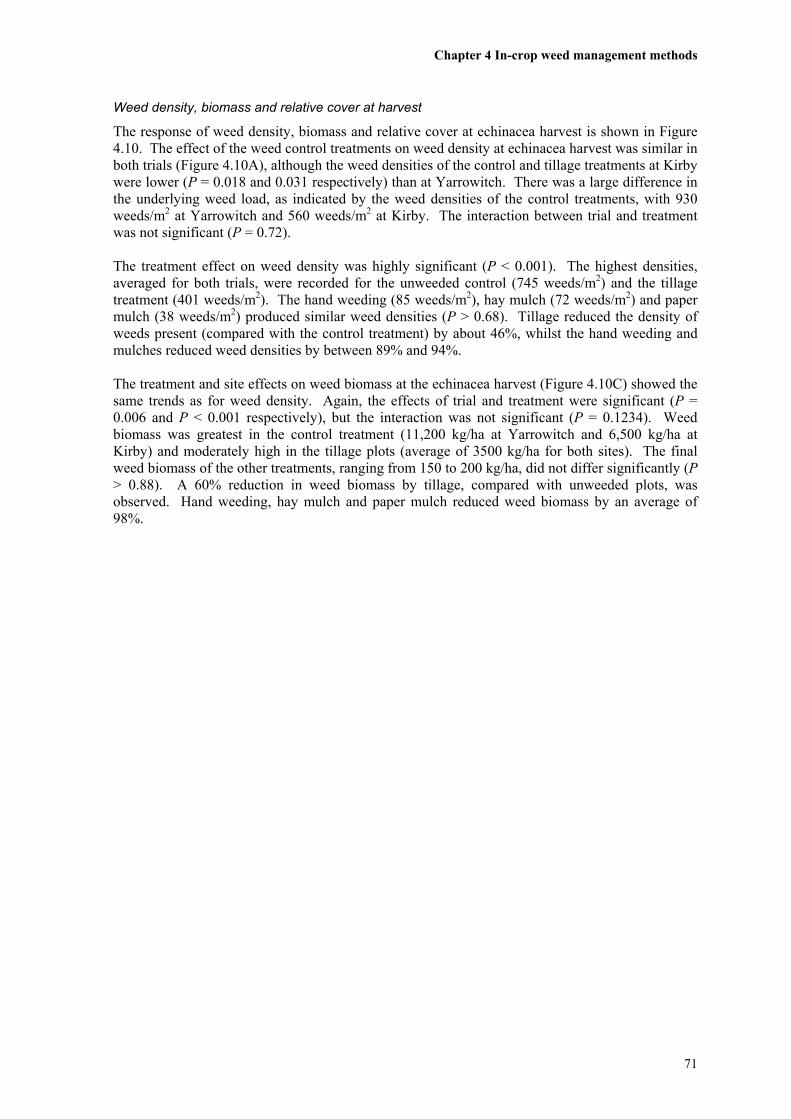
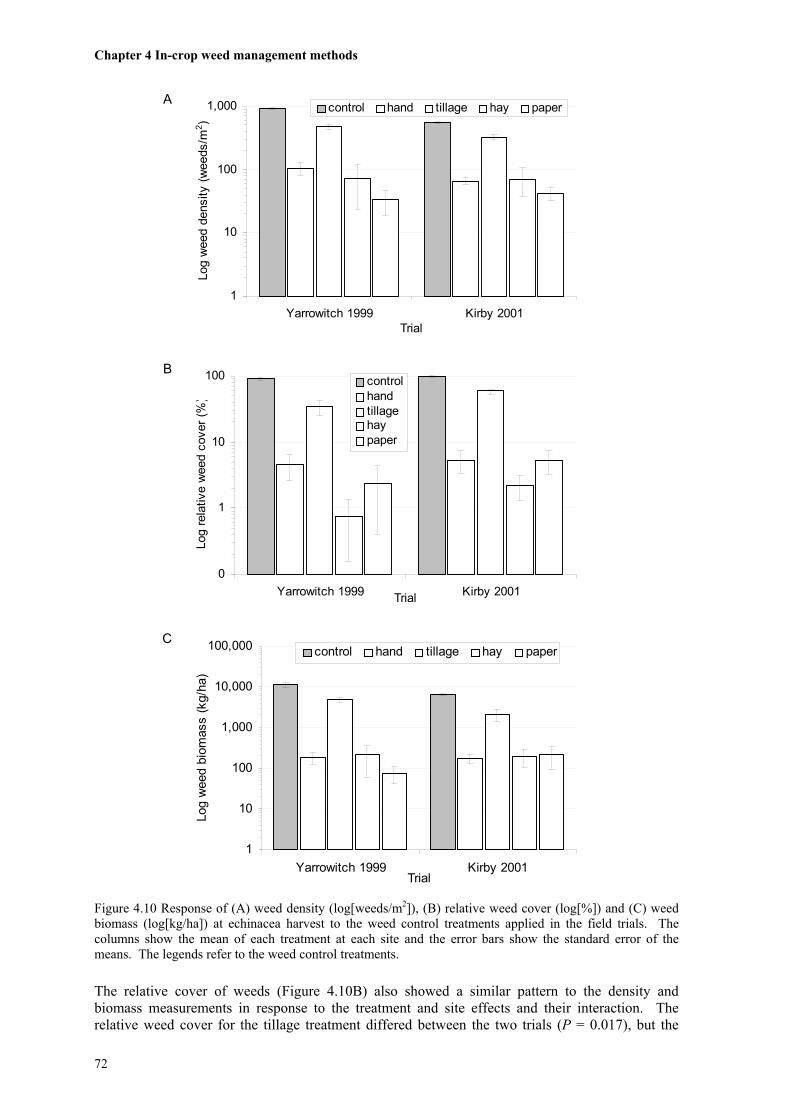
3.1.1 Context of the survey
The demand for relevant and practical information about organic farming practices is likely to become greater as more growers enter the industry (Hudson 1996), presumably with little or no experience in commercial organic production. However, numerous reports in Australia (Dumaresq 1997, Penfold 1997, Simmons and Newman 2000) and overseas (Groeneveld et al. 1997, FAO 1999, Rahman 1999, Walz 1999) state that institutional organic research and extension is poorly developed, with relevant information difficult to obtain. Organic farmers have been reluctant to use traditional information sources such as government agencies and commercial agronomists for a range of reasons such as unavailability of appropriate information and ideological conflict (Anderson 1990, Walz 1999). Instead, information has often been sought from selected sources overseas (Balfour 1948, Steiner 1974, Fukuoka 1978, Coleman 1989). Knowledge about organic agriculture in Australia exists, although it is not always readily available to newer organic growers. Organic farmers have been managing commercially successful farms in Australia for at least two decades and longer overseas, often without institutional support. These experienced farmers have individually and collectively, through a network of certification organisations and other growers' groups, developed a pool of knowledge about many aspects of organic production (Derrick 1997, Wynen 1998, FAO 1999). To gain a better understanding of organic production methods, communication with those who already have expertise is advisable (Wynen 1998) Weed management is widely acknowledged as a major constraint in organic agriculture, as discussed in Chapter 2. The lack of relevant, accessible information and concerns about the impact of weeds on production have highlighted the need for further research and extension of OWM practices. Experimentation (Bond et al. 1998a, Melander 1998b, Rasmussen 1998, Baerveldt and Ascard 1999) and reviews of existing literature (Ascard 1990, Marshall 1992, Köpke 1999) have been used for this purpose. Another technique for obtaining information about organic production methods is the use of surveys to capture the experiences and ideas of current growers. Several surveys of organic growers have been carried out overseas, especially in the USA, but also in Europe. These surveys consisted of both mail surveys (Table 3.1) and interviews (Peacock 1990, Brophy et al. 1991, Lockeretz 1995, Ridgely and Van Horn 1995, Lockeretz 1997, Burton et al. 1998, Liebig and Doran 1999, Kozower 2000, Nilsson et al. 2000). A smaller number of organic grower surveys have been reported in Australia including mail surveys (Table 3.1) and interviews (Wynen 1988b, Derrick 1992, Moxham 1992). Some of these surveys refer to the issue of weed management, however, only a few reports specifically seek information about OWM methods and present quantitative data about the weed control methods used (Beveridge and Naylor 1999, Walz 1999, Burnett 2001). The survey of Australian organic broadacre growers by Burnett (2001) has only been published in a rudimentary form in industry publications with very limited data. The report by Walz (1999) presents data from a survey of over 1,000 organic growers in the USA. In addition to reporting that weeds are the most important concern or research issue for organic growers, Walz also provided information about the most commonly reported weeds and the most frequently used methods for controlling weeds organically. In Beveridge and Naylor’s (1999) survey of organic farmers in the United Kingdom, respondents were predominantly involved with grain production, with a smaller number of potato growers and graziers responding. They reported on weeds encountered, methods used to manage weeds and perceived effectiveness of those methods.
Chapter 3 Organic weed management survey
18
A range of surveys of conventional growers have been published, including several focused on weeds and weed management (Table 3.1). Herbicides are the predominant method of weed control reported, although a number also refer to other weed management options such as grazing, tillage, timing of sowing, crop rotations, biological control, hand weeding and enhancing crop competitiveness (Martin et al. 1988, Sindel and Michael 1988, Jones et al. 2000). One report, based on interviews with graziers, states that respondents "considered they did not have suitable alternatives" to the continual use of the same herbicide (Ayres and Kemp 1998). Many of these reports provide information about grower’s attitudes to weeds and the methods they use to manage them, with herbicides predominating. Several authors suggest that weed problems are not improving or may be worsening (Lees and Reeve 1994, Sindel 1996, Ayres and Kemp 1998, Jones et al. 2000). This general lack of success in longer-term weed control may be related to the observation that weeds are merely suppressed sufficiently to prevent crop yield loss, but weed populations are not depleted over time (Medd 1997). Table 3.1 Summary of response rates for mail surveys related to weed management and/or organic practices identified in the literature. The distribution method “inserts” refers to the practice of inserting survey materials in newsletters or similar and mailing to all persons or groups on the newsletter mailing list.
Response rate (%)
Type of farming system
Country in which survey conducted
Distribution method Reference
100 conventional Australia direct contact (Dellow and Seaman 1987) 80 organic Australia mail (Rickson et al. 1997) 74 conventional Australia mail (Sindel and Michael 1988) 70 low-input USA mail (Anderson 1990)
70 conventional USA mail? (Fernandez-Cornejo et al. 1998)
65 conventional USA mail (Stoller et al. 1993) 63 conventional Australia mail (Johnson 2000) 60 conventional Australia mail (Rickson et al. 1997)
57 organic United Kingdom mail (Beveridge and Naylor 1999)
53 conventional USA mail (Anderson 1990) 53 organic USA mail (Duram 1999) 51 conventional Australia mail (Trotter and Sindel 1999)
< 50? organic Australia insert (Simmons and Newman 2000)
48 conventional Australia mail (Sindel 1996) 46 organic Australia mail (Hudson 1996) 46 organic New Zealand mail? (Rahman 1999)
43 (56/30) organic Australia mail/insert † 41 organic Austria mail (Eder and Kirner 2000) 40 organic Australia mail (Anon 2000a)
35 mixed USA mail (Stivers-Young and Tucker 1999)
27 organic USA mail (OFRF 1995) 26 conventional Australia mail (Martin et al. 1988) 26 organic USA mail (Walz 1999)
23 organic Australia mail (Burnett 2001, V. Burnett pers. comm.)
20? organic USA mail? (Fernandez-Cornejo et al. 1998)
20 organic USA mail (OFRF 1993)
10 conventional Australia insert (Alemseged et al. 2001, Jones et al. 2000)
1 organic Australia insert (Geno and Geno 2001)
? mixed Australia mail (Conacher and Conacher 1982)
† The item in bold typeface refers to the survey reported in this chapter. The overall response rate is given and the response rates shown in brackets are for mailed and inserted questionnaires respectively.
Chapter 3 Organic weed management survey
19
Given the importance of successful weed management to organic growers and the current lack of readily available information about OWM in Australia, collecting such information from the knowledge base of current growers was considered to be an important task. This chapter describes a mail survey of herb and vegetable organic growers in Australia regarding their attitudes to weeds and the strategies used for managing weeds. The aims of the survey were: * to determine the range of weeding methods used by organic herb and vegetable growers in
Australia, * to determine the attitudes of those growers towards weeds, * to characterise the types of farms and farmers surveyed (e.g. by farm size), and * to identify meaningful relationships between the parameters in order to better understand why
growers use the weed control methods they do.
3.1.2 Methodological issues in mail surveys
Mail surveys are a widely used technique for collecting information from a population, or group of people (Paxson 1995). More specific sample surveys are done by mail than any other survey method, although, phone surveys are more common for surveying the general public for marketing and social research. Some of the reasons for this are the considerably lower cost, the simplicity with which they can be carried out (Dillman 1991) and the advent of new information technologies that enable ready access to mailing lists and word processing programs (Axford et al. 1997). Despite the apparent ease of conducting surveys, there are numerous difficulties that may be encountered in designing and conducting a survey, some which may not become apparent until the survey responses have been returned and analysed (Foddy 1995, Rea and Parker 1997, Pannell and Pannell 1999). These limitations vary in the extent to which they can be overcome. Important considerations in the design of survey questions include constructing intelligible, relevant and unambiguous questions; avoiding contextual influences by logical sequencing of questions, avoiding (or providing) clues to the desired type of response; providing sufficient options in closed or limited-choice questions; and thoroughly testing drafted questionnaires in one or more pilot studies and refining, adding or removing questions as necessary prior to distributing the final survey (Dillman 1978, Foddy 1995, Rea and Parker 1997). Mail surveys have been criticised for being too general and descriptive (Derrick 1997), and that they yield variable and unreliable responses (Pannell and Pannell 1999). While those criticisms are often valid, careful survey design and implementation can improve the quality of the data, and, in the context of little or no existing information on a particular topic, a mail survey may be the most cost effective method of gathering information from a large and widely dispersed target population. Phone surveys or focus groups may improve the response rate and reduce measurement error, but the time and cost required to sample in that way are considerably greater (Pannell and Pannell 1999). Four important sources of error in surveying are described by Dillman (1991). These are non-response error, non-coverage error, measurement error and sampling error. They are now discussed individually. Non-response error
Non-response error, when some members of the sample population do not respond, is the most common source of error to receive attention from researchers (Dillman 1991), because the response rate is generally inversely proportional to non-response error, and a higher response rate usually means that the results are more representative of the whole target population. Many techniques have been devised to increase response rate including effective cover letters, personalisation, assurances of confidentiality, incentives (e.g. offering a prize), pleasant typographic and graphic design standards, printing the questionnaire on coloured paper, prior notification, reply-paid envelopes, follow-ups (i.e. subsequent mail-outs of the survey materials to survey recipients who had not responded within a set period, usually 4 – 6 weeks), brevity, minimal complex questions and avoiding sensitive or confidential questions (Hox et al. 1984, Dillman 1991, Dillman et al.
Chapter 3 Organic weed management survey
20
1993, Paxson 1995, Dillman et al. 1996, Maynard 1996, Hare et al. 1998). Research on the effects of separate techniques on response rates are contradictory and inconsistent, apart from follow-ups and financial incentives (Dillman 1991). Using Dillman's (1978) Total Design Method, which systematically incorporates most of the survey design features listed above, response rates typically reach 50 – 70% for general public surveys, and 60 – 80% for more homogenous groups where low education is not a characteristic of the population (Dillman 1991). Other researchers suggest that expected response rates are more likely to be in the order of 35 – 50% (Jones et al. 2000) or even 30% or less (Pannell and Pannell 1999). A summary of response rates for mail surveys of primary producers identified in the literature is given in Table 3.1, with the response rate for the OWM survey, reported in this chapter, shown in bold typeface. In general, surveys in Table 3.1 yielding a response rate greater than 50% used follow-ups (Sindel and Michael 1988, Anderson 1990, Rickson et al. 1997, Trotter and Sindel 1999) or had small sample size (< 100 responses) with a narrowly targeted population (Duram 1999, Johnson 2000). Low yielding surveys generally did not use follow-ups adequately or at all, targeted geographically dispersed populations, were distributed by inserts rather than direct mail-out or were lengthy and complex. Response rates for surveys targeted at organic growers tend to be lower than surveys targeted at conventional growers. This may be related to the skill and experience of researchers conducting the surveys, the diversity of the target populations, availability and ease of access to well defined subsets of the primary industry sector and differences in the willingness of survey recipients to co-operate with institutional researchers. Non-response bias may be evaluated by comparing responses between respondents to a mail survey and non-respondents contacted later by phone, or by assessing differences between early and late responders, assuming that late responders are not dissimilar to non-respondents (Rowan and White 1994, Anderson et al. 1998). Non-coverage error
Non-coverage error, is the exclusion of members of the target population from the sampling (Dillman 1991). Walz (1999) reports that her survey was targeted at certified organic growers and that by utilizing the mailing lists of certification organisations in the USA, 90% of the country's organic growers were included in the sampling frame. She also notes that the organisations varied in the access they provided to their membership lists, including some which provided entire lists, some providing partial lists and others which did not want to participate at all. Anecdotal reports by Australian researchers have confirmed this variability in access to Australian certification organisations. Measurement error
Measurement error is the discrepancy between the observed variable and the corresponding response. Respondents are unable or unwilling to provide accurate answers, commonly due to poor question design and/or poor survey implementation (Dillman 1991). Errors of this type may arise in a range of situations including when respondents interpret words or phrases differently, guesses or estimates are required, previous questions influence later answers, respondents provide answers which may please or impress the researchers but which aren't necessarily true, or they contrive their responses to sensitive questions (Foddy 1995). Weed recognition is relevant to this survey, and other researchers have reported that accurate weed identification by respondents was problematic (Trotter and Sindel 1999). Sindel and Michael (1988), however, reported that only a very small number of respondents to their survey of conventional farmers regarding fireweed (Senecio madagascariensis Poir.) had trouble recognizing the weed, and those respondents farmed in a region in which the weed was not common. In the primary production sector, the individual experiences of farmers are often quite varied (Crosby et al. 1993) and strongly differing mindsets may polarise responses (Howden et al. 1998).
Chapter 3 Organic weed management survey
21
Differences in response may be due to demographic and situational factors such as age, gender, education, farming experience, type of farming system used and debt:equity ratio (Black and Reeve 1996). These relationships between response variables were explored using a range of statistical methods including t-tests (Rowan and White 1994, Lockeretz 1997), Chi-square tests (Rowan and White 1994, Lockeretz 1997), linear regression (Rowan and White 1994, Hayman and Alston 1999), logistic regression (Anderson 1990, Lacey et al. 1993), cluster analysis (Anderson 1990, Cox et al. 1993, Lees and Reeve 1994) and principal component analysis (Black and Reeve 1996). Strategies for minimising error in the data entry process, such as reviewing the survey responses for accuracy and during and after data entry, have also been reported (Rowan and White 1994, Walz 1999). Sampling error
Sampling error occurs as a result of heterogeneity amongst the surveyed population (Dillman 1991) or by the use of an incorrect sampling frame (Stopher and Meyburg 1979). In general the larger the sample size, the smaller the sampling error (Walz 1999). Sampling error is similar to random error in an agronomic field trial and it cannot usually be completely eliminated. The variation that exists between the sample and the whole population can be statistically estimated using confidence intervals (Rea and Parker 1997).
3.2 Methods
3.2.1 Survey design
The sample population for the survey was drawn from the membership lists of three of the certifying organisations operating in Australia, the Biological Farmers of Australia (BFA), the National Association for Sustainable Agriculture, Australia (NASAA) and the Organic Herb Growers of Australia (OHGA). All other certifying organisations were invited to participate but declined. Given the focus on herb and vegetable production in the research project generally, the survey was targeted at growers of those commodities. BFA provided a list herb and vegetable growers from their membership database, and OHGA membership was almost entirely based on herb and vegetable growers (D. Andrews. pers. comm.). However, NASAA was only able to provide a limited list of general members willing to respond to surveys (R. Dyke, pers. comm.). A small number of other organic growers also returned questionnaires after becoming aware of the survey through colleagues, the media and the internet. A summary of the population sampling criteria, distribution method and number of surveys sent to growers is presented in Table 3.2. Table 3.2 Summary of the population sampling criteria, distribution methods and number of surveys sent to growers. Organisations Sampling criteria Distribution method Surveys
sent BFA vegetable or herb grower direct mail-out with follow-up 129 NASAA subset of “interested growers” direct mail-out with follow-up 212 OHGA all newsletter recipients newsletter inclusion 400 Others self-selected (e.g. media, internet) direct mail-out upon request 21 Total 762
A draft questionnaire and cover letter were prepared and subjected to an initial evaluation study to assess relevance, ambiguity, comprehensiveness and layout. This pilot study sought comments from ten people directly involved with production, research and extension in the organic community, and two academic researchers with experience in the design and conduct of farmer surveys. Feedback from the reviewers was incorporated into a final version of the questionnaire and cover letter. The survey sought general information about the farming enterprise as well as details about attitudes to weeds and strategies used to manage weeds. A combination of numerical,
Chapter 3 Organic weed management survey
22
open-ended and scaled-choice responses was used (Table 3.3). The cover letter, printed on official University stationery, described the overall project, the purpose of the survey and emphasised that the results would be confidential. The questionnaire was distributed with the cover letter, a reply-paid return envelope and an optional form for people interested in receiving information about the results. As an incentive to reply, a prize of a 1-year subscription to a popular national sustainable agriculture newspaper was offered. The survey was announced in the newsletters of all participating certification organisations and in other industry publications as the surveys were being distributed. Copies of the cover letter and questionnaire are provided in Appendix 2. The survey was either mailed directly to BFA and NASAA growers on 28/9/98 or included in a newsletter posted to OHGA members by the certification organisation (19/10/98). A follow-up mail-out was sent after 6 weeks (9/11/98) to BFA and NASAA members who had not responded to the first mail-out. The materials sent in the follow-up were the same as the first mail-out, although the cover letter was slightly modified to explain the reason for a second mail-out and to further encourage recipients to complete and return the questionnaire. The survey process is summarised in Figure A1 in Appendix 2.
3.2.2 Data processing
The raw data in the survey responses were entered into a relational database program (Microsoft Access 2000). All variables were checked for errors by plotting for outliers and by selecting a random sample of 50 questionnaires (15% of returned surveys) and confirming accurate data entry. A range of data editing operations was also carried out to standardise the variables, such as combining “acres” and “hectares” into “farm size”. A list of questions presented in the survey questionnaire and variables derived from those questions is given in Table 3.3. Two approaches were used to present the breadth and complexity of information reported in the open-ended questions about weed management strategies. The first quantitative approach was to prepare a matrix of growers and reported weeding methods, where each cell in the table had a "yes" or "no" in it. This matrix contained responses for the 42 categories of weeding methods that were identified. These methods were reclassified into 15 categories that were more consistent with the scaled-choice questions to enable a comparison of the two question types and also to help satisfy the statistical requirements of the Chi-square test regarding adequate numbers of observations (Rea and Parker 1997). The second technique for representing the open-ended questions was qualitative. A selection of salient quotes from the surveys is presented, conveying information about attitudes to weeds and how specific methods were used. The following information is given at the end of each quote to provide a general idea of the type of grower making each comment: main type of crop(s) grown (i.e. herb and/or vegetable), number of years experience with organic production and State or Territory in which the farm is located. Matrices were also constructed for the open-ended questions about crops grown and weeds encountered to facilitate a quantitative analysis. These matrices contained fields such as reported crop or weed name, botanical classification (family, genus, species), growth habit and perenniality. Botanical names were inferred from common names by consulting a number of reference books on weeds (Auld and Medd 1987, Hussey et al. 1997, Lazarides et al. 1997, TPNP 2003) and crops (Hartmann et al. 1988, CNCPP 2001, TPNP 2003). The scaled-choice questions about weed management gave respondents the opportunity to indicate the regularity with which they used a number of listed weeding methods. A 5-point scale was used, ranging from 1 = "never" to 5 = "always". Those responses were processed by classifying the listed weeding methods, plus the methods reported in the "other" section, into 15 categories. The perceived success and expense of those methods were also measured on a 5-point scale, ranging from "very poor" to "very good" and "not expensive" to "very expensive" respectively. The scaled-
Chapter 3 Organic weed management survey
23
choice responses were averaged for all respondents and the methods were ranked in descending order by regularity of usage. Table 3.3 Summary of questions presented in the survey questionnaire and derived variables used in the analyses. Survey questions * Derived variables Farm and farmer characteristics
State/Territory; town; postcode; certification status; organic farming experience; farm size; crops grown1; weeds encountered1; time spent weeding; cost of weeding
Are weeds a problem?; reasons for problem (five weed impacts listed plus "others" section provided) 2
Reasons included the weed impacts contamination, difficult/time consuming, harbour pest/disease, interference and competition/reduced yield
Weed management
Strategies used1; regularity3, success3 & expense3 of methods used (17 listed plus "other" section provided)
42-column matrix@ of OWM strategies (with yes/no response for each grower); 24-column matrix@ of OWM methods (with "others" reclassified) for each of regularity, success & expense; 6-column matrix of tillage implements (with yes/no response for each respondent)
* Survey question types: 1open ended, 2scaled (0,1,2 or 3), 3scaled (1,2,3,4 or 5) @ These matrices were reduced to 15 categories for the analyses
3.2.3 Analysis
Statistical analyses were carried out using S-Plus 2000 (MathSoft 1999a, MathSoft 1999b, MathSoft 1999c). The results for each variable were summarised using means, standard errors, medians, frequency distributions and proportions. The median provides a more robust summary than mean for non-normally distributed data (Venables and Ripley 1999), such as those encountered in the survey results presented in this chapter. The relationships between variables were analysed using the Generalised Linear Model (GLM) for logistic regression of binomial response variables and log-linear (Poisson) regression of multinomial response variables. The GLM output contained an Analysis of Deviance table with a Chi-square test for significance of the explanatory variables. The P-value is presented in the results section to indicate the level of significance, with a value of 0.05 or less regarded as significant. A goodness of fit test was conducted to ensure that the data conformed to the assumed underlying distribution by comparing the residual deviance with the underlying Chi-square distribution. When the goodness of fit test reported a significant value, i.e. ≤ 0.05, the model was considered unsuitable and the results from the GLM were not used. Linear regressions were performed using the linear model function in S-Plus. This function calculates several values of interest including an r2 value, a slope coefficient and P-values. Diagnostic plots were generated and assessed to confirm that the data fulfilled the assumptions of the model, particularly homogenous variance and normality. A non-parametric test, the Pearson's Chi-square test with Yates' continuity correction, was also used in S-Plus to detect differences between categories of respondents. The validity of this test depends heavily on the assumption that the expected cell counts are at least moderately large; a minimum size of 5 is the usual rule of thumb (Beveridge and Naylor 1999, MathSoft 1999c). S-Plus generates an error warning when this condition has not been met. Therefore, tests in which that message appeared were not used in the analyses presented. That limitation prevented general use of this test for analysing the survey data.
Chapter 3 Organic weed management survey
24
The impact of bias due to non-response error was evaluated indirectly using three methods, i.e. by comparing responses with time taken to respond, by comparing pre- and post-follow-up responses and by referring to other surveys or published materials with similar types of data (I. Reeve, pers. comm.). Firstly, the number of days taken to return the survey was compared with several response variables using 1-way ANOVA in S-Plus and, when significant differences were detected, orthogonal contrasts were used to separate the means (MathSoft 1999a). Variables thought to be prone to differences in response over time were selected. For example, a farmer reporting a high level of concern about weeds may be motivated to reply quickly, whereas a less concerned (more skilled?) grower may delay replying or not bother replying at all. The suitability of these statistical methods was confirmed using diagnostic plots (e.g. residual-fitted plots, normal quantile plots). Secondly, pre- and post-follow-up responses for growers affiliated with BFA and NASAA were compared using the Chi-square test in GLM. Thirdly, reference is made to published research and industry literature to compare the results presented here with those obtained in other similar surveys of primary producers such as Walz (1999) and the Australian Bureau of Statistics (2000). The spatial analysis of respondents was carried out using the "buffer" function in the geographic information systems program ArcView 3.1. This function creates rings around, or inside, geographic features at a specified distance from the edge of those features. Buffers were created at 25 km intervals inland from the coast of Australia and the number of respondents located within each ring was counted. A number of multivariate analyses were attempted using cluster analysis, principal component analysis and classical multi-dimensional scaling (Venables and Ripley 1999) with the intention of exploring multivariate relationships between weeding methods reported and other factors measured in the survey. However, none of the analyses yielded significant findings. Instead, a series of bivariate analyses of weeding methods (response variable) in relation to several farm and farmer characteristics (explanatory variables) was carried out using the Chi-square test in GLM (Table 3.4). Table 3.4 List of explanatory variables used in the bivariate analyses. Type of variable Explanatory variables Geographic Latitude
Longitude Demographic Organic farming experience
Farm size Certification status
Attitude to weeds Are weeds a problem? Benefits of weeds cited by respondent
This survey is referred to as the "OWM survey" to differentiate it from other surveys mentioned in the following discussion.
Chapter 3 Organic weed management survey
25
3.3 Results and discussion
3.3.1 Response rate
The initial number of responses to the survey was 305 (40%) and the follow-up mail-out yielded a further 21 responses. The final number of returned questionnaires was 326 (43%), although some respondents did not complete all the questions, or provided unusable responses to some questions. The proportion of questionnaires returned is a key indicator of survey success (Paxson 1995). Primary producer surveys in Australia have yielded a wide range of response rates (Table 3.1), influenced by several factors including relevance or importance of survey topic, characteristics of the sample population, sampling method, and survey design and implementation. Surveys using newsletter inserts to distribute questionnaires were likely to receive lower response rates (≤ 30%) (Hayman and Alston 1999, Jones et al. 2000, Geno and Geno 2001), although Simmons and Newman (2000) report an imprecise response rate of "less than 50%". The follow-up procedures recommended in the Total Design Method (Dillman 1978) were not fully implemented in this survey due to the inability to distinguish non-respondents from respondents in the OHGA sample, and the low number of returns elicited by the first follow-up of BFA and NASAA growers, i.e. 6% of BFA/NASAA survey recipients. Increased pressure to respond, such as repeated follow-ups, may reduce the quality of the response, thus reducing non-response error at the expense of measurement error (Dillman 1991, Paxson 1995). A small number of hostile comments in response to the follow-up (e.g. "the proliferation of broadacre monocultures started in universities") indicated that organic growers were unlikely to respond in much greater numbers. Negative or cynical comments about government agencies and universities have been reported in other surveys of organic growers (V. Burnett, pers. comm., Burton et al. 1998, Duram 1999, Walz 1999). Three quarters of all respondents reported herb and/or vegetable production as the dominant cropping system, providing a sample size of 219. In a survey undertaken in early 1995, Hudson (1996) received 146 responses from organic herb and vegetable growers, plus 13 mixed enterprises producing at least some herbs or vegetables. That group represented almost 40% of all responding growers. A majority of herb and vegetable growers reported full organic certification status (79%), a further 16% were either seeking certification or currently in conversion to full organic status, and the remainder were not certified (Hudson 1996). Table 3.5 shows the percentage of respondents by State or Territory in which their farm was located and the certification organisation with which they were affiliated. The questionnaires were returned from all States and Territories of Australia except the Northern Territory. Most of these growers (84%) were from the eastern mainland States of Victoria, New South Wales and Queensland and the Australian Capital Territory, with about 5% each from Tasmania, South Australia and Western Australia. Table 3.5 Percentage of herb and vegetable growers that returned questionnaires, categorised by the State in which the farm was located and the grower’s certification organisation (n = 219). Organisation NSW-ACT VIC QLD TAS SA WA Organisation total OHGA 21.9 10.5 6.4 2.7 0.5 42.0 NASAA 11.9 8.2 2.7 2.3 1.8 2.3 29.2 BFA 8.7 4.5 6.4 0.9 3.2 2.3 26.0 Other 1.4 0.9 0.5 2.8 State total 43.9 24.1 16.0 5.9 5.5 4.6 100.0
BFA members had a response rate of 55%, NASAA members 57%, and OHGA only 30%. There was a significant difference (GLM Chi-square test, P = 0.006) in the response rates between BFA/NASAA members and OHGA members, which was most likely due to the different methods
Chapter 3 Organic weed management survey
26
of distributing the surveys, including the lack of personalisation with newsletter inserts (Dillman 1978). No duplicate questionnaires were received from people with dual membership. A large proportion of responses were sent from properties in coastal Queensland and NSW (40%), central Victoria (5%) and Gippsland (4%) (Figure 3.1). Loose regional concentrations of organic farms based on similar production types have been reported previously, such as wheat in western Victoria and southern Western Australia, milk in central Victoria and a range of horticultural operations around major urban centres and along the Murray (Hudson 1996, Dumaresq and Greene 1997). A strong tendency was noted for farms to be located near the coast. About 42% of properties were within 25 km of the coast, and two-thirds were within 50 km of the coast. Less than 10% of the farms were located more than 200 km from the coast.
Figure 3.1 Geographic distribution of the survey respondents in Australia. The black dots represent the location of the respondents' properties and the grey lines indicate the distance inland from the coast in 100 km intervals Non-response error
The results of this survey may be biased against growers who were not very concerned about weeds and who may be very skilled in weed management but were not motivated to contribute to the survey. Many published surveys of primary producers do not report an analysis of non-response bias. However, Hayman and Alston (1999) acknowledged possible non-response bias in their survey of nitrogen usage by conventional farmers in the grains belt of northern NSW, stating that farmers using no or low rates of nitrogen would be less likely to reply to their survey. Reeve (2001) provides a comprehensive analysis of non-response bias in his survey of farmers throughout Australia. An indirect evaluation of non-response bias was conducted by comparing the number of days taken to return the questionnaire with the variables listed in Table 3.4. An analysis of deviance using the
Chapter 3 Organic weed management survey
27
Chi-square test in GLM detected no significant differences (P > 0.05) for all the variables. A comparison of the pre-follow-up responses and post-follow-up responses of growers who received questionnaires directly (i.e. BFA and NASAA members) identified no significant differences for all variables analysed (P > 0.15). Certification organisation membership was also compared with time to respond and was found to be highly significant (p < 0.01). Orthogonal contrasts confirmed that BFA and NASAA members returned their questionnaires sooner than OHGA members or others (P < 0.01) as would be expected due to the different distribution methods. Differences within those pairs were not significant (P = 0.61 and 0.67 respectively), implying that time to respond did not vary within a given distribution method. It may be concluded that there was little evidence for differences in responses between early and late responders, and between pre- and post-follow-up responders, and that, therefore, the responses were representative of the target population. A direct evaluation of non-respondent's attitudes, by telephone interview for example, was not undertaken. Further evaluation of the validity of specific results by comparison with other surveys is presented in the sections below. The match between findings on farm size, years of organic farming experience, crops grown and weed types reported was good. The data for weeding methods were less consistent because the classification of weeding methods and the target populations differ between surveys. Non-coverage error
The survey's sampled population would ideally include all possible organic herb and vegetable growers in Australia, however some groups of growers were not able to be included. Non-coverage error may have occurred in response to the limited access to the NASAA membership list, in which case non-sampled NASAA members would have provided different responses to the NASAA members who were included in the sampled group. A comparison of the responses of BFA and NASAA members was made using the same parameters and procedure used for testing non-response error. These comparisons showed no significant differences for all variables analysed (P > 0.41), despite the more accurately targeted sampling method used for BFA. It was assumed, therefore, that sampled NASAA members were no less representative than respondents from BFA. Another possible source of non-coverage bias was the omission of members of a bio-dynamic certification organisation that did not participate. These growers may have distinct weed management attitudes and practices compared with regular organic growers. However, some other bio-dynamic growers were also members of the participating certification organisations and were therefore included in the sampled group. Specific reference was made by some survey respondents to their bio-dynamic practices. However, these practices may be under-represented. In future surveys, a yes-or-no question about whether growers practise bio-dynamic agriculture could provide a more reliable means of differentiating such growers and, hence, their particular methods of production. A third group that was not covered by the survey was organic growers who were not affiliated with an Australian certification organisation. Numerous local organic grower groups exist in Australia, usually with non-commercial gardeners as members. Some of these people may have considerable experience with OWM that could be useful in commercial situations. Other sources of error
Several sources of potential measurement error were apparent in this survey. Interpretations of certain questions, especially those relating to money and time spent on weed management, were highly variable and therefore generally unreliable. Several growers noted that the estimate did not include labour whilst others noted that it did. The farmer's own labour may be seen as free, in contrast to payments made for casual labour, mulches or tractor fuel and maintenance. Longer-
Chapter 3 Organic weed management survey
28
term management operations (e.g. grazing, crop rotation) may not have clearly quantifiable weed control benefits and may be excluded from calculations (Crosby et al. 1993). Inferring weed scientific names from the common names provided by respondents proved problematic in a number of cases, and the item was either classified only to family (e.g. “thistles” classified as Asteraceae only) or genus (e.g. “clover” classified as Trifolium L. sp.). In a national survey, some error is likely in interpreting locally specific common names for a given weed species, as certain common names can be applied to different weed species. The difficulties faced by respondents in correctly naming weeds have been also reported by Trotter and Sindel (1999). Interpreting and categorising the data provided in the open-ended questions is potentially subjective. Respondents may use terminology differently, especially when referring to tillage implements. In a study of no-till farming in the USA, inconsistencies between a farmer's perceptions and practices were reported for corn (Zea mays L.) growers, but not for soybean and wheat growers (Uri 2000). Sampling error may have been present given the broad diversity of crops, locations and production systems reported in the survey. Obtaining a perfect representation of the OWM methods used by the target population may be more difficult with such a heterogeneous population. Broader sampling may capture further diversity of principles and practices, however it is probable that the most common attitudes and techniques were well represented in the survey results. The extent to which these potential errors occurred in the OWM survey is probably impossible to accurately quantify. However, comparisons are made in each section of the results with other published surveys, thereby providing an alternative check that the results were meaningful.
3.3.2 Farm and farmer characteristics
Farm size
The percentage frequency of reported farm sizes is presented in Figure 3.2. The organic herb and vegetable farms reported in the survey were generally small in size relative to conventional growers, but were consistent with farm sizes reported in other surveys of organic growers. A third of the properties were no more than 1 ha in size, and about 70% were 5 ha or less. Only 10% of the farms were more than 20 ha. Apart from two large properties, a 202 ha potato farm and a 426 ha mixed vegetables and grains enterprise, farm size peaked at about 60 ha. The mean farm size, 9.7 ha, was strongly skewed upwards relative to the median of 2.4 ha. The mean may give the impression that farms were about four times larger than what was reported by the median. A 1995 mail survey of organic growers reported a mean organic farm size of 219 ha, but this figure included orchards, broadacre cropping and pastoral enterprises (Hudson 1996). Broadacre and livestock farms made up 22% of the respondents, but 87% of the total reported area farmed. However, the median farm size reported in the OWM survey was very similar to farm sizes reported in several other organic surveys (Anderson 1990, Lockeretz 1995, Fernandez-Cornejo et al. 1998).
Chapter 3 Organic weed management survey
29
0
10
20
30
40
0 - 0.1
0.2 - 11.1 - 5
5.1 - 10
10.1 - 20
20.1 - 50
50.1 - 100
100.1 - 200
200.1 - 500
Farm size (ha)
Freq
uenc
y (%
of r
espo
nden
ts)
Figure 3.2 Frequency of farm sizes (ha) reported by organic herb and vegetable growers.
Farm size statistics for vegetable growers across Australia during the same period are shown in Figure 3.3 (ABS 2000). The broad categories in the Australian Bureau of Statistics (ABS) figures mask the distribution of farm sizes for about half of the population. The absence of a separate category in the ABS report for herb production also makes comparison with the OWM survey slightly complicated. However, it is clear that the size of Australian vegetable farms generally was larger than the organic herb and vegetable properties reported in the OWM survey. Almost 50% of the farms in the ABS sample were larger than the largest organic farms. The combined total area farmed organically by OWM survey respondents was 2,124 ha, which was 1.6% of the total national area of vegetable production of 130,220 ha (ABS 2000). Given the moderate non-response rate in the OWM survey, it is possible that the proportion of organic growers would be greater if a higher response rate was achieved.
0
10
20
30
40
50
60
0 - 4950 - 99
100 - 499500 - 999
1,000 - 2,499
2,500 - 24,999
Farm size (hectares)
Fre
quen
cy (
% o
f res
pond
ents
)
Figure 3.3 Frequency of farm sizes (ha) reported by vegetable growers throughout Australia (ABS 2000).
Differences in farm sizes between organic and conventional growers have been reported in overseas surveys (Anderson 1990, Lockeretz 1995, Burton et al. 1998, Fernandez-Cornejo et al. 1998), as shown in Table 3.6. The comparisons by Anderson (1990) and Lockeretz (1995) indicate that organic farms may be at least four times smaller than conventional farms. Table 3.6 Median organic and conventional farm sizes (ha) reported in mail surveys conducted in the USA. Median farm size reported (ha) Organic farms Conventional farms Reference 4 91 (Anderson 1990) 1.6 20.4 (Lockeretz 1995) < 4.9 (mean = 20) > 10 (mean = 40) (Fernandez-Cornejo et al. 1998)
Chapter 3 Organic weed management survey
30
The small organic farm sizes shown in Table 3.6 were consistent with the median farm size in the OWM survey. The small farm sizes may be due to several factors including historically small and variable markets for organic produce (Hudson 1996), the relative inexperience of individual organic growers (see below), and higher labour costs (Hudson 1996, Lockeretz 1997, FAO 1999, Brumfield et al. 2000). The higher labour costs were incurred mainly during conversion (Padel and Lampkin 1994) and often because of the needs of weed management (Nilsson et al. 2000), however these needs were not necessarily ongoing (Padel and Lampkin 1994). While many new growers entering the organic sector are likely to do so on smaller acreages, there was evidence that average farm sizes are increasing. A regression analysis using GLM of farming size against farming experience reported in the OWM survey detected a highly significant (p < 0.001) increase in farm size as the number of years experience increased. In Australia, the organic industry average has risen from about 150 ha in 1990 and 230 ha in 1995 (Hudson 1996), to approximately 4,400 ha in 2000 (Kinnear 2000b). However, several very large cattle grazing operations in NSW and Queensland, comprising about 7 million ha (Kinnear 2000), are new to the organic sector and they may account for a significant proportion of the rise in average farm size. Average organic farm sizes in Canada and the USA, countries that also have ready access to extensive grazing lands, were 81 and 136 ha respectively in 2000 (Willer and Yussefi 2001). In the European Union, average organic farm sizes have increased from 20 ha in 1990, to 24 ha in 1995 and to 28 ha in 2000, a 40% increase over the decade. Lockeretz (1995, 1997) suggests that the relative inexperience of organic farmers may mean that they have not had the time to build up large farming enterprises and that the considerably greater off-farms incomes for organic growers compared with conventional growers reduces the need or time available to run a large farm. In a survey of organic farmers in Colorado, USA, based on a more experienced group of growers (mean = 18 years), Duram (1999) reports that at least half of the respondents were interested in buying or leasing more land. A national organic grower survey in the USA (Walz 1999) found that 56% of respondents planned to increase their acreage under organic production, compared with 49% in a previous survey (OFRF 1995). Organic farming experience
The percentage frequency of reported organic farming experience is presented in Figure 3.4. The herb and vegetable growers in the survey had generally been farming organically for only a few years and appeared to be relatively inexperienced. A third of the respondents had no more than 4 years experience, and about 70% have 9 years or less. Only 10% of the growers had more than 15 years experience. The mean number of years of experience was 7.8, which was only weakly skewed upwards relative to the median of 6 years. The combined total farming experience of the respondents was 1,702 years.
0
5
10
15
0 10 20 30 40 50
Organic farming experience (years)
Fre
quen
cy (
% o
f res
pond
ents
)
Figure 3.4 Frequency of reported organic farming experience (years).
Chapter 3 Organic weed management survey
31
The level of experience reported in the OWM survey was generally consistent with that reported for organic growers in other published surveys from Australia (Hudson 1996) and the USA (Figure 3.5). Hudson (1996) reported that 44% of respondents had less than 5 years organic farming experience, and a further 34% had between 5 and 10 years experience. Compared with the results for the three Organic Farming Research Foundation (OFRF) biennial surveys (OFRF 1993, OFRF 1995, Walz 1999), shown in Figure 3.5, the OWM survey sample had more growers in the 1 – 5 and 5 – 10 year categories, but less in the other categories, indicating that the Australian sample was slightly less experienced. The findings reported by Fernandez-Cornejo et al. (1998) point to higher levels of experience amongst their sample of organic growers, however, this was quite different to the OFRF and OWM findings and may be due to different sampling methods. Fernandez-Cornejo et al. (1998) derived their sample from the database of a previously conducted US Department of Agriculture survey rather than directly from organic certification organisations.
0
10
20
30
40
50
1-5 6-10 11-15 16-20 21-30 31-40 41-50 50+
Organic farming experience (years)
Fre
quen
cy (
% o
f res
pond
ents
) OW M survey
W alz, 1999
OFRF, 1995
OFRF, 1993
F-C et al., 1998
Figure 3.5 Comparison of frequency of reported organic farming experience (years) between the OWM survey and selected US organic grower surveys. Legend: black bars = OWM survey, white bars = OFRF (1993), grey bars = OFRF (1995), dotted bars = Walz (1999) and striped bars = Fernandez-Cornejo et al. (1998).
In comparison with conventional growers, organic farmers were less experienced. In the USA, Anderson's (1990) study showed means of 8 years and 22 years for organic and conventional growers respectively, while Lockeretz reported (1995) medians of 5 years and 19 years respectively. In Australia, a mail survey of conventional wheat farmers indicated that 55% of respondents had at least 30 years experience (Hayman and Alston 1999). The report by Lockeretz (1995) also noted that many of the organic farmers were new to farming, rather than converts from conventional farming; they therefore represent a source of new ideas and new activities for rural areas. Time and cost of weed management
Questions about the time and money spent on weed management were included in the survey. Estimating these values posed a noticeable problem for respondents (e.g. "no idea"), with 22% and 44% unable to estimate time and cost respectively. When estimating the monetary value of weed management, some growers stated whether labour costs were included, while others did not. It was not always clear which farm operations were specifically related to weed management and which were not, and respondents were unlikely to evaluate time and costs using a consistent framework (Crosby et al. 1993, Pannell and Pannell 1999).
Chapter 3 Organic weed management survey
32
Growers reported spending between 0 and 6,500 person-hours/ha/year on weed management, with a median of 270 person-hours/ha/year and a mean of 600 person-hours/ha/year. Reported costs ranged from $0 to $39,000/ha/year, with a median of $400/ha/year and a mean of about $2,200/ha/year. The reported values for weed management costs were poorly correlated with farm size (r2 < 0.001), so greater spending was not simply based on a bigger farm. An experienced organic vegetable grower has reported that weed management can cost up to $10,000/ha for a cropping season (Anon 2001), and other research on herb and vegetable production has found that hand weeding alone can cost from $3,800/ha (Buntain 1999) to $7,500/ha (Melander 1998a) over one cropping season. It was assumed that the survey responses to these questions were of limited reliability and, therefore, these figures need to be treated with some caution. Nevertheless, they show that weed control is a significant cost in organic herb and vegetable production. Crops
Over 130 different commodities or groupings (e.g. "culinary herbs") were reported, from which 115 crops were recognised. The most commonly reported herbs and vegetables are shown in Table 3.7 and Table 3.8 respectively. Garlic, the most frequently reported herb, was grown on organic farms for indirect uses in addition to commercial sales. Such uses included companion planting for pest management and as an industrial crop for use in the on-farm manufacture of organically approved pesticide. Echinacea (Echinacea Moench spp.), lemon balm (Melissa officinalis L.) and chamomile (Chamomilla recutita (L.) Rauschert, Chamaemelum nobile (L.) All.) were the most widely reported medicinal herbs. Staple vegetable commodities such as tomatoes, beans (Phaseolus L. spp., Vicia L. spp. Vigna Savi spp.), pumpkins (Cucurbita L. spp.), potatoes and peas (Pisum sativum L.) were commonly grown by respondents, as were several commercially popular culinary herb varieties including garlic (Allium sativum L.), mint, thyme (Thymus Tourn. ex Linn. spp.) and parsley (Petroselinum Hill spp.). Walz (1999) reports that the most common vegetable crops in the OFRF survey conducted in the USA were cucurbits, tomatoes, alliums, brassicas and Capsicum L. species, whereas Fernandez-Cornejo et al. (1998) found that their sample of US organic vegetable growers mostly reported tomatoes, sweet corn, lettuce, carrots and onions. Table 3.7 Percentage frequency of herb crops grown by survey respondents (n = 219). The ten most commonly reported herb varieties are shown. Herb variety % of
respondents unspecified 34.2 garlic (Allium sativum L.) 12.8 mint (Mentha L. spp.) 11.0 echinacea (Echinacea Moench spp.) 10.5 thyme (Thymus Tourn. ex Linn. spp.) 7.3 parsley (Petroselinum Hill spp.) 6.4 lemon balm (Melissa officinalis L.) 5.9 chamomile (Chamomilla recutita [L.] Rauschert, Chamaemelum nobile (L.) All.) 5.5 sage (Salvia officinalis L.) 5.5 basil (Ocimum basilicum L.) 5.0 rosemary (Rosmarinus officinalis L.) 5.0
Data published by the Australian Bureau of Statistics (2000) on the amount of land used for the production of specific vegetables indicate that many of the most commonly grown crops in Australia were similar to frequently grown crops reported in the OWM survey (Table 3.8). Notable exceptions from the list of common vegetables in the OWM survey were carrots and onions (and other alliums), which were ranked 4th and 9th respectively in the ABS report. One respondent observed that "crops like shallots [Allium cepa L., Allium fistulosum L.] have minimal leaf coverage [and are vulnerable to weeds], but plants like beetroot [Beta vulgaris L.] which have a broad leaf area will not have as many weeds" (vegetable grower, 8 years experience, Queensland). Interestingly, beetroot was ranked highly (7th) in the organic survey but was 18th in the ABS data. It is possible that organic growers tend to grow crops in which weed control is easier. The choice of crop will be influenced by factors including climate, soil, farming experience, market demand and ease of marketing.
Chapter 3 Organic weed management survey
33
Table 3.8 Percentage frequency of vegetable crops grown by survey respondents (n = 219). The ten most commonly reported vegetable varieties are shown. Australian Bureau of Statistics (2000) data on area (ha) and ranking of national production for each vegetable in 1998 is also presented.
National vegetable production in 1998 Vegetable variety
The diversity of commodities grown by respondents was spread widely amongst growers (Figure 3.6). Three quarters of the farmers reported growing between one and five herb and vegetable crops, 17% reported growing 6 – 10 crops, 5% reported 11 – 15 crops, and 2% reported growing between 16 and 21 different crops. An earlier OFRF survey showed that a third of USA organic farmers reported growing up to five crops, 19% grew 6 – 10 crops and also 11 – 25 crops, 11% grew between 26 and 40 crops and 10% reported at least 40 different crops (OFRF 1993).
Figure 3.6 Percentage frequency of the reported number of crops grown by respondents.
Several comments were made in the open-ended responses in the OWM survey about the ecological and economic advantages of growing a diverse range of crops at any one time. For example, one grower stated that "growing a number of different crops provides some protection against pests and diseases" and that "this diversity also fits in with the optimum usage of drying facilities, and marketing requirements" (herb grower, 28 years, Tasmania). An FAO report on organic agriculture noted "that the diversification of crops typically found on organic farms, with their various planting and harvesting schedules" may help to even out the demand for labour (FAO 1999). It is probable that conventional herb and vegetable growers also grow several crops during a season, especially herb growers (Miller 1985) and market gardeners (Stivers-Young and Tucker 1999), although no reports quantifying this issue were identified. Weeds
Common names were invariably cited by respondents rather than botanical names and, in some cases, some interpretation and assumptions have been made to ascertain the specific identity of the
Chapter 3 Organic weed management survey
34
weeds. Often general names like "dock" and "clover" were used. Some respondents did not list any weeds (3%) whilst others gave very general information (10%) such as "summer weeds" and "woody weeds", although they may also have listed more precise weed names as well. The diversity of weeds reported included almost 250 species or groups (e.g. "thistles") from 48 families and 156 genera. The most frequently reported weeds are given in Table 3.9. Most of the weeds (90%) were mentioned by no more than 5% of respondents. Conversely, the top five weeds were each reported by 15% or more growers, with couch (Cynodon dactylon (L.) Pers.), capeweed (Arctotheca calendula (L.) Levyns), dock (Rumex L. and Acetosa Mill. spp.), Kikuyu (Pennisetum clandestinum Hochst. ex Chiov.) and sorrel (Acetosella vulgaris Fourr.) being the most frequent. Three families were predominant: they were Poaceae (30% of all weed instances), Asteraceae (22%) and Polygonaceae (10%). All other families were reported in less than 5% of instances. Four of the five most common weeds (i.e. couch, dock, Kikuyu, sorrel) have persistent underground parts that resist common forms of organic weed control such as cultivation and mulch. Aggregating reported weed taxa into more general botanical or functional categories provides another level of analysis. The predominant growth habit of the reported weeds was herbaceous (94%), a small proportion was shrubs (5%) and the remainder were either trees or vines. The growth of plants with woody structures and seed production that is delayed for several years is disadvantaged in the regularly changing environment of intensive row cropping (Baker 1974). Such conditions do not appear to disadvantage perennial weeds that are able to rapidly achieve vegetative reproductive capability such as nutgrass. Table 3.9 Percentage frequency of weeds reported by at least 10% of the respondents (n = 219). Weeds Family % of respondents Couch (Cynodon dactylon (L.) Pers.) Poaceae 27.4 Capeweed (Arctotheca calendula (L.) Levyns) Asteraceae 21.5 Dock (Rumex L. and Acetosa Mill. spp.) Polygonaceae 17.8 Kikuyu (Pennisetum clandestinum Hochst. ex Chiov.) Poaceae 17.8 Sorrel (Acetosella vulgaris Fourr.) Polygonaceae 17.8 Thistles (various species) Asteraceae 16.9 Clover (Trifolium L. spp.) Fabaceae 15.1 Cobbler's pegs/Farmer's friend (Bidens pilosa L.) Asteraceae 12.8 Fat hen (Chenopodium album L.) Chenopodiaceae 11.4 Chickweed (Stellaria media [L.] Cirillo) Caryophyllaceae 10.0 Ryegrass (Lolium L. spp.) Poaceae 10.0
A summary of the characteristics of perenniality and type (i.e. broadleaf or grass) of the reported weeds is presented in Figure 3.7. About 70% of the weeds were broadleaf weeds and the other 30% were grasses. Short-lived (annual and/or biennial) and long-lived (perennial) were equally common, at about 40% each. A smaller number of weeds (22%) of variable perenniality were reported. A Chi-square test of the relationship between the perenniality and weed type showed that the differences were highly significant (P < 0.001).
Chapter 3 Organic weed management survey
35
0
10
20
30
short either longPerenniality
Freq
uenc
y (%
of w
eed
repo
rts)
grassbroadleaf
Figure 3.7 Frequency of weeds reported by survey respondents classified by (a) perenniality: short (annual and/or biennial), either (variable or uncertain perenniality) and long (perennial); and (b) weed type: grass (white bars) and broadleaf (grey bars) (n = 1097). The most commonly reported weeds in the survey were members of similar botanical families to those listed for the weeds that are generally common throughout Australia (Groves 1991, Kloot 1991, Michael 1994, Lazarides et al. 1997). For example, Poaceae and Asteraceae are very large and diverse families and are likely to be well represented in most farming systems. Other families that are well represented amongst weedy genera are the Fabaceae, Brassicaceae, Liliaceae, Apiaceae and Polygonaceae (Michael 1994, Lazarides et al. 1997). Short-lived broadleaf weeds were the most common type reported by survey respondents, however they were generally not the most problematic for many growers as 90% of these weeds were reported by less than 10 growers. The most frequently reported short-lived broadleaf weeds were, in descending order, capeweed, cobblers pegs/farmer’s friend, fat hen, chickweed, Paterson’s curse, wireweed (Polygonum vulgare Gueldenst.) and Scotch thistle (possibly misidentified spear thistle [Cirsium vulgare (Sati) Ten.]). Short-lived grasses were generally of localised importance to respondents, each being reported by only a few growers. However, ryegrasses (annual, perennial and unspecified), summer grass and barley grass were moderately common. Longer-lived broadleaf weeds, the second most frequently reported group (24%), were also predominantly of minor importance (90% reported by less than 10 respondents). Six weeds, i.e. dock, sorrel, nutgrass (Cyperus L. spp.), dandelion (Taraxacum officinale [L.] Weber), blackberry (Rubus fruticosus L.) and lantana (Lantana camara L.), were commonly reported by growers. Longer-lived species of Poaceae were the most frequently reported grasses, with couch and Kikuyu being very common, paspalum (Paspalum L. spp.) less so, and about 25 infrequent species. Common weeds of variable or uncertain perenniality were thistles, clover, stinging nettles (Urtica L. spp.) and unspecified grasses. Conventional vegetable growers report a greater commercial impact from broadleaf weeds compared with grasses, possibly as a result of selection pressure against grassy weeds by the use of selective herbicides (Henderson and Bishop 2000). This selection pressure doesn’t occur in organic production, yet broadleaf weeds were reported in the survey twice as much as grassy weeds. The dominance of broadleaf species as weeds on organic farms may be due to their diversity and abundance in the Australian and world flora generally (Groves 1991), rather than as a direct consequence of farm management practices. Annual weeds that reproduce from seed are commonly found in conventional vegetable crops, although there are several notable exceptions such as couch and nutgrass (Henderson and Bishop 2000). Organic growers in the OWM survey reported similar numbers of annual and perennial weeds, with the most highly reported weeds being perennials displaying persistent underground reproductive parts such as stolons and rhizomes. Without systemic herbicides, organic growers
Chapter 3 Organic weed management survey
36
may be less capable of controlling such herbaceous perennials. Comments by survey respondents requesting the development of organic sprays and thermal methods such as stream weeding were probably indicative of their frustration with managing such weeds. Ultimately, a weed’s persistence in organic production may be related to biological and ecological factors such as reproductive strategies, competitive ability and phenology, rather than perenniality or the broadleaf/grass dichotomy per sé. The locations of the five most commonly reported weeds are shown in Figure 3.8. These maps illustrate the geographical variation in reports of weeds. Couch is a fairly cosmopolitan weed (Lazarides et al. 1997) and is considered to be one of the world’s ten hardest weeds to control (Hartmann et al. 1988). This weed species was the most widely dispersed of the common weeds reported, with about a third in the northern NSW – southern Queensland coastal region and another third scattered through central and western Victoria. These areas include semi-arid, Mediterranean, cool temperate, warm temperate and sub-tropical climatic zones. Extreme occurrences were reported from Huonville, Tasmania (latitude 43.0° south) to Malanda, Queensland (latitude 17.4° south). On the other hand, the reported geographic distributions of capeweed, Kikuyu and sorrel suggest that these weeds have more specific climatic requirements. Capeweed was generally limited to cool and warm temperate areas in the south of the continent, with 60% of reports occurring in Victoria. Sorrel was also more common in cooler regions such as the southern States and up the sub-coastal Great Dividing Range, at higher elevations, to the Queensland border, but was also reported from several warmer locations near or on the coast, including Maleny (latitude 26.7° south) and Byron Bay (latitude 28.6° south). Kikuyu was limited to the warmer and higher rainfall areas, with 70% of the reports coming from coastal sub-tropical areas and the balance from warm temperate regions. Only one report was received from Queensland, i.e. Cooroy (latitude 26.4° south). It was unclear why there were no other reports of Kikuyu from survey respondents from Queensland. Lazarides et al. (1997) list 11 species in two genera for “dock”, with some wide distributions, including curled dock (Rumex crispus L.), swamp dock (R. brownii Campd.) and broadleaf dock (R. obtusifolius L.). Therefore, it was expected that reports of “dock” were likely to be from a wide range of locations. The reported farm distributions appear to be less contiguous than the other weeds in Figure 3.8, with some clustering in several regions such as south-eastern Victoria, Gippsland, southern Tasmania and the north coast of NSW. The clustering may have been due to different species or biotypes of dock, but that was uncertain.
dock (Rumex and Acetosa spp.) kikuyu (Pennisetum clandestinum)
Figure 3.8 Locations of the five most commonly reported weeds; couch, capeweed, dock, Kikuyu andsorrel. The black squares represent the locations wereeach weed was reported and the grey dots represent the219 farm locations reported in the survey. sorrel (Acetosella vulgaris) About 240 weeds or weed groups were reported in the OFRF survey. The six most frequently cited weeds, i.e. those that were reported by at least 3% of respondents, are listed in Table 3.10. The botanical names were inferred from the INVADERS database (http://invader.dbs.umt.edu/), HYPPA database (http://www.dijon.inra.fr/malherbo/hyppa/hyppa-a/hyppa_a.htm), the Weed Science Society of America's plant names database (http://www.wssa.net/weednames/) and University of California IPM Online (http://www.ipm.ucdavis.edu/). Pigweed was assumed to refer to species of Amaranthus L., rather than Portulaca oleracea L. because purslane, the usual common name used in the USA, was also listed. The percentages are generally lower in the OFRF survey compared with the OWM survey (Table 3.9) possibly because respondents to the former
Chapter 3 Organic weed management survey
38
study were not just herb and vegetable farmers, therefore the overall range of weeds reported may have been greater and the frequencies of individual weed species reduced as a consequence. Table 3.10 The most frequently reported weeds in the OFRF survey, i.e. those reported by at least 3% of respondents (n = 1,192). Weeds Family % of respondents Foxtail (various genera possible?) Poaceae 6.5 Pigweed, Amaranth (Amaranthus spp.) Amaranthaceae 5.5 Quack grass (Elytrigia repens) Poaceae 5.3 Lambsquarters, Fathen (Chenopodium album) Chenopodiaceae 4.7 Canada thistle, Perennial thistle (Cirsium arvense)
Asteraceae 3.7
Bindweeds (Convolvulus and Calystegia spp.) Convolvulaceae 3.6 Apart from foxtail, which could not be botanically distinguished below family using the available information, these weeds were either heavily seeding annuals or perennials with persistent rhizomes. Broadleaf weeds made up 63% of the weeds reported and grasses constituted the other 37%, a similar ratio to the weeds reported in the OWM survey. The most difficult weeds to control in the OFRF survey were Bermuda grass (couch, Cynodon dactylon), Johnson grass (Sorghum halepense) and bindweed (Convolvulus and Calystegia spp.), all rhizomatous weeds (Lazarides et al. 1997). Walz (1999) notes that “the reliance on mechanical and hand tillage for weed management is probably correlated to the high level of difficulty assigned to the management of rhizomotous [sic] weed species, which are easily spread rather than killed by tillage”. Beveridge and Naylor's (1999) survey of organic farmers, in the United Kingdom noted a range of commonly reported weeds (e.g. docks [Rumex spp.], wild oats [Avena fatua], thistles [Cirsium spp.]), including both annuals and perennials, although frequencies were not given.
3.3.3 Attitudes to weeds
Are weeds a problem?
Approximately 80% of the herb and vegetable growers answered yes to the question "Do you consider weeds to be a problem in your organic crops?" This parameter is referred to below as “Problem”. A more detailed picture emerged from the open-ended questions where attitudes to weeds ranged from active utilisation to passive acceptance, through to desperation. Growers’ comments such as “weed management is the major cost associated with the growing of medicinal herbs and threatens the viability of the enterprise” (herb grower, 2 years, NSW) and “weed control would be the main limit to our production using organic methods” (vegetable grower, 9 years, NSW) clearly emphasise the general impact of weeds in organic horticultural production. Several respondents (11%) considered weeds to be a normal part of the farming system that can have positive functions such as stock feed, capturing otherwise unavailable soil nutrients, raw material for liquid fertiliser, mulch, compost, habitat for spiders and insects, physical protection of crop, soil cover against erosion, and as an indicator of soil condition. Comments highlighting these positive perceptions of weeds included: “[they are] just a necessary part of the whole” (vegetable grower, 20 years, Victoria) and "they are an important part of the ecology " (vegetable grower, 12 years, Tasmania). Respondents citing the beneficial role of weeds were compared with those not citing benefits against several variables including weeding methods used and farm/farmer characteristics such as organic farming experience, certification status, farm size and geographic location. No significant differences were observed using the Chi-square test in GLM for all parameters (P > 0.16). The question of whether farmers' attitudes to weeds change with the number of years of organic farming experience was of interest as it may indicate whether weed management is perceived to become easier with time. The effect of organic farming experience (Years) on concerns about weeds (Problem) was tested using the Chi-square test in GLM and a significant decrease in concern was detected with increasing experience (P = 0.052).
Chapter 3 Organic weed management survey
39
The finding that weeds were a significant problem for organic growers, was consistent with the results of Walz (1999) regarding the impact weeds have in organic production. Her report showed that weeds were ranked as the top research priority, the top category for desired production information, the top pest management concern and the top constraint to production during the conversion process.
Conventional growers also report that weeds were an significant problem in their farming systems. In a 1998 survey of Australian conventional wheat farmers, weeds were ranked as the most serious problem by 90% of respondents. A large percentage of farmers considered that the weed problems were worse or unchanged from 5 years ago (34 - 62% depending on bioregion, Jones et al. 2000), despite the considerable time and money spent on herbicide-dominated weed management strategies.
The ubiquity and general consistency of reports about the impact of weeds is compelling. However, growers may have a vested interest in reporting to researchers that weeds were a significant problem, or exaggerating the extent of the problem, if it will encourage further research on issues of direct benefit to them. The difference between visual thresholds for taking action against weeds observed by farmers and higher thresholds based on a quantitative assessment of weed levels (Cousens 1987) suggests that growers’ perceptions of the impact of weeds may be overstated partly as a risk avoidance strategy. The use of data derived from on-farm monitoring of weed densities (Gavin et al. 1999) may provide a mechanism for verifying grower perceptions. A comparison of mail survey responses and a field survey of weed problems and management practices showed broad agreement between the two survey methods (Jones et al. 2000). Why are weeds a problem?
The level of concern expressed by respondents about various weed impacts on organic herb and vegetable production is shown in Figure 3.9. The frequency of responses by all survey respondents was calculated from the number of growers reporting some level of concern (i.e. marking 1, 2 or 3 on the scaled-choice question) about each impact (grey bars in Figure 3.9). The average responses for the various weed impacts, i.e. the mean of all responses on the 4-point scale, were strongly correlated with percentage frequency (r2 = 0.98). Therefore the relative importance of the impacts was assumed to be the same. The 44 open-ended responses recorded in the "Others" section were all reclassified into the existing categories, except for a single comment about "community responsibility" to control weeds (vegetable grower, 15 years, Victoria). The frequency of reporting weed impacts in the "Others" section is shown in Figure 3.9 (white bars). The most important perceived impact of weeds was that they were difficult and time consuming to control (93% of respondents). About 80% of the growers expressed a moderate to high level concern about the effort required to manage weeds, emphasised by the comment "weed control is the single most time consuming activity connected with the running of my farm" (vegetable grower, 8 years, Victoria), and "weed control is a huge problem on my property and takes up more time than any other activity" herb grower, 13 years, Victoria). More than half of the growers who recorded a comment in the "Others" sections (i.e. 11% of all respondents) mentioned the time consuming and costly nature of OWM. Other very frequently reported weed impacts were reduced crop yields due to weed competition and interference with farming operations. Competition from weeds was also reported by over 20% of respondents in the "Others" section. Reasons of less concern, though still reported by more than 50% of respondents, were the harbouring of pests and diseases by weeds and contamination of crop or product with plant parts from weeds.
Chapter 3 Organic weed management survey
40
0 20 40 60 80 100
Difficult & tim econs um ing to control
Com pete w ith crop &reduce yield
Interfere w ith farmoperations
Harbour pes ts &dis eas es
Contam inatecrop/product
Frequency (% of respondents)
all responses
responses in'Others ' section
Figure 3.9 Level of concern about specific weed impacts on herb and vegetable production, expressed as the percentage frequency of respondents. The grey bars represent the frequency of responses by all survey respondents (n = 219) and the white bars represent the frequency of responses recorded in the "Others" section (n = 44). A regression analysis of the level of concern about weed impacts against years of farming experience was carried out using the Chi-square test in GLM. A significant (p ≤ 0.05) decrease was detected in levels of concern for most weed impacts as experience increased. The strongest response was observed for concern about weeds being difficult and time consuming to control and contamination of crops/products. Levels of concern dropped by more than 1 point on the 3-point scale for these two parameters. Concerns about weeds interfering with farming operations and harbouring pests/diseases decreased by about 0.5 points. Concern about weed competition and reduced yields decreased with experience by about 0.4 points, but was not significant (P = 0.35) due to the variability in responses from more experienced growers. A regression analysis of the level of concern about weed impacts and farm size (ha) was also carried out. A significant (P ≤ 0.05) decrease in concern was detected as farm size increased only for difficulty of control and interference in farming operations. Concern about the other impacts also decreased, but not significantly. As reported above, there was a strong relationship between farm size and farmer experience. Therefore, it is possible that reduced concern by managers of larger properties was due to greater experience. To summarise the section on attitudes to weeds, although weeds were reported as a key production constraint, it appears that growers tend to become less concerned about weeds as they gain more experience in organic farming. In general, growers with about 10 years experience or more will be less concerned about weeds than their less experienced colleagues. The change in attitude may be due to an increase in the growers’ skills, changes in their level of tolerance of weeds on their farm, a reduction in weed densities to more manageable levels, and changes to the weed flora toward fewer problematic species.
3.3.4 Organic weed management methods
Methods used: scaled-choice questions
The scaled-choice questions enabled respondents to indicate the regularity with which they used a number of listed weeding methods. A 5-point scale was used, ranging from 1 (“never”) to 5 (“always”). In addition to the 17 methods listed, respondents were able to add weeding methods that they used. Many of the methods added were variations of existing categories and were therefore reclassified into the appropriate existing category. However, seven new methods or categories were identified. These were, in descending order of frequency, underlying principles of OWM, farm hygiene, strategic fertilisation fallowing, bio-dynamic peppering, strategic irrigation and solarisation.
Chapter 3 Organic weed management survey
41
The responses were reclassified into 15 general categories consistent with those used for responses to the open-ended questions. The average response for each method was determined and those averages were ranked in descending order to indicate their relative importance to organic herb and vegetable growers. Figure 3.10 presents that data and the percentage frequency of respondents using each method at any level of regularity, i.e. those respondents who marked 2, 3, 4 or 5 on the 5-point scale. Manual weeding was very regularly used by a vast majority of respondents, with a mean score of 4.3 points (out of a maximum of 5) for regularity, and 95% of growers reporting some usage of this method. Several methods were used with moderate regularity (mean ≈ 3 points), including organic mulch, tillage, rotations, bed preparation, slashing/mowing and timing of operation. The frequency of respondents using these methods was moderately high (> 50% of respondents) and generally consistent with regularity of use, except that slashing/mowing and timing of operations were more commonly used but with less regularity than rotations and bed preparations. Less regularly (mean ≈ 2 points) used methods were cover crops, grazing, inter-cropping and cultural methods. These techniques, and thermal methods, were used by at least 30% of growers.
0 25 50 75 100
manual weeding
organic mulch
tillage
rotations
bed preparation
slash / mow
timing of operations
cover crops
grazing
inter-cropping
cultural methods
thermal methods
synthetic mulch
organic sprays
farm hygiene
Percentage frequency of responses (% of respondents)
1 2 3 4 5Regularity of use (mean of scaled choice response ± standard error)
Frequency (% ) Regularity of use
Figure 3.10 Regularity of use (mean ± standard error) and percentage frequency of responses (% of respondents) for weeding methods reported in the scaled-choice questions. The top axis depicts the regularity data, which are an average of responses on a 5-point scale, i.e. 1 = “never” to 5 = “always” for each weeding method. The grey bars indicate the mean regularity of use, the error bars indicating the standard error of that mean. The bottom axis depicts the frequency data, which are the percentage frequency of respondents using each method at any level of regularity. The white bars indicate the frequency of responses (n = 219). Respondents also provided information about the tillage implements they used for weed management. About 70% of all respondents reported using some form of mechanical cultivation and about a quarter of these used more than one implement. Figure 3.11 shows the percentage frequency of reported use of various categories of tillage implements. The most popular implement by a considerable margin was the rotary hoe. More than 40% of growers using tillage reported using a rotary hoe compared with 10 – 15% of growers using a tractor-drawn implement plough
Chapter 3 Organic weed management survey
42
with tines, discs or mouldboards. Less than 5% reported using a harrow, ripper or scarifier, and a range of other implements such as hydraulic rotating tines, rolling blades and home-made devices were used by only a few growers.
0 10 20 30 40 50
rotary hoe
chisel/tine plough
disc plough
mouldboard plough
harrow
ripper
scarifier
other/unspecified
Frequency (% of respondents using tillage)
Figure 3.11 Percentage frequency of the use of various tillage implements (n = 157). Despite some serious potential problems with the overuse or misuse of rotary hoes, such as damage to soil structure and pan formation, these implements can be a versatile and effective weed management tool (Bowman 1997, Whitten 1999), especially on smaller farms that were common amongst the herb and vegetable growers in the OWM survey. A Chi-square test confirmed that rotary hoe users have significantly smaller farms than non-users (P = 0.05), with mean farm sizes of 5 and 12 ha respectively. Other variables such as organic farming experience, farm location, certification status, certification organisation and days to return questionnaire were not significant. Methods used: open-ended questions
Responses to open-ended questions ranged from a few words (e.g. “hand weed, mow, mulch”) to a few pages explaining weed management strategies and the underlying principles in considerable detail. These responses highlight the diversity of practices in OWM across the industry (Table 3.11). Some of the categories in Table 3.11 overlap, for example, rotations are likely to include grazing and/or cover crops, and the integrated nature of organic production makes it difficult to clearly classify individual methods. Other weed researchers have categorised weeding methods in various ways and acknowledge that such schemes are imperfect (Watson 1992).
Chapter 3 Organic weed management survey
43
Table 3.11 Weeding methods reported in the open-ended questions and examples of specific techniques or equipment used. Method Example manual weeding hand pulling, rake, fork, mattock, wheel hoe and various chipping hoes organic mulch paper (pellets, sheets, rolls), hay, cardboard, straw, woodchip, sawdust,
seaweed, wool, hessian tillage numerous plough types such as bed former/potato hiller, brush weeder,
chisel/tine, deep ripper, disc, harrow, hydraulic rotating tines, mouldboard, rolling blades, rotary hoe, scarifier, scufflers, spring tine
slashing brush-cutter, whipper-snipper, hand mower, ride-on mower, slasher rotation fallowing, green manure crops, grazing, cash crop sequence, competitive
crops before uncompetitive ones bed preparation stale seed bed, raised beds timing sowing, tillage, hand weeding, slashing, applying inputs, weed and crop
lifecycles, lunar cycle cover crops cereal and legume green manures, living mulch, weed-suppressive
solarisation synthetic mulch black plastic film, carpet, woven plastic weed mat sprays/intervention citrus and pine oils, salt, mustard powder, homeopathic potencies, bio-
dynamic “peppers” hygiene prevent seed set and spread, composting, clean machinery, buy weed-
free inputs other cultural methods
crop selection, site selection, sowing/planting rate, fertiliser placement, irrigation and water monitoring, soil management, diligence, observation, weed seed bank reduction focus, integration
About 40 weeding methods or strategies were identified from a quantitative analysis of the open-ended questions. However, many of these methods were used by only a small number of growers. Half of the methods were used by less than 5% of the growers and another quarter was used by 5 – 10% of growers. Only 7 of these methods were reported by more than 20% of respondents. The responses were reclassified into 15 categories of weeding methods to provide a more general evaluation of the frequency with which various OWM methods were used by herb and vegetable growers (Figure 3.12). The most frequently reported method was manual weeding, which was reported by about 80% of respondents. Manual weeding, usually performed as chipping with a hoe, was sometimes used as a central management technique or as a final “clean up” after relying on other methods such as tillage or mulch for the bulk of the weed control. Other commonly reported methods (> 40% of respondents) were mulching with organic materials such as hay, paper or compost; tillage using a wide range of implements including rotary hoes and various types of ploughs; and slashing, often to prevent seed set, using brush-cutters, mowers and tractor-mounted slashers. Less frequently reported OWM methods (10 – 25%) were cover crops, thermal methods such as solarisation and flame weeding, adjusting the timing of farming operations including sowing, cultivation and slashing, and using rotations incorporating various cash crops, green manures, fallowing and grazing. A wide range of cultural weed management methods were reported with moderate frequency overall, although many were limited to only a few growers. Cultural techniques reported included crop and site selection to suit the existing weed burden, higher crop densities, strategic irrigation and fertilization, and the manipulation of various soil quality parameters such as pH, the calcium:magnesium ratio and drainage. Infrequently reported methods (< 10%) included practising good farm hygiene by preventing the spread of weed seeds; bed preparation methods such as raised beds to ease between-row weed
Chapter 3 Organic weed management survey
44
control and false seed beds to eliminate a final cohort of emerged weeds prior to sowing or planting; and various inter-cropping strategies that were designed to reduce weed impacts compared with growing a single crop species. Synthetic mulches and organic sprays were also used by a small number of growers. These materials are approved for use by the Australian organic certification standards, but they are only recommended for limited use in weed management, not as substitutes for good organic farm management (OPAC 1998). Synthetic mulches reported in the survey included weed matting (woven black plastic) and polythene film. Growers mentioned a number of organic sprays such as essential oils, homeopathic potencies and bio-dynamic peppering. Peppering refers to burning the seeds of specific weeds, collecting the ash, mixing the ash with water in a particular process and then spraying the solution onto the paddock (Thun 1980). Biological control was not mentioned by survey respondents even though this option is compatible with organic production, a result consistent with Beveridge and Naylor’s (1999) findings. Classical bio-control may be less suited to annual horticultural cropping systems in which the control agent’s habitat may be disturbed or completely removed from time to time, or if farming operations (e.g. tillage) interfere with the lifecycle of the control agent (Hartley and Forno 1992). Weeds that were most commonly reported by survey respondents, e.g. couch, kikuyu, sorrel and dock, have perennial rhizomatous organs with a strong capacity to regenerate. Bio-control programs for these types of weeds have been persistent failures (Hartley and Forno 1992).
0 20 40 60 80 100
m anual weeding
organic m ulch
tillage
s las h / m ow
cultural m ethods
cover crops
therm al m ethods
tim ing of operations
rotations
grazing
farm hygiene
bed preparation
inter-cropping
s ynthetic m ulch
organic s prays
Frequency (% of res pondents )
Figure 3.12 Frequency of weeding methods reported in the open-ended questions. The methods were classified into 15 categories and sorted in descending order by frequency (n = 219). Summarising individual practices may neglect the importance of principles in OWM. An understanding of the role of weeds in the ecology of a farming system is emphasised by many authors of organic production publications (Marshall 1992, Walters 1996, Oien 1997, Merfield 2002). About 7% of the survey respondents specifically referred to underlying principles that guided their weed management practices. Various responses to the open-ended questions reported principles and integrative strategies, including: * observing weed lifecycles and succession, * timing operations to maximize the impact on weeds, * preventing weed seed set, * paying attention to detail early to save extra effort later, * planning operations in a logical sequence, and * gearing all operations on the farm towards weed management.
Chapter 3 Organic weed management survey
45
Diversity of practices
The range of techniques listed in response to the open-ended questions about weeding indicates the diversity of weed management methods used amongst the surveyed population. Over 40 methods were reported, although many were used by a very small number of respondents. This diversity may be related to several factors such as farm size, farm location, years of experience, commodities grown and the various practical and philosophical backgrounds of the respondents. Duram's (1999) report on decision-making by organic farmers in Colorado, USA, found a high level of operational diversity that was tailored to suit specific local conditions and the farmer's expertise. A survey of conventional broadacre farmers in Australia (Alemseged et al. 2001) also reported distinct regional differences in weed management practices across the continent, although they noted that the small number of respondents for certain regions made comparisons unreliable. The scaled-choice questions can provide a more comprehensive evaluation of the diversity of OWM practices on individual farms. The average number of weed control methods reported in the scaled-choice questions was 8.6 and the maximum number of methods was 17. About a quarter of the respondents reported using five methods or less. Surveys about weed management practices may report the frequency of each weeding method or category, but they generally do not report the frequency of methods used by individual respondents. Alemseged et al. (1999) reported that the conventional broadacre farmers responding to their survey routinely used an average of four to five different methods to control weeds in winter crops. Although that figure was about half of the average reported in the OWM survey, differences in cropping system, survey design, terminology and categorization of weed control methods may account for the differences in weed control practices between the two sampled populations. A comparison of the frequency histograms of the number of methods used by individual respondents for the two types of questions (i.e. open-ended and scaled-choice), with two levels of method classification (i.e. uncategorised and categorised) is shown in Figure 3.13. The shape of the histograms for the open-ended responses (graphs A and B) show a rapid rise in the frequency, peaking at about four methods used. For the scaled-choice questions (graphs C and D), the rise was less steep, the peak was at a higher number of methods and the maximum number of methods was greater. The differences in histogram shapes in Figure 3.13 suggest that the question types elicited different responses. This hypothesis was tested using the Chi-squared test in GLM. The number of methods reported in the open-ended (Graph A) and scaled-choice questions (Graph C) were significantly different (P < 0.001), with medians of 4 and 9 respectively. After reclassifying the methods into 15 categories of weed control methods the question types (Graphs B and D) were still significantly different (P < 0.001), with medians of 4 and 7 respectively. It may be concluded that scaled-choice questions did provide a more comprehensive evaluation of the diversity of OWM practices than did the open-ended questions. Foddy (1995) noted that answers to open questions tend to be less complete than answers to corresponding closed questions (such as the scaled-choice questions in the OWM survey), and that respondents find closed questions easier to answer because they are guided in the types of answers required and prompted to recall more information. He recommends, however, that a judicious mixture of both types of questions is generally desirable.
Chapter 3 Organic weed management survey
46
0 5 10 15 20
010
2030
4050
60
A
0 5 10 15 20
010
2030
4050
60
B
0 5 10 15 20
010
2030
4050
60
C
0 5 10 15 20
010
2030
4050
60
D
Number of methods used by each respondent
Freq
uenc
y (n
umbe
r of r
espo
nden
ts)
Figure 3.13 Frequency histograms (number of respondents) for the number of weeding methods reported in the open-ended questions (A: uncategorised, B: categorised) and scaled-choice questions (C: uncategorised, D: categorised) (n = 219). Comparison with other organic surveys
The popularity of weed management methods reported in the OWM survey was compared with that reported in three other surveys of organic growers that presented data in a similar format (Beveridge and Naylor 1999, Walz 1999, Burnett 2001). The results from two of those surveys are shown in Figure 3.14, with the weeding control methods ranked in descending order of frequency. Graph A shows the results of the OFRF survey in the USA that included farmers producing a broad range of organic commodities. Horticultural crop producers made up 57% of the respondents, 52% produced broadacre field crops, 40% grew tree crops and 27% produced animal products (Walz 1999). The total was greater than 100% as some respondents operate mixed farming systems. Graph B depicts the results of a survey of Australian organic broadacre cropping and grazing enterprises (V. Burnett, pers. comm.). In Beveridge and Naylor's survey (1999) of UK organic farmers, grain production was the main cropping system of respondents, with a smaller number of potato growers and graziers responding.
Chapter 3 Organic weed management survey
47
A
0 20 40 60 80 100
hand weed/chipping
mechanical tillage
cover crops
crop rotations
mulches
planting date
smother crops
row width
flaming/burning
grazing
ridge tillage
solarisation
Frequency (% of respondents)
B
0 20 40 60 80
grazing
cultivation
rotations
hay/silage
green manure
fallow
high seeding rates
competitive crops
post-sowing cultivation
manual weeding
weed seed collection at harvest
Frequency (% of respondents)
Figure 3.14 Percentage frequency of respondents reporting the use of various weed management method in A: a survey of US organic producers (n = 1,192) (Walz 1999), and B: a survey of broadacre organic farmers in Australia (n = 70) (Burnett 2001). Comparing these surveys with the OWM survey was complicated by the different types of farming systems sampled, survey design characteristics, terminology used in the questionnaires and categorisation of methods during the analyses. Therefore, care should be taken in identifying differences in the ranking of methods. Nevertheless, some common trends were apparent between the weed control methods reported in the four surveys, particularly between the OFRF (Walz 1999) and OWM surveys. Tillage or cultivation was a very commonly used tool for weed management, being ranked second or third in all surveys. Rotations were also consistently highly ranked, and cover crops (or green manures) and timing of operations was considered to be at least moderately important techniques in weed control. "Slashing" (OWM survey), "topping/mowing" (Beveridge and Naylor 1999) and cutting "hay/silage" (Burnett 2001) were also moderately common. Thermal methods and cultural methods (e.g. crop selection, modified crop density) were generally used with low to moderate frequency in all surveys. The lower ranking of mulches and ridge tillage (equated with "bed preparation" in the OWM) in the OFRF survey, compared with the OWM survey, may be related to the inclusion of farmers with broadacre and animal production systems where such practices are presumably less common or not relevant. Also, raised beds and ridge tillage are possibly not directly comparable. The very high ranking of grazing, and the low ranking of manual weeding and absence of mulches as a weed control method in Burnett's survey (2001) was probably due to the absence of horticultural enterprises and the large proportion of permanent-pasture grazing enterprises in the surveyed population (V. Burnett, pers. comm.). Several reviews of organic (or non-chemical) weed management failed to mention grazing as a weed control method (Parish 1990, Rasmussen and
Chapter 3 Organic weed management survey
48
Ascard 1995, Bond and Grundy 2001), while another review only cited anecdotal reports from growers (Patriquin 1988). Success and expense of the methods used
This section presents the results from the scaled choice questions regarding the perceived success and expense of weeding methods used by growers (Figure 3.15). The scales ranged from 1 = "very poor" to 5 = "very good" for success, and 1 = "not expensive" to 5 = "very expensive" for expense, and the methods were ranked in descending order by regularity of usage. The results are averaged responses and only include data from growers using each weed control method. Excluding non-users of each method may bias the results against respondents who believe that certain weeding methods were not successful, have ceased using those methods and were therefore disinclined to respond, whether favourably or not. However, the "users only" sub-sample provides an overview of the perceptions of current users of each weed control method.
209
172
157
144
133
151
138
123
89
98
66
72
51
28
3
1 2 3 4 5
manual weeding
organic mulch
tillage
rotations
bed preparation
slash / mow
timing of operations
cover crops
grazing
inter-cropping
cultural methods
thermal methods
synthetic mulch
organic sprays
farm hygiene
Mean response (± standard error)
success
expense
Figure 3.15 Mean response (± standard error) by all respondents to perceived success and expense of weeding methods. The data are an average of responses on a 5-point scale from "very poor" to "very good" for success (white bars), and "not expensive" to "very expensive" for expense (grey bars). The methods are in descending order by regularity of use. The numbers down the right-hand side indicate the number of respondents using each method (n = 219). Growers reported that the most successful methods of weed management were farm hygiene, tillage, organic mulches, manual weeding and timing of operations. The exceptionally high reported success of farm hygiene was possibly unreliable given the very low number of growers reporting that method (i.e. 3). However, the other methods are used by at least 70% of the respondents, so those values are assumed to be more reliable. These methods were also the most frequently reported by the respondents. Several moderately successful weed control methods were reported including, synthetic mulches, rotations, bed preparation, slashing/mowing, grazing and various cultural methods. Methods that
Chapter 3 Organic weed management survey
49
were perceived to be less effective for controlling weeds were thermal methods, inter-cropping and organic sprays. The success of weeding methods showed relatively little variation between methods compared with regularity of use and expense. Apart from farm hygiene, all methods averaged between 2.7 and 3.7 points, suggesting that most of the reported methods were at least moderately successful at controlling weeds, and that none were dramatically effective or ineffective. This finding concurs with other studies of organic weed management, where individual weed control practices are neither "very effective" nor "poor" (Beveridge and Naylor 1999), and that reliance on several methods is important (Bond and Lennartsson 1999). The most expensive OWM methods reported were synthetic mulches and thermal methods, with organic mulch, manual weeding, slashing/mowing and tillage also considered to be expensive. These methods generally rely on high levels of external-input requirements such as fabricated materials that are non-recyclable (limited to single-season usage) and dependence on fossil fuels and special machinery. Organic mulches are bulky materials with high purchases prices, transport costs and application costs. Several respondents reported using paper and cardboard which may offer a cheaper alternative to hay and straw mulches. Labour, whether for direct manual weed control or for operating tractors and other machinery used in weed control, is widely considered to be a major cost in organic and low-input weed management (Ascard and Mattsson 1994, Bastiaans et al. 2000, Leinonen and Närkki 2000). The high labour requirements were acknowledged by survey respondents with respect to why weeds are a problem (section 3.3.3). The greatest problem posed by weeds was perceived to be the difficult and time consuming nature of OWM (92.6% of respondents). About 55% of the 44 responses recorded in the "Others" sections were related to the time and cost of managing weeds. Methods that were reported to be moderately expensive included organic sprays, cover crops and bed preparation. These methods may be considered to be expensive because of the cost of materials used in organic sprays such as essential oils; the costs of producing a cover crop such as seed, inputs, labour and forgone income; and the labour and machinery costs incurred in preparing and maintaining raised beds. The least expensive methods were a range of cultural techniques or farm management operations including timing of operations, farm hygiene, inter-cropping, grazing and rotations. Many of those methods are likely to be undertaken for other reasons than weed management, so the full expense was not applied to weed control. A loose linear correlation (r2 = 0.63) was detected between the mean responses for regularity of use and success and the slope was significant (P < 0.001). The moderately close relationship between regularity and success appears logical; respondents would not be expected to persist with weeding control methods that were not perceived to be successful, and the more successful a method is at controlling weeds, the more regularly it is likely to be used. No correlation was found between regularity of use and expense (r2 = 0.06) and success and expense (r2 = 0.002) and the slopes were not significant (P = 0.38 and 0.89 respectively). The lack of relationship between these parameters implies that respondents generally do not base their choice of weeding method on cost, and that more expensive weeding management methods do not necessarily provide greater success. Relationships between weed control methods and farm characteristics
The relationships between weeding methods and farm and farmer characteristics were analysed using the Chi-square test in GLM. Several relationships were found to be significant (p ≤ 0.05) and these are shown in Table 3.12. The relationships were not necessarily causal, but may indicate associations between variables that provide a broader understanding of adoption and use of OWM practices reported in the survey. Only two weeding methods, organic sprays and farm hygiene, were not affected by any of the explanatory variables. These were the two least frequently reported weeding methods and it was possible that there were too few responses to detect significant trends.
Chapter 3 Organic weed management survey
50
Table 3.12 P-values for relationships between weeding methods reported and various farm and farmer characteristics (explanatory variables) that were identified in the bivariate analysis as being significantly different (p ≤ 0.05). The P-values generated using the Chi-square test in GLM. Weeding methods reported
Certification status 0.004 0.002 0.008 0.003 0.023
Are weeds are a problem? 0.049 0.054 0.026 0.037 0.039 0.050 0.033
Benefits of weeds cited 0.042 0.011 0.043 0.022 0.002
The frequency of use of weeding methods varied with geographic location (latitude and longitude). Organic mulches and cover crops were more commonly reported in the east and north of the continent, especially NSW and Queensland, whereas tillage, timing of operations, thermal methods and synthetic mulch were less common in the north and/or the east. This suggests a preference by respondents in the north and east for weed control methods that are organically derived and not necessarily reliant on off-farms inputs, rather than (a preference for) methods that require a higher level of external inputs such as fuel and specialised equipment or materials. Whether such preferences are based on organic farming experience, farming systems (e.g. types of crops grown), availability of resources, local historical factors such as availability of information and grower groups with specific interests, or attitudinal factors is unclear. Several weeding methods were more likely to be used by respondents with greater experience, especially cultural methods such as rotations, timing of operations, cover crops and grazing that rely more heavily on a systems approach to weed management. The use of slashing/mowing was also found to increase with experience, perhaps in response to an increase in awareness of the importance of minimising weed seed production. The only method with a negative relationship between frequency of use and organic farming experience was manual weeding. It is probable that reliance on this method decreases over time as skills and confidence increase with using other weeding methods. The amount of land under organic production significantly influenced grazing and thermal weeding only, despite reports that farm size is an important factor in the cost effectiveness of weed management methods such as hand weeding and tillage (Melander 1998a, Alemán 2001). The use of grazing for weed control was greater by those with larger farms. The average farm size of growers reporting very high regularity of use of grazing (i.e. those selecting 5 on the scaled-choice question) was about 20 ha, while the average for all other levels of use was about 7 ha. Grazing options, particularly with larger stock such as cattle and pigs, may be constrained physically and economically on smaller properties (Popay and Field 1992). Smaller animals, including poultry and goats, were reported in the OWM survey, however their use in weed management is not generally widespread (Popay and Field 1992). Thermal weeding methods, e.g. flame and steam weeding, were less frequently used as farm size increased, with regular users reporting average farm sizes no larger than 4 ha and moderate users less than 6 ha. Thermal methods are perceived to
Chapter 3 Organic weed management survey
51
be very expensive (Figure 3.16, and Litterick et al. 1999), and they may only be cost effective on high value crops that are currently grown on smaller acreages. A number of weeding methods were used more frequently as respondents progressed from uncertified status, through transition, to full organic certification status. These methods were rotations, cover crops, tillage, slashing/mowing and thermal methods. The trends in the use of cultural methods were similar to that found for organic farming experience. Tillage and thermal weeding were also adopted more by certified growers, although other factors than increased farming experience appear to be consistent with such a trend. The answer to the question of whether weeds are perceived to be a problem by respondents was significantly correlated to the frequency of use of many weeding methods reported. Hand weeding/chipping, tillage, slashing/mowing, thermal weeding and synthetic mulch were positively correlated with the perception that weeds were a problem, while grazing and cultural methods were negatively correlated. The former group of methods are relatively intensive, direct or high input weeding methods, while the latter methods are less intensive and direct, implying that growers concerns about weed impacts are proportional to the intensity of the weeding methods used. In contrast to the perception of weeds as a problem in herb and vegetable production, weeds were also considered to be a beneficial component of the farming system. Respondents who cited some beneficial aspect of weeds in their response were more likely to use rotations, bed preparation, cover crops, inter-cropping and other cultural methods. This positive correlation may also imply that growers who are more accepting of weeds tend to report using less intensive and direct weed control methods. Both increasing organic farming experience and decreasing concern about weeds were associated with weed control methods that tend to be more passive and indirect. Respondents with less experience and more concern about weeds were more likely to use active and direct weed control methods. These differences in practices may represent the development of a more ecological approach to weed management that was more reliant on cultural methods rather than physical or mechanical methods. Such a trend may be expected given the emphasis crop protection strategies that are based on a whole farming system approach, rather than reliance on external inputs and intervention, in the Australian organic National Standards (AQIS 2001) and elsewhere (Lampkin 1990, Joint FAO-WHO Food Standards Programme 1999, UKROFS 2001).
3.4 Conclusions
The organic weed management survey was prompted by the numerous anecdotal and research reports that weeds were a key constraint in organic crop production and the general lack of information about OWM practices. It was considered that the existing knowledge base amongst Australian organic herb and vegetable growers could be accessed through a mail survey. The OWM survey was conducted to provide information about the weed control methods used by growers, attitudes towards weeds, basic characteristics of the farms and farmers surveyed, and the relationships between parameters. The survey provide a quantitative analysis of current weed management practices used by organic herb and vegetable growers in Australia and also gives an insight into some of the factors that influence those practices. A review of the literature pertaining to mail survey methodology identified several potential sources of error. These sources of error were addressed in the subsequent analyses of the results by comparing data within the survey and with other similar surveys. The findings were found to be generally free from significant sources of error and consistent with other surveys. Although efforts were made to sample from the widest possible grower base, incomplete sampling inevitably means that results from the survey should be seen as indicative rather than conclusive and as a basis for further research into OWM practices amongst Australian organic herb and vegetable growers.
Chapter 3 Organic weed management survey
52
A moderate response rate was achieved (43%), and the majority of respondents were within the sampling frame, i.e. organically certified producers of herbs and vegetables. The reported farm sizes were small (median = 2.4 ha) and the respondents had relatively little experience with organic farming (median = 6 years). Producers grew a wide range of herb and vegetable crops (median = 3) and reported numerous types of weeds on their farms. The most common weeds were predominantly those with persistent underground parts that resist common forms of organic weed control such as cultivation (by hand or plough) and mulch. Heavily seeding annuals were also frequently reported. Respondents expressed strong concern about weed management, particularly regarding the difficult and time consuming nature of OWM and the impact of weed competition in reducing crop yields. About 10% of growers reported that weeds could play a beneficial role in the farming system. The respondents reported using a diverse range of weed management techniques, with over 40 specific methods or strategies being mentioned. The most common method was manual weeding, which was sometimes used as a central management technique or as a final “clean up” after relying on other methods such as tillage or mulch for the bulk of the weed control. Other commonly reported methods were organic mulches; tillage (especially rotary hoes); cultural methods such as rotations, bed preparation, timing of operations, cover crops and inter-cropping; slashing and/or mowing; and grazing. Less frequently reported OWM methods included thermal methods, synthetic mulches, organic sprays and farm hygiene practices. The results for perceived success of weeding methods used were loosely correlated with the regularity of use. Therefore, manual weeding, organic mulches and tillage were reported to be the most successful weeding methods. No relationship was found between the perceived expense of a weeding method and the regularity of use of that method. This suggests that growers were not primarily motivated by the cost of a weeding method; instead, they were more concerned that it was successful in controlling weeds. Synthetic mulches and thermal weeding were considered to be the most expensive weed control methods, but these are not very commonly used in OWM. A change in OWM practices was found in relation to respondents' organic farming experience and level of concern about weeds. There was a decline in the use of direct, physical methods (e.g. manual weeding, tillage) and an increase in the use of indirect, cultural methods (e.g. rotations, cover crops) as growers became more experienced and less concerned about the negative impacts of weeds. Results from the OWM survey and the OFRF survey (Walz 1999) highlight a number of possible research issues of concern to organic growers. Improved control of particularly problematic weeds, such as couch, sorrel and nutgrass, was a common area of concern. Studies on the biology and ecology of such weeds may identify lifecycle vulnerabilities that can be exploited by modified management practices. There also appeared to be some interest from respondents in novel techniques such as flame weeding, steam weeding, improved tillage implements and organic sprays. Cultural strategies such as techniques for weed seed bank reduction and the development of weed suppressing cover crops that don't become weeds themselves were also of interest to respondents. Given the failure of the questions about time and cost of weed management to elicit reliable data in this survey, and the general importance of economic factors in broader decision-making, another potential research area may be an economic analysis of OWM practices. A more focused study of the economic impact of weeds and the cost and efficiency of various key weed management methods may generate empirical data about the relative cost of weed management in organic production. Such information is not currently available in Australia. The dominant weed control methods reported in the survey – manual weeding, organic mulches, cover crops and tillage – provided the focus for the experimental work reported in the following chapters of this thesis.
53
Chapter 4 In-crop weed management methods
4.1 Introduction
Whilst weed management in organic herb and vegetable production is widely reported to be a major constraint, a range of systems have been developed by organic growers in Australia to manage weeds on their properties. These OWM systems vary in the types of methods used and how they are used depending on a variety of issues including the crops grown, existing weed populations, soil conditions, climate, availability of resources (e.g. local source of mulch), farm financial situation, organic farming experience and the farmer's mind set. In the absence of the highly developed extension and production strategies that are available to conventional farmers (e.g. fertiliser and crop protection programs), farmers have devised OWM solutions based on their own needs and capabilities, support from grower groups and certification organisations, and information from published materials in Australia and overseas. In Australia, some farming systems trials have been conducted that investigate the effect of organic and non-organic production systems on crop yield, weed levels, soil fertility, costs and other variables (Penfold et al. 1995, Wells 1996). These trials have not studied the comparative effects of different weeding methods within a given farming system. Some research has been conducted on specific non-chemical weeding methods in herb or vegetable systems, including mulches (Olsen and Gounder 2001), grazing (Penfold and Miyan 1996), thermal methods (Hewitt et al. 1998) and tillage (Dunn and Penfold 1996). However, very few comparative studies that consider the economics of weed management methods in annual horticultural cropping in Australia have been published, apart from that by Tyler (1999). There appears to be scant quantitative data on farm budgets or weed control costs for organic herb and vegetable growers available in Australia (Buntain 1999, Whitten 1999, Davidson 2000), although such data have been collected in Europe (Philipps et al. 1998, Geven 2000) and the United States (Sellen et al. 1995, Clark et al. 1999, Brumfield et al. 2000). Several overseas studies have reported findings based on comparative trials of different weeding methods in vegetable production, including some that present an economic evaluation of the methods tested (Edwards et al. 1995, Melander 1998a, Litterick et al. 1999, Feldman et al. 2000, Alemán 2001, Turner and Grundy 2002). Factors that are considered to have an impact on the relative economic performance of weed control methods include the existing weed density, the cost of labour, size of the area to be treated, crop type, crop yield and the price received for the harvested crop. This chapter reports on a comparative evaluation of the agronomic and economic performance of some of several weed control methods that are commonly used in organic herb and vegetable production, i.e. hand weeding, tillage and organic mulches. In consultation with the project’s industry partner, these methods were selected based on the extent to which they were already relied upon, the availability of farm resources and wider applicability to other organic herb and vegetable growers. Australian organic herb and vegetable farmers frequently reported using these methods, as described in the previous chapter. Hand weeding was used by about 95% of organic herb and vegetable growers in the OWM survey, organic mulches by about 80% of respondents, and tillage by about 70% of growers. These methods were also frequently reported in other surveys of organic growers (Walz 1999, Burnett 2001). In addition to hay mulch, which is a common type of mulch used by organic growers (Whitten 1999), a novel pelletised paper mulch was used in the experiments. Paper mulches have been reported to be effective for weed suppression (Smith et al. 1998, Olsen and Gounder 2001). A series of experiments was conducted on two crops with differing growth patterns, the medicinal herb, echinacea, and the salad vegetable, lettuce cv. Imperial Triumph, a crisphead variety. Echinacea was the predominant crop at the farm, and it is commonly grown by organic herb growers, being the third most frequently reported herb in the survey described in the previous
Chapter 4 In-crop weed management methods
54
chapter (Table 3.7). Echinacea has a long growing season and weed control is reported to be a serious problem in organic production (Switala 1999). Lettuce, however, has a much shorter growing season than echinacea (Wallace 2000) and effective weed control is more straightforward (Roberts 1977). The objective of the experiments was to assess the relative performance of various weed control treatments in terms of weed growth, crop growth and treatment cost.
4.2 Methods
4.2.1 Site descriptions
The field experiments reported in this chapter were carried out at three sites over three consecutive summer growing seasons on properties situated on the Northern Tablelands of New South Wales (Figure 4.1). In the first year (1998 – 1999) field trials were conducted at Yarrowitch, located at latitude 31.14°S, longitude 152.00°E and elevation 970 m. This property was owned by Subiaco Herbs Pty Ltd, the industry partner initially associated with the project. The withdrawal of Subiaco Herbs from the project during the first growing season due to financial difficulties meant that further trials could not be conducted at that site. The Yarrowitch site had been operated organically for the previous two seasons, before which it was a conventional wool-growing property. Echinacea had been grown in the previous year. It had full organic certification from the accredited certifying body Organic Herb Growers Australia.
#
#
#
#
$
$$
QLD
NSW
VICMelbourne
CanberraSydney
Brisbane
#
#
$
$$
151.5°E 152°E
30.5
°S31
°S
KIRBYLAURELDALE
YARROWITCH
Armidale
Walcha
A
B
0 10 20 kilometres
Figure 4.1 Map of south-eastern Australia (A) and detailed map (B) showing the location of the three sites used for the field trials reported in this chapter. In map B, the field sites are represented by ▲, the grey lines indicate roads and the black line indicates the road from Armidale to Yarrowitch. In the second year (1999 – 2000) field trials were undertaken on two of the University of New England's research farms (Figure 4.1). Kirby Research Station, located at latitude 30.43°S, longitude 151.61°E and elevation 1135 m, is principally a wool-growing farm and the paddock in which the trials were conducted had been sown to pasture and grazed by sheep and cattle for at least the previous 7 years. No herbicides or fertilisers had been used during that time. Laureldale Research Station, located at latitude 30.48°S, longitude 151.65°E and elevation 1063 m, is used for small-plot field trials and has a very complicated land-use history based on a range of cereal and
Chapter 4 In-crop weed management methods
55
legume crops and a diverse mixture of fertliser and pesticide usage patterns. The area used in the field trial reported here had been used for a buckwheat (Fagopyrum esculentum) variety experiment in the previous season. In the third year (2000 – 2001) field trials were undertaken at Kirby Research Station only. Experiments were not continued at Laureldale due to the poor growth of lettuce in the second season, heterogeneity of the site (e.g. high spatial variability of weeds), and the high clay content of the soil making access difficult after rain. Soil descriptions
The soil at Yarrowitch was a granite-derived fine sandy loam, Dg 3.42. The soil at Kirby was a granite-derived sandy loam, Dy 4.42. The Laureldale soil was a basalt-derived heavy chocolate clay, Ug 5.14 (Northcote 1984). Soil analyses were carried out at the beginning of each season at each field site. The soil was sampled by collecting 20 cores (100 mm diameter x 200 mm deep) in an X-shaped pattern across the trial area, bulking the cores, mixing thoroughly and randomly selecting a sub-sample of approximately 500 ml of soil. The sub-sample was oven dried at 40°C for 48 hours, hammer milled through a 2 mm sieve and placed in air-tight plastic specimen jars. Approximately 40 g of prepared soil was sent to Incitec (Paringa Road, Murarrie, QLD 4170) for analysis and the results are shown in Table 4.1. Table 4.1 Results of soil analyses for the four field trials.
Trial Parameter (method of analysis*) [units] Yarrowitch
The long-term climatic averages for the Yarrowitch district are 19.2°C for daily maximum temperature, 5.2°C for daily minimum temperature (Bureau of Meteorology 2001) and 1300 mm for annual rainfall (H. Mason, pers. comm.). The long-term averages for the Armidale district, in which the two UNE research stations were located, are 20.3°C for daily maximum temperature, 7.1°C for daily minimum temperature and 790.1 mm for annual rainfall (Bureau of Meteorology 2001). A summary of the climatic data in Yarrowitch and Armidale during the trials is shown in Figure 4.2. Daily rainfall data for Yarrowitch were supplied by Helen Mason of Yarrowitch based on a rain gauge located 15 km south of the field site, and temperature data were based on the nearest known recording station at the Walcha office of NSW State Forests. Weekly rainfall data for Kirby and Laureldale were obtained from rain gauges within 20 metres of the experimental sites
Chapter 4 In-crop weed management methods
56
and temperature data were obtained from the Armidale weather station (Bureau of Meteorology 2001).
-5
0
5
10
15
20
25
30
O N D J F M A M J J A S O N D J F M A M J J A S O N D J F M A M J
Month (October 1998 - June 2001)
Ave
rage
mon
thly
tem
pera
ture
(°C
)
0
40
80
120
160
200
240
280
Mon
thly
rai
nfal
l (m
m)
Yarrowitch (rainfall) Arm idale (rainfall)Yarrowitch (Tm ax) Yarrowitch (Tm in)Arm idale (Tm ax) Arm idale (Tm in)
Figure 4.2 Monthly summaries of average maximum and minimum temperatures (°C) and rainfall (mm) at Yarrowitch and Armidale for the period in which the field trials were conducted. The solid lines indicate temperature, closed squares ( ) = maximum temperature (Tmax) at Yarrowitch, open squares ( ) = minimum temperature (Tmin) at Yarrowitch, closed circles ( ) = maximum temperature (Tmax) at Armidale, open circles ( ) = minimum temperature (Tmin) at Armidale. The white columns represent rainfall at Yarrowitch and the grey columns represent rainfall at Armidale. For each trial, cumulative rainfall, the amount of precipitation after the trial was planted, was calculated. Degree day estimates were calculated, based on the cumulative product of temperature and time (UC-IPM 2001). The single sine method was used as it produces relatively low errors during warmer months and in inland areas (Roltsch et al. 1999). A base temperature of 4.4°C was used for lettuce and 5°C for echinacea (Ash et al. 1999). The cumulative rainfall (mm) and accumulated degree days (°Cd) during each field trial is shown in Figure 4.3. In the lettuce trials, the cumulative rainfall at the Armidale sites in 2000 was lower than Yarrowitch in 1999 (P = 0.076) and Kirby in 2001 (P = 0.051). The difference in rainfall between the Yarrowitch in 1999 and Kirby in 2001 was not significant (P = 0.445). In the echinacea trials, rainfall was considerably greater at Yarrowitch compared with Kirby (P = 0.032). There were no significant differences (P > 0.727) in accumulated degree days between the field sites for lettuce or echinacea.
Chapter 4 In-crop weed management methods
57
A
0
40
80
120
160
200
240
280
320
0 2 4 6 8 10W eeks after planting lettuce
Cum
ulat
ive
rain
fall
(m
m)
Yarrowitch 1999Kirby & Laureldale 2000Kirby 2001
B
0
200
400
600
800
1000
1200
0 2 4 6 8 10Weeks after planting lettuce
Deg
ree
days
(°C
d)
Yarrowitch 1999Kirby & Laureldale 2000Kirby 2001
C
0
100
200
300
400
500
600
700
0 4 8 12 16 20 24W eeks after planting echinacea
Cum
ulat
ive
rain
fall
(m
m)
Yarrowitch 1999Kirby 2001
D
0
400
800
1200
1600
2000
0 6 12 18 24W eeks after planting echinacea
Deg
ree
days
(°C
d)
Yarrowitch 1999Kirby 2001
Figure 4.3 Cumulative rainfall (mm) and accumulated degree days (°Cd) during each field trial at Yarrowitch in 1998 – 1999 ( ), Laureldale in 1999 – 2000 ( ) and Kirby in 1999 – 2000 ( ) and 2000 – 2001 ( ) for lettuce (graphs A and B) and echinacea (graphs C and D). In graphs A and B, the closed symbols ( , , ) represent measurements taken up to harvest time, while the open symbols ( , , ) represent measurements after the lettuce was harvested, but while bolting was still being recorded for the remaining plants.
4.2.2 Plant species
The test crops used in the experiments reported in this chapter were echinacea and lettuce. As discussed in the Literature Review (section 2.4), lettuce is a short-season, low-growing crop with relatively short roots and does not form a complete canopy over the planting beds. In contrast, echinacea is a longer-season crop with a taller, spreading growth habit that enables canopy closure and a larger root system. Echinacea seeds were supplied by Subiaco Herbs (Yarrowitch, NSW) in the first year and by Peter Green (Corindi Beach, NSW) in later years. Lettuce seeds were obtained from Purkiss Seeds, (Armidale, NSW). All experiments were conducted using seedlings rather than direct seeding. Echinacea and lettuce seedlings used in the Yarrowitch experiments were grown at the on-farm nursery using organic methods. Lettuce seedlings used in 1999 – 2000 and 2000 – 2001 were grown by Withcott Seedlings (PO Box 9145, Withcott, Queensland, 4352) without the use of synthetic pesticides. The echinacea seedlings used in the Kirby experiment in 2000 – 2001 were grown by Peter Green (Corindi Beach, NSW) using organic methods.
Chapter 4 In-crop weed management methods
58
4.2.3 Preparation and maintenance of the field plots
The experimental area at Yarrowitch was prepared using two passes with a chisel plough to a depth of 250 mm and one pass with a bed-former to create raised beds. The row width was 2 m and the top of the raised bed was 1.5 m wide and 120 mm high. The sides of the beds and the inter-row area were hand weeded in all treatments. Echinacea seedlings, aged approximately 8 weeks, were transplanted from 25 mm cell trays on 20/10/98. They were planted in two rows 600 mm apart with a 300 mm spacing between plants along the rows. Lettuce seedlings, aged approximately 3 weeks were planted in a similar configuration on 11/12/98. The plants were fertilised after planting using organically certified 'Long Life' Dynamic Lifter®, a pelletised poultry manure formulation, at a rate of 70 g per plant. The fertiliser was spread by hand in a circular area around each plant to a radius of 100 mm. The nutrient analysis was nitrogen 4%, phosphorus 3.1%, potassium 1%, calcium 7%, magnesium 0.3%, zinc 0.02 mg/kg and manganese 0.02%. Immediately after planting, the seedlings were watered-in using approximately 5 litres of water for each plant in order ensure that the surrounding soil was well soaked. No further irrigation was applied. The lettuce crop was harvested on 5/2/99 and the echinacea was harvested on 22/3/99. At the Kirby and Laureldale sites, the experimental areas were prepared using two passes with a chisel plough to a depth of 250 mm and two passes with tractor-mounted rotary hoe to a depth of 100 mm. The rows were 2 m wide and the bed width (not including the tractor wheel paths) was 1.75 m wide. The inter-row area was mown in all treatments. The echinacea and lettuce planting configuration and fertilisation regime were the same as that used at Yarrowitch. The lettuce seedlings were planted on 7/1/00 and 8/1/01, and echinacea seedlings on 15/11/00. Immediately after planting, the seedlings were watered-in using approximately 5 litres of water for each plant. Watering was repeated three further times at 2-day intervals after the first irrigation. No further irrigation was applied. Lettuce was harvested on 26/2/00 and 28/2/01, and echinacea was harvested on 4/4/01. The plots used in all experiments were laid out along adjacent prepared and planted beds. The whole area used in each trial was as close to square as possible in order to maximise the area:perimeter ratio. The plots were 10 m long and 2 m wide for lettuce, and 7 m long and 2 m wide for echinacea. Examples of field trial layouts after planting crop seedlings and applying the treatments for lettuce and echinacea are shown in Figure 4.4.
Chapter 4 In-crop weed management methods
59
A
B
Figure 4.4 Examples of field trial layouts after planting crop seedlings and applying the treatments for (A) lettuce at Kirby in 2000 and (B) echinacea at Yarrowitch in 1999.
4.2.4 Treatments applied
Five weed control treatments were used in the lettuce and echinacea trials. A summary of the treatments used in each trial is presented in Table 4.2. Supplementary hand weeding was used in the tillage and mulch treatments because it was intended that the treatments should have practical relevance to growers. The paper mulch was not used in the 1999 – 2000 trials due to lack of availability. Four replicates were used for each treatment at Yarrowitch and Laureldale and eight replicates were used at Kirby in 2000 and 2001. The replicates were allocated to plots in a
Chapter 4 In-crop weed management methods
60
completely randomised design and randomisation was achieved using a list of random numbers generated by the rand() function in Excel®. Table 4.2 Summary of experiments reported in this chapter and the treatments applied in each experiment.
Site Year Crop Control Hand weeding Tillage Hay
mulch Paper mulch
Yarrowitch 1998 – 1999 echinacea lettuce
Laureldale & Kirby 1999 – 2000 lettuce
Kirby 2000 – 2001 echinacea lettuce
A control treatment, in which weeds were allowed to grow unchecked, was used to determine the background weed load and the comparative effect on crop yield of doing nothing to control weeds. A hand weeding treatment was used to both test its efficacy and cost effectiveness in controlling weeds, and to act as a weeded pseudo-control for determining crop yield in a situation with minimal competition from weeds (Donald 2000). Hand weeding was carried out at 4 weeks after planting (WAP) in lettuce and at 4, 8 and 12 WAP in echinacea, and consisted of manually removing weeds using a wheel-mounted stirrup hoe (Figure 4.5A) for weeding along the rows and a chipping hoe for removing weeds between crop plants in the planting row. The wheel hoe blade was 230 mm across and 30 mm wide and was used at a depth of 50 mm, with some deeper tilling required for larger individual weeds. The chipping hoe had a 100 mm wide blade and was used to a depth of about 100 mm. The tillage treatment, carried out at 4 WAP in lettuce and at 4, 8 and 12 WAP in echinacea, consisted of mechanically removing weeds using a tractor-mounted rigid tine chisel plough (Figure 4.5B). The plough had seven 50 mm wide tines operating at a depth of 130 mm. The tines were arranged so that two tines ran outside each of the crop rows, and three tines ran between the two crop rows along the middle of the bed. The operating speed was about 5 km/hour. Immediately after each tillage operation, a chipping hoe was used to remove weeds growing in the planting row between the crop plants, but no attempt was made to remove all weeds in close proximity to the crop plants. Two mulch treatments were used (Figure 4.5C and Figure 4.5D). A hay mulch, predominantly ryegrass (Lolium sp.) and oats (Avena sativa L.), was applied to a thickness of 100 mm (9.5 tonnes/ha) after the crop seedlings were planted, and at 4 WAP weeds immediately around the crop plants were manually removed by hand pulling and a further 0.5 tonnes/ha of hay was added. A paper mulch, composed of pelletised and dried waste paper slurry, was applied to a thickness of 30 mm (42 tonnes/ha) after the crop seedlings were planted. At 4 WAP, weeds immediately around the crop plants were manually removed by hand pulling.
Chapter 4 In-crop weed management methods
61
A B
C D
Figure 4.5 In-crop weed control treatments used in the trials: (A) wheel-mounted stirrup hoe used for the hand weeding treatment, (B) chisel plough used in the tillage treatment at Laureldale and Kirby, (C) hay mulch and (D) paper mulch. In the trials at Kirby in 2000 and 2001, a number of pre-crop treatments were tested in combination with the in-crop treatments in an incomplete factorial design. The effects of those pre-crop treatments and their interaction with the in-crop treatments are discussed in the following chapter. The bare fallow and green fallow pre-crop treatments had similar effects on subsequent weed and lettuce growth (P ≥ 0.11), therefore, the in-crop weed and lettuce data were pooled for those two treatments in this chapter.
4.2.5 Assessment
Assessments of various weed and crop parameters were carried out during the trials. These measurements were not taken within 1 m of the ends of each plot, nor within 250 mm of the sides of each plot. Weeds
Weeds were defined as any non-crop plant growing in the experimental plots. The spatial distribution of weed species across the field trials was highly variable and, in some cases, limited to distinct patches. The distributions were not related to the treatments used in the experiment, but
Chapter 4 In-crop weed management methods
62
were based on the pre-existing weed seed bank. The predominant weed species at each site were noted, but no attempt was made to quantify the growth of weeds by taxon or type (e.g. broad-leaved vs. grass, perenniality). The following measurements of weed growth were made in the lettuce trials. Weed density (weeds/m2) was measured using a 0.5 m x 1 m quadrat placed lengthwise in the middle of the plot and counting all emerged weeds manually. In the first year's trial, weed density was recorded at harvest only, i.e. 7 WAP lettuce. In the second and third years, weed density was recorded at 2, 4 (prior to carrying out the scheduled weed control treatments) and 7 WAP. Weed biomass was measured at crop harvest by placing a 0.5 m x 1 m quadrat randomly within the plots, cutting all weeds at ground level, drying the cut weeds at 80°C for 72 hours and weighing the dried weeds. Measurements of weed growth in the echinacea trials included weed density and biomass, both recorded at harvest, i.e. 21 WAP. Similar methods were used to those used for weed measurements in the lettuce trials. The relative cover of weeds was also measured in all trials, as described below. Crops
The height and diameter of lettuce were recorded at 2, 4 and 7 WAP. Five plants were sampled in each plot, using the 5th, 10th, 15th, 20th and 25th plant from the northern or eastern end of the plots, depending on the orientation of the rows. Height measurements were taken from the ground immediately adjacent to the plant base up to the tip of the highest leaf and diameter measurements were taken across the longest leaf tip-to-leaf tip distance. The relative cover of the lettuce plants was also recorded at the same time as the height and diameter measurements using the method described below. At harvest, eight lettuces were cut at ground level, roughly chopped, dried at 80°C for 72 hours and weighed. At 7, 9 and 10 WAP, the number of bolting lettuces was counted in each plot and those counts were converted to a percentage of total number of plants in each plot. A lettuce was considered to have bolted if the flower stalk had begun to form. The height, diameter and number of flowers (capitula) of echinacea were recorded at 4, 8, 12, 16, 18 and 21 WAP. Height and diameter measurements were assessed in the same way as for lettuce. Flower counts were based on the number of capitula per sampled plant with a diameter of ≥ 20 mm. Flowering is used by echinacea growers as an indicator of crop maturity and readiness for harvest (P. Green, pers. comm.). The relative cover of the echinacea plants was recorded at 4, 6, 8, 10, 12, 16, 18, 20 and 21 WAP using the method described in the section below. Crop biomass at harvest (21 WAP) was determined by sampling 10 plants in the centre of the plot. The soil was loosened around the plants using a garden fork and the plants were pulled up and separated into shoots (i.e. all above-ground plant parts) and roots sub-samples by cutting plants at the base of the main stem. The roots were roughly chopped to aid drying. Both sub-samples were dried at 80°C for 72 hours and weighed. Relative cover
The proportion of ground cover occupied by bare ground (i.e. no vegetation), weeds or crops, referred to here as relative cover, was determined periodically during the growing seasons using 100 ASA Kodak film stock and a Nikon FG 35 mm camera with a zoom lens set at a focal length of 35 mm. The aperture setting was adjusted according to the prevailing light conditions and the shutter speed was maintained at 1/125 second. The camera was held above the centre of the plot in a horizontal position at a height of 1.5 m and the bottom edge of the view in the camera's view finder was kept perpendicular to the crop rows. The area captured in the photographs was 0.87 m2 (1.11 m long and 0.78 m wide). The field of view included both rows of lettuce or echinacea in each
Chapter 4 In-crop weed management methods
63
plot, an ~600 mm wide strip between the two crop rows, and an ~250 mm wide strip on the outside of the crop rows. The photographs were 176 mm long x 126 mm wide. Relative cover was assessed by placing a 28 x 20 cell grid over the photographs and manually counting the cells according to the predominant ground cover category, either weed, crop or bare ground (or mulch). The grid consisted of a pane of glass that was slightly larger than the photographs, with lines etched and painted at 6.3 mm intervals. The counts were converted from a proportion of the total number of grid cells to a percentage. In the lettuce trials, relative cover was assessed at 2, 4 and 7 WAP. In the echinacea trials, relative cover was assessed at 4, 6, 8, 10, 12, 16, 18, 20 and 21 WAP. Cost of treatments
A cost-benefit analysis was used to determine the effect of weed control treatments on the net return on a $/ha basis. The analysis only considered the changes in costs due to the various treatments. The cost of each weed control treatment was based on the amount of materials used, the labour required and machinery usage. All other variable and fixed costs associated with the production of the crop, such as irrigating and fertilising, depreciation and interest on credit, were considered to be equal between treatments and were not included in calculating costs. The cost for the hand weeding treatment consisted of labour only, while the tillage treatment costs included tractor/implement usage, driver's labour, and supplementary chipping along the planting rows. The costs of the two mulching treatments were based on the price of the mulch, labour to apply the mulch and labour for supplementary hand weeding at 4 WAP. The costs for machinery and implement usage were obtained from the farm manager at Subiaco Herbs (P. Brown, pers. comm.) and at Kirby Research Station (N. Thomas, pers. comm.). There were no costs associated with the control treatment. Labour was assumed to cost $15/hour, including 20% on-costs and the mulches cost $110/tonne and $200/tonne for hay and paper respectively, not including transport. The amount of mulch required was 8 tonnes/ha of hay mulch and 42 tonnes/ha of paper mulch. The cost of the tillage treatment, including tractor, ploughing implement and the driver's labour, was $48.82/ha at Yarrowitch and $56.76/ha at Laureldale and Kirby. Weed control treatment costs were converted to $/ha so that comparisons could be made with crop yield. Crop yield in $/ha was calculated by multiplying the wholesale price ($/kg) by the crop biomass (kg/ha). The prevailing wholesale prices in 1999 were $0.58/kg for lettuce (Heisswolf et al. 1999a), $20.00/kg for echinacea roots and $4.00/kg for echinacea shoots (P. Green, pers. comm.). Organically certified commodities often attract premium prices, however conventional prices were used in this study. Adjusted crop values (ACV) were derived by subtracting the cost of each treatment at each site from the crop yield or gross crop value (GCV). The adjusted values provided a measure of the relative cost effectiveness of the treatments in each trial.
4.2.6 Statistical analysis
Data analyses were carried out using the statistical functions available in S-Plus 2000® (MathSoft 1999a, MathSoft 1999b, MathSoft 1999c) and a number of extra functions written for use in S-Plus 2000. In most cases, the GLMs were used, via the glm function, as they allow for dependence of the variance on the mean (McCullagh and Nelder 1989). GLMs provide the ability to specify the type of distribution of the response variable through the use of family functions that define the link and variance functions (MathSoft 1999a). This overcomes the need to perform ad-hoc transformations that attempt to stabilize the mean-variance relationship for variables that are non-normal in distribution, and allows the response variables to be analysed on their original scale (Smyth and Verbyla 1999, Lane 2002). The Tweedie family was used to define the response distribution for variables which could not be satisfactorily modelled using the common distributions available in S-Plus such as gaussian (normal), binomial, and poisson (Jørgensen 1997, Smyth 2001). The Tweedie family function is
Chapter 4 In-crop weed management methods
64
used in the GLM to allow the power variance function and power link to be specified. A power variance, p, of zero signifies a gaussian distribution, p = 1 signifies a poisson distribution, p = 2 a Gamma distribution, p = 3 and p = 4 an inverse gaussian distribution. The appropriate power variances were derived by computing the sample mean and sample variance for each treatment and then regressing logarithms of the variances against the logarithms of means. The resulting slope coefficient was used as an estimate of p (Smyth and Verbyla 1999). The GLM function produces an Analysis of Deviance table with a Chi-square test for significance of the explanatory variables. The P-value is presented to indicate the level of significance, with a value of 0.05 or less regarded as significant. A goodness of fit test was conducted to ensure that the data conformed to the assumed underlying distribution by comparing the residual deviance with the underlying Chi-square distribution. When the goodness of fit test reported a significant value, i.e. ≤ 0.05, the model was considered unsuitable and the results from that GLM were not used. The dispersion was also estimated in order to protect against erroneous results from over- or under-dispersed data that did not fit the assumed distribution. Dispersion was calculated by dividing the residual Chi-square statistic by the residual degrees of freedom (MathSoft 1999c). Linear regressions were performed using the linear regression modelling function in S-Plus. This function calculates several values of interest including an Analysis of Variance (AOV) table, an r2 value, the regression coefficients (and their standard errors and P-values) (MathSoft 1999a). Diagnostic plots were generated and assessed to confirm that the data fulfilled the assumptions of the model, particularly homogenous variance and normality of distribution. For several weed and crop variables, the response was described using a quadratic function,
2cxbxay ++= Equation 4.1 where y is the response variable, x is the explanatory variable, and a, b and c are the regression coefficients. Relative echinacea cover was fitted to a cubic function,
32 dxcxbxay +++= Equation 4.2 where y is the response variable, x is the explanatory variable, and a, b, c and d are the regression coefficients. Polynomial regression was used for simplicity of computing, although it is acknowledged that polynomial regression has a number of limitations including biologically unrealistic functions (e.g. values greater than 100%) and difficulties deriving predicted values and extrapolating (Thornley and Johnson 1990, Venables and Ripley 1999). Separation of the treatment means was achieved using contrast analysis, rather than multiple comparison methods. Contrasts are suitable for factorial experiments, including unbalanced layouts and may be used with GLMs. They enable straightforward interpretation and provide superior error protection (Pearce 1993, Venables and Ripley 1999, Riley 2001). Results from measurements repeated over a period of time cannot be assumed to be independent of each other (Webster and Payne 2002), therefore they were analysed as GLMMs using the SAMM suite of functions in S-Plus (Butler et al. 2000). The SAMM functions allow for non-normally distributed data and use the ASReml program to evaluate fixed and random effects using restricted maximum likelihood (Butler et al. 2000, Gilmour et al. 2002). Time was expressed as accumulated degree days (°Cd). The effects of degree days, trial, weed control treatment and their interactions were evaluated as fixed effects and the effects of plot location within the field trials (and its interaction with time) were evaluated as random effects. The response variables relative weed cover and relative crop cover were analysed using the binomial family function. The suitability of the models was assessed by inspecting the plot of residuals versus fitted values and by observing which random terms increased the log residual likelihood. The heterogeneity of the variance (deviance divided by the degrees of freedom) was also checked to ensure that it was close to one, signifying that the chosen distribution was satisfactory. An AOV table with P-values based on the Chi-squared test was generated to evaluate the significance of the fixed effects.
Chapter 4 In-crop weed management methods
65
Standard errors of the means were used to show the variability of the mean values for categorical data (e.g. weed control treatments) and confidence limits are used to represent the variability of continuous data (e.g. over time). The correlation between two variables is reported as an r2 value, and only values of about 0.8 or above are considered to express a strong relationship (Riley 2001). The Student’s t-test was used to determine whether the cumulative rainfall and degree days differed between the field sites. A standard 2-sample t-test was performed, with checks on the assumption of normality and the presence of outliers carried out (MathSoft 1999a).
4.3 Results
4.3.1 Weeds
Weed species observed
The most abundant weeds, based on observations at the three field sites, are listed in Table 4.3. The weed flora at Yarrowitch was heavily dominated by the three grasses Digitaria sanguinalis (L.) Scop., Paspalum dilatatum and Setaria pumila (Poir.) Roem. & Schult., with almost no individuals of broad-leaved weeds achieving canopy dominance. At Laureldale, the weed flora was predominantly composed of the broadleaved weeds Polygonum aviculare L. and Hibiscus trionum L., and the grasses Echinochloa crus-galli (L.) and P.Beauv. Digitaria sanguinalis (L.) Scop. The trials at Kirby were mostly infested with Acetosella vulgaris Fourr., Polygonum aviculare, Festuca arundinacea Schreb. and Conyza bonariensis (L.) Cronquist in both growing seasons (2000 and 2001). Vulpia myuros (L.) C.C.Gmel. became more common in the second season. Table 4.3 Weeds that were most abundant at the three field sites, based on observations made during the growing seasons at each trial. Field site Weed
Vulpia myuros (L.) C.C.Gmel. (rat's tail fescue) Weeds in lettuce
Weed growth during trials
The response of relative weed cover to the weed control treatments during the lettuce trials at Yarrowitch in 1999, Laureldale and Kirby in 2000 and Kirby in 2001 is shown in Figure 4.6. An analysis of the response using GLMMs was carried out with time (degree days), trial, treatment and their interactions as fixed effects. All fixed effects were highly significant (P < 0.001), except the trial by time interaction term (P = 0.031). The relationship between relative weed cover and time (WAP) fitted a quadratic function (Equation 4.1) for all treatment by trial combinations (r2 ≥ 0.80)
Chapter 4 In-crop weed management methods
66
except the tillage treatment at Yarrowitch (r2 ≥ 0.72) and Kirby in 2001 (r2 ≥ 0.63). Relative weed cover in the tillage treatment in these trials showed greater variability than the other trials, especially at harvest (7 WAP). While the control treatment was the most variable (average standard error = 2.7% relative weed cover), tillage was also relatively variable (1.4%) and hand weeding, hay mulch and paper mulch were less variable (0.7, 0.5 and 0.9% respectively). Relative weed cover increased most rapidly over time in the control treatment. Averaged across all trials, the mean relative cover in that treatment was 1.6%, 18.0% and 43.1% at 2, 4 and 7 WAP respectively. A moderate increase was observed for the tillage treatment, rising from a mean relative cover of 1.9% at 2 WAP, to 10.4% at 4 WAP and 12.9 at 7 WAP. The weeding operation at 4 WAP in the hand weeding and tillage treatments appeared to effectively limit further weed growth up to 7 WAP. Relative weed cover in the hand weeding, hay mulch and paper mulch treatments not rise significantly during the trials. At Yarrowitch, the emerged weeds in the hay mulch plots were mainly from the existing weed population (e.g. paspalum, pigeon grass) while at the other sites weed seeds contained in the mulch were the dominant source of weeds.
0
20
40
60
80
100Control
Yarrowitch 1999Hand weeding
Yarrowitch 1999Tillage
Yarrowitch 1999Hay mulch
Yarrowitch 1999Paper mulch
Yarrowitch 1999
0
20
40
60
80
100Control
Laureldale 2000Hand weeding
Laureldale 2000Tillage
Laureldale 2000Hay mulch
Laureldale 2000Paper mulch
Laureldale 2000
0
20
40
60
80
100Control
Kirby 2000Hand weeding
Kirby 2000Tillage
Kirby 2000Hay mulchKirby 2000
Paper mulchKirby 2000
0
20
40
60
80
100
200 400 600 800
ControlKirby 2001
200 400 600 800
Hand weedingKirby 2001
200 400 600 800
TillageKirby 2001
200 400 600 800
Hay mulchKirby 2001
200 400 600 800
Paper mulchKirby 2001
Accumulated degree days (°Cd)
Rel
ativ
e w
eed
cove
r (%
)
Figure 4.6 Effect of weed control treatments applied in the lettuce trials on relative weed cover (%) over time (accumulated degree days [°Cd]). The circles show the data points, the solid lines are the quadratic regression curves and the dashed lines are the 95% confidence limits. The paper mulch treatment was not used in 2000. Weed density, biomass and relative cover at harvest
The response of weed density, biomass and relative cover at lettuce harvest is shown in Figure 4.7. Weed density differed significantly (P < 0.001) between the trials, treatments and in the interaction of trials and treatments (Figure 4.7A). The weed density of the control treatments gave an indication of the size of the existing weed populations in the absence of any weed control effort. Weed density was highest at Yarrowitch, with 715 weeds/m2, which was more than double the density at Kirby in 2001 and about 10 times more than that at Laureldale and Kirby in 2000.
Chapter 4 In-crop weed management methods
67
The weed density in the controls was usually greater than the other treatments, except at Laureldale where it was equivalent to tillage and hay mulch. The tillage treatments showed higher weed densities compared with the hand weeded and mulched treatments at Yarrowitch and Kirby in 2001. In general, the lowest weed densities were observed in the hand weeded plots. However at Kirby in 2000, tillage, hand weeding and mulching were equivalent (P = 0.664) and in 2001 the paper mulch produced a similarly low weed density compared with hand weeding (P = 0.724). Averaging the treatments for each trial, the control yielded 259 weeds/m2, tillage produced 80 weeds/m2, hay mulch 53 weeds/m2, paper mulch 27 weeds/m2 and hand weeding 14 weeds/m2. The difference in weed density of the control treatments between the two seasons at Kirby was very large, i.e. about 50 weeds/m2 in 2000 and 335 weeds/m2 in 2001. Staff at Yarrowitch also reported that weed levels had increased in the three years of annual cropping, prior to using the land for sheep grazing (P. Brown, pers. comm.). Weed biomass followed a similar pattern to weed density in response to the weed control treatments applied in each lettuce trial, and the differences between trials, treatments and in the interaction of trials and treatments were significant (P < 0.001) (Figure 4.7C). Averaged across all trials, the unweeded control produced the greatest weed biomass (1,450 kg/ha), followed by tillage (498 kg/ha) and then hay mulch (268 kg/ha). The weed biomass accumulation in the hay mulch plots was due to the germination and growth of grass seeds, predominantly ryegrass (Lolium sp.) and oats (Avena sativa L.), in the hay, rather than pre-existing weeds. Paper mulch and hand weeding produced similar weed biomasses (both about 59 kg/ha). Expressed as a percentage of the weed biomass for the control treatment (i.e. as a proportion of the background weed levels), this represents an average reduction of weeds by 96% for hand weeding and paper mulch, 80% for hay mulch and 66% for tillage. The trial:treatment interaction was significant because of (a) the relatively low weed biomass in the hay mulch at Yarrowitch compared to the other sites, probably due to more thorough supplementary hand weeding at 4 WAP; and (b) the low weed biomass in the tilled plots at Kirby in 2000, possibly due to the ploughing being more effective with the lower weed load.
Chapter 4 In-crop weed management methods
68
A
1
10
100
1000
Yarrowitch1999
Laureldale2000
Kirby 2000 Kirby 2001
Trial
Log
wee
d de
nsity
(wee
ds/m
2 ) control hand tillage hay paper
B
0
1
10
100
Yarrowitch1999
Laureldale2000
Kirby 2000 Kirby 2001
Trial
Log
rela
tive
wee
d co
ver (
%)
control hand tillage hay paper
C
1
10
100
1,000
10,000
Yarrowitch1999
Laureldale2000
Kirby 2000 Kirby 2001
Trial
Log
wee
d bi
omas
s (k
g/ha
) control hand tillage hay paper
Figure 4.7 Response of (A) weed density (log[weeds/m2]), (B) relative weed cover (log[%]) and (C) weed biomass (log[kg/ha]) at lettuce harvest to the weed control treatments applied in the field trials. The columns show the mean of each treatment at each site and the error bars show the standard error of the means. The legends refer to the weed control treatments. The results for relative weed cover (Figure 4.7B) followed a similar pattern as for weed biomass and, to a lesser extent, weed density, with all terms showing significant differences (P < 0.001).
Chapter 4 In-crop weed management methods
69
When the data were averaged across all trials, the unweeded control produced the highest relative cover (43%), followed by tillage (13%), hay mulch (6%), paper mulch (7%) and hand weeding (2%). Relative weed cover for the control treatment was highest at Yarrowitch and Kirby in 2001 and significantly lower at Laureldale and Kirby in 2000. A comparison of the relationships between the three weed variables indicated that relative weed cover was well correlated with weed biomass in all lettuce and echinacea trials (r2 ≥ 0.826). The relationships between weed biomass and relative cover in the trials are shown in Figure 4.8. The weed density-relative cover and weed density-biomass relationships were also closely correlated in the trials at Yarrowitch and Kirby in 2001 (r2 ≥ 0.896), but not at Laureldale and Kirby in 2000 (r2 ≤ 0.582).
0
1
2
3
Yarrowitch 1999
y = -0.1 + 0.04 x
r² = 0.938
Laureldale 2000
y = 0.24 + 0.04 x
r² = 0.826
0
1
2
3
0 20 40 60 80
Kirby 2000
y = -0.01 + 0.04 x
r² = 0.85
0 20 40 60 80
Kirby 2001
y = 0.03 + 0.03 x
r² = 0.963
Relative weed cover (%)
Wee
d bi
omas
s (1
,000
kg/
ha)
Figure 4.8 The relationship between weed biomass (1,000 kg/ha) and relative weed cover (%) at harvest for the lettuce trials. The circles represent the data points and the solid lines are the linear regression curves defined by the equation on each graph. The correlation coefficient, r2, is also given. The relationship between weed variables (density, biomass and relative cover) and lettuce yield variables (relative cover and crop yield) at harvest was assessed using linear regression. The three weed variables had poor correlations with crop yield (r2 ≤ 0.170) and relative crop cover (r2 ≤ 0.388). The regression slopes were not significant for crop yield (P ≥ 0.059), and were only significant for relative crop cover at Yarrowitch (P ≤ 0.013, b = -0.01 to -0.44). Treatments with low relative weed cover may also have had lower crop yields (e.g. paper mulch), whilst treatments with moderate weed levels may have had reasonable crop yields (e.g. tillage). Weeds in echinacea
Weed growth during trials
The response of relative weed cover to the weed control treatments during the echinacea trials at Yarrowitch in 1999 and Kirby in 2001 is shown in Figure 4.9. An analysis of the response using GLMMs was carried out with time (degree days), trial, weed control treatment and their
Chapter 4 In-crop weed management methods
70
interactions as fixed effects and all terms were highly significant (P ≤ 0.003). The relationship between relative weed cover and time fitted a quadratic function (Equation 4.1) for all treatment by trial combinations (r2 ≥ 0.80) except the tillage treatment at Yarrowitch (r2 = 0.57) and Kirby (r2 = 0.77). The average standard error for relative cover was 4.3% for tillage, 1.8% for the control treatment and between 0.5% and 0.7% for the other treatments. These differences indicate that the tillage treatment was more variable than the other treatments. Relative weed cover increased rapidly early in the trials for the unweeded control treatment, rising from an average of the two trials of 7.3% at 4 WAP (~ 285 °Cd) to 87.4% at 6 WAP (~ 440 °Cd), and then rising only slightly to an average of about 96% for the rest of the experiments. The weed cover at Yarrowitch was more variable in the final weeks of the experiment, i.e. 18 – 21 WAP (~ 1,630 – 1,850 °Cd), as the tall grass weeds began to lodge, revealing the stunted echinacea plants lower down in the canopy.
0
20
40
60
80
100
ControlYarrowitch 1999
Hand weedingYarrowitch 1999
TillageYarrowitch 1999
Hay mulchYarrowitch 1999
Paper mulchYarrowitch 1999
0
20
40
60
80
100
0 500 1000 1500 2000
ControlKirby 2001
0 500 1000 1500 2000
Hand weedingKirby 2001
0 500 1000 1500 2000
TillageKirby 2001
0 500 1000 1500 2000
Hay mulchKirby 2001
0 500 1000 1500 2000
Paper mulchKirby 2001
Accumulated degree days (°Cd)
Rel
ativ
e w
eed
cove
r (%
)
Figure 4.9 Effect of weed control treatments applied in the echinacea trials on relative weed cover (%) over time (accumulated degree days [°Cd]). The circles show the data points, the solid lines are the quadratic regression curves and the dashed lines are the 95% confidence limits. The tillage treatment reduced relative weed cover significantly compared with the control (P < 0.001). However, the response of weed cover over time differed in the two trials. At Yarrowitch, weed cover increased more rapidly during the early weeks of the trial, i.e. from 1.6% at 4 WAP (235 °Cd) to 35.2% at 12 WAP (933 °Cd), and then maintained a similar level for the rest of the trial. At Kirby, the weed cover increased slowly early in the trial, i.e. from 1.0% at 4 WAP (355 °Cd) to 6.8% at 12 WAP (1160 °Cd), but rose quickly in the later weeks to a final coverage of about 58%. Relative weed cover in the hand weeding, hay mulch and paper mulch treatments did not rise significantly during the trials. Averaged across the two trials, these treatments produced significantly lower relative weed covers than tillage from 6 WAP (~ 440 °Cd) onwards, but they were not significantly different from each other at any time. At Yarrowitch, the emerged weeds in the hay mulch plots were mainly from existing weed growing throughout the paddock (e.g. paspalum, pigeon grass) while at the other sites weed seeds contained in the mulch were the dominant source of weeds in the experimental plots and those weeds did not occur elsewhere.
Chapter 4 In-crop weed management methods
71
Weed density, biomass and relative cover at harvest
The response of weed density, biomass and relative cover at echinacea harvest is shown in Figure 4.10. The effect of the weed control treatments on weed density at echinacea harvest was similar in both trials (Figure 4.10A), although the weed densities of the control and tillage treatments at Kirby were lower (P = 0.018 and 0.031 respectively) than at Yarrowitch. There was a large difference in the underlying weed load, as indicated by the weed densities of the control treatments, with 930 weeds/m2 at Yarrowitch and 560 weeds/m2 at Kirby. The interaction between trial and treatment was not significant (P = 0.72). The treatment effect on weed density was highly significant (P < 0.001). The highest densities, averaged for both trials, were recorded for the unweeded control (745 weeds/m2) and the tillage treatment (401 weeds/m2). The hand weeding (85 weeds/m2), hay mulch (72 weeds/m2) and paper mulch (38 weeds/m2) produced similar weed densities (P > 0.68). Tillage reduced the density of weeds present (compared with the control treatment) by about 46%, whilst the hand weeding and mulches reduced weed densities by between 89% and 94%. The treatment and site effects on weed biomass at the echinacea harvest (Figure 4.10C) showed the same trends as for weed density. Again, the effects of trial and treatment were significant (P = 0.006 and P < 0.001 respectively), but the interaction was not significant (P = 0.1234). Weed biomass was greatest in the control treatment (11,200 kg/ha at Yarrowitch and 6,500 kg/ha at Kirby) and moderately high in the tillage plots (average of 3500 kg/ha for both sites). The final weed biomass of the other treatments, ranging from 150 to 200 kg/ha, did not differ significantly (P > 0.88). A 60% reduction in weed biomass by tillage, compared with unweeded plots, was observed. Hand weeding, hay mulch and paper mulch reduced weed biomass by an average of 98%.
Chapter 4 In-crop weed management methods
72
A
1
10
100
1,000
Yarrowitch 1999 Kirby 2001Trial
Log
wee
d de
nsity
(wee
ds/m
2 )
control hand tillage hay paper
B
0
1
10
100
Yarrowitch 1999 Kirby 2001Trial
Log
rela
tive
wee
d co
ver (
%)
controlhandtillagehaypaper
C
1
10
100
1,000
10,000
100,000
Yarrowitch 1999 Kirby 2001Trial
Log
wee
d bi
omas
s (k
g/ha
)
control hand tillage hay paper
Figure 4.10 Response of (A) weed density (log[weeds/m2]), (B) relative weed cover (log[%]) and (C) weed biomass (log[kg/ha]) at echinacea harvest to the weed control treatments applied in the field trials. The columns show the mean of each treatment at each site and the error bars show the standard error of the means. The legends refer to the weed control treatments. The relative cover of weeds (Figure 4.10B) also showed a similar pattern to the density and biomass measurements in response to the treatment and site effects and their interaction. The relative weed cover for the tillage treatment differed between the two trials (P = 0.017), but the
Chapter 4 In-crop weed management methods
73
other treatments did not (P ≥ 0.130), and the interaction term was non-significant (P = 0.098). Averaging the data for the two sites, weeds almost completely covered the control plots (95%), half covered the tillage plots (46%) and were a very small proportion of the ground cover in the hand weeded, paper mulched and hay mulched plots (5%, 4% and 1% respectively). The treatment differences were significant (P < 0.001). A comparison of the relationships between the three weed variables indicated that relative weed cover was well correlated with weed biomass in both echinacea trials (r2 ≥ 0.878). The relationships between weed biomass and relative cover in the trials are shown in Figure 4.11. The weed density-relative cover and weed density-biomass relationships were also closely correlated in the echinacea trials (r2 ≥ 0.920).
0
5
10
15
0 20 40 60 80 100
Yarrowitch 1999
y = 0.08 + 0.12 xr² = 0.878
0 20 40 60 80 100
Kirby 2001
y = -0.27 + 0.06 xr² = 0.899
Relative weed cover (%)
Wee
d bi
omas
s (1
,000
kg/
ha)
Figure 4.11 The relationship between weed biomass (1,000 kg/ha) and relative weed cover (%) at harvest for the echinacea trials. The circles represent the data points and the solid lines are the linear regression curves defined by the equation on each graph. The correlation coefficient, r2, is also given. The relationships between weed variables (density, biomass and relative cover) and echinacea yield variables (relative cover and crop yield) at harvest were assessed using linear regression. Of the three weed variables, relative cover had the highest correlation with both crop yield and relative crop cover in all trials and the slopes were all negative and significant (P ≤ 0.002). The correlation of relative weed cover was stronger with relative crop cover (r2 = 0.985 and 0.570 at Yarrowitch and Kirby respectively) than with crop yield (r2 = 0.750 and 0.423 at Yarrowitch and Kirby respectively). The paper mulch had low weed levels but also had lower crop yields, so excluding the paper mulch treatment improved the correlations (r2 ≥ 0.80). However, in general, higher relative weed cover was clearly associated with lower yields of echinacea.
4.3.2 Lettuce
Relative crop cover during trials
The response of relative crop cover to the weed control treatments during the lettuce trials at Yarrowitch in 1999, Laureldale and Kirby in 2000 and Kirby in 2001 is shown in Figure 4.12. Time was expressed as accumulated degree days (°Cd). The relationship between relative weed cover and time was linear, with r2 ≥ 0.80 for all treatment by trial combinations. An analysis of the response using GLMMs was carried out with time, trial, weed control treatment and their
Chapter 4 In-crop weed management methods
74
interactions as fixed effects. All fixed effects were highly significant (P < 0.001) except the trial by time interaction, which was slightly non-significant (P = 0.067).
0
20
40
60
80
100Control
Yarrowitch 1999Hand weeding
Yarrowitch 1999Tillage
Yarrowitch 1999Hay mulch
Yarrowitch 1999Paper mulch
Yarrowitch 1999
0
20
40
60
80
100Control
Laureldale 2000Hand weeding
Laureldale 2000Tillage
Laureldale 2000Hay mulch
Laureldale 2000Paper mulch
Laureldale 2000
0
20
40
60
80
100Control
Kirby 2000Hand weeding
Kirby 2000Tillage
Kirby 2000Hay mulchKirby 2000
Paper mulchKirby 2000
0
20
40
60
80
100
200 400 600 800
ControlKirby 2001
200 400 600 800
Hand weedingKirby 2001
200 400 600 800
TillageKirby 2001
200 400 600 800
Hay mulchKirby 2001
200 400 600 800
Paper mulchKirby 2001
Accumulated degree days (°Cd)
Rel
ativ
e le
ttuce
cov
er (%
)
Figure 4.12 Effect of weed control treatments applied in the lettuce trials on relative lettuce cover (%) over time (accumulated degree days [°Cd]). The circles show the data points, the solid lines are the linear regression curves and the dashed lines are the 95% confidence limits. The paper mulch treatment was not used in 2000. The effect of cumulative rainfall on relative crop cover was also tested, and the results were similar to the effect of time (degree days). The linear correlations were high, i.e. r2 = 0.81 – 0.98, except the control treatments where r2 ≥ 0.57, and the fixed effects were all highly significant (P ≤ 0.001). This indicates that lettuce growth was closely related to the amount of rainfall received. The slope coefficient from the regression may be used as an indicator of the growth rate of the crop. In the lettuce trials, degree day accumulation in a 1 week period was approximately 100°Cd. Therefore, a b value of 0.05 would be equivalent to about 5% increase in relative cover per week. At Yarrowitch, b was about 0.05 for the control and paper mulch treatments and double that for the hand weeding, tillage and hay mulch treatments (b ≈ 0.11). At Laureldale in 2000, hand weeding and hay mulch had similar slopes (b = 0.05 and 0.06 respectively), while the control and tillage (b = 0.03 and 0.04 respectively) were less steep (P = 0.016). At Kirby in 2000, the treatments had equivalent slopes of relative crop cover (b ≈ 0.07), but in 2001, all treatments at Kirby yielded significantly different slopes (P ≤ 0.025). Hand weeding and hay mulch had the highest coefficients (b = 0.06 and 0.07 respectively), tillage produced an intermediate slope (b = 0.05) and the control and paper mulch had smallest coefficients (b = 0.03 and 0.01 respectively). Plant size, relative cover and yield at harvest
The parameters lettuce plant size (height x diameter), relative cover and yield (expressed as fresh weight biomass, tonnes/ha) were measured at harvest (7 WAP) and analysis using GLMs found that their response was significantly different between trials and treatments (P < 0.001). Each of these parameters showed a generally similar pattern in response to the treatments and between trials
Chapter 4 In-crop weed management methods
75
(Figure 4.13). The highest growth and yields were recorded at Yarrowitch, with plants averaging 0.11 m2 in size, 53% relative cover and about 25 tonnes/ha in crop yield. The lettuce growth at Kirby in 2000 was significantly lower than at Yarrowitch (P ≤ 0.002) by about 40% for plant size, 30% for relative cover, and about 10% for yield. The lowest growth was observed in the trials at Laureldale in 2000 and Kirby in 2001, both significantly lower than Kirby in 2000 (P ≤ 0.05). The weed control treatments produced the same ranking for each parameter measured when averaged across the four trials. Hand weeding and hay mulch gave the highest growth and yield, with lettuce plants averaging 0.07 m2 in size, 40% relative cover and about 23 tonnes/ha crop yield. The results for tillage were slightly less (~10 – 19%) than hand weeding and hay mulch, though not significantly (P ≥ 0.089). In the control treatment, plant size was reduced by 28% compared with the hand weeding treatments, relative cover was reduced by one third and yield was down by one quarter. Paper mulch produced the lowest growth and yields, with lettuce plant size reduced by 40%, and relative cover and yield by about 50% compared with hand weeding. The relative performance of the treatments differed between trials, as indicated by the highly significant interaction of trial and treatment in the analysis (P < 0.001). Larger differences were observed at Yarrowitch and Kirby in 2001, while responses to treatments at the other two sites were mostly not significantly different. At Yarrowitch and Kirby in 2001, the rankings generally followed the pattern found for the across-site averages referred to above, i.e. hand weeding = hay mulch = tillage > control > paper mulch. The treatment effects at Kirby in 2000 were smaller, with the only significant differences occurring between hand weeding and tillage (P ~ 0.034). At Laureldale, the treatments produced similar results (P ≥ 0.142).
Chapter 4 In-crop weed management methods
76
A
0.00
0.02
0.04
0.06
0.08
0.10
0.12
0.14
0.16
Yarrowitch1999
Laureldale2000
Kirby 2000 Kirby 2001
Trial
Lettu
ce p
lant
siz
e (m
2 ) control hand tillage hay paper
B
0
10
20
30
40
50
60
70
80
Yarrowitch1999
Laureldale2000
Kirby 2000 Kirby 2001
Trial
Rel
ativ
e le
ttuce
cov
er (%
) control hand tillage hay paper
C
0
10
20
30
40
Yarrowitch1999
Laureldale2000
Kirby 2000 Kirby 2001
Trial
Lettu
ce y
ield
(ton
nes/
ha) control hand tillage hay paper
Figure 4.13 Response of lettuce (A) plant size (height x diameter, m2), (B), relative cover (%) and (C) crop yield (tonnes/ha) at harvest to the weed control treatments applied in the field trials. The columns show the mean of each treatment at each site and the error bars show the standard error of the means. The legends refer to the weed control treatments.
Chapter 4 In-crop weed management methods
77
Bolting
The proportion of lettuces that were bolting at harvest time is shown in Figure 4.14. At 7 WAP, the lettuces in the hand weeding and tillage treatments showed significantly higher rates of bolting (25% and 8% of plants per plot, respectively) compared with the other treatments (P < 0.001). In plots in which the soil was covered by either weeds (i.e. the control treatment) or mulch, only 1 – 2% of the lettuces had bolted. An analysis of the effect of soil relative cover on bolting using GLMs indicated that there was a significant relationship (P < 0.001). The extent of bolting was similar in 1999 and 2000 (2.8 – 4.2% averaged across treatments). However, bolting at Kirby in 2001 was significantly greater (P < 0.001) than the other trials, with about 18% bolting. In particular, lettuces in the hand weeded treatment at Kirby in 2001 had bolted excessively (60%) by harvest time.
0
5
10
15
20
Yarrowitch1999
Laureldale2000
Kirby 2000 Kirby 2001
Trial
Bolte
d le
ttuce
s (%
) control hand tillage hay paper
60.4 ± 6.85
Figure 4.14 Proportion of bolted lettuces (% of plants per plot, n = 48) at harvest in response to the weed control treatments applied in the field trials. The columns show the mean of each treatment at each site and the error bars show the standard error of the means. The legend refers to the weed control treatments. Economic analysis
The direct cost of carrying out each weed control treatment in the four trials is given in Figure 4.15. Paper mulch was the most expensive treatment, costing about $12,100/ha for the initial purchase of the mulch, laying and minor follow-up hand weeding at 4 WAP. About 70% of the cost was related to the purchase of the mulch and 29% to laying the mulch, and 1% for the follow-up hand weeding. The hay mulch was the next most expensive treatment, costing about $7,600/ha. However, the purchase cost of the mulch was considerably less (14% of total cost) than the cost of labour for laying the hay mulch (50%) and subsequent hand weeding (36%). The cost of the hand weeding was approximately $4,400/ha, consisting entirely of labour. The tillage treatment was relatively cheap, about $985, and was made up of 5% for machinery costs and 95% for labour (tractor driving and supplementary hand weeding). No direct financial costs were incurred in the control treatment.
Chapter 4 In-crop weed management methods
78
0
2
4
6
8
10
12
14
Yarrowitch1999
Laureldale2000
Kirby 2000 Kirby 2001
Trial
Cos
t of t
reat
men
t ($1
,000
/ha) Control Hand weeding
Tillage Hay mulchPaper mulch
Figure 4.15 The cost of weed control treatments ($1,000/ha) applied in the field trials. The columns show the mean of each treatment at each site (n = 4). The legends refer to the weed control treatments. The GCVs and the ACVs (i.e. GCV minus treatment cost) are given in Figure 4.16. Graph A shows that the highest GCV was recorded at Yarrowitch ($19,000/ha), followed by Kirby in 2000 ($17,000/ha). The lowest GCVs were observed in the trials at Laureldale in 2000 and Kirby in 2001, $9,400 and $14,200 per ha respectively, both significantly lower than Kirby in 2000 (P ≤ 0.05). Averaged across the trials, the treatments with the highest GCV were hand weeding, hay mulch and tillage, with values for the control treatment slightly lower (P = 0.014), and considerably lower for paper mulch (P < 0.001). These differences were distinct at Yarrowitch in 1999 and Kirby in 2001, but in the 2000 trials the treatment differences were generally not significant, except hand weeding and tillage at Kirby (P = 0.051). The income reported in the gross margin budget for lettuce production in NSW in 2001 was $17,600/ha (NSW Agriculture 2001). The ACV provides a measure of the relative cost effectiveness of the weed control treatments under the experimental conditions imposed (Figure 4.16B). Losses due to bolting were not included in the calculations as the differences were an unexpected result of the experiment, partly limited by the need to harvest all treatments at the same time. It would be expected that, in practice, growers would have harvested the prematurely bolting plants earlier than was done in the trial. Averaged across all trials, the tillage, control and hand weeding treatments resulted in the highest ACVs ($14,600/ha, $13,300/ha and $11,700/ha respectively). Hay mulch, with an ACV of $8,700/ha, was significantly lower than tillage and the control (P ≤ 0.015), but not hand weeding (P = 0.114). Paper mulch yielded a very low ACV, giving a mean loss of $4,100/ha.
Chapter 4 In-crop weed management methods
79
A
0
5
10
15
20
25
30
Yarrowitch1999
Laureldale2000
Kirby 2000 Kirby 2001
Trial
Gro
ss c
rop
valu
e ($
1,00
0/ha
)
control hand tillage hay paper
B
-10
-5
0
5
10
15
20
25
Yarrowitch1999
Laureldale2000
Kirby 2000 Kirby 2001
Trial
Adj
uste
d cr
op v
alue
($1,
000/
ha) Control Hand weeding
Tillage Hay mulchPaper mulch
Figure 4.16 The (A) gross crop value and (B) adjusted crop value ($1,000/ha) of lettuce for each treatment applied in the field trials. The columns show the mean of each treatment at each site and the error bars show the standard error of the means. The legends refer to the weed control treatments. The ACV showed a similar pattern amongst treatments at Yarrowitch and Kirby in 2001. Tillage, hand weeding, the control and hay mulch gave the highest values and paper mulch the lowest. In those trials, the top four treatments were generally not significantly different. At Laureldale, the ACVs for the control and tillage treatments were equivalent (P = 0.902), as were the ACVs for hand weeding and hay mulch (P = 0.913). Those two pairs of treatments were significantly different from each other (P < 0.001). The response of the ACV at Kirby in 2000 was unique amongst the trials in that the control treatment was significantly higher than the other treatments (P ≤ 0.048). Tillage, hand weeding and hay mulch were equivalent, but tillage was slightly higher than hay mulch (P = 0.032).
4.3.3 Echinacea
Relative crop cover during trials
The response of relative crop cover to the weed control treatments during the echinacea trials at Yarrowitch in 1999, Laureldale and Kirby in 2000 and Kirby in 2001 is shown in Figure 4.17. A cubic function (Equation 4.2) was used to describe the change in echinacea relative cover over time (expressed as degree days) and all treatment by trial combinations had high correlations (r2 ≥ 0.80), except the tillage treatment (r2 ≥ 0.79) and paper mulch at Kirby (r2 ≥ 0.66). One replicate in the
Chapter 4 In-crop weed management methods
80
latter treatment showed significantly higher growth towards the end of the trial than the other replicates (P = 0.029) and temporarily excluding this replicate from the regression analysis yielded an r2 of 0.88. An analysis of the response using a GLMM was carried out with time, trial, weed control treatment and their interactions as fixed effects. All fixed effects were highly significant (P < 0.001).
0
20
40
60
80
100
ControlYarrowitch 1999
Hand weedingYarrowitch 1999
TillageYarrowitch 1999
Hay mulchYarrowitch 1999
Paper mulchYarrowitch 1999
0
20
40
60
80
100
0 500 1000 1500 2000
ControlKirby 2001
0 500 1000 1500 2000
Hand weedingKirby 2001
0 500 1000 1500 2000
TillageKirby 2001
0 500 1000 1500 2000
Hay mulchKirby 2001
0 500 1000 1500 2000
Paper mulchKirby 2001
Accumulated degree days (°Cd)
Rel
ativ
e ec
hina
cea
cove
r (%
)
Figure 4.17 Effect of weed control treatments applied in the echinacea trials on relative echinacea cover (%) over time (accumulated degree days [°Cd]). The circles show the data points, the solid lines are the cubic regression curves and the dashed lines are the 95% confidence limits. An analysis of the effect of cumulative rainfall on relative crop cover was also carried out. The results were similar to the effect of time (degree days). The cubic correlations were relatively high, i.e. r2 = 0.76 – 0.95 (except the control treatments where r2 = 0.19 at Yarrowitch and 0.67 at Kirby) and the effects were all highly significant (P ≤ 0.001), apart from the trial by rainfall interaction (P = 0.029). This suggests that echinacea growth was closely related to the amount of rainfall received, except in very weedy plots. The control treatment in both trials produced very little increase in echinacea relative cover over time, with the plants at Kirby slightly decreasing (P < 0.001). At Yarrowitch, the greatest increase in relative cover occurred in the hand weeding and hay mulch treatments (the slope coefficient, b, was approximately 0.07), with both treatments reaching about 96% coverage. The paper mulch at Yarrowitch also produced a strong growth response (b = 0.06) but with a lower asymptote of 86% relative cover. In the tillage treatment, the crop plants had a moderate growth rate (b = 0.04), achieving a maximum relative cover of about 64%. At Kirby, hand weeding and hay mulch treatments gave the greatest increase in crop growth (b ≈ 0.05), with a relative cover at harvest of about 66%. The paper mulch treatment produced a notably smaller growth rate (b = 0.01) compared with paper mulch at Yarrowitch (P < 0.001), causing it to be ranked below tillage (b = 0.02), though not significantly (P = 0.02).
Chapter 4 In-crop weed management methods
81
Apart from the unweeded control, the treatments appear to have reached their asymptote of maximum relative cover at Yarrowitch but not at Kirby. The crops were grown for the same length of time at each site and accumulated the same number of degree days, but Kirby received 43% less rainfall. Some differences in the soil nutrient status between the sites were detected. The possible reasons for the different growth responses between trials are considered in the discussion below. Plant size, relative cover and yield at harvest
The echinacea crop is shown being harvested at Yarrowitch in Figure 4.18. The effect of the weed control treatments applied at Yarrowitch in 1999 and Kirby in 2001 on final echinacea plant size (height x diameter), relative cover and yield (expressed as dry weight biomass, tonnes/ha) is shown in Figure 4.19. Analysis of plant size, relative cover and crop yield using GLMs found significant differences between the two trials (P = 0.001), the weed control treatments (P ≤ 0.007), and in the interaction of trials and treatments (P ≤ 0.002).
Figure 4.18 Harvesting echinacea from the field trial at Yarrowitch, 22/3/99. The possible reasons for the large differences in the growth of echinacea recorded at Yarrowitch and Kirby are evaluated in the discussion. An analysis of the effect of cumulative rainfall and various leaf tissue nutrient concentrations (data reported in Chapter 7) on crop yield was carried out using GLMs. The nutrients tested were nitrogen (N), potassium (K), calcium (Ca), magnesium (Mg) and aluminium (Al), all of which differed between the soil tests at each trial (Table 4.1), and which may have had an effect on echinacea yield. The analysis showed that rainfall was highly significant (P ≤ 0.003) but leaf nutrient concentrations were not (P ≥ 0.062).
Chapter 4 In-crop weed management methods
82
A
0
0.2
0.4
0.6
0.8
Yarrowitch 1999 Kirby 2001Trial
Ech
inac
ea p
lant
siz
e (m
2 )
control hand tillagehay paper
B
0
20
40
60
80
100
Yarrowitch 1999 Kirby 2001Trial
Rel
ativ
e ec
hina
cea
cove
r (%
)
control hand tillagehay paper
C
0
2
4
6
8
10
Yarrowitch 1999 Kirby 2001Trial
Ech
inac
ea y
ield
(ton
nes/
ha)
control hand tillagehay paper
Figure 4.19 Echinacea (A) plant size (height x diameter, m2), (B) relative cover (%), and (C) crop yield (tonnes/ha) at harvest in response to the weed control treatments applied in the field trials. The columns show the mean of each treatment at each site and the error bars show the standard error of the means. The legends refer to the weed control treatments.
Chapter 4 In-crop weed management methods
83
Echinacea growth was highest in the hand weeding and hay mulch plots. These treatments were not different statistically (P ≥ 0.230) from each other. The average plant size in the hand weeded and hay mulched plots was 0.71 and 0.20 m2 at Yarrowitch and Kirby respectively, average relative cover was 95 and 69%, and mean crop yields were 7.8 and 2.2 tonnes/ha. At Yarrowitch, paper mulch had the next highest growth after hand weeding and hay mulch (P ≤ 0.032), with mean plant size reduced by 15%, relative cover by 10% and crop yield by 33%. Tillage produced slightly lower echinacea growth than the paper mulch, with the difference being significant for relative cover (P = 0.035) but not for plant size and crop yield (P ≥ 0.148). The tillage treatment reduced plant size and relative cover by about one third compared with hand weeding and hay mulch, while yield was about half that in the hand weeding and hay mulch treatments. The lowest echinacea growth was recorded for the unweeded control treatments, a result that was significantly lower than the other treatments (P < 0.007). Plant size was reduced by about 70% of the hand weeded and hay mulched plots, and relative cover and crop yield were reduced by about 90%. At Kirby, paper mulch produced lower yields than tillage, although the difference was not significant (P ≥ 0.132). The responses of the tillage and paper mulch treatments were lower than hand weeding and hay mulch (P ≤ 0.012), and were generally higher than the control treatment. The lower ranking of paper mulch was related to the large decline in echinacea growth under paper mulch, rather than a change in the performance of the tillage treatment. A moderate decrease in the crop growth of the tillage treatment at Kirby was recorded. Plant size in the tillage treatment was 72% (relative to hand weeding and hay mulching) at Yarrowitch compared with 52% at Kirby, relative crop cover was 67% at Yarrowitch compared with 38% at Kirby, and crop yield was 46% at Yarrowitch compared with 41% at Kirby. However, a comparison of paper mulch with hand weeding and hay mulch showed larger reductions in crop growth between Yarrowitch and Kirby. Relative performance decreased from 84% at Yarrowitch to 28% at Kirby for plant size, 90% to 32% for relative cover and 66% to 27% for crop yield. The control treatment gave the lowest growth in echinacea at Kirby. Compared with hand weeding and hay mulch, the unweeded control reduced plant size by 90%, relative cover by 99% and crop yield by 95%. The echinacea yield was measured by determining the biomass of both the above-ground plant parts, called shoots, and the below-ground parts, called roots. The responses of the shoots and roots biomass to the treatments at each trial closely followed the pattern reported for crop yield (Figure 4.19C) and have, therefore, not been reported separately. However, the proportional contribution of shoots and roots biomass to total biomass (crop yield) is of interest (Figure 4.20), as echinacea roots have a higher economic value than the shoots. Therefore, weed control treatments that maximise the proportion of roots in total plant biomass, while not penalising overall yield, may have economic advantages.
Chapter 4 In-crop weed management methods
84
A
0
20
40
60
80
100
control hand tillage hay paper
Weed control treatment
Ech
inac
ea b
iom
ass
(% o
f tot
al)
shoot biomassroot biomass
Yarrowitch
B
0
20
40
60
80
100
control hand tillage hay paper
Weed control treatment
Ech
inac
ea b
iom
ass
(% o
f tot
al)
shoot biomassroot biomass
Kirby
Figure 4.20 Proportional contribution (%) of shoot biomass and root biomass to total echinacea biomass at harvest in response to the weed control treatments applied at (A) Yarrowitch and (B) Kirby. The columns show the mean of each treatment (n = 4) and the error bars show the standard error of the means. An analysis of the ratio of shoot biomass to root biomass using GLMs indicated that the effects of trials, treatment and their interaction were significant (P < 0.001). The proportion of root biomass was greater at Kirby (average = 31%) than at Yarrowitch (average = 15%). At Yarrowitch, the ratio of shoot biomass to root biomass was the same for tillage, hand weeding and mulching (P ≥ 0.102), with an average ratio of 86:14, but the control treatment had a ratio of 80:20 (P < 0.001). At Kirby, the response pattern was similar, with the control having the lowest shoot:root ratio (48:52) (P ≤ 0.003), and the other treatments having equivalent proportions of shoot to root biomass (P ≥ 0.197) ranging from 70:30 in the tillage treatment to 81:19 in the hay mulch treatment. The tillage treatment did not appear to reduce the proportion of roots, an outcome that may have been expected given the higher level of soil and root disturbance compared with the hand weeded and mulched treatments. Flowering
The effect of the weed control treatments on echinacea flowering over time is presented in Figure 4.21. An analysis of the response using a GLMM was carried out with time, trial, weed control treatment and their interactions as fixed effects. All fixed effects were highly significant (P < 0.008) except the treatment by time interaction (P = 0.110). The number of flowers in the control treatments was significantly lower than in the other treatments (P < 0.001) and did not increase during the sampling period (Pslope ≥ 0.327). The other
Chapter 4 In-crop weed management methods
85
treatments at Yarrowitch fitted a quadratic function (r2 ≤ 0.80), with almost no flowering up to 12 WAP (~ 1050 °Cd) as the plants continued to grow vegetatively. Hand weeding had the greatest increase in flower numbers (about 2 flowers/plant/week), followed by paper and hay mulch (about 1.5 flowers/plant/week), then tillage (0.7 flowers/plant/week). Compared with the unweeded control, tillage, hand weeding and mulching at Kirby were more variable in their flowering over time (r2 ≤ 0.69), particularly hand weeding and hay mulch, the two treatments with the highest rate of flowering (about 2.3 flowers/plant/week). Tillage and paper mulch had flowering rates of about 0.8 flowers/plant/week.
0
5
10
15
20
25
30Control
Yarrowitch 1999Hand weeding
Yarrowitch 1999Tillage
Yarrowitch 1999Hay mulch
Yarrowitch 1999Paper mulch
Yarrowitch 1999
0
5
10
15
20
25
30Control
Kirby 2001
0 500 1000 1500 2000
Hand weedingKirby 2001
0 500 1000 1500 2000
TillageKirby 2001
0 500 1000 1500 2000
Hay mulchKirby 2001
0 500 1000 1500 2000
Paper mulchKirby 2001
0 500 1000 1500 2000
Accumulated degree days (°Cd)
Ech
inac
ea fl
ower
s (fl
ower
s/pl
ant)
Figure 4.21 The number of flowers per echinacea plant over time (accumulated degree days [°Cd]) in response to the weed control treatments applied at Yarrowitch and Kirby. The circles show the data points, the solid lines are the quadratic regression curves and the dashed lines are the 95% confidence limits. The number of flowers occurring on echinacea plants at harvest is shown in Figure 4.22. Analysis using GLMs indicated that flowering varied significantly by treatment (P < 0.001), and that the difference in flowering between the two trials was not significant (P = 0.319) although the trial-treatment interaction was significant (P ≤ 0.002). The most abundant flowering at Yarrowitch was observed in the hand weeding treatment, followed by the paper and hay mulches. These treatments were not significantly different (P ≥ 0.232). The tillage treatment had about half as many flowers as the hand weeding treatment (P = 0.029), but only slightly less than the mulched plots (P ≤ 0.269). Flowering in the control treatment was about 13% of the hand weeding plots, and significantly lower than the other treatments (P < 0.001). At Kirby, hand weeding and hay mulch flowered to a similar extent and had the highest number of flowers of the weed control treatments (P ≤ 0.023). Tillage and paper mulch also had similar levels of flowering, having about one third the number of flowers of the hand weeding and hay mulch treatments. The control treatment had very few flowers (3% of the hand weeding and hay mulch plots) and was significantly lower than the other treatments (P < 0.001). A linear regression analysis indicated that the number of flowers was reasonably well correlated with the total crop biomass at harvest, with an r2 of 0.77 at Yarrowitch and 0.90 at Kirby.
Chapter 4 In-crop weed management methods
86
0
5
10
15
20
25
Yarrowitch 1999 Kirby 2001Trial
Ech
inac
ea fl
ower
s (fl
ower
s/pl
ant)
control hand tillagehay paper
Figure 4.22 The number of flowers per echinacea plant at harvest in response to the weed control treatments applied at Yarrowitch and Kirby. The columns show the mean of each treatment at each site and the error bars show the standard error of the means. The legend refers to the weed control treatments. Economic analysis
The direct cost of carrying out each weed control treatment in the trials is shown in Figure 4.23. Paper mulch was the most expensive treatment at a cost of about $13,000/ha, of which 65% was due to purchase costs, 30% to laying and 5% to minor follow-up hand weeding. Hand weeding was the next most expensive treatment ($9,600/ha) followed by hay mulch ($8,900/ha). The hay mulch costs were based on purchase costs (14%), laying the mulch (50%) and supplementary hand weeding (36%). Tillage was the least expensive treatment ($4,000/ha), made up of machinery costs (4%) and labour (95%). No costs were associated with the control treatment.
0
2
4
6
8
10
12
14
Yarrowitch 1999 Kirby 2001Trial
Cos
t of t
reat
men
t ($1
,000
/ha)
control hand tillage hay paper
Figure 4.23 The cost of weed control treatments ($1,000/ha) applied in the field trials. The columns show the mean of each treatment at each site (n = 4). The legend refers to the weed control treatments. The GCV and ACV of the weed control treatments are shown in Figure 4.24. In graph A, the response pattern for GCV follows that reported for crop yield (Figure 4.19C), with large differences observed between trials and treatments (P < 0.001). Hand weeding and hay mulch produced similarly high GCV, averaged at $49,000/ha and $15,500/ha at Yarrowitch and Kirby respectively, whilst the GCV for tillage was about half those figures and the control treatment about 10% of the value of hand weeding and hay mulch. Paper mulch performed moderately well at Yarrowitch, with a GCV about one third less than hand weeding and hay mulch, but performed poorly at Kirby, with a GCV about 70% less than hand weeding and hay mulch.
Chapter 4 In-crop weed management methods
87
The ACVs for the treatments in Figure 4.24B indicated that the treatment rankings changed compared with GCV at Kirby, but not at Yarrowitch. In the former trial, the higher cost of implementing hand weeding and hay mulch, in combination with the lower overall yields, reduced the yield advantages observed at Yarrowitch. The ACV for hand weeding and hay mulch became equivalent to the cheaper tillage treatment (P ≥ 0.526) and control slightly more cost effective than the control treatment (P = 0.013 and 0.052 respectively). The relatively high cost of the paper mulch treatment and its poor crop yield at Kirby meant that a loss of about $9,000/ha was incurred.
A
0
10
20
30
40
50
60
Yarrowitch 1999 Kirby 2001Trial
Gro
ss c
rop
valu
e ($
1,00
0/ha
) control hand tillagehay paper
B
-10
0
10
20
30
40
50
Yarrowitch 1999 Kirby 2001Trial
Adj
uste
d cr
op v
alue
($1,
000/
ha)
control hand tillagehay paper
Figure 4.24 The (A) gross crop value and (B) adjusted crop value ($1,000/ha) of echinacea for each treatment applied in the field trials. The columns show the mean of each treatment at each site and the error bars show the standard error of the means. The legends refer to the weed control treatments. Although the ranking of the treatments by their cost was similar for both lettuce and echinacea, expressing the costs as a percentage of the hand weeding treatment cost indicated that the different weeding requirements of the two crops altered the relative costs of the treatments (Table 4.4). The cost of tillage doubled relative to hand weeding, while the cost of mulching halved. An evaluation of weed control strategies for large-scale organic potato production in the UK found a similar ranking of treatments to that found in the study reported here. However, the actual and relative values were different, partly due to the non-equivalence of the treatments.
Chapter 4 In-crop weed management methods
88
Table 4.4 Relative costs of weed control treatments, expressed as a percentage of the hand weeding treatment cost, with the actual cost ($/ha) of the hand weeding treatment is given in brackets. The values for lettuce and echinacea are across-trial averages from the experiments reported in this chapter. The values for potatoes are from an experiment in the UK (Litterick et al. 1999) and are included for comparison.
Relative cost of weed control treatment (% of hand weeding treatment) Weed control treatment Lettuce Echinacea Potatoes Hand weeding 100 ($4,390/ha) 100 ($9,600/ha) 100 ($1,600/ha) Control 0 0 - Tillage 22 41 6 Hay mulch 173 93 13 * Paper mulch 276 135 125
* Mulch grown in-situ as a cover crop preceding the potato crop
4.4 Discussion
4.4.1 Weed variation between trials
Weed levels varied between the trials in terms of the species that were dominant, the background weed levels observed in the control treatments, and the different responses due to the weed control treatments. Weed species differed between sites, apart from wireweed (Polygonum aviculare) which was common at both Laureldale and Kirby. The most abundant weed growth in lettuce and echinacea trials occurred at Yarrowitch in 1999, followed by Kirby in 2001 and then Laureldale and Kirby in 2000. No assessment of the soil seed banks in each trial was attempted, so the extent to which variations in weed emergence were simply due to variations in the existing number of weed seeds is uncertain. Factors that may have affected weed emergence and growth include recent land use history, climatic variables, soil conditions and the method of bed preparation (Cousens and Mortimer 1995, Bond et al. 1998b, Buntain 1999). These factors varied considerably between the field sites used in the trials. For example, the land use histories included land that had been subject to organic annual cropping for 2 years after being used for conventional sheep grazing for many years (Yarrowitch), land that had been continuously cropped as research plots (Laureldale) and land that had only been grazed by sheep and cattle for the previous 7 years (Kirby). The observed increase in weed density at Kirby (50 to 335 weeds/m2 in 2000 and 2001 respectively) parallels comments by staff at Yarrowitch who reported that weeds levels had increased since converting from grazing to annual cropping (P. Brown, pers. comm.). An increase in the abundance of annual weeds may be expected after a fallow (Sjursen 2001), and increased weed density and biomass, especially during conversion to an organic system, has been reported in other organic cropping studies (Samuel and Guest 1990, Belde et al. 2000, Sadowski and Tyburski 2000). The method of bed preparation was the same at Kirby and Laureldale, but different at Yarrowitch due to the use of a different bed forming implement. The heavy clay soil at Laureldale caused the planting beds to have more and larger clods than in the finer structured soil at Kirby. Large soil clods can reduce weed seedling emergence, but may also protect emerged weeds against damage by direct weeding methods (Bond and Lennartsson 1999). Therefore, the initial conditions for weed seed germination and seedling emergence will have varied between trials, including soil texture, soil moisture and weed seed depth (Cussans et al. 1996, Grundy et al. 1999b). After the experiments were established, climatic factors are likely to have had an impact on the growth of emerged weed seedlings and on further emergence. Cumulative rainfall was significantly higher at Yarrowitch, while the 2001 trial had slightly more rainfall than the 2000 trials. The timing of the rainfall events, particularly in relation to the timing of the weeding operations, may also have influenced weed emergence and growth. The differences in weed levels between trials may also have been related to the differing ability of the dominant weed species to accumulate aboveground biomass or cover the ground more quickly. Wireweed had a low spreading habit and would be expected to achieve greater relative cover with lower biomass, while
Chapter 4 In-crop weed management methods
89
buckwheat (Fagopyrum esculentum) grew with an upright and sparse canopy and may contribute less to both relative weed cover and biomass. The three variables used to measure the weed response to the treatments generally had high correlations in all trials for both lettuce and echinacea, particularly the relationship between relative weed cover and biomass. However, at Laureldale and Kirby 2000 the correlations were low for weed density and relative cover, and for density and biomass. The weed densities at these sites were relatively low while the relative cover and biomass were not, suggesting that fewer individual weeds produced relatively more growth, but with greater variability. While the inter-trial variations in weed levels are of interest and had a statistically significant effect on the performance of the weed control treatments, the effects due to trials may be considered to be a random selection of the possible range of effects that may be observed at different field sites over different growing seasons. Of greater interest in these experiments were the effects of the weed control treatments, the fixed effects from deliberately applied treatments. The general trends observed for the effect of treatments on weed growth were generally similar between trials and a reasonably clear set of conclusions can be made from those trends.
4.4.2 Weed response to treatments
The weed control treatments varied significantly in their ability to control weeds effectively. In both lettuce and echinacea, the ranking of treatments by weed biomass accumulation at harvest was similar: hand weeding ≈ paper mulch < hay mulch < tillage < control. Weed growth was very effectively controlled by hand weeding and paper mulch, with a 96% reduction in weed biomass in the lettuce trials compared with the control, and a 98% reduction in the echinacea trials. The hay mulch was equally as effective in reducing weed biomass in the echinacea trials, but less effective in the lettuce trials (80% reduction) due to weed seeds contained in the mulch. The tillage treatment reduced weed biomass by about 60% in both lettuce and echinacea. Weeds in the control treatment were allowed to grow unchecked. Hand weeding
The low weed populations at the end of the lettuce and echinacea trials indicate that the hand weeding regime was adequate for each crop. The high level of weed control achieved by the hand weeding treatment was deliberate, so that the crop yields in a relatively weed-free situation could be determined, but it was also intended to emulate organic weed management practices of a grower reliant on hand weeding. Hand weeding is very commonly used by organic growers (Walz 1999, Kristiansen et al. 2001), and its efficacy in controlling weeds, either as a central method of weed management or as a supplement to other methods has been widely reported in both organic (Melander 1998a) and conventional production systems (Lewthwaite and Triggs 2000). One thorough hand weeding at 4 WAP was sufficient to prevent almost all weed growth up to 7 WAP in lettuce. The low stature, smaller root systems and high nutrient and water requirements (Gallardo et al. 1996) of lettuce did not limit the ability of this crop to compete effectively against weeds and achieve good yields. Lettuce was successful with only minor weeding inputs because of the short growing season and the rapid early growth of the transplanted seedlings. In a study of critical weeding periods in three vegetable crops Weaver (1984) found that that a single weeding event was sufficient to prevent yield losses in cabbage (Brassica oleracea L. Capitata group) and cucumber grown for about 8 weeks, but not for direct seeded tomatoes grown for about 16 weeks. Weaver observed that the exponential phase of growth began at about 8 weeks after sowing (WAS). Earlier work by the same author on transplanted tomatoes indicated that transplanting tomatoes reduced weeding requirements to a single removal at 4 – 5 WAP (Weaver and Tan 1983). Lettuce has a considerably shorter growing season (Wallace 2000), canopy size and root development is smaller, and weed control is not as problematic, with a single weeding at about three weeks after seedling establishment being reported to be effective (Roberts 1977).
Chapter 4 In-crop weed management methods
90
Echinacea has a longer growing season, with limited growth in the first 10 WAP when the crop is very susceptible to weed competition (Buntain 1999). Relative crop cover had only reached 20% by 10 WAP in both trials. However, once shoot extension and leaf expansion begin (about 8 – 10 WAP in these trials), echinacea becomes more competitive against weeds and can develop a dominant canopy by about 12 – 16 WAP. The three weeding operations at 4, 8 and 12 WAP in the echinacea trials were sufficient to maintain a minimal level of weed growth up to 21 WAP. The emphasis should be on maintaining a high level of weed control up to about 10 WAP. Paper mulch
The paper mulch treatment was used in the experiment as an alternative to the hay and straw mulches that are commonly used in organic herb and vegetable production. A very high level of weed control was achieved due to the thick, continuous layer that prevented most weeds from emerging. Once the mulch had been wet from irrigation or rainfall, the pellets swelled and partly coalesced to form a dense, compact layer. This layer completely prevented light penetration through to the soil where the mulch was maintained at the required thickness of 50 mm. Thinner patches with < 10 mm of mulch were the most common point where weeds emerged. Paper mulch is likely to have provided a formidable physical barrier against emergence by germinated weed seeds. Weed control benefits have been reported for pelletised paper mulch in the nursery industry (Senesac 1998, Smith et al. 1998) and for shredded newspaper (Munn 1992, Monks et al. 1997) . Paper sheeting has also been effective in capsicum (Olsen and Gounder 2001), potatoes (Cui et al. 2000) and rice (Umezaki and Tsuno 1998). Several of these reports noted better weed control by a newspaper mulch than mulches composed of crop residues (Munn 1992, Monks et al. 1997, Olsen and Gounder 2001). Hay mulch
The hay mulch treatment was quite effective in reducing weed levels, an observation commonly reported in the literature (e.g. Wade and Sanchez 1983, Yih 1989, Schonbeck 1998, Alemán 2001, Olsen and Gounder 2001), but extra labour was required to maintain those low levels. About 36% ($3,000/ha) of hay mulch treatment costs were due to supplementary weeding but only 1% ($120/ha) of paper mulch treatment costs. The supplementary hand weeding was carried out in order to maintain the practical relevance of the hay mulch treatment. Follow-up weeding was also conducted in the tillage and paper mulch treatments for the same reason. Hay mulch did not form a layer that was as dense as the paper mulch, although the mulch became moderately compact after wetting and settling. Light penetration through the mulch is unlikely to have been completely prevented. Ryegrass mulch biomasses of 8 and 16 tonnes/ha have been reported to reduce incident radiation by 90 and 95% respectively (9.5 tonnes/ha of hay mulch was used in the lettuce and echinacea trials), and that was considered sufficient to stimulate germination in weed seeds that are dependent on a phytochrome response (Teasdale and Mohler 1993). In a study of the effect of various mulch properties on weed emergence (Teasdale and Mohler 2000b), the surface area of a mulch was found to be more useful for describing weed emergence than the biomass or height of the mulch, and the available space within the mulch was also an important parameter. The pelletised paper mulch used in the trials being reported here is likely to have had a high surface area and very little space between particles, especially after wetting, compared with the hay mulch. Tyler noted that shredded newspaper provided poor weed control in a trial of mulches in Echinacea purpurea, possibly due to the more open nature of the mulch, whereas a finer, milled newspaper mulch provided better weed control (2000) Other factors that may have reduced weed germination and growth in the paper and hay mulch treatments include leaching of phytotoxins that reduce weed germination and emergence, nitrogen immobilisation causing a reduction in growth of germinated weed seeds, unfavourable soil physical conditions (e.g. moisture, temperature, aeration), or the presence of herbivorous fauna such as gastropods. An investigation of these factors is reported in Chapter 7.
Chapter 4 In-crop weed management methods
91
Tillage
Tillage tended to be the least effective method of managing weeds, apart from the control treatment. It was also the most variable weeding treatment. Satisfactory weed control was usually achieved away from the crop rows, but poor weed control was achieved in the rows. The supplementary hand weeding was intended to remove weeds in the crop row with a chipping hoe but not those weeds immediately adjacent to the crop, where the competitive effects of weeds would be greatest. The ploughs used in the trials were simple chisel ploughs with limited ability to accurately control weeds close to the crop plants without damaging crop plants. While this type of implement is commonly used by organic herb and vegetable growers in Australia (see Figure 3.12 in the previous chapter), its effectiveness is variable (Oriade and Forcella 1999, Welsh et al. 1999). Another source of variability in the trials was the skill of the tractor driver. The driver was inexperienced at cultivating between crop rows. With a more experienced operator, it may have been possible to set the tines closer to the planting rows and, thus, control more weeds with each tillage pass (Litterick et al. 1999, Bishop et al. 2002, Home et al. 2002). The 50% reduction in weed density due to inter-row hoeing in an organic cereal crop reported by Welsh et al. (1999) is similar to the 46% reduction in weed density in echinacea by the tillage treatment in these trials, but weed density was reduced by 69% in the shorter duration lettuce crop. The quadratic response of relative weed cover during the echinacea trials varied between sites (Figure 4.9). Weed cover at Yarrowitch rose quickly and levelled off, whereas weed cover at Kirby increased very slowly in the first 12 WAP followed by rapid growth until harvest. These contrasting patterns may be due to (a) the higher cumulative rainfall in the first 10 WAP at Yarrowitch (233 mm compared with 103 mm at Kirby) which could have promoted early weed germination and growth (Bond and Baker 1990), and (b) the competitive effects of greater echinacea growth at Yarrowitch (49% relative cover at 12 WAP compared with 12% at Kirby) (Figure 4.17). Another possible cause is that the weed flora in each trial had different emergence patterns in relation to the timing of the establishment of the experiment and the tillage operations (Rasmussen 1996). However, specific data about weed species was not recorded in these trials. Control (unweeded)
The unweeded control treatment provided a measure of the pre-existing weed levels in each trial and a basis for evaluating the extent of weed control achieved by the other treatments. In most trials, weeds in the control plots grew rapidly and achieved a high relative cover by harvest time, although this was not as great in the shorter lettuce trials. The late decrease in relative weed cover in the control treatment at Yarrowitch in the echinacea trials (Figure 4.9) may have been due to the lodging by the tall grass weeds that were about 0.8 – 1 m tall and had begun to seed. The weeds had begun leaning out beyond the beds and opened up the canopy slightly to show the stunted echinacea plants.
4.4.3 Crop response - variation between trials
Lettuce
The lettuce yields were ranked by trial as follows: Yarrowitch 1999 > Kirby 2000 > Kirby 2001 > Laureldale 2000. The variation in overall lettuce yields between trials may be due largely to differences in the amount of rainfall received in the latter part of the experiments. Lettuce is usually grown with irrigation on commercial farms (Heisswolf et al. 1999a), but irrigation was not readily available in these trials. Therefore the observed lettuce yields would be expected to be affected by the amount of rainfall received in each trial. The high correlation between cumulative rainfall and relative crop cover (r2 ≥ 0.81) appears to confirm that lettuce growth (and yield) was influenced by the amount of rainfall received. The soil test data (Table 4.1), especially those for nitrogen, phosphorus, potassium and soil pH, did not appear to show a pattern that is consistent with the observed yields.
Chapter 4 In-crop weed management methods
92
The poor growth of lettuce in the trial at Laureldale in 2000 is difficult to explain conclusively. The performance of the cover crops grown prior to the lettuce (reported in the next chapter) was also poor. One factor that was not seen in the other trials was the sporadic evidence of leaf chewing by rabbits (Oryctolagus cuniculus), hares (Lepus capensis) or kangaroos (Macropus giganteus) during the second week after planting the lettuce seedlings. The trial area at Laureldale has a complex history of uses with a mosaic of previous crops, fertiliser regimes and herbicide applications, some of which may have had residual effects. The soil analyses did not reveal any serious deficiencies, although nitrogen was slightly lower than at Kirby in 2000. The average lettuce yield in the hand weeded plots was about 27 tonnes/ha, not including the low yielding trial at Laureldale (average for all trials was 23 tonnes/ha). Industry benchmarking for conventional lettuce yields in Australia ranges from 17 – 29 tonnes/ha (Titley 2000) to 20 – 45 tonnes/ha (NSW Agriculture 2001). Apart from the unweeded control, the observed yields in the treatments in these trials were similar to commercial yields, despite the lack of irrigation and supplementary fertilising. Lettuce bolting varied significantly between Kirby 2001 and the other trials. Bolting was greater in the hand weeding and tillage treatments at Kirby in 2001 than in the other three trials and this may be to have been due to the drier soils in the later part of the growing season (< 16 mm rainfall in the 3 weeks prior to harvest) causing greater fluctuations in soil temperature (Titley 2000). During the same trial periods, the 2001 season was also slightly warmer. Although the difference is not statistically significant, the difference may have biological importance (Hasegawa et al. 1999). The effect of the treatments on bolting is further discussed below. Echinacea
The yield of echinacea at Yarrowitch was significantly greater than at Kirby, with growth parameters indicating a 2- to 4-fold difference, and the response of relative crop cover over time indicated that echinacea reached an upper asymptote of growth at Yarrowitch, but not at Kirby. Rainfall seemed to be an important factor in determining overall echinacea growth, as indicated by a high correlation between cumulative rainfall and relative crop cover (r2 ≥ 0.76 for all treatment combinations except the control) and the significantly lower rainfall received at Kirby, 43% that received at Yarrowitch. Soil analyses from the two sites (Table 4.1) indicated several differences in nutrient concentrations and leaf tissue analyses from the harvested echinacea plants (reported in Chapter 7) suggesting that whilst the leaf nitrogen levels were low in both trials, while cation levels were generally adequate (Reuter and Robinson 1997). However, an analysis of the effects of cumulative rainfall and various leaf nutrient concentrations (i.e. N, K, Ca, Mg and Al) on echinacea yield indicated that the nutrients were not significant but rainfall was. No differences in degree days were recorded between the two trials, and no pest or disease infestations were observed at either trial. The shoot:root biomass ratio was lower at Kirby. This may have been due to the drier conditions limiting the growth of stem and leaf and/or inducing more root growth in order to access soil moisture. Shoots biomass was 80% lower at Kirby, but root biomass was 63% lower, suggesting that shoots growth became limited by the drier conditions. Echinacea is reported to be tolerant of dry conditions, with a number of leaf adaptations to water stress (Chapman and Auge 1994). The average echinacea root yield in the hand weeded plots was 1.2 tonnes/ha at Yarrowitch and 0.5 tonnes/ha at Kirby. Echinacea root yields reported elsewhere range from 1 – 3.7 tonnes/ha (Parmenter et al. 1992, Galambosi 1993, Polachic 1996, Buntain 1999), although yields can vary widely depending on planting density (Parmenter and Littlejohn 1997) and site (Parmenter et al. 1992). The average yield of echinacea shoots in the hand weeded plots was 6.6 tonnes/ha at Yarrowitch and 1.8 tonnes/ha at Kirby, while others have reported yields of 6.4 – 17.5 tonnes/ha (Von Bomme et al. 1992, Butler 1997, Buntain 1999). The observed yields in the tillage, hand weeding and mulched treatments at Yarrowitch showed reasonable equivalence with commercial yields, but the yields at Kirby were lower than those reported in the literature.
Chapter 4 In-crop weed management methods
93
4.4.4 Crop response to treatments
The weed control treatments had a significant effect on all of the crop variables measured in the lettuce trials. The highest yields were recorded in the hand weeding and hay much, followed by tillage plots (87% of hand weeding yields) the control treatment (75%), then the paper mulch (45%). The treatments also had a significant effect on crop variables in the echinacea trials. The highest yields were again recorded in the hand weeding and hay mulch plots. At Yarrowitch, paper mulch had lower yields (66%), followed by tillage treatment (46%). At Kirby, paper mulch yields were considerably reduced in proportion to the hand weeded plots (27%), and paper mulch was therefore ranked lower than tillage (41%). The control treatment had poor yields in both trials. The only crop parameter to show little variation in response to the treatments was the shoot:root ratio. The proportion of echinacea shoots biomass was lower in the control treatment, particularly at Kirby, but there was little difference in the shoot:root ratio in response to the other weed control treatments. This indicates that heavy weed competition had a greater limiting effect on shoots growth than on root growth in echinacea. Hand weeding and hay mulch
Lettuces and echinacea in the hand weeding and hay mulch treatments grew the quickest and were the largest by size and weight at harvest. The positive response to these treatments is presumably a consequence of having low weed levels throughout their growing season and an absence of other potential limiting factors. Hand weeding is generally acknowledged to be an effective method of weed control in organic and conventional herb and vegetable production (Whitten 1999, Napier 2001b) and, although it is often considered to be expensive (Rasmussen and Ascard 1995, Melander 1998a), that is not always the case (Alemán 2001). Mulches composed of crop residues such as hay and straw have been used successfully for weed control and generally produce good crop yields (Bond and Grundy 2001). However, positive (Hutchinson and McGiffen 2000), neutral (Abdul-Baki et al. 1999) and negative (Munn 1992) effects on crop yield have been reported. Stirzaker and Bunn (1996) indicated that an annual ryegrass mulch reduced lettuce growth compared with an unmulched control in a pot trial. However, a second experiment indicated that ryegrass mulch increased lettuce growth relative to the unmulched control. Bolting
Despite the yield benefits observed in the hand weeded plots, a noteworthy short-coming of that treatment was the high incidence of early bolting, especially at Kirby in 2001. Bolting in lettuce, a quantitative long-day plant (Waycott 1995), is generally caused by high daily maximum temperatures, large fluctuations in diurnal temperature and/or longer daylengths (Waycott 1995, Napier 2001a). In these trials, daylength would not have varied between treatments. However, the hand weeded plots were likely to have had higher soil temperatures and large daily fluctuations in soil temperatures than the mulched plots (Olasantan 1999) and such conditions were more likely to induce bolting in lettuce. Soil temperature (daily maxima and diurnal fluctuations) was tested in the echinacea trial at Kirby in 2001. The temperature variables were found to be significantly greater in the hand weeding and tillage treatments (see Chapter 7). Root zone cooling has been shown to reduce the incidence of bolting in lettuces (Lee and Cheong 1996), and other vegetables have also experienced less bolting when grown with soil coverings that reduced soil temperature, including pak choi (Brassica rapa L.) (Vogel and Flogel 1992) and radicchio (Cichorium intybus L. var. silvestre Bisch.) (Rangarajan and Ingall 2001). The tillage treatment also had a high percentage of bare soil and it too had a higher incidence of bolting than the weedy control treatment and the mulches. The relationship between soil cover and bolting was highly significant. Other untested factors besides soil cover may also have influenced soil temperature, such as changes in soil bulk density (Andales et al. 2000) due to the disturbance by the hand weeding and tillage, and crop root damage may also have been a stress factor that could affect plant maturation (Das and Ahmed 1989).
Chapter 4 In-crop weed management methods
94
Paper mulch
While paper mulch kept the level of weeds very low, lettuce yield was greatly reduced in comparison with the other treatments. Echinacea yields were also significantly reduced compared with hand weeding, but only at Kirby. Reports vary about the effect of paper mulches on crop yields, with some research finding no negative effect on yield (Munn 1992, Matitschka 1996, Unger 2001), and others finding yield reductions (Guertal and Edwards 1996, Monks et al. 1997, Tyler 1999). The lower yields are commonly attributed to soil nitrogen immobilisation in response to the high carbon:nitrogen ratio of the mulch. However, other factors that may have affected crop growth under paper mulch include altered soil hydrothermal conditions (e.g. cooler soil temperatures, water-logging) or the effect of phytotoxins. The proportion of root biomass in the paper mulched echinacea at Kirby was relatively high amongst treatments other than the unweeded control, suggesting that soil conditions were not unfavourable. An investigation of the factors involved with mulch performance is reported in Chapter 7. Tillage
The tillage treatment produced moderate crop yields compared with the other weed control treatments. The lettuce yields were 13% lower than hand weeding (averaged across trials), a difference that was not significant. The single weeding operation at 4 WAP appears to have reduced weed competition sufficiently to avoid crop yield losses observed in the unweeded control treatment at Yarrowitch in 1999 and Kirby in 2001, although with the lower weed levels at Laureldale and Kirby in 2000, little difference in yield between treatments was detected. A low yield in the tillage treatment at Kirby in 2000 is likely to have been due to soil disturbance and/or root damage by the tines. The tractor operator in the Armidale trials was relatively inexperienced in 2000 and would have been more competent in 2001. In the echinacea trials, the crop yields for tillage were about half of hand weeding yields, most likely because of the considerably higher weed levels in the tillage plots. The tillage treatment consisted of three passes with a chisel plough with follow-up chipping each time. The efficacy would be improved by carrying out more hand weeding near the crop plants so that the competitive effects of weeds in close proximity were reduced. It might be expected that the impact of soil disturbance and root damage would be greater with the tillage treatment, with a consequent reduction in yield as observed in the lettuce trial at Kirby in 2000. The relatively high echinacea root biomass proportion in both trials indicates that tillage did not have a negative effect on echinacea roots, and that the lower overall yield was due more to reduced shoot growth. However, the finer roots of lettuce may be less robust than echinacea roots. Lettuce was harvested at ground level, so the impact of the treatments is unknown. The weedy control treatment also had a high proportion of root biomass, which implies that echinacea plants favour root growth when subjected to competition for resources. Indeed, echinacea is a perennial herb from North America in which all aboveground parts die-off over winter, while the rhizomes persist and reshoot in early spring (Whitten 1999). Plants often respond to stresses (e.g. drought, inadequate nutrients, defoliation) by partitioning growth in various ways. A range of plants have been reported to respond to such stresses by increasing root biomass at the expense of shoot biomass (Traore and Maranville 1999, Maillard et al. 2001, Strand and Weisner 2001). Control (unweeded)
The crop yields in the unweeded control treatment were generally lower than the other treatments. This was especially so in the longer-season echinacea where weeds had many weeks to compete with the crop plants and where the early growth rate of the crop was low. At harvest, the ratio of weed to crop biomass for the control treatment was about 25:1, whereas the same ratio in the lettuce trials was 3:1. In 2000, the lettuce yields at Laureldale and Kirby were equivalent to the other treatments. The result at Laureldale may have been due to the overall low yields at that site not being sensitive to
Chapter 4 In-crop weed management methods
95
treatment effects, and the over-riding influence of other limiting factors such as inadequate rainfall, less degree day accumulation, low or unavailable soil nutrients, or residual effects from previous crops. The overall crop yields at Kirby in 2000 were not low compared with Yarrowitch in 1999 and Kirby in 2001. However, the background weed levels were the lowest of all trials (50% of Laureldale, the next lowest). Therefore, the competitive pressure from weeds would be considerably lower and any benefits from reduced weed levels in the other treatments would be less obvious or even negligible (Martínez-Ghersa et al. 2000). Studies on a crop with a very short growing season, radish (Raphanus sativus L.), have demonstrated how rapid crop development can avoid the need for weeding in short-season species (Turner et al. 1999). Adequate pre-cropping weed control can also reduce the risk of weed inundation (Wallace 2000).
4.4.5 Economic analysis
While crop yield is usually considered to be a key indicator of the performance of a weed control treatment in research trials, it is possible to get good yields from treatments that may be uneconomical in practice. Therefore, taking account of the cost of each treatment and incorporating that variable into the analysis allows for an economic evaluation of the performance of the various treatments, rather than a merely agronomic evaluation. This analysis did not account for the cost of environmental impacts due to the weed control treatments (Roberts and Swinton 1996), such as soil loss in the tillage treatment (Gilley and Doran 1997), or soil moisture conservation in the mulched treatments (Rahman and Khan 2001). It is also recognised that the costs of implementing weed control methods on research plots may differ from implementation costs in a commercial setting (Anuebunwa 2000) and that some farms may have different equipment. The most expensive treatment was paper mulch, followed by hay mulch and hand weeding. Tillage was comparatively cheap, and the control treatment cost nothing. Other research has also found that tillage can be less costly than hand weeding (Melander 1998a, Alemán 2001) and mulching (Edwards et al. 1995, Litterick et al. 1999, Alemán 2001). The amount of time used in each application of the hand weeding treatment (198 – 228 and 268 – 312 hours/ha for lettuce and echinacea respectively) was within the range of reported times for various vegetable crops, which include 100 – 300 hours/ha in organic carrots (Rasmussen and Ascard 1995), 256 hours/ha in echinacea (Buntain 1999) and up to 500 hours/ha in organic onions (Melander 1998a). The mulches differed in the proportion of cost that was due to purchase of materials. Paper mulch was expensive to buy, but was in a form that enabled quicker and more even application to the cropping beds than the cheaper hay mulch. Paper mulch also required less follow-up hand weeding than hay mulch. However, a major short-coming of the paper mulch treatment, besides the initial cost, was the strongly negative effect on crop yield. This would appear to limit the use of such a mulch unless soil nutrient issues are addressed, for example by adding manure or slurry to the mulch to reduce the carbon:nitrogen ratio. The high cost is clearly prohibitive in the current commercial environment. However, waste collection and reprocessing techniques are likely to become more efficient over time through technological advancement, increasing volumes of feedstocks, economies of scale and regulatory and market forces promoting sustainable resource use (van Rijswijk 1999, Olsen and Gounder 2001). Consequently, the cost of producing paper-based mulches may become less prohibitive over time. In the lettuce trials, the treatment ranking for crop yield was altered when treatments were compared by their ACV. The more expensive treatments, particularly the mulches, became less profitable and the cheaper treatments became more profitable. The control treatment had high ACVs, especially in 2000 at Laureldale and Kirby. Even under the higher weed loads at Yarrowitch, the control and tillage treatments were cost effective compared with hand weeding. In the echinacea trials, there was no re-ranking of treatments by ACV compared with GCV at Yarrowitch. Hand weeding and hay mulch remained highly ranked even with the inclusion of their higher costs. The high yields at Yarrowitch and the high wholesale value of the echinacea appeared to make the investment in more expensive weeding methods cost effective. At Kirby,
Chapter 4 In-crop weed management methods
96
were yields were relatively low, the treatments were re-ranked by taking cost into account. The cheaper treatments (e.g. control, tillage) had relative higher ACVs, but paper mulch yields were so low that a substantial loss was incurred. The relative costs of the treatments differed between lettuce and echinacea. Compared with hand weeding, the cost of tillage in the echinacea trials was twice that of the lettuce trials whereas the relative cost of hay and paper mulch was about half as much in lettuce than in echinacea. The likely reasons for these differences are that the mulch treatments incurred substantial initial costs with purchase and laying of the mulch materials, but on-going costs were low, especially for paper mulch. Tillage did not require a high initial outlay, but over time on-going costs remained fairly constant. In a short-season crop like lettuce, a weed control treatment with a high initial outlay gave a comparatively low return and increased the risk of loss if the crop failed (e.g. paper mulch at Kirby 2000). In a longer-season crop such as echinacea, the on-going, low maintenance weed suppression provided by mulches became economically attractive compared with repeated tillage operations. The higher value of echinacea in the market place would also mean that more expensive weeding methods were relatively cost effective, although the prices are unlikely to remain stable (P. Green, pers. comm.). These results indicate that in short-season crops (and under lower weed loads), the use of cheaper, low intensity weeding methods (e.g. unweeded control, tillage) may be the most profitable option, and that mulches are more suited to high-value crops (Runham and Town 1995) or perennial crops (Bond and Grundy 2001). In organic farming systems, where weed seed bank depletion may be an important goal (Geier 1990, Merfield 2002), the longer term implications of uncontrolled weeds in a crop need to be considered by growers (Jones and Medd 2000). There was no correlation between cost of weeding method and the crop yield (r2 ≤ 0.270). This result is similar to the finding reported in the Organic Weed Management survey in Chapter 3, where the perceived expense of a weed control method was not related to the success of that method at managing weeds. Bond and Lennartsson (1999) note that relatively expensive methods should not necessarily be dismissed because they may not be uneconomic in large acreage arable crops, and that different techniques are appropriate for different crops, and success depends on matching up the weed control and cropping strategies. Other factors that can have an influence on the economics of weed management include the size of cropping area, prevailing weed density, the cost of labour and commodity price fluctuations (Melander 1998a, Alemán 2001).
4.5 Conclusions
The weed control treatments had important agronomic and economic effects in the lettuce and echinacea trials reported above. The treatments showed clear differences in their ability to control weeds effectively, their impact on the growth of the crop and their cost effectiveness. The economic analysis of the treatments is specific to the time and location of the trials, and outcomes may vary depending on the availability of labour, machinery and implements, and suitable mulch materials. However, similar trends have been reported in other organic and conventional trials. For lettuce, a crop with a short growing season and rapid early growth from transplanted seedlings, cheaper weed control methods such as tillage with limited follow-up hand weeding may be sufficient to ensure a reasonable crop yield. The acceptable economic return of the control treatment suggests that good weed control in the cropping area prior to planting may even be adequate. Hay mulch provided good yields but was less cost effective due to the high labour requirement for mulch laying and follow-up hand weeding. However, this treatment greatly reduced bolting in the lettuces and may have given more flexibility in terms of harvest timing than tillage or hand weeding. Paper mulch stunted the growth of lettuce, presumably due to nitrogen immobilisation, although it also provided excellent weed control. It could not be recommended without reformulation with a nitrogenous fertiliser or some other method of improving available soil nutrient levels.
Chapter 4 In-crop weed management methods
97
The results from the echinacea trials suggest that more expensive weeding methods are cost effective for longer-season and higher value crops. Hand weeding and hay mulch both provided cost effective weed management. The differing effects of those two treatments on soil structure, carbon and moisture conservation were not evaluated, although these factors may be considered important by growers. The paper mulch again reduced crop yields and, combined with high purchase cost, appeared to be unreliable. The moderate ACV for paper mulch in echinacea at Yarrowitch suggests that the treatment may have some potential as a weed control method in certain circumstances. While most attention is paid by growers to controlling weeds in an existing crop, good preparation prior to planting can reduce the weed burden and make in-crop weeding easier. Crop rotation, including fallowing and cover crops, is an important practice that contributes to weed management in organic farming systems. The following chapter investigates the effects of several pre-crop weed control methods on weed suppression during the pre-crop phase and on weed suppression and crop growth during the subsequent in-crop phase.
99
Chapter 5 Pre-crop weed control methods (fallowing and cover crops) and their interaction with in-crop weed control methods
5.1 Introduction
Direct methods of weed management aimed at reducing weed levels within a crop are a key focus for organic herb and vegetable producers. Such methods, including hand weeding, tillage, mulching and slashing, have been frequently reported in surveys of organic growers. However, growers also commonly report using a range of indirect techniques for managing weeds at times before and after a cash crop has been planted, such as, planned rotation sequences, bed preparation and cover crops (Figure 3.11 of this thesis, and Walz 1999). Cover crops, or green manure crops are grown for various purposes such as improving soil fertility and structure, decreasing nitrate leaching, reducing erosion, conserving soil moisture, suppressing weeds and increasing agroecosystem diversity over time (Wyland et al. 1996, Sustainable Agriculture Network 1998, Liebman and Davis 2000). The use of cover crops in farming rotations for weed management and other purposes is formally recognised in many organic certification systems (OPAC 1998, Joint FAO-WHO Food Standards Programme 1999, OCIA International 2002) and manifested in the practices of organic growers (Smith 1994, Merfield 2002). However, the adoption of cover cropping by conventional growers appears to be less common. Results from a survey of California farmers indicated that whilst 100% of organic respondents used cover crops, only 11% of conventional growers used them (Ridgely 1996). The use of cereal, grass and legume cover crops for weed suppression prior to a herb or vegetable crop has been widely studied in horticultural cropping systems, including sorghum (Sorghum spp.), ryegrass (Lolium spp.) and lucerne (Medicago sativa L.) (e.g. Sutton 1998, Creamer and Baldwin 2000). Recent work on biofumigant crops in the Brassicaceae has drawn attention to the weed management potential of species from that family (Henderson and Bishop 2000). It is believed that isothiocyanates (ITCs), the breakdown products of glucosinolates (GSLs), are responsible for the phytotoxic effects observed (Bell and Muller 1973, Eberlein et al. 1997). Previous research on the weed suppressing capabilities of brassica cover crops (Mason-Sedun et al. 1986, Grodzinsky 1992, Boydston and Hang 1995, Krishnan et al. 1998) has been carried out using varieties that had not been specifically developed as weed suppressing cover crops. A number of new brassica varieties, high in GSLs, have been developed in Australia for biofumigation and weed control in horticultural and other crops. These varieties include Fumus™ (Indian mustard, Brassica juncea [L.] Czern.), Weedcheck™ (fodder radish, Raphanus sativus L.) and BQMulch™ (fodder rape, Brassica napus L.). Weed suppression by cover crops and their residues may be achieved by resource competition (e.g. light, water, nutrients), allelopathy, niche disruption or a combination of these factors (Masiunas 1998, Sustainable Agriculture Network 1998, Liebman and Davis 2000). Separating the effects of resource competition and allelopathy under field conditions is considered to be very difficult (Inderjit and del Moral 1997), although some progress has been made in non-cropping systems (Williamson 1990, Wardle et al. 1998). Some studies report that phytotoxins, rather than physical factors, are responsible for weed suppression (Worsham 1991, Creamer et al. 1996), while other studies highlight the importance of physical effects such as reduced light transmittance (Teasdale 1993, Grundy et al. 1999a). The role of allelochemical weed suppression in the trials in this chapter was not directly assessed, although the impact of potential phytotoxins was evaluated indirectly by looking at subsequent weed and crop growth after a cover crop. Various species of ryegrass have been used commercially and experimentally as cover crops, including Italian ryegrass (Lolium multiflorum Lam.) (e.g. Nelson et al. 1991, Schonbeck et al. 1991, Creamer et al. 1997, Oregon Wholesale Seed 2001). Italian ryegrass is suitable for cooler
Chapter 5 Pre-crop and in-crop weed control methods
100
areas with shorter growing seasons, and it establishes easily and grows rapidly in most soil types (Stivers-Young 1998, SAREP 2001). Lolium multiflorum Lam. cv. Conquest, a late-flowering variety grown for forage in the New England area of New South Wales, was used as a pre-crop treatment in the experiment reported below to compare with the performance of the lesser known brassica cover crop varieties. Alternatives to growing a cover crop before a herb or vegetable crop include green fallowing (simply allowing the existing weeds to grow) and bare fallowing (tilling the soil periodically). Green fallowing can sequester nutrients, conserve water, provide green manure and increase biodiversity over time and space (Patriquin 1988). Bare fallowing may be similar to false seed bed preparation techniques, where the goal is to allow one or more successive cohorts of weeds to emerge and be killed (e.g. by shallow cultivation, flame weeding, herbicides) prior to sowing or planting a cash crop (Johnson and Mullinix 1998, Merfield 2002). The experimental program reported in this chapter consisted of a series of field trials designed to test the effects of green fallow, bare fallow, two brassica cover crops and a grass cover crop on weed suppression during the pre-crop phase, and to assess weed suppression and crop yield in a subsequent vegetable crop phase using agronomic and economic variables.
5.2 Methods
5.2.1 Field site descriptions
The field trials were carried out at the University of New England's (UNE) research farm, Kirby Research Station in the consecutive summer growing seasons of 1999 – 2000 and 2000 – 2001, and at the University's Laureldale Research Station in the 1999 – 2000 season only. These properties were situated in the Armidale district of the Northern Tablelands, New South Wales. Details about the geographic location, recent land use history, soil types and climate during the research period are provided in section 4.2.1 of the previous chapter. Experiments were not conducted at Laureldale in the second season due to the poor growth of cover crops and lettuce in the first season, the lack of homogeneity of the site (e.g. high spatial variability of weeds, see Figure 5.1), and the difficulty of access on a heavy clay soil after rain.
Chapter 5 Pre-crop and in-crop weed control methods
101
Figure 5.1 Spatial variability of weed emergence at Laureldale, 26/10/99. The plots were orientated left to right in the photo, indicated by the ryegrass cover crop sown in the first and third plots from the front. Note the absence of weeds on the left side of the experimental area (indicated by dashed white line). For each season, cumulative rainfall and degree day estimates were calculated using the methods outlined in section 4.2.1 of Chapter 4. A value of 5°C was used for as a general base temperature (Ash et al. 1999). A summary of the cumulative rainfall and accumulated degree days during the pre-crop phase (i.e. fallows and cover crops) was given in Figure 4.3. This figure also shows the cumulative rainfall plus 30 mm supplementary irrigation applied in 2001 to assist the germination and establishment of the cover crops. During the pre-crop phase, the cumulative rainfall was significantly greater in 2000 than the natural rainfall in 2001 (P < 0.001) and the natural rainfall plus irrigation (P = 0.002). There was no significant difference in accumulated degree days observed between the seasons (P = 0.993). A B
0
50
100
150
200
250
300
0 2 4 6 8 10W eeks after sowing cover crops
Cum
ulat
ive
rain
fall
(m
m)
200020012001 + irrigation
0
100
200
300
400
500
600
700
0 2 4 6 8 10W eeks after sowing cover crops
Deg
ree
days
(°C
d)
20002001
Figure 5.2 Cumulative rainfall (mm, graph A) and accumulated degree days (°Cd, graph B) during the pre-crop phase at Laureldale and Kirby in 1999 – 2000 ( ) and at Kirby in 2000 – 2001 ( ). The dashed line in graph A indicates the cumulative rainfall plus 30 mm supplementary irrigation in 2001. A summary of cumulative rainfall and accumulated degree days for the in-crop phase (i.e. lettuce) is presented in Figure 5.3. During the in-crop phase, rainfall was similar up to about 3 WAP, after which 2001 was significantly wetter than 2000 (P = 0.024), but the differences in accumulated degree days were not significant (P = 0.347).
Chapter 5 Pre-crop and in-crop weed control methods
102
A B
0
50
100
150
200
250
0 2 4 6 8 10W eeks after planting lettuce
Cum
ulat
ive
rain
fall
(m
m)
20002001
0
200
400
600
800
1000
1200
0 2 4 6 8 10W eeks after planting lettuce
Deg
ree
days
(°C
d)
20002001
Figure 5.3 Cumulative rainfall (mm) and accumulated degree days (°Cd) during in-crop phase at Laureldale and Kirby in 1999 – 2000 ( ) and Kirby in 2000 – 2001 ( ). The closed symbols ( , ) represent measurements taken up to harvest time, while the open symbols ( , ) represent measurements after the lettuce was harvested, but while bolting was still being recorded for the remaining plants.
5.2.2 Plant species
The cover crops used in the experiments were Indian mustard (Brassica juncea [L.] Czern. cv. Fumus F-L71), Italian ryegrass (Lolium multiflorum Lam. cv. Conquest), and fodder radish (Raphanus sativus L. cv. Weedcheck). The mustard seed was provided by AgSeed Research Pty. Ltd., Horsham, and the radish seed was provided by AusWest Seeds, Forbes. The ryegrass seed was purchased from Richardsons Hardware & Agriculture, Armidale. Lettuce cv. Imperial Triumph was used as the test crop. Details about the source of the lettuce seeds and seedlings are given in Chapter 4.
5.2.3 Preparation and maintenance of the field plots
At the Kirby and Laureldale sites, the experimental areas were prepared using two passes with a chisel plough to a depth of 250 mm and one pass with a tractor-mounted rotary hoe to a depth of 100 mm. The rows were 2 m wide, the sowing bed (not including the tractor wheel paths) was 1.75 m wide and the plots were 10 m long. The cover crops were sown in seven rows to a depth of about 30 mm using a cone-seeder with seven points set 250 mm apart. The fallow treatments that were not sown with a cover crop were subjected to a single pass of the cone seeder so that the tillage effects of the sowing implement were consistent across all treatments. The whole area used in each trial was as close to square as possible in order to maximise the area:perimeter ratio. In the first season, heavy rain after sowing removed the need to irrigate, but in the second season the plots were irrigated with an overhead sprinkler with approximately 10 mm being applied 4, 7 and 10 days after sowing. This delayed emergence of the cover crops by about two weeks. Two days after sowing, gypsum (15.6% sulfate sulfur) was broadcast at the rate of 200 kg/ha and organically certified 'Long Life' Dynamic Lifter®, a pelletised poultry manure formulation, was broadcast at a rate of 1,000 kg/ha. The nutrient analysis of the poultry manure pellets was nitrogen 4%, phosphorus 3.1%, potassium 1%, calcium 7%, magnesium 0.3%, zinc 0.02% and manganese 0.02%. The cover crop and fallow plots were ploughed in at about 10 weeks after 50% flowering using a rotary hoe to a depth of 100 mm. Following incorporation of the cover crop and fallow plots, the trial area was left to allow the plant residues to begin breaking down. The area was prepared for subsequent planting of the lettuce seedlings by carrying out one pass with the rotary hoe at 2 weeks after incorporation (WAI) and
Chapter 5 Pre-crop and in-crop weed control methods
103
another pass at 4 WAI. Two days after the second rotary hoeing, lettuces were transplanted using the procedures described in Chapter 4.
5.2.4 Treatments applied
Five pre-crop weed control treatments, followed by two in-crop treatments, were used in these experiments. The treatment combinations are given in Table 5.1 and the pre-crop treatments are shown in Figure 5.4. The bare fallow treatment was not used at Laureldale because the clay soil was too boggy for a prolonged period during the pre-crop phase and rotary hoeing was not possible. Table 5.1 Pre-crop and in-crop treatment combinations used.
Pre-crop treatments (fallows and cover crops) In-crop treatments
Green fallow (GF)
Bare fallow (BF)*
Mustard (MU)
Radish (RA)
Ryegrass (RY)
Control Tillage * BF not used at Laureldale.
The pre-crop treatments consisted of a green or weedy fallow, a bare fallow, two brassica cover crops (mustard and radish) and a ryegrass cover crop. The green fallow was left unweeded during the pre-crop phase and was designed to be a control treatment for measuring the level of weed control by the bare fallow and cover crop treatments. The bare fallow was intended to give an indication of the effect of removing weeds in the period prior to planting the lettuce crop in comparison to the other pre-crop treatments. Bare fallowing was carried out by rotary hoeing the plots at 5 weeks after the trial started (i.e. when the cover crop plots were sown) using a tractor-mounted rotary hoe implement to a depth of 100 mm. The cover crops were sown at the rates recommended by the suppliers: 10 kg/ha (~375 seeds/m2) for mustard, 20 kg/ha (~186 seeds/m2) for radish and 100 kg/ha (~4,100 seeds/m2) for ryegrass. The in-crop treatments were implemented in the same way as the control and tillage treatments were carried out in the lettuce trials reported in Chapter 4. In the control treatment, the plots were left unweeded. The tillage treatment consisted of chisel ploughing the plots at 4 WAP the lettuce, with supplementary hand hoeing in the rows to remove weeds between lettuce plants, while completely weeding around each plant.
Chapter 5 Pre-crop and in-crop weed control methods
104
Figure 5.4 Example of the pre-crop weed control treatments used in the trials: GF = green fallow, BF = bare fallow, MU = Indian mustard, RA = fodder radish, RY = ryegrass. Photo taken at Kirby, 10/11/00. A completely randomised design was used, with four replicates for each treatment combination randomly allocated to the field plots based on a list of random numbers generated by the rand() function in Excel®. In the first season (1999 – 2000), the pre-crop treatments were established on 28/9/99 and all plots were ploughed in on 8/12/99, and the lettuce seedlings were planted on 7/1/00 and harvested on 26/2/00. In the second season (2000 – 2001), the pre-crop treatments began on 19/9/00 and were ploughed in on 6/12/00, whilst the lettuce seedlings were planted on 8/1/01 and harvested on 28/2/01.
5.2.5 Assessment of weeds, cover crops and lettuce
During the pre-crop phase, the growth of weeds was measured by recording weed density at 4 and 8 WAS (plus 6 WAS at Kirby in 2001), relative weed cover at 2, 4, 6, 8 and 10 WAS, and final weed biomass at 10 WAS. The sampling and processing methods used were the same as in section 4.2.5. During the in-crop phase weed density and relative cover were measured at 2, 4 and 7 WAP the lettuce and final weed biomass was recorded at 7 WAP (= 21 WAS). Lettuce growth during the in-crop phase was determined by measuring height, diameter and relative cover at 2, 4 and 7 WAP, crop biomass at harvest (7 WAP), and bolting at 7, 9 and 10 WAP. Lettuce size was calculated by multiplying height by diameter. The growth of the cover crops was characterised by measuring relative cover at 2, 4, 6, 8 and 10 WAS. Just prior to incorporation (10 WAS), height, density, light transmittance and biomass were measured. The cover crop height was determined by measuring the height of plants at 3, 4, 5, 6 and 7 metres from the northern or eastern end of the plots, depending on the orientation of the rows. Height measurements were taken from the ground immediately adjacent to the plant base up to the tip of the highest shoot. Density was measured by (a) counting the number of plants in a 0.5 m x 1 m quadrat placed lengthwise in the middle of the plot; and (b) counting the number of plants in the photos used to record relative cover. Cover crop biomass was measured by sampling whole
Chapter 5 Pre-crop and in-crop weed control methods
105
plants from the quadrat used for density measurements, and drying and weighing using the procedure described for weeds and crops in Chapter 4. Light measurements were made using a LI-250 Light Meter with a LI-190SA quantum sensor to detect photosynthetically active radiation (LI-COR 1996). For each plot in the trial, the sensor was held in a horizontal position above the cover crop canopy to determine the incident light level in µmol/sec/m2. Five readings were then taken at 20 mm above ground level, in the middle row of the plots at 3, 4, 5, 6 and 7 metres from the northern or eastern end. The five readings at ground level were averaged and the average was divided by the incident light to give a percentage of light transmitted through the cover crop. Measurements were taken between 11:00 and 13:00 hours on cloud-free days. The cost of each pre-crop treatment was calculated to enable the cost effectiveness of each to be compared. No costs were associated with the green fallow and the cost of the bare fallow was based on labour and machinery usage ($58.82/ha). The cost of the cover crops was based on the price of seed, machinery usage and labour (tractor driver and seeder operator). The seed cost $12.00, $3.70 and $3.50/kg for the mustard, radish and ryegrass, respectively. When sown at the recommended rate, the cost of seed per unit area was $120, $74 and $350/ha, respectively. The tractor and cone seeder cost $50.44/ha (D. Edmonds, pers. comm.) and labour was assumed to cost $15/hour including on-costs. Other economic advantages (e.g. improved soil fertility, disease breaks) and disadvantages (e.g. opportunity cost of not growing a cash crop) of cover crops were not considered. The cost of the control and tillage treatments used during the in-crop phase was calculated in the same way as in Chapter 4. ACV was determined by subtracting the total cost of each weed control treatment from the GCV.
5.2.6 Statistical analysis
Statistical analyses of the data were carried out using the procedures detailed in section 4.2.6 of the previous chapter. In most cases GLMs were used for variables measured at a single time point (e.g. lettuce yield) and GLMMs were used to test the effects of treatments on variables that were measured several times during the course of the trials (e.g. relative weed cover). Contrast analysis was used to separate the means where significant effects were detected. The non-linear least squares regression function in S-Plus 2000® was used to fit data to several response curves (MathSoft 1999a). The suitability of the models was assessed by inspecting the plot of residuals versus fitted values. When the residual variance was not homogeneous, the generalized non-linear least squares regression function was used, with a power or exponential variance function being included in the model to account for the non-normal distribution of the data (MathSoft 1999c). The variability of the data was presented in graphs by using confidence limits (with a probability level of 95%). Cover relative crop cover was modelled using the logistic function
)exp(1 WASmaRC
−+= Equation 5.1
where RC is the relative cover (%), WAS is the time variable, a is the asymptote of maximum relative cover, and m is the inflexion point of the curve (i.e. the time at which RC is 50% of the asymptote). The response of relative weed cover was modelled using Equation 5.2, which is a slight modification of Equation 5.1 to account for the lower level of weed growth in some treatments.
2/)exp(1 WASmaRC−+
= Equation 5.2
Chapter 5 Pre-crop and in-crop weed control methods
106
The number of weeks after sowing (WAS) was used as the time variable for all response variables except the lettuce bolting data. The bolting results were analysed as a function of accumulated degree days because the temperature difference between the growing seasons was relatively large during the period after lettuce harvest compared with earlier in the trials. Light transmittance through a canopy is commonly described using the exponential decay function
)*exp( RCkLL i −= Equation 5.3 where Li represents the incident light above the canopy, k is the extinction coefficient and RC is the cover crop relative cover (Thornley and Johnson 1990). However, Equation 5.3 does not always provide a good fit for experimental data (Sutton 1998). When the exponential decay function is inadequate, an alternative sigmoidal function may used based on a generalised, inverted Michaelis-Menten equation
nn
n
RCmmaL
**
= Equation 5.4
where a is the upper asymptote, m is the RC at which L is 50% of the asymptote and n represents the slope or degree of sigmoidal curvature (Thornley and Johnson 1990). The fit of the two models was compared using the anova function and F-test in S-Plus 2000® to determine if the models differed significantly, and then by inspecting the residual sums of squares (RSS) to identify the model with the lower RSS (Crawley 2002). In addition to relative cover, cover crop height and biomass were also used individually and in combination to analyse the light response. The combinations were height + relative cover, height + biomass, relative cover + biomass, and height + relative cover + biomass. In the combined analysis, a cover crop growth index was calculated by separately adjusting relative cover, height and biomass to make their ranges vary from 0 to 1 (using the formula x' = xi/xmaximum), summing the adjusted variables and dividing by the number of variables used. The combinations were used because their correlation with light was better than for individual variables.
5.3 Results
5.3.1 Cover crop growth
The plant densities of the cover crops were determined at the end of the pre-crop phase and the results are presented in Table 5.2. The density in the MU and RA treatments were significantly lower at Laureldale (P = 0.031 and 0.002 respectively) than at Kirby in 2000 and 2001; however, there were no significant differences in the final density of the RY treatment (P = 0.781). Compared with the initial sowing rate (Table 5.2), about 60% of the RY seeds emerged and survived through the 10 week pre-crop period. At Laureldale, the survival of MU and RA seedlings was only 13 and 14%, while in the other two trials, average survival was 23% for MU and 22% for RA seedlings.
Chapter 5 Pre-crop and in-crop weed control methods
107
Table 5.2 Initial sowing rate of cover crops (seeds/m2) and the average density (plants/m2) at the end of the pre-crop phase. The mean density in each trial is shown for each cover crop, with the standard error of the mean given in brackets. Initial sowing rate Average cover crop density ± standard error (plants/m2) Cover crop (seeds/m2) Laureldale 2000 Kirby 2000 Kirby 2001 Mustard 375 54.0 (10.63) 83.6 (11.41) 83.5 (13.67) Radish 186 23.8 (42) 44.3 (6.90) 40.6 (4.87) Ryegrass 4,100 2306.6 (120.19) 2412.9 (192.82) 2488.3 (128.50)
The growth pattern of the cover crops, in terms of relative cover, is given in Figure 5.5. The responses were analysed using GLMMs and the effects of the trials, treatments and the interaction of trials and treatments were significant (P < 0.001). Apart from the MU and RA at Laureldale, the responses showed a similar pattern across treatments and trials. The brassica cover crops at Laureldale failed to establish effectively and subsequent growth was poor. These treatments only achieved a relative cover of about 12%, whilst relative weed cover was about 80%. In the other trials, the brassica cover crops reached an average of 85% relative cover. The RY treatment had an average relative cover of 98% for all trials. Possible causes for the poor growth at Laureldale are raised in the discussion section below, although waterlogging is likely to have reduced the growth of the brassica cover crops in particular due to their root morphology, i.e. tap roots as opposed to fibrous roots (Figure 5.6).
y=15.1/(1 + exp(3.2-x) )
0
20
40
60
80
100
120Mustard
Laureldale 2000
y=16.6/(1 + exp(3.3-x) )Radish
Laureldale 2000
y=98.6/(1 + exp(4.9-x) )Ryegrass
Laureldale 2000
y=88.7/(1 + exp(4.6-x) )
0
20
40
60
80
100
120Mustard
Kirby 2000
y=94.6/(1 + exp(4.4-x) )Radish
Kirby 2000
y=103.6/(1 + exp(4.8-x) )Ryegrass
Kirby 2000
y=95.7/(1 + exp(5.2-x) )
0
20
40
60
80
100
120Mustard
Kirby 2001
2 4 6 8 10
y=95/(1 + exp(6.6-x) )Radish
Kirby 2001
2 4 6 8 10
y=104/(1 + exp(5.2-x) )Ryegrass
Kirby 2001
2 4 6 8 10
Weeks after sowing
Cov
er c
rop
rela
tive
cove
r (%
)
Figure 5.5 Effect of pre-crop weed control treatments on cover crop relative cover (%) over time at Laureldale and Kirby in 2000 and Kirby in 2001. The circles show the data points, the solid lines are the logistic regression curves, the dashed lines are the 95% confidence limits, and the equations describe the regression for each treatment combination.
Chapter 5 Pre-crop and in-crop weed control methods
108
Figure 5.6 Effect of waterlogging on fodder radish root at Laureldale, 6/12/00. (Coin diameter is 19 mm.) The m parameter values in the logistic regression were higher at Kirby in 2001 than in 2000, especially for MU and RA. The parameter m represents that time at which 50% of predicted growth will have occurred. The parameters indicate that 50% relative cover would be achieved in 4.6 weeks for MU and 4.4 weeks for RA at Kirby in 2000, but in 2001, 5.2 and 6.6 weeks would be needed to reach 50% relative cover for MU and RA respectively. It is likely that the lower rainfall at Kirby in 2001 reduced the growth rate of these cover crops. The biomass produced by the cover crops just prior to incorporation at 10 WAS is shown in Figure 5.7. An analysis of these data using GLMs indicated that the effects of trials, treatments and the interaction of trials and treatments were all significant (P ≤ 0.011). As noted above, the performance of the brassica cover crops was poor at Laureldale and their biomass was significantly less than in the other trials (P < 0.001). The biomass of RY was consistent between all trials (average of 5,360 kg/ha), and RA biomass was similar in the two Kirby trials (average of 5,160 kg/ha). However, MU biomass was significantly lower (P = 0.043) at Kirby in 2000 than in 2001, with weights of 4,330 and 7,165 kg/ha respectively. Cover crop height was also recorded, however, differences in this variable were essentially the result of the different growth habits of the three cover crop species. MU was the tallest cover crop, with an average height of 0.75 m at Kirby in 2000 and 1.62 m in 2001, while RA was next tallest at 0.40 m (Kirby 2000) and 1.16 m (Kirby 2001). The RY cover crop was the shortest, averaging 0.37 m across all the trials.
Chapter 5 Pre-crop and in-crop weed control methods
109
Mustard
Radish
Ryegrass
Laureldale 2000
Mustard
Radish
Ryegrass
Kirby 2000
Mustard
Radish
Ryegrass
Kirby 2001
0 1000 2000 3000 4000 5000 6000 7000 8000
Cover crop biomass (kg/ha)
Pre
-cro
p tre
atm
ent
Figure 5.7 Effect of pre-crop weed control treatments on cover crop biomass (kg/ha) at Laureldale and Kirby in 2000 and Kirby in 2001. The dots show the mean of each treatment in each trial and the error bars show the standard error of the means. The weed variables prior to incorporation (density, relative cover and biomass) were only moderately correlated (r2 ≤ 0.76) with the cover crop variables prior to incorporation (height, relative cover and biomass, Figure 5.8). The strongest correlation was observed between relative weed cover and cover crop biomass, while weed density was very weakly correlated with the cover crop variables. The slope coefficients were all significant (P < 0.001). The variables were poorly correlated for RY because there was relatively little variation in response compared with MU and RA. Such clumped data are less likely to display trends in response (Devore and Peck 1993). An analysis of the relationship between weeds prior to incorporation and cover crop variables during the pre-crop phase indicated that the earlier the cover crop measurement, the weaker the correlation with final weed levels.
Chapter 5 Pre-crop and in-crop weed control methods
110
A
r² = 0.05
500
1000
1500
Mustard
0 20 40 60 80 100
r² = 0.11
Radish
0 20 40 60 80 100
r² = 0.06
Ryegrass
0 20 40 60 80 100
Cover crop relative cover (%)
Wee
d de
nsity
(wee
ds/m
²)
B
0
20
40
60
80
0 2000 4000 6000 8000 10000
Mustard
r² = 0.7
0 2000 4000 6000 8000 10000
Radish
r² = 0.76
0 2000 4000 6000 8000 10000
Ryegrass
r² = 0.21
Cover crop biomass (kg/ha)
Wee
d re
lativ
e co
ver (
%)
C
r² = 0.53
0
500
1000
1500
2000
2500
3000
Mustard
0 20 40 60 80 100
r² = 0.66
Radish
0 20 40 60 80 100
r² = 0.35
Ryegrass
0 20 40 60 80 100
Cover crop relative cover (%)
Wee
d bi
omas
s (k
g/ha
)
Figure 5.8 Relationship between (A) weed density (weeds/m2) and cover crop relative cover (%), (B) relative weed cover (%) and cover crop biomass (kg/ha), and (C) weed biomass (kg/ha) and cover crop relative cover (%) for mustard, radish and ryegrass at Laureldale and Kirby in 2000 and Kirby in 2001. The circles show the data points, the solid lines are the linear regression curves and the r2 indicates the correlation.
Chapter 5 Pre-crop and in-crop weed control methods
111
The amount of light that reached ground level under the cover crop canopy was recorded shortly before incorporation of the cover crops. The results were expressed as a percentage of the incident light to give a measure of the light transmitted through the cover crops (Figure 5.9). The differences in light transmittance between trials, treatments and the interaction of trials and treatments were tested using GLMs and all terms were significant (P < 0.001). In all trials, RY prevented at least 85% of the light from reaching ground level and was the most effective cover crop in this regard (P ≤ 0.001). The brassica cover crops displayed a similar capacity to each other for reducing light transmittance (P ≥ 0.585), although their effectiveness varied considerably between trials. At Laureldale, only about 20% of incident light was intercepted by the MU and RA, while at Kirby in 2000, about 63% of light was intercepted. At Kirby in 2001, the brassica cover crops reduced light by about 90%, although this was still less than RY.
Mustard
Radish
Ryegrass
Laureldale 2000
Mustard
Radish
Ryegrass
Kirby 2000
Mustard
Radish
Ryegrass
Kirby 2001
0 10 20 30 40 50 60 70 80 90 100
Light transmitted (% of incident light)
Pre
-cro
p tre
atm
ent
Figure 5.9 Effect of pre-crop weed control treatments on light transmitted though the cover crop (% of incident light) at Laureldale and Kirby in 2000 and Kirby in 2001. The dots show the mean of each treatment in each trial and the error bars show the standard error of the means. The relationship between light transmittance and the cover crop variables (individual and combined) was analysed using non-linear regression. The relationship between light and the combination of cover crop height and relative cover yielded the best fit (Figure 5.10). The response of RY was adequately described by the simpler exponential decay function Equation 5.3, however, a comparison with the sigmoidal function Equation 5.4, indicated that MU and RA were usually better described by the latter function (P ≤ 0.051). The combined variables generally fitted better than the individual variables, with residual sums of squares of 13,206 to 25,071 for the combined variables and 14,700 to 57,045 for the individual variables.
Chapter 5 Pre-crop and in-crop weed control methods
112
y=91.4*0.5^2.5/(0.5^2.5+x^2.5)
020
4060
8010
0
Mustard
0.2 0.4 0.6 0.8 1.0
y=82.6*0.5^7.3/(0.5^7.3+x^7.3)Radish
0.2 0.4 0.6 0.8 1.0
y=852067.8*exp(-20.1*x))Ryegrass
0.2 0.4 0.6 0.8 1.0
Cover crop growth index
Ligh
t tra
nsm
itted
(% o
f inc
iden
t lig
ht)
Figure 5.10 Relationship between light transmitted though the cover crop (% of incident light) and a cover crop growth index (combination of height and relative cover) at Laureldale and Kirby in 2000 and Kirby in 2001. The circles show the data points, the solid lines are the sigmoidal regression curves, the dashed lines are the 95% confidence limits, and the equations describe the regression for each cover crop.
5.3.2 Weeds during the pre-crop phase
The weed flora at Laureldale was predominantly composed of Fagopyrum esculentum (volunteers from previous crop), Polygonum aviculare and Paspalum dilatatum. At Kirby, the weed flora was dominated by Acetosella vulgaris, Polygonum aviculare, Holcus lanatus L. and Phalaris aquatica L. in both growing seasons (2000 and 2001). The density of weeds during the pre-crop phase is shown in Figure 5.11 An analysis using GLMMs indicated that weed density varied significantly between trials and pre-crop weed control treatments (P > 0.007), but the trial × treatment interaction was not significant (P = 0.375). The initial weed density was higher at Laureldale and Kirby in 2000 than at Kirby in 2001, and remained higher throughout the pre-crop phase. At 4 WAS, the average weed density in 2000 (both sites) was 543 weeds/m2 compared with 83 weeds/m2 in 2001, while at the end of this phase, the average weed densities were 950 weeds/m2 and 378 weeds/m2 respectively. In 2000, only the bare fallow (BF) treatment suppressed the emergence of weeds during the pre-crop phase, indicated by the non-significant slope of the linear regression (Pslope = 0.230). Compared with the unweeded green fallow (GF), the cover crops slightly suppressed weed emergence (P ≤ 0.053), except mustard (MU) at Kirby (P = 0.419). In 2001, weed density in the GF treatment increased at a greater rate than the BF, MU and ryegrass (RY) treatments (P ≤ 0.047), but not the radish (RA) (P = 0.320). The differences in final weed density (8 WAS) for the treatments were not significant at Laureldale in 2000 and Kirby in 2001 (P = 0.370 and 0.074 respectively). At Kirby in 2000, weed density was higher in MU and GF (average 1220 weeds/m2) compared with the other treatments (P = 0.029), with an average of 1220 weeds/m2 in the MU and GF, and 850 weeds/m2 in the others.
Chapter 5 Pre-crop and in-crop weed control methods
113
y = 88 + (129.34x)
0
500
1000
1500
2000Green fallow
Laureldale 2000Bare fallow
Laureldale 2000
y = 180 + (89.03x)Mustard
Laureldale 2000
y = 114 + (97x)Radish
Laureldale 2000
y = 55 + (98.69x)Ryegrass
Laureldale 2000
y = -120 + (168.54x)
0
500
1000
1500
2000Green fallowKirby 2000
y = 542 + (27.34x)Bare fallowKirby 2000
y = 26 + (148.19x)Mustard
Kirby 2000
y = 117 + (91.62x)Radish
Kirby 2000
y = 110 + (102.19x)RyegrassKirby 2000
y = -309 + (99.84x)
0
500
1000
1500
2000Green fallowKirby 2001
2 4 6 8 10
y = -253 + (68.88x)Bare fallowKirby 2001
2 4 6 8 10
y = -178 + (66.75x)Mustard
Kirby 2001
2 4 6 8 10
y = -219 + (79.72x)Radish
Kirby 2001
2 4 6 8 10
y = -142 + (52.97x)RyegrassKirby 2001
2 4 6 8 10
Weeks after sowing
Wee
d de
nsity
(wee
ds/m
²)
Figure 5.11 Effect of pre-crop weed control treatments on weed density (weeds/m2) over time at Laureldale and Kirby in 2000 and Kirby in 2001. The circles show the data points, the solid lines are the linear regression curves, the dashed lines are the 95% confidence limits, and the equations describe the regression for each treatment combination. The bare fallow treatment was not used at Laureldale in 2000. The response of relative weed cover to the pre-crop treatments in each trial is shown in Figure 5.12. The effects of the trials, treatments and the trial × treatment interaction were tested using GLMMs and were found to be significant (P < 0.001). In all three trials, relative weed cover in the GF increased rapidly from 3 to 5 WAS and reached complete coverage of the plots by between 6 and 9 WAS. The final relative weed cover at 10 WAS, was significantly higher for the GF in all trials (P ≤ 0.006). At Laureldale, the two brassica cover crops (i.e. FU and RA) failed to establish effectively and emerged weeds were able to grow relatively unimpeded and achieve 80% cover by 10 WAS. In contrast, the RY at Laureldale and the non-GF treatments at Kirby in both years all strongly suppressed weed growth. The RY was the most effective treatment, with significantly lower weed levels than other treatments in all trials (P ≤ 0.017), except MU at Kirby in 2001 (P = 0.520). In general, the relative weed cover in the cover crop treatments appeared to increase initially, but then level off as the cover crop grew and out-competed the weeds. In the BF treatment weeds were effectively controlled by the rotary hoeing at 5 WAS. However, on-going suppression was not provided, indicated by the increase in relative cover between 8 and 10 WAS, and the significantly higher predicted asymptote, 44.6 (± 17.4, standard error) and 188.9 (± 87.0, standard error) in 2000 and 2001 respectively, compared with the cover crops.
Chapter 5 Pre-crop and in-crop weed control methods
114
0
20
40
60
80
100
120Green fallow
Laureldale 2000
y=99.3/(1 + exp(5.4-x)/2 )Bare fallow
Laureldale 2000Mustard
Laureldale 2000
y=84.7/(1 + exp(5.6-x)/2 )Radish
Laureldale 2000
y=79.3/(1 + exp(5.6-x)/2 )Ryegrass
Laureldale 2000
y=7.6/(1 + exp(2.7-x)/2 )
0
20
40
60
80
100
120Green fallowKirby 2000
y=102.7/(1 + exp(5.8-x)/2 )Bare fallowKirby 2000
y=44.6/(1 + exp(10.6-x)/2 )Mustard
Kirby 2000
y=14.9/(1 + exp(4.9-x)/2 )Radish
Kirby 2000
y=9.1/(1 + exp(5.4-x)/2 )Ryegrass
Kirby 2000
y=3.5/(1 + exp(2.9-x)/2 )
0
20
40
60
80
100
120
2 4 6 8 10
Green fallowKirby 2001
y=111.2/(1 + exp(7.7-x)/2 )
2 4 6 8 10
Bare fallowKirby 2001
y=188.9/(1 + exp(12.7-x)/2 )
2 4 6 8 10
MustardKirby 2001
y=5.4/(1 + exp(3.9-x)/2 )
2 4 6 8 10
RadishKirby 2001
y=12.7/(1 + exp(5-x)/2 )
2 4 6 8 10
RyegrassKirby 2001
y=2.4/(1 + exp(2.8-x)/2 )
Weeks after sowing
Rel
ativ
e w
eed
cove
r (%
)
Figure 5.12 Effect of pre-crop weed control treatments on relative weed cover (%) over time at Laureldale and Kirby in 2000 and Kirby in 2001. The circles show the data points, the solid lines are the logistic regression curves, the dashed lines are the 95% confidence limits, and the equations describe the regression for each treatment combination. The bare fallow treatment was not used at Laureldale in 2000. Weed biomass was measured prior to incorporating the fallows and cover crops at 10 WAS (Figure 5.13). An analysis using GLMs indicated that the effects of trials, treatments and the trial × treatment interaction were significant (P ≤ 0.011). The general trends were similar to those observed for relative weed cover. The GF had the highest weed biomass in all trials (P < 0.001) with an average of 3,720 kg/ha. At Laureldale, the MU and RA had high weed biomasses, again due to poor establishment by the cover crops. All other treatments at Kirby in 2000 and 2001 were similar (P ≥ 0.200), except RY which consistently had the lowest weed biomass in each trial (P < 0.01). Where the brassica cover crops established well, they reduced weed growth by about 80%, while the BF achieved an 85% reduction and RY a 97% reduction.
Chapter 5 Pre-crop and in-crop weed control methods
115
Green fallow
Bare fallow
Mustard
Radish
Ryegrass
Laureldale 2000
Green fallow
Bare fallow
Mustard
Radish
Ryegrass
Kirby 2000
Green fallow
Bare fallow
Mustard
Radish
Ryegrass
Kirby 2001
0 500 1000 1500 2000 2500 3000 3500 4000 4500
Weed biomass (kg/ha)
Pre
-cro
p tre
atm
ent
Figure 5.13 Effect of pre-crop weed control treatments on weed biomass (kg/ha) immediately prior to incorporation at Laureldale and Kirby in 2000 and Kirby in 2001. The dots show the mean of each treatment in each trial and the error bars show the standard error of the means. The bare fallow treatment was not used at Laureldale in 2000. The relationships between light transmitted and weed density, relative cover and biomass prior to incorporation were adequately described by a linear model rather than a non-linear model (P ≥ 0.070). Relative weed cover had a reasonable correlation with light transmitted for the MU and RA cover crops (r2 = 0.78 and 0.82 respectively), but not with RY (r2 = 0.35). In the RY treatment, both variables (light and relative weed cover) were very low and, as noted above, such clumped data are unlikely to yield high linear correlations. Weed density and weed biomass were poorly correlated with light transmission through the cover crops (r2 ≤ 0.49).
5.3.3 Weeds during the in-crop phase
The response of weeds during the in-crop phase was potentially a result of both pre-crop and in-crop treatments. The effects of pre-crop treatments (i.e. green fallow, bare fallow, and mustard, radish and ryegrass cover crops) may be expected to be more evident during the early part of the lettuce phase. An evaluation of the effects of trials, pre-crop treatment, in-crop treatment and the 2-way and 3-way interactions was carried out using GLMMs. The effects of the pre-crop treatments, their 2-way interaction with the trials and in-crop treatments, and the 3-way interaction with trials and in-crop treatments were all non-significant (P ≥ 0.154). Therefore, the following results are presented with the pre-crop treatments pooled for each trial × in-crop treatment combination. The effect of trials was highly significant (P < 0.001) for all weed variables. Weed levels were lowest at Kirby in 2000, highest at Kirby in 2001 and intermediate at Laureldale. The in-crop treatments, unweeded control and mechanical tillage, were significantly different at 4 and 7 WAP (P ≤ 0.011), but not at 2 WAP (P ≥ 0.093). The trial × in-crop treatment interaction was significant for the weed variables only at lettuce harvest, i.e. 7 WAP (P ≤ 0.001).
Chapter 5 Pre-crop and in-crop weed control methods
116
The effects of the in-crop treatments on weeds generally followed a similar pattern to that observed in the trials reported in the previous chapter. Weed density (Figure 5.14) did not increase for the control or tillage treatments at Laureldale and Kirby in 2000, nor for the tillage treatment at Kirby in 2001. However, at Kirby in 2001, the slope was significant for the control treatment (P < 0.001). Final weed densities in the tillage treatment were between 24 and 46% of the weed densities in the control treatment. In the trials reported in Chapter 4, the ratio between density in the tillage and control was about 30%.
y = 230.8 + (-1.6x)
0
200
400
600
800
1000Control
Laureldale 2000
y = 137 + (-4.5x)Tillage
Laureldale 2000
y = 31.8 + (4.7x)
0
200
400
600
800
1000Control
Kirby 2000
y = 57.4 + (-5.5x)Tillage
Kirby 2000
y = 160.3 + (25.6x)
0
200
400
600
800
1000Control
Kirby 2001
2 3 4 5 6 7 8
y = 175.7 + (-6.5x)Tillage
Kirby 2001
2 3 4 5 6 7 8
Weeks after planting
Wee
d de
nsity
(wee
ds/m
²)
Figure 5.14 Effect of in-crop weed control treatments on weed density (weeds/m2) over time at Laureldale and Kirby in 2000 and Kirby in 2001. The circles show the data points, the solid lines are the linear regression curves, the dashed lines are the 95% confidence limits, and the equations describe the regression for each treatment combination. The response of relative weed cover to the in-crop treatments at each trial is shown in Figure 5.15. Relative weed cover increased significantly for all trial × treatment combinations (P < 0.01), although the slopes were higher for the control treatment in each trial. The final relative weed cover in the tillage treatment was between 17 and 40% of the relative weed cover in the control. In the trials reported in Chapter 4, the ratio of relative weed cover was about 30%. Tillage achieved the greatest reduction in relative weed cover when the weed levels were lowest, i.e. at Kirby in 2000. As the weed levels increased, the effectiveness of the tillage treatment was reduced.
Chapter 5 Pre-crop and in-crop weed control methods
117
0
20
40
60
80
100Control
Laureldale 2000
y = -8 + (6.6x)Tillage
Laureldale 2000
y = 2.5 + (2.1x)
0
20
40
60
80
100Control
Kirby 2000
y = -7.9 + (3.7x)Tillage
Kirby 2000
y = 0.6 + (0.5x)
0
20
40
60
80
100
2 3 4 5 6 7 8
ControlKirby 2001
y = -24.3 + (13x)
2 3 4 5 6 7 8
TillageKirby 2001
y = -3.4 + (3.9x)
Weeks after planting
Rel
ativ
e w
eed
cove
r (%
)
Figure 5.15 Effect of in-crop weed control treatments on relative weed cover (%) over time at Laureldale and Kirby in 2000 and Kirby in 2001. The circles show the data points, the solid lines are the linear regression curves, the dashed lines are the 95% confidence limits, and the equations describe the regression for each treatment combination. The response of weed biomass at lettuce harvest (Table 5.3) showed a similar pattern to relative weed cover at 7 WAP. Tillage gave reductions in weed biomass of between 46 and 90% compared with the control treatment (66% in the previous chapter's trials). Table 5.3 Average weed biomass (kg/ha) at lettuce harvest. The mean biomass in each trial is shown for the two in-crop treatments, with the standard error of the mean given in brackets. The reduction in weed biomass by the tillage treatment (as a percentage of the control treatment) is also given. Average weed biomass ± standard error (kg/ha) In-crop treatment Laureldale 2000 Kirby 2000 Kirby 2001 Control 1,787 (228) 770 (97) 1,286 (116) Tillage 970 (144) 77 (23) 600 (73) Reduction by tillage (% of control) 46% 90% 53%
5.3.4 Lettuce
The effects of the trials, pre-crop treatments and in-crop treatments on the growth of the lettuces were analysed using GLMMs. The effects involving pre-crop treatments were mostly non-significant (P ≥ 0.116), and the interaction of pre-crop and in-crop treatments was not significant for all variables measured (P ≥ 0.191). Only lettuce size (height × diameter) at 2 WAP varied significantly (P ≤ 0.026) in response to the pre-crop treatments and the pre-crop treatments × trials interaction (Figure 5.16). At Laureldale, the lettuces in the RY plots were about 40% smaller than the other treatments at 2 WAP (P = 0.009), while at Kirby in 2001 the lettuces were about 25% smaller in the RY plots at 2 WAP (P = 0.046) than the other treatments. Compared with the GF, the brassica cover crops did not appear to reduce the early growth of lettuce and final lettuce size, and relative cover and yield were also unaffected.
Chapter 5 Pre-crop and in-crop weed control methods
118
y = -0.035 + (0.066x)0.
00.
20.
40.
60.
81.
0 Green fallowLaureldale 2000
Bare fallowLaureldale 2000
y = -0.076 + (0.076x)Mustard
Laureldale 2000
y = -0.053 + (0.071x)Radish
Laureldale 2000
y = -0.053 + (0.054x)Ryegrass
Laureldale 2000
y = -0.048 + (0.089x)
0.0
0.2
0.4
0.6
0.8
1.0 Green fallow
Kirby 2000
y = -0.044 + (0.105x)Bare fallowKirby 2000
y = -0.101 + (0.106x)Mustard
Kirby 2000
y = -0.11 + (0.102x)Radish
Kirby 2000
y = -0.07 + (0.101x)RyegrassKirby 2000
y = -0.032 + (0.047x)
0.0
0.2
0.4
0.6
0.8
1.0 Green fallow
Kirby 2001
2 3 4 5 6 7 8
y = -0.042 + (0.052x)Bare fallowKirby 2001
2 3 4 5 6 7 8
y = -0.007 + (0.039x)Mustard
Kirby 2001
2 3 4 5 6 7 8
y = -0.069 + (0.058x)Radish
Kirby 2001
2 3 4 5 6 7 8
y = -0.078 + (0.054x)RyegrassKirby 2001
2 3 4 5 6 7 8
Weeks after planting
Lettu
ce s
ize
(m²)
Figure 5.16 Average lettuce size (m2) in response to pre-crop weed control treatment at Laureldale and Kirby in 2000 and 2001. The circles show the data points, the solid lines are the linear regression curves, the dashed lines are the 95% confidence limits, and the equations describe the regression for each treatment combination. The bare fallow treatment was not used at Laureldale in 2000. The effect of the in-crop treatments and the interaction of trials and the in-crop treatments were significant for all lettuce variables measured (P < 0.037). The averages of the variables relative crop cover, lettuce size, crop yield and bolted lettuces at harvest, pooled across pre-crop treatment, are presented in Table 5.4. At Laureldale, the variables did not differ between in-crop treatments. At Kirby in 2000, the control treatment produced significantly higher lettuce growth variables than tillage (e.g. yield was 17% lower in tillage), and bolting was considerably lower (21%) in the control treatment. The high yield of lettuce in the control is noteworthy. It is likely that the low weed levels failed to suppress yield. In contrast, at Kirby in 2001, the tillage treatment produced higher lettuce growth with tillage yielding about 85% more than the control. Bolting was still considerably higher in the tillage treatment however. These responses followed a similar pattern to that reported in the previous chapter for the control and tillage treatment in the lettuce trials.
Chapter 5 Pre-crop and in-crop weed control methods
119
Table 5.4 Response of lettuce to the in-crop weed control treatments for relative lettuce cover, lettuce size, crop yield and bolted lettuces at harvest. The mean in each trial, pooled across pre-crop treatments, is shown for the two in-crop treatments, with the standard error of the mean given in brackets. The P-value shows the level of significance of in-crop treatment differences. Laureldale 2000 Kirby 2000 Kirby 2001 Variable Control Tillage Control Tillage Control Tillage Relative lettuce cover (%)
18.0 (2.1)
22.4 (2.3)
35.1 (1.5)
29.9 (1.2)
16.6 (1.2)
27.6 (1.5)
P = 0.170 P = 0.008 P < 0.001 Lettuce size (m2)
0.037 (0.0022)
0.038 (0.0030)
0.062 (0.0030)
0.051 (0.0022)
0.020 (0.0015)
0.037 (0.0028)
P = 0.688 P = 0.015 P < 0.001 Crop yield ($/ha) 10,478
(962) 12,258 (1,177)
21,706 (1,058)
17,947 (812)
10,623 (973)
19,866 (1,430)
P = 0.081 P = 0.008 P < 0.001 Bolted lettuces (%)
1.67 (0.75)
2.92 (1.13)
0.50 (0.36)
2.33 (0.64)
2.67 (0.86)
15.3 (2.46)
P = 0.102 P < 0.001 P < 0.001
5.3.5 Economic evaluation of pre-crop and in-crop weed control treatments
The total cost of the pre-crop and in-crop weed management treatment combinations is shown in Table 5.5. The RY was the most expensive pre-crop treatment, mainly due to the higher sowing rate, i.e. 100kg/ha compared with 10 and 20 kg/ha for MU and RA respectively. The BF was relatively cheap as it involved only one pass with a tractor and implement. Expressing the costs as a proportion of the GCV (Table 5.6), the pre-crop treatment costs represented between 0 and 1.7% of the gross return for the fallows and brassica cover crops and about 3.9% for the RY. The total costs for the control treatment during the in-crop phase were unchanged, but the tillage treatment added almost $1,000/ha to the cost of weed management already incurred during the pre-crop phase. As a proportion of GCV, weeding costs for the fallows and brassica cover crops were between 7.1 and 8.7%, and 10.9% for the RY. When considered as a proportion of the gross return, the slightly higher costs associated with the RY treatment appear to be minor.
Chapter 5 Pre-crop and in-crop weed control methods
120
Table 5.5 Total cost of the pre-crop and in-crop weed control treatment combinations ($/ha), averaged across the three trials. Total cost ($/ha) Pre-crop treatment Control Tillage Green fallow 0.00 994.28 Bare fallow 58.82 1,053.10 Mustard 155.74 1,150.02 Radish 109.74 1,104.02 Ryegrass 385.74 1,380.02
The GCV and ACV for the in-crop treatments in each trial are presented in Table 5.6. An analysis of the effects of trials, pre-crop treatments and in-crop treatments using GLMs indicated that the trials and in-crop treatments were significant for the GCV and ACV (P ≤ 0.030), but the pre-crop treatments were not significant (P ≥ 0.117). The trial × in-crop treatment interaction was the only significant interaction term (P > 0.001) for GCV and ACV. The crop values showed no difference at Laureldale, but at Kirby, the GCV and ACV for the control treatment dropped by about 50% from 2000 to 2001, while tillage had consistent crop values in both years. Adjusting the GCV to include the cost of treatments (i.e. ACV) did not affect the ranking of the treatments, as the treatment costs were very small relative to the crop value. Table 5.6 Gross crop value and adjusted crop value of lettuce in response to the in-crop weed control treatments in each trial. The mean in each trial, pooled across pre-crop treatments, is shown for the two in-crop treatments, with the standard error of the mean given in brackets. The P-value shows the level of significance of in-crop treatment differences. Laureldale 2000 Kirby 2000 Kirby 2001 Variable Control Tillage Control Tillage Control Tillage Gross crop value ($/ha) 7,976 (698) 9,225 (739) 16,421 (801) 13,577 (615) 8,036 (736) 15,029
(1,082) P = 0.179 P = 0.011 P < 0.001 Adjusted crop value ($/ha) 7,805 (714) 8,142 (748) 16,273 (803) 12,500 (615) 7,886 (747) 13,947
(1,088) P = 0.523 P < 0.001 P < 0.001
5.4 Discussion
5.4.1 Cover crop growth
The brassica cover crops performed poorly at Laureldale, with about 40% less survival of seedlings compared with the two years at Kirby. The clay soil at Laureldale had larger and harder peds at sowing (up to 100 mm diameter), while the Kirby soil had a finer tilth (maximum ped size ~20 mm). The seed bed conditions at Laureldale would have created very uneven sowing depths, poor soil-seed contact and poor soil coverage which could be expected to reduce seed germination and seedling survival. Heavy rainfall early in the season, combined with very poor drainage, may have also reduced brassica cover crop seedling survival due to waterlogging. The ryegrass cover crop did not suffer the same fate as the brassicas, possibly due to the different shape of the seed (long and narrow, as opposed to spherical) reducing deeper burial and the fibrous root system tolerating waterlogging more effectively than the tap-rooted brassicas. The vigour and tolerance of imperfect conditions by Italian ryegrass has been reported elsewhere (Stivers-Young 1998, SAREP 2001). However, even when better conditions existed for seedling establishment, MU and RA only managed about 23% survival rate (i.e. emergence and survival through to termination), compared with an average for RY of 60%. Data on emergence was not recorded, so it is unclear whether the low survival rates were due to poor emergence and establishment or to reduced growth and/or death after establishment. Seed germinability of MU and RA was adequate found to be in glasshouse trials, were emergence rates of over 95% was observed.
Chapter 5 Pre-crop and in-crop weed control methods
121
It is proposed that the low survival was probably caused by poor emergence based on poor bed preparation and inconsistent watering-in, rather than poor growth after establishment. The soil tilth was worse at Laureldale than Kirby and that is reflected in the lower survival rates at Laureldale. The survival rates also appear to be independent of cover crop sowing rate. In experiments looking at different sowing rates (from 12.5 to 200% of the recommended sowing rate; see Chapter 6), it was found that MU and RA survival was very consistent, regardless of sowing rates. Instead, cover crop density would be more likely to affect post-establishment growth, e.g. through increased intraspecific competition or lodging (Harper 1977). The lower survival rate and inconsistency of survival between sites highlights the importance of selecting suitable soil types, creating a fine tilth for good establishment and providing adequate irrigation (Titley 1998, Light 1999). The two brassicas tested should be sown heavily (at least the commercially recommended rate) in order to maximise relative cover and biomass production in competition against weeds (Nelson et al. 1991, Morse 1999). As a result of the poor survival rates of MU and RA at Laureldale in 2000, the relative cover and final biomass of the cover crops were significantly reduced, and the amount of light transmitted through the cover crops was considerably higher, compared with the RY at Laureldale and with all cover crops at Kirby in 2000 and 2001. Poor cover crop establishment and variable biomass production have been associated with a lack of weed suppression in other studies (Schonbeck et al. 1991, Eadie et al. 1992, Creamer and Baldwin 2000). When better establishment was achieved, the brassica cover crops provided about 85% relative cover, biomass production was higher (4 – 7 tonnes/ha) and they reduced light transmission to ground level by between 60 and 90%. The RY crop grew quickly and consistently, almost completely covering the plots and producing over 5 tonnes of biomass per ha. Consequently, light transmission was reduced by 85 – 98%. The relationship between light transmission prior to incorporation and cover crop growth was inversely correlated, especially when height and relative cover were considered together. Similar relationships between light and cover crop residues have also been reported earlier (Teasdale and Mohler 1993, Sutton 1998). No problems were experienced in effectively terminating the cover crops and the weedy vegetation in the green fallow using the rotary hoe, except at Laureldale, where the heavy clay soil was too moist to completely incorporate the RY. Creamer and Dabney's (2002) review of mechanical cover crop termination identified Italian ryegrass as a cover crop variety that was difficult to terminate using either a mower or an undercutter implement. (An undercutter is a horizontal blade that severs cover crop roots near the soil surface with minimal soil disturbance, followed by rollers that flatten the intact aboveground biomass on the surface.) While tillage was generally effective at terminating the cover crops in the trials reported in this chapter, at other times flail mowing or tillage for cover crop termination produced higher weed densities and biomass than using an undercutting implement or a sickle bar mower.
5.4.2 Weeds during the pre-crop phase
Relative weed cover and final biomass were considerably higher at Laureldale compared with the responses at Kirby in 2000 and 2001, which were equivalent overall. This outcome is due to the performance of the cover crops, with poor establishment by MU and RA at Laureldale allowing weeds to grow relatively unhindered. A similar outcome from poorly establishment has been reported for a wide range of cover crops such as Italian ryegrass, buckwheat and red clover (Trifolium pratense L.) (Schonbeck et al. 1991, Bugg et al. 1996). At Kirby in both years, the cover crops grew well and good weed suppression was therefore achieved. In the unweeded control treatment (GF), relative weed cover rose to 100% by about 8 WAS. In the BF and cover crop treatments, relative weed cover rarely rose above 20%, and was commonly less than 5% in the BF and RY treatments. Although control of weeds by the cover crops was equivalent to that observed in the BF, the relative weed cover response patterns differed over time. Relative weed cover in the cover crop plots increase in the first 4 to 6 WAS and then remained constant, whereas relative weed cover in the BF plots remained fairly constant up to 8
Chapter 5 Pre-crop and in-crop weed control methods
122
WAS and then began to increase. These contrasting patterns reveal that BF did not provide on-going control of weeds, whilst the cover crops were able to provide good on-going weed control during the pre-crop phase. However, the cover crops were incorporated while the MU was at about 50% flowering, RA at about 10% and RY had not flowered. After full flowering, it is probable that senescence and lodging would reduce cover crop relative cover, providing an opportunity for weeds to become dominant. The BF treatment generally produced lower weed densities, while the cover crops had similar weed densities to each other and the GF. While the linear correlations between cover crops and weeds for relative weed cover and biomass were not high (r2 ≤ 0.76), the regression slopes were significant, indicating that weeds were increasingly suppressed by greater quantities of cover crops, even though the exact relationship may not be clear. Although it is common that weed and cover crop biomass are highly correlated (Teasdale 1996, Akemo et al. 2000), this is not true for all studies (Creamer et al. 1997, Bàrberi and Mazzoncini 2001). Variability in weed density between treatment replicates has been reported (Mohler and Galford 1997), and such variability is likely to reduce the correlations between variables. The physical and chemical effects of cover crops on weeds are known to be specific to the variety of cover crop used and the weed species present (Teasdale 1996, Masiunas 1998). Weeds were treated as a single group in these trials, mainly due to the pre-existing spatial variability of many species, such as localised patches of fat hen and rows of spiny rush (Juncus bufonius L.) along minor drainage lines. Certain dominant weeds may have been more tolerant of the cover crops or had different capacities to access resources (Liebman and Gallandt 1997). For example, amaranth has a tall habit and early emerging seedlings were able to grow quickly and maintain access to light. The suppression of weeds by the cover crops appeared to be due mainly to a reduction in growth of emerged weeds, rather than a reduction in the number of emerged weeds. Relative weed cover and biomass had an inverse relationship with the cover crop variables, particularly for MU and RA. Weed density, however, was poorly correlated with the cover crop variables, although there was a slight reduction in density as cover crop relative cover and biomass increased. Seefeldt (2000) noted that increases in perennial ryegrass (Lolium perenne L.) seeding density did not reduce weed emergence, but weed biomass was decreased. In the United Kingdom, Grundy et al. (1999a) also reported that cover-crops reduced weed biomass but weed emergence was not suppressed. By reducing weed growth, the cover crops also suppress weed seed production (Liebman and Gallandt 1997). The lower weed numbers in the second season at Kirby, especially evident in the GF, were probably due to the lower rainfall and the slightly earlier, and therefore cooler, sowing date (Bond and Baker 1990). The crops did not have a lower yield in the drier year, hence earlier the sowing time may have advantaged the cover crops over the weeds. However, in the New England area, early planting would be limited to frost hardy varieties. The upward trend in weed density for all treatments indicates that emergence continued throughout the pre-crop season in spite of the cover crop, suggesting that allelochemicals were not inhibiting seed germination and physical emergence was not being prevented (e.g. by fibrous crop roots). The same seed bed preparation methods were used for all treatments in this experiment, therefore, the early weed cohorts were subjected to similar treatment effects initially. In addition, apart from the poorly established brassicas at Laureldale, the cover crops took about 5 WAS to achieve 50% relative cover. During that early period, the competitive effects of the cover crops may have been limited spatially and in intensity. Once the cover crops became more fully established, their competitive effects would be expected to have a greater impact on the growth of emerged weeds (Monteith 2000). Although there was a generally uniform increase in weed density (across treatments within trials) from 4 to 8 WAS, the later emerging cohorts would be at a significant competitive disadvantage. Mohler (1996) has suggested that while many annual weeds can grow more rapidly than crops in high resource regimes – conditions commonly found in vegetable
Chapter 5 Pre-crop and in-crop weed control methods
123
production (Stirzaker 1999) – the high resource demands needed to support rapid weed growth can result in greater sensitivity of young weeds to competition. The reduction in light due to the cover crops reported in this chapter was strongly correlated with a decrease in relative weed cover, weakly correlated with a decrease in weed biomass and poorly correlated with weed density. Reduced light has been cited as an important factor in the suppression of weed emergence and growth (Teasdale 1993, Liebman and Gallandt 1997, Ballaré and Casal 2000). When light is reduced under the cover crop canopy, some weed species may respond by elongating stems at the expense of growing leaves; however, with a smaller leaf area, insufficient carbon assimilation may prevent such growth (Cousens et al. 2001, Rajcan and Swanton 2001). Cousens et al. (2001) reported that even short delays in wild radish (R. raphanistrum L.) emergence within a wheat (Triticum aestivum L.) crop decreased growth of the weed considerably and later wild radish cohorts had no detectable effect on wheat biomass. In the MU and RA treatments, the initial small rise in relative weed cover up to 6 WAS, followed by a plateau until cover crop termination at 10 WAS, may be interpreted as a sign of the competitiveness of those cover crops against the existing weeds. The RY treatment showed even greater competitive ability against weeds. Competition for soil nutrients and moisture was not directly investigated in these experiments, although it may have had a role in weed-cover crop interactions (Liebman and Robichaux 1990). Water was unlikely to be limiting at Laureldale and Kirby in 2000 (Figure 4.3A), with about 27 mm/week of rain falling evenly throughout the pre-crop phase. At Kirby in 2001, a similar total rainfall was received compared with the previous year, but the early period of the phase was drier and more than half (125 mm) fell in the 9th WAP. The supplementary irrigation provided after sowing in 2001 was applied across the whole experimental area using an overhead sprinkler, so that was unlikely to have advantaged the cover crops over the weeds. Soil tests taken before the trial began (Table 4.1 in previous chapter) indicated that macronutrients did not appear to be deficient (G. Blair, pers. comm.). Nevertheless, the relative impacts of light, water and nutrients on weed-cover crop interactions cannot be decisively evaluated in this experiment. The continued emergence of weeds in all cover crops up to 8 WAS suggests that allelochemicals were not strongly effective in reducing weed germination and emergence compared with the green fallow. However, it is acknowledged that certain species in the green fallow could have been exerting a phytotoxic effect on other species, so the value of the green fallow as an inert control treatment may be compromised. Several reports by Teasdale co-workers have indicated that light deprivation was more important than allelopathy in controlling weed emergence rates through cover crop residues and mulches (Teasdale 1993, Teasdale and Mohler 2000b). Sutton (1998) also reported that, although allelopathy was a possible mechanism for weed suppression, the presence of weeds under some mulched treatments, but not under shade-cloth, suggests that physical factors were more important. The net effect of competition for the various types of resources (i.e. light, nutrients and water) is an interactive process, and such a process is usually specific to plant species and site characteristics (Goldberg 1990). However, light can be a dominant limiting resource because it is directional and rapidly exhausted within a canopy (Schwinning and Weiner 1998, Bastiaans et al. 2000), and plants cannot positively influence light levels as they can with nutrients and water (Goldberg 1990). Also, in a production situation, water and nutrients are likely to be amply supplied, so growth will be determined by radiation interception (Baumann et al. 2002).
5.4.3 Weeds during the in-crop phase
The pre-crop treatments did not have a significant effect on weeds during the in-crop phase, even early in the lettuce crop when a residual effect may be expected. In addition, the interaction of pre-crop and in-crop treatments was also non-significant for all weed variables measured. Cover crops are commonly reported to reduce weed levels in subsequent crops due to mechanisms such as allelopathy, physical impedance, reduced seed production and niche disruption (Liebman and Ohno
Chapter 5 Pre-crop and in-crop weed control methods
124
1998, Teasdale 1998). Some researchers have found cover crops may have no detectable impact on weeds in following crops, or that the effects may vary considerably by site and weed species (Johnson et al. 1993, Eberlein et al. 1997, Krishnan et al. 1998, Shrestha et al. 2002). For example, no residual effect on weed density was observed for three cover crop varieties grown prior to a corn (Zea mays L.) crop when measured at 3 to 4 WAS (Bàrberi and Mazzoncini 2001). One of the cover crops was rye (Secale cereale L.), a cover crop that has been widely reported to suppress weeds in subsequent crops (Creamer et al. 1996, Blum et al. 1997, Nagabhushana et al. 2001). In a review of the contribution of cover crops to weed management, Teasdale (1996) stated that surface residues from cover crops can be expected to provide early-season weed suppression only (also see Krishnan et al. 1998). Incorporated residues may be less effective due to soil disturbance during tillage promoting a new flush of weeds, the lack of ground cover to prevent light transmission to weed seeds and seedlings, and higher nutrient inputs from decomposing residues. Conversely, when cover crop residues are incorporated, weed suppressing phytotoxins may be more concentrated in the soil and immobilisation may reduce nitrogen availability to weed seedlings. The impact of a cover crop on weeds in a subsequent crop can be influenced by a range of factors including cover crop biomass production and the level of weed suppression during the cover crop phase, as well as residue management, farming operations (particularly tillage) carried out between crops, and time elapsed between crops (Whitworth 1995, Smeda and Weller 1996, Teasdale 1996). Cover crop biomass production averaged about 5,000 kg/ha (range: 4,330 – 7,165 kg/ha), excluding the brassicas at Laureldale (~1,000 kg/ha). That amount of residue is consistent with rates of biomass production reported elsewhere (Mason-Sedun et al. 1986, Stivers-Young 1998, Creamer and Baldwin 2000). The cover crops provided about a 90% reduction in relative weed cover compared with the unweeded control green fallow. Ryegrass, in particular, consistently had the least weeds during the pre-crop phase. Seed production by weeds in the pre-crop treatments was not measured, although it may be expected that the treatments with more weeds, especially the green fallow, would contribute to higher subsequent weed levels (Cousens and Mortimer 1995). In regard to residue management, options for terminating cover crop residues in an organic farming system include incorporation, undercutting, mowing and natural senescence. The residue from the latter three methods may then be either left on the surface as mulch or incorporated into the soil (Teasdale 1998, Dastgheib et al. 1999, Creamer and Dabney 2002). Several reports have indicated that leaving cover crop residue on the soil surface as a mulch provided better weed suppression than incorporating the cover crops (Dyck and Liebman 1995, Mangan et al. 1995), although phytotoxicity of crop residues was found to increase when residues were incorporated rather than left on the surface (Lovett and Jessop 1982). Dastgheib et al. (1999) found that a pea (Pisum sativum L.) cover crop suppressed weeds more effectively when left as surface mulch, white clover (Trifolium repens L.) and wheat were more effective when incorporated (ploughed or rotary hoed) and perennial ryegrass was equivalent for all residue management treatments. All plots were rotary hoed at 2 WAI and immediately before planting lettuces at 4 WAI. No other farming operations were carried out in the interim period. The tillage operation at 2 WAI may have neutralised any underlying treatment differences that could have been manifested in the level of weeds in the lettuce phase. The interim period occurred in summer when temperatures were warm and rainfall was moderate (>60 mm/month), conditions favourable to weed emergence in recently disturbed soil (Forcella et al. 2000). Rotary hoeing at 2 WAI was intended to prepare the planting bed for the lettuce seedlings, but it may have acted like a false seed bed treatment and reduced the weed seed bank across all treatments. While the reported duration of weed suppressive effects from cover crops varies from several days (Ohno et al. 2000, Petersen et al. 2001, Morra and Kirkegaard 2002) to several weeks (Masiunas et al. 1995, Smeda and Weller 1996), the outcome in particular situations is likely to be related to the plant species involved and the experimental conditions. The plant-back delay (i.e. the time elapsed between terminating the pre-crop treatments and planting the lettuces) may have been too long for the residual effects of the pre-crop treatments to be manifested (Liebman and Davis 2000, Creamer and Dabney 2002). Alternatively, the allelopathic potential of the cover crops may not have been
Chapter 5 Pre-crop and in-crop weed control methods
125
expressed in the soil and climatic conditions prevailing during the experiment (Weidenhamer 1996), or the release of nutrients by the decomposing cover crops could potentially overcome any weed suppression caused by other factors (Wyland et al. 1995, Korsaeth et al. 2002). The effect of varying plant-back delay and the role of phytotoxins are examined in the experiments reported in the following chapters. Generally, there was little or no evidence for significant allelopathic effects by the brassica cover crops. Despite the good weed suppression and biomass production by the cover crops, it is possible that the effects of the pre-crop treatment on weeds in the lettuce phase may have been nullified by a combination of insufficient growing time for the cover crops, incorporating the cover crops (as opposed to cutting and leaving residues on the soil surface), tillage during the interim period, and an overly long plant-back delay period. Moonen and Bàrberi (2002) identify three mechanisms in weed-cover crop interactions: (a) weed suppression in the cover crop, (b) weed suppression of cover crop residues in the following cash crop, and (c) residual effects on weed seedbank size and composition present in subsequent crops. The cover crops used in this experiment demonstrated the first mechanism, but failed to demonstrate the second mechanism. The third mechanism was not tested. Like cover crops, no reduction in weed density or growth was observed for the bare fallow treatment compared with the untilled green fallow. The benefits of bare fallowing for reducing the impact of weeds on subsequent crops cited by several authors (Mortimer et al. 1997, Johnson and Mullinix 1998, Merfield 2002) are not always observed. Caldwell and Mohler (2001) used several tillage implements, including a rotary hoe, to evaluate the false seedbed method of weed control, but found that subsequent weed density and biomass was not reduced compared with an untilled control (see also Herrero et al. 2001). However, it is possible that a reduction in the weed seed bank may provide longer-term benefits that cannot be detected over a single cropping season (Jones and Medd 1997, Rasmussen 1999). Pre-crop weed control methods require longer time periods or repeated implementations to deplete the seedbank significantly. The weed seed bank was not assessed, although it is anticipated that the treatments used in these trials could have different effects on weed seed decline that may be manifested in subsequent seasons. The cover crops may have altered the weed seed bank by modifying various factors including seed predator habitat (Buhler et al. 1998), allelochemical concentrations (Acharya et al. 2002), and factors influencing dormancy such as soil temperature and hydrology (Benech-Arnold et al. 2000). Tillage in the BF treatment potentially depleted the weed seed bank to some extent, altered weed seed distribution in the soil and modified physical characteristics of the soil (Mohler and Galford 1997, Bàrberi and Lo Cascio 2001, Cardina et al. 2002). The initial weed densities for the in-crop weed treatments, tillage and an unweeded control, were equivalent at 2 WAP in all trials. The weed density of the tilled plots then decreased slightly over time (the slope coefficients were all negative, but non-significant), while the control plots generally remained constant, except at Kirby in 2001, where a significant increase occurred. The results for weed density at Kirby closely followed the pattern for rainfall. High weed numbers were recorded during the wetter pre-crop phase in 2000, and weed density did not increase over during the drier lettuce phase in 2000. The weed load was lower in the lettuce phase than the pre-crop phase in all trials. This may be due to the effects of disturbance from the pre-crop phase on subsequent germinable seed levels or to seasonal and environmental differences effects on weed floristics (Grace 2000). However, the lack of seed bank measurements and the short-term nature of the project limit a clear interpretation of the results. Compared with climatic variation between seasons, the effects of some management techniques on weed levels may be less detectable over a period of two seasons or without a more detailed investigation of the population dynamics. The farms used in the trials were operated as grazing enterprises and had only recently been used for horticultural cropping. Weed floristics and numbers would be expected to change considerably in as cropping continues (Sjursen 2001, Ngouajio and McGiffen 2002). A longer-term trial would allow the seasonal effects to be accounted and provide more robust information about particular weeds’ responses to the weeding methods imposed.
Chapter 5 Pre-crop and in-crop weed control methods
126
The tillage treatment generally reduced relative weed cover and biomass compared with the control. Relative weed cover was reduced by between 60 and 83%, while final weed biomass was reduced by 46 to 90%. The extent of the reduction was equivalent to that observed in the previous chapter. Tillage achieved the greatest reduction in relative weed cover when the weed levels were lowest, i.e. at Kirby in 2000. As the weed levels increased, the effectiveness of the tillage treatment was reduced. In a study of corn and soybean (Glycine max Merrill.) cropping systems, Forcella et al. (1993) found that low weed densities (< 40 seedlings/m2) may require no control, moderate densities (< 400 seedlings/m2) can be controlled mechanically, but high densities (> 400 seedlings/m2) will be inadequately controlled by tillage ("non-chemical measures") alone. The influence of trials was highly significant for all weed variables measured. Weed biomass was highest at Laureldale (1,787 kg/ha), followed by Kirby in 2001 (1,286 kg/ha), while Kirby in 2000 had the lowest weed biomass (770 kg/ha). A discussion of the inter-trial variation in weed responses is given section 4.4.1 of the previous chapter.
5.4.4 Lettuce growth
The pre-crop fallows and cover crops had very little effect on lettuce growth and yield in these trials. The only difference noted was a variation in lettuce sizes at 2 WAP, but no differences were detected in the lettuce growth variables at 4 and 7 WAP in response to the pre-crop treatments. The interaction of the pre-crop and in-crop treatments was not significant for all lettuce variables. At 2 WAP, lettuces were smaller in RY at Laureldale (40% smaller compared with the other treatments) and at Kirby in 2001 (25% smaller). However the effect was transient and was not apparent 2 and 5 weeks later. Possible reasons for the lower early lettuce growth following RY include nitrogen immobilisation (Odhiambo and Bomke 2001), inhibition by phytotoxins (Breland 1996), modification of soil biology (Walker and Morey 1999) and changes in the hydrological characteristics of soil (Unger and Vigil 1998). The elevated carbon:nitrogen ratio of Lolium spp. including L. multiflorum (at least 40:1, Churchill et al. 1996, Odhiambo and Bomke 2001), suggests that there was potential for immobilisation of nitrogen. Other studies using an Italian ryegrass cover crop have also found that growth in subsequent crops can be suppressed (Burgos and Talbert 1996, Reddy 2001). The MU and RA brassica cover crops did not inhibit the early growth or final yield of lettuce in these experiments. While lettuce has been used as a test species in many crop residue bioassays (Fischer et al. 1989, Brown and Morra 1995, Duryea et al. 1999, Fujihara and Yoshida 1999), inhibitory effects are less commonly observed in the field. Several reports on the effects of brassica cover crop residues, including some that cite allelopathic suppression of weeds, state that inhibition of cash crop growth was generally not observed or that growth was increased (Kirkegaard et al. 1994, Umbers 1994, Boydston and Hang 1995, Santos and Leskovar 1997, Krishnan et al. 1998). Mason-Sedun and Jessop (1988) indicated that incorporating low volumes of brassica residues in soil showed an increase in test plant growth, possibly due to extra nutrients and/or improved soil structure, and that phytotoxicity can decline quickly, e.g. 20+ days. The warm weather and moderate rainfall during the interim period and tillage at 2 WAI, may have hastened the degradation of potential phytotoxins (Weston 1996). Similar brassica varieties have carbon:nitrogen ratios of about 20:1 at the 50% flowering stage (M. Ryan, pers. comm.), lower than cereals and grasses, therefore the mustard and radish cover crops may not have contributed to nitrogen immobilisation to the same extent as the ryegrass. The in-crop treatments, control and tillage, affected lettuce growth (relative cover, size and biomass) differently in each trial. In-crop treatment differences in lettuce growth and yield were not significant at Laureldale (control was 15% less than tillage), tillage was lower than the control by 17% at Kirby in 2000, but the control was 47% lower than tillage at Kirby in 2001. Similar differences were recorded in the experiment reported in the previous chapter and are discussed in section 4.4.4 above. Growth was poor for all lettuce crops grown at Laureldale, so treatment differences were difficult to identify. At Kirby in 2000, the weed load was low and appears not to
Chapter 5 Pre-crop and in-crop weed control methods
127
have suppressed lettuce growth, while the lower yields in the tilled plots may have been due to soil disturbance and/or root damage by the tines. In the following year at Kirby, the weed load was higher and lettuce yield in the control was about half that observed in 2000, while yield in the tilled plots relatively unchanged from the previous year. From the previous chapter, the distinct differences in echinacea growth between tillage and the control (Figure 4.18) indicate that tillage has the potential to provide greater yields than the control, although that may not be manifested where weed levels, overall crop growth and tillage accuracy are low. Significantly more lettuces bolted in the tillage treatment than the control. The differences are similar to those reported in the previous chapter (Figure 4.15) and the possible causes are discussed in section 4.4.4 and in chapter 7. It is suggested that the microclimatic effects (i.e. greater soil temperature daily maxima and diurnal fluctuations and lower soil moisture) in the bare soil of the tillage treatment induced earlier flowering compared with the vegetated control plots. The influence of trials was highly significant for all lettuce variables measured. Lettuce yield was highest at Kirby in 2000 (19,827 kg/ha), followed by Kirby in 2001 (15,245 kg/ha), while Laureldale had the lowest lettuce yield (11,368 kg/ha). A discussion of the variation in lettuce responses between trials is presented in section 4.4.3 of the previous chapter. The economic evaluation of the pre-crop and in-crop weed control methods indicated that RY was the most expensive treatment due to higher seed costs, followed in descending order by MU, RA and BF. However, as a percentage of the crop’s value, the treatment costs were all small. Compared with the cheaper fallows, the cover crops did not have any benefits for subsequent in-crop weed control and may not be considered to be worthwhile. However, cover cropping is mandatory in organic production, so the costs incurred are generally unavoidable. Two possible options for improving the cost effectiveness of cover crops are reducing the growing costs and/or increasing the weed suppression ability of the cover crop. The sowing rate used for RY was very high (based on the advice of seed merchant) and it is likely that the sowing rate could be reduced without incurring an reduction in weed control. Sowing RY at 15 kg/ha (Carpenter 1985) for example would reduce the treatment cost from $385/ha to $58/ha, below that of the brassica cover crops and similar the cost of the BF. Increasing the weed suppression ability of cover crops requires the selection of appropriate varieties (e.g. early vigour, spreading habit, phytotoxicity) and good agronomic practices. For the in-crop treatments, tillage was more expensive than the unweeded control (similar to Chapter 4), although the treatment cost for tillage was small compared with the crop value. In 2000, when weed loads were lighter, the extra tillage costs did not provide any increase in lettuce production, but in 2001, when weed loads were considerably higher, the extra tillage maintained lettuce yields, while the cost-free control treatment had yields reduced by about 50%. The variable economic performance of these treatments highlights the effect of crop biology (e.g. short season, less weeding needed) and weed seed levels on weed control success. Knowledge about a paddock’s history can be used by farmers in developing weed management strategies over time. For example, money could be saved in the first season after a fallow by growing a quick crop and weeding less frequently or intensively, then going for more intensive weed management in later cropping seasons.
5.5 Conclusions
The brassica cover crops used in these trials were varieties that have been developed for weed and pest suppression in horticultural and other cropping systems. Although they suppressed weeds while they were growing (except in one trial), they did not have any effect on weed or crop growth during the subsequent lettuce phase, and no interaction with the in-crop treatments was observed. Ryegrass was grown as a contrasting cover crop to compare with the brassica species. Consistent weed suppression was achieved in the pre-crop phase in all trials and was generally greater than that achieved by the brassicas. Ryegrass also had no effect on weed or crop growth in the lettuce
Chapter 5 Pre-crop and in-crop weed control methods
128
phase. Nevertheless, cover crops are used by organic growers for several reasons (e.g. soil fertility, disease breaks), are required under the Australian organic standards (AQIS 2002) and are therefore not only a weed management tool. The cover crops reduced weed levels by suppressing growth (relative cover and biomass) rather than emergence. The suppression was correlated with the reduction in light reaching the soil surface. While allelopathy and competition for nutrients and water were not directly measured, indirect observations suggested that these factors were not dominant in suppressing weed growth, a conclusion supported by other published research on the dominance of light in similar resource competition interactions. The two brassicas tested should be sown at the commercially recommended rate, or greater, into well prepared seed beds with a fine, compacted tilth and irrigated well in order to produce a cover crop that generates sufficient biomass to suppress weeds. The lack of carry-over effects suggests that the cover crops did not have an allelopathic on the weeds or lettuce growing in the in-crop period. The bare fallow treatment provided effective weed control during the pre-crop phase, although it too had no apparent effect on weed and crop growth in the lettuce phase. The bare fallow reduced weed density more than the cover crops and this may have longer-term benefits for weed seed bank decline. Although residual effects on weeds in the lettuce phase by the pre-crop treatments were not detected in these trials, it may have been worthwhile measuring the weed seed bank. Variations in weed seed bank levels may have given a different indication of the effects of the pre-crop treatments, particularly if the trial was carried out over a longer term. The in-crop treatments yielded similar results to those in the previous chapter, with tillage reducing weed levels more than the control. The experiments reported in this chapter evaluated the effects of brassica cover crops in comparison with other pre-crop and in-crop weed control treatments. The next chapter describes a series of field and glasshouse trials that investigated the performance of the brassica cover crops in more detail.
129
Chapter 6 Brassica cover crops – field and glasshouse trials
6.1 Introduction
Several management factors are important in growing cover crops, including sowing rate, duration of growth, method of termination, residue handling and plant-back delay (i.e. the period between cover crop incorporation and planting of next crop). The effects of sowing rate and plant-back delay are of particular interest to growers aiming to maximise weed suppression during the cover crop phase, while also minimising any potential crop suppression in the subsequent cash crop phase. The recently developed high-glucosinolate (GSL) brassica varieties have been anecdotally reported to suppress subsequent crop and weed growth in a range of farming systems in eastern Australia including wheat in Tamworth, New South Wales (J. Holland, pers. comm.) and sugar cane in northern Queensland (J. Kirkegaard, pers. comm.). However, these effects do not appear to have been tested nor the results published. While some recommendations exist on sowing rates for the newer cover crop varieties, these recommendations are based on results from trials on conventional farms where agronomic factors such as sowing rate, fertiliser input and weed control are likely to be managed differently compared with organic farms (Clark et al. 1998, Mäder et al. 2002) and where weed flora would be expected to be different to an organic farm (Bàrberi et al. 1998a, Hald 1999). The optimum timing of plant-back delay for the new brassica cover crop varieties is uncertain and is likely to depend on factors such as environmental conditions, farming system and plant species, i.e. cover crops, weeds and cash crops. In general, a high density of cover crop plants with abundant biomass production is desirable for effective weed suppression (Nelson et al. 1991, Sustainable Agriculture Network 1998), although excessively high sowing rates may lead to spindly growth, greater disease incidence and/or lodging in some cover crop varieties (K. Light, pers. comm., Leach et al. 1999). The literature on brassica cover crops contains widely differing suggested sowing rates. Rates from about 6 kg/ha (Krishnan et al. 1998) to 100 kg/ha (Gubbels and Kenaschuk 1989), and even 896 kg/ha (Vera et al. 1987) have been used in field trials for mustard and radish, depending on variety, although the most commonly recommended range is about 10 – 30 kg/ha (Gardner and Morgan 1993, Hafez et al. 1995, Stivers-Young 1998, Light 1999). The lack of residual effects by the cover crops in the previous chapter was in contrast to some reports in the research literature of significant weed and/or crop suppression following a brassica cover crop (Boydston and Hang 1995, Al-Khatib et al. 1997, Krishnan et al. 1998). It is possible that the 4 week delay between cover crop incorporation and lettuce planting was too long for suppressive effects to be observed. Therefore, the plant-back delay treatments were included in the trials reported in this chapter to determine if the Indian mustard and fodder radish cover crops would suppress weeds or crops when a subsequent lettuce crop was planted immediately after incorporation of the cover crops. Various recommendations have been suggested for plant-back delay, ranging from 2 to 6 weeks (DPIWE 1996, Long 2000). Published field experiments using brassica cover crops have used plant-back delays from no delay, i.e. next crop planted within a day or two of incorporating a cover crop (Vera et al. 1987, Krishnan et al. 1998), up to about 6 weeks delay (Boydston and Hang 1995). In glasshouse trials where brassica residues have been incorporated into soils and a crop or weeds grown, there is usually no delay between incorporation and sowing or planting (Boydston and Hang 1995, Al-Khatib et al. 1997, Krishnan et al. 1998), although fresh residues are not always used (Mason-Sedun et al. 1986, Mason-Sedun and Jessop 1988). Numerous researchers have highlighted the limitations of using bioassays in controlled environments to evaluate the allelopathic effects of crop residues, extracts or synthetic compounds, with considerable attention placed on separating allelopathy and resource competition (Harper 1977, Willis 1985, Williamson 1990, Inderjit et al. 2001). In order to address these issues, two
Chapter 6 Brassica cover crops – field and glasshouse trials
130
additional factors were used in the glasshouse experiment reported in this chapter. They were fertilisation level and cover crop residue removal. The first group of experiments reported in this chapter was a series of field trials designed to assess the effect of (a) brassica cover crop sowing rate on weed suppression during the pre-crop phase and in a subsequent vegetable crop, and (b) the timing of plant-back of a vegetable crop after incorporating the cover crop. The second group of experiments was a series of glasshouse trials that tested cover crop sowing rate and timing of plant-back in a controlled environment. The glasshouse trials were designed to determine (a) the effect of sowing rate on cover crop biomass production and subsequent lettuce emergence and growth, (b) if fertiliser affected cover crop and subsequent lettuce growth, (c) if sowing lettuce immediately after cover crop incorporation was inhibitory to crop emergence and growth, and (d) if removing cover crop residue prior to sowing lettuce modifies the level of inhibition.
6.2 Methods
6.2.1 Experiment One: Cover crop sowing rate and plant-back delay in the field
Field site descriptions
Details concerning the geographic location, recent land use history, soil types and climate during the research period are provided in the previous chapter. For each season, cumulative rainfall and degree day estimates were calculated using the methods outlined in Chapter 4. A summary of the cumulative rainfall and accumulated degree days during the pre-crop phase (i.e. fallows and cover crops) for experiment one is given in Figure 6.1. This figure also shows the cumulative rainfall plus 30 mm supplementary irrigation applied in 2001 to assist the germination of the cover crops. During the pre-crop phase, the cumulative rainfall was significantly greater in 2000 than the natural rainfall in 2001 (P = 0.006) and the natural rainfall plus irrigation (P = 0.019). There was no significant difference in accumulated degree days observed between the seasons (P = 0.997). A B
0
50
100
150
200
250
0 2 4 6 8 10W eeks after sowing cover crops
Cum
ulat
ive
rain
fall
(m
m)
200020012001 + irrigation
0
100
200
300
400
500
600
700
0 2 4 6 8 10W eeks after sowing cover crops
Deg
ree
days
(°C
d)
20002001
Figure 6.1 Cumulative rainfall (mm, graph A) and accumulated degree days (°Cd, graph B) during the pre-crop phase at Laureldale and Kirby in 1999 – 2000 ( ) and at Kirby in 2000 – 2001 ( ). The dashed line in graph A shows the cumulative rainfall plus 30 mm supplementary irrigation in 2001. Cumulative rainfall and accumulated degree days for the in-crop phase (i.e. lettuce) is presented in Figure 6.2. During this phase, the cumulative rainfall was similar up to about 3 WAP. In 2001, approximately 146 mm of rainfall was received in the 4th WAP of the delayed plant-back treatment, and the 8 WAP in the no delay plant-back treatment in 2001. The delayed treatment in 2001 was significantly higher than the other trials (P ≤ 0.045), and the other two trials had similar
Chapter 6 Brassica cover crops – field and glasshouse trials
131
rainfall overall (P = 0.309). The differences in accumulated degree days were not significant (P ≤ 0.926), although the period of the “no delay” treatment was slightly warmer in the period after lettuce harvest. A B
0
50
100
150
200
250
0 2 4 6 8 10W eeks after planting lettuce
Cum
ulat
ive
rain
fall
(m
m)
200020012001 (nodelay)
0
200
400
600
800
1000
1200
0 2 4 6 8 10W eeks after planting lettuce
Deg
ree
days
(°C
d)
200020012001 (no delay)
Figure 6.2 Cumulative rainfall (mm) and accumulated degree days (°Cd) during in-crop phase at Laureldale and Kirby in 1999 – 2000 ( ), at Kirby in 2000 – 2001 ( ) and at Kirby in 2000 – 2001 for the "no delay" treatment in experiment one ( ). The closed symbols ( , , ) represent measurements taken up to harvest time, while the open symbols ( , , ) represent measurements after the lettuce was harvested, but while bolting was still being recorded for the remaining plants. Preparation, maintenance and assessment of the field plots
Details about methods used in land preparation, plant species and materials used, sowing, management and incorporation of the cover crops, planting and management of the lettuces, and assessments used are given in the previous chapter. A completely randomised design was used, with three replicates for each treatment randomly allocated to the field plots. Three replicates were used rather than four due to the larger number of sowing rate treatments used. In the first season (1999 – 2000), the pre-crop treatments were established on 28/9/99 and all plots were ploughed in on 8/12/99, and the lettuce seedlings were planted on 7/1/00 and harvested on 26/2/00. In the second season (2000 – 2001), the pre-crop treatments began on 19/9/00 and were ploughed in on 6/12/00, whilst the lettuce seedlings were either planted on 8/12/00 and harvested on 24/1/01 (i.e. no delay treatment), or planted on 8/1/01 and harvested on 28/2/01 (i.e. delayed treatment). Treatments applied
The first treatment factor, cover crop type, consisted of the two brassica cover crops, Indian mustard (MU) and fodder radish (RA) as used in the previous chapter. The second treatment factor, sowing rate, consisted of sowing the cover crops at 0, 12.5, 25, 50, 100 or 200% of the recommended sowing rate at Laureldale and Kirby in 2000 and at 0, 50 or 100% rates at Kirby in 2001. The lower rates were used in order to evaluate the lower limits of possible sowing rates in regard to weed control. The sowing rates recommended by the seed suppliers were 10 kg/ha (~375 seeds/m2) for mustard (MU) and 20 kg/ha (~186 seeds/m2) for radish (RA). The actual rates used were 0, 1.25, 2.5, 5, 10 and 20 kg/ha for mustard (MU) and 0, 2.5, 5, 10, 20 and 40 kg/ha for radish (RA) in 2000, and 0, 5 and 10 kg/ha for MU and 0, 10 and 20 kg/ha for RA in 2001. The third treatment factor, plant-back delay (Figure 6.3), was used at Kirby in 2001 and consisted of planting lettuces either (a) shortly after incorporating the cover crops and unweeded control ("no delay" treatment), or (b) 4 weeks after incorporation ("delayed" treatment). In the delayed treatment, the plots were not rotary hoed at 2 WAI as they had been in the previous year. Table 6.1 shows the treatment combinations used in each field trial.
Chapter 6 Brassica cover crops – field and glasshouse trials
132
Figure 6.3 Measuring weed density amongst lettuce seedlings planted 4 weeks after cover crop incorporation (“delayed” treatment) at Kirby in 2001. Lettuces in the plot in the foreground were planted 4 weeks earlier (“no delay” treatment). Table 6.1 Cover crop sowing rates for mustard and radish, and plant-back delay (period between cover crop incorporation and planting following crop) treatments used in experiment one.
Cover crop type and sowing rate (% of recommended rate) Mustard Radish
6.2.2 Experiment Two: Cover crops in the glasshouse
A pair of experiments was conducted under controlled environment conditions in 1999 – 2000 and 2000 – 2001 to assess the effect of (a) cover crop sowing rate and (b) plant-back delay. The glasshouse facility was located at the main campus of the UNE, Armidale. The glasshouse daily maximum temperature was maintained at 25 ± 3°C and the minimum temperature was maintained at 15 ± 3°C during the experiments. In both trials, a completely randomised design with 4 replicates was used. Randomisation of the pot layout was achieved using the method described in previous chapters. The first year’s trials will be referred to as 2000, and the second year’s trials as 2001, corresponding with the year in which the trials were completed. Treatments
In 2000, two experimental factors were tested: sowing rate and plant-back delay. The cover crops were sown at the rates of 1, 2, 4, 8, 12 and 16 plants/pot, and a control treatment was also used (0 plants/pot). The plant-back delay treatments consisted of either sowing lettuce seeds on the same day that the cover crop phase was terminated ("no delay") or about 2 weeks after termination ("delayed").
Chapter 6 Brassica cover crops – field and glasshouse trials
133
In 2001, only one sowing rate was used (i.e. 4 plants/pot) for each cover crop, and a control treatment with 0 plants/pot was included. The delayed plant-back treatment was changed to 4 weeks for consistency with the delay period used in the field trials. Two additional factors were also used: * a fertiliser treatment, consisting of fertilising (+FERT) or not fertilising (-FERT) the cover crop,
and * a residue treatment, consisting of incorporating the cover crop residues prior to sowing lettuce
(+RES) or removing the residue and using the unamended potting soil from the cover crop phase (-RES).
Cover crop phase
The MU and RA cover crops used in the field trials above were used in the glasshouse experiments (Figure 6.4). In 2000, the cover crops were sown on 15/10/99 and incorporated on 9/12/99, while in 2001, the cover crops were sown on 17/10/00 and incorporated on 12/12/00. The cover crops were sown in black plastic pots (200 mm diameter × 200 mm high) at double the required sowing rate and thinned at 5 days after sowing. The potting medium was a sandy loam collected from the paddock at Kirby Research Station near where the field trials where conducted.
Figure 6.4 Layout of cover crop glasshouse trial, 12/11/99. Indian mustard and fodder radish were sown at 0, 1, 2, 4, 8, 12 and 16 plants/pot in 200 mm diameter pots. Each pot in the +FERT treatment was fertilised with 0.45 g of gypsum (~0.06 g SO4) prior to sowing cover crops, and with 400 ml of a general liquid fertiliser (Maxicrop®, 4.6% nitrogen, 1.2% phosphorus, 3.1% potassium) diluted to 3 ml/L at 1, 2 and 3 WAS. Pots in the -FERT treatment received no fertiliser. Any emerged weeds were removed by hand at regular inspections every three days. All pots were placed on 240 mm diameter plastic saucers and irrigated by filling the saucers with tap water every 3 days, except when the saucer was already wet, e.g. in the control treatment. At 8 WAS, the cover crop phase was terminated. The plants and soil in each pot were removed, and the plants coarsely chopped and incorporated thoroughly and evenly in the soil. The amended soil was placed into two 140 mm diameter black plastic pots for use in the lettuce phase. Lettuce phase
The test plant used to evaluate the effects of the treatments in the cover crop phase was lettuce cv. Imperial Triumph, the same variety used in the field trials reported in this and the previous chapter.
Chapter 6 Brassica cover crops – field and glasshouse trials
134
Using the 140 mm diameter pots with soil (amended and not amended) from the cover crop phase, 20 lettuce seeds were sown at a depth of 5 mm per pot. Seeds were used as an alternative to transplants in order to test the effect of the treatments on lettuce emergence as well as growth. Each pot was fertilised with 400ml of Maxicrop®, diluted to 3 ml/L at 1 and 3 WAS, and the plants were irrigated every 3 days, as for the cover crops. The lettuces were grown for 5 weeks, and were weeded regularly during that time. In 2000, the lettuces were either sown on 9/12/99 and harvested on 13/1/00 ("no delay" treatment) or sown on 23/12/99 and harvested on 27/1/00 (2 week "delayed" treatment). In 2001, the lettuces were either sown on 12/12/00 and harvested on 16/1/01 ("no delay" treatment) or sown on 9/1/01 and harvested on 13/2/01 (4 week "delayed" treatment). Assessment
The cover crops were assessed by measuring height (from soil surface to tip of tallest shoot) and fresh weight biomass of whole plants at 8 WAS the cover crops. The final biomass was determined by carefully removing excess soil from around the plants, washing the plants to remove all soil and residues, and weighing. Dry weights were not recorded as the cover crops were incorporated back into the soil for growing the lettuces. Lettuces were assessed at 5 WAS by counting the number of live plants and measuring height (from base of plant to tip of longest leaf) and dry weight biomass. The biomass was determined by carefully removing the plants, washing the plants, oven drying for 48 hours at 80°C and weighing.
6.2.3 Statistical analysis
Statistical analyses of the data were carried out using the procedures detailed in Chapter 4. In most cases, GLMs were used for variables measured at a single time point and GLMMs were used to test the effects of treatments on variables that were measured several times during the course of the trials. Contrast analysis was used to separate the means where significant effects were detected. The non-linear least squares regression function in S-Plus 2000® was used to fit data to several response curves (MathSoft 1999a). The suitability of the models was assessed by inspecting the plot of residuals versus fitted values. When the residual variance was not homogeneous, the generalized non-linear least squares regression function was used, with a power or exponential variance function being included in the model to account for the non-normal distribution of the data (MathSoft 1999c). The variability of the data was presented in graphs by using confidence limits with a probability level of 95%. Cover crop and relative weed cover were modelled using the logistic function
)exp(1 WASmaRC
−+= Equation 6.1
where RC is the relative cover (%), WAS is the time variable, a is the asymptote of maximum relative cover, and m is the inflexion point of the curve (i.e. the time at which RC is 50% of the asymptote). In experiment one, the effect of cover crop sowing rate on cover crop relative cover was modelled using non-linear least squares regression. In particular, the rectangular hyperbolic Michaelis-Menten equation (Thornley and Johnson 1990, MathSoft 1999a)
RatemRateaRC
+=
* Equation 6.2
was used, where Rate is the sowing rate of the cover crop (% of recommended sowing rate), a is the upper asymptote and m is the Rate at which RC is 50% of the asymptote. An inverted form of Equation 6.2 was used to describe the effects of cover crop sowing rate on relative weed cover,
Chapter 6 Brassica cover crops – field and glasshouse trials
135
RatemRateaRC
+−
−=*)100(100 Equation 6.3
where a becomes the lower asymptote. Light transmittance in response to cover crop sowing rate for the six trial × cover crop type combinations (three trials with two cover crops each) was also modelled using the inverted rectangular hyperbolic function (Equation 6.3). Preliminary tests indicated that the alternative functions (exponential decay function [Equation 5.3] and sigmoidal function [Equation 5.4]) were less suitable compared with the hyperbolic function. The latter had significantly lower residuals sums of squares for all but one treatment. The anomalous response, MU at Kirby in 2000, fitted Equations 6.3 and 5.3 similarly well (P = 0.214), but Equation 5.4 provided a less adequate fit (P < 0.001).
6.3 Results
6.3.1 Experiment One: Cover crop sowing rate and plant-back delay in the field
A visual evaluation of the weed and cover crop data suggested a possible spatial trend across the plots that was probably not related to the treatments. Therefore, GLMMs were used to analyse all data in this experiment, with the effects of the field plot columns and rows included as random terms in the analysis (Butler et al. 2000). Cover crops
The density of the cover crops immediately before incorporation in each of the trials is presented in Figure 6.5. A test of the treatment effects using GLMMs indicated that density varied by trial, sowing rate and cover crop type, as well as all interaction terms (P ≤ 0.003), except the rate × type interaction (P = 0.807). The correlation between cover crop sowing rate and final density was high for all trial × cover crop type combinations (r2 ≥ 0.81). The MU cover crop had higher densities than RA, and the slope coefficient was lowest for Laureldale and highest for Kirby in 2000 and 2001.
Chapter 6 Brassica cover crops – field and glasshouse trials
136
y = 6.6 + (0.41x)
0
50
100
150
200
250Laureldale 2000
Mustard
y = -2.56 + (0.88x)Kirby 2000
Mustard
y = 1.64 + (0.71x)Kirby 2001
Mustard
y = -1.26 + (0.3x)
0
50
100
150
200
250Laureldale 2000
Radish
0 50 100 150 200
y = -0.57 + (0.48x)Kirby 2000
Radish
0 50 100 150 200
y = -1.76 + (0.43x)Kirby 2001
Radish
0 50 100 150 200
Cover crop sowing rate (% of recommended rate)
Cov
er c
rop
dens
ity (p
lant
s/m
²)
Figure 6.5 Cover crop density (plants/m2) in response to sowing rate (% of recommended rate) for mustard and radish immediately prior to incorporation at Laureldale and Kirby in 2000 and Kirby in 2001. The circles show the data points, the solid lines are the linear regression curves, the dashed lines are the 95% confidence limits, and the equations describe the regression for each treatment combination. The seedling survival of MU and RA from sowing to incorporation at 10 WAS was calculated from final cover crop density as a percentage of the initial sowing rate (Table 6.2). The survival of the cover crop seedlings was lowest at Laureldale, with an average across sowing rates of 15% for MU and 14% for RA. At Kirby, the average survival of both cover crop types was about 22% in 2000 and 20% in 2001. These figures are similar to the survival rates observed in the previous chapter (section 5.3.1), and the various sowing rates had generally equivalent seedling survival, except the 25% sowing rate for RA at Laureldale, which had a very low survival rate (5%) compared with the other sowing rates for RA at Laureldale (average = 15.8%). Table 6.2 Percentage seedling survival of mustard and radish seeds sown at Laureldale in 2000 and Kirby in 2000 and 2001. Survival was calculated using the formula, final density/initial sowing rate × 100.
Seedling survival of cover crops (% of seeds sown) Laureldale 2000 Kirby 2000 Kirby 2001
Average survival (%) 15.3 13.6 21.6 24.4 20.2 20.4 * - indicates the sowing rate not used The variation in cover crop relative cover over time was fitted to a logistic regression function (Equation 6.1) and these curves are shown in Figure 6.6 and Figure 6.7 for MU and RA respectively. An analysis using GLMMs indicated that the effects of trials, treatments and their
Chapter 6 Brassica cover crops – field and glasshouse trials
137
interactions were significant (P ≤ 0.042). At Laureldale, the cover crops failed to establish effectively, with an average maximum relative cover of 22% for MU and 18% for RA. The cover crop types were only different from each other at the lowest sowing rate of 12.5% (P = 0.011), where MU relative cover was about twice that of RA. Relative cover did not vary between the sowing rates for either cover crop type at Laureldale (P ≥ 0.334). At Kirby, the MU cover crops had very low relative cover (~20%) at the lower sowing rates (i.e. 12.5 – 50%), but produced substantial cover when sown at the higher rates (100% and 200%) (P > 0.001). In 2001, the sowing rates produced similar relative covers (P < 0.138), averaging 75% coverage overall. The m coefficients were larger in 2001 (m ≈ 6.3 WAS) than in 2000 (m ≈ 4.3 WAS), suggesting that cover crop growth was slower in 2001.
0
20
40
60
80
100
120Rate: 12.5%
Laureldale 2000
y=3.7/(1 + exp(5-x) )Rate: 25%
Laureldale 2000
y=9/(1 + exp(4.6-x) )Rate: 50%
Laureldale 2000
y=24/(1 + exp(4.4-x) )Rate: 100%
Laureldale 2000
y=24.9/(1 + exp(3.8-x) )Rate: 200%
Laureldale 2000
y=16.9/(1 + exp(2.7-x) )
0
20
40
60
80
100
120Rate: 12.5%Kirby 2000
y=11.2/(1 + exp(4-x) )Rate: 25%Kirby 2000
y=26.2/(1 + exp(4.3-x) )Rate: 50%Kirby 2000
y=19/(1 + exp(3.7-x) )Rate: 100%Kirby 2000
y=85.7/(1 + exp(4.7-x) )Rate: 200%Kirby 2000
y=89.3/(1 + exp(4.3-x) )
0
20
40
60
80
100
120
0 2 4 6 8 10
Rate: 12.5%Kirby 2001
0 2 4 6 8 10
Rate: 25%Kirby 2001
0 2 4 6 8 10
Rate: 50%Kirby 2001
y=62/(1 + exp(6.7-x) )
0 2 4 6 8 10
Rate: 100%Kirby 2001
y=79/(1 + exp(5.9-x) )
0 2 4 6 8 10
Rate: 200%Kirby 2001
Weeks after sowing
Cov
er c
rop
rela
tive
cove
r (%
)
Figure 6.6 Variation in cover crop relative cover over time in response to Indian mustard sowing rate at Laureldale and Kirby in 2000 and Kirby in 2001. The circles show the data points, the solid lines are the logistic regression curves, the dashed lines are the 95% confidence limits, and the equations describe the regression for each treatment combination. The 12.5, 25 and 200% sowing rates were not used at Kirby in 2001. The RA cover crops at Kirby in 2000 produced equivalent relative covers across the sowing rates (P = 0.136), averaging about 80% relative cover at 10 WAS. The lighter sowing rates of 12.5% and 25% had lower asymptotes (averaged a coefficient = 57%) than the heavier sowing rates (average a = 90%), indicating that lower rates were less successful in producing adequate ground cover. In 2001 at Kirby, the relative cover of the RA was similar for both sowing rates (P = 0.629), although growth was significantly less than in the previous year (P = 0.006). The RA had higher m coefficients in 2001 (8.5 WAP for the 50% sowing rate and 7.3 WAP for the 100% sowing rate) than in 2000 (range = 3.8 – 5 WAP), indicating that it was slower in developing a canopy in 2001.
Chapter 6 Brassica cover crops – field and glasshouse trials
138
0
20
40
60
80
100
120Rate: 12.5%
Laureldale 2000
y=4.1/(1 + exp(4.6-x) )Rate: 25%
Laureldale 2000
y=5.6/(1 + exp(4.7-x) )Rate: 50%
Laureldale 2000
y=11.1/(1 + exp(4.6-x) )Rate: 100%
Laureldale 2000
y=23.6/(1 + exp(4.6-x) )Rate: 200%
Laureldale 2000
y=18.9/(1 + exp(3.9-x) )
0
20
40
60
80
100
120Rate: 12.5%Kirby 2000
y=44.6/(1 + exp(5-x) )Rate: 25%Kirby 2000
y=68.8/(1 + exp(4.6-x) )Rate: 50%Kirby 2000
y=90.4/(1 + exp(4.4-x) )Rate: 100%Kirby 2000
y=85.9/(1 + exp(3.9-x) )Rate: 200%Kirby 2000
y=93.7/(1 + exp(3.8-x) )
0
20
40
60
80
100
120
0 2 4 6 8 10
Rate: 12.5%Kirby 2001
0 2 4 6 8 10
Rate: 25%Kirby 2001
0 2 4 6 8 10
Rate: 50%Kirby 2001
y=81.5/(1 + exp(8.5-x) )
0 2 4 6 8 10
Rate: 100%Kirby 2001
y=75.6/(1 + exp(7.3-x) )
0 2 4 6 8 10
Rate: 200%Kirby 2001
Weeks after sowing
Cov
er c
rop
rela
tive
cove
r (%
)
Figure 6.7 Variation in cover crop relative cover over time in response to fodder radish sowing rate at Laureldale and Kirby in 2000 and Kirby in 2001. The circles show the data points, the solid lines are the logistic regression curves, the dashed lines are the 95% confidence limits, and the equations describe the regression for each treatment combination. The 12.5, 25 and 200% sowing rates were not used at Kirby in 2001. The effects of trials, sowing rate and cover crop type on the cover crop biomass at incorporation (10 WAS) were tested using GLMMs. All main terms and 2- and 3-way interactions were significant (P ≥ 0.042). The variation in cover crop biomass in response to sowing rates is shown in Figure 6.8. The final biomass was equivalent for the 100 and 200% sowing rates at Laureldale and Kirby in 2000 (P ≥ 0.007). The 50% rate was also similar to the higher rates, though not for MU at Kirby in 2000 and 2001 (P ≥ 0.046). Poor yields were recorded at Laureldale, with high sowing rates producing less than 1,000 kg/ha of biomass for both MU and RA, compared with three to four times that at Kirby in 2000 and 2001 (P < 0.001). At the higher sowing rates (i.e. 100 and 200%), biomass was greater for RA than MU in 2000 (P < 0.001), but this difference was not observed at Kirby in 2001 (P = 0.381). Apart from the results at Laureldale, where growth was very poor overall, the m coefficient (i.e. sowing rate to achieve 50% of upper asymptote biomass) was lower for RA (38.4% and 89.8 % sowing rate in 2000 and 2001 respectively) than MU (103.1% and 795.7%). This indicates that RA increased biomass more quickly than MU. As in the previous chapter, the correlation between weed parameters (density, relative cover and biomass) and cover crop parameters (relative cover and biomass) recorded at the end of the cover crop phase was generally low (r2 ≤ 0.63). However, weed biomass was reasonably well correlated with cover crop relative cover (r2 = 0.64, 0.82 and 0.86 at Laureldale, Kirby 2000 and Kirby 2001 respectively) and moderately so with cover crop biomass (r2 = 0.59, 0.77 and 0.79 at Laureldale, Kirby 2000 and Kirby 2001 respectively).
Chapter 6 Brassica cover crops – field and glasshouse trials
139
y = 538.2 * x / ( 23.3 + x)
0
1000
2000
3000
4000
5000
6000
Laureldale 2000Mustard
y = 4044.8 * x / ( 103.1 + x)Kirby 2000
Mustard
y = 45188.4 * x / ( 795.7 + x)Kirby 2001
Mustard
y = 1487.2 * x / ( 155.3 + x)
0
1000
2000
3000
4000
5000
6000
Laureldale 2000Radish
0 50 100 150 200
y = 5404 * x / ( 38.4 + x)Kirby 2000
Radish
0 50 100 150 200
y = 8370.1 * x / ( 89.8 + x)Kirby 2001
Radish
0 50 100 150 200
Cover crop sowing rate (% of recommended rate)
Cov
er c
rop
biom
ass
(kg/
ha)
Figure 6.8 Effect of cover crop type and sowing rate on cover crop biomass (kg/ha) immediately prior to incorporation at Laureldale and Kirby in 2000 and 2001. The circles show the data points, the solid lines are the rectangular hyperbolic regression curves, the dashed lines are the 95% confidence limits, and the equations describe the regression for each treatment combination. The light transmitted through the cover crops was measured immediately before incorporation in each of the trials and the results fitted with the rectangular hyperbolic function (Figure 6.9). An analysis of the responses using GLMMs indicated that light transmission was significantly different between trials and sowing rates (P < 0.001) but not cover crop type (P = 0.226). All interaction terms were significant (P < 0.001). Averaged across sowing rates, the reduction in light transmittance was lower at Laureldale than at Kirby in 2000 and 2001. The highest reduction in light transmittance was at Kirby in 2001, where light was reduced by about 90% in the high sowing rate for MU and RA. The lowest light reduction was observed at Laureldale, where even the high sowing rates achieved only 25 – 40% decrease in light transmitted. As the sowing rate increased, the amount of light transmitted through the covers crops decreased rapidly in the 0 – 50% sowing rate treatments, especially at Kirby. In general, there was no difference in light transmittance between the 50, 100 and 200% rate, except for the 50% MU treatment at Kirby in 2000, which produced significantly lower values for relative cover (Figure 6.7) and biomass (Figure 6.8) than the other treatments in 2000 and 2001. The correlation between light transmitted and relative weed cover at the end of the cover crop phase was high (r2 = 0.83), but low for light and weed density or weed biomass (r2 ≤ 0.12). The cover crop parameters relative cover and biomass were fairly well correlated with light transmitted (r2 = 0.82 and 0.77 respectively).
Chapter 6 Brassica cover crops – field and glasshouse trials
140
y=100-( (100-44.8)*x/( 51.3 + x) )
0
20
40
60
80
100Laureldale 2000
Mustard
y=100-( (100-3.4)*x/( 62.7 + x) )
Kirby 2000Mustard
y=100-( (100-7.5)*x/( 3 + x) )
Kirby 2001Mustard
y=100-( (100-72.1)*x/( 26.7 + x) )
0
20
40
60
80
100Laureldale 2000
Radish
0 50 100 150 200
y=100-( (100-9.9)*x/( 23.7 + x) )
Kirby 2000Radish
0 50 100 150 200
y=100-( (100-7.7)*x/( 0.7 + x) )
Kirby 2001Radish
0 50 100 150 200
Cover crop sowing rate (% of recommended rate)
Ligh
t tra
nsm
itted
(% o
f inc
iden
t lig
ht)
Figure 6.9 Effect of cover crop type and sowing rate on light transmitted through the cover crops (% of incident light) immediately prior to incorporation at Laureldale and Kirby. The circles show the data points, the solid lines are the rectangular hyperbolic regression curves, the dashed lines are the 95% confidence limits, and the equations describe the regression for each treatment combination. Weeds during the cover crop phase
The growth of weeds during the cover crop phase was measured by recording the relative cover at intervals of 2 weeks. An analysis of the response of weed cover over time using GLMMs indicated that trial, cover crop sowing rate and cover crop type all had significant effects, as did the 2- and 3-way interactions (P < 0.001). The increase in relative weed cover for each treatment combination was fitted to a logistic regression (Equation 6.1) and the curves are presented in Figure 6.10 and Figure 6.11 for MU and RA respectively.
Chapter 6 Brassica cover crops – field and glasshouse trials
141
0
20
40
60
80
100
1200
Laureldale 2000
y=96.6/(1 + exp(5-x) )12.5
Laureldale 2000
y=97.6/(1 + exp(5-x) )25
Laureldale 2000
y=92.3/(1 + exp(4.9-x) )50
Laureldale 2000
y=74.9/(1 + exp(5.1-x) )100
Laureldale 2000
y=74.2/(1 + exp(5-x) )200
Laureldale 2000
y=86.4/(1 + exp(5.1-x) )
0
20
40
60
80
100
1200
Kirby 2000
y=105.1/(1 + exp(5.1-x) )12.5
Kirby 2000
y=95.4/(1 + exp(5.2-x) )25
Kirby 2000
y=78/(1 + exp(5.3-x) )50
Kirby 2000
y=86.2/(1 + exp(5.1-x) )100
Kirby 2000
y=38.3/(1 + exp(8.9-x) )200
Kirby 2000
y=24.2/(1 + exp(8.3-x) )
0
20
40
60
80
100
120
0 2 4 6 8 10
0Kirby 2001
y=85.1/(1 + exp(7.5-x) )
0 2 4 6 8 10
12.5Kirby 2001
0 2 4 6 8 10
25Kirby 2001
0 2 4 6 8 10
50Kirby 2001
y=34.5/(1 + exp(7.4-x) )
0 2 4 6 8 10
100Kirby 2001
y=12/(1 + exp(4.8-x) )
0 2 4 6 8 10
200Kirby 2001
Weeks after sowing
Rel
ativ
e w
eed
cove
r (%
)
Figure 6.10 Variation in relative weed cover over time in response to Indian mustard (MU) sowing rates at Laureldale and Kirby in 2000 and Kirby in 2001. The circles show the data points, the solid lines are the logistic regression curves, the dashed lines are the 95% confidence limits, and the equations describe the regression for each treatment combination. The 12.5, 25 and 200% sowing rates were not used at Kirby in 2001. At Laureldale, the cover crops only weakly suppressed weed growth compared with the control (0% sowing rate) for both mustard (MU) and radish (RA). The asymptotes of the treatments other than the unweeded control were about 20% less than the control, a difference that was significant for all sowing rates of MU and the 100 and 200% sowing rates of RA (P ≤ 0.037), but not the 50% RA treatment (P = 0.229). The performance of the two cover crop types was similar across the range of sowing rates used.
Chapter 6 Brassica cover crops – field and glasshouse trials
142
0
20
40
60
80
100
1200
Laureldale 2000
y=100.9/(1 + exp(5.1-x) )12.5
Laureldale 2000
y=95.3/(1 + exp(5.1-x) )25
Laureldale 2000
y=91.6/(1 + exp(5.3-x) )50
Laureldale 2000
y=88.2/(1 + exp(5-x) )100
Laureldale 2000
y=74.1/(1 + exp(4.7-x) )200
Laureldale 2000
y=77.7/(1 + exp(4.6-x) )
0
20
40
60
80
100
1200
Kirby 2000
y=100.9/(1 + exp(5.1-x) )12.5
Kirby 2000
y=61.2/(1 + exp(5-x) )25
Kirby 2000
y=73.4/(1 + exp(8.9-x) )50
Kirby 2000
y=40.5/(1 + exp(9.7-x) )100
Kirby 2000
y=25.6/(1 + exp(7.8-x) )200
Kirby 2000
y=8.2/(1 + exp(4.4-x) )
0
20
40
60
80
100
120
0 2 4 6 8 10
0Kirby 2001
y=94.4/(1 + exp(7.9-x) )
0 2 4 6 8 10
12.5Kirby 2001
0 2 4 6 8 10
25Kirby 2001
0 2 4 6 8 10
50Kirby 2001
y=24.7/(1 + exp(6.1-x) )
0 2 4 6 8 10
100Kirby 2001
y=18.9/(1 + exp(5.7-x) )
0 2 4 6 8 10
200Kirby 2001
Weeks after sowing
Rel
ativ
e w
eed
cove
r (%
)
Figure 6.11 Variation in relative weed cover over time in response to fodder radish (RA) sowing rates at Laureldale and Kirby in 2000 and Kirby in 2001. The circles show the data points, the solid lines are the logistic regression curves, the dashed lines are the 95% confidence limits, and the equations describe the regression for each treatment combination. The 12.5, 25 and 200% sowing rates were not used at Kirby in 2001. The MU and RA treatments were significantly different at Kirby in 2000 (P < 0.001), with very low weed suppression by MU at 50% sowing rate compared with RA, similar effectiveness at 100% sowing rate and slightly lower suppression by MU at the 200% rate. The effect of sowing rates and their interaction with cover crop types were also significant (P < 0.001). The decline in relative weed cover in response to increasing sowing rates was approximately linear for MU and hyperbolic for RA. The RA treatments reduced relative weed cover by 59, 74 and 95% at the sowing rates of 50%, 100% and 200% respectively, while MU reduced weed cover by 19, 63 and 77% at the 50, 100 and 200% sowing rates respectively. In 2001 at Kirby, sowing rate, cover crop type and the interaction of rate and type were significant (P ≤ 0.003). At the 50% sowing rate, RA suppressed weeds more effectively than MU (74 and 59% respectively, compared with the controls), while at the 100% rate, RA was less effective than MU (80 and 86% respectively). The effect of cover crop type and sowing rate on weed density and biomass at cover crop incorporation is shown in Figure 6.12. An analysis of the weed density data using GLMMs indicated that there were no differences between MU and RA (P = 0.901) or between sowing rates (P = 0.308). Weed density did not decrease with increasing cover crop sowing rate (Pslope ≥ 0.660), except for MU at Kirby in 2000 (Pslope = 0.001). Weed biomass decreased linearly with increasing sowing rate (Pslope ≤ 0.022), except for MU at Laureldale where biomass remained constant across the range of sowing rates (Pslope ≥ 0.591). However, there was no difference in weed biomass between the 100% and 200% sowing rate (P = 0.947). Compared with the control treatment (0% sowing rate), a 64% decrease in weed biomass occurred for RA at Laureldale, 85% at Kirby in 2000 and 57% at Kirby in 2001. The MU treatment reduced weed biomass by 70 and 60% at Kirby in 2000 and 2001 respectively. The differences between cover crop types were significant (P = 0.028).
Chapter 6 Brassica cover crops – field and glasshouse trials
143
A
y = 1438 + (0.4x)0
500
1000
1500
2000
2500
3000Laureldale 2000
Mustard
y = 2441 + (-4.6x)
Kirby 2000Mustard
y = 1010 + (-1.8x)
Kirby 2001Mustard
y = 1546 + (-2.2x)0
500
1000
1500
2000
2500
3000Laureldale 2000
Radish
0 50 100 150 200
y = 1971 + (-3.4x)
Kirby 2000Radish
0 50 100 150 200
y = 1039 + (-1.3x)
Kirby 2001Radish
0 50 100 150 200
Cover crop sowing rate (% of recommended rate)
Wee
d de
nsity
(wee
ds/m
²)
B
y = 964 + (-0.9x)
0
500
1000
1500
2000
2500
Laureldale 2000Mustard
y = 783 + (-3.1x)Kirby 2000
Mustard
y = 2503 + (-15.3x)Kirby 2001
Mustard
y = 985 + (-3.4x)
0
500
1000
1500
2000
2500
Laureldale 2000Radish
0 50 100 150 200
y = 618 + (-2.9x)Kirby 2000
Radish
0 50 100 150 200
y = 2233 + (-13.1x)Kirby 2001
Radish
0 50 100 150 200
Cover crop sowing rate (% of recommended rate)
Wee
d bi
omas
s (k
g/ha
)
Figure 6.12 Effect of cover crop type and sowing rate on (A) weed density (weeds/m2) and (B) biomass (kg/ha) for mustard and radish immediately prior to incorporation at Laureldale and Kirby. The circles show the data points, the solid lines are the linear regression curves, the dashed lines are the 95% confidence limits, and the equations describe the regression for each treatment combination.
Chapter 6 Brassica cover crops – field and glasshouse trials
144
Weeds and crop growth during the lettuce phase
Sowing rate and cover crop type
The effect of trials, sowing rate and cover crop type on the weed parameters density, relative cover and biomass was analysed using GLMMs. The plant-back delay treatments were only used at Kirby in 2001, therefore, the no delay treatments were not included in this analysis but were analysed separately in the next section. The variation between trials was highly significant for all parameters tested (P < 0.001), but the cover crop rate and type had no significant effects on weeds (P ≥ 0.245) and the interaction terms were also not significant (P ≥ 0.087). Relative weed cover was lower at Kirby in 2000 than in the other two trials, with weed density and biomass showing a similar pattern. Average relative weed cover in each trial was 13.8, 2.6 and 22.5% at Laureldale, Kirby in 2000 and Kirby in 2001 respectively. The slope coefficients for the linear regression of relative weed cover and sowing rate were all non-significant (Pslope ≥ 0.072), confirming that there was no difference in weed suppression during the lettuce phase between the control (0% sowing rate) and the cover crops. The lettuce variables height, diameter, relative cover, bolting, yield, GCV and ACV were analysed using GLMMs. The yield of lettuce in response to the sowing rate for MU and RA in each trial is shown in Figure 6.13. Cover crop sowing rate and type did not significantly affect the variables (P ≥ 0.078) and the interaction terms were non-significant (P ≥ 0.240). The slopes of the linear regressions of lettuce yield and cover crop sowing rate were also non-significant (Pslope ≥ 0.387). However, all lettuce variables differed significantly between trials (P ≤ 0.001), with average yields of 14.1, 18.6 and 16.1 tonnes/ha respectively at Laureldale, Kirby in 2000 and Kirby in 2001. The responses of the other lettuce variables followed a similar pattern to that of yield.
y = 14.1 + (0x)
0
5
10
15
20
25
30Mustard
Laureldale 2000
y = 14.8 + (-0.01x)Radish
Laureldale 2000
y = 17.3 + (0.01x)
0
5
10
15
20
25
30Mustard
Kirby 2000
y = 18.9 + (0.01x)Radish
Kirby 2000
y = 17.1 + (-0.04x)
0
5
10
15
20
25
30Mustard
Kirby 2001
0 50 100 150 200
y = 19.3 + (-0.04x)Radish
Kirby 2001
0 50 100 150 200
Cover crop sowing rate (% of recommended rate)
Lettu
ce y
ield
(ton
nes/
ha)
Figure 6.13 Effect of cover crop type and sowing rate on lettuce yield (tonnes/ha) at Laureldale and Kirby in 2000 and 2001. The circles show the data points, the solid lines are the linear regression curves, the dashed lines are the 95% confidence limits, and the equations describe the regression for each treatment combination.
Chapter 6 Brassica cover crops – field and glasshouse trials
145
Plant-back delay
The plant-back delay treatments were analysed using GLMMs. Sowing rate, cover crop type and interaction terms were included in the model, but their effects were not significant. Weed density and relative cover in the lettuce phase were significantly affected by the delay treatments (P ≤ 0.034). The effect of plant-back delay on weed density and relative cover during the lettuce phase is summarised in Figure 6.14. Weed density was initially higher in the no delay treatment, but did not significantly increase from 2 to 7 WAP (P ≤ 0.492). However, weed density in the delayed treatment continued to increase during the course of the lettuce phase, and was equivalent to the no delay treatment by 7 WAP (P = 0.199). Relative weed cover was slightly higher in the no delay treatment than the delayed treatment through the lettuce phase, but the difference was only significant at 2 WAP (P < 0.001). Weed biomass at the end of the lettuce phase was about 20% less in the delayed treatment than in the no delay treatment (525 and 658 kg/ha respectively), but the difference was not significant (P = 0.137). A B
0
100
200
300
400
500
1 2 3 4 5 6 7 8W eeks after planting
Wee
d de
nsity
(w
eeds
/m2 )
no delaydelayed
0
5
10
15
20
25
30
1 2 3 4 5 6 7 8W eeks after planting
Wee
d re
lativ
e co
ver
(%)
no delaydelayed
Figure 6.14 Effect of plant-back delay on (A) weed density (weeds/m2) and (B) relative cover (%) at Kirby in 2001. The symbols ( = no delay, = delayed) indicate the mean of each treatment in each trial and the error bars show the standard error of the means. The lettuce variables height, diameter and yield were not affected by the plant-back delay treatments at any time point (P ≥ 0.313). Lettuce relative cover at 4 WAP was significantly higher for the delayed plant-back treatment the (P = 0.002), although no differences were observed at 2 and 7 WAP (P = 0.0084 and 0.560 respectively). The response of lettuce relative cover over time is shown in Figure 6.15.
0
5
10
15
20
25
30
35
1 2 3 4 5 6 7 8W eeks after planting
Lett
uce
rela
tive
cove
r (%
)
no delaydelayed
Figure 6.15 Relative crop cover (%) in response to the plant-back delay treatments at Kirby in 2001. The black circles and squares represent the no delay and delayed treatments respectively. The data points show the mean of each treatment in each trial and the error bars show the standard error of the means.
Chapter 6 Brassica cover crops – field and glasshouse trials
146
It is noteworthy that the delayed plant-back treatment received considerably more rainfall, 150 mm of cumulative rainfall up to 4 WAP, compared with 45 mm in the no delay treatment (Figure 5.3). It is possible that the different levels of rainfall after the cover crop phase may have influenced weed and lettuce responses rather than the plant-back delay treatments themselves. An analysis of the effects of rainfall and treatment factors (cover crop type, sowing rate and delay) on relative weed cover using GLMMs confirmed that rainfall itself had a significant effect (P ≤ 0.002), and that delay and the rainfall × delay interaction was also significant (P < 0.001). This result suggests that the effects of the delay treatment and rainfall may be confounded.
6.3.2 Experiment Two: Cover crops in the glasshouse
Cover crop phase
The effect of cover crop sowing rate on final cover crop height or final fresh weight biomass in the glasshouse trials was not significant in 2000 according to an analysis using GLMs (P ≥ 0.218). However, the MU and RA had significantly different heights and fresh weights (P < 0.001, see Figure 6.16). Although MU was about three times taller than RA, MU produced about 35% less fresh weight. Similar trends were observed in 2001 (P ≤ 0.004), with MU being almost double the height of RA (0.52 m ± 0.058 [mean ± standard error] and 0.33 m ± 0.032 respectively), but producing about 60% less fresh weight (27.6 g/pot ± 4.21 and 78.5 ± 8.79). The effect of the fertiliser treatment in 2001 was not significant for cover crop height of fresh weight (P ≥ 0.491). Cover crop height was quite variable for MU, suggesting that it may be a poor measure of growth compared with fresh weight. In contrast, the variability of RA height across sowing rates was small and fresh weight variability was high. Although it is possible that the variability of the observations could have masked possible treatment effects, the lack of effect by sowing rate is considered to be genuine based on the responses by RA height and MU fresh weight.
Chapter 6 Brassica cover crops – field and glasshouse trials
147
A
y = 0.62 + (0.007x)
0.0
0.2
0.4
0.6
0.8
1.0
Mustard
0 2 4 6 8 10 12 14 16
y = 0.23 + (-0.003x)
Radish
0 2 4 6 8 10 12 14 16
Cover crop sowing rate (plants/pot)
Cov
er c
rop
heig
ht (m
)
B
y = 28 + (0.3x)0
10
20
30
40
50
60
70
Mustard
0 2 4 6 8 10 12 14 16
y = 49 + (0.2x)
Radish
0 2 4 6 8 10 12 14 16
Cover crop sowing rate (plants/pot)
Cov
er c
rop
fresh
wei
ght (
g/po
t)
Figure 6.16 Effect of cover crop sowing rate and type on (A) cover crop height (m) and (B) fresh weight (g/pot) in 2000. The circles show the data points, the solid lines are the linear regression curves, the dashed lines are the 95% confidence limits, and the equations describe the regression for each treatment combination. Lettuce phase
The response of lettuce density (number of emerged seedlings), height and dry weight at harvest (i.e. 5 WAS) was analysed using GLMs. The various sowing rates used in 2000 did not significantly affect final lettuce density, height or biomass (P ≥ 0.095), and contrast analyses indicated that the control was not significantly different from the other cover crop sowing rates in either year (P ≥ 0.110). The effect of cover crop sowing rate on lettuce biomass is shown in Figure 6.17, with the no delay and delayed treatments displayed separately to remove the variation due to that factor. Lettuce density and height had similar responses and the linear regression slopes were non-significant (Pslope ≥ 0.075) for all three lettuce parameters and two cover crop types.
Chapter 6 Brassica cover crops – field and glasshouse trials
148
0.0
0.2
0.4
0.6
0.8
1.0
1.2Controlno delay
Mustardno delay
y = 0.38 + (-0.002x)
Radishno delay
y = 0.62 + (-0.009x)
0.0
0.2
0.4
0.6
0.8
1.0
1.2
0 5 10 15
Control2 week delay
0 5 10 15
Mustard2 week delay
y = 0.67 + (-0.007x)
0 5 10 15
Radish2 week delay
y = 0.85 + (-0.01x)
Cover crop sowing rate (plants/pot)
Lettu
ce b
iom
ass
(g/p
ot)
Figure 6.17 Effect of cover crop sowing rate and type on lettuce biomass (g/pot) in 2000. The “no delay” and “2 week delay” treatments are displayed separately to remove the variation due to that factor. The circles show the data points, the solid lines are the linear regression curves, the dashed lines are the 95% confidence limits, and the equations describe the regression for each treatment combination. In 2000, lettuce density, height and biomass (Figure 6.18) were significantly different in response to cover crop type and delay (P ≤ 0.050), but there were no significant interactions (P ≥ 0.147). The trends were similar for each lettuce variable, with (a) higher values for RA than for MU and (b) lower values for the no delay treatment compared with the delayed treatment, except that the control did not vary with delay period. The delayed treatments for MU and RA had similar responses to that of the control, whereas the no delay treatment for MU and RA showed a significant reduction in lettuce density, height and final biomass compared with the control and the delayed MU and RA treatments. Density and biomass in the no delay treatment were reduced by about one third and height was reduced by one fifth compared with the delayed treatment. The linear correlation between lettuce density and biomass for all treatments was not high (r2 = 0.546), but the slope coefficient was significant (Pslope < 0.001).
Chapter 6 Brassica cover crops – field and glasshouse trials
149
A
no delay
2 week delay
Control
no delay
2 week delay
Mustard
no delay
2 week delay
Radish
0 20 40 60 80 100
Lettuce density (%, n = 20)
Pla
nt-b
ack
dela
y
B
no delay
2 week delay
Control
no delay
2 week delay
Mustard
no delay
2 week delay
Radish
0 20 40 60 80 100
Lettuce height (mm)
Plan
t-bac
k de
lay
C
no delay
2 week delay
Control
no delay
2 week delay
Mustard
no delay
2 week delay
Radish
0.0 0.5 1.0 1.5
Lettuce biomass (g/pot)
Plan
t-bac
k de
lay
Figure 6.18 Effect of plant-back delay period and cover crop type on lettuce (A) density (%, n = 20), (B) height (mm) and (C) dry weight biomass (g/pot) in 2000. The black dots show the mean of each treatment averaged across cover crop sowing rates, and the error bars indicate the standard error of the mean.
Chapter 6 Brassica cover crops – field and glasshouse trials
150
The larger error bars in the control treatment compared with MU and RA (Figure 6.18) are due to the different number of observations used in calculating the standard errors (Equation 6.4). The control had four replicates (n = 4), whereas the MU and RA included all six cover crop sowing rates (n = 24). Therefore, the higher number of observations for the MU and RA will tend to reduce the standard error compared with the control.
ndeviation standard error standard = Equation 6.4
The results for 2001 are shown in Figure 6.19. Statistical analysis of the data indicated that cover crop type and delay period did not significantly affect lettuce density, height or biomass (P ≥ 0.734). However, the fertiliser and residue treatments, and the fertiliser × residue interaction were significant for all lettuce variables (P ≤ 0.044). The +FERT treatment had considerably higher averages for the lettuce variables than -FERT, as did the +RES compared with the -RES. In comparison with the control, lettuce height was generally greater for +RES, but lower for -RES. Lettuce biomass was similar for the control and the +RES, but lower in the -RES treatments. The positive effect of +FERT on growth was considerably enhanced for height and biomass by the +RES treatment, but in -FERT, adding residues did not produce a significant change in lettuce height or biomass (P ≥ 0.196). The lettuce density response was different to that of lettuce height and biomass. The +RES treatment reduced density for both fertiliser treatments, and the +FERT treatment increased density, especially in the +RES treatment. The linear correlation between lettuce density and biomass for all treatments was low (r2 = 0.129), but the slope coefficient was significant (Pslope = 0.023).
Chapter 6 Brassica cover crops – field and glasshouse trials
151
A
-FERT
+FERT
-RES
-FERT
+FERT
+RES
0 20 40 60 80
Lettuce density (%, n = 20)
B
-FERT
+FERT
-RES
-FERT
+FERT
+RES
0 20 40 60 80 100
Lettuce height (mm)
C
-FERT
+FERT
-RES
-FERT
+FERT
+RES
0.0 0.2 0.4 0.6 0.8 1.0
Lettuce biomass (g/pot)
Figure 6.19 Effect of fertiliser and cover crop residue treatments on lettuce (A) density (%, n=20), (B) height (mm) and (C) dry weight biomass (g/pot) in 2001. Fertiliser treatments: +FERT = cover crops grown with fertiliser, -FERT = cover crops grown without fertiliser. Residue treatments: +RES = cover crop residue incorporated into soil, -RES = residue not incorporated. The black dots show the mean of each treatment and the error bars indicate the standard error of the mean.
Chapter 6 Brassica cover crops – field and glasshouse trials
152
6.4 Discussion
6.4.1 Experiment One: Cover crop sowing rate and plant-back delay in the field
Cover crops
The correlation between cover crop sowing rate and final cover crop density was consistently high (r2 ≥ 0.81), implying that differences in the sowing rates applied were reflected in the actual plant densities measured in the field. The emergence and survival of cover crop seedlings was lower at Laureldale (about 15%) and higher at Kirby in 2000 and 2001 (about 21%). These findings are consistent with those reported in the previous chapter, where it was suggested that the imperfect seed bed conditions and waterlogging of the poorly drained site at Laureldale may have reduced seed germination and seedling survival. Mustard usually had a higher density in the field than radish because the initial sowing rates of mustard were higher. There were no clear differences between sowing rate and percentage seedling survival, indicating that cover crop germination and emergence was similar across sowing rates that emerged plants continued growing despite probable later intra-specific competition, i.e. seedling mortality was not density-dependent (Harper 1977). The cause of the poor seedling survival of the 25% sowing rate for RA at Laureldale in 2000 is difficult to determine as there were no consistent trends between survival and sowing rate or cover crop type. Inspection of the raw data indicates that the replicates were consistent, i.e. all replicates had very low seedling survival, so it is unlikely that the mean was skewed downwards by an outlying data point (Venables and Ripley 1999). The increase in cover crop relative cover over time varied significantly between trials, cover crop type and sowing rate. As reported in the previous chapter (section 5.4.1), cover crop establishment was poor at Laureldale and relative cover usually did not increase above 30%, whereas cover crop establishment was more effective at Kirby in 2000 and 2001, achieving relative covers of up to 100% at higher sowing rates. The poor growth at Laureldale meant that potential treatment differences were not significant. At Kirby, a number of trends were apparent in the performance of the cover crops. A difference between years was observed, with higher relative covers in 2000, most likely due to the significantly higher rainfall during the first weeks of the trial. Higher sowing rates (≥ 100%) for both cover crop types consistently produced high relative cover levels, however, the lower sowing rates (≤ 50%) produced moderate relative cover for RA, but poor coverage for MU, especially in 2000. The cause of the poor MU growth at lower sowing rates at Kirby in 2000 is uncertain. Those treatments showed similar seedling survival rates to the other treatments, suggesting that germination and emergence was not reduced. The poor subsequent growth cannot be attributed to inadequate water availability as 2000 was the wetter year and the higher MU sowing rate treatments did not show any major limitation in growth. Soil tests indicated that nutrition was generally sound (Table 4.1), although phosphorus and sulfur, the latter being particularly important for brassicas (Haneklaus et al. 1999, Light 1999), were low at Kirby in 2000. The soil tests were taken at the start of each season, prior to fertilising with gypsum and poultry manure pellets, so the nutrient levels in the plots would presumably have been higher than the values shown in the soil tests in a given year (G. Blair, pers. comm.). However, as for water, there appears to be little evidence of growth limitation in the high sowing rate treatments due to poor soil nutrition. It could be expected that the higher plant densities would produce greater intraspecific competition for nutrients in the soil and therefore be more likely to display signs of reduced growth (Miller 1996). The MU cover crop had a tall, narrow growth habit and relatively small leaves, whereas RA produced a basal rosette with larger leaves. The relatively open canopy of MU, especially when
Chapter 6 Brassica cover crops – field and glasshouse trials
153
sown at lower densities, possibly allowed the weeds to achieve an early growth advantage that could not be overcome later. The high level of weed growth recorded in the lower sowing rates of MU (discussed below) is consistent with that scenario, and weed infested cover crops are not uncommon (Schonbeck et al. 1991, Whitten 1999, Miles and Chen 2001). The lower and wider early growth habit of RA, however, ensured that that cover crop performed moderately well at 25%, and even 12.5%, of the recommended sowing rate. Similarly, the ability of the ryegrass cover crop, used in experiments reported in the previous chapter, to quickly develop substantial relative cover confirms the importance of early growth and canopy morphology for effective weed suppression by cover crops (Dingkuhn et al. 1999, Crotser and Witt 2000, Begna et al. 2001). Cover crops with slower early growth and/or narrow, sparse canopy (such as MU) will be more vulnerable to weed competition and will need to be sown at higher densities (Sustainable Agriculture Network 1998). This re-emphasises the conclusion in Chapter 5 (section 5.4.1) that the brassicas used in the trials should be sown heavily. Greater consistency in performance may also be achieved by selecting varieties known to be well adapted to the growing locality and better crop management practices (Sustainable Agriculture Network 1998). The varieties used in these trials have not been grown in the Armidale district, although they were developed for temperate regions (K. Light, pers. comm., C. Lamrock, pers. comm.). Light transmission through the cover crops declined hyperbolically as sowing rate increased, especially for RA in both years at Kirby and MU in 2001 at Kirby. However, no differences were found between the higher sowing rates, i.e. 100 and 200%. Light transmission was reduced to about 20% of incident light at the high sowing rates at Kirby in 2000 and 10% in 2001. At lower sowing rates (< 50%), light was not reduced below about 60%, indicating that a substantial amount of light was available for weed seeds and seedlings. Light was well correlated with cover crop relative cover and biomass. These results are similar to those reported in the previous chapter and in the literature (Teasdale and Mohler 1993, Sutton 1998). Biomass at incorporation was highest at Kirby in 2001, slightly less in 2000 and considerably lower at Laureldale in 2000. RA had consistent amounts of dry matter at Kirby, with about 4,500 kg/ha produced each year. MU produced equivalent biomass only in 2001, but about half as much in 2000. The higher sowing rates (100 – 200%) had similar biomass production, and the 50% rate for RA was also equivalent, but in the lower sowing rates, biomass production declined quickly. These results reflect trends similar to those observed for relative cover (discussed above). Also, RA was able to develop biomass more quickly than MU (indicated by lower m coefficients), suggesting that it’s potential to suppress weeds may be greater. Cover crop biomass production is important for weed suppression during both the pre-crop and in-crop phases. During the pre-crop period, high biomass production may indicate successful resource acquisition by the cover crop (Brandsæter and Netland 1999) and greater biomass is likely to be associated with greater amounts of phytotoxins (Eberlein et al. 1998, Kirkegaard and Sarwar 1998). During the in-crop period, the amount of biomass produced by the cover crops may affect growing conditions for the subsequent crop by modifying soil nutrient levels, soil structure, soil biological activity, pest and disease incidence, and phytotoxin concentrations (Gubbels and Kenaschuk 1989, Grodzinsky 1992, Wyland et al. 1995, Hartwig and Ammon 2002). Weeds during the cover crop phase
The growth of weeds during the cover crop phase differed significantly between trials, with the most weeds occurring at Laureldale, where cover crop establishment and growth were very poor, followed by Kirby in 2000 and then Kirby in 2001. Cover crop biomass and relative cover were reasonably well correlated with weed biomass (r2 ≥ 0.77), especially at Kirby. Given that light transmittance was highly correlated with relative weed cover, but not weed biomass, it is possible that lower light levels facilitated leaf expansion and stem elongation, but that specific leaf weight was reduced as compensation (Harper 1977, Ballaré and Casal 2000). It is also possible that the low correlation between light transmittance and weed biomass may have been related to the variety of weeds occurring in the plots (Liebman and Gallandt 1997) or variations in leaf morphology of the weeds (Thompson et al. 1995). For example, wireweed, with a prostrate habit and very small leaves, would be expected to give higher relative cover estimates with low biomass production,
Chapter 6 Brassica cover crops – field and glasshouse trials
154
while amaranths, with an erect habit and large, thick leaves, might be associated with lower relative cover estimates but higher weed biomass. Weed density was not influenced by cover crop type or sowing rate, and was poorly correlated with cover crop growth and light transmittance. These findings probably indicate that the cover crops were suppressing weeds not by reducing emergence, but by limiting the growth of emerged weed seedlings (Grundy et al. 1999b). This conclusion is consistent with the results reported in the previous chapter (section 5.4.2), in which an Italian ryegrass cover crop was also used. The capacity of RA to suppress weeds was found to be greater than MU in (a) the level of suppression at a given sowing rate, and (b) in the consistency of effects across the range of sowing rates. As noted above, RA was able to increase relative cover more quickly than MU, and in this experiment, it was found that the cover crop relative cover was strongly associated with low weed biomass during the pre-crop phase. In regard to the question of what were the optimal sowing rates (least seed, most weed control), these trials showed that MU should not be sown below the recommended rate (10 kg seed/ha, or ~375 seeds/m2), and that double the recommended sowing rate did not significantly improve weed suppression. Lodging is reported to be a problem at higher sowing rates for this relatively tall variety (K. Light, pers. comm.), however this was not observed for the 200% sowing rate in these trials. Weed control was equivalent for RA at higher sowing rates (≥ 50%). However, the non-linear regression parameters indicate that, as sowing rate increased, the upper asymptote for relative weed cover was reduced. This implies that although adequate growth and weed control were be achieved at 50% of the recommended sowing rate (20 kg seed/ha, ~186 seeds/m2), higher sowing rates (i.e. 100 and 200%) provide slightly better weed control and also reduce the risk of the cover crop failing to adequately suppress weeds. Sowing at a higher than recommended rate may reduce the risk of cover crop failure for new varieties (such MU and RA) and for the less experienced farmers who make up a large segment of the organic industry (Chapter 3: one third of respondents have ≤ 4 years experience in organic farming). Weeds and crop during the lettuce phase
Sowing rate and cover crop type
Compared with an unweeded fallow (sowing rate of 0%), varying the sowing rate of both MU and RA appeared to have very little effect on weed and lettuce growth. The only exception was at Kirby in 2001, where relative weed cover in the RA control was about half that of the 50 and 100% sowing rates. The cause of this difference is unclear. A comparison of the averages of the MU and RA controls (22.2 and 15.3% respectively, standard error = 4.6%) indicates that the result for the RA control is relatively low. Nevertheless, the similarity in response at the 100% sowing rate for both MU and RA in terms of (a) cover relative crop cover, biomass production and light transmittance during the cover crop phase, and (b) relative weed cover in the lettuce phase, suggests that both cover crops had little effect on subsequent weeds when sown at the recommended rate. The variation in weed growth between the trials was probably due to differences in weed seed levels, given that the variation was apparent in the controls. It is assumed that the difference in weed seed levels were related to the land use history of the field sites, as discussed in section 4.4.1. A lack of carry-over effects by the cover crops on the weeds and crop in the lettuce phase was also reported in the previous chapter. Three possible reasons are suggested for reducing potential effects: * cover crop residue incorporation hastened decomposition, * a single rotary hoeing during the 4 week plant-back delay period interfered with the weed emergence patterns of the treatments (and further hastened residue decomposition), and * the plant-back delay was too long, therefore, dynamic processes limiting weed emergence and growth, such as phytotoxin release and nitrogen immobilisation by cover crop residues, may have peaked or been substantially completed before the lettuces were planted.
Chapter 6 Brassica cover crops – field and glasshouse trials
155
Plant-back delay
The delayed plant-back treatment received considerably more rainfall than the no delay treatment. Therefore, it is possible that rainfall may have influenced weed and lettuce responses instead of, or in addition to, the plant-back delay treatments themselves. Consequently, the following discussion on the effects of plant-back delay is presented with the knowledge that treatment effects and rainfall may be confounded. A number of suggestions are offered below regarding possible ways of overcoming confounding effects in future trials. Differences in weed response to the plant-back delay treatments were generally minor and only significant during the early stages of the lettuce phase. A key difference appears to be the changes in weed density induced by the delay treatment. Weed density in the delayed plant-back treatment was lower at 2 WAP than in the delated treatment. Weed density then increased in the delayed treatment but remained constant for the no delay treatment throughout the lettuce phase. With fewer weeds initially, the delayed treatment produced less weed biomass, despite the later increase in weed density and the higher rainfall. In the delayed plant-back treatment, the extra tillage operation at 2 weeks after incorporation is also likely to have reduced subsequent weed density by killing the cohort of weeds that emerged after incorporation. That weed cohort would be expected to be growing uncontrolled in the no delay treatment (Mohler 1993). The increase in weed density between the first and second sampling points, i.e. 2 and 4 WAP, in the delayed treatment was possibly due to the high rainfall (145 mm) received in the 3rd WAP (Bond and Baker 1990). The absence of an increase in weed density in the no delay treatment at 4 and 7 WAP may be related to the release of phytotoxins from the decomposing cover crop residues. However, the lack of significant differences between the cover crops and the weedy control, and between the various cover crop sowing rates, suggests that phytotoxins were not an important factor in reducing weed emergence and growth. While isothiocyanates (ITCs), the breakdown products of GSLs from brassicas, have been shown to be phytotoxic to various crop and weed species in bioassays (Mason-Sedun and Jessop 1988, Eberlein et al. 1997), Morra and Kirkegaard (2002) have recently shown that ITC release in the field peaked at about 2 hours after incorporation and then rapidly declined over the next two days (also see Bending and Lincoln 1999, Gardiner et al. 1999, Petersen et al. 2001). Those findings suggest that the phytotoxic activity of the brassica cover crop residues is likely to be relatively brief. Nitrogen immobilisation is another important process occurring after cover crop incorporation that has the potential to reduce lettuce growth. The timing and intensity of immobilisation depends on the cover crop residue quality, soil conditions and climatic factors (Wyland et al. 1995, Robertson 1997). However, the similarity in both weed biomass and lettuce yield for the no delay and delayed treatments indicates that the cover crops may not have caused sufficient nitrogen immobilisation to reduce weed growth or crop yields. The relatively low carbon:nitrogen ratio of the MU and RA (similar varieties have ratios of about 20:1 [M. Ryan, pers. comm.]) indicates that the cover crops may not have caused significant nitrogen immobilisation (Wyland et al. 1995). The lack of significant effects with either the 0 or 4 weeks plant-back delays would appear to reinforce the overall result that the MU and RA varieties used under these experimental conditions were not effective at controlling weeds in a following vegetable crop, nor did they cause a decrease in crop yield. Bàrberi (2001) varied the time between cover crop termination and sowing a subsequent corn (Zea mays L.) by 2 to 4 weeks and found no significant differences in residual weed suppression. It is possible that a longer plant-back delay could yield different results (Boydston and Hang 1995), however, the rapidity of ITC release (Morra and Kirkegaard 2002) and the low carbon:nitrogen of the cover crop residues (facilitating prompt decomposition and release of nutrients) would imply that longer delays are less likely to be effective at suppressing weeds, although it remains an untested possibility in this situation. The impact of cover crops on weed seed banks was not studied, nor were individual weed species quantified in the trials. A thorough evaluation of seed bank and weed seedling population dynamics in future trials may identify important effects that were not detected here. The number and species of weeds emerging at different times is likely to vary significantly (Bond and Baker
Chapter 6 Brassica cover crops – field and glasshouse trials
156
1990, Fennimore and Smith 2001). In experiments conducted in the same district as the trials presented here, Grace (2000) looked at the relationship between saffron thistle (Carthamus lanatus L.) emergence and climate. He found that emergence from natural seed banks was seasonal and closely correlated with rainfall and temperature. It is probable, therefore, that crops planted at different plant-back delay times may be competing with different weed communities, and observed responses may be due to the specific suite of weeds rather than the effect of time of cover crop residues. A number of possible options are available to overcome or reduce confounding effects due to different climate effects being experienced by crops planted at different times. For field-based experiments, these include: * applying sufficient water and nutrients throughout the trial so that neither resource is limiting, * staggering the timing of the cover crop phase into several treatments and beginning the lettuce
phase simultaneously for each treatment, * using cover crop residues grown off-site, incorporating at various time and planting lettuces
simultaneously, * repeating the trials over a number of years and/or at several sites, allowing the treatment effects
to be recorded in a wider range if climatic conditions and enabling the use of climate variable as covariates or random effects,
* closely monitoring the soil processes (e.g. nutrient dynamics), again using factors such as soil moisture as covariates or random effects in the analysis, and
* using rain shelters and manually irrigating the various treatments. The use of three replicates in this experiment may have increased the variability of the treatment means and, therefore, obscured possible treatment differences. However, inspection of the data points in a number of graphs (e.g. Figure 6.10, Figure 6.13) suggests that replicates within a treatment were generally consistent. An exception was the uneven response for weed density (Figure 6.12A), although this variable has been found to be inconsistent in some cases (Mohler and Galford 1997). The general conclusion that the cover crops had little effect on the subsequent lettuce crop concurs with the findings of the previous chapter in which four replicates were used.
6.4.2 Experiment Two: Cover crops in the glasshouse
Sowing rate
The MU and RA cover crops have different growth habits, as observed in experiment one and reported elsewhere (Boydston and Hang 1995, Krishnan et al. 1998). Despite being considerably shorter, RA produced significantly more biomass than MU. However, there were no differences in height or biomass production in response to the various sowing rates, with cover crop growth remaining constant across all densities. This outcome, yield being independent of density, conforms to the "law of constant final yield" cited by Harper (1977) as a relationship that holds with a wide range of plant species. Varying the sowing rate of the cover crop had no apparent effect on lettuce density or growth, probably because there was little variation in the amount of cover crop fresh weight produced by MU and RA at the different sowing rates. The cover crop plants behaved plastically, decreasing in size as density increased. Ishii and Saijo (1987) found that ITC concentrations in radish roots were not affected by the planting density of the crop. Cover crop type, fertiliser treatment and residue treatment
Lettuce biomass was lower after MU than RA (despite the higher biomass production by RA) and the control in 2000 only. In 2001, the effects of the control, MU and RA on lettuce growth did not differ significantly, although the fertiliser and residue treatments highlighted the possible role of nutrients in determining the lettuce response. Applying fertiliser during the cover crop phase generally increased subsequent lettuce density and growth, with the increase being considerably greater when residues were also incorporated.
Chapter 6 Brassica cover crops – field and glasshouse trials
157
In the +RES treatment, lettuce growth increased compared with the control, while the -RES treatment showed a decrease in lettuce height and biomass. In a series of glasshouse pot trials, Umbers (1994) also found that amending soil with fresh canola (Brassica napus L.) residues greatly increased the growth of wheat and perennial ryegrass, but not linseed. The positive effect with residues incorporated, including when the lettuce was sown immediately afterwards (i.e. the no delay treatment), indicates that nutrients released from the decomposing residues may have been responsible for increased lettuce growth (Scagnozzi et al. 1997). In the -FERT treatment, adding residues did not cause an increase in lettuce growth, suggesting either that the relatively nutrient-poor -FERT treatment was less able to use the nutrients available in the +FERT treatment, possibly due to microbial immobilisation, or that the positive effects of the residue nutrients were balanced with possible negative effects from phytotoxins or other changes in soil chemistry (Inderjit et al. 2001). Another possible reason for the improved growth in the +RES treatment is that the residues controlled pests or diseases in the soil that were inhibiting growth in the control and -RES treatments (Kirkegaard et al. 1994). Although not quantitatively assessed, no disease symptoms were observed on the lettuce leaves or roots for any of the treatments. Although the potting soils used in both trials were from the same paddock, they were sampled from different pits (P. Lockwood, pers. comm.), so it is possible that variations in soil characteristics may have existed. Average biomass production was 25% greater in 2001 than 2000 (53.1 and 40.3 g/pot respectively, standard error = 3.46), and that may indicate an underlying difference in soil nutrient status. It is conceivable that the inhibition of lettuce growth in the no delay treatment in 2000 was related to nutrient immobilisation during decomposition (Harper 1977). However, in 2001 the lack of inhibition with the no delay treatment, the higher residue rates incorporated (for RA), and the enhanced growth in the +RES treatments (even for lettuces sown without a delay period) suggests that immobilisation was not important under the prevailing glasshouse conditions. Plant-back delay
In 2000, the no delay treatment reduced lettuce density, height and biomass compared with the control and with delayed sowing, the delayed treatments for both MU and RA had equivalent lettuce growth to that of the controls and the controls did not vary with plant-back delay period. These results indicate that fresh residues in the no delay treatment inhibited lettuce emergence and growth, and that during the 2 week delay period either the inhibitory mechanisms were ameliorated, or other stimulatory mechanisms began to dominate. In 2001, there was no significant difference between sowing lettuce immediately or 4 weeks after incorporation, nor between the no delay and the control, indicating that lettuce growth was not inhibited when sown without delay. The different results between the two years may have been due to differences in the chopping and incorporation of the cover crop residues or variation in the soil used (the source was the same). The cause of the inhibition in the no delay treatment in 2000 is unclear. Possible mechanisms are phytotoxins from the cover crops, immobilisation of nutrients or other chemical changes in the soil. Physical modification of soil structure by incorporating cover crops may also affect the movement and settling of lettuce seeds prior to germination and emergence (e.g. after watering, as soil subsides). There are many reports of bioassays and pot trials in which brassicas reduced the germination and growth of numerous plant species (for example, the papers cited in Umbers [1994], Al-Khatib et al. [1997], Krishnan et al. [1998]), and the rapid release of ITCs by brassicas residues (Petersen et al. 2001, Morra and Kirkegaard 2002) could be expected to produce an effect similar to that observed in the 2000 trial and in other reports of inhibition by brassica residues. However, the effects are not assured. Krishnan et al. (1998) found that while B. juncea residues reduced the fresh weights of certain weed species in a pot trial and B. napus did not, no relationship between weed growth and cover crop GSL content was found. In addition to the conventional phytotoxic effect attributed to ITCs, alternative factors related to changes in the chemical or physical conditions may influence the lettuce seeds and seedlings
Chapter 6 Brassica cover crops – field and glasshouse trials
158
(Benech-Arnold et al. 2000, Forcella et al. 2000, Inderjit et al. 2001). Researchers have suggested that organic compounds not derived from GSLs may also be important in the suppression of soil microbes by brassica residues (Bending and Lincoln 1999), and that incorporating residues can affect many soil variables such as pH and inorganic ion concentrations (Inderjit et al. 2001). While phytotoxic or other chemical inhibition is plausible for the response seen in 2000, such inhibition was absent in 2001, despite higher cover crop biomass levels. In the latter year, the factors cover crop type and delay period did not have significant effects on lettuce. These factors would be expected to be significant if chemical interference was occurring. On the other hand, significant and positive fertiliser and residue effects were found, suggesting that plant nutrients were beneficial. The data from 2001 are not conclusive in determining a cause for the inhibition observed in 2000, but it is possible that nutrient immobilisation was not important. The fresh residues in the no delay treatment may have had different physical effects on lettuce seed germination and seedling growth compared with the older, partially decomposed residues in the delayed treatment. Freshly incorporated residues may have had more unfavourable microsites for seed germination and continued growth (e.g. poor seed-soil contact), and caused greater physical impedance of newly germinated seeds. In a soil bioassay trial not reported in this thesis, it was observed that large numbers of lettuce seeds were falling into the large pores in the potting soil created by incorporated cover crop residues. Those seeds generally did not emerge during the course of that trial, regardless of treatment effects. In summary, the cause of the plant-back delay effect in 2000 remains uncertain. Evidence from the 2001 trial suggests that nutrient immobilisation, phytotoxins and other chemicals in the soil were not important, while indirect evidence from similar (unreported) pot trials highlights the potential role of physical soil changes. Separating these and other possible factors requires further experimentation. The methods used for assessing allelopathic effects and separating chemical interference from resource competition are under development in the research community. The limitations of conventional bioassays have been stated (Weidenhamer 1996, Inderjit and del Moral 1997), and new practical techniques (Blum et al. 1992, Al Hamdi et al. 2001), new theoretical approaches (Wardle et al. 1998), and newly adopted analytical methods (Blum et al. 1997) are being developed. Linking the effects observed in controlled bioassay experiments with effects observed in the field remains a challenge (Williamson 1990, Petersen et al. 2001).
6.5 Conclusions
The results observed in these experiments are likely to be the net effect of the interaction between several factors, including pre-existing soil characteristics, physical changes induced by the residues, and the phytotoxins, nutrients and other compounds released by cover crop residues (Inderjit and Weston 2000, Al Hamdi et al. 2001). In general, the cover crops failed to have an effect on a subsequent lettuce crop in the field or weeds growing within the lettuce crop, in contrast to some published reports. Reducing the period between incorporating the cover crops and planting the lettuce crop from 4 weeks to 1 day did not produce greater weed suppression and did not have a negative impact on lettuce growth, although possible confounding effects between climate and delay treatment means that the finding is not certain. These field trials provide little evidence of the strong phytotoxic effects often attributed to brassica crops, and the rapidity of ITC breakdown reported in the literature suggests that suppression observed in the field may be due to other factors. The cover crops were effective at reducing weeds whilst they were growing, with the fodder radish being more effective at given densities and more consistent than the Indian mustard. Characteristics that were important for good weed suppression by the cover crops were early growth rate, growth habit (e.g. canopy architecture, leaf size), and biomass production.
Chapter 6 Brassica cover crops – field and glasshouse trials
159
Cover crops failed when their early growth was poor and weeds were able to out-compete the cover crop. Cover crops, or green manures, are an essential part of crop rotations in organic farming systems. However, they are not usually a cash crop, so they are commonly grown with a minimum of inputs. Once weeds are established in a cover crop, organic growers have very few options: hand weeding is likely to be economically unviable and tillage may only provide a partial solution. It is very important, therefore, that the cover crops are managed effectively. Selecting a suitable variety for the local conditions and using a high sowing rate can reduce the risk of cover crop failure. In the glasshouse trials, the cover crops did have an effect on a subsequent lettuce crop. As in the field trials, the fodder radish was more consistent, providing greater benefit to the subsequent lettuce crop as a green manure. Some strong evidence was found for the importance of soil and plant nutrients in determining plant growth. Adding cover crop residues increased lettuce growth when the previous cover crop had been fertilised, and had no effect when the covers had not been fertilised. This interaction between cover crop fertilisation and residue management emphasises the importance of good cover crop management practices. Other findings in the glasshouse trials (e.g., the reduced lettuce growth in the early plant-back treatment in 2000) indicated that chemical (e.g. phytotoxins) or physical factors might also have been important in certain circumstances. Soil chemical variables were not assessed. However, the possible effect of cover crop incorporation on the physical characteristics of soil and the consequent effects on a following crop were highlighted in these trials. Brassica cover crops were shown to be effective weed suppressors in the field and did not reduce subsequent lettuce growth, however, weed suppression during the in-crop phase was insignificant. They offer a possible option in crop rotations for organic growers seeking an alternative to cereal and legume cover crops, but may have limited impact on in-crop weeds. As research into plant-plant and plant-soil processes advances, awareness of the complexity and dynamic nature of the interactions is increasing. In addition to the traditional practice of investigating phytotoxins and macronutrients, new avenues of research, for example, looking at microbial interactions or in-organic compounds and using new theoretical and statistical approaches, are developing. Just as cover crops have a wide range of potential effects on weeds and crops, so too do mulches. The next chapter looks at some of the ways that mulches influence the soils and microclimates in which weeds and crops grow.
160
Chapter 7 Effect of mulches on crop growth and lettuce bolting
7.1 Introduction
The field trials reported in Chapter 4 highlighted some of the benefits and disadvantages of using mulches for in-crop weed control in herb and vegetable production. Apart from the financial cost of the mulches, two key agronomic findings were (a) the reduced yield of lettuce and echinacea grown under the paper mulch, and (b) the reduced occurrence of bolting in lettuces grown under both hay and paper mulch. This chapter describes a series of experiments designed to evaluate the likely causes of these findings. While the poor yields of the crops grown under paper mulch are clear, the cause is less certain. On the other hand, the reduction in bolting by the mulches may offer an economic advantage to growers of crops prone to premature flowering by providing an extended harvest window.
7.1.1 Possible causes of reduced crop yields under paper mulch
Weed competition
There are several commonly reported mechanisms by which mulches affect field grown herb and vegetable crop yields. These mechanisms are generally interrelated. Mulches may have an impact on crop growth by modifying weed infestations and thus, the competitive effects of weeds on the crop. Mulches may suppress weed germination, emergence and growth (Thompson et al. 1977, Teasdale and Mohler 2000b), providing an advantage to the crop. Conversely, mulches may reduce crop yields by increasing weed levels through introducing more weed seeds (Whitten 1999) or by failing to control weeds when applied unevenly (Henderson and Bishop 2000). Paper has been reported to be an effective mulch material for weed suppression either as a rolls, sheets, chopped, shredded or pellets (Munn 1992, Anderson et al. 1995, Runham and Town 1995, Monks et al. 1997, Smith et al. 1998, Umezaki and Tsuno 1998, Olsen and Gounder 2001). Nitrogen immobilisation
A second possible cause of the low lettuce and echinacea yields in paper mulch is nutrient immobilisation, especially nitrogen. The published literature on the performance of paper mulches in field situations is uncertain with regard to nitrogen immobilisation. A number of reports indicate that crop yields were not reduced under paper mulch. Unger (2001) found that paper pellets did not affect sorghum (Sorghum bicolor [L.] Moench) yields in a field trial. Field-grown tomatoes mulched with chopped or shredded newspaper had similar yields to unmulched tomatoes in two years at one site, but had reduced yields at a second site in one year (Monks et al. 1997). Munn (1992) found that yields of tomato and sweet corn were higher in a shredded newspaper mulch treatment compared with wheat straw and bare soil, and that the plants in the paper mulch treatment were the largest. He surmised that applying the mulch to the soil surface, rather than incorporating it, may have minimised nitrogen immobilisation. The mulch application rates used by Monks et al. and Munn were lower (i.e. 4.4 – 35.8 tonnes/ha) than in the trials reported here (42 tonnes/ha). Matitschka (1996) reported no difference in lettuce nitrogen concentrations at harvest between no mulch, paper mulch (rolls?) or plastic mulch in a field trial with 0, 50 and 112 kg/ha nitrogen fertiliser treatments. Lettuce fresh weight also did not vary significantly between treatments in two out of three trials (Matitschka 1996). Olsen and Grounder (2001) found that paper roll mulch used in capsicum (Capsicum annuum L.) production gave the best yields from a range of different novel mulch materials such as biodegradable polymer rolls and sugarcane trash. Contrary results, in which paper mulch has reduced crop yields in field trials, have also been reported. In a trial using collards (Brassica oleracea L. Acephala group), a non-heading leafy vegetable, ground newspaper mulch produced the lowest yields compared with plastic mulch, wood chips and bare soil, and leaf tissue nitrogen was also reduced at some fertilisation rates (Guertal and Edwards 1996). Tyler (Tyler 1999) reported that echinacea dry weight was lowest under
Chapter 7 Effect of mulches on crop growth and lettuce bolting
161
shredded paper mulch compared with bare soil, plastic mulch, compost and wood chips. Several researchers presumed that the reduced yields were due to nitrogen immobilisation, although no tests were reported to confirm those assumptions (Munn 1992, Guertal and Edwards 1996, Monks et al. 1997, Tyler 1999). Pelletised paper mulch has also been used for weed control by the nursery industry in the USA. Again, conflicting findings have been reported, from no reduction in yield (Smith et al. 1998) to greatly lowered yields (Smith et al. 1997, Sichivitsa et al. 1998, Glenn et al. 2000). However, Glenn (2000) found that the variation in foliar nitrogen levels was not significant and Smith (1997) found that paper mulch caused little or no growth suppression when amended with phosphorus, the later being used to bind suspected excess aluminium. Therefore, the role of nutrient immobilisation by paper mulch was not clearly determined. Although the above reports indicate that the use of paper mulches can have variable effects on the crop in a range of field and pot trials, other studies looking at a range of organic materials have identified a relationship between the release of nitrogen (and other nutrients) in the soil and physical and chemical characteristics of the mulch, the level of incorporation and the prevailing climatic and soil conditions (Parr and Papendick 1978, Seneviratne et al. 1998, Wagger et al. 1998). The paper mulches used in the trials cited are likely to vary widely in their chemical composition and physical nature, and how they contact and interact with soil. The ratio of carbon to nitrogen (C:N ratio) in the mulch is known to be a key determinant of the extent to which soil nitrogen may be immobilised as microorganisms decompose organic matter, although other factors such as lignin and polyphenol content can be important too (Tian et al. 1993, Duryea et al. 1999, Ibewiro et al. 2000). Net immobilisation of nitrogen may be expected to occur for organic material with a C:N ratio above 25 – 30 (Allison 1966, Odhiambo and Bomke 2000). Paper-based products generally have very high C:N ratios (e.g. 130, Rodale 1960, NRAES 1992). However, the paper mulch used in the field trials reported here was amended with worm castings and was marketed as ready to use. Organic residues with low C:N ratio and lignin levels can improve crop growth through nutritional contributions, whereas materials with a high C:N ratio and lignin levels may enhance crop performance through effects on the microclimate (Tian et al. 1993). The latter effect is discussed below. Phytotoxicity
A third possible reason for the poor yields in lettuce and echinacea in response to paper mulch is the effect of phytotoxins. The exact composition of the paper mulch was unknown and it was possible that phytotoxic substances may have been leached from the mulch after initial irrigation and subsequent rain in the field or that some other chemical change in soil conditions occurred in response to the paper mulch. For example, lettuce does not tolerate acid conditions, especially during the seedling stage (Fordham and Biggs 1985). However, a paper pulp residue was found to be more effective than lime in increasing soil pH (Voundi Nkana et al. 1999). Olsen (2001) reported results from a mulch toxicity experiment (including paper roll mulch) indicating that the materials were unlikely to contain phytotoxic substances and Runham et al. (2000) found that levels of heavy metals and organic pollutants in soil under paper roll mulch were similar to soil in hand weeded plots. Mulch or crop residue phytotoxicity is commonly evaluated using bioassays involving aqueous extracts applied to seeds or seedlings of target species and measuring germination and growth responses. Some researchers have emphasised the limitations of bioassays, including their relevance to field situations (Weidenhamer 1996, Inderjit and del Moral 1997, Wardle et al. 1998, Wu et al. 2001). However, bioassays can provide indirect evidence of possible mechanisms of chemical interference that may be operating in the field (Inderjit and Weston 2000). Other possible causes
Several other plausible mechanisms exist by which paper mulch could reduce crop yields. Modifications to the soil physical, chemical and biological conditions are likely, particularly compared with the unweeded control, hand weeding and tillage. Paper mulches have been reported
Chapter 7 Effect of mulches on crop growth and lettuce bolting
162
to improve soil carbon and aggregate stability (Unger 2001), bulk density (Brault et al. 2002) and water infiltration (Edwards 1997). The impact of the paper mulch on soil aeration may have contributed to the observed crop response in the paper mulch treatment (Obiefuna 1991, Khan et al. 2000). Soil moisture is widely reported to be greater under mulched soil than bare soil, including soils mulched with paper products (Teasdale and Mohler 1993, Monks et al. 1997, Sutton 1998). The relatively dense layer formed by the wetted paper mulch may have reduced oxygen diffusion from the air to the soil, or may have caused waterlogging by preventing evaporation (McAfee et al. 1989). These effects may lead to hypoxia or anoxia and consequently reduced root growth (Forcella et al. 2000) and nutrient uptake (Stepniewski and Przywara 1992). The presence of herbivorous fauna such as gastropods or insects may also differ between the weed control treatments. Each treatment offered different habitats, with the control and two mulch types being the least disturbed, and offering a greater variety of potential niches (Henderson and Bishop 2000). However, such niches may also repel pests or attract beneficial organisms (Riechert and Bishop 1990, Mwaja et al. 1996, Bottenberg et al. 1999).
7.1.2 Effect of weed control treatments on bolting
Bolting (premature flowering) in lettuce is commonly thought to be due to a range of issues including genetics, planting method (transplants vs. direct seeding), stress factors (water, nutrients), daylength and temperature (Heisswolf et al. 1999b, Titley 2000, Napier 2001a). Once a suitable lettuce variety has been chosen for the growing site, and assuming fertiliser and irrigation are not limiting, the two key determinants of the rate of lettuce maturation are soil temperature and daylength (Kristensen et al. 1985, Wurr et al. 1992, Waycott 1995). With regard to temperature, the maximum daily soil temperature and the diurnal variation in soil temperature are especially important (Titley 2000). Waycott (1995) reported that photoperiod, not high temperature, was the critical mediator of plant development in lettuce. At short daylengths (8 hours of light per day), higher temperatures (≤ 32°C) did not induce bolting, but longer daylengths (8 to 20 hours of light per day) produced a variety of bolting responses. The field trials reported in this thesis were carried out in mid-summer, a period with long daylengths (~13 hours). Therefore, the photoperiod would presumably be equivalent in all treatments, and any differences in bolting were not due to daylength. Organic mulches have been widely reported to reduce both maximum daily soil temperature and the diurnal soil temperature amplitude (Munn 1992, Stirzaker et al. 1995, Horton et al. 1996, Tyler 1999, Olsen and Gounder 2001). Although no-one appears to have reported on the effects of mulch on reducing lettuce bolting, there are several papers describing delayed maturation in other mulched vegetable crops. Tomatoes have been reported to fruit earlier under plastic mulches, but fruited later (with higher yields) under organic mulches, a difference ascribed partly to early temperature differences (Teasdale and Abdul-Baki 1995, Teasdale and Abdul-Baki 1997) Price (1985) found that tomatoes grown using conventional tillage had a more rapid growth rate initially compared with a no-till (killed rye mulch) treatment. Wool mulch also reduced the incidence of bolting pak choi (Brassica campestris var. chinensis), eliminating it completely in some experiments (Vogel and Flogel 1992). Rice husk and sawdust mulches significantly delayed flowering in onion, an effect thought to be due to the increased soil temperatures under other treatments (Rahman and Khan 2001).
7.1.3 Aims of the experiments
The key issues addressed in this chapter are the relative importance of phytotoxicity versus nitrogen immobilisation in response to the paper mulch, and the ability of mulches to reduce premature flowering by moderating fluctuations and extremes in soil temperature. The aims of the experiments reported in this chapter were: (a) to determine the cause of the poor yield of the paper mulch treatment in the field trials by investigating:
Chapter 7 Effect of mulches on crop growth and lettuce bolting
163
- the effect of the weed control treatments on crop nutrient concentrations and soil moisture in the field,
- the interaction of mulch and fertiliser on lettuce yield in a glasshouse, and - the effect of aqueous mulch extracts on lettuce and echinacea growth in a glasshouse; and (b) to evaluate the causes of the excessive bolting observed in the field trials by investigating the
effects of the weed control treatments on soil temperature.
7.2 Methods
7.2.1 Effects of mulch on soil and crop parameters in the field
Nutrient analyses of plant tissue and mulches
Plant tissue nutrient analyses were carried out for lettuce and echinacea grown in trials at Yarrowitch and at Kirby in 2001. Descriptions of the field sites, including location, recent land use history, soil type and climatic conditions prevailing during the trial periods are given in sections 4.2.1. Information about the crops used and the treatments applied are given in sections 4.2.2 – 4.2.4. Leaves were sampled from the plants used to assess crop biomass prior to drying (i.e. eight lettuce plants and ten echinacea plants per plot), bulked and thoroughly mixed. Five wrapper leaves were sampled per plant for lettuce, while five of the youngest (i.e. uppermost) mature leaves were sampled from echinacea plants (Benton Jones et al. 1991, Piggot 1997). In all cases, only clean, intact, non-diseased leaves were sampled. The leaves were dried at 80°C for 48 hours and hammer-milled to ≤ 2 mm. The samples were prepared using the sealed chamber digestion method (Anderson and Henderson 1986) and the concentrations of phosphorus, potassium, sulfur, calcium, magnesium, sodium, iron, zinc, copper and aluminium determined using Inductively Coupled Plasma - Atomic Emission Spectrometry (ARL 1981). A sub-set of the plant tissue samples was hammer-milled to ≤ 0.5 mm and the carbon and nitrogen concentrations measured using Automatic Nitrogen Carbon Analysis - Mass Spectrometry (ANCA-MS) (Barrie and Prosser 1996). The mulches were sampled by collecting two 100 g sub-samples from the plots after the mulch had been applied. The sub-samples were collected in a line along the centre of the plots, 4 m from each end. All sub-samples of each mulch were bulked, mixed, dried at 80°C for 24 hours and hammer-milled to ≤ 0.5 mm. Two samples of each mulch were drawn from the milled and stirred materials, and these were used as pseudo-replicates in the chemical analyses. Soil moisture
Soil moisture was recorded in the echinacea trial at Kirby in 2001 using Time Domain Reflectometry (TDR). The Trase System TDR (Model 6050X1) instantaneously measures the volumetric water content (Soilmoisture Equipment Corporation 1996). Calibration of the equipment with reference to gravimetrically determined soil moisture has been carried out by others and has been found to be accurate in many soil types (Jacobsen and Schjønning 1993a, Soilmoisture Equipment Corporation 1996, Topp et al. 1996). Nevertheless, in order to calibrate the TDR for the trial conditions reported here, a series of moisture measurements was taken on 1500 g samples of soil from the Kirby field site combined thoroughly with known quantities of water and placed in plastic buckets 150 mm in diameter and 200 mm deep. The relationship between the soil moisture level reported by the TDR (θ, %) and soil water content (Ws, % w/w) was evaluated by linear regression. The relationship was described by the equation θ = 0.91Ws – 0.88 and there was a close correlation between the variables (r2 = 0.972). Given that the slope was close to unity, and the main interest in recording soil moisture was to measure relative values, rather than absolute values, it was decided that the soil moisture level reported by the TDR would be not need to be adjusted. Five soil moisture measurements were taken in each plot using two probes 150 mm long and set 40 mm apart. The probes were mounted on a solid plastic head that was connected by coaxial cable to
Chapter 7 Effect of mulches on crop growth and lettuce bolting
164
a data analyser and storage unit. The probes were inserted into the soil in the planting rows to a depth of 150 mm, midway between two echinacea plants so that the effect of tillage on soil bulk density and, therefore, soil TDR accuracy (Jacobsen and Schjønning 1993b) might be reduced, and to be in close proximity to the zone where plant roots were likely to grow. The mulches were temporarily removed from the insertion area during the measurements so that the probes could be inserted to the same depth into the soil as the other treatments. The measurements were manually recorded every 3 to 5 days from 31/1/01 – 31/3/01, i.e. 11 – 20 WAP the echinacea. Rainfall records were also maintained during the trial. Soil temperature
Soil temperature was recorded in the echinacea trial at Kirby in 2001. Measurements should ideally have been taken in the lettuce plots in order to get a direct correlation between lettuce bolting and soil temperature. However, practical limitations prevented the use of the short temperature sensor cables in the larger multi-factorial lettuce trial area compared with the single factor echinacea trial area. Temperature was measured using probes consisting of silicon sensors (KTY87 – 205, Phillips Semiconductors) connected by a 2 mm single pair shielded electrical cable to a data-logger. The sensors are accurate to at least 0.7°C. The probes were pre-tested against a standard mercury thermometer in a water-bath gradually warmed from 1°C to 45°C to ensure accurate readings were obtained. One probe was used in each plot and one extra was used to record ambient air temperature in a Stephenson screen. The soil temperature probes were inserted 50 mm into the soil between two echinacea plants along the planting row. The data-logger was built by the Electrical Services Unit at UNE and had a temperature range of -10 to 55°C and a resolution of 0.4°C. The logger recorded soil and air temperature every 0.5 hours from 6/2/01 to 31/3/01, and the data were downloaded onto a laptop computer once each week. No measurements were recorded for about 4 days (14/2/01 to 18/2/01) due to a power failure in the data-logger. Measurements and statistical analysis
Statistical analyses of the data were carried out using the procedures detailed in Chapter 4. GLMs were used for variables measured at a single time point (e.g. nutrient analyses) and GLMMs were used for variables that were measured several times during the course of the trials (e.g. soil moisture). Contrast analysis was used to separate means where significant effects were detected.
7.2.2 Mulch and fertiliser (glasshouse trial)
Treatments and experimental design
Lettuce cv. Imperial Triumph seedlings were grown in cell trays in a sand:perlite:peat (1:1:1) potting medium until four true leaves were fully displayed, about 8 days after sowing. On 9/11/00, the seedlings were transplanted into black plastic pots (200 mm diameter × 200 mm high) containing soil from the Kirby Research Station (see section 6.2.2 for details). The pots were placed in a glasshouse located at the main campus of the UNE, Armidale, where the daily maximum temperature was maintained at 25 ± 3°C and the minimum was maintained at 15 ± 3°C during the experiments. Two factors, mulch and fertiliser, were investigated in this experiment using a full factorial design with six treatments (three mulch treatments × two fertiliser treatments). The mulches were the same as the materials used in the field trials, i.e. hay and pelletised paper, as well as an unmulched control. The hay mulch was applied to a depth of 50 mm (~30 g/pot, equivalent to 10 tonnes/ha) and the paper mulch was applied to a depth of 30 mm (~150 g/pot, equivalent to 50.2 tonnes/ha), similar to the depths used in the field. The fertiliser treatments consisted of an unfertilised control treatment and an ammonium nitrate fertiliser treatment (Nitram®, N:P:K 34:0:0, NO3
- 17% w/w, NH4
+ 17% w/w, dissolved in tap water at a rate of 4.8 g Nitram/ 2.4 L water). Each pot in the fertilised treatment received 100ml of solution at lettuce planting and again 2 weeks later,
Chapter 7 Effect of mulches on crop growth and lettuce bolting
165
providing a total equivalent to 133 kg Nitram/ha. Four replicates were used for each treatment, with all pots laid out in a completely randomised design. All pots were placed on 240 mm diameter plastic saucers and irrigated by filling the saucers with tap water every 2 to 3 days, except when the saucer was already wet. The trial was terminated at 5 WAP (21/12/00). Measurements and statistical analysis
Soil moisture was measured at weekly intervals by taking two readings in each pot using TDR (Trase System, as described for the previous experiment). The probes were inserted midway between the plant and the pot wall to reduce pot edge-effects and the two readings were averaged for each replicate. The response of soil moisture was modelled using the loess smoothing function in S-Plus 2000® which fits a local regression model (MathSoft 1999c ) based on the methods of Cleveland and Devlin (1988). Locally weighted regression (loess) can be used for data exploration and providing a nonparametric regression surface, and is especially useful when the response is non-linear (Cleveland and Devlin 1988). The assumptions of normality and constant variance of the errors apply, and these were tested using plots of frequency distribution and residuals versus fitted values respectively. At 5 WAP, lettuce height (from base of plant to tip of longest leaf) was measured and dry weight biomass was determined by carefully removing the plants from the potting soil, washing the plants, oven drying for 48 hours at 80°C and weighing. The soil moisture and growth data were normally distributed and variance was homogeneous, therefore Analysis of Variance (AOV) was used, without transformation of the data, to determine the effects of the mulch and fertiliser treatments, and the mulch × fertiliser interaction, on lettuce height and biomass at 5 weeks after planting. Contrast analysis was used to separate the means of the mulch treatments.
7.2.3 Mulch aqueous extracts (glasshouse trial)
Treatments and experimental design
An experiment was carried out to determine the effect of aqueous extracts of the hay and pelletised paper mulch on lettuce and echinacea seedling growth. The trial was conducted in 2000 (23/5/00 – 28/6/00) on lettuce only and in 2001 on lettuce and echinacea (16/11/00 – 21/12/00 and 16/11/00 – 18/01/01 respectively). Aqueous extracts of the mulches were prepared by soaking fresh hay in water (1:15 w/v) and pelletised paper in tap water (1:4 w/v) for 48 hours. The ratios for the extracts were determined by calculating the volume of rainfall received over 1 m2 for 1 week (790 mm/year ≈ 15mm/week or 15L/m2/week) and the amount of mulch covering 1 m2 (~1 and 4 kg for hay and paper respectively). After soaking, the liquid was strained through a 1 mm sieve and stored in sealed containers at ~4°C in the dark during the trial. Stocks of the treatment solutions were diluted with tap water to the following extract concentrations: 0 % (100% water, the control treatment), 25%, 50% and 100% (undiluted extract). The non-zero dilutions were chosen to span the range from a high concentration based on considerable mulch leaching due to high rainfall to concentrations in which mulch leachates would be significantly lower. Four replicates were used for each treatment, with each replicate consisting of one pot with four plants for lettuce and two plants for echinacea, and the pots were laid out in a completely randomised design. The experiment was conducted in the glasshouse conditions reported for experiment two (see section 7.2.2). The lettuce seedlings were prepared using the method outlined above (section 7.2.2) and the echinacea seedlings were those used in the field trial reported in Chapter 4 (section 4.2.2). Seedlings were planted into small black plastic pots (100 mm top diameter, 75 mm base diameter, 85 mm high) containing a sand:perlite:peat (1:1:1) potting medium, and placed in 100 mm diameter × 12 mm high plastic saucers. Lettuce was planted at four seedlings per pot and echinacea was planted at two seedlings per plot. A general fertiliser (Aquasol®, analysis: nitrogen 23%,
Chapter 7 Effect of mulches on crop growth and lettuce bolting
166
phosphorus 4%, potassium 18%, zinc 0.05%, copper 0.06%, molybdenum 0.0013%, manganese 0.15%, iron 0.06%, boron 0.011%) was diluted to 1 g/1 L tap water and 40 ml of the solution applied to each pot. No further fertiliser was applied to the seedlings during the trials. The extract solutions were applied at 120 ml at the beginning of the trial and then weekly for 4 weeks for lettuce or 8 weeks for echinacea. Supplementary irrigation was provided every 3 – 4 days where necessary (e.g. the controls) using tap water. Measurements and statistical analysis
The osmotic potential and pH of the mulch extract solutions were measured using a Wescor 5500 Vapour Pressure Osmometer and an Activon 210 pH meter respectively. The instruments were calibrated using standard solutions of known values. The extract solutions were measured at the beginning of each experiment, with two readings made for each solution and all readings carried out in a randomised order. Seedling height was measured at weekly intervals and the final dry weight biomass was determined at 5 WAP for lettuce and 9 WAP for echinacea using the procedures described in section 7.2.2. Statistical analyses were carried out using GLMs for measurements made at a single time point and GLMMs for measurements repeated over time. Changes in seedling height were analysed using linear regression and the effect of mulch extract concentration on seedling height and biomass at harvest was modelled using non-linear least squares regression. The analyses were carried out using the methods described in previous chapters. An inverted rectangular hyperbolic function (Thornley and Johnson 1990)
Concbbay
+=
* Equation 7.1
was used, where y is the seedling growth response variable (i.e. height or biomass), Conc is the concentration of the mulch extract, a is the maximum value of y, and b is the Conc at which y is 50% of the lower asymptote.
7.3 Results
7.3.1 Effects of mulch on soil and crop parameters in the field
Nutrient analysis of lettuce
The leaf tissue nutrient analyses of lettuce and echinacea were carried out on plant material from field trials at Yarrowitch in 1999 and Kirby in 2001 in order to evaluate possible relationships between the applied weed control treatments and the level of various plant nutrients at harvest. The effects of trial and treatment and the trial × treatment interaction were analysed using GLMs and the factors that were significant are reported here. It was assumed that the soils at Yarrowitch and Kirby would have different soil nutrient concentrations, and this was verified by the soil tests shown in Figure 4.1. Those differences would be expected to influence the leaf tissue leaf nutrient concentrations measured at the two locations, regardless of treatment effects. Therefore, the site differences are not of primary interest. Lettuce leaf nutrient concentrations that were significantly different between treatments are listed in Table 7.1. Leaf nitrogen concentrations were lowest in the paper mulch plots (P < 0.001) and similar in the other treatments, except that hay mulch was slightly higher than the control (P = 0.027). Leaf phosphorus was highest in the paper mulch treatment (P < 0.001) while the other treatments had similar levels of phosphorus. The hay and paper mulches produced lettuces with higher leaf potassium concentrations than the other treatments (P < 0.001) and leaf calcium was lower in the cultivated treatments (i.e. hand weeding and tillage) than the uncultivated treatments (P = 0.035). The concentration of magnesium was lower in the mulch treatments compared with
Chapter 7 Effect of mulches on crop growth and lettuce bolting
167
the control (P = 0.027), but was similar to the hand weeding and tillage treatments. Sodium concentrations were significantly lower for both mulches compared with the other treatments (P ≤ 0.001), with hay mulch being lower than paper mulch (P = 0.003). Leaf manganese was higher in the control (P = 0.045) while the other treatments were equivalent, and leaf iron was lower in the control and hay mulch compared to paper mulch, tillage and hand weeding (P < 0.001). The variation in leaf nutrient concentrations between trials generally did not match the variation found in the soil tests (see Chapter 4); only sulphur and iron had a similar pattern. Table 7.1 Lettuce leaf tissue concentration of nitrogen, phosphorus, potassium, calcium, magnesium, sodium, manganese and iron in response to the weed control treatments. The mean concentration of each treatment at both field sites (n = 8) is given with the standard error of the means in brackets. Mean nutrient concentration in lettuce leaf tissue (standard error) Weed control treatment
Nutrient (units) Control Hand weeding Tillage Hay mulch Paper mulch
There were no significant interactions between trial and treatment for any nutrient (P ≥ 0.068), except sodium (P = 0.001). The lack of significant interactions indicates that the treatment effects were consistent in both trials. In the case of sodium, leaf concentrations were significantly greater (P < 0.001) for hand weeded plots at Yarrowitch (0.70%) compared with Kirby (0.44%), but significantly lower (P < 0.001) for mechanically tilled plots at Yarrowitch (0.38%) than at Kirby (0.64%). The relationship between lettuce value (expressed in $1,000/ha) and leaf nutrient concentration was analysed using linear regression. The correlation with lettuce value and leaf nutrients was low for all nutrients (r2 ≤ 0.33), although leaf nitrogen concentration was positively correlated with lettuce value at Yarrowitch and Kirby and phosphorus was negatively correlated at Yarrowitch only (Pslope ≤ 0.007) (Figure 7.1). Lettuces in the paper mulch had low leaf nitrogen and low production, while the control had low production but similar nitrogen levels to the other treatments. Hay mulch had higher nitrogen contents and crop value. Hand weeding and tillage produced similar nitrogen concentrations although the crop values were higher in the former treatment. Leaf phosphorus concentrations were similar for all treatments except that lettuces under paper mulch at Yarrowitch had higher leaf phosphorus and generally lower lettuce values. A similar, though non-significant, trend was observed at Kirby. However, at Kirby, hand weeded lettuces had high value and high phosphorus levels.
Chapter 7 Effect of mulches on crop growth and lettuce bolting
168
A
0
5
10
15
20
25
30
0 1 2 3 4 5
Yarrowitch 1999
0 1 2 3 4 5
Kirby 2001
Leaf nitrogen concentration (%)
Lettu
ce v
alue
($1,
000/
ha)
ControlHand weedingTillageHay mulchPaper mulch
B
0
5
10
15
20
25
30
0.2 0.3 0.4 0.5
Yarrowitch 1999
0.2 0.3 0.4 0.5
Kirby 2001
Leaf phosphorus concentration (%)
Lettu
ce v
alue
($1,
000/
ha)
ControlHand weedingTillageHay mulchPaper mulch
Figure 7.1 The relationship between lettuce value ($1,000/ha) and (A) nitrogen and (B) phosphorus leaf concentrations (%) at Yarrowitch and Kirby. The solid lines are the linear regression curves, the dashed lines are the 95% confidence limits and the symbols indicate the data points for each weed control method (× = the control, / = hand weeding, . = tillage, , = hay mulch and + = paper mulch). Nutrient analysis of echinacea
The analysis of the results from the echinacea leaf nutrient tests using GLMs indicated that a number of nutrients varied significantly by weed control treatment. The nutrients that were significant are shown in Table 7.2. Most trial × treatment interactions were not significant (P ≥ 0.072), with the exception of carbon (P = 0.040), manganese (P = 0.002) and aluminium (P = 0.005).
Chapter 7 Effect of mulches on crop growth and lettuce bolting
169
Table 7.2 Echinacea leaf tissue concentrations of potassium, sodium, manganese, iron, zinc, copper and aluminium in response to the weed control treatments. The mean concentration of each treatment at both field sites (n = 8) is given with the standard error of the means in brackets. Mean nutrient concentration in echinacea leaf tissue (standard error) Weed control treatment
Nutrient (units) Control Hand weeding Tillage Hay mulch Paper mulch
In order to relate these variations to crop growth, and thus identify relevant effects, an analysis of the relationship between echinacea value and the nutrients listed in Table 7.2 was carried out using linear regression. Sodium, manganese and zinc were negatively related to crop value in one trial each, Kirby, Yarrowitch and Kirby respectively (Figure 7.2) (Pslope ≤ 0.001), although the correlations were low (r2 = 0.42, 0.35 and 0.42 respectively). The graphs in Figure 7.2 show that, for each nutrient, the hand weeding and hay mulch treatments had lower leaf nutrient concentrations and higher crop values; conversely, the control had higher concentrations and lower crop values, while the paper mulch and tillage treatments were intermediate in each case.
Chapter 7 Effect of mulches on crop growth and lettuce bolting
170
A
0
5
10
15
20
25
0.0 0.005 0.010 0.015 0.020 0.025 0.030
Leaf sodium concentration (%)
Ech
inac
ea v
alue
($1,
000/
ha)
ControlHand weedingTillageHay mulchPaper mulch
B
0
10
20
30
40
50
60
0 20 40 60 80 100 120 140
Leaf manganese concentration (µg/g)
Ech
inac
ea v
alue
($1,
000/
ha)
ControlHand weedingTillageHay mulchPaper mulch
C
0
5
10
15
20
25
0 10 20 30 40 50
Leaf zinc concentration (µg/g)
Ech
inac
ea v
alue
($1,
000/
ha)
ControlHand weedingTillageHay mulchPaper mulch
Figure 7.2 The relationship between echinacea value ($1,000/ha) and (A) sodium, (B) manganese and (C) zinc leaf concentrations (%) at Kirby, Yarrowitch and Kirby respectively. The solid lines are the linear regression curves, the dashed lines are the 95% confidence limits and the symbols indicate the data points for each weed control method (× = the control, / = hand weeding, . = tillage, , = hay mulch and + = paper mulch).
Chapter 7 Effect of mulches on crop growth and lettuce bolting
171
Nutrient analysis of mulches
The results from the chemical analysis of the mulches used in the field trials at Kirby in 2001 are given in Table 7.3. The difference in C:N ratios between the two mulches was very large and likely to be biologically significant. Table 7.3 Carbon and nitrogen content (%) of the hay and paper mulches and the derived carbon:nitrogen ratio. The values are an average of two pseudo-replicates for each mulch type. Mulch Carbon content (%) Nitrogen content (%) Carbon:Nitrogen ratio Hay 49.36 1.27 38.9 Paper 37.50 0.22 170.5
Soil moisture
The effect of the weed control treatments on soil moisture during the latter part of the echinacea field trial at Kirby in 2001 is presented in Figure 7.3. The graph indicates that the hay mulch generally had the highest soil moisture levels, followed by the paper mulch, while tillage had the lowest soil moisture levels and hand weeding the second lowest. The control was intermediate between those groups, tending towards the mulches when conditions were wetter and towards the cultivated (i.e. hand weeding and tillage) treatments when conditions were drier.
5
10
15
20
25
11 12 13 14 15 16 17 18 19 20
Weeks after planting echinacea
Soi
l moi
stur
e (%
)
ControlHand weedingTillageHay mulchPaper mulch
Figure 7.3 Variation of soil moisture during the echinacea trial at Kirby in 2001 (31/1/01 – 31/3/01) in response to weed control treatment. The averaged data for each treatment are shown by the following line types: large dashes = control, solid grey, = hand weeding, dots = tillage, small dashes = hay mulch, solid black = paper mulch. The vertical lines across the top of the graph are the standard errors of each time point. In order to compare the treatments statistically, the time points with the highest (11.9 and 16.6 WAP) and lowest (15 and 18 WAP) soil moisture levels were selected from Figure 7.3 to represent wetter and drier times. The subset of the soil moisture data was analysed for weed control
Chapter 7 Effect of mulches on crop growth and lettuce bolting
172
treatment effects using GLMs and the data are presented in Figure 7.4. Only one wet and dry time points are reported as the results were similar within each moisture category. The weed control treatments were significantly different in both wetter and drier conditions (P < 0.001), with soil moisture being greater in the mulched plots compared with the cultivated and control treatments (P ≤ 0.001). There was no difference between the hay and paper mulches (P = 0.081 and 0.343 for wetter and drier conditions respectively), nor between the cultivated treatments (P ≥ 0.442). The control was similar to the cultivated plots in drier conditions (P = 0.512), but was similar to the mulched plots in wetter conditions (P = 0.211).
Control
Hand weeding
Tillage
Hay mulch
Paper mulch
Wetter (11.9 WAP)
Control
Hand weeding
Tillage
Hay mulch
Paper mulch
Drier (15 WAP)
5 10 15 20 25
Soil moisture (%)
Wee
d co
ntro
l tre
atm
ent
Figure 7.4 Variation of soil moisture in response to the weed control treatments at wetter and drier time points in the echinacea trial at Kirby in 2001. The wetter period refers to data recorded at 11.9 WAP and the drier period refers to data from 15 WAP. The black dots show the mean of each treatment at each time point and the error bars indicate the standard error of the means. Soil temperature
Soil temperature was recorded during the latter half of the echinacea field trial at Kirby in 2001. These results are shown in Figure 7.5A and the rainfall for the same period is shown in Figure 7.5B. The ambient air temperature shown at the bottom of Figure 7.5A indicates that soil temperature fluctuations were similar to air temperature fluctuations. These graphs indicate that the hay and paper mulches had lower diurnal fluctuations compared with the hand weeded and tilled plots. The unweeded control plots showed an intermediate response between the mulched plots and the cultivated plots, although from 15 WAP onwards the controls had similar daily variation to the mulches, probably due to the moderating effects of the dense weed cover. The differences between treatments were less pronounced after rain had fallen (e.g. 16 WAP).
Chapter 7 Effect of mulches on crop growth and lettuce bolting
173
A
010
2030
Control
0102030
Hand weeding
0102030
Tillage
0102030
Hay mulch
0102030
Paper mulch
0102030
Ambient air temperature
11 12 13 14 15 16 17 18 19 20
Weeks after planting echinacea
Soil
tem
pera
ture
(°C
)
B
0
5
10
15
20
25
30
11 12 13 14 15 16 17 18 19 20
Weeks after planting echinacea
Rai
nfal
l (m
m)
Figure 7.5 A: Diurnal soil temperature in response to weed control treatments used in the echinacea trial at Kirby for the period 6/2/01 to 31/3/01. The bottom graph shows the variation in ambient air temperature at the field site. The lines indicate the temperature (°C) recorded at 0.5 hour intervals. Data was not recorded during week 14 due to a power failure in the data-logger. B: Mean daily rainfall at Kirby for the period 6/2/01 to 31/3/01. The soil temperature data were summarised by determining the average daily maxima and minima during the recording period and the average daily amplitude in temperature variation was calculated (Figure 7.6). The summarised data were analysed using GLMs to evaluate the effects of the weed control treatment. The analysis confirmed that the hay and paper mulches significantly reduced the amplitude of diurnal fluctuation compared with the other treatments (P = 0.002), and that the unweeded control had less variation than the cultivated plots (P = 0.004). Hay mulch had
Chapter 7 Effect of mulches on crop growth and lettuce bolting
174
the lowest fluctuation (P = 0.001). The average minima for hand weeding and tillage were lower than the other treatments (P = 0.017) and the average maxima were greater (P < 0.001).
10
14
18
22
26
Control Hand w eeding Tillage Hay mulch Paper mulchWeed control treatment
Dai
ly s
oil t
empe
ratu
re ra
nge
(°C
)
Figure 7.6 Daily soil temperature range (°C) in response to weed control treatments used in the echinacea trial at Kirby averaged across the period 6/2/01 to 31/3/01. The bottom of the columns represents the mean minimum daily soil temperature and the top of the columns represents the mean maximum daily soil temperature. The error bars show the standard error of the means. The length of the columns indicates the average diurnal variation in soil temperature.
7.3.2 Mulch and fertiliser (glasshouse trial)
Soil moisture
Soil moisture in the pots was recorded approximately weekly during the growing period to quantify the ability of the mulches to retain soil moisture (Figure 7.7). The results for the +FERT and – FERT treatments were pooled because the response patterns were very similar for each mulch treatment. Analysis of variance confirmed that fertiliser effects were non-significant (P = 0.108), as was the mulch × fertiliser interaction (P = 0.203). However, the mulch treatments were significantly different (P = 0.006). Inspection of the means and standard errors shows that hay mulch (17.2 ± 0.9%) and paper mulch (14.8 ± 0.7%) had similar soil moisture across the trial period, and that the control was significantly lower (11.7 ± 0.6%).
Chapter 7 Effect of mulches on crop growth and lettuce bolting
175
0
5
10
15
20
25
30
0 1 2 3 4 5
Control
0 1 2 3 4 5
Hay mulch
0 1 2 3 4 5
Paper mulch
Weeks after planting lettuce
Soi
l moi
stur
e (%
)
Figure 7.7 Soil moisture (%) in response to the mulch treatments in the glasshouse, with the +FERT and -FERT treatments pooled. The circles show the data points and the solid lines are the loess (locally weighted regression) curves. Lettuce height and biomass at harvest
The growth of lettuce seedlings in response to the mulch and fertiliser treatments used in the glasshouse trial was analysed using AOV and the mean height and dry weight biomass at harvest are presented in Figure 7.8. Lettuce height and biomass were significantly different for the mulch treatments (P ≤ 0.010) and the fertiliser treatments (P ≤ 0.004), however the mulch × fertiliser interaction was significant for biomass (P = 0.031) but not height (P = 0.801). The lettuces were tallest in the hay mulch, 175 mm (P = 0.006), followed by the paper mulch and the control, which had the same height, 153 mm, averaged across fertiliser treatments. The control differed from the mulches (P = 0.008), but the mulches responded in a similar way to each other (P = 0.745). The +FERT treatments averaged 170 mm across treatments, while the -FERT treatments averaged 150 mm. Lettuce biomass in the hay mulch, 3.6 g/pot, was significantly greater (P ≤ 0.016) than the control and paper mulch. The paper mulch and control had similar yields (P = 0.764), averaging 2.6 and 2.2 g/pot respectively. Averaged across mulch treatments, the +FERT treatment 3.0 g/pot produced greater lettuce biomass than the -FERT treatment 2.4 g/pot. The interaction term was significant because paper mulch had a significantly different response (P = 0.013) by failing to show an increase in biomass compared with hay mulch and the control, which both increased by about 0.8 g/pot.
Chapter 7 Effect of mulches on crop growth and lettuce bolting
176
A B
0
50
100
150
200
Control Hay mulch Paper mulchMulch treatment
Lettu
ce h
eigh
t (m
m)
-FERT +FERT
0
1
2
3
4
5
Control Hay mulch Paper mulchMulch treatment
Lettu
ce b
iom
ass
(g/p
ot) -FERT
+FERT
Figure 7.8 Variation in lettuce (A) height (mm) and (B) dry weight biomass (g/pot) in response to the mulch and fertiliser treatments in the glasshouse. The white columns represent the unfertilised (-FERT) treatment and the grey columns represent the fertilised (+FERT) treatment. The columns show the mean of each treatment combination and the error bars show the standard error of the mean.
7.3.3 Mulch aqueous extracts (glasshouse trial)
Osmotic potential and pH of mulch extract solutions
There was no difference in the osmotic potential (OP) or pH of the mulch extract solutions between the two trials (2000 and 2001, P = 0.241), therefore those data were averaged. The variation in OP and pH for the extract solutions was significant (P < 0.001) (Figure 7.9). Hay mulch extract had a significantly lower pH than paper mulch and the controls (i.e. 0% concentration) at the 50% and 100% concentrations (P ≤ 0.025), and a significantly higher OP only at the 100% concentration (P < 0.001). The pH and OP for paper mulch did not differ from the control treatments (P ≥ 0.376). A B
0
20
40
60
80
100
0 25 50 75 100Mulch extract concentration (%)
Osm
otic
pot
entia
l (m
mol
/kg)
HayPaper
5.5
6.0
6.5
7.0
7.5
0 25 50 75 100Mulch extract concentration (%)
pH
HayPaper
Figure 7.9 The osmotic potential (mmol/kg) (graph A) and pH (graph B) of the hay mulch (solid line) and paper mulch (dashed line) extract solutions. The lines indicate the mean response of each extract concentration, averaged across the two trials, and the error bars show the standard error of the means. Lettuce growth
An analysis of lettuce height over time using GLMMs indicated that the effects of trials (2000 versus 2001), mulch type, mulch extract concentration and all 2- and 3-way interactions were significant (P ≤ 0.010). The terms involving trials were not of specific interest but were included for a complete analysis. Variations in response between trials may be related to climatic differences or year-by-year differences in the composition of the mulches, especially the hay mulch.
Chapter 7 Effect of mulches on crop growth and lettuce bolting
177
A linear regression of lettuce height against time (Figure 7.10) shows that, in 2000, lettuce growth had a significant positive slope for the control treatments, the 25 and 50% paper mulch extracts and the 25% hay mulch extract (Pslope < 0.001). Hay mulch extract at 50% and paper mulch at 100% had non-significant slopes (Pslope = 0.459 and 0.326 respectively) indicating an inhibition of lettuce growth, and the 100% hay mulch extract had a significant negative slope (Pslope < 0.001) indicating strong inhibition. In 2001, the response pattern was similar, except that the 50% hay mulch extract had a significant negative slope (Pslope < 0.001), suggesting that this concentration was more inhibitory than in 2000.
A
y = 11.37 + (8.596x)
0
20
40
60
80
100
1200% extractHay mulch
y = -8.97 + (14.279x)
25% extractHay mulch
y = 9.13 + (-0.154x)
50% extractHay mulch
y = 7.49 + (-1.872x)
100% extractHay mulch
y = 12.35 + (9.352x)
0
20
40
60
80
100
1200% extract
Paper mulch
0 2 4
y = 6.78 + (9.519x)
25% extractPaper mulch
0 2 4
y = -2.44 + (11.12x)
50% extractPaper mulch
0 2 4
y = 12.01 + (-0.688x)
100% extractPaper mulch
0 2 4
Weeks after planting lettuce (2000 trial)
Lettu
ce h
eigh
t (m
m)
B
y = 52 + (8.688x)
0
20
40
60
80
100
1200% extractHay mulch
y = 42.28 + (6.781x)
25% extractHay mulch
y = 45.91 + (-2.594x)
50% extractHay mulch
y = 36.88 + (-7.938x)
100% extractHay mulch
y = 47.03 + (8.344x)
0
20
40
60
80
100
1200% extract
Paper mulch
0 2 4
y = 48.31 + (6.812x)
25% extractPaper mulch
0 2 4
y = 40.94 + (9.125x)
50% extractPaper mulch
0 2 4
y = 50.62 + (1.75x)
100% extractPaper mulch
0 2 4
Weeks after planting lettuce (2001 trial)
Lettu
ce h
eigh
t (m
m)
Figure 7.10 Lettuce height (mm) over time in response to the hay and paper mulch extract concentration in 2000 (graph A) and 2001 (graph B). The circles show the data points, the solid lines are the linear regression curves, the dotted lines are the 95% confidence limits, and the equations describe the regression for each mulch type. The effects of the treatments on lettuce height and biomass at harvest (5 WAP) were analysed using GLMs and mulch type, extract concentration and the mulch type × extract concentration interaction were all found to be significant for both growth variables (P < 0.001). Trial differences were significant for height but not biomass (P < 0.001 and P = 0.675 respectively). The response of lettuce seedling biomass to increasing mulch extract concentrations is shown in Figure 7.11 and the
Chapter 7 Effect of mulches on crop growth and lettuce bolting
178
response pattern for seedling height was generally similar. The hyperbolic regression parameter b (concentration at 50% of lower asymptote) was significantly lower (P < 0.001) for hay mulch (average b = 32%) than paper mulch (average b = 92%) in both trials, indicating that the inhibitory effects of hay mulch extract were considerably greater at lower concentrations.
y = 7.2 * 22.8 / (22.8 + x)
0
2
4
6
8
10Hay mulch2000 trial
y = 7.1 * 76 / (76 + x)
Paper mulch2000 trial
y = 6.1 * 40.1 / (40.1 + x)
0
2
4
6
8
10Hay mulch2001 trial
0 20 40 60 80 100
y = 6.2 * 107.4 / (107.4 + x)
Paper mulch2001 trial
0 20 40 60 80 100
Mulch extract concentration (%)
Lettu
ce b
iom
ass
(g/p
ot)
Figure 7.11 Lettuce biomass (g/pot) at harvest, 5 WAP, in response to the hay and paper mulch extract concentrations in 2000 and 2001. The circles show the data points, the solid lines are the hyperbolic regression curves, the dotted lines are the 95% confidence limits, and the equations describe the regression for each mulch type. Echinacea growth
The effect of the mulch type, extract concentration and the interaction of mulch type × extract concentration on echinacea seedling height was analysed using GLMMs and all terms were significant (P ≤ 0.006). A linear regression of seedling height against time (Figure 7.12) indicated that echinacea growth was reduced by hay mulch extract at the 25, 50 and 100% concentrations (Pslope < 0.001), with the slope coefficient decreasing with increasing extract concentration. Paper mulch extract only reduced echinacea height at the 100% concentration (Pslope < 0.001), while at lower concentrations, growth was generally equivalent to the control.
Chapter 7 Effect of mulches on crop growth and lettuce bolting
179
y = 57.9 + (2.137x)
0
20
40
60
80
1000% extractHay mulch
y = 67.04 + (-3.539x)25% extractHay mulch
y = 76.1 + (-4.718x)50% extractHay mulch
y = 77.67 + (-9.626x)100% extractHay mulch
y = 61.45 + (1.34x)
0
20
40
60
80
1000% extract
Paper mulch
0 2 4 6 8
y = 56.11 + (1.312x)25% extractPaper mulch
0 2 4 6 8
y = 62.41 + (0.512x)50% extractPaper mulch
0 2 4 6 8
y = 63.83 + (-3.488x)100% extractPaper mulch
0 2 4 6 8
Weeks after planting echinacea
Ech
inac
ea h
eigh
t (m
m)
Figure 7.12 Echinacea height (mm) over time in response to the hay and paper mulch extract concentration in 2001. The circles show the data points, the solid lines are the linear regression curves, the dotted lines are the 95% confidence limits, and the equations describe the regression for each mulch type. Analysis using GLMs indicated that the effects of mulch type, extract concentration and the interaction of mulch type × extract concentration were significant for height and biomass (P < 0.001). The response of echinacea seedling biomass at harvest (9 WAP) to increasing mulch extract concentrations is shown in Figure 7.13 and the response patterns for echinacea seedling height at harvest were very similar. The hyperbolic regression parameter b was significantly lower (P < 0.001) for hay mulch (8.5 %) than for paper mulch (62.8%). Like lettuce, this indicates that the inhibitory effects of hay mulch extract were considerably greater at lower concentrations.
Chapter 7 Effect of mulches on crop growth and lettuce bolting
180
y = 1.2 * 8.5 / (8.5 + x)
0.0
0.5
1.0
1.5Hay mulch
0 20 40 60 80 100
y = 1.1 * 62.8 / (62.8 + x)
Paper mulch
0 20 40 60 80 100
Mulch extract concentration (%)
Ech
inac
ea b
iom
ass
(g/p
ot)
Figure 7.13 Echinacea biomass (g/pot) at harvest, 9 WAP, in response to the hay and paper mulch extract concentration. The circles show the data points, the solid lines are the hyperbolic regression curves, the dotted lines are the 95% confidence limits, and the equations describe the regression for each mulch type.
7.4 Discussion
7.4.1 Effects of mulch on soil and crop parameters in the field
Nutrient analysis of lettuce and echinacea
The soils at Yarrowitch and Kirby had different soil nutrient concentrations and are, therefore, likely to have caused different crop growth responses. Consequently, the differences in leaf nutrient concentrations between the two trials are not discussed here. The analysis of leaf tissue nutrients in lettuce identified eight elements that varied significantly between the weed control treatments. Apart from nitrogen and phosphorus, these nutrients did not show a strong correlation with yield. For example, potassium levels were high in both the hay and paper mulch at both Yarrowitch and Kirby compared with the other treatments, however, hay and paper mulch had widely differing lettuce yields in both trials. Conversely, hay mulch and the control had similar iron levels and were significantly lower than the other treatments, despite the hay mulch and control having very different yields. The focus of this trial was to identify unique effects by paper mulch and it would appear that only leaf nitrogen and phosphorus showed a response that was related to yield and that could be attributed to a consistent treatment effect. Leaf nitrogen was significantly lower in paper mulch than the other treatments, while leaf phosphorus was significantly higher. The correlation between these two nutrients and yield was low (r2 ≤ 0.33). However, the slopes (Pslope ≤ 0.007) were significant for both nutrients in the Yarrowitch trial and for nitrogen only at Kirby. Nitrogen had a positive relationship with lettuce yield, with paper mulch having the lowest yields and the lowest leaf nitrogen concentrations. The
Chapter 7 Effect of mulches on crop growth and lettuce bolting
181
average concentration for both trials was 2.1%, well below the recommended range for lettuce of 3.0 – 4.5% reported by Piggot (1997), and below the deficiency range of 2.8 – 3.0% (Piggot 1997). This suggests that nitrogen uptake by plants under paper mulch was depressed and that adequate growth was not achieved as a consequence. In contrast, all other weed control treatments were within or slightly below the recommended range, averaging between 2.8% and 3.4%. The control also had low yields, but moderate nitrogen levels, so that treatment’s yield losses were more likely due to other factors, presumably weed competition. Phosphorus was negatively correlated with lettuce yield at Yarrowitch. The leaf phosphorus concentration for paper mulch in that trial was 0.38%, slightly below the recommended range of 0.40 – 0.65% but above the critical limit of 0.30% (Piggot 1997). This indicates that the higher phosphorus levels in the paper mulch treatment were possibly sub-optimal, but clearly not toxic. However, the other treatments, including the high-yielding hay mulch and hand weeding, had even lower concentrations, between 0.29% and 0.32%. But despite the lower phosphorus levels in the other treatments, the yields were higher. It is possible that all treatments took up similar amounts of phosphorus, and the treatments with lower yields had higher concentrations due to their lower biomass (P. Lockwood, pers. comm.). The control also had low yields, but it was associated with both low nitrogen and low phosphorus, an outcome that could be expected in response to strong weed competition. It would appear that the differences in P concentrations do not account for the poor yield of the paper mulch plots. Several leaf nutrients were found to vary significantly in response to the weed control treatments in the echinacea trials. Three of those nutrients showed a negative correlation with echinacea – sodium, manganese and zinc, each in one trial only. However, inspection of the plots (Figure 7.2) indicated that paper mulch had moderate concentrations of these nutrients which were not significantly different from, for example, the high-yielding hand weeding treatment. The negative correlation is thought to be due to a dilution of these nutrients in the larger plants and a concentration in the smaller plants based on differences in overall growth, rather than direct modification of nutrient uptake by the crop in response to the various treatments. Therefore, it is suggested that the leaf nutrient analysis of echinacea did not identify any important effects related to yield depression in response to the paper mulch. Nutrient analysis of mulches
The difference in C:N ratios between the two mulches was very large, with 39 for hay and 171 for paper. Other researchers have determined that Lolium spp., the dominant species in the hay mulch, have C:N ratios in the range of 34 – 56 (Odhiambo and Bomke 2001, de Neergaard et al. 2002), while paper products have a ratio of between 130 – 800 (Rodale 1960, NRAES 1992). The difference in the C:N ratio is likely to be biologically significant. A C:N ratio of around 25 – 30 is commonly considered to be the threshold above which net immobilisation of nitrogen will occur (Allison 1966, Odhiambo and Bomke 2000). The paper mulch was composed primarily of newspaper and was amended with worm castings, however, the contribution of nitrogen in the castings was insufficient to balance the carbon and nitrogen effectively and thus reduce nitrogen immobilisation. The differences in particle size, loading rate and contact area with the soil surface would also have increased the likelihood of nitrogen immobilisation (Wagger et al. 1998) by paper mulch compared with hay mulch. The paper mulch had much smaller particle sizes, was applied at a weight four times greater, and might be expected to have almost 100% contact with the soil surface. Organic materials are likely to contain some indigenous microorganisms (i.e. those present on the material immediately prior to usage) and these microbes may be responsible for a large proportion of the microbial decomposition (Parr and Papendick 1978). Although this was not tested, it is possible that the paper mulch had less indigenous microorganisms than the hay mulch. The former was processed in a factory using heat and compression, may have contained some toxic components (e.g. inks) and was stored in woven plastic bags in closed sheds, whereas the hay mulch was field grown and stored as bales in a hay shed with no walls, and was in contact with bare soil and a mixture of grasses and broadleaf plants.
Chapter 7 Effect of mulches on crop growth and lettuce bolting
182
Soil moisture
Soil moisture was greatest under the hay and paper mulches, with the cultivated hand weeded and tillage plots having the lowest soil moisture levels and the unweeded control being intermediate. Soil moisture in the control treatment was higher than the cultivated treatments in wetter conditions and similar to the mulched plots after rain. This suggests that total water loss (including transpiration) in the weedy control plots was reduced compared with the evaporation rate from the hand weeded and tilled plots in wetter conditions. However, in drier conditions, the soil moisture in the control treatment was similar to the cultivated treatments, implying that transpiration by weeds may have caused a larger reduction in soil moisture than in wetter conditions, regardless of a mulching effect (Murphy and Lodge 2001). The results for soil moisture are consistent with the published literature, i.e., that mulches generally conserve moisture (Munn 1992, Monks et al. 1997) and that cultivation of soil reduces soil moisture (Corbin and Pratley 1994). However, Unger (2001) reported a contrary finding in a field trial using paper pellet mulch. He found that the paper pellets did not increase soil moisture levels, rather that the mulch reduced water entry into soil and increased evaporative losses directly from the pellets. He also reported that the trials was conducted in a semi-arid region (annual rainfall ≈ 475 mm) with storms that yield only small amounts of rainfall (Unger 2001). In contrast, annual rainfall at Yarrowitch and Kirby is about 1300 mm and 790 mm respectively, and during the summer period when the trials were carried out, monthly rainfall was in excess of 50 mm and sometimes greater than 100 mm. Differences in the paper pellet mulch formulation, not specified by Unger (2001), may also have contributed to the different responses. The wetter soil under paper mulch is unlikely to have caused the poor yield observed in echinacea at Kirby because the high-yielding hay mulch treatment had similar soil moisture levels, and high-yielding hand weeded plots had significant lower soil moisture levels. Paper mulch sometimes had lower soil moisture levels than hay mulch during wetter periods (e.g. 12 and 19 WAP, Figure 7.3). Other factors
The field results presented in Chapter 4 (Figures 4.8C and 4.11C) indicate that weed levels were low for paper mulch, hay mulch and hand weeding. Therefore, it is unlikely that the lower yields in the paper mulch treatments were due to weed competition given that the hay mulch and hand weeding treatments had high yields. Herbivory was not quantitatively assessed, although casual observation at each harvest revealed almost no leaf damage in any treatment in all trials apart from some minor slug infestation and damage in the hay mulch treatment at Yarrowitch in 1999, due to Deroceras reticulatum (HYPP 1998). Soil aeration and oxygen diffusion were not measured, but the soil moisture results indirectly suggest that poor soil aeration was not a problem under the paper mulch. In addition, the ratio of shoot biomass to root biomass (Figure 4.20) for paper mulch was not significantly different to the hay mulch, hand weeding or tillage treatments. Although soil pH in the field trials was not tested, the paper mulch extract solutions were in the range 6.5 – 7.3, not significantly different to the water control even at the 100% extract concentration, suggesting that acidification of the soil by the paper mulch may have been unlikely to have occurred. Smith et al. (1998) found that the solution pH of potting medium was within the recommended range for acceptable plant growth for pots mulched with paper pellets. The indirect evidence indicates that these soil parameters were not unfavourable for root growth (and, therefore, whole plant growth) under the paper mulch. The effect of mulch phytotoxins on lettuce and echinacea growth is discussed in section 7.4.3. Soil temperature and bolting
Ideally, soil temperature should have been measured in the lettuce plots to get direct correlation with lettuce bolting. However, practical limitations prevented the use of the recording equipment in the lettuce trial area. While a direct correlation would be more desirable, it is expected that the treatment effects observed on soil temperature would be fairly similar regardless of crop (Stirzaker et al. 1995, Matitschka 1996, Tyler 1999), and the conclusions below are therefore justified.
Chapter 7 Effect of mulches on crop growth and lettuce bolting
183
Sutton (1998) found that annual ryegrass mulch grown in situ had the lowest diurnal temperature amplitudes compared with lupin (Lupinus angustifolius L), two species of clovers (Trifolium subterraneum L. and T. alexandrinum L.), shade cloth or bare soil in a weed control trial with no follow-up crop used. Bolting in lettuce, a quantitative long-day plant, is predominantly caused by high daily maximum temperatures, large fluctuations in diurnal temperature and/or longer daylengths (Waycott 1995, Napier 2001a). In these trials, daylength would not be expected to have varied between treatments. Hay and paper mulch had significantly lower daily maximum soil temperatures and diurnal variation and higher daily minimum soil temperatures compared with the hand weeding and tillage plots. These results are consistent with other research which has shown that organic mulches reduce both maximum daily soil temperature and the diurnal soil temperature amplitude (Munn 1992, Stirzaker et al. 1995, Olsen and Gounder 2001). The control plots had an intermediate soil temperature pattern, with larger diurnal variation initially, before weed cover and biomass had fully established. Later in the measurement period, the pattern for the control was similar to the mulched plots. Rainfall tended to reduce overall treatment difference, while drier periods heightened the differences, due to variation in thermal conductivity and heat (Bristow and Horton 1996, Horton et al. 1996). The trends observed for soil temperature closely parallel those recorded for bolting in Chapter 4 (Figure 4.15). No published reports on the effect of mulch on reducing lettuce bolting were identified, however, other vegetables have had reduced premature flowering when grown with soil coverings that reduced soil temperature, including pak choi (Brassica rapa L.) (Vogel and Flogel 1992), radicchio (Cichorium intybus L. var. silvestre Bisch.) (Rangarajan and Ingall 2001) and tomato (Price and Baughan 1985, Teasdale and Abdul-Baki 1997). It is likely that the high level of bolting observed in the bare, tilled plots (hand weeding and tillage) in all field trials was due to the induced changes in soil temperature compared with the covered, undisturbed plots (mulches and control).
7.4.2 Mulch and fertiliser (glasshouse trial)
Results from the glasshouse trial investigating the effect of hay and paper mulching and fertiliser on lettuce growth showed that lettuce height and biomass at harvest was significantly greater in hay mulch compared with the paper mulch and controls. Positive responses to the addition of ammonium nitrate fertiliser were observed for both lettuce height and biomass in all treatments except biomass in paper mulch. Adding fertiliser did not change the biomass of lettuce grown with paper mulch. Soil moisture was significantly lower in the control treatment, but equivalent in the hay and paper mulches. The higher growth under hay mulch compared with the control may be due to a nutrient effect based on the leaching of available nutrients from the mulch (Mason-Sedun and Jessop 1988, An et al. 1993, Umbers 1994) and/or a beneficial modification of the microclimate within the pot such as reduced evaporation (Bristow and Horton 1996, Kirnak et al. 2001). The soil moisture data in this trial suggest that the latter is likely, although nutrient leaching may have had an additional effect. The similarity in height and biomass for the control and paper mulch indicates that the higher soil moisture in paper mulch was of no apparent benefit and that other inhibitory factors may have been responsible for limiting yield. In parallel with the observations in the field trial, two possible reasons are nutrient immobilisation and leaching of phytotoxins. It was anticipated that supplementary fertiliser, i.e. the +FERT treatment, would overcome potential nitrogen immobilisation by the paper mulch, however that was not observed. The lack of positive response to fertiliser suggests that the quantity of nitrogen received (~ 45 kg/ha) may have been insufficient to overcome the effects of immobilisation. The use of a wider range of fertiliser doses and including pre-leached mulch treatments may have been more effective in confirming immobilisation. Nevertheless, it appears that the added nitrogen was not taken up by the seedlings under paper mulch as it was for the control and hay mulch.
Chapter 7 Effect of mulches on crop growth and lettuce bolting
184
The levels of phytotoxins leached from the mulch were not evaluated, and that mechanism for reducing lettuce growth cannot be excluded in this trial. However section 7.3.2 reports on a series of trials conducted using aqueous extracts of the hay and paper mulches, and a key finding is that the paper mulch was not phytotoxic except at very high concentrations. The lack of lettuce biomass response to the +FERT treatment for paper mulch compared with a positive response for hay mulch and the unmulched control indicates that nutrient availability may be more important (Kamara et al. 2000).
7.4.3 Mulch aqueous extracts (glasshouse trial)
Osmotic potential and pH of mulch extract solutions
The confounding of OP and allelopathic effects has been reported for bioassays using aqueous plant extracts, and recommendations have been made regarding adjusting the OP of the control treatment to match that of the plant extract solution (Wardle et al. 1992). The OP and pH were measured to determine the extent to which they varied from the control (water only). The OP and pH of paper mulch extract did not vary significantly as concentration increased, with similar levels as the control. In a nursery pot trial using paper pellet mulch, Smith et al. (1998) found that the container medium solution pH was within the recommended range for acceptable plant growth. Hay mulch extract had an increasing OP and decreasing pH as concentration increased. For OP, the 100% hay much extract concentration (about 90 mmol/kg) was significantly higher than the control and all other mulch extract solutions (average 30 mmol/kg). This OP is considered very high and it is possible that the observed negative seedling growth responses were strongly influenced by OP rather than phytotoxins (Bell 1974, Rietveld 1977). Hay mulch extract pH was significantly reduced at 50 and 100% (about 6.25 and 5.8 respectively) compared with the other solutions (average 6.75). While the first value is within the recommended soil pH range for lettuce production (i.e. 6.0 – 6.8, Wallace 2000), the second value may be slightly acidic for optimum lettuce growth. In New Zealand, echinacea has been grown successfully in soils with the pH ranging from 5.5 to 6.0 (Douglas 1993). Lettuce and echinacea growth
Paper mulch extracts only reduced lettuce and echinacea height at the 100% concentration, while in lower concentrations, the response was similar to the control. In contrast, hay mulch extracts mildly or strongly reduced lettuce height at 50% and 100% and echinacea height was reduced by hay mulch extract concentrations of 25% or more. Lettuce and echinacea biomass were similarly affected, with hay mulch extracts being about three times more suppressive for lettuce and six times more suppressive for echinacea (based on differences in the hyperbolic regression parameter, b). Other Australian research has indicated that ryegrass mulches may be phytotoxic. Aqueous extracts of perennial ryegrass suppressed growth of several pasture legumes in a laboratory bioassay (Halsall et al. 1995). Stirzaker and Bunn (1996) indicated that an annual ryegrass mulch reduced lettuce growth compared with an unmulched control in a pot trial, an effect attributed to phytotoxicity. However, the reduction was slight and a second experiment indicated that the ryegrass mulch considerably increased lettuce growth relative to the unmulched control. The clear findings of strong inhibition of seedling growth by hay mulch extracts and much weaker inhibition by the paper mulch extracts is the reverse of what was recorded in the field trials. In the field, hay mulch consistently produced high lettuce and echinacea yield while paper mulch commonly produced very low crop yields. The results provide evidence that the poor growth observed under paper mulch in the field was not due to the leaching of phytotoxins from the mulch. Despite a considerable volume of research using bioassays to determine the effect of organic residues and their extracts on plant germination and growth, several key problems remain with the interpretation of the results. In particular, the applicability of the results to the field setting (Wardle et al. 1998, Kamara et al. 2000) and the confounding of nutrient (and other) effects (Weidenhamer 1996, Inderjit and del Moral 1997) are cited as important limitations to bioassay results. For
Chapter 7 Effect of mulches on crop growth and lettuce bolting
185
example, Kamara et al. (2000) found that leaf extracts of several tropical tree species reduced corn germination and root and shoot growth in bioassays, but in pot and field experiments, corn grown in soil amended with mulch of the same tree species showed enhanced growth compared with corn grown in unamended soil. They suggest that allelochemicals were inactivated by soil microorganisms and that nitrogen supply and uptake were more important. The discrepancy between the data from the glasshouse experiment reported here and the data from field trials presented in Chapter 4 indicates that extrapolation of results from the bioassay to the field would be risky.
7.5 Conclusions
Causes of poor yields in the paper mulch treatment
The evidence provided by the leaf nutrient analysis in lettuce indicates that nitrogen was limiting under the paper mulch treatment, a likely outcome for a shallow rooted crop grown under mulch with a C:N ratio of 171. The results for echinacea did not show a similar trend, possibly due to the longer growing season and deeper root system of echinacea enabling that crop to access available soil nitrogen more effectively. Other factors such as weed competition, waterlogging, poor soil aeration, and unfavourable soil pH were either absent from the paper mulch plots or were not consistently related to yield across all treatments. It may be assumed that these factors do not explain the poor yield of crops grown with the paper mulch. The mulch-fertiliser pot trial confirmed that paper mulch was inhibitory to lettuce seedling growth and indicated that extra nitrogen did not benefit seedling growth, providing evidence of nitrogen immobilisation. The bioassay of hay and paper mulch extracts showed that paper was only mildly inhibitory, while hay was extremely inhibitory, indicating that it is unlikely that phytotoxins were responsible for depressed crop yields in the field. On balance, it is concluded that the paper mulch reduced crop yields by immobilising nitrogen rather than leaching phytotoxins. Although this mulch provided excellent weed suppression in the field, the cost of the material and the strong reduction in crop growth it caused make it a poor option for weed control in organic herb and vegetable production. Reformulation of the mulch with a considerably higher concentration of nitrogenous fertiliser may overcome the growth problem, however, it would probably make the product more expensive. Effects of weed control treatments on lettuce bolting
The trends observed for lettuce bolting in Chapter 4 closely paralleled those recorded for soil temperature in this chapter. A high level of bolting was observed in the bare, tilled plots (hand weeding and tillage) compared with the covered, undisturbed plots (mulches and control) in all field trials, due most probably to an increase in soil temperature maxima and diurnal fluctuations. This result does not appear to have been reported elsewhere in the published literature for lettuce. The reduction in bolting has practical implications for organic lettuce growers by reducing losses due to premature bolting and creating a longer period during which the crop can be harvested.
186
Chapter 8 General conclusion
8.1 Introduction
The research project reported in this thesis consisted of several related parts – a literature review, a survey of organic growers and a series of field and glasshouses experiments looking at various OWM methods. The project objectives were to gain an understanding of the current state of knowledge about OWM amongst organic herb and vegetable growers, to test some of the weed management practices in a specific setting (i.e. the New England Tablelands), and to explore issues about the effects of cover crops and mulches on weed crop growth. This chapter summarises the key findings of the project, highlights a number of implications for organic growers, and identifies future research needs arising from the project. The literature review considered the organic industry, the role of weeds in organic farming, the principles and practices of OWM, and the weed control methods used in organic herb and vegetable production. The production and weed management of lettuce and echinacea (the test crops used in the experimental work) were also reviewed. It was noted that organic agriculture is a small but growing sector of primary production in Australia and overseas that has historically developed through the enterprise and innovation of organic farmers and farmer groups, without financial and research support from commercial or government sources. The rapid industry growth has created a pool of less experienced growers and a keen demand for information about organic production methods, especially during the conversion phase. The review also highlighted the importance of weed management as a major constraint in organic agriculture, noting that OWM is often labour intensive and expensive, and is commonly reliant on a large proportion of hand weeding to successfully control weeds. Overseas research on organic or non-chemical weed management has investigated various methods of weed control and their effects on weed growth, weed population ecology and crop responses. However, there was a lack of research on OWM in Australia in a range of areas including the documentation and review of OWM methods used by growers, documentation of crops grown and especially troublesome weeds encountered, and the evaluation of the agronomic and economic effectiveness of OWM methods. The project reported here was designed to begin the process of filling those gaps in the literature.
8.2 Findings from the research
8.2.1 Organic weed management survey
The survey collected and analysed data on the characteristics of organic herb and vegetable farms in Australia, farmers’ attitudes to weeds and weed control methods used. A moderate response rate was achieved and the results were generally free from significant sources of error and were consistent with other published surveys. The survey findings showed that farm sizes were relatively small compared with conventional herb and vegetable growers and with farms in other organic sectors such as grazing and broadacre cropping. The smaller farm sizes may allow greater reliance on labour intensive weeding methods (e.g. hand weeding, mulching) than larger properties. A large range of commodities were grown by the survey respondents and about one quarter of the farmers grew more than five crops. While the respondents tended to have less experience than their conventional counterparts, a change in OWM practices was observed as growers became more experienced, with less use of direct, physical methods and more use of indirect, cultural methods. A similar change in practices was found in relation to growers concerns about weeds: decreasing concerns about weeds were associated with the increasing use cultural weeding methods. A large majority of growers had clear, strong concerns about weed control, particularly with regard to the time-consuming and
Chapter 8 Conclusion
187
difficult nature of OWM, however, the beneficial role of weeds was also raised by several farmers. A range of problem weeds were reported, with the most common weeds being perennials with persistent underground parts and heavy seeding annuals. These weeds are difficult to control using common OWM methods such as cultivation (by hand or plough) and mulching. Approximately 40 different weed management techniques were mentioned by respondents, of which the most common method was manual weeding. Other frequently reported methods were organic mulches, tillage (especially rotary hoes), cultural methods (e.g. rotations, cover crops), and slashing and/or mowing. Techniques that were less commonly reported by growers were thermal methods (e.g. flame weeding, steam weeding), synthetic mulches and organic sprays. However, respondents mentioned that these methods would be of interest if more information was available about their application and effectiveness. The responses for perceived success of the OWM methods were positively correlated with regularity of use of those methods, but no relationship was found between the regularity of use and the perceived expense of a method. These findings indicate that growers were not primarily motivated by cost, but were more concerned with the effectiveness of the methods reported. The data collected in the survey were previously unavailable as no systematic attempt to document organic growers’ attitudes and practices regarding weed management had been carried out before in Australia. The findings could potentially form a starting point for further research into OWM practices amongst Australian growers (see section 8.4.1 below).
8.2.2 Agronomy and economics of weed management treatments
In-crop weed management
While there were some similar responses in lettuce and echinacea to the effects of the weed control treatments on weeds and crops, there were also some noteworthy differences. The different responses by the two crops were due to the differences in the length of the growing seasons, morphology (e.g. root length, canopy size) and the wholesale value of each crop. The use of these two contrasting crops confirmed the principle that OWM strategies should be based on the crop being grown. Cheaper methods such as tillage were sufficient to ensure a reasonable yield in lettuce but not echinacea due to differences in crop phenology and economic value. Given effective weed control prior to planting, no further in-crop weeding may be needed to produce adequate yields. Such a strategy may have short-term cost savings and could be incorporated into a crop rotation to generate a short-term cash flow (often scarce for new organic growers) without the need for specialised equipment, and many culinary herb and salad vegetable varieties have suitably short growing seasons. However, repeating that strategy frequently would probably lead to longer-term increases in the weed seed bank, particularly for precocious weeds. More expensive weed control methods such as hand weeding and mulching with hay usually produced low weed levels and good yields, but were less cost effective. The labour requirements were high, with hay mulch having the added cost of mulching materials. On the other hand, hay mulch can offer benefits in delaying flowering and fruiting (e.g. leafy vegetable crops) and may offer more flexibility in harvest timing. Paper mulch provided excellent weed control, but severely reduced crop yields and was very expensive. The poor yields and the high cost produced an economic losses for lettuce and echinacea in one year. In echinacea, the cheaper weeding methods (e.g. tillage and the control) were less effective and had lower crop yields. While the unweeded control was cost effective in the short-term for lettuce, it was not economically viable for echinacea, with yields reduced by about 95%. Hand weeding and hay mulch controlled weed well and, although expensive, were cost effective because high yields and the higher value of echinacea compensated for the higher treatment costs. Paper mulch was again very expensive and produced moderate to low yields, greatly limiting its cost effectiveness.
Chapter 8 Conclusion
188
The lettuce and echinacea field trials provide information about the success and cost effectiveness of several in-crop weeding techniques commonly reported in the OWM survey. Profitable weed management can be achieved in lettuce by a single ploughing operation and light hand chipping mid-season, especially when weed loads are lighter. The implement used in the field trials was When tillage equipment is not available (e.g. new producers on small farms), a single hand weeding once gave similar net results to ploughing – yields were higher, but so were weeding costs. The lettuce growing season the New England region is constrained to late spring to late summer, so varying planting times to avoid periods of high weed growth is limited. In warmer regions, such flexibility is available and should be used advantageously by timing bed preparation, planting and early weeding operations to suit the local weed emergence patterns. Echinacea requires greater effort to control weeds than lettuce. The slow crop growth during the first 2 – 3 months presents a vulnerable target for weeds and challenge for growers, but higher investments of time and money in weed management were usually well rewarded in the field trials. Hand weeding and hay mulch were very cost effective, but the higher expenses make these weed control methods less attractive when crops are reduced due to factors other than weeds (e.g. low rainfall, frost, insect damage). Two or three tillage operations followed by light hand weeding can be enough the control weeds in a low yielding season when the extra cost of mulches and hand weeding may not be worthwhile. Most of the very commonly reported weeds in the survey did not occur at the field sites. Unlike the weeds in the survey, very few of the weeds in the field trials had persistent root systems – of the top 5 weeds, sorrel was recorded at one site only. However, many heavy seeding annual weeds were common including amaranths, paspalum and wireweed in the field trials. The dominant weeds at Yarrowitch were annual grasses, annual broadleaved species at Laureldale and a mixture of annuals and a perennial broadleaved species (sorrel) at Kirby. It is expected that the types of weeds and the treatment effects would be similar in most regions with arable soil and similar climate, although the economics would vary depending on input costs related to weeding. Effect of mulches
The results from the trials on in-crop weeding methods highlighted a number of agronomic issues related to the effects of the mulches. In particular, the reduced crop yields observed for paper mulch and the reduced occurrence of bolting in lettuces grown under both hay and paper mulch were of interest. Subsequent investigation of these issues in field and glasshouse experiments provided evidence about the likely causes of the responses observed. The poor yields in crops grown with paper mulch were the result of nutrient immobilisation, particularly nitrogen, rather than a number of other possible causes such as phytotoxins, waterlogging, poor soil aeration, unfavourable soil pH or weed competition. Leaf nutrient analyses indicated that nitrogen was limiting in lettuce with a significant positive correlation between lettuce yield and leaf nitrogen concentration. The effect was not observed in echinacea, probably because of the greater ability of the latter crop to access available soil nitrogen temporally and spatially due to the longer growing season and deeper root system respectively. A pot trial in which paper mulch inhibited lettuce growth compared with bare soil or hay mulch, and in which extra nitrogen did not overcome the inhibition, gave further evidence of the role of nitrogen immobilisation under paper mulch. Paper mulch was clearly inappropriate for a fast growing vegetable crop such as lettuce, however, echinacea growth was reasonable under paper mulch at Yarrowitch indicating that such mulches are more suitable for biennial and perennial crops. Results of a bioassay using aqueous extracts from the mulches showed that paper mulch extract was only mildly inhibitory, but hay mulch extract was extremely inhibitory. This finding is inconsistent with observations from the field trials and it was therefore unlikely that phytotoxins were responsible for lower crop yields when grown with paper mulch. This mulch would need reformulation with a higher concentration of organically certified nitrogenous fertiliser; however it is expected that such a reformulation would further increase the cost of an already expensive
Chapter 8 Conclusion
189
product. Other organic materials, with lower C:N ratios, such as manures, crop residues or fishery by-products may provide useful sources for incorporation in the mulch if they were readily available and overall costs could be contained or reduced. More bolting occurred in bare, tilled plots (hand weeding and tillage) than covered, undisturbed plots (mulches and control). The pattern of bolting in lettuce closely paralleled the variation in soil temperature between weed control treatments. It is likely that increased bolting was due to higher soil temperature maxima and diurnal fluctuations. This finding does not appear to have been reported previously in the literature and has practical implications for reducing losses due to bolting and prolonging the harvest period. Pre-crop weed management (fallows and cover crops)
The cover crops and bare fallow effectively suppressed weeds during the pre-crop phase compared with an unweeded green fallow, but had little or no effect on weed and lettuce growth in the subsequent in-crop phase. There was also no interaction between the pre-crop and in-crop treatments. The lack of effects in the in-crop phase may be due to several factors including incorporating the cover crops rather than surface mulching, rotary hoeing during the period between the cover crops and the lettuce, or an overly long plant-back delay before planting lettuces. Reducing the plant-back delay from 4 weeks to 1 day did not affect lettuce and weed growth in the field. Cover crops reduced weed levels by suppressing growth (relative cover and biomass) rather than weed emergence, while the bare fallow had lower weed emergence than the cover crops. Such lower weed densities may have longer-term benefits for the weed seed bank. Measuring weed seed banks could have provided an indication of the effects of the treatments on weed numbers in future years. The ryegrass cover crop was more consistent in suppressing weeds than the brassica cover crops, establishing well in different soils and rainfall regimes, and growing relatively quickly. The brassicas performed poorly when their early growth was inadequate, sowing density was inadequate, and weeds were able to out-compete the cover crop. Suppression was positively correlated with the reduction in light by the cover crops and indirect observations – the lack of correlation between soil moisture or nutrients and weed levels – indicated that competition for nutrients and water was not dominant in suppressing weed growth. There was no evidence of the strong phytotoxic effects attributed to brassica crops in the literature. In glasshouses trials, brassica cover crops grown and incorporated in pots had a positive effect on subsequent lettuce growth, but only when extra fertiliser was added during the cover crop phase, not when no fertiliser was added. This finding emphasises the importance of soil nutrients, rather than phytotoxins, in determining plant growth. The results also show the potential benefit of brassicas as alternative green manure crops to cereals and legumes, although they may have limited impact on subsequent in-crop weeds. Ryegrass was more reliable than the brassicas at suppressing weeds, and therefore would be the preferred cover crop (of those tested) in most situations. The use of brassicas was generally adequate, although the strong follow-on effects reported elsewhere were not observed. It is possible that these varieties may be used as cover crops to satisfy other production goals (e.g. breaking disease cycles, increasing biological diversity), rather than predominantly for weed management goals.
8.3 Development of new information and ideas
The research reported in this thesis has provided a number of original contributions to our understanding of organic and non-chemical weed control. Firstly, a new data set has been created from the survey that will be useful for research planning in Australian organic agriculture, especially herb and vegetable production. In addition, a critical analysis of the results in an
Chapter 8 Conclusion
190
international context has provided new information about the nature of organic production in Australia. Secondly, a number of original findings were identified from the field and glasshouse trials. New information has been generated regarding the performance of novel methods of weed management (i.e. brassica cover crops, paper mulch). Unique results from the research include the lack of negative effects by brassica cover crops on subsequent weeds and crops, the role of mulches in reducing premature bolting in lettuce, and the conflicting response between mulch extracts in bioassays and mulches in the field. The economic analysis of weed control treatments indicated that there was no correlation between the cost of a weeding method and its effectiveness. This result concurred with findings from the survey that the expense of a weed control method was not related to the perceived effectiveness of the method in managing weeds.
8.4 Future research
8.4.1 Organic weed management survey
The survey provided the first glimpse of the attitudes of organic herb and vegetable growers to weeds and the practices and principles used in managing weeds in Australia. While the study collected useful quantitative data on many aspects of OWM, reliable economic data and a deeper review of whole weed management strategies (i.e. how individual methods are integrated in time and space) were lacking. Consequently, an investigation of the economic impact of weeds and weed management in organic farming could be very useful, as would a study of the ways organic growers integrate their farming practices to achieve weed management goals. Both proposals could be implemented using a case study approach. Other research issues arising from the survey include biological and ecological studies of particularly troublesome weeds – rhizomotous species (e.g. Kikuyu) and prolific seeders (e.g. thistles) – in order to identify vulnerabilities that can be exploited using existing or modified OWM techniques, and the improvement of less commonly used OWM methods, for example, flame weeding, organic sprays, novel tillage implements, strategic grazing with poultry and solarisation. Numerous anecdotal reports by organic growers refer to a link between soil health and the types of weeds present and crop performance. Research into plant-soil and plant-plant processes, especially the relative effects of competition for light, water and nutrients, may identify opportunities for increasing the competitiveness of crops against weeds by manipulating soil conditions.
8.4.2 Agronomy and economics of weed management treatments
Hand weeding was very effective, but also quite time-consuming. The development of new hand weeding tools or the improvement of existing tools is receiving only limited attention globally, even though much of the world – not just organic farmers – still relies heavily on hand weeding in agriculture. Simple improvements such as the wheel-mounted hoe can be significant labour-savers. Tillage is also very widely used around the world, considerably reducing the need for hand weeding in many cases. Research on novel tillage implements for in-row weed control is increasing, particularly in Europe, and may be expected to continue for some time, perhaps with further stimulation from weed researchers of conventional farming systems who are concerned about herbicide resistance. There is growing interest in low-tillage systems in conventional horticulture, however, these systems normally rely on herbicides making them inappropriate for organic growers. An investigation of non-chemical methods of terminating cover crops (in-situ mulches) may allow organic growers to enjoy some of the soil and water conservation benefits of low-till systems. As well as in-situ mulches, other methods for reducing the high cost of applying mulches deserve further study. Two possibilities for mechanising the mulch laying process include flowable mulches (in liquid, pellet or powder form) and rolls similar to polyethylene mulch, based on paper, crop by-products or starches. The selection and breeding of cover crop and green manure species
Chapter 8 Conclusion
191
suited to organic systems in different climatic and cropping situations could produce a range of cultivars (and mixtures) that provide effective medium-term weed control, do not suppress subsequent crop growth and do not become weeds themselves. The research presented here has shown that OWM does not take place in isolation from other aspects of the farming system, and that strategies will vary between farms and farmers. Effective weed management in organic farming is a challenging but not insurmountable task that will be made easier over time as research increases and knowledge spreads through the farming and scientific community.
192
References Abdul-Baki, A.A., Morse, R.D. and Teasdale, J.R. 1999. Tillage and mulch effects on yield and
fruit fresh mass of bell pepper (Capsicum annum L.). Journal of Vegetable Crop Production. 5(1): 43-58.
Abdul-Baki, A.A. and Teasdale, J.R. 1997. Sustainable Production of Fresh-Market Tomatoes and Other Summer Vegetables With Organic Mulches. United States Department of Agriculture - Agricultural Research Service, Beltsville.
ABS. 2000. 1998-1999 Agriculture. 7113.0. Australian Bureau of Statistics, Melbourne. Acharya, B.D., Khattri, G.B., Chettri, M.K. and Srivastava, S.C. 2002. Effect of Brassica
campestris var. toria as a catch crop on Orobanche aegyptiaca seed bank. Crop Protection. 21(7): 533-537.
Agele, S.O., Iremiren, G.O. and Ojeniyi, S.O. 2000. Effects of tillage and mulching on the growth, development and yield of late-season tomato (Lycopersicon esculentum L.) in the humid south of Nigeria. Journal of Agricultural Science. 134(1): 55-59.
Akemo, M.C., Regnier, E.E. and Bennett, M.A. 2000. Weed suppression in spring-sown rye (Secale cereale)-pea (Pisum sativum) cover crop mixes. Weed Technology. 14(3): 545-549.
Al Hamdi, B., Inderjit, Olofsdotter, M. and Streibig, J.C. 2001. Laboratory bioassay for phytotoxicity: An example from wheat straw. Agronomy Journal. 93(1): 43-48.
Alemán, F. 2001. Common bean response to tillage intensity and weed control strategies. Agronomy Journal. 93(3): 556-563.
Alemseged, Y., Jones, R.E. and Medd, R.W. 2001. A farmer survey of weed management and herbicide resistance problems of winter crops in Australia. Plant Protection Quarterly. 16(1): 21-25.
Alenson, C.J. 1997. Organic Retailers and Growers Association of Australia. In: Dumaresq, D., Greene, R. and van Kerkhoff, L., eds. Organic Agriculture in Australia: Proceedings of the National Symposium on Organic Agriculture: Research and Development 30 June - 3 July, 1996. Rural Industries Research and Development Corporation, Barton. pp. 20-23.
Alföldi, T., Lockeretz, W. and Niggli, U., eds. 2000. IFOAM 2000 - The World Grows Organic. Proceedings of the 13th International IFOAM Scientific Conference. Convention Centre Basel, Switzerland 28 to 31 August 2000. vdf Hochschulverlag AG an der ETH Zurich, Basel.
Al-Khatib, K., Libbey, C. and Boydston, R. 1997. Weed suppression with Brassica green manure crops in green pea. Weed Science. 45(3): 439-445.
Allison, F.E. 1966. The fate of nitrogen applied to soils. Advances in Agronomy. 18: 219-258. Altieri, M.A. and Liebman, M. 1988a. Weed Management in Agroecosystems: Ecological
Approaches. CRC Press, Boca Raton. Altieri, M.A. and Liebman, M. 1988b. Weed management: ecological guidelines. In: Altieri, M.A.
and Liebman, M., eds. Weed Management in Agroecosystems: Ecological Approaches. CRC Press, Boca Raton. pp. 331-337.
An, M., Johnson, I.R. and Lovett, J.V. 1993. Mathematical modelling of allelopathy: biological response to allelochemicals and its interpretation. Journal of Chemical Ecology. 19(10): 2379-2388.
Andales, A.A., Batchelor, W.D., Anderson, C.E., Farnham, D.E. and Whigham, D.K. 2000. Incorporating tillage effects into a soybean model. Agricultural Systems. 66(2): 69-98.
Anderson, D., Johnson, R. and Milligan, B. 1998. Access to Postgraduate Courses: Opportunities and Obstacles. AGPS, Canberra.
Anderson, D.F., Garisto, M.-A., Bourrut, J.-C., Schonbeck, M.W., Jaye, R., Wurzberger, A. and DeGregorio, R. 1995. Evaluation of a paper mulch made from recycled materials as an alternative to plastic film mulch for vegetables. Journal of Sustainable Agriculture. 7(1): 39-61.
Anderson, D.L. and Henderson, L.J. 1986. Sealed chamber digestion for plant nutrient analysis. Agronomy Journal. 78: 937-938.
Anderson, M. 1990. Farming with reduced synthetic chemicals in North Carolina. American Journal of Alternative Agriculture. 5(2): 60-68.
Andres, L.A. and Clement, S.L. 1984. Opportunities for reducing chemical inputs for weed control. In: Bezdicek, D.F., Power, J.F., Keeney, D.R. and Wright, M.J., eds. Organic Farming: Current
References
193
Technology and Its Role in a Sustainable Agriculture. American Society of Agronomy/Crop Science Society of America/Soil Science Society of America, Madison. pp. 129-140.
Anon. 2000a. Qld Govt seizes lead in huge boost for organics. Acres Australia. August: 1, 5-6. Anon. 2000b. Rotation at heart of weed control at Fernleigh. Acres Australia. January: 10. Anon. 2001. Learning the lessons; building the market. Acres Australia. September: 1, 5. Anuebunwa, F.O. 2000. A bio-economic on-farm evaluation of the use of sweet potato for
complementary weed control in a yam/maize/egusi/cassava intercrop in pigeon pea hedgerows in the rain forest belt of Nigeria. Biological Agriculture and Horticulture. 18(2): 95-102.
AQIS. 2001. Draft National Standard for Organic and Bio-Dynamic Produce. Australian Quarantine and Inspection Service, Canberra.
AQIS. 2002. National Standard for Organic and Bio-Dynamic Produce. Australian Quarantine and Inspection Service, Canberra.
ARL. 1981. ICP Spectrometry. Instrumentation and Operating Parameters. Applied Research Laboratories, Bausch & Lomb, Sunland, California.
Ascard, J. 1990. Weed control in ecological vegetable farming. <http://sll.bibul.slu.se/html/sll/slu/ekologiskt_lantbruk/EKL05/EKL05AD.HTM>. Accessed: 2/7/01.
Ascard, J. and Fogelberg, F. 2002. Mechanical intra-row weed control in organic onion production. In: Cloutier, D.C., ed. Proceedings of the 5th EWRS Workshop on Physical and Cultural Weed Control. Scuola Superiore Sant'Anna di studi universitari e di perfezionamento, Pisa, Italy. 11-13 March 2002. European Weed Research Society, Pisa. p. 125.
Ascard, J. and Mattsson, B. 1994. Inter-row cultivation in weed-free carrots - the effect on yield of hoeing and brush weeding. Biological Agriculture and Horticulture. 11(3): 161-173.
Ash, G.H.B., Blatta, D.A., Mitchell, B.A., Davies, B., Shaykewich, C.F., Wilson, J.L. and Raddatz, R.L. 1999. Agricultural Climate of Manitoba. Manitoba Agriculture and Food, Winnipeg.
Auld, B.A. and Medd, R.W. 1987. Weeds: an Illustrated Botanical Guide to the Weeds of Australia. Inkata Press, Melbourne.
Axford, R., Carter, B. and Grunwald, G. 1997. Enhancing Dillman's total design method for mailed/telephone surveys using current technology to maximise cost-benefit ratios. Australian and New Zealand Journal of Sociology. 33(3): 387-393.
Ayres, L.J. and Kemp, D.R. 1998. Weeds: a perspective from NSW central tablelands farmers. In: Michalk, D.L. and Pratley, J.E., eds. Proceedings of the 9th Australian Agronomy Conference "Agronomy - Growing a Greener Future". Australian Society of Agronomy, Charles Sturt University, Wagga Wagga. pp. 595-596.
Baerveldt, S. and Ascard, J. 1999. Effect of soil cover on weeds. Biological Agriculture and Horticulture. 17: 101-111.
Baker, H.G. 1974. The evolution of weeds. Annual Review of Ecology and Systematics. 5: 1-24. Baker, J.P. and Smith, D.B. 1987. Self identified research needs of New York organic farmers.
American Journal of Alternative Agriculture. 2(3): 107-113. Balfour, E.B. 1948. The Living Soil. Faber, London. Ballaré, C.L. and Casal, J.J. 2000. Light signals perceived by crop and weed plants. Field Crops
Research. 67(2): 149-160. Bàrberi, P. 2002. Weed management in organic agriculture: are we addressing the right issues?
Weed Research. 42(3): 177-193. Bàrberi, P., Cozzani, A., Macchia, M. and Bonari, E. 1998a. Size and composition of the weed
seedbank under different management systems for continuous maize cropping. Weed Research. 38(5): 319-334.
Bàrberi, P. and Lo Cascio, B. 2001. Long-term tillage and crop rotation effects on weed seedbank size and composition. Weed Research. 41(4): 325-340.
Bàrberi, P., Macchia, M. and Bonari, E. 1998b. Comparison between the seed extraction and seedling emergence methods for weed seedbank evaluation. In: Champion, G.T., Grundy, A.C., Jones, N.E., Marshall, E.J.P. and Froud-Williams, R.J., eds. Weed Seedbanks: Determination, Dynamics and Manipulation. Association of Applied Biologists, Warwick. pp. 9-14.
Bàrberi, P. and Mazzoncini, M. 2001. Changes in weed community composition as influenced by cover crop and management system in continuous corn. Weed Science. 49(4): 491-499.
References
194
Barrie, A. and Prosser, S.J. 1996. Automatic analysis of light-element stable isotopes by isotope ratio mass spectrometry of soils. In: Boulton, T.W. and Yamasaki, S., eds. Mass Spectrometry of Soils. Marcel Dekker, New York. pp. 1-46.
Bastiaans, L., Kropff, M.J., Gourdriaan, J. and van Laar, H.H. 2000. Design of weed management systems with a reduced reliance on herbicides poses new challenges and prerequisites for modelling crop-weed interactions. Field Crops Research. 67(2): 161-179.
Baumann, D.T., Bastiaans, L., Goudriaan, J., van Laar, H.H. and Kropff, M.J. 2002. Analysing crop yield and plant quality in an intercropping system using an eco-physiological model for interplant competition. Agricultural Systems. 73(2): 173-203.
Baumann, D.T., Kropff, M.J. and Bastiaans, L. 2000. Intercropping leeks to suppress weeds. Weed Research. 40(4): 359-374.
Begna, S.H., Hamilton, R.I., Dwyer, L.M., Stewart, D.W., Cloutier, D., Assemat, L., Foroutan-Pour, K. and Smith, D.L. 2001. Morphology and yield response to weed pressure by corn hybrids differing in canopy architecture. European Journal of Agronomy. 14(4): 293-302.
Belde, M., Mattheis, A., Sprenger, B. and Albrecht, H. 2000. Langfristige Entwicklung ertragsrelevanter Ackerwildpflanzen nach Umstellung von konventionellem auf integrierten und ökologischen Landbau. (Long-term development of yield affecting weeds after the change from conventional to integrated and organic farming). Zeitschrift für Pflanzenkrankheiten und Pflanzenschutz. 17: 291-301.
Bell, D.T. 1974. The influence of osmotic pressure in tests of allelopathy. Transactions of the Illinois State Academy of Science. 67: 312-317.
Bell, D.T. and Muller, C.H. 1973. Dominance of California annual grasslands by Brassica nigra. American Midland Naturalist. 90(2): 277-299.
Bending, G.D. and Lincoln, S.D. 1999. Characterisation of volatile sulphur-containing compounds produced during decomposition of Brassica juncea tissues in soil. Soil Biology and Biochemistry. 31(5): 695-703.
Benech-Arnold, R.L., Sánchez, R.A., Forcella, F., Kruk, B.C. and Ghersa, C.M. 2000. Environmental control of dormancy in weed seed banks in soil. Field Crops Research. 67(2): 105-122.
Bennett, P. 1993. Australia and New Zealand: Organic Gardening. National Book Distributors, Brookvale.
Benton Jones, J., Wolf, B. and Mills, H.A. 1991. Plant Analysis Handbook. Micro-Macro Publishing, Athens, Georgia.
Beveridge, L.E. and Naylor, R.E.L. 1999. Options for organic weed control - what farmers do. In: Marshal, G., ed. Proceedings of the 1999 Brighton Conference - Weeds. 15-18 November 1999. British Crop Protection Council, Surrey. pp. 939-944.
Birkeland, L. and Døving, A. 2000. Development of organic strawberry production in Norway: Cultivars and mulching materials. In: Alföldi, T., Lockeretz, W. and Niggli, U., eds. IFOAM 2000 - The World Grows Organic. Proceedings of the 13th International IFOAM Scientific Conference. Convention Centre Basel, Switzerland 28 to 31 August 2000. vdf Hochschulverlag AG an der ETH Zurich, Basel. p. 207.
Bishop, A., Dennis, J., French, J. and Gardam, P. 2002. Going organic: a study of weed management in an intensive organic vegetable production system. In: Spafford Jacob, H., Dodd, J. and Moore, J.H., eds. 13th Australian Weeds Conference. Proceedings and Papers. 8-13 September 2002, Sheraton Perth Hotel, Perth Western Australia. Plant Protection Society of WA Inc, Perth. pp. 218-221.
Black, A.W. and Reeve, I.J. 1996. Farmers' attitudes to environmental issues: an Australian study. In: Ester, P. and Schluchter, W., eds. Social Dimensions of Contemporary Environmental Issues: International Perspectives. Tilburg University Press, Tilburg, Netherlands. pp. 189-213.
Bleeker, P. and van der Weide, R. 2000. Management of weeds in lettuce: false seedbed, soil preparation and mechanical weed control options. In: Cloutier, D., ed. 4rd EWRS Workshop on Physical Weed Control, Elspeet, Holland, 20-22 March 2000. European Weed Research Society, Elspeet. pp. 15-16.
Blum, U., Gerig, T.M., Worsham, A.D., Holappa, L.D. and King, L.D. 1992. Allelopathic activity in wheat- conventional and wheat-no-till soils: development of soil extract bioassays. Journal of Chemical Ecology. 18(12): 2191-2221.
References
195
Blum, U., King, L.D., Gerig, T.M., Lehman, M.E. and Worsham, A.D. 1997. Effects of clover and small grain cover crops and tillage techniques on seedling emergence of some dicotyledonous weed species. American Journal of Alternative Agriculture. 12(4): 146-161.
Bond, W. and Baker, P.J. 1990. Patterns of weed emergence following soil cultivation and its implications for weed control in vegetable crops. In: Crop Protection in Organic and Low Input Agriculture: Options for Reducing Agrochemical Usage, Surrey. pp. 63-68.
Bond, W., Burston, S., Bevan, J.R. and Lennartsson, M.E.K. 1998a. Optimum weed removal timing in drilled salad onions and transplanted bulb onions grown in organic and conventional systems. Biological Agriculture and Horticulture. 16(2): 191-201.
Bond, W. and Grundy, A.C. 2001. Non-chemical weed management in organic farming systems. Weed Research. 41(5): 383-405.
Bond, W. and Lennartsson, M.E.K. 1999. Organic weed control - back to the future. In: Marshal, G., ed. Proceedings of the 1999 Brighton Conference - Weeds. 15-18 November 1999. British Crop Protection Council, Hilton Brighton Metropole Hotel, UK. pp. 929-938.
Bond, W., Moore, H.C., Atkinson, R.J., Bevan, J.R. and Lennartsson, M.E.K. 1998b. Changes in the weed seedbank following different weeding treatments in drilled salad onion and carrot crops grown in organic and conventional systems. Biological Agriculture and Horticulture. 16(2): 203-215.
Bottenberg, H., Masiunas, J. and Eastman, C. 1999. Strip tillage reduces yield loss of snapbean planted in rye mulch. HortTechnology. 9(2): 235-240.
Bowman, G., ed. 1997. Steel in the Field: A Farmer's Guide to Weed Management Tools. Sustainable Agriculture Network, Beltsville, Maryland.
Boydston, R.A. and Hang, A. 1995. Rapeseed (Brassica napus) green manure crop suppresses weeds in potato (Solanum tuberosum). Weed Technology. 9(4): 669-675.
Brandsæter, L.O. and Netland, J. 1999. Winter annual legumes for use as cover crops in row crops in northern regions: I. Field experiments. Crop Science. 39(5): 1369-1379.
Brault, D., Stewart, K.A. and Jenni, S. 2002. Growth, development, and yield of head lettuce cultivated on paper and polyethylene mulch. HortScience. 37(1): 92-94.
Breland, T.A. 1996. Phytotoxic effects of fresh and decomposing cover crop residues. Norwegian Journal of Agricultural Sciences. 10(4): 355-362.
Bristow, K.L. and Horton, R. 1996. Modeling the impact of partial surface mulch on soil heat and water flow. Theoretical and Applied Climatology. 54(1-2): 85-98.
Brophy, L.S., Murray, H., Lev, L.S., Dick, R.P. and Butler, L.M. 1991. In the face of change: a rapid reconnaissance survey of northwest horticultural crop producers. American Journal of Alternative Agriculture. 6(1): 23-28.
Brown, P.D. and Morra, M.J. 1995. Glucosinolate-containing plant tissues as bioherbicides. Journal of Agricultural and Food Chemistry. 43(12): 3070-3074.
Bruinsma, J., ed. 2003. World Agriculture: Towards 2015/2030. An FAO Perspective. Earthscan Publications and Food and Agriculture Organization of the United Nations, London.
Brumfield, R.G., Rimal, A. and Reiners, S. 2000. Comparative cost analyses of conventional, intregrated crop management, and organic methods. HortTechnology. 10(4): 785-793.
Bugg, R.L., McGourty, G., Sarrantonio, M., Lanini, W.T. and Bartolucci, R. 1996. Comparison of 32 cover crops in an organic vineyard on the north coast of California. Biological Agriculture and Horticulture. 13(1): 63-81.
Buhler, D.D., Hartzler, R.G. and Forcella, F. 1998. Weed seed bank dynamics: Implications to weed management. Journal of Crop Production. 1(1): 145-168.
Buntain, M. 1999. Commercial Production of Medicinal Herbs in Tasmania. Rural Industries Research and Development Corporation, Barton.
Bureau of Meteorology. 2001. Averages for ARMIDALE (RADIO STATION 2AD). Bureau of Meteorology, Melbourne. <http://www.bom.gov.au/climate/averages/tables/cw_056002.shtml>. Accessed: 4/12/01.
Burgos, N.R. and Talbert, R.E. 1996. Weed control by spring cover crops and imazethapyr in no-till southern pea (Vigna unguiculata). Weed Technology. 10(4): 893-899.
Burnett, V. 2001. Natural control of weeds. Acres Australia. February: 4. Burt, J.R. 1996. Guide to the Organic Production of Vegetables. Agriculture Western Australia,
South Perth.
References
196
Burton, M., Rigby, D. and Young, T. 1998. Adoption of Organic Agriculture in Europe: Economic and Non-Economic Determinants. SEA News (Newsletter on Bioeconomic and Social Research on Sustainability and Economics in Agriculture). 2.
Butler, D., Gilmour, A.R., Cullis, B.R. and Gogel, B.J. 2000. Spatial Analysis Mixed Models with S-PLUS. Queensland Department of Primary Industries, Brisbane.
Butler, K. 1997. Echinacea Production Guide. Department of Primary Industry, Water and Environment, Hobart.
Caldwell, B. and Mohler, C.L. 2001. Stale seedbed practices for vegetable production. HortScience. 36(4): 703-705.
Cardina, J., Herms, C.P. and Doohan, D.J. 2002. Crop rotation and tillage system effects on weed seedbanks. Weed Science. 50(4): 448-460.
Carpenter, J.A. 1985. Pastures. In: Reid, R.L., ed. A Manual of Australian Agriculture. William Henemann, Melbourne. pp. 217-264.
Centre for Tropical Agriculture. 1999. Opportunities for the Atherton Tablelands: Organic. Queensland Department of Primary Industries, Brisbane.
Chandran, R.S., Salinas, K. and Madeira, M. 2001. WVU Organic Research Project. Weed Control Research at the Organic Farm. West Virginia University, Morgantown. <http://www.caf.wvu.edu/plsc/organic/frontpage/weed.htm>. Accessed: 7/9/02.
Chapman, D.S. and Auge, R.M. 1994. Physiological mechanisms of drought resistance in four native ornamental perennials. Journal of the American Society for Horticultural Science. 119(2): 299-306.
Chatizwa, I. 1997. Mechanical weed control: the case of hand weeders. Brighton Crop Protection Conference - Weeds: 203-208.
Churchill, D.B., Horwath, W.R., Elliott, L.F. and Bilsland, D.M. 1996. Low-input, on-farm composting of high C:N ratio residues. American Journal of Alternative Agriculture. 11(1): 7-9.
Clark, M.S., Ferris, H., Klonsky, K., Lanini, W.T., van Bruggen, A.H.C. and Zalom, F.G. 1998. Agronomic, economic, and environmental comparison of pest management in conventional and alternative tomato and corn systems in northern California. Agriculture, Ecosystems and Environment. 68(1-2): 51-71.
Clark, S., Klonsky, K., Livingston, P. and Temple, S. 1999. Crop-yield and economic comparisons of organic, low-input, and conventional farming systems in California's Sacramento Valley. American Journal of Alternative Agriculture. 14(3): 109-121.
Cleveland, W.S. and Devlin, S.J. 1988. Locally weighted regression: an approach to regression analysis by local fitting. Journal of the American Statistical Association. 83(403): 596-610.
Cloutier, D., ed. 2000. 4th EWRS Workshop on Physical Weed Control, Elspeet, Holland, 20-22 March 2000. European Weed Research Society, Elspeet.
Cloutier, D.C., ed. 2002. Proceedings of the 5th EWRS Workshop on Physical and Cultural Weed Control. Scuola Superiore Sant'Anna di studi universitari e di perfezionamento, Pisa, Italy. 11-13 March 2002. European Weed Research Society, Pisa.
CNCPP. 2001. Crop Index. Center for New Crops & Plant Products, Purdue University, West Lafayette. <http://newcrop.hort.purdue.edu/newcrop/Indices/index_ab.html>. Accessed: 2/7/01.
Coleman, E. 1989. The New Organic Grower. Chelsea Green, Vermont. Conacher, A. and Conacher, J. 1982. Organic farming in Australia. Geowest. 18. Corbin, E.J. and Pratley, J.E. 1994. Cultural Practices. In: Pratley, J.E., ed. Principles of Field Crop
Production. Oxford University Press, Melbourne. pp. 250-292. Cousens, R. 1987. Theory and reality of weed control thresholds. Plant Protection Quarterly. 2(1):
13-20. Cousens, R. and Mortimer, M. 1995. Dynamics of Weed Populations. Cambridge University Press,
Cambridge. Cousens, R.D., Warringa, J.W., Cameron, J.E. and Hoy, V. 2001. Early growth and development of
wild radish (Raphanus raphanistrum L.) in relation to wheat. Australian Journal of Agricultural Research. 52(7): 755-769.
Cox, P.G., Garside, A.L. and McCown, R.L. 1993. Market research for decision support for dryland crop production in central Queensland: a preliminary report. In: McDonald, G.K. and Bellotti, W.D., eds. Proceedings of the 7th Australian Agronomy Conference 1993 "Farming - From Paddock to Plate". Australian Society of Agronomy, University of Adelaide, Adelaide. pp. 332-335.
References
197
Crawley, M.J. 2002. Statistical Computing: An Introduction to Data Analysis using S-Plus. John Wiley and Sons, New York.
Creamer, N.C., Bennet, M.A., Stinner, B.R., Cardina, J. and Regnier, E.E. 1996. Mechanisms of weed suppression in cover crop-based production systems. HortScience. 31(3): 410-413.
Creamer, N.G. and Baldwin, K.R. 2000. An evaluation of summer cover crops for use in vegetable production systems in North Carolina. HortScience. 35(4): 600-603.
Creamer, N.G., Bennett, M. and Stinner, B.R. 1997. Evaluation of cover crop mixtures for use in vegetable production systems. HortScience. 32(5): 866-870.
Creamer, N.G. and Dabney, S.M. 2002. Killing cover crops mechanically: Review of recent literature and assessment of new research results. American Journal of Alternative Agriculture. 17(1): 32-40.
Crosby, J.R., Bellotti, W.D., Kerby, J.S. and Harrison, R. 1993. Farmer attitudes towards pastures in the cereal-livestock zone of South Australia. In: McDonald, G.K. and Bellotti, W.D., eds. Proceedings of the 7th Australian Agronomy Conference 1993 "Farming - From Paddock to Plate". Australian Society of Agronomy, University of Adelaide, Adelaide. pp. 321-324.
Crothers, L. 2000. Australia, Organic Products 2000. Foreign Agricultural Service, United States Department of Agriculture, Canberra.
Crotser, M.P. and Witt, W.W. 2000. Effect of Glycine max canopy characteristics, G. max interference, and weed-free period on Solanum ptycanthum growth. Weed Science. 48(1): 20-26.
Cui, R.X., Lee, B.W. and Lee, H.L. 2000. Growth and yield of potato as affected by paper, oil-treated paper and urea-coated paper mulching in spring season culture. Korean Journal of Crop Science. 45(3): 216-219.
Cussans, G.W. 1995. Integrated weed management. In: Glen, D.M., Greaves, M.P. and Anderson, H.M., eds. Ecology and Integrated Farming Systems. John Wiley and Sons, Bristol. pp. 17-29.
Cussans, G.W., Raudonius, S., Brain, P. and Cumberworth, S. 1996. Effects of depth of seed burial and soil aggregate size on seedling emergence of Alopecurus myosuroides, Galium aparine, Stellaria media and wheat. Weed Research. 36(2): 133-141.
Das, G.R. and Ahmed, T. 1989. Effect on rice yield of root damage to seedlings. International Rice Research Newsletter. 14(6): 5-6.
Dastgheib, F., Kumar, K. and Goh, K.M. 1999. Weed infestations in wheat cropping systems as affected by crop residues and their management practices. Biological Agriculture and Horticulture. 16(4): 395-407.
Davidson, A. 2000. Some Financial Considerations of Herb Growing in Australia. Herbs Australia, Launceston. <http://www.herbsaustralia.com.au/list_news_detailed.php3?news_id=181>. Accessed: 27/9/01.
Davies, G. 2001. Organic Lettuce and Salad Workshop Report. Henry Doubleday Research Association, Coventry. <http://www.organic-research.com/research/Papers/lettuce.asp>. Accessed: 26/9/01.
Davis, J.M. 1994. Comparison of mulches for fresh-market basil production. HortScience. 29(4): 267-268.
de Haan, R.L., Sheaffer, C.C. and Barnes, D.K. 1997. Effect of annual medic smother plants on weed control and yield in corn. Agronomy Journal. 89(5): 813-821.
de Neergaard, A., Hauggaard-Nielsen, H., Stoumann Jensen, L. and Magid, J. 2002. Decomposition of white clover (Trifolium repens) and ryegrass (Lolium perenne) components: C and N dynamics simulated with the DAISY soil organic matter submodel. European Journal of Agronomy. 16(1): 43-55.
Dellow, J.J. and Seaman, J.T. 1987. Current status and distribution of common heliotrope (Heliotropium europaeum L.) in New South Wales. Plant Protection Quarterly. 2(4): 165-167.
Denham, J. 1997. National Association for Sustainable Agriculture Australia. In: Dumaresq, D., Greene, R. and van Kerkhoff, L., eds. Organic Agriculture in Australia: Proceedings of the National Symposium on Organic Agriculture: Research and Development 30 June - 3 July, 1996. Rural Industries Research and Development Corporation, Barton. pp. 12-13.
Derrick, J. 1992. Crop rotation for broad acre organic cropping systems in south east Australia. In: Hutchinson, K.J. and Vickery, P.J., eds. Proceedings of the 6th Australian Agronomy Conference "Looking Back - Planning Ahead". Australian Society of Agronomy, University of New England, Armidale. p. 488.
References
198
Derrick, J.W. 1997. Organic agriculture in Australia: on-farm research. In: Dumaresq, D., Greene, R. and van Kerkhoff, L., eds. Organic Agriculture in Australia: Proceedings of the National Symposium on Organic Agriculture: Research and Development 30 June - 3 July, 1996. Rural Industries Research and Development Corporation, Barton. pp. 153-172.
Devore, J. and Peck, R. 1993. Statistics: The Exploration and Analysis of Data. Duxbury Press, Belmont.
Dhliwayo, H.H., Mabasa, S., Twomlow, S.J. and Riches, C.R. 1995. The effects of weeding methods and water conservation on weed populations in dryland maize. Brighton Crop Protection Conference - Weeds. 1: 207-212.
Dillman, D.A. 1978. Mail and Telephone Surveys: The Total Design Method. Wiley, New York. Dillman, D.A. 1991. The design and administration of mail surveys. Annual Review of Sociology.
17: 225-249. Dillman, D.A., Sinclair, M.D. and Clark, J.R. 1993. Effects of questionnaire length, respondent-
friendly design, and a difficult question on response rates for occupant-addressed census mail surveys. Public Opinion Quarterly. 57(3): 289-304.
Dillman, D.A., Singer, E., Clark, J.R. and Treat, J.B. 1996. Effects of benefits appeals, mandatory appeals, and variations in statements of confidentiality on completion rates for census questionnaires. Public Opinion Quarterly. 60(3): 376-389.
Dingkuhn, M., Johnson, D., E, Sow, A. and Audebert, A.Y. 1999. Relationships between upland rice canopy characteristics and weed competitiveness. Field Crops Research. 61(1): 79-95.
Donald, W.W. 2000. Alternative ways to control weeds between rows in weeded check plots in corn (Zea mays) and soybean (Glycine max). Weed Technology. 14: 36-44.
Dorward, P.T., Shepherd, D.D. and Wolmer, W.L. 1997. Developing farm management type methods for participatory needs assessment. Agricultural Systems. 55(2): 239-256.
Douglas, J. 1993. Echinacea - the purple coneflowers. Ruakura Agricultural Research Centre, New Zealand Institute for Crop and Food Research. <http://www.crop.cri.nz/psp/broadshe/ECHINACE.HTM>. Accessed: 7/10/98.
DPIWE. 1996. Green Manure Crops. Department of Primary Industry, Water and Environment, Hobart.
Dumaresq, D. 1997. Industry Summary. In: Dumaresq, D., Greene, R. and van Kerkhoff, L., eds. Organic Agriculture in Australia: Proceedings of the National Symposium on Organic Agriculture: Research and Development, 30 June - 3 July, 1996. Rural Industries Research and Development Corporation, Barton. pp. 1-4.
Dumaresq, D. and Derrick, J. 1990. Some preliminary results from a survey of sustainable cropping systems for south eastern Australia. In: Proceedings of the 1990 Australian Organic Agriculture Conference: A Regional Conference of the International Federation of Organic Agriculture Movements (IFOAM). Soil Association of South Australia, Adelaide.
Dumaresq, D., Greene, R. and van Kerkhoff, L., eds. 1997. Organic Agriculture in Australia: Proceedings of the National Symposium on Organic Agriculture: Research and Development 30 June - 3 July, 1996. Rural Industries Research and Development Corporation, Barton.
Dumaresq, D. and Greene, R.S.B. 1997. Overview of the organic industry in Australia. In: Dumaresq, D., Greene, R. and van Kerkhoff, L., eds. Organic Agriculture in Australia: Proceedings of the National Symposium on Organic Agriculture: Research and Development, 30 June - 3 July, 1996. Rural Industries Research and Development Corporation, Barton. pp. 95-109.
Dunn, G. and Penfold, C. 1996. Mechanical and biological weed control. In: Kristensen, N.H. and Hogh-Jensen, H., eds. New Research in Organic Agriculture, Down to Earth and Further Afield: Proceedings of the 11th International Scientific IFOAM Conference. International Federation of Organic Agriculture Movements, Copenhagen.
Duram, L.A. 1999. Factors in organic farmers' decisionmaking: diversity, challenge, and obstacles. American Journal of Alternative Agriculture. 14(1): 2-10.
Duryea, M.L., English, R.J. and Hermansen, L.A. 1999. A comparison of landscape mulches: Chemical, allelopathic, and decomposition properties. Journal of Arboriculture. 25(2): 88-97.
Dyck, E. and Liebman, M. 1995. Crop-weed interference as influenced by a leguminous or synthetic fertilizer nitrogen source .2. Rotation experiments with crimson clover, field corn, and lambsquarters. Agriculture, Ecosystems and Environment. 56(2): 109-120.
References
199
Eadie, A.G., Swanton, C.J., Shaw, J.E. and Anderson, G.W. 1992. Integration of cereal cover crops in ridge-tillage corn (Zea mays) production. Weed Technology. 6(3): 553-560.
Eberlein, C.V., Boydston, R., Al-Khatib, K., Davis, J.R., Guttieri, M.J., Santo, G.S. and Pan, W. 1997. Brassica green manure systems for weed, disease, and nematode control in potatoes. Proceedings of the Western Society of Weed Science. 50: 24-25.
Eberlein, C.V., Morra, M.J., Guttieri, M.J., Brown, P.D. and Brown, J. 1998. Glucosinolate production by five field-grown Brassica napus cultivars used as green manures. Weed Technology. 12(4): 712-718.
Eder, M. and Kirner, L. 2000. The current and future position of organic farming in Austria. In: Alföldi, T., Lockeretz, W. and Niggli, U., eds. IFOAM 2000 - The World Grows Organic. Proceedings of the 13th International IFOAM Scientific Conference. Convention Centre Basel, Switzerland 28 to 31 August 2000. vdf Hochschulverlag AG an der ETH Zurich, Basel. p. 662.
Edwards, C.A., Shuster, W.D., Huelsman, M.F. and Yardim, E.N. 1995. An economic comparison of chemical and lower-chemical input techniques for weed control in vegetables. Brighton Crop Protection Conference - Weeds. 3: 919-924.
Edwards, J.H. 1997. Composition and use of uncomposted wastepaper and other organics. In: Rechcigl, J.E. and MacKinnon, H.C., eds. Agricultural Uses of By-Products and Wastes. American Chemical Society, Washington, D.C. pp. 163-184.
Eggins, G. 1998. Weed control for organic farms. Tweed Richmond Organic Growers Association, Lismore.
Elder, R.J., Reid, D.J., Macleod, W.N.B. and Gillespie, R.L. 2002. Post-ratoon growth and yield of three hybrid papayas (Carica papaya L.) under mulched and bare-ground conditions. Australian Journal of Experimental Agriculture. 42(1): 71-81.
FAO. 1999. Organic Agriculture. Food and Agriculture Organization of the United Nations, Rome. Feldman, R.S., Holmes, C.E. and Blomgren, T.A. 2000. Use of fabric and compost mulches for
vegetable production in a low tillage, permanent bed system: Effects on crop yield and labor. American Journal of Alternative Agriculture. 15(4): 146-153.
Fennimore, S. and Smith, R.F. 2001. Integrated Weed Management for Lettuce: Optimized Weed Management Inputs Made According to Seasonal Fluctuations in Weed Seed Germination. University of California - Davis, Salinas, California.
Fernandez-Cornejo, C.J., Greene, C., Penn, R. and Newton, D. 1998. Organic vegetable production in the U.S.: Certified growers and their practices. American Journal of Alternative Agriculture. 13(2): 69-78.
Finckh, M.R., Mundt, C.C. and Wolfe, M.S. 2000. Opportunities for managing plant diseases in organic farming through functional diversity. In: Alföldi, T., Lockeretz, W. and Niggli, U., eds. IFOAM 2000 - The World Grows Organic. Proceedings of the 13th International IFOAM Scientific Conference. Convention Centre Basel, Switzerland 28 to 31 August 2000. vdf Hochschulverlag AG an der ETH Zurich, Basel. pp. 101-104.
Fischer, N.H., Williamson, G.B., Weidenhamer, J.D., Tanrisever, N., de la Pena, A., Jordan, E.D. and Richardson, D.R. 1989. Allelopathic mechanisms in the Florida scrub community. In: Chou, C.H. and Waller, G.R., eds. Phytochemical Ecology: Allelochemicals, Mycotoxins and Insect Pheromones and Allomones. Institute of Botany, Taipei, Taiwan. pp. 183-193.
Foddy, W. 1995. Constructing Questions for Interviews and Questionnaires. Cambridge University Press, Cambridge.
Forcella, F., Benech-Arnold, R.L., Sánchez, R. and Ghersa, C.M. 2000. Modeling seedling emergence. Field Crops Research. 67(2): 123-139.
Forcella, F., Eradat-Oskoui, K. and Wagner, S.W. 1993. Application of weed seedbank ecology to low-input crop management. Ecological Applications. 3(1): 74-83.
Fordham, R. and Biggs, A.G. 1985. Principles of Vegetable Crop Production. Collins/Angus and Robertson, London.
Fraser, S. and Whish, J.P.M. 1997. A Commercial Herb Industry for Northern NSW - An Infant Enterprise. Rural Industries Research and Development Corporation, Bardon.
Fujihara, S. and Yoshida, M. 1999. Allelopathy of hairy vetch, Vicia villosa Roth. and its application for crop production as mulching material. Bulletin of the Shikoku National Agricultural Experiment Station. 65: 17-32.
Fukuoka, M. 1978. One Straw Revolution. Rodale Press, Emmaus.
References
200
Galambosi, B. 1993. Introduction of Echinacea purpurea and Leuzea charthamoides into cultivation in Finland. Acta Horticulturae. 331: 169-178.
Gallardo, M., Jackson, L.E. and Thompson, R.B. 1996. Shoot and root physiological responses to localized zones of soil moisture in cultivated and wild lettuce (Lactuca spp.). Plant, Cell and Environment. 19(10): 1169-1178.
Gardiner, J.B., Morra, M.J., Eberlein, C.V., Brown, P.D. and Borek, V. 1999. Allelochemicals released in soil following incorporation of rapeseed Brassica napus) green manures. Journal of Agricultural and Food Chemistry. 47(9): 3837-3842.
Gardner, B. and Morgan, W. 1993. Green Manure Crops: The Organic Alternative for Improving Soils. Agmedia, East Melbourne.
Gavin, J.J., Rew, L.J., Robinson, G., Medd, R.W. and Walker, S.W. 1999. On farm monitoring of weed occurrence and density in the Northern Grain Region. In: Bishop, A., Boersma, M. and Barnes, C.D., eds. Proceedings of the 12th Australian Weeds Conference. Tasmanian Weeds Society, Hobart. pp. 31-34.
Geier, B. 1990. Non-chemical weed control in organic agriculture. In: SASA, ed. Proceedings of the 1990 Australian Organic Agriculture Conference: A Regional Conference of the International Federation of Organic Agriculture Movements (IFOAM). Soil Association of South Australia, Adelaide. pp. 75-78.
Geno, L. and Geno, B. 2001. Polyculture Production: Principles, Benefits and Risks of Multiple Cropping Land Management Systems for Australia. Rural Industries Research and Development Corporation, Barton.
George, B.H. and Brennan, P.D. 2002. Herbicides are more cost-effective than alternative weed control methods for increasing early growth of Eucalyptus dunnii and Eucalyptus saligna. New Forests. 24(2): 147-163.
Geven, C.G.M. 2000. Economic perspectives of organic vegetable farms in the Netherlands. Acta Horticulturae. 524: 27-32.
Gilley, J.E. and Doran, J.W. 1997. Tillage effects on soil erosion potential and soil quality of a former Conservation Reserve Program site. Journal of Soil and Water Conservation. 52(3): 184-188.
Gilmour, A.R., Cullis, B.R., Welham, S.J. and Thompson, R. 2002. ASREML Reference Manual. NSW Agriculture, Orange.
Glenn, J.S., Gilliam, C.H., Edwards, J.H., Keever, G.J. and Knight, P.R. 2000. Recycled waste paper mulch reduces available container N. Journal of Environmental Horticulture. 18(4): 189-191.
Goldberg, D.E. 1990. Components of resource competition in plant communities. In: Grace, J.B. and Tilman, D., eds. Perspectives in Plant Competition. Academic Press, San Diego. pp. 27-49.
Grace, B. 2000. Population biology and management of saffron thistle (Carthamus lanatus L.) in pastures. University of New England, Armidale. Doctor of Philosophy thesis.
Griggs, A. 2000. Research and Development of Organic Agriculture in Australia: A Review. Tasmanian Department of Primary Industries, Water and Environment, New Town.
Grodzinsky, A.M. 1992. Allelopathic effects of Cruciferous plants in crop rotation. In: Rizvi, S.J.H. and Rizvi, V., eds. Allelopathy: basic and applied aspects. Chapman and Hall, London. pp. 77-85.
Groeneveld, R.M.W., Lotz, L.A.P. and Kloen, H. 1997. Increasing cost-effectiveness of weed control in organic farming. In: Lotz, L.A.P., ed. Crop-Weed Interactions Workshop 1997, European Weed Research Society. European Weed Research Society, Dijon, France. p. 18.
Groves, R.H. 1991. The biogeography of mediterranean plant invasions. In: Groves, R.H. and Di Castri, F., eds. Biogeography of Mediterranean Invasions. Cambridge University Press, Cambridge. pp. 427-438.
Grundy, A.C., Bond, W., Burston, S. and Jackson, L. 1999a. Weed suppression by crops. In: Marshal, G., ed. Proceedings of the 1999 Brighton Conference - Weeds. 15-18 November 1999. Hilton Brighton Metropole Hotel, UK. British Crop Protection Council, Surrey. pp. 957-962.
Grundy, A.C., Mead, A. and Burston, S. 1999b. Modelling the effect of cultivation on seed movement with application to the prediction of weed seedling emergence. Journal of Applied Ecology. 36(5): 663-678.
References
201
Gubbels, G.H. and Kenaschuk, E.O. 1989. Effect of spring seedling residues on the agronomic performance of subsequent flax and barley crops seeded with and without prior tillage. Canadian Journal of Plant Science. 69: 151-159.
Guertal, E.A. and Edwards, J.H. 1996. Organic mulch and nitrogen affect spring and fall collard yields. HortScience. 31(5): 823-826.
Hafez, S.L., Thornton, M., Barton, D., Finnigan, B., Harding, G. and Seyedbagheri, M. 1995. Management of Oilseed Radish and Yellow Mustard Green Manure Crops. In: Thornton, M., ed. Cultural Management of Green Manure Crops. University of Idaho, Moscow.
Hald, A.B. 1999. Weed vegetation (wild flora) of long established organic versus conventional cereal fields in Denmark. Annals of Applied Biology. 134(3): 307-314.
Hall, D. 1988. Dorothy Hall's Herbal Medicine. Lothian, Port Melbourne. Halsall, D.M., Leigh, J.H., Gollasch, S.E. and Holgate, M. 1995. The role of allelopathy in legume
decline in pastures. II. Comparative effects of pasture, crop and weed residues on germination, nodulation and root growth. Australian Journal of Agricultural Research. 46(1): 189-207.
Haneklaus, S., Paulsen, H.M., Gupta, A.K., Bloem, E. and Schnug, E. 1999. Influence of sulfur fertilization on yield and quality of oilseed rape and mustard. In: Wratten, N. and Salisbury, P.A., eds. "New Horizons for an Old Crop" Proceedings of the 10th International Rapeseed Congress, Canberra, Australia, 1999. The Regional Institute Ltd., Canberra.
Hare, S., Price, J.H., Flynn, M.G. and King, K.A. 1998. Increasing return rates of a mail survey to exercise professionals using a modest monetary incentive. Perceptual and Motor Skills. 86(1): 217-218.
Harper, J.L. 1977. Population Biology of Plants. Academic Press, London. Hartley, K.L.S. and Forno, I.W. 1992. Biological Control of Weeds: A Handbook for Practioners
and Students. Inkata Press, Melbourne and Sydney. Hartley, M.J., Reid, J.B., Rahman, A. and Springett, J.A. 1996. Effect of organic mulches and a
residual herbicide on soil bioactivity in an apple orchard. New Zealand Journal of Crop and Horticultural Science. 24(2): 183-190.
Hartmann, H.T., Kofranek, A.M., Rubatzky, V.E. and Flocker, W.J. 1988. Plant Science: Growth, Development and Utilization of Cultivated Plants. Prentice Hall Career and Technology, Englewood Cliffs, NJ.
Hartwig, N.L. and Ammon, H.U. 2002. Cover crops and living mulches. Weed Science. 50(6): 688-699.
Hasegawa, H., Labavitch, J.M., McGuire, A.M., Bryant, D.C. and Denison, R.F. 1999. Testing CERES model predictions of N release from legume cover crop residue. Field Crops Research. 63: 255-267.
Hayman, P.T. and Alston, C.L. 1999. A survey of farmer practices and attitudes to nitrogen management in the northern New South Wales grains belt. Australian Journal of Experimental Agriculture. 39: 51-63.
Heisswolf, S., Carey, D., Henderson, C., O'Brien, R. and Dueter, P. 1999a. Growing Lettuce: Before You Start. Queensland Department of Primary Industries, Brisbane.
Heisswolf, S., Carey, D., Henderson, C., O'Brien, R. and Dueter, P. 1999b. Growing Lettuce: Common Questions. Queensland Department of Primary Industries, Brisbane.
Henderson, C. 2001. Weed Management in Lettuce. Queensland Department of Primary Industries, Brisbane.
Henderson, C.W.L. and Bishop, A.C. 2000. Vegetable weed management systems. In: Sindel, B.M., ed. Australian Weed Management Systems. R.G. and F.J. Richardson, Melbourne. pp. 355-372.
Herrero, E.V., Mitchell, J.P., Lanini, W.T., Temple, S.R., Miyao, E.M., Morse, R.D. and Campiglia, E. 2001. Use of cover crop mulches in a no-till furrow-irrigated processing tomato production system. HortTechnology. 11(1): 43-48.
Hewitt, M., Bullen, K. and George, D. 1998. Comparison of three weed control methods: chemical, flame and hot water. In: Michalk, D.L. and Pratley, J.E., eds. Proceedings of the 9th Australian Agronomy Conference "Agronomy - Growing a Greener Future". Australian Society of Agronomy, Charles Sturt University, Wagga Wagga. pp. 607-608.
Hippe, C., Gysi, C., Imhof, T. and Kesper, C. 2000. Integrated and organic production of vegetables - improvements in plant nutrition and weed, pest and disease control at Swiss VEGINECO pilot farms. In: Alföldi, T., Lockeretz, W. and Niggli, U., eds. IFOAM 2000 - The
References
202
World Grows Organic. Proceedings of the 13th International IFOAM Scientific Conference. Convention Centre Basel, Switzerland 28 to 31 August 2000. vdf Hochschulverlag AG an der ETH Zurich, Basel. pp. 193-196.
Home, M.C.W., Tillett, N.D., Hague, T. and Godwin, R.J. 2002. An experimental study of lateral positional accuracy achieved during inter-row cultivation. In: Cloutier, D.C., ed. Proceedings of the 5th EWRS Workshop on Physical and Cultural Weed Control. Scuola Superiore Sant'Anna di studi universitari e di perfezionamento, Pisa, Italy. 11-13 March 2002. European Weed Research Society, Pisa. pp. 101-110.
Horsley, P. 2000. The Organic Alternative: The Complete Guide to Organic Farming. Kondinin, Cloverdale.
Horton, R., Bristow, K.L., Kluitenberg, G.J. and Sauer, T.J. 1996. Crop residue effects on surface radiation and energy balance - review. Theoretical and Applied Climatology. 54(1-2): 27-37.
Howden, P., Vanclay, F., Lemerle, D. and Kent, J. 1998. Working with the grain: Farming styles amongst Australian broadacre croppers. Rural Society. 8(2): 109-125.
Hox, J.J., de Leeuw, E.D. and Dujix, A.W.M. 1984. The postman rings thrice: a study of two features in Dillman's Total Design Method for follow-up questionnaires. Mens en Maatschappij. 59(2): 189-194.
Hudson, R.B. 1996. The Domestic Market for Australian Organic Produce - An Update. Rural Industries Research and Development Corporation, Barton.
Hussey, B.M.J., Keighery, G.J., Cousens, R.D., Dodd, J. and Lloyd, S.G. 1997. Western Weeds: A Guide to the Weeds of Western Australia. Plant Protection Society of Western Australia (Inc.), Victoria Park.
Hutchinson, C.M. and McGiffen, M.E. 2000. Cowpea cover crop mulch for weed control in desert pepper production. HortScience. 35(2): 196-198.
HYPP. 1998. Deroceras reticulatum (Müller). HYPP (HYpermédia en Protection des Plantes), Institut National de la Recherche Agronomique, Paris. <http://www.inra.fr/Internet/Produits/HYPPZ/RAVAGEUR/6derret.htm>. Accessed: 23/5/99.
Ibewiro, B., Sanginga, N., Vanlauwe, B. and Merckx, R. 2000. Nitrogen contributions from decomposing cover crop residues to maize in a tropical derived savanna. Nutrient Cycling in Agroecosystems. 57(2): 131-140.
IFOAM. 2002. Final Draft 2002. Basic Standards for Organic Production and Processing. IFOAM (International Federation of Organic Agriculture Movements), Tholey-Theley.
Inderjit and del Moral, R. 1997. Is separating resource competition from allelopathy realistic? (Interpreting botanical progress). The Botanical Review. 63(3): 221-230.
Inderjit, Kaur, M. and Foy, C.L. 2001. On the significance of field studies in allelopathy. Weed Technology. 15: 792-797.
Inderjit and Weston, L.A. 2000. Are laboratory bioassays for allelopathy suitable for prediction of field responses? Journal of Chemical Ecology. 26(9): 2111-2118.
Isart, J. and Llerena, J.J. 1999. Conclusions. Recommendations for future research in organic farming. In: Isart, J. and Llerena, J.J., eds. Organic Farming Research in the EU, Towards 21st Century. ENOF White Book. European Network for Scientific Research Co-ordination in Organic Farming (ENOF), Barcelona. pp. 105-108.
Ishii, G. and Saijo, R. 1987. Effect of season, soil type, sulfate level mulching and plant density on isothiocyanate content in radish root juice (Raphanus sativus L.). Journal of the Japanese Society for Horticultural Science. 56(3): 313-320.
ITC. 1999. Organic Food and Beverages: World Supply and Major European Markets. Product and Market Development. International Trade Centre UNCTAD/WTO, Geneva.
Jacobsen, O.H. and Schjønning, P. 1993a. Field evaluation of time domain reflectometry for soil water measurements. Journal of Hydrology. 151(2-4): 159-172.
Jacobsen, O.H. and Schjønning, P. 1993b. A laboratory calibration of time domain reflectometry for soil water measurement including effects of bulk density and texture. Journal of Hydrology. 151(2-4): 147-157.
Joedodibroto, R., Widyanto, L.S. and Soerjani, M. 1979. Weeds as non-conventional natural resources. In: Medd, R.W. and Auld, B.A., eds. Proceedings of the 7th Asian-Pacific Weed Science Society Conference. Sydney, Australia. November, 26 to 30, 1979. Council of Australian Weed Science Societies for the Asian-Pacific Weed Science Society, Sydney. pp. 47-50.
Johnson, G.A., Defelice, M.S. and Hensel, Z.R. 1993. Cover crop management and weed control in corn (Zea mays). Weed Technology. 7(2): 425-430.
Johnson, S.B. 2000. Biology and Management of the 'take-all' Weed Polymeria longifolia (Peak Downs curse) in Cotton. University of New England, Armidale. Doctor of Philosophy thesis.
Johnson, W.C. and Mullinix, B.G. 1998. Stale seedbed weed control in cucumber. Weed Science. 46(6): 698-702.
Joint FAO-WHO Food Standards Programme. 1999. Codex Alimentarius: Guidelines for the Production, Processing Labelling and Marketing of Organically Produced Food. Joint FAO-WHO Food Standards Programme, Rome.
Jones, R., Alemseged, Y., Medd, R. and Vere, D. 2000. The Distribution, Density and Economic Impact of Weeds in the Australian Annual Winter Cropping System. Cooperative Research Centre for Weed Management Systems, Glen Osmond.
Jones, R. and Medd, R. 1997. Economic analysis of integrated management of wild oats involving fallow, herbicide and crop rotational options. Australian Journal of Experimental Agriculture. 37(6): 683-691.
Jones, R.E. and Medd, R.W. 2000. Economic thresholds and the case for longer term approaches to population management of weeds. Weed Technology. 14: 337-350.
Jørgensen, B. 1997. The Theory of Dispersion Models. Chapman and Hall, London. Kamara, A.Y., Akobundu, I.O., Sanginga, N. and Jutzi, S.C. 2000. Effect of mulch from selected
multipurpose tree (MPTs) on growth, nitrogen nutrition and yield of maize (Zea mays L.). Journal of Agronomy and Crop Science. 184(2): 73-80.
Kelly, T., Gempton, G. and Palmer, A. 2000. Managing the transition from conventional to organic farming. In: Organics 2020 Conference. May 19-21, 2000. Soil and Health Association, Auckland.
Khan, A.R., Chandra, D., Quraishi, S. and Sinha, R.K. 2000. Soil aeration under different soil surface conditions. Journal of Agronomy and Crop Science. 185(2): 105-122.
Kinnear, S. 2000a. Organic and Biodynamic Farming Background Paper. Organic Federation of Australia, East Brunswick.
Kinnear, S. 2000b. Organic Production in Australia. Organic Federation of Australia, East Brunswick.
Kinsela, M.N. 1985. Vegetable crops. In: Reid, R.L., ed. A Manual of Australian Agriculture. William Hienemann, Melbourne. pp. 138-145.
Kirkegaard, J.A., Gardner, P.A., Angus, J.F. and Koetz, E. 1994. Effect of Brassica break crops on the growth and yield of wheat. Australian Journal of Agricultural Research. 45: 529-545.
Kirkegaard, J.A. and Sarwar, M. 1998. Biofumigation potential of Brassicas. I. Variation in glucosinolate profiles of diverse field-grown brassicas. Plant and Soil. 201(1): 71-89.
Kirnak, H., Kaya, C., Higgs, D. and Gercek, S. 2001. A long-term experiment to study the role of mulches in the physiology and macro-nutrition of strawberry grown under water stress. Australian Journal of Agricultural Research. 52: 937–943.
Klonsky, K. and Livingston, P. 1994. Alternative systems aim to reduce inputs, maintain profits. California Agriculture. 48(5): 1-3.
Kloot, P.M. 1991. Invasive plants in southern Australia. In: Groves, R.H. and Di Castri, F., eds. Biogeography of Mediterranean Invasions. Cambridge University Press, Cambridge. pp. 131-143.
Köpke, U. 1999. Review of crop production and weed control: state of arts and outlook. In: Isart, J. and Llerena, J.J., eds. Organic Farming Research in the EU, Towards 21st Century. ENOF White Book. European Network for Scientific Research Co-ordination in Organic Farming (ENOF), Barcelona. pp. 27-41.
Köpke, U. and Geier, U. 1999. Mixed farming on bio-regional level: current issues and new perspectives. In: Zanoli, R. and Krell, R., eds. First SREN Workshop on Research Methodologies in Organic Farming. Proceedings. Frick, Switzerland. 30 September - 3 October 1998. Food and Agriculture Organization of the United Nations, Rome. pp. 95-99.
Korsaeth, A., Henriksen, T.M. and Bakken, L.R. 2002. Temporal changes in mineralization and immobilization of N during degradation of plant material: implications for the plant N supply and nitrogen losses. Soil Biology and Biochemistry. 34(6): 789-799.
References
204
Kozower, C.A. 2000. Use of soil tests by certified organic farmers in the New England region of the United States. In: Alföldi, T., Lockeretz, W. and Niggli, U., eds. IFOAM 2000 - The World Grows Organic. Proceedings of the 13th International IFOAM Scientific Conference. Convention Centre Basel, Switzerland 28 to 31 August 2000. vdf Hochschulverlag AG an der ETH Zurich, Basel. p. 3.
Krell, R., ed. 1997. Biological Farming Research in Europe. Food and Agriculture Organization of the United Nations, Rome.
Krishnan, G., Holshouser, D.L. and Nissen, S.J. 1998. Weed control in soybean (Glycine max) with green manure crops. Weed Technology. 12(1): 97-102.
Kristensen, S., Friis, E., Henriksen, K. and Mikkelsen, S.A. 1985. Application of temperature sums in the timing of production of crisp lettuce. Acta Horticulturae. 198: 217-223.
Kristiansen, P.E., Jessop, R.S. and Sindel, B.M. 2001. Organic weed management survey: methods used by Australian herb and vegetable growers. In: Rowe, B., Mendham, N. and Donaghy, D., eds. 10th Australian Agronomy Conference. Science and Technology: Delivering Results for Agriculture. 28 January - 1 February 2001, Hobart, Tasmania. Australian Society of Agronomy, Hobart.
Kristiansen, P.E., Sindel, B.M. and Jessop, R.S. in press. Information resources for organic weed management in Australia. In: Jewel, R., ed. Farming for the Future: Organic Produce for the 21st Century, 22-23rd September 1999. Central Queensland University, Mackay.
Kropff, M.J., Bastiaans, L. and Lotz, L.A.P. 1997. Systems approaches in weed management and the design of weed suppressing crop varieties. In: FAO, ed. Expert Consultation on Weed Ecology and Management. FAO, Rome 22-24 September 1997. Plant Production & Protection Division, Food and Agriculture Organization of the United Nations, Rome. pp. 73-85.
Kropff, M.J., Baumann, D.T. and Bastiaans, L. 2000. Dealing with weeds in organic agriculture - challenge and cutting edge in weed management. In: Alföldi, T., Lockeretz, W. and Niggli, U., eds. IFOAM 2000 - The World Grows Organic. Proceedings of the 13th International IFOAM Scientific Conference. Convention Centre Basel, Switzerland 28 to 31 August 2000. vdf Hochschulverlag AG an der ETH Zurich, Basel. pp. 175-177.
Lacey, J.R., Jamtgaard, K., Riggle, L. and Hayes, T. 1993. Impacts of big game on private land in south-western Montana: Land owner perceptions. Journal of Range Management. 46(1): 31-37.
Lampkin, N. 1990. Organic Farming. Farming Press, Ipswich. Lane, P.W. 2002. Generalized linear models in soil science. European Journal of Soil Science.
53(2): 241-251. Lazarides, M., Cowley, K. and Hohnen, P. 1997. CSIRO Handbook of Australian Weeds. CSIRO
Australia, Collingwood. Leach, J.E., Stevenson, H.J., Rainbow, A.J. and Mullen, L.A. 1999. Effects of high plant
populations on the growth and yield of winter oilseed rape (Brassica napus). Journal of Agricultural Science. 132(2): 173-180.
Leake, A.R. 1996. The effect of cropping sequences and rotational management: an economic comparison of conventional, integrated and organic systems. Aspects of Applied Biology. 47: 185-194.
Lee, H.C. 1995. Non-chemical weed control in cereals. Brighton Crop Protection Conference - Weeds. 3: 1161-1170.
Lee, S.K. and Cheong, S.C. 1996. Inducing head formation of iceberg lettuce (Lactuca sativa L) in the tropics through root-zone temperature control. Tropical Agriculture. 73(1): 34-42.
Lees, J. and Reeve, I. 1994. TPSKP 1994 Producer Survey (M.414). Report to the Meat Research Corporation. The Rural Development Centre, University of New England, Armidale.
Leinonen, P. and Närkki, V. 2000. Help for the hand work on horticultural fields. In: Alföldi, T., Lockeretz, W. and Niggli, U., eds. IFOAM 2000 - The World Grows Organic. Proceedings of the 13th International IFOAM Scientific Conference. Convention Centre Basel, Switzerland 28 to 31 August 2000. vdf Hochschulverlag AG an der ETH Zurich, Basel. p. 189.
Lewthwaite, S.L. and Triggs, C.M. 2000. Weed control in sweetpotatoes. New Zealand Plant Protection. 53: 262-268.
Li, T.S.C. 1996. Nutrient weeds as soil amendments for organically grown herbs. Journal of Herbs, Spices and Medicinal Plants. 4(1): 3-8.
LI-COR. 1996. LI-250 Light Meter Instruction Manual. LI-COR, Inc, Lincoln.
References
205
Liebig, M.A. and Doran, J.W. 1999. Evaluation of farmers' perceptions of soil quality indicators. American Journal of Alternative Agriculture. 14(1): 11-21.
Liebman, M. 2001. Weed management: a need for ecological approaches. In: Liebman, M., Mohler, C.L. and Staver, C.P., eds. Ecological Management of Agricultural Weeds. Cambridge University Press, New York. pp. 1-39.
Liebman, M. and Davis, A.S. 2000. Integration of soil, crop and weed management in low-external-input farming systems. Weed Research. 40(1): 27-47.
Liebman, M. and Gallandt, E.R. 1997. Many little hammers: Ecological management of crop-weed interactions. In: Jackson, L.E., ed. Ecology in Agriculture. Academic Press, San Diego. pp. 291-343.
Liebman, M. and Janke, R.R. 1990. Sustainable weed management practices. In: Francis, C.A., Flora, C.B. and King, L.D., eds. Sustainable Agriculture in Temperate Zones. John Wiley and Sons, New York. pp. 111-143.
Liebman, M. and Ohno, T. 1998. Crop rotation and legume residue effects on weed emergence and growth: Implications for weed management. In: Hatfield, J.L., Buhler, D.D. and Stewart, B.A., eds. Integrated Weed and Soil Management. Ann Arbour Press, Chelsea, Michigan. pp. 181-221.
Liebman, M. and Robichaux, R.H. 1990. Competition by barley and pea against mustard: effects on resource acquisition, photosynthesis and yield. Agriculture, Ecosystems and Environment. 31(2): 155-172.
Light, K. 1999. Agronomy of FUMUSTM F-L71 and F-E75 Brassica juncea (Mustard) lines. Ag-Seed Research Pty Ltd, Horsham.
Lines-Kelly, R. and Mason, D. 2001. Organic agriculture: An opportunity to link urban consumers with rural producers through direct marketing mechanisms. In: RIRDC, ed. The Organic Challenge: Unity Through Diversity. RIRDC's Inaugural National Organics Conference 2001. Darling Harbour, Sydney, Australia, 27-28th August 2001. Rural Industries Research and Development Corporation, Barton. pp. 135-147.
Lipson, M. 1997. Searching for the "O-Word": An Analysis of the USDA Current Research Information System (CRIS) for Pertinence to Organic Farming. Organic Farming Research Foundation, Santa Cruz.
Litterick, A.M., Redpath, J., Seel, W. and Leifert, C. 1999. An evaluation of weed control strategies for large-scale organic potato production in the UK. In: Marshal, G., ed. Proceedings of the 1999 Brighton Conference - Weeds. 15-18 November 1999. Hilton Brighton Metropole Hotel, UK. British Crop Protection Council, Surrey. pp. 951-956.
Lockeretz, W. 1995. Organic farming in Massachusetts: An alternative approach to agriculture in an urbanized state. Journal of Soil and Water Conservation. 50(6): 663-667.
Lockeretz, W. 1997. Diversity of personal and enterprise characteristics among organic growers in the northeastern United States. Biological Agriculture and Horticulture. 14: 13-24.
Lockeretz, W. 2002. Strategies for organic research. In: Powell, J., ed. Proceedings of the UK Organic Research 2002 Conference: Research in Context. 26-28th March 2002 Aberystwyth. Organic Centre Wales, Institute of Rural Studies, University of Wales Aberystwyth, Aberystwyth. pp. 25-31.
Long, C. 2000. Build your soil with cover crops. Organic Gardening. November/December: 56-59.
Lovett, J.V. and Jessop, R.S. 1982. Effects of residues of crop plants on germination and early growth of wheat. Australian Journal of Agricultural Research. 33(6): 909-916.
MacRae, R.J., Hill, S.B., Mehuys, G.R. and Henning, J. 1990. Farm-scale agronomic and economic conversion from conventional to sustainable agriculture. Advances in Agronomy. 43: 155-198.
Mäder, P., Fließbach, A., Dubois, D., Gunst, L., Fried, P. and Niggli, U. 2002. Soil fertility and biodiversity in organic farming. Science. 296(5573): 1694-1697 (and supplementary material).
Maillard, P., Guehl, J.M., Muller, J.F. and Gross, P. 2001. Interactive effects of elevated CO2 concentration and nitrogen supply on partitioning of newly fixed 13C and 15N between shoot and roots of pedunculate oak seedlings (Quercus robur). Tree Physiology. 21(2-3): 163-172.
Mangan, F., DeGregorio, R., Schonbeck, M., Herbert, S., Guillard, K., Hazzard, R., Sideman, E. and Litchfield, G. 1995. Cover cropping systems for brassicas in the northeastern United States. 2. Weed, insect and slug incidence. Journal of Sustainable Agriculture. 5(3): 15-36.
References
206
Manu, V.T. 2000. Effects of Cropping on Soil C and Nutrient Availability, and the Amelioration Practices that Enhances Optimum Sustainable Crop Yields in Tonga. University of New England, Armidale. Doctor of Philosophy thesis.
Marshall, T. 1992. Weed control in organic farming systems. In: Richardson, R.G., ed. Proceedings of the First International Weed Control Congress. Weed Science Society of Victoria, Melbourne. pp. 311-314.
Marshall, T. 1999a. Hoe, hoe ... and off to work we go. Acres Australia. April: 38. Marshall, T. 1999b. Hoes for every purpose. Acres Australia. May: 32. Martin, R.J., McMillan, M.G. and Cook, J.B. 1988. Survey of farm management practices of the
northern wheat belt of New South Wales. Australian Journal of Experimental Agriculture. 28: 499-509.
Martínez-Ghersa, M.A., Ghersa, C.M. and Satorre, E.H. 2000. Coevolution of agricultural systems and their weed companions: implications for research. Field Crops Research. 67(2): 181-190.
Masiunas, J.B. 1998. Production of vegetables using cover crop and living mulches - a review. Journal of Vegetable Crop Production. 4(1): 11-31.
Masiunas, J.B., Weston, L.A. and Weller, S.C. 1995. The impact of rye cover crops on weed populations in a tomato cropping system. Weed Science. 43(2): 318-323.
Mason-Sedun, W. and Jessop, R.S. 1988. Differential phytotoxicity among species and cultivars of the genus Brassica to wheat. II. Activity and persistence of water-soluble phytotoxins from residues of the genus Brassica. Plant and Soil. 107: 69-80.
Mason-Sedun, W., Jessop, R.S. and Lovett, J.V. 1986. Differential phytotoxicity among species and cultivars of the genus Brassica to wheat. I. Laboratory and field screening of species. Plant and Soil. 93: 3-16.
MathSoft. 1999a. S-PLUS 2000 Guide to Statistics, Volume 1. Data Analysis Products Division, MathSoft, Seattle.
MathSoft. 1999b. S-PLUS 2000 Guide to Statistics, Volume 2. Data Analysis Products Division, MathSoft, Seattle.
MathSoft. 1999c. S-PLUS 2000 Professional Release 2. MathSoft, Seattle. Matitschka, G. 1996. Mineral N dynamic, N uptake and growth of lettuce as affected by mulch.
Acta Horticulturae. 428: 85-94. Maynard, M.L. 1996. Effectiveness of "begging" as a persuasive tactic for improving response rate
on a client/agency mail survey. Psychological Reports. 78(1): 204-206. McAfee, M., Lindstrom, J. and Johansson, W. 1989. Aeration studies on arable soil. 1. The effect
of a sand/peat mulch on aeration regime in a silty clay loam. Swedish Journal of Agricultural Research. 19(3): 147-153.
McCaman, J.L. 1994. Weeds and Why They Grow. Jay L. McCaman, Sand Lake. McCoy, S. 2001. Carrots - organic production guidelines. In: McCoy, S. and Parlevliet, G., eds.
Organic Production Systems: Beef, Wheat, Grapes and Wines, Oranges and Carrots. Rural Industries Research and Development Corporation, Barton. pp. 119-143.
McCoy, S. and Parlevliet, G., eds. 2001. Organic Production Systems: Beef, Wheat, Grapes and Wines, Oranges and Carrots. Rural Industries Research and Development Corporation, Barton.
McCullagh, P. and Nelder, J.A. 1989. Generalized Linear Models. Chapman and Hall, London. McFarlane, D. 1997. Biological Farmers of Australia. In: Dumaresq, D., Greene, R. and van
Kerkhoff, L., eds. Organic Agriculture in Australia: Proceedings of the National Symposium on Organic Agriculture: Research and Development 30 June - 3 July, 1996. Rural Industries Research and Development Corporation, Barton. pp. 8-10.
Medd, R.W. 1997. Weed management on arable lands. In: Cornish, P.S. and Pratley, J.E., eds. Tillage - New Directions in Australian Agriculture. Inkata Press, Melbourne.
Melander, B. 1998a. Economic aspects of physical intra-row weed control in seeded onions. In: Foguelman, D. and Lockeretz, W., eds. Organic Agriculture - the Credible Solution for the XXIst Century: Proceedings of the 12th International IFOAM Scientific Conference. International Federation of Organic Agriculture Movements, Mar del Plata, Argentina. pp. 180-185.
Melander, B. 1998b. Interactions between soil cultivation in darkness, flaming and brush weeding when used for in-row weed control in vegetables. Biological Agriculture and Horticulture. 16(1): 1-14.
References
207
Melander, B. and Rasmussen, G. 2001. Effects of cultural methods and physical weed control on intrarow weed numbers, manual weeding and marketable yield in direct-sown leek and bulb onion. Weed Research. 41(6): 491-508.
Melander, B. and Rasmussen, K. 2000. Reducing intrarow weed numbers in row crops by means of a biennial cultivation system. Weed Research. 40(2): 205-218.
Merfield, C.N. 2002. Organic Weed Management: A Practical Guide. Charles N. Merfield, Canterbury.
Meyer, S. 1996. Choose the right hoe for you! (tools for use against weeds). Organic Gardening. 43(6): 70-72.
Michael, P.W. 1994. Alien plants. In: Groves, R.H., ed. Australian Vegetation. Cambridge University Press, Cambridge. pp. 44-64.
Miles, C. and Chen, C. 2001. Cover Crops for Weed Management in Organic Vegetables. Vancouver Research and Extension Unit, Washington State University Cooperative Extension, Vancouver, Washington.
Miller, R.A. 1985. The Potential of Herbs as a Cash Crop: How to Make a Living in the Country. Acres USA, Kansas City.
Miller, T.E. 1996. On quantifying the intensity of competition across gradients. Ecology. 77(3): 978-981.
Miyasaka, S.C., Hollyer, J.R. and Kodani, L.S. 2001. Mulch and compost effects on yield and corm rots of taro. Field Crops Research. 71(1): 101-112.
Mohler, C.L. 1993. A model of the effects of tillage on emergence of weed seedlings. Ecological Applications. 3(1): 53-73.
Mohler, C.L. 1996. Ecological bases for the cultural control of annual weeds. Journal of Production Agriculture. 9(4): 468-474.
Mohler, C.L. and Galford, A.E. 1997. Weed seedling emergence and seed survival: separating the effects of seed position and soil modification by tillage. Weed Research. 37(3): 147-155.
Monks, C.D., Monks, D.W., Basden, T., Selders, A., Poland, S. and Rayburn, E. 1997. Soil temperature, soil moisture, weed control, and tomato (Lycopersicon esculentum) response to mulching. Weed Technology. 11(3): 561-566.
Monteith, J.L. 2000. Fundamental equations for growth in uniform stands of vegetation. Agricultural and Forest Meteorology. 104(1): 5-11.
Moonen, A.C. and Bàrberi, P. 2002. A system-oriented approach to the study of weed suppression by cover crops and their residues. In: Cloutier, D.C., ed. Proceedings of the 5th EWRS Workshop on Physical and Cultural Weed Control. Scuola Superiore Sant'Anna di studi universitari e di perfezionamento, Pisa, Italy. 11-13 March 2002. European Weed Research Society, Pisa. pp. 184-191.
Morgan, W. 1990. Crop performance during conversion. In: Morgan, W.C., ed. Sustainable Vegetable Growing. Victorian Department of Agriculture and Rural Affairs, Frankston. pp. 18-19.
Morgan, W.C. 1989. Alternatives to herbicides. Plant Protection Quarterly. 4(1): 33-37. Morra, M.J. and Kirkegaard, J.A. 2002. Isothiocyanate release from soil-incorporated Brassica
tissues. Soil Biology and Biochemistry. 34(11): 1683-1690. Morse, R.D. 1999. No-till vegetable production - Its time is now. HortTechnology. 9(3): 373-379. Mortimer, A.M., Lubigan, R. and Piggin, C. 1997. Constraints and opportunities for weed
Moxham, R. 1992. Organic rice cultivation - for sustaining irrigation farming in the Riverina. In: Hutchinson, K.J. and Vickery, P.J., eds. Proceedings of the 6th Australian Agronomy Conference "Looking Back - Planning Ahead". Australian Society of Agronomy, University of New England, Armidale. pp. 442-445.
Munn, D.A. 1992. Comparison of shredded newspaper and wheat straw as crop mulches. HortTechnology. 2(3): 361-366.
Murphy, S.R. and Lodge, G.M. 2001. Plant density, litter and bare soil effects on actual evaporation and transpiration in autumn. In: Rowe, B., Mendham, N. and Donaghy, D., eds. 10th Australian Agronomy Conference. Science and Technology: Delivering Results for Agriculture. 28 January - 1 February 2001, Hobart, Tasmania. Australian Society of Agronomy, Hobart. pp. CD-ROM.
References
208
Mwaja, V.N., Masiunas, J.B. and Eastman, C.E. 1996. Rye (Secale cereale L.) and hairy vetch (Vicia villosa Roth) intercrop management in fresh-market vegetables. Journal of the American Society for Horticultural Science. 121(3): 586-591.
Nagabhushana, G.G., Worsham, A.D. and Yenish, J.P. 2001. Allelopathic cover crops to reduce herbicide use in sustainable agricultural systems. Allelopathy Journal. 8(2): 133-146.
Napier, T. 2001a. Selecting lettuce varieties. NSW Agriculture, Yanco. Napier, T. 2001b. Weed control in lettuce. NSW Agriculture, Yanco. Nelson, W.A., Kahn, B.A. and Roberts, B.W. 1991. Screening cover crops for use in conservation
tillage systems for vegetables following spring plowing. HortScience. 26(7): 860-862. Ngouajio, M. and McGiffen, M.E. 2002. Going organic changes weed population dynamics.
HortTechnology. 12(4): 590-596. Ngouajio, M., McGiffen, M.E. and Hutchinson, C.M. 2003. Effect of cover crop and management
system on weed populations in lettuce. Crop Protection. 22(1): 57-64. Niggli, U. 2002. The contribution of research to the development of organic farming in Europe. In:
Powell, J., ed. Proceedings of the UK Organic Research 2002 Conference: Research in Context. 26-28th March 2002 Aberystwyth. Organic Centre Wales, Institute of Rural Studies, University of Wales Aberystwyth, Aberystwyth. pp. 19-24.
Nilsson, U., Lundqvist, P. and Martensson, L. 2000. Organic farming and working conditions. In: Alföldi, T., Lockeretz, W. and Niggli, U., eds. IFOAM 2000 - The World Grows Organic. Proceedings of the 13th International IFOAM Scientific Conference. Convention Centre Basel, Switzerland 28 to 31 August 2000. vdf Hochschulverlag AG an der ETH Zurich, Basel. p. 674.
Norfleet, M.L., Rogers, K.M., Burt, E.C., Raper, R.L. and Burmester, C.H. 1996. Tillage effects on soil quality. In: MacEwan, R.J. and Carter, M.R., eds. Soil Quality is in the Hands of the Land Manager. Proceedings of an International Symposium. Advances in Soil Quality for Land Management: Science, Practice and Policy. 17-19 April 1996, University of Ballarat, Victoria. Centre for Environmental Management, University of Ballarat, Ballarat. pp. 69-72.
Northcote, K.H. 1984. A Factual Key for the Recognition of Australian Soils. Rellim Technical Publications, Adelaide.
NSW Agriculture. 2001. Farm Enterprise Budget. Lettuce - Fresh. NSW Agriculture, Orange. Obiefuna, J.C. 1991. The effect of crop residue mulches on the yield and production pattern of
plantain (Musa AAB). Biological Agriculture and Horticulture. 8(1): 71-80. OCIA International. 2002. 2002 International Certification Standards. Organic Crop Improvement
Association International, Lincoln, Nebraska. Odhiambo, J.J.O. and Bomke, A.A. 2000. Short term nitrogen availability following overwinter
cereal/grass and legume cover crop monocultures and mixtures in south coastal British Columbia. Journal of Soil and Water Conservation. 55(3): 347-354.
Odhiambo, J.J.O. and Bomke, A.A. 2001. Grass and legume cover crop effects on dry matter and nitrogen accumulation. Agronomy Journal. 93(2): 299-307.
OFRF. 1993. 1993 National Organic Farmers' Survey Results. Organic Farming Research Foundation, Santa Cruz.
OFRF. 1995. 1995 National Organic Farmers' Survey Results. Organic Farming Research Foundation, Santa Cruz.
Ohno, T., Doolan, K., Zibilske, L.M., Liebman, M., Gallandt, E.R. and Berube, C. 2000. Phototoxic effects on red clover amended soils on wild mustard seedling growth. Agriculture, Ecosystems and Environment. 78: 187-192.
Oien, D.N. 1997. Weed management strategies in organic farming systems. Saskatchewan Soil Conservation Association, Indian Head, Saskatchewan. <http://paridss.usask.ca/consgroups/ssca/97-Proceed/Oien.htm>. Accessed: 2/7/01.
Olasantan, F.O. 1999. Effect of time of mulching on soil temperature and moisture regime and emergence, growth and yield of white yam in western Nigeria. Soil and Tillage Research. 50(3-4): 215-221.
Olsen, J.K. and Gounder, R.K. 2001. Alternatives to polyethylene mulch film - a field assessment of transported materials in capsicum (Capsicum annuum L.). Australian Journal of Experimental Agriculture. 41(1): 93-103.
References
209
OPAC. 1998. National Standard for Organic and Bio-Dynamic Produce. Organic Produce Advisory Committee, Australian Quarantine and Inspection Service, Canberra.
Oriade, C. and Forcella, F. 1999. Maximizing efficacy and economics of mechanical weed control in row crops through forecasts of weed emergence. Journal of Crop Production. 2(1): 189-205.
Padel, S. 2001. Conversion to organic farming: A typical example of the diffusion of an innovation? Sociologia Ruralis. 41(1): 40-61.
Padel, S. and Lampkin, N.H. 1994. Conversion to organic farming: an overview. In: Lampkin, N.H. and Padel, S., eds. The Economics of Organic Farming: an International Perspective. CAB International, Wallingford. pp. 295-313.
Pannell, P.B.W. and Pannell, D.J. 1999. Introduction to social surveying: pitfalls, potential problems and preferred practices. SEA Working Paper 99/04. SEA News (Newsletter on Bioeconomic and Social Research on Sustainability and Economics in Agriculture). 3.
Parish, S. 1990. A review of non-chemical weed control techniques. Biological Agriculture and Horticulture. 7(2): 117-137.
Parmenter, G.A., Burgmans, J., Burton, L., Douglas, M., Follet, J., Gray, G. and Smallfield, B. 1992. Production of the medicinal crops Valerian and Echinacea in New Zealand. Proceedings of the Agronomy Society of New Zealand. 22: 61-65.
Parmenter, G.A. and Littlejohn, R.P. 1997. Planting density effects on root yield of purple coneflower (Echinacea purpurea (L.) Moench). New Zealand Journal of Crop and Horticultural Science. 25(2): 169-175.
Parr, J.F. and Papendick, R.I. 1978. Factors affecting the decomposition of crop residues by microorganism. In: Oschwald, W.R., ed. Crop Residue Management Systems. American Society of Agronomy/Crop Science Society of America/Soil Science Society of America, Madison. pp. 101-129.
Patriquin, D.G. 1988. Weed control in organic farming systems. In: Altieri, M.A. and Liebman, M., eds. Weed Management in Agroecosystems: Ecological Approaches. CRC Press, Boca Raton. pp. 303-317.
Paxson, M.C. 1995. Increasing survey response rates: practical instructions from the total-design method. Cornell Hotel and Restaurant Administration Quarterly. 36(4): 66-73.
Peacock, L. 1990. Practical constraints and opportunities for improving crop protection in organic vegetable production. In: Crop Protection in Organic and Low Input Agriculture: Options for Reducing Agrochemical Usage. British Crop Protection Council, Surrey. pp. 157-162.
Pearce, S.C. 1993. Data analysis in agricultural experimentation. III. Multiple comparisons. Experimental Agriculture. 29: 1-8.
Peet, M. 1996. Sustainable Practices for Vegetable Production in the South. Focus Publishing, Newburyport.
Penfold, C. 1997. Biological Farming Systems Trial. In: Dumaresq, D., Greene, R. and van Kerkhoff, L., eds. Organic Agriculture in Australia: Proceedings of the National Symposium on Organic Agriculture: Research and Development 30 June - 3 July, 1996. Rural Industries Research and Development Corporation, Barton. pp. 82-83.
Penfold, C. 2001. Managing weeds organically. In: RIRDC, ed. The Organic Challenge: Unity Through Diversity. RIRDC's Inaugural National Organics Conference 2001. Darling Harbour, Sydney, Australia, 27-28th August 2001. Rural Industries Research and Development Corporation, Barton. pp. 120-121.
Penfold, C.M. and Miyan, M.S. 1996. IWMA - Integrated weed management alternatives. In: Shepherd, R.C.H., ed. Eleventh Australian Weeds Conference. 30 September - 3 October 1996. Weed Society of Victoria, Frankston. pp. 73-75.
Penfold, C.M. and Miyan, M.S. 1998. Organic farming - now and the future. In: Michalk, D.L. and Pratley, J.E., eds. Proceedings of the 9th Australian Agronomy Conference "Agronomy - Growing a Greener Future". Australian Society of Agronomy, Charles Sturt University, Wagga Wagga. pp. 669-672.
Penfold, C.M., Miyan, M.S., Reeves, T.G. and Grierson, I.T. 1995. Biological farming for sustainable agricultural production. Australian Journal of Experimental Agriculture. 35(7): 849-856.
References
210
Petersen, J., Belz, R., Walker, F. and Hurle, K. 2001. Weed suppression by release of isothiocyanates from turnip-rape mulch. Agronomy Journal. 93(1): 37-43.
Peterson, A. 2000. Alternatives, traditions, and diversity in agriculture. Agriculture and Human Values. 17(1): 95-106.
Pfeiffer, E.E. 1970. Weeds and What They Tell. Bio-Dynamic Farming and Gardening Association, Inc, Kimberton.
Philipps, L., Welsh, J.P., Bulson, H.A.J. and Woodward, L. 1998. Agronomic viability and potential economic performance of three organic four-year rotations without livestock, 1988-1998. In: Foguelman, D. and Lockeretz, W., eds. Organic Agriculture - the Credible Solution for the XXIst Century: Proceedings of the 12th International IFOAM Scientific Conference. International Federation of Organic Agriculture Movements, Mar del Plata, Argentina. pp. 109-115.
Piggot, T.J. 1997. Vegetable crops. In: Reuter, D.J. and Robinson, J.B., eds. Plant Analysis: An Interpretation Manual. Inkata Press, Melbourne and Sydney. pp. 148-87.
Polachic, D. 1996. Growing Echinacea for profit. Small Farm Today. 13(April): 53. Popay, I., Daly, M., Knight, T., Stiefel, W. and White, S. 1992. Weed control in "organic" arable
crops in New Zealand. In: Richardson, R.G., ed. Proceedings of the First International Weed Control Congress. Weed Science Society of Victoria, Melbourne. pp. 391-393.
Popay, I. and Field, R. 1992. Grazing animals as biological control agents. In: Richardson, R.G., ed. Proceedings of the First International Weed Control Congress. Weed Science Society of Victoria, Melbourne. pp. 273-277.
Porter, P.M., Huggins, D.R., Perillo, C.A., Quiring, S.R. and Crookston, R.K. 2003. Organic and other management strategies with two- and four-year crop rotations in Minnesota. Agronomy Journal. 95(2): 233-244.
Pratley, J.E. 2000. Tillage and other physical management methods. In: Sindel, B., ed. Australian Weed Management Systems. R.G. and F.J. Richardson, Melbourne. pp. 105-122.
Price, H.C. and Baughan, R.A. 1985. Establishment of fresh market tomatoes in a no-till system. Acta Horticulturae. 198: 261-268.
Pullen, D.W.M. and Cowell, P.A. 1997. An evaluation of the performance of mechanical weeding mechanisms for use in high speed inter-row weeding of arable crops. Journal of Agricultural Engineering Research. 67(1): 27-34.
Radics, L. and Székelyné Bognár, E. 2002. Comparison of different mulching methods for weed control in organic green bean and tomato. In: Cloutier, D.C., ed. Proceedings of the 5th EWRS Workshop on Physical and Cultural Weed Control. Scuola Superiore Sant'Anna di studi universitari e di perfezionamento, Pisa, Italy. 11-13 March 2002. European Weed Research Society, Pisa. pp. 192-204.
Rahman, M.A. 1999. Information Sources and the Needs of Organic Farmers. Horticultural Management Group, Applied Management and Computing Division, Lincoln University, Canterbury, New Zealand.
Rahman, S. and Khan, A.H. 2001. Mulching-induced alteration of microclimatic parameters on the morpho-physiological attributes in onion (Allium cepa L.). Plant Production Science. 4(3): 241-248.
Rajcan, I. and Swanton, C.J. 2001. Understanding maize-weed competition: resource competition, light quality and the whole plant. Field Crops Research. 71(2): 139-150.
Rangarajan, A. and Ingall, B. 2001. Mulch color affects radicchio quality and yield. HortScience. 36(7): 1240-1243.
Rasmussen, I.A. 1999. Slutrapport 1999. Forskningsprogram: Jordbrugsfaglige og anvendelsesorienterede forsknings- og udviklingsopgaver I økologisk jordbrug. Danmarks JordbrugsForskning, Slagelse.
Rasmussen, I.A., Melander, B., Rasmussen, K., Jensen, R.K., Hansen, P.K., Rasmussen, G., Christensen, S. and Rasmussen, J. 2000. Recent advances in weed management in cereals in Denmark. In: Alföldi, T., Lockeretz, W. and Niggli, U., eds. IFOAM 2000 - The World Grows Organic. Proceedings of the 13th International IFOAM Scientific Conference. Convention Centre Basel, Switzerland 28 to 31 August 2000. vdf Hochschulverlag AG an der ETH Zurich, Basel. p. 178.
References
211
Rasmussen, J. 1996. Mechanical weed management. In: Brown, H., ed. Proceedings, Second International Weed Control Congress, Copenhagen, Denmark, 25-28 June 1996, Copenhagen. pp. 943-948.
Rasmussen, J. and Ascard, J. 1995. Weed control in organic farming systems. In: Glen, D.M., Greaves, M.P. and Anderson, H.M., eds. Ecology and Integrated Farming Systems. John Wiley and Sons, Bristol. pp. 49-67.
Rasmussen, J. and Svenningsen, T. 1995. Selective weed harrowing in cereals. Biological Agriculture and Horticulture. 12(1): 29-46.
Rasmussen, K. 1998. Feed the crop and starve the weeds. In: Foguelman, D. and Lockeretz, W., eds. Organic Agriculture - the Credible Solution for the XXIst Century: Proceedings of the 12th International IFOAM Scientific Conference. International Federation of Organic Agriculture Movements, Mar del Plata, Argentina. pp. 186-189.
Rea, L.M. and Parker, R.A. 1997. Designing and Conducting Survey Research: A Comprehensive Guide. Jossey-Bass Publishers, San Francisco.
Reddiex, S.J., Wratten, S.D., Hill, G.D., Bourdôt, G.W. and Frampton, C.M. 2001. Evaluation of mechanical weed management techniques on weed and crop populations. Proceedings of the 54th New Zealand Plant Protection Conference: 174-178.
Reddy, K.N. 2001. Effects of cereal and legume cover crop residues on weeds, yield, and net return in soybean (Glycine max). Weed Technology. 15: 660-668.
Reeve, I.J., Kaine, G., Lees, J.W. and Barclay, E. 2000. Producer perceptions of pasture decline and grazing management. Australian Journal of Experimental Agriculture. 40(2): 331-341.
Reganold, J.P., Glover, J.D., Andrews, P.K. and Hinman, H.R. 2001. Sustainability of three apple production systems. Nature. 410: 926 - 930.
Reuter, D.J. and Robinson, J.B. 1997. Plant Analysis: An Interpretation Manual. Inkata Press, Melbourne and Sydney.
Rickson, R.E., Saffigna, P. and Sanders, R. 1997. Dynamics of Organic Farming in Australia: A Preliminary Analysis. In: Dumaresq, D., Greene, R. and van Kerkhoff, L., eds. Organic Agriculture in Australia: Proceedings of the National Symposium on Organic Agriculture: Research and Development 30 June - 3 July, 1996. Rural Industries Research and Development Corporation, Barton. pp. 80-81.
Ridgely, A.M. 1996. Preliminary Survey Results: The Status of Cover Cropping in Annual Crop Rotations. Sustainable Agriculture Research and Education Program, University of California, Davis.
Ridgely, A.M. and Van Horn, M. 1995. Survey of annual crop growers regarding cover crops. Sustainable Agriculture Technical Reviews. 7(4).
Riechert, S.E. and Bishop, L. 1990. Prey control by an assemblage of generalist predators: spiders in garden test systems. Ecology. 71(4): 1441-1450.
Rietveld, W.J. 1977. Phytotoxic effects of bunchgrass residues on germination and initial root growth of yellow sweetclover. Journal of Range Management. 30(1): 39-43.
Riley, J. 2001. Presentation of statistical analyses. Experimental Agriculture. 37(1): 115-123. RIRDC. 2000. R&D Plan for the Culinary Herb Industry 2000 - 2005. Rural Industries Research
and Development Corporation, Barton. RIRDC. 2003. Organic Produce Research Program. Rural Industries Research and Development
Corporation, Barton. <http://www.rirdc.gov.au/programs/org.html>. Accessed: 2/4/03. Roads, M.J. 1989. The Natural Magic of Mulch. Organic Gardening Australian Style. Greenhouse
45. Roberts, W.S. and Swinton, S.M. 1996. Economic methods for comparing alternative crop
production systems: a review of the literature. American Journal of Alternative Agriculture. 11(1): 10-17.
Robertson, G.P. 1997. Nitrogen use efficiency in row-crop agriculture: crop nitrogen use and soil nitrogen loss. In: Jackson, L.E., ed. Ecology in Agriculture. Academic Press, San Diego. pp. 347-365.
Robson, M.C., Fowler, S.M., Lampkin, N.H., Leifert, C., Leitch, M., Robinson, D., Watson, C.A. and Litterick, A.M. 2002. The agronomic and economic potential of break crops for ley/arable rotations in temperate organic agriculture. Advances in Agronomy. 77: 369-427.
References
212
Rodale, J.I. 1960. Complete Book of Composting. Rodale Books, Emmaus. Roe, N.E., Stoffella, P.J. and Bryan, H.H. 1994. Growth and yields of bell pepper and winter
squash grown with organic and living mulches. Journal of the American Society for Horticultural Science. 119(6): 1193-1199.
Rogers, G., Silcock, S., Little, S. and Williams, L. 2000. Integrated system improves vegetable establishment results. Good Fruit and Vegetables. March: 35-36.
Roltsch, W.J., Zalom, F.G., Strawn, A.J., Strand, J.F. and Pitcairn, M.J. 1999. Evaluation of several degree-day estimation methods in California climates. International Journal of Biometeorology. 42: 169-176.
Rowan, R.C. and White, L.D. 1994. Regional differences among Texan rangeland operators. Journal of Range Management. 47(5): 338-343.
Rubin, H. 1997. The Organic Herb Growers of Australia Inc. In: Dumaresq, D., Greene, R. and van Kerkhoff, L., eds. Organic Agriculture in Australia: Proceedings of the National Symposium on Organic Agriculture: Research and Development 30 June - 3 July, 1996. Rural Industries Research and Development Corporation, Barton. p. 11.
Rubin, H. 2001. Supporting the Growth of the Australian Herb Growing Industry. Rural Industries Research and Development Corporation, Barton.
Runham, S.R. and Town, S.J. 1995. An economic assessment of mulches in field scale vegetable crops. Brighton Crop Protection Conference - Weeds. 3: 925-930.
Runham, S.R., Town, S.J. and Fitzpatrick, J.C. 2000. Evaluation over four seasons of a paper mulch used for weed control in vegetables. Acta Horticulturae. 513: 193-201.
Russo, V.M. 1992. Effects of planting date and spray-on mulch on yield of eggplant cultivars. Journal of Sustainable Agriculture. 3(1): 41-50.
Sadowski, T. and Tyburski, J. 2000. Weed infestation of spring wheat grown on organic vs conventional farms. In: Alföldi, T., Lockeretz, W. and Niggli, U., eds. IFOAM 2000 - The World Grows Organic. Proceedings of the 13th International IFOAM Scientific Conference. Convention Centre Basel, Switzerland 28 to 31 August 2000. vdf Hochschulverlag AG an der ETH Zurich, Basel. p. 186.
Samuel, A.M. and Guest, S.J. 1990. Weed studies in organic and conventional cereals. In: Crop Protection in Organic and Low Input Agriculture: Options for Reducing Agrochemical Usage. British Crop Protection Council, Surrey. pp. 183-186.
Santos, J.R.A. and Leskovar, D.I. 1997. Interference from broccoli; vege residue on Brassica germination and seedling growth. Journal of the American Society for Horticultural Science. 122(5): 715-720.
SAREP. 2001. UC SAREP Cover Crop Resource Page. Sustainable Agriculture Research and Education Program, University of California, Davis. <http://www.sarep.ucdavis.edu/ccrop/>. Accessed: 24/7/01.
Scagnozzi, A., Saviozzi, A., Levi, M.R. and Riffaldi, R. 1997. Nutrient release from decomposing crop residues in soil: a laboratory experiment. American Journal of Alternative Agriculture. 12(1): 10-13.
Schäfer, W., Väisänen, J. and Pihala, M. 2001. Technique of green mulch spreading. Agricultural Engineering Research, MTT Agrifood Research, Vakola.
Schimpf, W. and Lundberg-Schimpf, T. 1998. Echinacea Farm. Medicinal Herb Farm, Kelowna, British Columbia. <http://www.geocities.com/HotSprings/5760/>. Accessed: 7/10/98.
Schonbeck, M., Browne, J., Deziel, G. and DeGregoria, R. 1991. Comparison of weed biomass and flora in four cover crops and a subsequent lettuce crop on three New England organic farms. Biological Agriculture and Horticulture. 8(2): 123-143.
Schonbeck, M.W. 1998. Weed suppression and labor costs associated with organic, plastic, and paper mulches in small-scale vegetable production. Journal of Sustainable Agriculture. 13(2): 13-33.
Schonbeck, M.W. and Evanylo, G.K. 1998. Effects of mulches on soil properties and tomato production. I. Soil temperature, soil moisture and marketable yield. Journal of Sustainable Agriculture. 13(1): 55-81.
Schot, S.L. 1983. Herbal Codex. Earthventure, Mapleton. Schwinning, S. and Weiner, J. 1998. Mechanisms determining the degree of size asymmetry in
competition among plants. Oecologia. 113(4): 447-455.
References
213
Scialabba, N.E. and Hattam, C., eds. 2002. Organic Agriculture, Environment and Food Security. Food and Agriculture Organization of the United Nations, Rome.
Seefeldt, S.S. and Armstrong, M.L. 2000. Impact of perennial ryegrass seeding densities on weed emergence, growth and development. New Zealand Plant Protection. 53: 38-43.
Sellen, D., Tolman, J.H., McLeod, D.G.R., Weersink, A. and Yiridoe, E.K. 1995. A comparison of financial returns during early transition from conventional to organic vegetable production. Journal of Vegetable Crop Production. 1(2): 11-39.
Senesac, A. 1998. Utilizing pelletized paper mulch in combination with herbicides for weed control in container-grown perennials and annuals. Proceedings of the Annual Meeting - Northeastern Weed Science Society. 52: 132.
Seneviratne, G., van Holm, L.H.J. and Kulasooriya, S.A. 1998. Quality of different mulch materials and their decomposition and N release under low moisture regimes. Biology and Fertility of Soils. 26(2): 136-140.
Shennan, C., Drinkwater, L.E., van Bruggen, A.H.C., Letourneau, D.K. and Workneh, F. 1991. Comparative study of organic and conventional tomato production systems: an approach to on-farm systems studies. In: Board on Agriculture (National Research Council), ed. Sustainable Agricultural Research and Education in the Field: A Proceedings. National Academy Press, Washington, DC. pp. 109-132.
Shrestha, A., Knezevic, S.Z., Roy, R.C., Ball-Coelho, B.R. and Swanton, C.J. 2002. Effect of tillage, cover crop and crop rotation on the composition of weed flora in a sandy soil. Weed Research. 42(1): 76-87.
Sichivitsa, J.O., Gilliam, C.H., Edwards, J.H., Keever, G.J. and Olive, J.W. 1998. Recycled newspaper reduces nitrate leaching from nursery containers. Southern Nursery Association Research Conference. 34: 76-79.
Simmons, G. and Newman, S. 2000. OHGA Survey 2000. Part 1. The Herb Grower. September/October: 14-17.
Sindel, B.M. 1996. Grazier attitudes to weeds, research and education in northern New South Wales. In: Shepherd, R.C.H., ed. Eleventh Australian Weeds Conference. 30 September - 3 October 1996. Weed Society of Victoria, Frankston, Victoria. pp. 247-250.
Sindel, B.M. and Michael, P.W. 1988. Survey of the impact and control of fireweed (Senecio madagascariensis Poir.) in New South Wales. Plant Protection Quarterly. 3(1): 22-28.
Sjursen, H. 2001. Change of the weed seed bank during the first complete six-course crop rotation after conversion from conventional to organic farming. Biological Agriculture and Horticulture. 19(1): 71-90.
Smeda, R.J. and Weller, S.C. 1996. Potential of rye (Secale cereale) for weed management in transplant tomatoes (Lycopersicon esculentum). Weed Science. 44(3): 596-602.
Smestad, B.T., Tiessen, H. and Buresh, R.J. 2002. Short fallows of Tithonia diversifolia and Crotalaria grahamiana for soil fertility improvement in western Kenya. Agroforestry Systems. 55(3): 181-194.
Smith, D.R., Gilliam, C.H., Edwards, J.H., Eakes, D.J. and Williams, J.D. 1997. Recycled waste paper as a landscape mulch. Journal of Environmental Horticulture. 15(4): 191-196.
Smith, D.R., Gilliam, C.H., Edwards, J.H., Olive, J.W., Eakes, D.J. and Williams, J.D. 1998. Recycled waste paper as a non-chemical alternative for weed control in container production. Journal of Environmental Horticulture. 16(2): 69-75.
Smith, M. 1994. The Real Dirt: Farmers Tell About Organic and Low-Input Practices in the Northeast. Northeast Regional Sustainable Agriculture Research and Education, Burlington.
Smyth, G.K. 2001. Tweedie. Tweedie generalized linear model family. Statistical Science Web, Melbourne. <http://www.statsci.org/s/tweedief.html>. Accessed: 16/11/01.
Smyth, G.K. and Verbyla, A.P. 1999. Adjusted likelihood methods for modelling dispersion in generalized linear models. Environmetrics. 10(6): 695-709.
Søgaard, H.T. and Olsen, H.J. 2003. Determination of crop rows by image analysis without segmentation. Computers and Electronics in Agriculture. 38(2): 141-158.
Soilmoisture Equipment Corporation. 1996. 6050X1 Operating Instructions. Trase System 1 - For Soil Moisture Measurement - Version 2000 Software. Soilmoisture Equipment Corporation, Goleta, California.
Steiner, R. 1974. Agriculture: a course of eight lectures given at Koberwitz, Silesia, 7th to 16th June, 1924. Bio-Dynamic Agricultural Association, London.
References
214
Stepniewski, W. and Przywara, G. 1992. The influence of soil oxygen availability on yield and nutrient uptake (N, P, K, Ca, Mg, Na) by winter rye (Secale cereale). Plant and Soil. 143(2): 267-274.
Stevenson, F.C., Légère, A., Simard, R.R., Angers, D.A., Pageau, D. and Lafond, J. 1997. Weed species diversity in spring barley varies with crop rotation and tillage, but not with nutrient source. Weed Science. 45(6): 798-806.
Stirzaker, R.J. 1999. The problem of irrigated horticulture: matching the biophysical efficiency with the economic efficiency. Agroforestry Systems. 45(1-3): 187-202.
Stirzaker, R.J. and Bunn, D.G. 1996. Phytotoxicity of ryegrass and clover cover crops, and a lucerne alley crop for no-till vegetable production. Biological Agriculture and Horticulture. 13(1): 83-101.
Stirzaker, R.J., Bunn, D.G., Cook, F.J., Sutton, B.G. and White, I. 1995. No-tillage vegetable production using cover crops and alley cropping. In: Cook, H.F. and Lee, H.C., eds. Soil Management in Sustainable Agriculture. Wye College Press, Wye. pp. 466-474.
Stivers-Young, L.J. 1998. Growth, nitrogen accumulation, and weed suppression by fall cover crops following early harvest of vegetables. HortScience. 33(1): 60-63.
Stivers-Young, L.J. and Tucker, F.A. 1999. Cover-cropping practices of vegetable producers in western New York. HortTechnology. 9(3): 459-465.
Stoller, E.W., Wax, L.M. and Alm, D.M. 1993. Survey results on environmental issues and weed science research priorities within the corn belt. Weed Technology. 7: 763-770.
Stonehouse, D.P., Weise, S.F., Sheardown, T., Gill, R.S. and Swanton, C.J. 1996. A case study approach to comparing weed management strategies under alternative farming systems in Ontario. Canadian Journal of Agricultural Economics. 44(1): 81-99.
Stopher, P.R. and Meyburg, A.H. 1979. Survey Sampling and Multivariate Analysis for Social Scientists and Engineers. Lexington Books, Lexington.
Strand, J.A. and Weisner, S.E.B. 2001. Morphological plastic responses to water depth and wave exposure in an aquatic plant (Myriophyllum spicatum). Journal of Ecology. 89(2): 166-175.
Sustainable Agriculture Network, ed. 1998. Managing Cover Crops Profitably. Sustainable Agriculture Research and Education Program, Washington, DC.
Sutton, B.G. 1998. Sustainable Horticulture Using In Situ Mulches. Rural Industries Research and Development Corporation, Barton.
Switala, J. 1999. Echinacea: A Commercial Overview. Queensland Department of Primary Industries, Brisbane.
Teasdale, J.R. 1993. Interaction of light, soil moisture, and temperature with weed suppression by hairy vetch residue. Weed Science. 41(1): 46-51.
Teasdale, J.R. 1996. Contribution of cover crops to weed management in sustainable agricultural systems. Journal of Production Agriculture. 9(4): 475-479.
Teasdale, J.R. 1998. Cover plants, smother plants, and weed management. In: Hatfield, J.L., Buhler, D.D. and Stewart, B.A., eds. Integrated Weed and Soil Management. Ann Arbour Press, Chelsea, Michigan. pp. 247-270.
Teasdale, J.R. and Abdul-Baki, A.A. 1995. Soil temperature and tomato growth associated with black polyethylene and hairy vetch mulches. Journal of the American Society for Horticultural Science. 120(5): 848-853.
Teasdale, J.R. and Abdul-Baki, A.A. 1997. Growth analysis of tomatoes in black polyethylene and hairy vetch production systems. HortScience. 32(4): 659-663.
Teasdale, J.R. and Mohler, C.L. 1993. Light transmittance, soil temperature, and soil moisture under residue of hairy vetch and rye. Agronomy Journal. 85(3): 673-680.
Teasdale, J.R. and Mohler, C.L. 2000a. The physical properties of mulches contributing to weed suppression. In: Légère, A., ed. Proceedings of the 3rd International Weed Science Congress, Foz do Iguacu, Brazil, 6-11 June 2000. International Weed Science Society, Corvallis.
Teasdale, J.R. and Mohler, C.L. 2000b. The quantitative relationship between weed emergence and the physical properties of mulches. Weed Science. 48(3): 385-392.
Thompson, J.A., Nelson, R.L. and Schweitzer, L.E. 1995. Relationships among specific leaf weight, photosynthetic rate, and seed yield in soybean. Crop Science. 35(6): 1575-1581.
Thompson, K., Grime, J.P. and Mason, G. 1977. Seed gemination in response to diurnal fluctuations in temperature. Nature. 267: 147-149.
References
215
Thompson, R., ed. 2002. Cultivating Communities. Proceedings of the 14th IFOAM Organic World Congress. Victoria, Canada, 21 to 28 August 2002. Canadian Organic Growers, Ottawa.
Thornley, J.H.M. and Johnson, I.R. 1990. Plant and Crop Modelling: A Mathematical Approach to Plant and Crop Physiology. Clarendon Press, Oxford.
Thun, M. 1980. Unkraut aus der Sicht der Konstellations- und Potenzforschung (Weeds from the view of constellation and potency research). Aussaatage - M. Thun Verlag, Biedenkopf.
Tian, G., Kang, B.T. and Brussaard, L. 1993. Mulching effect of plant residues with chemically contrasting compositions on maize growth and nutrients accumulation. Plant and Soil. 153(2): 179-187.
Tillett, N. and Home, M. 2002. Cultivations at hoeing depth. In: Welsh, J.P., Tillett, N., Home, M. and King, J.A., eds. A Review of Knowledge. Inter-Row Hoeing and its Associated Agronomy in Organic Cereal and Pulse Crops. Elm Farm Research Centre, Newbury. pp. 33-50.
Tillett, N.D., Hague, T. and Miles, S.J. 2002. Inter-row vision guidance for mechanical weed control in sugar beet. Computers and Electronics in Agriculture. 33(3): 163-177.
Titley, M. 1998. Vegetable crop establishment. In: Salvestrin, J., ed. Australian Vegetable Growing Handbook. Scope Publishing, Frankston. pp. 22-35.
Titley, M. 2000. Food service and food safety - challenges and opportunities. In: Fresh 2000 Conference. Cairns, Queensland. 31 August - 1 September 2000, Cairns.
Topp, G.C., Watt, M., Hayhoe, H.N. and Rochette, P. 1996. Point specific measurement and monitoring of soil water content with an emphasis on TDR. Canadian Journal of Soil Science. 76(3): 307-316.
TPNP. 2003. International Plant Names Index. The Plant Names Project, Kew. <http://www.ipni.org/>. Accessed: 2/6/03.
Traore, A. and Maranville, J.W. 1999. Effect of nitrate/ammonium ratio on biomass production, nitrogen accumulation, and use efficiency in sorghums of different origin. Journal of Plant Nutrition. 22(4-5): 813-825.
Trotter, M.G. and Sindel, B.M. 1999. Best Practice Management (BPM) for thistles on the Northern Tablelands of NSW and its potential in weed research. In: Bishop, A., Boersma, M. and Barnes, C.D., eds. Proceedings of the 12th Australian Weeds Conference. Tasmanian Weeds Society, Hobart. pp. 261-265.
Turner, R.J. and Grundy, A.C. 2002. Weed control strategies in organically grown carrots. In: Powell, J., ed. Proceedings of the UK Organic Research 2002 Conference: Research in Context. 26-28th March 2002 Aberystwyth. Organic Centre Wales, Institute of Rural Studies, University of Wales Aberystwyth, Aberystwyth. pp. 229-230.
Turner, R.J., Lennartsson, M.E.K., Bond, W., Grundy, A.C. and Whitehouse, D. 1999. Organic weed control - getting it right in time. In: Marshal, G., ed. Proceedings of the 1999 Brighton Conference - Weeds. 15-18 November 1999. Hilton Brighton Metropole Hotel, UK. British Crop Protection Council, Surrey. pp. 969-974.
Tyler, S. 1999. Results of Organic Waste as Mulch on Echinacea. Ecofix, Gosford. Tyler, S. 2000. Final Report of On Farm Trial of Organic Waste as Surface Mulch. Ecofix,
Tenambit. UC-IPM. 2001. Degree-days and Phenology Models: Concepts. University of California -
Integrated Pest Management (UCIPM) Project, Davis. <http://www.ipm.ucdavis.edu/WEATHER/ddconcepts.html>. Accessed: 1/12/01.
UKROFS. 2001. UKROFS (United Kingdom Register of Organic Food Standards) Standards for Organic Food Production. Ministry of Agriculture, Fisheries and Food, United Kingdom.
Umbers, A.C. 1994. Allelochemicals from Brassica spp. (Canola) residues: effects on other plants and cereal fungal pathogens. University of New England, Armidale. Master of Rural Science thesis.
Umezaki, T. and Tsuno, K. 1998. Effects of used-paper mulching on growth of early-season culture rice. Japanese Journal of Crop Science. 67(2): 143-148.
Unger, P.W. 2001. Paper pellets as a mulch for dryland grain sorghum production. Agronomy Journal. 93(2): 349-357.
Unger, P.W. and Vigil, M.F. 1998. Cover crop effects on soil water relationships. Journal of Soil and Water Conservation. 53(3): 200-207.
Uri, N.D. 2000. Perceptions on the use of no-till farming in production agriculture in the United States: an analysis of survey results. Agriculture, Ecosystems and Environment. 77: 263-266.
References
216
van Elsen, T. 2000. Species diversity as a task for organic agriculture in Europe. Agriculture, Ecosystems and Environment. 77(1): 101-109.
van Elzakker, B. and Caldas, T. 1999. Comparing the costs of organic and conventional cotton. In: Meyers, D. and Stolton, S., eds. Organic Cotton: From Field to Final Product. Intermediate Technology Publications, London. pp. 86-100.
van Rijswijk, G. 1999. Using a 'total system' approach to waste policy. Association of Liquidpaperboard Carton Manufacturers Incorporated,
North Sydney. Venables, W.N. and Ripley, B.D. 1999. Modern Applied Statistics with S-PLUS. Springer Verlag,
New York. Vera, C.L., McGregor, D.I. and Downey, R.K. 1987. Detrimental effects of volunteer Brassica on
production of certain cereal and oilseed crops. Canadian Journal of Plant Science. 67: 983-995. Virtual Consulting Group. 2000. Development of a Strategic Plan for the Australian Organic
Industry. CAB International, Lara. Vogel, G. and Flogel, I. 1992. Pak-Choi mit Vlies und Kulturschutznetzen bedeckt (Pak-choi
protected with fleece and netting). Gartenbau Magazin. 1(6): 55-57. Von Bomme, U., Hölzl, J., Heßler, C. and Stahn, T. 1992. Wie beeinflußt die Sorte Wirkstoffgehalt
und Ertrag von Echinacea purpurea (L.) Moench im Hinblick auf die pharmazeutische Nutzung? 2. Mitt.: Ergebnisse des zweiten Standjahres und Gesamtbeurteilung. (How does variety influence active substance contents and crop yield of Echinacea purpurea (L.) Moench with regard to its pharmaceutical use? 2. Report: Results of the second year of planting and overall evaluation). Bayerisches Landwirtschaftliches Jahrbuch. 69(3): 323-342.
Voundi Nkana, J.C., Tack, F.M.G. and Verloo, M.G. 1999. Comparing the effects of paper pulp and lime additions to acid tropical soils using batch experiments. Journal of Plant Nutrition and Soil Science. 162(2): 207-213.
Wade, M.K. and Sanchez, P.A. 1983. Mulching and green manure applications for continuous crop production in the Amazon Basin. Agronomy Journal. 75: 39-45.
Wagger, M.G., Cabrera, M.L. and Ranells, N.N. 1998. Nitrogen and carbon cycling in relation to cover crop residue quality. Journal of Soil and Water Conservation. 53(3): 214-218.
Walker, G.E. and Morey, B.G. 1999. Effect of brassica and weed manures on abundance of Tylenchulus semipenetrans and fungi in citrus orchard soil. Australian Journal of Experimental Agriculture. 39(1): 65-72.
Wallace, E. 2000. VGH 2000. Vegetable Growers' Handbook. A Basic Guide for the Commercial Production of Vegetable Crops in New Zealand. Agro-Research Enterprises, Havelock North.
Walters, C. 1996. Weeds: Control Without Poisons. Acres USA, Metairie, Lousiana. Walz, E. 1999. Final Results of the Third Biennial National Organic Farmers' Survey. Organic
Farming Research Foundation, Santa Cruz. Wardle, D.A., Nicholson, K.S. and Ahmed, M. 1992. Comparison of osmotic and allelopathic
effects of grass leaf extracts on grass seed germination and radicle elongation. Plant and Soil. 140: 315-319.
Wardle, D.A., Nilsson, M.-C., Gallett, C. and Zackrisson, O. 1998. An ecosystem-level perspective of allelopathy. Biological Reviews of the Cambridge Philosophical Society. 73: 305-319.
Wardle, D.A., Yeates, G.W., Watson, R.N. and Nicholson, K.S. 1993. Response of soil microbial biomass and plant litter decomposition to weed management strategies in maize and asparagus cropping systems. Soil Biology and Biochemistry. 25(7): 857-868.
Watkinson, A.R., Freckleton, R.P. and Dowling, P.M. 2000. Weed invasions of Australian farming systems: from ecology to economics. In: Perrins, C., Williamson, M. and Dalmazzone, S., eds. The Economics of Biological Invasions. E. Elgar, Cheltenham. pp. 94-114.
Watson, A.K. 1992. Biological and other alternative control measures. In: Richardson, R.G., ed. Proceedings of the First International Weed Control Congress. Weed Science Society of Victoria, Melbourne. pp. 64-73.
Waycott, W. 1995. Photoperiodic response of genetically diverse lettuce accessions. Journal of the American Society for Horticultural Science. 120(3): 460-467.
Weaver, S.E. 1984. Critical period of weed competition in three vegetable crops in relation to management practices. Weed Research. 24: 317-325.
Weaver, S.E. and Tan, C.S. 1983. Critical period of weed interference in transplanted tomatoes (Lycopersicon esculentum): growth analysis. Weed Science. 31: 476-481.
References
217
Webster, R. and Payne, R.W. 2002. Analysing repeated measurements in soil monitoring and experimentation. European Journal of Soil Science. 53(1): 1-13.
Weidenhamer, J.D. 1996. Distinguishing resource competition and chemical interference: overcoming the methodological impasse. Agronomy Journal. 88: 866-875.
Wells, T. 1996. Environmental impact of alternative horticultural production systems in the Hawkesbury-Nepean catchment. NSW Agriculture, Gosford.
Welsh, J.P., Bulson, H.A.J., Stopes, C.E., Froud-Williams, R.J. and Murdoch, A.J. 1997. Mechanical weed control in organic winter wheat. Aspects of Applied Biology. 50: 375-384.
Welsh, J.P., Philipps, L., Bulson, H.A.J. and Wolfe, M. 1999. Weed control strategies for organic cereal crops. In: Marshal, G., ed. Proceedings of the 1999 Brighton Conference - Weeds. 15-18 November 1999. Hilton Brighton Metropole Hotel, UK. British Crop Protection Council, Surrey. pp. 945-950.
West, S. 1998. Weed control in vegetable crops. In: Salvestrin, J., ed. Australian Vegetable Growing Handbook. Scope Publishing, Frankston. pp. 266-297.
Weston, L.A. 1996. Utilization of allelopathy for weed management in agroecosystems. Agronomy Journal. 88(6): 860-866.
Whitten, G. 1999. Herbal Harvest. Bloomings Books, Hawthorn. Whitworth, J.L. 1995. The ability of some cover crops to suppress common weeds of strawberry
fields. Journal of Sustainable Agriculture. 7(2/3): 137-145. Wilkie, J. and Plane, M. 2000. Gundaroo Tiller. The Organic Garden-Farm Supply Company.
Gundaroo Tiller, Gundaroo. <http://www.allsun.com.au>. Accessed: 30/9/00. Willer, H. and Yussefi, M., eds. 2001. Organic Agriculture Worldwide. Statistics and Future
Prospects. Stiftung Ökologie and Landbau, Bad Dürkheim. Willer, H. and Zerger, U. 1999. Demand of Research and Development in Organic Farming in
Europe. In: Zanoli, R. and Krell, R., eds. First SREN Workshop on Research Methodologies in Organic Farming. Proceedings. Frick, Switzerland. 30 September - 3 October 1998. Food and Agriculture Organization of the United Nations, Rome. pp. 57-92.
Williamson, G.B. 1990. Allelopathy, Koch's postulates, and the neck riddle. In: Grace, J.B. and Tilman, D., eds. Perspectives in Plant Competition. Academic Press, San Diego. pp. 143-162.
Willis, R.J. 1985. The historical bases of the concept of allelopathy. Journal of the History of Biology. 18(1): 71-102.
Women in Development Service (FAO). 2001. Agricultural implements used by women farmers in Africa. Findings of a study conducted in 1998. SD Dimensions. July.
Worsham, A.D. 1991. Role of cover crops in weed management and water quality. In: Hargrove, W.L., ed. Cover Crops for Clean Water. The Proceedings of an International Conference, West Tennessee Experiment Station, April 9-11, 1991, Jackson, Tennessee. Soil and Water Conservation Society, Ankeny, Iowa. pp. 141-145.
Wu, H., Pratley, J., Lemerle, D., Haig, T. and An, M. 2001. Screening methods for the evaluation of crop allelopathic potential. The Botanical Review. 67(3): 403-415.
Wurr, D.C.E., Fellows, J.R. and Hambridge, A.J. 1992. Environmental factors influencing head density and diameter of crisp lettuce cv. Saladin. Journal of Horticultural Science. 67(3): 395-401.
Wyland, L.J., Jackson, L.E., Chaney, W.E., Klonsky, K., Koike, S.T. and Kimple, B. 1996. Winter cover crops in a vegetable cropping system: Impacts on nitrate leaching, soil water, crop yield, pests and management costs. Agriculture, Ecosystems and Environment. 59(1-2): 1-17.
Wyland, L.J., Jackson, L.E. and Schulbach, K.F. 1995. Soil-plant nitrogen dynamics following incorporation of a mature rye cover crop in a lettuce production system. Journal of Agricultural Science. 124(1): 17-25.
Wynen, E. 1988a. Sustainable and Conventional Agriculture in South Eastern Australia: a Comparison. School of Economics, La Trobe University, Bundoora.
Wynen, E. 1988b. Sustainable and Conventional Agriculture: an Economic Analysis of Australian Cereal-Livestock Farming. La Trobe University, Bundoora. Doctor of Philosophy thesis.
Wynen, E. 1992. Conversion to Organic Agriculture in Australia: Problems and Possibilities in the Cereal-Livestock Industry. National Association for Sustainable Agriculture, Australia, Sydney.
Wynen, E. 1997. Research on biological farming methods in Europe: perspectives, status and requirements. In: Krell, R., ed. Biological Farming Research in Europe. Food and Agriculture Organization of the United Nations, Rome. pp. 6-48.
References
218
Wynen, E. 1998. Evaluating the Potential Contribution of Organic Agriculture to Sustainability Goals. Environment and Natural Resources Service, Research, Extension and Training Division, Sustainable Development Department, Food and Agriculture Organization of the United Nations, Rome.
Wynen, E. 2003a. Organic Agriculture in Australia - Levies and Expenditure. Rural Industries Research and Development Corporation, Bardon.
Wynen, E. 2003b. What are the key issues faced by organic producers? In: OECD, ed. Organic Agriculture Sustainability, Markets and Policies. Organisation of Economic Cooperation and Development, Paris. pp. 207-220.
Yih, W.K. 1989. The effects of plant litter and inorganic fertiliser on crop-weed interactions in a temperate, rich-soil site. Biological Agriculture and Horticulture. 6: 59-72.
Young, K.R. and Hingston, L. 1993. Cereal cover crops for vegetable production in Tasmania. In: Swarbrick, J.T., Henderson, C.W.L., Jettner , R.J. and Walker, S.R., eds. Proceedings of the 10th Australian Weeds Conference and 14th Asian Pacific Weed Science Society Conference. September, 1993. Weed Society of Queensland, Brisbane. pp. 233-237.
Yussefi, M. and Willer, H., eds. 2003. The World of Organic Agriculture - Statistics and Future Prospects 2003. International Federation of Organic Agriculture Movements, Tholey-Theley.
Zimmerman, R. 2002. Investigating the Impact of Green Manures and Weed Mat on Soil Biota and Tree Growth in Organic Peach Tree Orchards. Western Colorado Research Center, Hotchkiss, Colorado.
Zinati, G.M. 2002. Transition from conventional to organic farming systems: II. Summary of discussion session and recommendations for future research. HortTechnology. 12(4): 611-612.
219
Appendices
Appendix 1 Personal communications
The following people provided information that has been cited as personal communications in this thesis: Doug Andrews, Organic Herb Growers of Australia, South Lismore NSW 2480 Graeme Blair, Agronomy and Soil Science, University of New England, Armidale NSW 2351 Phillip Brown, Subiaco Herbs Pty. Ltd., Yarrowitch via Walcha NSW 2354 Viv Burnett, Department of Natural Resources and Environment, Rutherglen Victoria 3685 Rod Dyke, National Association for Sustainable Agriculture Australia, Stirling SA 5152 David Edmonds, Agronomy and Soil Science, University of New England, Armidale NSW 2351 Peter Green, private horticulturalist, Corindi Beach NSW 2456 John Holland, NSW Agriculture, Tamworth NSW 2340 John Kirkegaard, CSIRO - Plant Industry, Canberra ACT 2601 Colin Lamrock, Auswest Seeds, Forbes NSW 2871 Kate Light, AgSeed Research, Horsham Vic 3402 Peter Lockwood, Agronomy and Soil Science, University of New England, Armidale NSW 2351 Helen Mason, Upper Yarrowitch Pastoral Company, Yarrowitch via Walcha NSW 2354 Rod May, National Association for Sustainable Agriculture Australia, Stirling SA 5152 Andrew Monk, Biological Farmers of Australia, Toowoomba QLD 4350 Ian Reeve, Institute for Rural Futures, University of New England, Armidale NSW 2351 Megan Ryan, CSIRO - Plant Industry, Canberra ACT 2601 Norm Thomas, Rural Properties, University of New England, Armidale NSW 2351 Els Wynen, Eco Landuse Systems, Flynn ACT 2615.
Appendix 2 Survey materials
This appendix contains the following a material referred to in Chapter 3: a schematic diagram of the process used to conduct the Organic Weed Management survey (Figure A1), the cover letter (Figure A2) and double-sided blue questionnaire that were sent to growers in the mail survey (Figure A3).
Appendices
220
Mail Out (BFA & NASAA growers)
To: Grower
Reply Paid Envelope
Data Request Slip
Questionnaire
Cover Letter
Newsletter insert (OHGA growers)
Reply Paid Envelope
Data Request Slip
Questionnaire
Cover Letter
Conceptualisation and planning
Draft cover letter, questionnaire and
associated material
Identify research population
Select and prepare sample addresses
Conduct pilot study
Finalise survey design
Follow-up (to non-respondents only)
To: Grower
Reply Paid Envelope
Data Request Slip
Questionnaire
Cover Letter
Distribute survey
Collate responses
Analyse and present data
Figure A1 Schematic plan of the process used to conduct the Organic Weed Management survey
Kristiansen, P. 2000. Work with nature for effective weed control. In: Horsley, P., ed. The Organic Alternative: The Complete Guide to Organic Farming. Kondinin, Cloverdale. pp. 80-84.
Kristiansen, P. 2000. Work with nature for weed control. In: Kondinin Group, ed. Organic Farming in Australia. Rural Industries Research and Development Corporation, Barton. pp. 18-25.
Conference papers
Kristiansen, P., Sindel, B. & Jessop, R. 2003. Agronomic and economic evaluation of weed management methods in organic herb and vegetable production systems. In: Solutions for a Better Environment. Proceedings of the 11th Australian Agronomy Conference. 2 - 6 February 2003, Deakin University, Geelong, Victoria. Australian Society of Agronomy. pp. CD-ROM. http://www.regional.org.au/au/asa/2003/c/13/kristiansen.htm
Kristiansen, P.E., Jessop, R.S. & Sindel, B.M. 2001. Organic weed management survey: methods used by Australian herb and vegetable growers. In: 10th Australian Agronomy Conference. Science and Technology: Delivering Results for Agriculture. 28 January - 1 February 2001, Hobart, Tasmania. Australian Society of Agronomy. pp. CD-ROM. http://www.regional.org.au/au/asa/2001/6/c/kristiansen.htm
Unrefereed
Conference papers
Kristiansen, P.E., Sindel, B.M. & Jessop, R.S. (in press). Weed control in organic horticultural cropping systems. In: Organic Farming Workshops, 5-7th July 2001, NSW Agriculture Centre for Organic Farming, Bathurst, NSW. NSW Agriculture, Bathurst.
Kristiansen, P.E., Sindel, B.M. & Jessop, R.S. 2001. The importance of diversity in organic weed management. In: The Organic Challenge: Unity Through Diversity. RIRDC's Inaugural National Organics Conference 2001. Darling Harbour, Sydney, Australia, 27-28th August 2001. Rural Industries Research and Development Corporation, Barton. pp. 181-191
Kristiansen, P.E., Sindel, B.M. & Jessop, R.S. 1999. Organic weed management research in Australia. In: Proceedings of the 12th Australian Weeds Conference. Tasmanian Weeds Society, Hobart. pp. 35-38.
Kristiansen, P.E., Sindel, B.M. & Jessop, R.S. (in press). Information resources for organic weed management in Australia. In: Farming for the Future: Organic Produce for the 21st Century, 22-23rdk September 1999. Central Queensland University, Mackay.
Conference poster
Kristiansen, P.E., Sindel, B.M. & Jessop, R.S. 2000. Organic weed management. In: Proceedings of the 6th Queensland Weed Symposium. Caloundra, 10-13 July 2000. Weed Society of Queensland Inc., Caloundra. p. 204.
Appendices
225
Industry newsletters
Kristiansen, P. 2001. The good the bad and the ugly: weeds in organic horticulture. The Herb Grower. September-October: 14.
Kristiansen, P. 2001. Weed management in Echinacea: An organic growers' perspective. BFA News. Autumn: 26-27.
Kristiansen, P. 2001. Organic weed management. Australian Organics. 7(April): 5. Kristiansen, P. 2001. Organic weed management survey: Responses from Echinacea growers. The
Herb Grower. January-February: 23-25. Kristiansen, P. 1999. Organic weed management survey. Preliminary results - Part 1. The Herb
Grower. September/October: 14-16. Kristiansen, P. 1999. Working with weeds: RIRDC research update. BFA News. September: 14. Kristiansen, P. 2000. Organic weed management survey: Echinacea. NASAA Bulletin. 7(3): 18-19. Kristiansen, P. 1999. Organic weed management - industry survey. The Herb Grower. March-
April: 19. Kristiansen, P. 1999. Organic weed management - industry survey update. Canberra Organic. 7(2):
7. Kristiansen, P. 1999. Organic weed management survey. NASAA Bulletin. 6(3): 9-10. Kristiansen, P. 1999. Organic weed management survey. Preliminary results - Part 1. Canberra
Organic. 7(3): 19-21. Kristiansen, P. 1999. Survey shows diverse views on weeds. Acres Australia. March: 6. Kristiansen, P. 1998. Wanted: Growers opinions! COGS Quarterly. 6(4): 13. Kristiansen, P. 1998. Wanted: Growers' opinions! Organic weed management - industry survey.
NASAA Bulletin. 5(4): 5. Kristiansen, P. 1998. Wanted: Growers' opinions! Organic weed management industry survey. The
Herb Grower. November-December: 6. Electronic media
12/10/1999. NT Country Hour, ABC Radio. Interviewed by Margaret Dekker. 17/10/1999. TAS Country Hour, ABC Radio. Interviewed by Margaret Dekker. 13/12/2000. Rural Report, New England North West (Tamworth), ABC Radio. Interviewed by