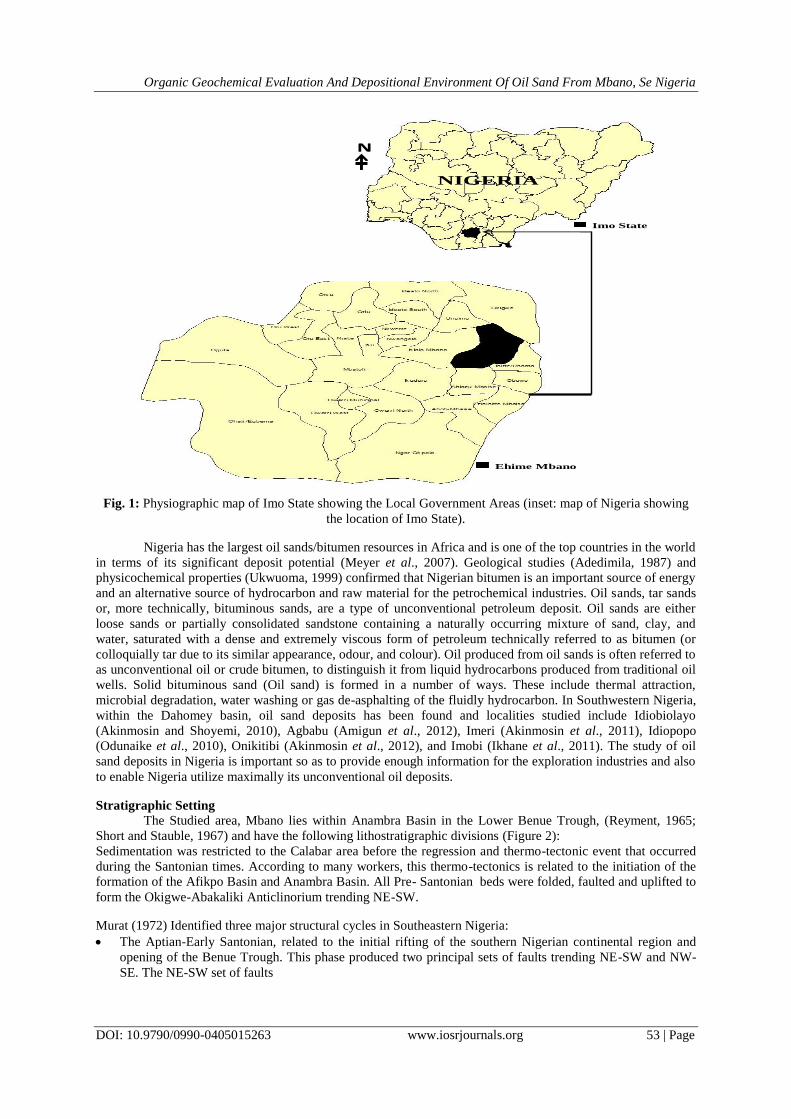
IOSR Journal of Applied Geology and Geophysics (IOSR-JAGG)
e-ISSN: 2321–0990, p-ISSN: 2321–0982.Volume 4, Issue 5 Ver. I (Sep. - Oct. 2016), PP 52-63
www.iosrjournals.org
DOI: 10.9790/0990-0405015263 www.iosrjournals.org 52 | Page
Organic Geochemical Evaluation and Depositional Environment
of Oil Sand from Mbano, SE Nigeria
M.U. Uzoegbu*1, N.R. Nwachukwu
2 and O. Wosu
2
1Michael Okpara University of Agriculture, Umudike, Abia State, Nigeria
2University of Port Harcourt, Port Harcourt, Rivers State, Nigeria
Abstract: In this study, organic geochemical characteristics and depositional environment of the Cretaceous-
Tertiary aged oil sand deposits in Mbano Southeast Nigeria have been examined. Oil sands in all the studied
areas are typically characterized by high hydrogen index and low oxygen index values. The organic richness of
the oil sand, the quality, source and thermal maturity of organic matter discovered at Umuezeala Nsu (MBA)
and Umualumaku (MBB) in Mbano were determined on 13 oil sand samples. The results generally suggest
relatively high Total organic matter content (TOC) for MBA and MBB oil sand samples ranging from 17.07 to
61.31wt% with a mean of 44.43 wt% for MBA and from 29.55 to 52.94 wt% with a mean of 36.05 wt% for MBB
respectively. This serves as a link in determining the quality of source rocks. The free hydrocarbon (S1) versus
TOC plot was used to differentiate between allochthonous and autochthonous hydrocarbon. Tmax ranges from
412-431oC with mean value of 421.8
oC. Hydrogen index (HI) versus Tmax plot confirms that a significant
amount of the organic matter is of lacustrine with a mixed marine and terrestrial origin. The HI of MBA and
MBB ranges from 771 to 869 mgHCg-1
TOC and 689 to 89 0 mgHCg-1
TOC respectively indicating the presence
of type I kerogen. The Tmax versus Production index (PI) shows that MBA and MBB organic matter as
immature but the Production index (PI) ranges from 0.16 and 0.29 indicating that the organic matters in MBA
and MBB have reached the production stage. The GC-MS results derived by CPI varies from 0.01 to 3.80 in
MBA and 0.14 to 0.90 in MBB showing that MBA attended higher level of maturation as compared to MBB.
Furthermore, indicated that MBA organic matter was deposited in a deeper environment than MBB or closer to
heat source. Pr/Ph ratio (0.44-2.33; 0.68-3.55), Long/Short ratio (0.17-1.28; 0.10-0.66), OEP (0.40-1.22; 0.31-
0.93), Pr/n-C17 (0.10-2.10; 077-3.27), Ph/n-C18 (0.04-3.50; 0.43-1.72) and C31/(C31+C29) (1.00-3.60) revealed
the organic matter depositional environment as dysoxic to marine environment.
Keywords: Oil sand, TOC, Tmax, production Index, depositional environment, Anambra Basin, Nigeria.
I. Introduction The studied area lies within latitudes 4°45'N and 7°15'N, and longitude 6°50'E and 7°25'E with an area
of around 5,100 sq km (Figure 1) and is within the Anambra basin.Oil sand is a naturally occurring mixture of
sand, clay or other minerals, water and bitumen, which is heavy and extremely viscous oil that must be treated
before it can be used by refineries to produce usable fuels such as gasoline and diesel. Oil sand which is also
referred to as tar sand (Bituminous sand) has a similar composition as the light crude. It is believed to have been
formed from biodegradation and water washing of light crude due to lack of cap rock (Akinyemi et al., 2013).
Bitumen is about 20% of the actual oil sands found in Nigeria while 76% is for mineral matter that includes clay
and sand and 4% water (Akinyemi et al., 2013). The recovery process includes extraction and separation
systems to remove the bitumen from the sand and water. The oil sand history started with the development of
oil sand separation in the 1920s by Dr. Karl Clark. In 1936 Max Ball developed a way to produce diesel oil from
oil sand (Nate, 2008). Nate (2008) also reported that the actual commercial production started in 1963 when the
Sun Oil Company – later Suncor – started the construction of the first commercial oil sand production plant. The
first barrel of commercial production by open pit mining was produced in 1967 (Syncrude, 2003).
Various countries of the world have embraced the exploration of oil sands as an alternate source of
energy. In the Anambra basin, Southeastern Nigeria, oil sand deposits has been discovered in Mbano, Imo State.
This study aims to determine the organic matter richness, quality, type, source, maturity variation, the
geochemical characterization and depositional environment of the organic matter from the oil sand deposits.
Organic Geochemical Evaluation And Depositional Environment Of Oil Sand From Mbano, Se Nigeria
DOI: 10.9790/0990-0405015263 www.iosrjournals.org 53 | Page
NIGERIA
Ehime Mbano
Imo State
N
Fig. 1: Physiographic map of Imo State showing the Local Government Areas (inset: map of Nigeria showing
the location of Imo State).
Nigeria has the largest oil sands/bitumen resources in Africa and is one of the top countries in the world
in terms of its significant deposit potential (Meyer et al., 2007). Geological studies (Adedimila, 1987) and
physicochemical properties (Ukwuoma, 1999) confirmed that Nigerian bitumen is an important source of energy
and an alternative source of hydrocarbon and raw material for the petrochemical industries. Oil sands, tar sands
or, more technically, bituminous sands, are a type of unconventional petroleum deposit. Oil sands are either
loose sands or partially consolidated sandstone containing a naturally occurring mixture of sand, clay, and
water, saturated with a dense and extremely viscous form of petroleum technically referred to as bitumen (or
colloquially tar due to its similar appearance, odour, and colour). Oil produced from oil sands is often referred to
as unconventional oil or crude bitumen, to distinguish it from liquid hydrocarbons produced from traditional oil
wells. Solid bituminous sand (Oil sand) is formed in a number of ways. These include thermal attraction,
microbial degradation, water washing or gas de-asphalting of the fluidly hydrocarbon. In Southwestern Nigeria,
within the Dahomey basin, oil sand deposits has been found and localities studied include Idiobiolayo
(Akinmosin and Shoyemi, 2010), Agbabu (Amigun et al., 2012), Imeri (Akinmosin et al., 2011), Idiopopo
(Odunaike et al., 2010), Onikitibi (Akinmosin et al., 2012), and Imobi (Ikhane et al., 2011). The study of oil
sand deposits in Nigeria is important so as to provide enough information for the exploration industries and also
to enable Nigeria utilize maximally its unconventional oil deposits.
Stratigraphic Setting
The Studied area, Mbano lies within Anambra Basin in the Lower Benue Trough, (Reyment, 1965;
Short and Stauble, 1967) and have the following lithostratigraphic divisions (Figure 2):
Sedimentation was restricted to the Calabar area before the regression and thermo-tectonic event that occurred
during the Santonian times. According to many workers, this thermo-tectonics is related to the initiation of the
formation of the Afikpo Basin and Anambra Basin. All Pre- Santonian beds were folded, faulted and uplifted to
form the Okigwe-Abakaliki Anticlinorium trending NE-SW.
Murat (1972) Identified three major structural cycles in Southeastern Nigeria:
The Aptian-Early Santonian, related to the initial rifting of the southern Nigerian continental region and
opening of the Benue Trough. This phase produced two principal sets of faults trending NE-SW and NW-
SE. The NE-SW set of faults
Organic Geochemical Evaluation And Depositional Environment Of Oil Sand From Mbano, Se Nigeria
DOI: 10.9790/0990-0405015263 www.iosrjournals.org 54 | Page
8º7º
MBANO
Fig. 2: Generalised geological map of the SE Nigeria (small circle area of inset) showing the location of the oil
sand deposits. Numbers indicate Cretaceous and Tertiary formations shown in Fig. 7 as follows: 1. Asu River
Group; 2. Odikpani Formation; 3. Eze-Aku Shale; 4. Awgu Shale; 5. Enugu/Nkporo Shale; 6. Mamu Formation;
7. Ajali Sandstone; 8. Nsukka Formation; 9. Imo Shale; 10. Ameki Formation and 11. Ogwashi-Asaba
Formation (modified from Akande et al., 2007).
bound the Benue Trough, while the NW-SE deformed sedimentary beds within the Calabar Flank.
The Turonian-Santonian, which was characterized by compressional movements resulting in the folding of
the Abakaliki Anticlinorim and the development of the complementary Afikpo Syncline.
The Late Campanian-Middle Miocene phase, which produced rapid subsidence and uplift in alternation
with subsequent progradation of a delta.
During the Coniacian, beds of rapid changing lithofacies including shale, limestone and an increasing
amount of sandstone were deposited in South- Eastern Nigerian. The rapid facies change has been interpreted by
(Short and Stauble, 1967) as being the first indication of onset of active tectonic phase of folding, faulting and
upliftment which ended during Santonian. These Santonian movements resulted in the folding and upliftment of
the NE striking Abakaliki Anticlinorium which in turn led to the exposure and subsequent erosion of the
Coniacian, Turonian and Albian Formations. Consequent to this uplift, two depressions were formed flanking
the Abakaliki Anticlinorium; the wide Anambra Basin to the NW and the narrow Afikpo Syncline to the South
East (Kogbe, 1976). These two depressions became the main foci of deposition during the Campanian to
Palaeocene.
II. Materials And Methods Two methods of sample collection were employed within this period. These are the grab and bulk
sampling methods. Although the grab method of sampling is not the best for collection of samples for analysis,
it was used here to get representative samples from Mbano for oil sand in order to carry out laboratory analyses
on a large scale.Chisel, spatula and sample bags were used for the collection of the samples. The samples
collected were labeled according to each locality. Care is taken to avoid sampling unwanted sections or
contamination in the samples.
A total of 13 samples were collected from oil sand in two locations of Umuezeala Nsu (MBA) and
Umualumaku (MBB). The number of samples from any of this locality was based on the accessibility of the
sample area and the extent to which the oil sand is development at the outcrop (Plates A and B).
Organic Geochemical Evaluation And Depositional Environment Of Oil Sand From Mbano, Se Nigeria
DOI: 10.9790/0990-0405015263 www.iosrjournals.org 55 | Page
(a) (b)
Plates: Field photograph of oil sand outcrops at Mbano; a). Umuezeala Nsu and b). Umualumaku localities.
Magnifications X 50
Samples Preparation
A total of thirteen bulk oil sand samples were analysed. For each of these samples, 2 to 3g was used for
the analyses. The samples were dissolved on a temperature below 40°C to remove the dirts and sands on the
samples. These dissolved samples were measured crucible ready for Rock-Eval analysis.
Rock-Eval 6 Pyrolysis
A total of thirteen samples from Mbano have been subjected to Rock-Eval pyrolysis.
The instrument used was the Rock-Eval 6 Classic S3 that has a programmed heat conducted from 100°C to
850°C for both the pyrolysis and the oxidation ovens.A mass of 2 –3 mg of dissolved oil sand samples were
weighed in crucibles with a balance weighing instrument model Sartorius ISO 9001. The weighed samples
together with the crucibles were placed in a Rock-Eval 6 machine where the samples were subjected to initial
temperature of 100°C before it was increased to 300°C and finally to the temperature of 850°C. In between
these temperatures, the Tmax, the temperature at maximum rate of pyrolysable (S2) hydrocarbon generation,
was determined. Also free oil content (S1), pyrolysable hydrocarbon content (S2), and amount of CO2 (S3) were
determined (Figure 2).
Fig. 3: Programmed pyrolysis result profile showing MBA and MBB samples.
During heating at temperatures between 100 to 300oC free hydrocarbon (S1) is obtained. As cracking
of kerogen continued in the furnace at temperature between 400 and 600 o
C residual hydrocarbons potential (S2)
is obtained. Increase in temperatures from 600 to 850 o
C cause the liberation of CO2 resulting in the
determination of S3. In between the temperatures of 400 to 600 o
C maximum temperature (Tpeak) is attained
leading to the birth line or determining the maturity of an individual sample.
0
100
200
300
400
500
600
700
800
4
54
104
154
204
254
304
0 3 6 8 11 14 17 20 23 25 28 31 34 37 39 42
CO
an
d C
O2 R
esp
on
se (
mil
livo
lts) -
Tem
p (
oC
)
FID
Resp
on
se (
mil
livo
lts)
Time (min)
FID Response
CO Response
CO2 Response
Temp Profile
MBB-1
Organic Geochemical Evaluation And Depositional Environment Of Oil Sand From Mbano, Se Nigeria
DOI: 10.9790/0990-0405015263 www.iosrjournals.org 56 | Page
GC-MS Analysis
The oil sand (3 gm) were first dissolved in DCM (dichloromethane) (200mls) to remove the sand, clay
which are insoluble in DCM, the solution was decimated separating the sand and clay out. The resultant solution
was left in a fume chamber to evaporate, the tar was then dissolve in 200mls of pentane (AnalaR Grade) while
stirring and continued for 1hr. the solution was allowed to cool in a freezer for 2hrs at 5ºC. The precipitated
asphaltene were filtered off washed with cold n-pentane and dried in a dessicators, then weighed and scraped
into a sample vials. The obtained asphaltene were then presented for GC-MS analysis for a suite of metals. The
metals were mainly the biophiles (Udo et al., 1992). A 3g of the sample (asphaltene) was subjected to sohxlett
extraction using a solvent mixture of acetone, chloroform and methanol (47: 30: 23 v/v) at 60oC for 24 hours to
extract the soluble organic matter. The extract was concentrated by evaporation to dryness using a rotating
vapour evaporator at 250 mb. The extract was transferred to an 8 ml vial using the same solvent mixture and
allowed to evaporate to dryness in a vented hood. The dried extract was fractionated by silica gel column
chromatography with a column prepared using 2 g of baker silica gel calcined at 200oC for 24 hours to yield six
fractions ranging from saturate to polar (Figure 4).
(a) (b)
Fig. 4: Chromatogram finger print of oil sand samples from; a) Umuezeala Nsu (MBA) and b) Umualumaku
(MBB).
The saturate fraction was subjected to urea adduction to separate isoprenoids from n-alkanes and
subjected to gas chromatography-mass spectrometry (GC-MS) using a CE 5980 GC coupled to an HP Finnigan
8222 MS held at 80oC for three minutes and raised to 310
oC at 3
oC min
-1 and held isothermally for 10 minutes
in order to assess some molecular parameters used in source rock characterization.
III. Results And Discussion Organic matter (or organic material, natural organic matter) is matter composed of organic compounds
that has come from the remains of organisms such as plants and animals and their waste products in the
environment (Baker, 1972). Following the deposition of organic-rich sediments, microbial processes convert
some of the organic matter into biogenic methane gas. Greater depths of burial are accompanied by increase in
heat in accordance with the basin’s geothermal gradient. This heat and diagenetic processes cause the organic
matter to gradually transform into an insoluble organic matter know as kerogen.
The capacity to generate petroleum depends largely on the chemical composition of this convertible
carbon fraction (Lebile kerogen). The TOC measurement is the first screen for quantifying organic richness.
TOC values provide only a semi-quantitative scale of petroleum-generating potential. TOC indicates the
quantity, but not the quality of organic matter. If this initial screening test demonstrates sufficient organic
content, the rock should undergo additional tests to ascertain organic matter quality and maturity.The MBA
TOC values range from 17.07 to 61.31 wt% with a mean of 44.43wt%. Tmax values for MBA Oil sand samples
range from 412 - 431ºC (Table 1). The MBB TOC values range from 29.55 to 52.94wt% with a mean value of
36.05 wt%. Tmax values for MBB oil sand samples ranges from 418-424ºC. The pyrograms of oil sand
samples from MBA and MBB is shown in Figure 3.Total organic carbon (TOC) which is the measure of the
amount of carbon found in an organic compound is important in the geochemical characterization of oil sands.
0.5 wt% of TOC is the minimum value and is considered as the minimum limit for hydrocarbon generation
(Tissot and Welte, 1984; Bordenove et al., 1993; Hunt, 1996; Hendrix et al., 1995). The data obtained in Table 1
show that the total organic carbon content values for MBA oil sand samples are between 17.07 and 61.31. TOC
content of MBA-5 is the lowest. These values indicate excellent oil sand samples.
Organic Geochemical Evaluation And Depositional Environment Of Oil Sand From Mbano, Se Nigeria
DOI: 10.9790/0990-0405015263 www.iosrjournals.org 57 | Page
The TOC content for MBB 1-4 are between 27.04 and 52.94 with MBB-2 as the lowest. These also indicate
excellent oil sand samples. This is confirmed by the plot of TOC (wt %) versus S2 (Figures 5 and 6). On the
other hand, the plot of S1 versus TOC (Figures 7 and 8) can be used to discriminate between non-indigenous
hydrocarbon (allochthonous) and indigenous hydrocarbons (autochthonous). The plots show that the oil sand
samples of MBA and MBB were characterized equally by allochthonous hydrocarbon and autochthonous
hydrocarbon. This indicates that part of the oil migrated from another location. TOC is used here as a link to
determine variation in source rock quality through expulsion of oil.
Hydrogen index (HI) MBA ranges from 771 to 869 mgHC/gTOC (Table 1) with an average of 799
mgHC/gTOC. The average HI from S2 vs. TOC plot (Langford and Blanc-Valleron, 1990) of oil sand samples
from MBA is 799 mgHC/gTOC (Figure 5). HI vs. OI was plotted on modified Van Krevalen diagram for MBA
Oil sand samples. The HI vs. OI plots for the samples plotted in the organic matter type I fields (Figure 9).
Tmax vs. HI plot of MBA oil sand samples is shown on Figure 11. S2/S3 values range from 59.85 to 216.89
(Table 1). In Table 1, S1/TOC values are between 1.66 and 2.65. The production Index (PI) for MBA samples
are between 0.16 and 0.27. HI of MBB ranges from 689 to 890 mgHC/gTOC (Table 1) with an average of 744.5
mgHC/gTOC. The average HI from S2 vs. TOC plot (Langford and Blanc-Valleron, 1990) of oil sand samples
from MBB is 744.5 mgHC/gTOC (Figure 6).
Table 1: Results of Rock-Eval analysis and calculated parameters.
Fig. 5: S2 vs TOC plot of MBA oil sand samples with calculated average hydrogen index (Av. HI. Sample
name attached).
Organic Geochemical Evaluation And Depositional Environment Of Oil Sand From Mbano, Se Nigeria
DOI: 10.9790/0990-0405015263 www.iosrjournals.org 58 | Page
Fig. 6: S2 vs TOC plot of MBB oil sand samples with calculated average hydrogen index (Av. HI. Sample name
attached).
Fig. 7: Diagram of S1/TOC using MBA oil sand samples for discriminating between non indigenous and
indigenous hydrocarbon.
Fig. 8: Diagram of S1/TOC using MBB oil sand samples for discriminating between non indigenous and
indigenous hydrocarbon.
Allochthonous
Autochthonous
Organic Geochemical Evaluation And Depositional Environment Of Oil Sand From Mbano, Se Nigeria
DOI: 10.9790/0990-0405015263 www.iosrjournals.org 59 | Page
0
100
200
300
400
500
600
700
800
900
1000
0 2 4 6 8 10 12 14
HI
(mg
HC
g--
1T
OC
)
OI (mgHCg-1 TOC)
MBA
Type I
Type II
Type III
Fig. 9: HI vs. OI plot of oil sand samples from Umuezeala Nsu (MBA).
0
100
200
300
400
500
600
700
800
900
1000
0 5 10 15 20 25
HI
(mg
HC
g-1
TO
C)
OI (mgHCg-1 TOC)
Type I
Type II
Type III
MBB
Fig. 10: HI vs. OI plot of oil sand samples from Umualumaku (MBB).
Fig. 11: Tmax vs HI plot of MBA Oil sand samples.
Organic Geochemical Evaluation And Depositional Environment Of Oil Sand From Mbano, Se Nigeria
DOI: 10.9790/0990-0405015263 www.iosrjournals.org 60 | Page
Fig. 12: Tmax vs HI plot of MBA Oil sand samples.
Fig. 13: Tmax vs. Production index plot of MBA oil sand samples.
Fig. 14: Tmax vs. Production index plot of MBB oil sand samples.
Gas Oil
Organic Geochemical Evaluation And Depositional Environment Of Oil Sand From Mbano, Se Nigeria
DOI: 10.9790/0990-0405015263 www.iosrjournals.org 61 | Page
HI vs. OI was plotted on modified Van Krevalen diagram for MBB oil sand samples. The HI vs. OI
plots for the samples plotted in the organic matter type I fields (Figure 10). Tmax vs. HI plot of MBB oil sand
samples is shown on Figure 12. S2/S3 values range from 33.98 to 444.65 (Table 1). In Table 1, S1/TOC values
are between 1.75 and 2.94. The PI for MBB samples are between 0.18 and 0.29.The quality of organic matter
(OM) in the oil sand samples was done by using Rock-Eval generated data (HI and Tmax). The MBA and MBB
oil sand samples plot mainly along the oil prone kerogen evolutionary pathway as indicated by the plot of HI
against Tmax. This confirms that a substantial proportion of the OM is of marine origin with oil potential.
The type of kerogen in the oil sand samples determines its quality. Type I kerogen is the highest quality
and type III is the lowest. Waples (1985) used the HI values to differentiate between the types of OM. HI <150
mg/g indicates mainly type III kerogen (Gas prone), Hydrogen indices between 150 and 300 mg/g indicates that
the OM is oil and gas prone but mainly gas because it contains more type III kerogen than type II kerogen. HI
>300 mg/g is oil and gas prone but mainly oil because it contains a large amount of type II kerogen than type III
kerogen. Kerogen with HI >600 mg/g indicates the presence of type I or type II kerogen and therefore have an
excellent hydrocarbon potential (Oil prone). The HI values of MBA oil sand samples ranges from 771 and 869
indicating the presence of type I or type II kerogen while hydrogen index for MBB oil sand samples ranges from
689 and 890 also indicating the presence of type I or type II kerogen.
The plot of S2 vs. TOC plot (Langford and Blanc-Valleron, 1990) in figs. 5 and 6 shows that the MBA
samples are characterized by kerogen type I while the MBB oil samples are characterized by kerogen type I and
type II. HI versus OI plot as carried out by Van Krevelen (1961), which is used to determine the kerogen type
(Figures 9 and 10) shows that the MBA oil sand samples are generally plotted under type I kerogen, while the
MBB oil sand samples are also plotted under type I kerogen. High HI content in this oil sand is probably caused
by unusual kind of organism rich in lipids that formed the OM.
The Tmax values measured during the pyrolysis and the calculated PI values are closely related to
thermal history of the OM (Tissot et al., 1984; Waples, 1985). According to Peters, 1986 and Espitalié et al.,
1985, oil generation began at Tmax 435–465 °C, and PI between 0.2 and 0.4, the OM are in immature stage
when Tmax has a value less than 435 °C, and PI less than 0.2 and the gas generation began at Tmax 470 °C, and
production index PI more than 0.4. HI versus Tmax (Espitalié et al., 1985) plot (Figures 11 and 12) shows that
the MBA and MBB oil sand samples plotted in the immature zone of type I kerogen. The plot of Tmax versus PI
(Waples, 1985; Peters, 1986) (Figures 13 and 14) shows that the MBA and MBB oil sand samples are immature.
PI results hovers between 0.16 and 0.29 indicating that the OM has reached the production stage. PI also
allowed dissemination of oil when Tmax below threshold affects the OM. Again, Tmax is applied here to
determine maturation variation of the OM of the source rock that produced the oil sands.
Environmental Geochemistry
Low Molecular Weight (LMW) n-alkanes are usually produced by marine biogenic sources while High
Molecular Weight (HMW) n-alkanes are usually produced from terrestrial vascular plant. Concentrations of
LMW and HMW n-alkanes can be obtained from the following:
LMW = Sum of concentrations of aliphatic hydrocarbons ranging from nC10 to nC20.
HMW = Sum of concentrations of aliphatic hydrocarbons range from nC21 to nC36.
Predominantly, lower molecular weight n-alkanes exist in fresh oil while higher plants, marine animals
and sedimentary bacteria show higher molecular weight n-alkanes (Pingchang et al., 2013). Main peaks with
carbon numbers greater than nC20 reflect the significant incorporation of higher plant wax and some fungi,
whereas those with lower carbon numbers indicate major inputs from microbial activity (algae and bacteria -
nC17, nC18) or petroleum (diesel exhaust -nC20, nC21). LMW/HMW ratio in n-alkanes in sediments is used to
distinguish macrophytes from terrestrial plants (Pingchang et al., 2013). Values below 1 show natural input
from terrestrial biogenic sources while values above 1 show natural input from marine biogenic sources. LMW
is predominance in the sample locations.
Long Chain Hydrocarbons (LHC) is n-alkanes above nC20 while Short Chain Hydrocarbons (SCH) is
n-alkanes below nC20. LHC/SHC ratio is used to assess the macrophyte/land plant and phytoplankton- dominant
trends. Low LHC/SHC values such as 0.21 to 0.80 are dominantly phytoplankton derived. Intermediate values
such as 2.38 to 4.33 show a mixture of both input sources. Higher ratios above 4.0 are dominated by terrestrial
plant waxes (Pingchang et al., 2013). It is predominance of long chain over short chain n-alkanes as their values
varies from 0.17-1.28 in MBA to 0.10-0.66 in MBB (Table 2) indicating a dominance source of marine organic
matter (Guangyou et al., 2013).
The Pr/Ph ratios from 0.44 to 3.55 in both locations suggest a marine to terrestrial derived material
because Pr/Ph is found mainly from the phytol portion of photosynthetic plant chlorophyll (Didyk et al., 1978;
IIIich, 1983). Value of OEP varies from 0.31-0.93 in the oil sand from MBB-02 to 0.40-1.22 from MBA-03
(Table 2).
Organic Geochemical Evaluation And Depositional Environment Of Oil Sand From Mbano, Se Nigeria
DOI: 10.9790/0990-0405015263 www.iosrjournals.org 62 | Page
These values of OEP for immature higher plant contributions are often >1.0 but approach 1.0 with
increasing maturity (Bray and Evans, 1961; Didyk et al., 1978). The CPI results gotten from MBA and MBB
could be said that majority of the terrestrial material is probably transported by fluvial processes and deposited
under marginal to marine environments (Bird et al., 1995; Obaje et al., 2004) which contribute to the marine
source of OM in the MBA and MBB samples.
Table 2: Showing n-Alkanes, Isoprenoids distribution and ratios from GC of oil sand samples from Mbano,
Anambra Basin.
The ratio C31/ C31 + C29 of these two n-alkanes (C31 and C29) are higher in the sample numbers of MBA
and MBB both in oil sand samples with values 3.60 and 1.40 (Table 2) respectively. The carbon preference
index (CPI) of the n-alkanes also varies with values ranging from 0.14-0.90in the oil sand samples from MBB-
0.1 and 0.01-3.80 in the oil samples from MBA-02 (Table 2; Figure 4). This indicates more maturation of OM in
MBB area than the MBA area or location MBB may be closer to higher heat source.
The CPI 25-33= 0.5*[(C25-C33)/ (C24-C32)] + [(C25- C33)/ (C26-C34)] n-alkanes can be derived from two
sources i.e. vascular plant wax and fossil fuel combustion products (Ali et al., 2015). An odd carbon preference
is characteristic of oils derived from source rocks deposited in non-marine environments. In contrast, the
predominance of an even numbered n-alkane preference is commonly observed in bitumen and oils derived
from carbonate or evaporate rocks. This is usually characterized with CPI values that are lower than 1. If the
total even and odd numbers of paraffin are equally abundant, the value of (CPI) will be equal to 1 as generally
observed in high maturity samples. This shows that the hydrocarbons are petrogenic in origin.
Predominance of vascular plants input to the environment usually demonstrates CPI values from1 to 3
(Ali et al., 2015). The average CPI value of 0.35 was obtained from MBB samples and 1.35 from samples of
MBA suggesting marginal maturity. Although this parameter is usually low in marine source rock that produce
mostly low molecular weight hydrocarbons (Cooles et al., 1986; Peters and Moldowan, 1993; Eseme et al.,
2002; 2006; Sengüler et al., 2008). CPI in the C25-C31 range of samples from the Anambra Basin is generally
high (> 1), indicating immaturity and reflecting the contribution of wax-derived n-alkanes which form bitumen
at the end of diagenesis (Hunt, 1996).
Pr/C17 values range from 0.10-2.10 in the MBA sample and values from 0.77-3.27 in MBB while
Ph/C18 is between 0.04-3.50 in the MBA and 0.43-1.72 from MBB (Table 2; Figure 4) indicating marginal to
marine depositional environment. The result of C31/(C31+C29) (1.00-3.60) also supported values obtained for
Pr/C17 and Ph/C18 depositional environment of the organic matter as dysoxic to marine environment (Pingchang
et al., 2013).
Acknowledgements
Gratitude is expressed to all the Staff in the Departments of Geology, Michael Okpara University of
Agriculture and University of Port Harcourt for their advice. Trican Geological Solutions, Alberta, Canada is
gratefully acknowledged for the analyses of these samples.
References [1]. Adedimila AS, (1987). Okitipupa bituminous sands: New construction materials for flexible pavements? Nig. Eng., 22, 1-14.
[2]. Akande SO, Ogunmoyero IB, Petersen HI, Nytoft HP, (2007). Source rock evaluation of coals from the Lower Maastrichtian Mamu
Formation, SE Nigeria. Jour. Petrol.Geol., 30(4), 303-324. [3]. Akinyemi LP, Odunaike RK, Fasunwon OO, (2013). Physical and chemical characterization of oil sands observed at Imeri in Ogun
state of South Western Nigeria, CSPG/CSEG/CWLS GeoConvention Integration: Geoscience Engineering Partnership, 6-12 May,
Calgary, Ab, Canada.
Organic Geochemical Evaluation And Depositional Environment Of Oil Sand From Mbano, Se Nigeria
DOI: 10.9790/0990-0405015263 www.iosrjournals.org 63 | Page
[4]. Akinmosin AA, Shoyemi O, (2010). Technical Feasibility of direct application of the Nigerian Tar Sand Deposits as Road Asphalt. Pacific J. Sci. Techn., 11(1), pp. 526-536.
[5]. Akinmosin A, Omosanya KO, Folorunsho AF, Ariyo SO, Aiyeola SO, (2011). Structural Control for Bitumen Seepages in Imeri,
Southwestern, Nigeria. Int. J. Basic and Applied Sci., 11(1), 93-103. [6]. Akinmosin AA, Omosanya KO, Ikhane PR, Mosuro GO, Goodluck I, (2012). Characterisation of a bitumen seepage at Onikitibi,
Eastern Dahomey Basin, SW, Nigeria. Adv. Applied Sci. Res., 3(4), 2078-2089.
[7]. Ali S, Arash, VM, Yamur K, Aye KY, (2015). Evaluation of the Hydrocarbon Potential, Mineral Matrix effect and Gas-Oil Ratio Potential of Oil Shale from the Kabalar Formation, Göynük, Turkey. Oil Shale, 32(1), 25–41.
[8]. Amigun JO, Adelusi AO, Ako BD, (2012). The application of integrated geophysical methods in oil sand exploration in Agbabu
area of Southwestern Nigeria. Int. Res. J. Geol. Mining (IRJGM), 2(9), 243-253. [9]. Baker DR, (1972). Organic Geochemistry and Geological Interpretation. J. Geol.
[10]. Edu., 20, 221-234.
[11]. Bird MI, Summons RE, Gagan MK, Roksandic Z, Dowling L, Head J, Fifield LK, Cresswell RG, Johnson DP, (1995). Terrestrial vegetation change inferred from n-alkanes 13C analysis in the marine environment: Geochem. Cosmochim. Acta., 59, 2853-2857.
[12]. Bordenove ML, Espitalie J, Leplat P, Oudin JL, Vandenbrouke M, (1993). Screening techniques for source rock evaluation. In:
Bardenave, M.L. (ed.), Appl. Petrol. Geochem, Paris Eds. Technip., 217–278. [13]. Bray EE, Evans ED, (1961). Distribution of n- paraffins as a clue to recognition of source beds. Geochem. Cosmochim. Acta, 22, 2-
15.
[14]. Cooles GP, Mackenzie AS, Quigley TM, (1986). Calculation of petroleum masses generated and expelled from source rocks. Org.
Geochem., 10, 235-245.
[15]. Didyk BM, Simoneit BRT, Brassell SC, Eglinton G, (1978). Organic geochemical indicators of paleodepositional conditions of
sedimentation: Nature, 272, 216-222. [16]. Eseme E, Agyingi CM, Foba-Tedo J, (2002). Geochemistry of brine emanations from Cretaceous strata of the Mamfe Basin,
Cameroon. J. Afri. Earth Sci., 35(4), 467-476.
[17]. Eseme E, Littke R, Agyingi CM, (2006). Geochemical characterization of a Cretaceous black shale from Mamfe Basin, Cameroon. Petrol. Geosci., 12, 69 – 74.
[18]. Espitalie J, Deroo G, Marquis F, (1985). “ Rock-Eval pyrolysis and its application”. Inst. Fr. Pet. Preprint 33578, pp.72.
[19]. Guangyou Z, Zhengjun W, Jin S, (2013). Geochemical Characteristics of High quality Hydrocarbon Source Rocks in the Nanpu Sag of the Bohai Bay Basin, China. Oil Shale, 30(2), 117–135.
[20]. Hendrix MS, Brassell SC, Carroll AR, Graham SA, (1995). Sedimentology, organic geochemistry and petroleum potential of
jurassic coal measures: Tarim, junggar and turpan basins, Northwest China. Amer. Assoc. Pet. Geol. Bull, 79, 929-959. [21]. Hunt JM, (1979). Petroleum geochemistry and geology. Freeman, San Francisco.
[22]. Hunt JM (1996). Petroleum Geochemistry and Geology, second ed., W.H. Freeman and Company, New York.
[23]. Ikhane PR, Omosanya KO, Afolabi AO, (2011). Stratigraphy of Imobi, Southwestern Nigeria. Res. J. Earth Planet. Stud., 1(2), 33 – 45.
[24]. Illich HA, (1983). Pristane, phytane and lower molecular weight isoprenoid distributions in oils. Amer. Assoc. Petrol. Geol., Bull.,
67, 3385-393. [25]. Kogbe CA, (1976). The Upper Cretaceous Abeokuta Formation of South Western Nigeria. Nigerian Field No. 4, December 1974.
[26]. Longford FF, Blanc-Valleron MM, (1990). Interpreting Rock–Eval pyrolysis data using graphs of pyrolyzable hydrocarbons vs.
total organic carbon Amer. Assoc. Petrol. Geol. Bull., 74(6), 799–804. [27]. Meyer RF, Attanasi ED, Freeman PA, (2007). Heavy oil and natural bitumen resources in geological basins of the World. US
Geological Survey Open-File Report 2007-1084. http://pubs.usgs.gov/of/2007/1084/OF2007-1084v1.pdf.
[28]. Murat RC, (1972). Stratigraphy and paleogeography of the Cretaceous and lower Tertiary in southern Nigeria. In: African Geology (Ed. By Dessauvagie, T.F.J. and Whiteman, A.J.), 251-266. Ibadan University press, Ibadan, Nigeria.
[29]. Nate H, (2008). The Oil Drum: Net Energy. Discussions about Energy and Our Future. Retrieved from
http://www.theoildrum.com/node/3839 on 14 March, 2010. [30]. Obaje NG, Wehner H, Scheeder G, Abubakar MB, Jauro A, (2004). Hydrocarbon prospectivity of Nigeria's inland basins: From the
viewpoint of organic geochemistry and organic petrology. Amer. Assoc. Petrol. Geol. Bull., 87, 325-353.
Odunaike RK, Laoye JA, Fasunwon OO, Ijeoma GC, Akinyemi LP, (2010). Geophysical mapping of the occurrence of shallow oil sands in Idiopopo at Okitipupa area South-western Nigeria. Afri. J. Env. Sci. Techn., 4(1), 034-044.
[31]. Peters KE, (1986). Guidelines for evaluating petroleum source rocks using programmed pyrolysis. Amer. Assoc. Petrol. Geol. Bull., 70, 318-329.
[32]. Peters KE, Moldowan JM, (1993). The Biomarker Guide: Interpreting Molecular Fossils
[33]. in Petroleum and Ancient Sediments. Prentice Hall Englewood Cliff, NJ. pp. 363. [34]. Pingchang S, Zhaojun L, Reinhard G, Yinbo X, Rong L, Baoyi L, Qingtao M, Jinjun X (2013). Oil Yield and Bulk Geochemical
Parameters of Oil Shales from the Songliao andHuadian Basins, China: A Grade Classification Approach, Oil Shale, 30(3), 402–
418.
[35]. Reyment RA, (1965). Aspects of Geology of Nigeria. University of Ibadan Press, Ibadan, Nigeria, pp. 133.
[36]. Short KC, Stauble, AJ, (1967). Outline of geology of Niger Delta. Amer. Assoc. Petrol. Geol. Bull, 51, 761-779.
[37]. Sengüler I, Ayyildiz T, Onal Y, Onal M, (2008). Organic Geochemical Characterization and Mineralogic Properties of Mengen Oil Shale (Lutetian), Bolu-Turkey. Oil Shale, 25 (3), 359–375.
[38]. Syncrude ND, (2003). Production Reader. Retrieved from www.syncrude.com/production.html on 2 August, 2003.
[39]. Tissot BP, Welte DH, (1984). Petroleum Formation and Occurrence, 2nd Ed. Springer- Verlag, Berlin, Heidelberg, New York, Tokyo, pp. 699.
[40]. Tissot B, Durand B, Espitalie J, Combaz A, (1984). Influence of Nature and Diagenesis of Organic Matter in Formation of
Petroleum. Amer. Assoc. Petrol. Geol. Bull., 58, 499-506. [41]. Ukwuoma O, (1999). Study of composition of Nigerian Tar sand bitumen. Petrol. Sci. Techn., 17, 57-65.
[42]. Van Krevalen DW, (1961). Coal-typology, Chemistry, Physics, Constitution. Elsevier, Amsterdam, pp. 514.
[43]. Waples DW, (1985). Geochemistry in Petroleum Exploration. International Human Resources Development Corporation, Boston, pp. 232.