Page 1
Organic geochemistry, its meaning in the
process of hydrocarbon exploration and
demonstration of its application on samples
from @utica – 1 zapad well
R. Vasiljeviæ
PROFESSIONAL PAPER
Organic geochemistry is scientific discipline used in the process of exploration and production of
hydrocarbons. Geochemical results provide determination of source rocks, evaluation of their productivity,
efficiency of expulsion, and migration phenomena. At the same time this research provides also genetic
characterization of hydrocarbons in reservoirs, their comparison and detection of their alteration. Organic
geochemistry is applied to development and production engineering while geochemical results usually
complement geological and geophysical research. Geochemical research methods in this paper are
demonstrated through the example of source rocks examination from @utica-1 zapad well. This example
describes the concept of organic geochemistry, its methods and how they fit into the hydrocarbons
exploration process. After testing of source rocks, comparison of bitumen extracted from rock samples and
oil from the @utica oil field was conducted. The conclusion of this paper explains the differences in
molecular content between the bitumen and oil and also offers guidelines for further geological and
geophysical research, where these results should be incorporated.
Key words: Organic geochemistry, source rock, reservoir, bitumen, petroleum, @utica oil field
1. Introduction
Petroleum geochemistry is based on application of chem-
ical principles during generation, migration, accumula-
tion and hydrocarbon alterations and the
implementation of such knowledge to the processes of
research and production. Organic geochemistry studies
hydrocarbon accumulation and content, its subsurface
movement and its alteration impacted by temperature
and pressure. This research is incorporated in other geo-
logical and geophysical methods to increase the proba-
bility and decrease the risk of hydrocarbon commercial
discoveries. For nearly 150 years it has been known that
the precursor of hydrocarbons is organic matter depos-
ited in sedimentary basins. The main supplies of organic
matter are phytoplankton, zooplankton, bacteria and
terrestrial plants.10,7 All organisms basically consist of
the same chemical ingredients, such as proteins, carbo-
hydrates, lipids and lignin. Protein and carbohydrates
are unstable and they decompose through microbiologi-
cal processes. Hydrogen rich, lipids, which are the main
petroleum precursor, are very important. Lignin compo-
nents are constituents of higher terrestrial plants, and
are mostly sources of gas hydrocarbons.
Organic matter is deposited in aquatic environment
together with mineral particles. Depending on oxygen
content in water column, i.e. depositional environment,
organic matter is completely decomposed or there is a
possibility of its preservation. Then follow the processes
of preserved organic matter change which undergo
through the phases of diagenesis, catagenesis and
metagenesis. Diagenesis is the initial kerogen forming
phase which occurs within biological and chemical
processes. Catagenesis and metageneis are thermal
phases, where kerogen molecules crack and form
hydrocarbons due to high temperature (Bariæ, 1996). All
organic matter alteration processes mentioned above
take place in fine grained sediments called source rocks.
The results of geochemical research of source rocks from
@utica -1 zapad well, are presented in the paper. The
results were compared with the present data on
determined source rocks in Sava Depression.
General properties of source, reservoir rocks and hy-
drocarbons in Sava Depression are presented in papers
written by Bariæ et al.3,4,5,6 Source rocks in Sava Depres-
sion were determined in the north-western and central
part of Gojlo area. In the north-western part of Sava De-
pression, the source rocks are marly sandstones, lime
marls and clay marls of Badenian and Pannonian age,
situated between 1 600 to 3 000 m. These rocks contain
increased concentrations of organic matter (average TOC
is 1.4%). High hydrogen indices (300 up to 600 mgHC/g
Corg), and high content of amorphous kerogen are indica-
tors of petroleum source rocks. Source rocks in Gojlo oil
field contain high quantity of resinite and sporinite
macerals, terrestrial lipid, confirmed by high negative
values of isotopic carbon in kerogen (�13C -28.1‰). This
facies type is the source of high paraffin oil. Source rocks
maturity varies between 0.6 and 0.8% R0, and early
phase of hydrocarbon generation is estimated which had
begun during Miocene – Pliocene age, at the depths be-
tween 2 100 and 2 200 m. Differences in thickness and
depth of source rocks as well as fragmentation caused by
NAFTA 60 (11) 591-602 (2009) 591
Page 2
tectonic activity impacted different migration pathways
and hydrocarbon accumulation.5 Source rocks are char-
acterized by small lithology, stratigraphy and organic fa-
cies variety which is the cause of minor differences of
hydrocarbon properties within reservoir rocks.
Reservoir rocks in Sava Depression are characterized
by lithology and stratigraphical variety. Production inter-
vals at the depths between 370 to 2 300 meters are Paleo-
zoic igneous and metamorphic rocks, and Pannonian
and Pontian coarse clastic sediments. API gravity of oils
and condensates varies between 16.9 and 60.6 ºAPI, and
sulfur content changes from 0.0 to 1.0%. Content of res-
ins and asphaltenes in some oils is high and reaches up
to 18.0%. The carbon isotope composition varies be-
tween �13C-22.8 to -26.0 ‰ and is an indicator of certain
varieties of original organic matter, sedimentary facies
conditions and post accumulation alterations of certain
oils.6
Most of oils chromatographic profiles from Sava De-
pression show relatively regular molecular distributions.
Oil from Jamarica and Lipovljani oil fields in central part
of Sava Depression are characterized by long chain mo-
lecular structure (up to C40), which is reflected in high
concentrations of paraffin, reaching up to 16%. These
high paraffin oil originates from source rocks with in-
creased content of terrestrial lipid components, identi-
fied in Gojlo area. Small number of oils in Sava
Depression is altered due to post generative processes:
biodegradation, water rinsing and evaporate fraction-
ation. Microbiological degradation of oil is particularly
expressed in shallow Paleozoic reservoir rocks contami-
nated with bacteria rich surface water. Biodegradation
activity caused partial oil alteration in Bunjani and
Kozarice fields and complete alteration was registered in
the oil from Kri� field. The primary paraffin – aromatic
oil content from Kri� field was altered into naphthenic –
aromatic content that caused alteration of basic and spe-
cific parameters. In north-western part of Sava Depres-
sion, an important field is Okoli oil field. Shallower
reservoir rocks are saturated with light condensate 60.6°
592 NAFTA 60 (11) 591-602 (2009)
R. VASILJEVIÆ ORGANIC GEOCHEMISTRY, ITS MEANING IN THE PROCESS...
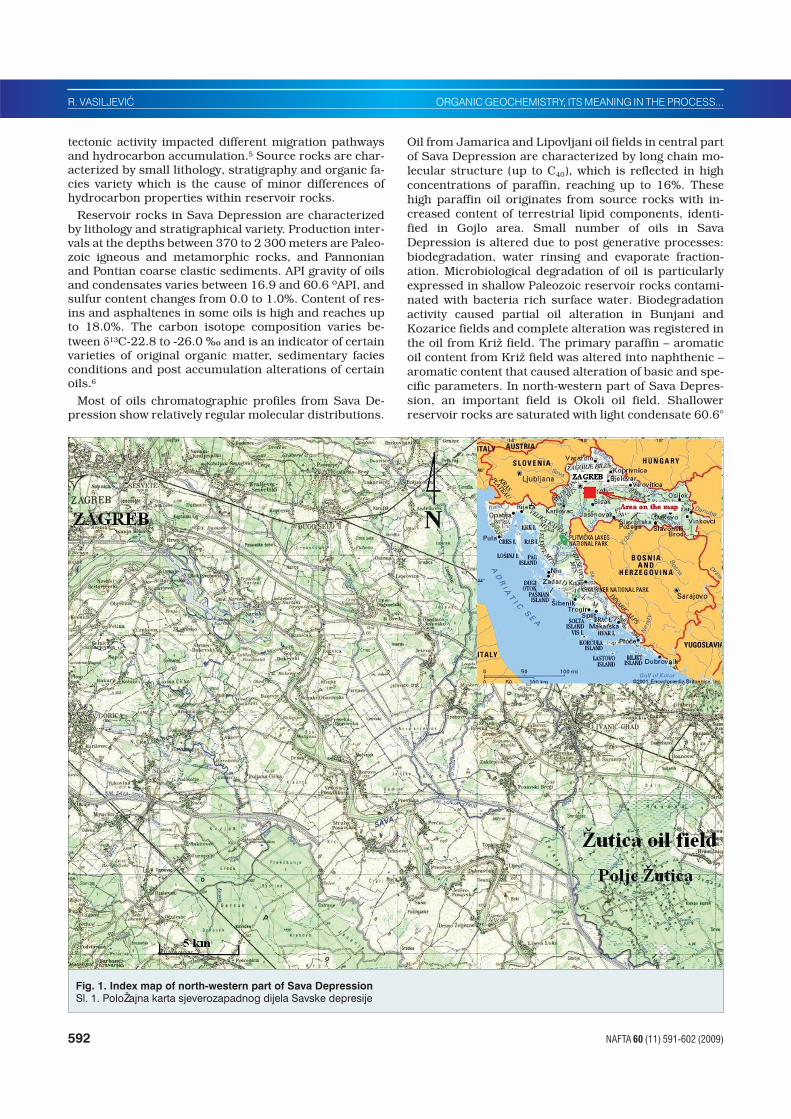
Fig. 1. Index map of north-western part of Sava Depression
Sl. 1. Polo�ajna karta sjeverozapadnog dijela Savske depresije
Page 3
API (736 kg/m3) while in deeper reservoirs there is partly
altered oil 30.8°API (871 kg/m3). Registered differences
in hydrocarbon types can not be assigned to different lev-
els of source rock thermal maturity; the condensate is a
result of evaporative fractionation of light hydrocarbons
from deeper reservoir. Separated hydrocarbons which
migrated into shallow sediments, were trapped on im-
permeable barriers, and were retrograde condensed in
new traps.5
2. Geological Setting
@utica oil field is situated in north-western part of Sava
Depression, approximately 30 kilometres south-east
from Zagreb (Figure 1.) There is a large number of small
oil and oil-gas accumulations (Ivaniæ, @utica, Okoli,
Stru�ec fields etc.) (Bariæ, 1979).
Geochemical analyses were carried out on sediment
samples from the @utica –1 zapad well. @utica –1 zapad
exploration well is located at north-western margin of
@utica structure. The well reached the depth of 2 906.5
m. Quaternary and Neogene sediments were recognized,
from Lonja to the upper part of Preèec Formation. Lonja
Formation was determined up to the depth of 914 m, and
it is bounded by �’ log marker and the surface. These se-
quences stratigraphically belong to Quaternary and
Levantian – Dacian stage (Pliocene). Sands, gravel and
clay, sandy and gravel clay with coal intercalations ap-
pear in this interval. Široko polje Formation is defined in
interval from 917.0 to 1 557.0 m. Formation is bounded
by �’ and R� log markers while deposits stratigraphically
relate to the Upper Pontian and top part to Lower Pontian
age. In the upper part of formation clay with gravel sand
and with coal intercalations appears. These deposits in
deeper parts are transformed into marly clay and clay
marl, and at the bottom into mica sandstone. Kloštar
Ivaniæ Formation of Lower Pontian age appears in the in-
terval from 1 557.0 to 2 037.0 m. Formation is bounded
by R� and Z’ markers while sandstones in alteration with
marls occur too. Ivaniæ Grad Formation in interval from
2 037.0 to 2 524.0 m, belongs to Upper Pannonian age
and is situated between log markers Z’ and Rs5. The sed-
iments are sandstones in alteration with marls. Prkos
Formation is situated between 2 524.0 and 2 670.0 m,
Rs5 and Rs7 log markers, and corresponds to Lower
Pannonian. These deposits are marls enriched with or-
ganic matter. Preèec Formation was drilled at the depth
of more than 2 670.0 m, and bounded by Rs7 and Tg.
This sedimentary interval is of Badenian age and it con-
sists of marls that are gradually transformed into sandy
marls, below 2 820.7 m.
3. Geochemical Testing Methods for
Sediments and Hydrocarbons from
@utica -1 zapad Well and for Oil
from @utica Field
The samples from five core intervals were chosen for geo-
chemical testing. All samples belong to Prkos and Preèec
Formation and they originated from the depth range
from 2 542 to 2 906 m. This sedimentary complex con-
sists of dark compact marls which in deeper parts
change into sandy marls. Pelitic sediments are interest-
ing from geochemical point of view, but all sediments
have not been analyzed as cuttings from mud were not
preserved. Along with the sediments, oil and bitumen
were tested as well, and the results were compared with
representative oil sample from @utica field.
Following analyses and testing methods were per-
formed:
• macroscopic sediments description and hydrocarbon
quality tests under fluorescent light
• total organic carbon determination
• determination of source rock properties by Rock-Eval
pyrolysis
• optical examination of organic matter
• mathematical modeling
• determination of soluble organic matter, bitumen
• characterization of main group of compounds in bitu-
men and oil
• gas – chromatographic analyses of bitumen and oil
3.1 Macroscopic Sediments Description and
Hydrocarbon Quality Tests under
Fluorescent Light and Preparation of
Chosen Samples
Macroscopic sediments determination showed the pres-
ence of dark-grey to black compact marls. After chloro-
form treating and UV light examination, light-yellow to
gold-yellow fluorescence appeared in all samples. The
samples taken for further analyses were rinsed with wa-
ter to remove the mud residues. The samples were dried,
pulverized and screened to granulation of 0.5 mm. Such
prepared samples were used for further analyses.
3.2 Determination of Total Organic Carbon
Content
The organic matter content in the rock is expressed as to-
tal organic carbon (TOC). This simple and fast analysis is
the initial parameter in estimation of the potential source
rocks. Examinations of the amount of total organic car-
bon, on numerous rock samples, of different geological
age, showed that the samples from oil bearing regions
ORGANIC GEOCHEMISTRY, ITS MEANING IN THE PROCESS... R. VASILJEVIÆ
NAFTA 60 (11) 591-602 (2009) 593
CORE INTERVAL (m) TOC (%)
2 542.0 - 2 545.5 I 0.51
II 1.69
2 577.2 - 2 579.4 I 1.63
II 0.94
2 731.0 - 2 734.0 I 2.35
II 2.96
III 1.56
2 820.7 – 2 823.6 I 1.06
II 1.14
2 904.5 – 2 906.5 I 0.67
II 0.57
Table 1. Organic matter content (TOC) in cores, @utica –1
zapad well (Leco analyzer)
Page 4
contain up to three times larger amount of organic mat-
ter than samples from other regions (Ronov, 1958). For
determining the organic matter quantity approximately
one gram of rock sample is sufficient, but if rock is en-
riched with organic matter, smaller quantities would be
enough. The removal of inorganic components contain-
ing carbon is implemented in the initial phase while the
quantity of organic matter is determined by burning the
sample in oxygen current at a temperature of 1 200 °C.
Organic matter in the sample is oxidized to CO and CO2
and the resulting carbon dioxide is proportional to the
content of organic matter in the rocks. Results of testing
showed that all samples contain increased amount of or-
ganic matter, which indicates possible source rocks.
Eleven samples from five intervals were prepared ac-
cording to the described procedure. TOC measuring was
performed using Leco analyzer. TOC values in samples
were between 0.51 to 2.96%, average TOC was 1.37%
(Table 1). Particularly high concentrations of organic
matter (1.56 to 2.96%) contained samples from 2731.0-2
734.0 m interval. The results show that all samples con-
tain increased amount of organic matter, which is an in-
dicator of possible source rocks.
The rocks enriched with organic matter were identified
at various locations in the northwestern part of Sava De-
pression. Marly limestones, calcareous and sandy marls
of Prkos and Preèec Formations, of Lower Pannonian to
Badenian age, at depths from 1 600 to 3 000 m contain
increased amount of organic matter. The average content
of organic matter is 1.4%, which is in conformity with
sediments testing in @utica-1 zapad well.
3.3 Determination of Source Rocks Properties
by Rock-Eval Pyrolysis
Rock-Eval pyrolysis was used for source rock hydrocar-
bon potential determination. As hydrocarbon generation
depended on temperature and geological time, pyrolysis
process is performed at much higher temperatures than
those of subsurface, what compensates much shorter
geological period. Pulverized rock sample is gradually
heated in inert atmosphere to the temperature of 550 ºC.
During the warming, at a temperature of about 250 ºC
free hydrocarbons release from rock, which is detected
as the value of S1. Further warming, at the temperature
interval between 420 and 460 ºC causes cracking of
kerogen molecules and release of newly formed hydro-
carbons (value S2). The value of S2 is the most important
indicator of the ability of the rock to generate hydrocar-
bons. At the end, rock releases carbon dioxide (S3 value).
Values S1, S2 and S3 are expressed as milligram of hydro-
carbons per gram of rock (mg HC/g rock).
Rock-Eval pyrolysis parameters were measured on all
samples with TOC higher than 0.5%. The results (Table
2, Figure 2) show that the samples have higher values of
residual potential (S2). Particularly, high potentials were
registered in rock samples from intervals from 2 542.0
to 2 545.5 m, 2 577.2 – 2 579.4 m and 2 731.0 – 2 734.0
m, that belong to marls of Prkos and upper part of Preèec
formation. Residual potential in several samples reaches
a value of 14.93 mgHC/g rock. According to the existing
classification, these sediments represent good to very
good source rocks. Rock samples from deeper part of
Preèec Formation are sandy marls, containing less con-
tent of the organic matter, and generation potential is re-
duced. Good generation potential of Prkos Formation
sediments is the result of enhanced concentration of or-
ganic matter and favorable, hydrogen rich lipid kerogen.
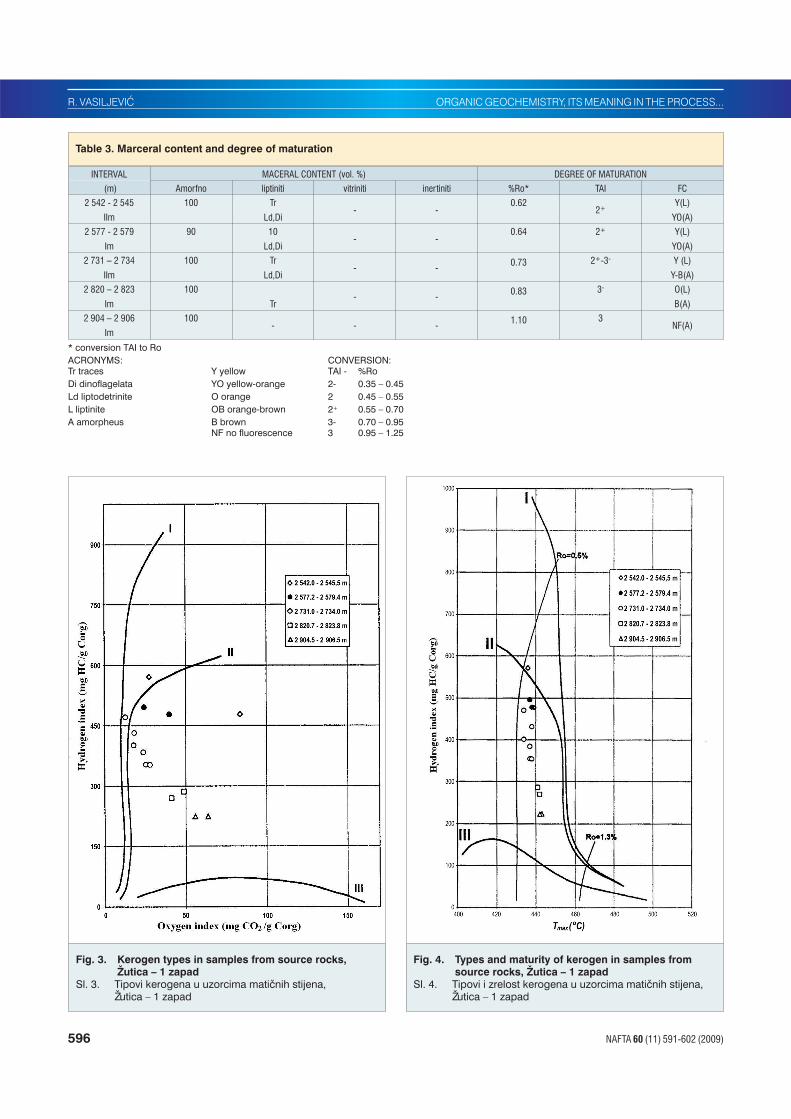
From the values of hydrogen and oxygen indexes (Table
2) in modified Van Krevelen diagram (Figure 3), kerogen
type II was estimated, while mixed type II and III is pres-
ent in samples from deeper formations. Determined
types of organic facies are considered as good petroleum
hydrocarbon sources.
594 NAFTA 60 (11) 591-602 (2009)
R. VASILJEVIÆ ORGANIC GEOCHEMISTRY, ITS MEANING IN THE PROCESS...
Core
interval
(m)
Corg
(%)
S1
mg HC
g st
S2
mg HC
g st
S3
mg CO2
g st
Tmax
(ºC)PI
S2
S3
HI
mg HC
g Corg
OI
mg CO2
g Corg
Ekst.
(ppm)
2 542.0 – 2 545.5 I 0.31 0.20 1.48 0.26 439 0.12 5.69 477 84 766
II 1.51 0.73 8.62 0.42 436 0.08 20.52 571 28
2 577,2 – 2 579.4 I 1.42 0.56 7.04 0.35 437 0.07 20.11 496 25
II 0.72 0.36 3.44 0.29 438 0.09 11.86 478 40
2 731.0 – 2 734.0 I 2.46 3.35 9.87 0.45 434 0.25 21.93 401 18 7 980
I (E) 1.83 0.18 6.47 0.47 437 0.03 13.77 354 26
II 3.17 3.26 14.93 0.41 434 0,18 36.41 471 13
II (E) 2.38 0.20 10.27 0.44 438 0.02 23.34 432 18 9 560
III 1.61 1.20 6.18 0.39 437 0.16 15.85 384 24
III (E) 1.34 0.15 4.73 0.38 438 0.03 12.45 353 28
2 820.7 – 2 823.6 I 0.99 0.70 2.67 0.41 442 0.21 6.51 270 41
II 0.98 0.76 2.80 0.48 441 0.21 5.83 286 49 2 120
2 904.5 – 2 906.5 I 0.55 0.54 1.23 0.35 443 0.31 3.51 224 64
II 0.43 0.41 0.96 0.24 442 0.30 4.00 223 56
(E) – extracted sample
Table 2. Results of Rock-Eval pyrolysis of samples from the core, @utica -1 zapad
Page 5
Tmax values of tested sediments
show regular maturity increase
with depth (436 to 443 ºC) (Fig-
ure 4). Source rocks maturity of
oil window was estimated from
maturity profiles. Hydrocarbon
generation possibilities are sig-
nificant, S1 value is high, which
indicates increased quantity of
free, thermo vaporized hydrocar-
bons. Only core samples were ex-
amined, but uniform litostrati-
graphic characteristics of sedi-
ments within interval from 2 542
to 2 906 m imply that this sedi-
mentary complex represents ma-
ture source rocks and generated
hydrocarbons which migrated
and saturated reservoir rocks in
the Oil field @utica.
Source rocks characteristics
tested in Sava Depression
showed similar results. Hydro-
gen indices between 250 and 600
mg HC/gTOC imply hydrogen
rich kerogen, type II, which is a
source of petroleum hydrocar-
bons in this area. Hydrocarbon
potential of source rocks is not
equable but varies in broad
range. The main causes are dif-
ferent conditions in depositional
environment (oxic – anoxic)
which influenced quantity and
quality of deposited organic mat-
ter. Measured and calculated val-
ues of source rocks maturity
show regular increase of matu-
rity with depth. Based on matu-
rity profiles, oil window in Sava
Depression starts at the depth of
2 200 m, which corresponds to
geothermal gradients of this area
(4-5 ºC /100 m). The research
showed that identified source
rocks in Sava Depression were in
mature catagenetic phase of hy-
drocarbon generation.
3.4 Optical Examination of
Organic Matter
Methods of optical microscopy
were also used in determining
the type and maturity of organic
matter. Results of this research
are in accordance with the re-
sults of previous chemical and
physical determinations. Optical
examination of maceral composi-
tion of kerogen, enabled further
detailed characterization.
ORGANIC GEOCHEMISTRY, ITS MEANING IN THE PROCESS... R. VASILJEVIÆ
NAFTA 60 (11) 591-602 (2009) 595
Fig. 2. Rock-Eval parameters in the core, �utica – 1 zapad
Sl. 2. Prikaz Rock Eval parametara u mehanièkim jezgrama, �utica – 1 zapad
Page 6
596 NAFTA 60 (11) 591-602 (2009)
R. VASILJEVIÆ ORGANIC GEOCHEMISTRY, ITS MEANING IN THE PROCESS...
INTERVAL MACERAL CONTENT (vol. %) DEGREE OF MATURATION
(m) Amorfno liptiniti vitriniti inertiniti %Ro* TAI FC
2 542 - 2 545
IIm
100 Tr
Ld,Di- -
0.622+
Y(L)
YO(A)
2 577 - 2 579
Im
90 10
Ld,Di- -
0.64 2+ Y(L)
YO(A)
2 731 – 2 734
IIm
100 Tr
Ld,Di- -
0.73 2+-3- Y (L)
Y-B(A)
2 820 – 2 823
Im
100
Tr- -
0.83 3- O(L)
B(A)
2 904 – 2 906
Im
100- - -
1.10 3NF(A)
* conversion TAI to Ro
ACRONYMS: CONVERSION:
Tr traces Y yellow TAI - %Ro
Di dinoflagelata YO yellow-orange 2- 0.35 – 0.45
Ld liptodetrinite O orange 2 0.45 – 0.55
L liptinite OB orange-brown 2+ 0.55 – 0.70
A amorpheus B brown 3- 0.70 – 0.95
NF no fluorescence 3 0.95 – 1.25
Table 3. Marceral content and degree of maturation
Fig. 3. Kerogen types in samples from source rocks,
�utica – 1 zapad
Sl. 3. Tipovi kerogena u uzorcima matiènih stijena,
�utica – 1 zapad
Fig. 4. Types and maturity of kerogen in samples from
source rocks, �utica – 1 zapad
Sl. 4. Tipovi i zrelost kerogena u uzorcima matiènih stijena,
�utica – 1 zapad
Page 7
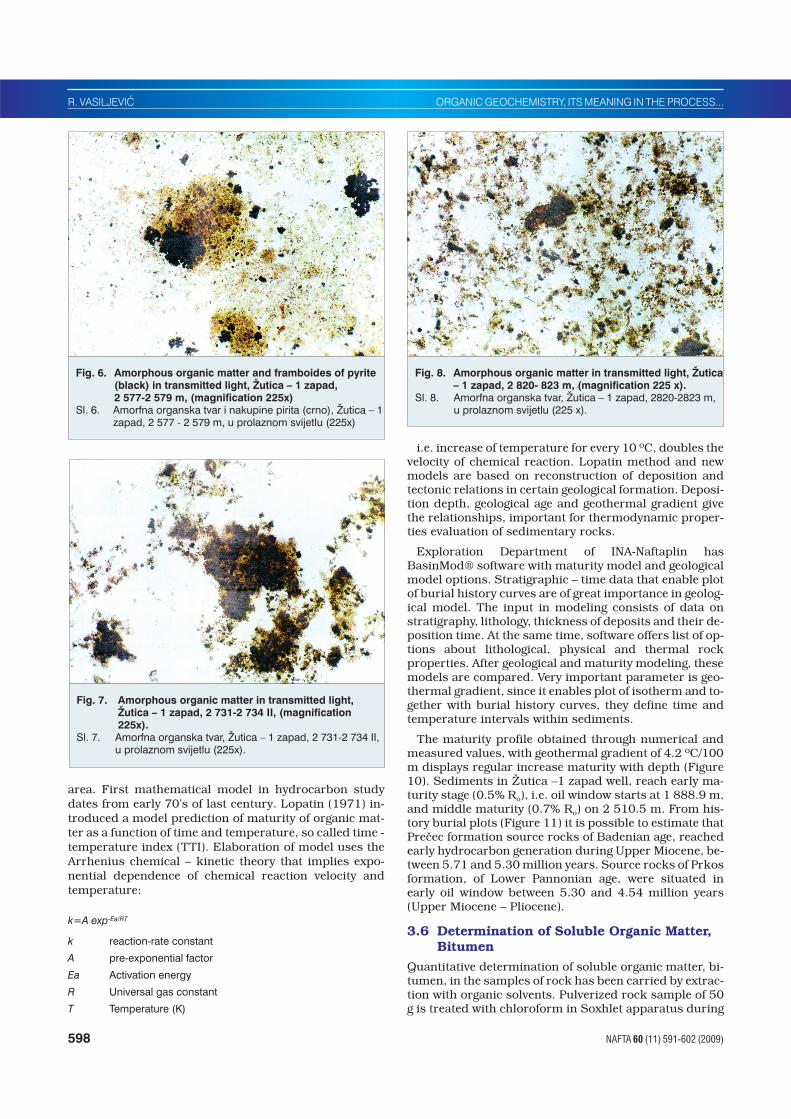
Isolated kerogen samples were examined
in transmitted light and amorphous
kerogen was defined as predominant com-
pound (90-100%) (Table 3). Content of
liptinite maceral is low, and terrestrial
vitrinite has not been found in any sample.
Amorphous kerogen visible on microscopic
photographs (Figure 6, 7 and 8) indicates
hydrogen rich kerogen, which originated
from Marine algae, lipid-cell bacteria, as
well as from plant wax and resins. Beside
amorphous kerogen, the presence of black
framboids pyrite was also recognized on
the photographs. The presence of pyrite is
usual characteristic of anoxic environments
which enabled good precursor preserva-
tion. Amorphous kerogen is considered as
good precursor of petroleum hydrocar-
bons.
Maturity of organic matter was estimated
from the palinomorph color in transmitted
and fluorescent light. The color in transmit-
ted light was expressed in numerical values
as Thermal Alteration Index (TAI). The
Staplin's (1969) scale with values between 1
and 4 was used for color description.
TAI values of tested kerogene varied be-
tween 2+ to 3 and they changed with depth.
(Table 3). Fluorescence color also changed
from yellow-orange, yellow-brown and
brown to no fluorescence at the depth of 2
906 m, which is the result of relatively high
thermal alteration degree.
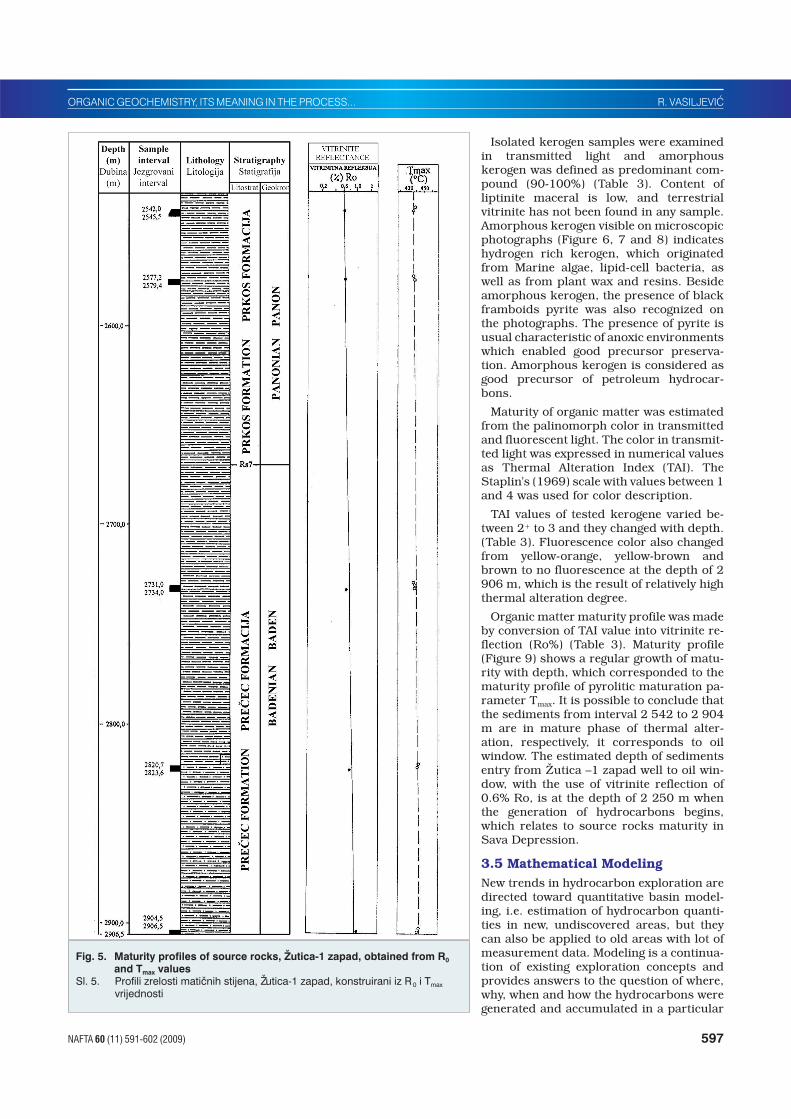
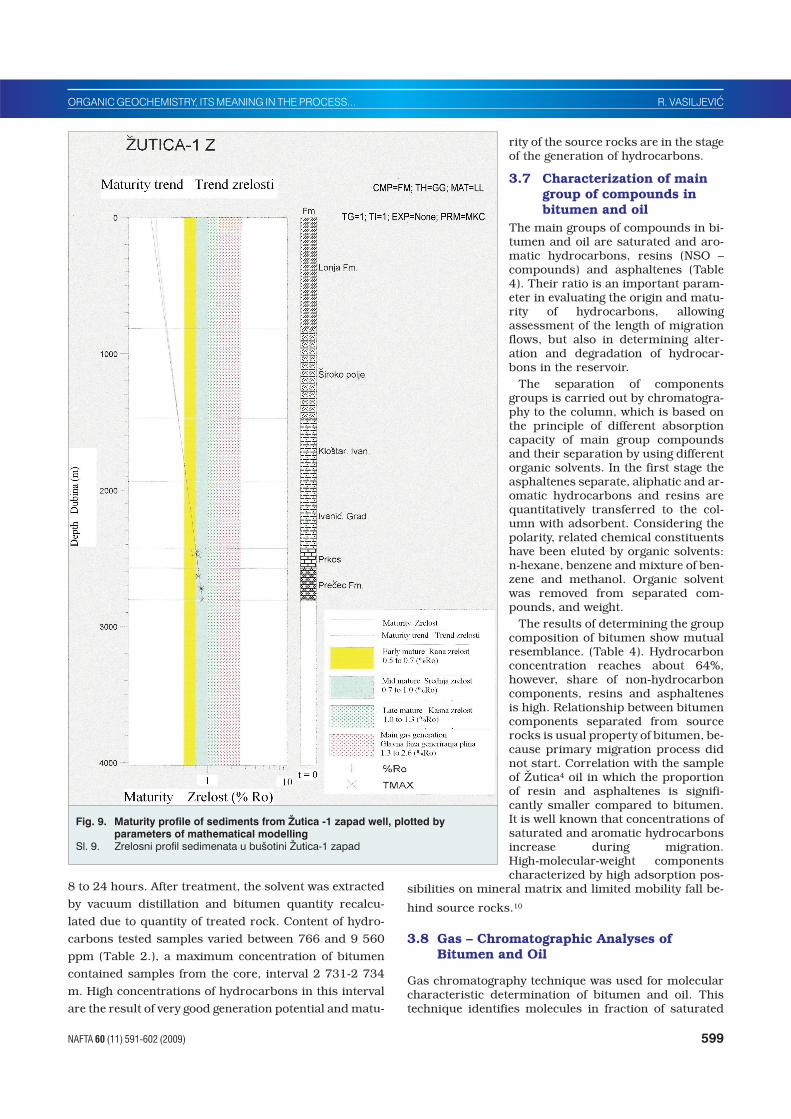
Organic matter maturity profile was made
by conversion of TAI value into vitrinite re-
flection (Ro%) (Table 3). Maturity profile
(Figure 9) shows a regular growth of matu-
rity with depth, which corresponded to the
maturity profile of pyrolitic maturation pa-
rameter Tmax. It is possible to conclude that
the sediments from interval 2 542 to 2 904
m are in mature phase of thermal alter-
ation, respectively, it corresponds to oil
window. The estimated depth of sediments
entry from @utica –1 zapad well to oil win-
dow, with the use of vitrinite reflection of
0.6% Ro, is at the depth of 2 250 m when
the generation of hydrocarbons begins,
which relates to source rocks maturity in
Sava Depression.
3.5 Mathematical Modeling
New trends in hydrocarbon exploration are
directed toward quantitative basin model-
ing, i.e. estimation of hydrocarbon quanti-
ties in new, undiscovered areas, but they
can also be applied to old areas with lot of
measurement data. Modeling is a continua-
tion of existing exploration concepts and
provides answers to the question of where,
why, when and how the hydrocarbons were
generated and accumulated in a particular
ORGANIC GEOCHEMISTRY, ITS MEANING IN THE PROCESS... R. VASILJEVIÆ
NAFTA 60 (11) 591-602 (2009) 597
Fig. 5. Maturity profiles of source rocks, �utica-1 zapad, obtained from R0
and Tmax values
Sl. 5. Profili zrelosti matiènih stijena, �utica-1 zapad, konstruirani iz R 0 i Tmax
vrijednosti
Page 8
area. First mathematical model in hydrocarbon study
dates from early 70’s of last century. Lopatin (1971) in-
troduced a model prediction of maturity of organic mat-
ter as a function of time and temperature, so called time -
temperature index (TTI). Elaboration of model uses the
Arrhenius chemical – kinetic theory that implies expo-
nential dependence of chemical reaction velocity and
temperature:
k=A exp-Ea/RT
k reaction-rate constant
A pre-exponential factor
Ea Activation energy
R Universal gas constant
T Temperature (K)
i.e. increase of temperature for every 10 ºC, doubles the
velocity of chemical reaction. Lopatin method and new
models are based on reconstruction of deposition and
tectonic relations in certain geological formation. Deposi-
tion depth, geological age and geothermal gradient give
the relationships, important for thermodynamic proper-
ties evaluation of sedimentary rocks.
Exploration Department of INA-Naftaplin has
BasinMod® software with maturity model and geological
model options. Stratigraphic – time data that enable plot
of burial history curves are of great importance in geolog-
ical model. The input in modeling consists of data on
stratigraphy, lithology, thickness of deposits and their de-
position time. At the same time, software offers list of op-
tions about lithological, physical and thermal rock
properties. After geological and maturity modeling, these
models are compared. Very important parameter is geo-
thermal gradient, since it enables plot of isotherm and to-
gether with burial history curves, they define time and
temperature intervals within sediments.
The maturity profile obtained through numerical and
measured values, with geothermal gradient of 4.2 ºC/100
m displays regular increase maturity with depth (Figure
10). Sediments in @utica –1 zapad well, reach early ma-
turity stage (0.5% Ro), i.e. oil window starts at 1 888.9 m,
and middle maturity (0.7% Ro) on 2 510.5 m. From his-
tory burial plots (Figure 11) it is possible to estimate that
Preèec formation source rocks of Badenian age, reached
early hydrocarbon generation during Upper Miocene, be-
tween 5.71 and 5.30 million years. Source rocks of Prkos
formation, of Lower Pannonian age, were situated in
early oil window between 5.30 and 4.54 million years
(Upper Miocene – Pliocene).
3.6 Determination of Soluble Organic Matter,
Bitumen
Quantitative determination of soluble organic matter, bi-
tumen, in the samples of rock has been carried by extrac-
tion with organic solvents. Pulverized rock sample of 50
g is treated with chloroform in Soxhlet apparatus during
598 NAFTA 60 (11) 591-602 (2009)
R. VASILJEVIÆ ORGANIC GEOCHEMISTRY, ITS MEANING IN THE PROCESS...
Fig. 6. Amorphous organic matter and framboides of pyrite
(black) in transmitted light, @utica – 1 zapad,
2 577-2 579 m, (magnification 225x)
Sl. 6. Amorfna organska tvar i nakupine pirita (crno), @utica – 1
zapad, 2 577 - 2 579 m, u prolaznom svijetlu (225x)
Fig. 7. Amorphous organic matter in transmitted light,
@utica – 1 zapad, 2 731-2 734 II, (magnification
225x).
Sl. 7. Amorfna organska tvar, @utica – 1 zapad, 2 731-2 734 II,
u prolaznom svijetlu (225x).
Fig. 8. Amorphous organic matter in transmitted light, @utica
– 1 zapad, 2 820- 823 m, (magnification 225 x).
Sl. 8. Amorfna organska tvar, @utica – 1 zapad, 2820-2823 m,
u prolaznom svijetlu (225 x).
Page 9
8 to 24 hours. After treatment, the solvent was extracted
by vacuum distillation and bitumen quantity recalcu-
lated due to quantity of treated rock. Content of hydro-
carbons tested samples varied between 766 and 9 560
ppm (Table 2.), a maximum concentration of bitumen
contained samples from the core, interval 2 731-2 734
m. High concentrations of hydrocarbons in this interval
are the result of very good generation potential and matu-
rity of the source rocks are in the stage
of the generation of hydrocarbons.
3.7 Characterization of main
group of compounds in
bitumen and oil
The main groups of compounds in bi-
tumen and oil are saturated and aro-
matic hydrocarbons, resins (NSO –
compounds) and asphaltenes (Table
4). Their ratio is an important param-
eter in evaluating the origin and matu-
rity of hydrocarbons, allowing
assessment of the length of migration
flows, but also in determining alter-
ation and degradation of hydrocar-
bons in the reservoir.
The separation of components
groups is carried out by chromatogra-
phy to the column, which is based on
the principle of different absorption
capacity of main group compounds
and their separation by using different
organic solvents. In the first stage the
asphaltenes separate, aliphatic and ar-
omatic hydrocarbons and resins are
quantitatively transferred to the col-
umn with adsorbent. Considering the
polarity, related chemical constituents
have been eluted by organic solvents:
n-hexane, benzene and mixture of ben-
zene and methanol. Organic solvent
was removed from separated com-
pounds, and weight.
The results of determining the group
composition of bitumen show mutual
resemblance. (Table 4). Hydrocarbon
concentration reaches about 64%,
however, share of non-hydrocarbon
components, resins and asphaltenes
is high. Relationship between bitumen
components separated from source
rocks is usual property of bitumen, be-
cause primary migration process did
not start. Correlation with the sample
of @utica4 oil in which the proportion
of resin and asphaltenes is signifi-
cantly smaller compared to bitumen.
It is well known that concentrations of
saturated and aromatic hydrocarbons
increase during migration.
High-molecular-weight components
characterized by high adsorption pos-
sibilities on mineral matrix and limited mobility fall be-
hind source rocks.10
3.8 Gas – Chromatographic Analyses of
Bitumen and Oil
Gas chromatography technique was used for molecular
characteristic determination of bitumen and oil. This
technique identifies molecules in fraction of saturated
ORGANIC GEOCHEMISTRY, ITS MEANING IN THE PROCESS... R. VASILJEVIÆ
NAFTA 60 (11) 591-602 (2009) 599
Fig. 9. Maturity profile of sediments from @utica -1 zapad well, plotted by
parameters of mathematical modelling
Sl. 9. Zrelosni profil sedimenata u bušotini @utica-1 zapad
Page 10
hydrocarbons. Analyses were performed on gas
chromatograph Perkin Elmer with capillary column.
Bitumen from @utica – 1 zapad well and oil from @utica
field were undergoing gas chromatographic analysis. Re-
sults showed smaller differences in length of hydrocar-
bon chain molecule, content of n-alkanes, iso-alkanes
and molecule ratios of Pr/C17, Ph/C18 and Pr/Ph. These
differences can be seen from gas chromatograms (Figure
9). Differences in molecular distribution are result of dif-
ferences of their precursors. Molecular distribution of bi-
tumen from 2 820 to 2 823 m interval with increased
content of isoprenoids is indicator of enhanced content
of terrigenous components (Bariæ, 1993). Hydrocarbon
distribution corresponds to deter-
mined type of organic facies. There is
no correspondence between gas chro-
matography profiles of bitumen and oil
from @utica field. The greatest similar-
ity of oil from @utica field was detected
in bitumen extracted from cores in 2
731-2 734 m interval. Results indicate
that oil from @utica field is the mixture
of hydrocarbons generated in nearby
source rocks, which show smaller dif-
ferences in type and maturity of precur-
sors. Alteration of hydrocarbon
chemical compounds occurs during
migration process and additional alter-
ations are the result of hydrocarbons
mixing in reservoir rocks.
4. CONCLUSION
Sediments of Prkos and Preèec Forma-
tion, of Lower Pannonian and
Badenian age, from the interval 2 522.4
to 2 906.5 m, sampled from @utica – 1
zapad well, were geochemically tested.
Core samples from the 2 542.0 –
2 545.5 m interval and 2 577.0 - 2
579.4 m are highly compact, dark grey
to black marls with increased content
of carbonaceous compounds. Deeper,
the content of sand component in
marls increases, which is reflected on
decreased quantity of organic matter,
organic facies alteration and lower gen-
erative potential.
Sediments showed increased quanti-
ties of organic matter, and maximum
value of TOC (3.17%) was registered in
core interval 2 731.0 – 2 734.0 m. Rock
Eval pyrolysis confirmed the existence
of source rocks, with changeable gener-
ation potential which varies between
1.37 to 14.93 mg HC/g rock. Differ-
ences in sediment hydrocarbon genera-
tion possibilities are result of changes
in sedimentation environment. Organic
facies determined from pyrolytic pa-
rameters, hydrogen and oxygen indices
and optical examination showed pres-
ence of predominantly hydrogen rich,
lipid kerogen, type II. In sediments at the depths below 2
820.7 m kerogen type slightly changes, as terrigenous
components increase and kerogen presents mixture of
kerogen type II and III, but with lower generation capac-
ity. Examined sediments are god source rocks and hy-
drogen rich kerogen is the source of petroleum
hydrocarbons.
Maturity of organic matter was determined thorugh
pyrolytic (Tmax) and optical (TAI) parameters. Maturity
profiles show regular increase in maturity with depth
and determined source rocks reached oil window,
catagenetic stage of thermal alteration. Sediments from
@utica –1 zapad well reached oil window phase at 2 250
600 NAFTA 60 (11) 591-602 (2009)
R. VASILJEVIÆ ORGANIC GEOCHEMISTRY, ITS MEANING IN THE PROCESS...
Fig.10. Burial history curves of sediments, @utica -1 zapad well
Sl. 10. Krivulje povijesti zalijeganja sedimenata, bušotina @utica – 1 zapad.
Page 11
m. Favourable type and maturity of organic matter re-
flected with increased quantity of hydrocarbons, bitu-
men. Extracted bitumen, compared with oil from @utica
field, characterized increased content of high molecular
resins and asphaltenes and decreased content of alkane
and aromatic components. Differences are the result of
adsorption of resine and asphaltene compounds and de-
creased migration possibilities. Bitumen molecular
properties show differences too, as a result of differences
in type and precursor maturity. Correlation of basic and
molecular properties of bitumen and oil from the oil field
@utica showed differences, which is possible to explain
by chemical hydrocarbon alteration during migration
processes from neighboring precursors, which are of
various types and maturity of organic facies and by hy-
drocarbon mixing processes in the reservoir.
This paper presents sediment complex in hydrocarbon
generation stage. Together with geological and geophysi-
cal methods it is possible to confirm regional distribu-
tion of these source rocks which enable determination of
sediments volume characteristics as well as estimation of
their real generating properties.
Acknowledgment
I would like to express my gratitude to dr. sc. Gertrud
Bariæ from INA Industrija nafte d.d. for her constructive
help to accomplish this paper, and my college Goran
Mikša from INA Naftaplin for support in writing of this
paper and to company ECOINA ltd.
ORGANIC GEOCHEMISTRY, ITS MEANING IN THE PROCESS... R. VASILJEVIÆ
NAFTA 60 (11) 591-602 (2009) 601
Interval
(m)
Extract
(ppm)
alkanes
(%)
aromates
(%)
resins
(%)
asphaltenes
(%)
2 542 - 2 545 722 45.8 18.2 27.8 8.2
2 731 - 2 734 7 980 45.3 18.0 26.5 10.2
@utica oil - 60.5 25.7 12.2 1.6
Table 4. Results of main group compounds in bitumen from @utica-1 zapad well and @utica oil
Fig. 11. Gas chromatograms of bitumen from @utica – 1
zapad well and @utica oil
Sl. 11. Plinski kromatogrami bitumena @utica – 1 zapad i nafte
@utica
Sample interval (m)
bitumen and oil 2 542 - 2 545 2 731 - 2 734 2820 - 2823 @utica
n –alkanes (%) 80.43 77.14 74.79 60.29
iso–alkanes (%) 19.58 22.85 25.21 39.71
Pr/C17 0.64 0.54 1.35 0.82
Ph/C18 0.92 0.94 1.06 0.86
Ph/Pr 0.89 0.61 1.54 1.07
HC range C14-C32 C13-C33 C14-C33 C6-C33
Table 5. Gas chromatographic data of bitumen @utica – 1
zapad well and @utica oil
Page 12
References
1. Bariæ, G. (1979): Prilog poznavanju sastava i svojstava bitumena s lokaliteta
@utica. Magistarski rad, Kemijsko-tehnološki fakultet sveuèilišta u Zagrebu,
62 str.
2. Bariæ, G. (1993): Coal – bed hydrocarbon characteristics at the Vrbak
Benkovica exploration locations, Nafta (10), 543 – 554. Zagreb.
3. Bariæ, G. (1996): Organic Geochemistry in the Rationalization of Oil and Gas
Exploration and Production, Geologia Croatica, 49/2, 191-195. Zagreb.
4. Bariæ, G., et al., (1998): Petroleum System of the Sava Depression, Croatia. 60
th EAGE Conference and Technical Exhibition 8 – 12 June 1998, Leipzig. Ex-
tended Abstracts, 2, 4 - 12.
5. Bariæ, G., et al., (2000): The miocene petroleum system of the Sava Depres-
sion, Croatia. Petroleum Geoscience, 6, 165 – 173.
6. Bariæ, G. (2006): Naftna geokemija, INA Industrija nafte d.d. Zagreb, 208,
222, 223.
7. Hunt, J. M. (1996): Petroleum Geochemistry and Geology. 2nd ed., Freeman,
San Francisco.
8. Lopatin, N.V. (1971): Temperature and geological time factors in
coalification, Izvestiya Akademii Nauk USSR, Seriya Geologicheskaya, no. 3,
95-106. Moskva.
9. Ronov, A.B. (1958): Organic carbon in sedimentary rocks (in relation to the
presence of petroleum) .Geochemistry, 5, 497-509. Washington.
10. Tissot, B., Welte, D. H. (1984): Petroleum Formation and Occurence. 2nd ed.
Springer Verlag, pp 325-340, Heidelberg.
11. Vasiljeviæ R. (1998): Geokemijske znaèajke badenskih i panonskih talo�ina te
ugljikovodika u bušotini @utica –1 zapad, diplomski rad, Rudarsko-Geološko-
Naftni Fakultet, Sveuèilišta u Zagrebu
�
Author:
Ratko Vasiljeviæ, grad. eng., ECOINA ltd, [email protected]
602 NAFTA 60 (11) 591-602 (2009)
R. VASILJEVIÆ ORGANIC GEOCHEMISTRY, ITS MEANING IN THE PROCESS...