Page 1
Atmos. Chem. Phys., 15, 13377–13392, 2015
www.atmos-chem-phys.net/15/13377/2015/
doi:10.5194/acp-15-13377-2015
© Author(s) 2015. CC Attribution 3.0 License.
Organic nitrate aerosol formation via NO3 + biogenic volatile
organic compounds in the southeastern United States
B. R. Ayres1, H. M. Allen1,2, D. C. Draper1,3, S. S. Brown4, R. J. Wild4, J. L. Jimenez5,6, D. A. Day5,6,
P. Campuzano-Jost5,6, W. Hu5,6, J. de Gouw5,6, A. Koss5,6, R. C. Cohen7, K. C. Duffey7, P. Romer7, K. Baumann8,
E. Edgerton8, S. Takahama9, J. A. Thornton10, B. H. Lee10, F. D. Lopez-Hilfiker10, C. Mohr10,11, P. O. Wennberg12,
T. B. Nguyen12, A. Teng12, A. H. Goldstein13, K. Olson13, and J. L. Fry1
1Department of Chemistry, Reed College, Portland, OR, USA2Division of Chemistry and Chemical Engineering, California Institute of Technology, Pasadena, CA, USA3Department of Chemistry, University of California, Irvine, CA, USA4Earth System Research Laboratory, National Oceanic and Atmospheric Administration, Boulder, CO, USA5Cooperative Institute for Research in Environmental Sciences, University of Colorado, Boulder, CO, USA6Department of Chemistry and Biochemistry, University of Colorado, Boulder, CO, USA7Department of Chemistry, University of California at Berkeley, CA, USA8Applied Research Associates, Inc., Research Triangle Park, NC, USA9Department of Environmental Engineering, École polytechnique fédérale de Lausanne (EPFL), Switzerland10Department of Atmospheric Sciences, University of Washington, Seattle, WA, USA11Karlsruhe Institute of Technology, Karlsruhe, Germany12Division of Geological and Planetary Sciences and Division of Engineering and Applied Science, California Institute of
Technology, Pasadena, CA, USA13Department of Environmental Science, Policy, and Management, University of California, Berkeley, CA, USA
Correspondence to: J. L. Fry ([email protected] )
Received: 12 May 2015 – Published in Atmos. Chem. Phys. Discuss.: 16 June 2015
Revised: 26 October 2015 – Accepted: 14 November 2015 – Published: 3 December 2015
Abstract. Gas- and aerosol-phase measurements of oxi-
dants, biogenic volatile organic compounds (BVOCs) and or-
ganic nitrates made during the Southern Oxidant and Aerosol
Study (SOAS campaign, Summer 2013) in central Alabama
show that a nitrate radical (NO3) reaction with monoterpenes
leads to significant secondary aerosol formation. Cumulative
losses of NO3 to terpenes are correlated with increase in gas-
and aerosol-organic nitrate concentrations made during the
campaign. Correlation of NO3 radical consumption to or-
ganic nitrate aerosol formation as measured by aerosol mass
spectrometry and thermal dissociation laser-induced fluores-
cence suggests a molar yield of aerosol-phase monoterpene
nitrates of 23–44 %. Compounds observed via chemical ion-
ization mass spectrometry (CIMS) are correlated to predicted
nitrate loss to BVOCs and show C10H17NO5, likely a hy-
droperoxy nitrate, is a major nitrate-oxidized terpene product
being incorporated into aerosols. The comparable isoprene
product C5H9NO5 was observed to contribute less than 1 %
of the total organic nitrate in the aerosol phase and corre-
lations show that it is principally a gas-phase product from
nitrate oxidation of isoprene. Organic nitrates comprise be-
tween 30 and 45 % of the NOy budget during SOAS. Inor-
ganic nitrates were also monitored and showed that during
incidents of increased coarse-mode mineral dust, HNO3 up-
take produced nitrate aerosol mass loading at a rate compa-
rable to that of organic nitrate produced via NO3+BVOCs.
1 Introduction
Secondary organic aerosol (SOA), formed from the oxida-
tion of volatile organic compounds (VOCs) by ozone (O3),
hydroxyl radical (OH), or nitrate radical (NO3), affects visi-
bility as well as regional and global radiative climate forcing
(Bellouin et al., 2011; Feng and Penner, 2007; Goldstein
et al., 2009; Myhre et al., 2013). Aerosol has been studied
Published by Copernicus Publications on behalf of the European Geosciences Union.
Page 2
13378 B. R. Ayres et al.: Organic nitrate aerosol formation in the southeastern US
as a source for significant risk factors for pulmonary and car-
diac disorders (Nel, 2005; Pope and Dockery, 2006). Organic
aerosol (OA) contributes a large fraction of the total tropo-
spheric submicron particulate matter (PM; De Gouw, 2005;
Heald et al., 2005; Zhang et al., 2007). Biogenic volatile or-
ganic compounds (BVOCs) are dominant precursors in SOA
formation (Goldstein and Galbally, 2007; Spracklen et al.,
2011). SOA is a significant fraction of total aerosol mass
in the southeastern United States (SEUS) (predicted to be
80–90 % of the organic aerosol load; Ahmadov et al., 2012;
Stocker et al., 2013). Understanding the interaction of an-
thropogenic pollutants with BVOCs is vital to improving our
understanding of the human impact on SOA formation (Carl-
ton et al., 2010; Spracklen et al., 2011) and the associated
radiative forcing of climate change (Stocker et al., 2013).
Nitrogen oxides (NOx =NO+NO2), common byprod-
ucts of combustion, are linked to aerosol formation in the tro-
posphere via daytime and nighttime oxidation mechanisms
(Rollins et al., 2012). Total reactive nitrogen, NOy , consists
of NOx , as well as NOx reaction products, including NO3,
HNO3, HONO, alkyl nitrates, peroxynitrates and all partic-
ulate organic nitrates. Alkyl nitrates produced from oxida-
tion of VOCs are related to tropospheric ozone generation
(Chameides, 1978) and, via low-volatility products, can lead
to formation of SOA (Hallquist et al., 2009). Oxidation of
NOx to nitric acid (HNO3) can also produce inorganic nitrate
aerosol via heterogeneous uptake of NO3 onto mineral or sea
salt aerosols (Vlasenko et al., 2006) and via co-partitioning
with ammonia to form semi-volatile NH4NO3 (Lee et al.,
2008).
Nitrogen oxides are primarily emitted as NO (Nizich et al.,
2000; Galloway et al., 2004; Wayne et al., 1991). NO is oxi-
dized to NO2 and further to the highly reactive NO3 radical.
NO3 is especially predominant at night when loss via pho-
tolysis and NO reaction are at a minimum (Horowitz et al.,
2007; von Kuhlmann et al., 2004; Xie et al., 2013).
The formation of NO3 and the associated N2O5 in the at-
mosphere have been studied in detail (Bertram and Thornton,
2009; Brown and Stutz, 2012; Brown et al., 2011; Wagner
et al., 2013). The hydrolysis of N2O5 to HNO3 can be im-
portant in the prediction of the tropospheric oxidant burden
with respect to the O3 production, and therefore OH radi-
cal production (Dentener and Crutzen, 1993; Evans and Ja-
cob, 2005). However, previous studies in eastern Texas have
found N2O5 uptake into aerosols to be relatively low in the
southern United States (TexAQS average γ of 0.003) (Brown
et al., 2009; Riemer et al., 2009).
NO3 is an effective nocturnal oxidizer of VOCs (Atkin-
son and Arey, 2003, 1998; Calogirou et al., 1999; Winer
et al., 1984). NO3 oxidation is especially reactive towards
unsaturated, non-aromatic hydrocarbons of which BVOCs
are major global constituents. NO3 is less reactive towards
aromatic compounds and saturated hydrocarbons, which are
major compounds of anthropogenic VOCs. Nitrate oxida-
tion of some BVOCs, such as β-pinene and limonene, lead
to rapid production of SOA in laboratory experiments with
high yields (Griffin et al., 1999; Jimenez et al., 2009; Zhang
et al., 2007; Hallquist et al., 2009; Fry et al., 2009, 2011;
Boyd et al., 2015). Analysis of previous field studies have
characterized the loss of NO3 to its major daytime sinks, in-
cluding reaction with NO and photolysis, as well as its loss
to BVOCs during both daytime and nighttime (Aldener et al.,
2006; Brown et al., 2005).
Nitrogen-containing oxidation products include alkyl ni-
trates (RONO2), peroxynitrates (RO2NO2) and nitric acid
(HNO3) (Brown and Stutz, 2012; Perring et al., 2013), all
of which may partition to the aerosol phase and contribute
to SOA (via direct reaction or catalysis) (Kroll and Seinfeld,
2008). Ambient concentrations of alkyl nitrates and perox-
ynitrates can be quantified using laser-induced fluorescence
(Day et al., 2002; Rollins et al., 2010) and mass spectrometry
methods (Bahreini et al., 2008; Farmer et al., 2010; Beaver
et al., 2012; Fry et al., 2013). Ions and acids (i.e., HNO3)
can be quantified using ion chromatography (IC; Makkonen
et al., 2012; Trebs et al., 2004) as well as chemical ionization
mass spectrometry (CIMS) (Beaver et al., 2012). The com-
bination of these instruments, as well as others discussed be-
low, allow for the determination of a total ambient-oxidized
nitrogen (NOy) budget, which enables the interpretation of
the importance of nitrogen oxides in SOA formation.
Xu et al. (2015a) have reported that organic aerosol from
nitrate radical oxidized monoterpenes are strongly influenced
by anthropogenic pollutants and contribute 19–34 % of the
total OA content (labeled less-oxidized oxygenated organic
aerosols, LO-OOA). Monoterpene oxidation products show a
large contribution to LO-OOA year-round (Xu et al., 2015b).
Another aerosol mass spectrometry factor specific to reac-
tive uptake of isoprene oxidation products (e.g., IEPOX),
isoprene-OA, is isolated in the warmer summer months in
both urban as well as rural areas across the SEUS and con-
tributes 18–36 % of summertime OA (Hu et al., 2015; Xu
et al., 2015a). LO-OOA is seen predominantly during night-
time hours, implying NO3 oxidation of monoterpenes, and is
strongly correlated specifically with the nitrate functionality
in organic nitrates (Xu et al., 2015b). It is suggested that dur-
ing the summer months, increasing nighttime LO-OOA bal-
ances with increasing daytime isoprene-OA to give the ob-
served constant OA concentration over the diurnal cycle. Xu
et al. (2015b) estimated that the total particle-phase organic
nitrates contribute 5–12 % of total OA in the southeastern US
in summer.
In this paper, we use the initial products (ex. C10H17NO5),
as well as total aerosol-phase organic nitrates, to track NO3
radical contributions to SOA formation during Southern Oxi-
dant and Aerosol Study (SOAS). We analyze the role of NO3
oxidation of BVOCs both at night and during the day. Ni-
trate sinks have been determined for measured BVOCs and
correlations of observed alkyl nitrate products versus these
calculated loss rates are discussed.
Atmos. Chem. Phys., 15, 13377–13392, 2015 www.atmos-chem-phys.net/15/13377/2015/
Page 3
B. R. Ayres et al.: Organic nitrate aerosol formation in the southeastern US 13379
35
34
33
32
31
30
Latit
ude
(o N)
-89 -88 -87 -86 -85Longitude(oW)
CTR SOAS ground site
SO2 emissions NOx emissions
(sqrt tons per day, only sources above 50 stpd)
Tuscaloosa
Birmingham
Montgomery
Mobile
Barry Power Plant
Greene County Power Plant
E C Gaston Power Plant
James H Miller Jr Power Plant
Yates Power Plant
Figure 1. Map of Alabama with SO2 and NOx emissions point
sources shown, as well as major roadways (black). Centreville is lo-
cated in Central Alabama about 55 miles SSW of Birmingham, AL.
Major highways, city limits and major contributors to emissions are
referenced for Alabama. The size of the emission markers depicts
the relative concentrations of the pollutants according to the 2013
EPA Air Markets Program in square-root tons per day, and only
sources above 50 square-root tons per day are shown. For reference,
the Alabama Power Company Gaston Plant emits 19.52 kgh−1 SO2
and 6.43 kgh−1 NOx .
The 2013 SOAS campaign was a comprehensive field in-
tensive study in central Alabama near Centreville (CTR),
in which concentrations of oxidants, BVOCs and aerosol
were measured with a particular focus on understanding the
effects of anthropogenic pollution on SOA formation. The
site was chosen due to its high biogenic VOC emissions as
well as its relatively large distance from anthropogenic pol-
lution (Fig. 1). County-level monoterpene emissions across
the US shows the CTR site gives a regional representation
of monoterpene emissions in the SEUS (Geron et al., 2000).
Furthermore, Xu et al. (2015b) showed that the CTR site
is representative of more-oxidized and less-oxidized oxy-
genated organic aerosols (MO-OOA and LO-OOA, respec-
tively) loadings across several monitoring stations in the
SEUS. Comparison of annual molar emissions in the SEUS
(an eight-state region including the CTR site) of BVOCs (es-
timated from Geron et al., 2000) to NOx emissions (from
2011 NEI database) suggests that NOx is the limiting reagent
NO2
O3
OH
NO3
HNO3
BVOC
aerosolsurface
inorganic nitrates
organonitratesorganonitrate
aerosol
17
Scheme 1. Generalized reaction fate for NO2 in the troposphere.
Oxidation of NO2 from atmospheric oxidants leads to two possible
paths.
in NOx-drived BVOCs oxidation throughout the region and
demonstrates that the CTR site is regionally representative.
Alabama is home to a number of power plant facili-
ties that are a large point sources of NOx capable of be-
ing carried long distances. Alabama’s non-interstate road-
ways also have large emissions of NOx , though a majority
of the emissions come from urban areas. Although the NOxemissions have been steadily dropping since 1998, they are
still substantial (2.70 million tons in reported for SEUS in
1999 to 1.75 million tons in 2008; Blanchard et al., 2013).
Frequent controlled biomass burning events (crop burning;
Crutzen and Andreae, 1990), as well as vehicular sources
(Dallmann et al., 2012) also contribute to local NOx emis-
sions and PM concentrations (a full analysis of contribu-
tions can be found at the EPA National Emissions Inventory,
http://www.epa.gov/ttn/chief/net/2011inventory.html).
In the present study, we investigate the production of SOA
species from NO3 reaction with monoterpenes. NO3 loss to
BVOCs is calculated and compared to aerosol mass spec-
trometry (AMS), chemical ion mass spectrometry (CIMS),
and thermal dissociation laser-induced fluorescence (TD-
LIF) measurements of aerosol-organic nitrates. We compare
this to an alternate fate of NOx , heterogeneous HNO3 uptake
to produce inorganic nitrate aerosol, which is considered in
detail in a second paper (Allen et al., 2015). Both pathways
from NOx to nitrate aerosol shown in Scheme 1 are produced
at various times in the SEUS.
2 Experimental
Measurements for the SOAS campaign took place near the
Talladega National Forest, 6 miles southwest of Brent, AL
(32.9029◦ N, 87.2497◦W), from 1 June–15 July 2013. The
forest covers 157 000 acres to the northwest and southeast
of Centreville, AL. Figure 1 shows a map of the site loca-
tion as well as nearby point sources of anthropogenic NOxand SO2. The site is in a rural area representative of the
transitional nature between the lower coastal plain and Ap-
palachian highlands (Das and Aneja, 2003). Wind direction
varied during SOAS allowing for periods of urban influence
from sources of anthropogenic emissions located near the
sampling site, including the cities of Montgomery, Birming-
ham, Mobile, and Tuscaloosa (Hidy et al., 2014). The clos-
est large anthropogenic NOx emission point sources are the
www.atmos-chem-phys.net/15/13377/2015/ Atmos. Chem. Phys., 15, 13377–13392, 2015
Page 4
13380 B. R. Ayres et al.: Organic nitrate aerosol formation in the southeastern US
Alabama Power Company Gaston Plant located near Birm-
ingham and the Green County Power Plant southwest of
Tuscaloosa (EPA Air Markets Program 2013).
Two cavity ringdown spectrometers (CRDSs) were used to
determine ambient mixing ratios of NOx , O3, NOy , NO3 and
N2O5 (Wild et al., 2014; Wagner et al., 2011). A CRDS is a
high sensitivity optical absorption method based on the de-
cay time constant for light from an optical cavity composed
of two high reflectivity mirrors. NO2 is measured using its
optical absorption at 405 nm in one channel, and O3, NO,
and total NOy are quantitatively converted to NO2 and mea-
sured simultaneously by 405 nm absorption on three addi-
tional channels. NO3 is measured at its characteristic strong
absorption band at 662 nm. N2O5 is quantitatively converted
to NO3 by thermal dissociation and detected in a second
662 nm channel with a detection limit of 1 pptv (30 s, 2 σ )
for NO3 and 1.2 pptv (30 s, 2 σ ) for N2O5 (Dubé et al., 2006;
Wagner et al., 2011).
TD-LIF (PM2.5 size cut) (Day et al., 2002; Farmer et al.,
2010; Rollins et al., 2010) was used to measure total alkyl
nitrates (6ANs), total peroxy nitrates (6PNs) and aerosol-
phase 6ANs (Rollins et al., 2012). A high-resolution time-
of-flight aerosol mass spectrometry (HR-ToF-AMS, here-
after AMS; DeCarlo et al., 2006; Canagaratna et al., 2004;
PM1 size cut) was used to measure submicron organic and
inorganic nitrate aerosol composition using the nitrate sep-
aration method described in Fry et al. (2013). Organic ni-
trates in the particle phase (pRONO2) decompose prior to
ionization on the AMS vaporizer to NO+2 organic fragments;
hence, pRONO2 cannot be quantified directly from AMS
data. The contribution of pRONO2 to total particulate ni-
trate was calculated using the method first discussed in Fry
et al. (2013) and briefly summarized here. This method re-
lies on the different fragmentation patterns observed in the
AMS for organic nitrates vs. NH4NO3, specifically the ra-
tio of the ions NO+2 to NO+. Since this ratio depends on
mass spectrometer tuning, vaporizer settings, and history, Fry
et al. (2013) proposed to interpret the field ratio of these
ions in relation to the one recorded for NH4NO3 (which
is done routinely during infield calibrations of the instru-
ment). Using such normalized ratios, most field and cham-
ber observations of pure organic nitrates are consistent with
(NO+2 /NO+) / ((NO+2 /NO+)ref of 1/2.25 (Farmer et al.,
2010) to 1/3 (Fry et al., 2009) of the calibration ratio. Xu
et al. (2015b) also used this method for the SEUS and dis-
cussed the estimated uncertainties. The data reported here
were calculated using the 1/2.25 ratio derived from Farmer
et al. (2010) and used in Fry et al. (2013), interpolating lin-
early between pure ammonium nitrate and organic nitrate.
It should be noted that (a) the relative ionization efficiency
(RIE) for both types of nitrate is assumed to be the same
(since similar neutrals are produced) and (b) that the organic
part of the molecule will be quantified as OA in the AMS.
Therefore, while only equivalent NO2 pRONO2 can be re-
ported from AMS measurements, this makes the technique
well-suited for comparison with the TD-LIF method. These
measurements correlate well to one another, but the magni-
tudes differ by a factor of approximately 2–4 for unknown
reasons, with TD-LIF being larger than AMS (see Supple-
ment).
Two chemical ionization mass spectrometers (Caltech’s
cTOF-CIMS and University of Washington’s HR-ToF-
CIMS, hereafter both referred to as CIT-CIMS and UW-
CIMS, respectively; Bertram et al., 2011; Yatavelli et al.,
2012; Lee et al., 2014; Nguyen et al., 2015) were used to
identify specific organic nitrate product ions, specifically
monoterpene (Eddingsaas et al., 2012) and isoprene prod-
ucts (Crounse et al., 2013, 2006; Beaver et al., 2012). The
CIT-CIMS measured only gas-phase products (Beaver et al.,
2012; Nguyen et al., 2015) while the UW-CIMS employed
a Filter Inlet for Gas and AEROsol (FIGAERO) to sepa-
rate aerosol and gas species (Lopez-Hilfiker et al., 2014; Lee
et al., 2014, 2015). Both spectrometers are capable of resolv-
ing ions with different elemental formulae at common nomi-
nal m/z.
An online cryostat-Gas Chromatography-Mass Spectrom-
eter (GC-MS) was used to measure mixing ratios of gas-
phase BVOC species (Goldan et al., 2004; Gilman et al.,
2010). BVOC emissions at the CTR site are dominated by
isoprene, α-pinene, β-pinene, and limonene (Fig. S1 in the
Supplement; Stroud et al., 2002; Goldan et al., 1995). Sur-
face area concentration was calculated from number distri-
bution measurements of a hygroscopicity scanning mobil-
ity particle sizer (SMPS) and optical particle sizer (OPS)
similar to a dry-ambient aerosol size spectrometer (Stanier
et al., 2004). Boundary layer height was measured using a
CHM 15k-Nimbus and the method employs a photon count-
ing of back-scattered pulse of near-IR light (1064 nm) via li-
dar principle. A Metrohm Monitor for Aerosols and Gases
in Ambient Air (MARGA; Makkonen et al., 2012; Trebs
et al., 2004; Allen et al., 2015; PM2.5 size cut), which com-
bines a wet-rotating denuder/steam jet aerosol collector inlet
with positive and negative ion chromatograph, measured in-
organic ion concentrations at a 1h time resolution in both the
aerosol and gas phases.
Site infrastructure consisted of a 65-foot tower, with the
top platform set above the canopy height for sampling to
prevent bias between measurements, and seven trailers lo-
cated in a field ∼ 90 m south of the tower. The tower in-
struments used for this analysis consisted of the two CRDSs,
CIT-CIMS, TD-LIF, and a cryostat GC-MS. The field trail-
ers contained the AMS, SMPS, APS (aerodynamic particle
sizer), UW-CIMS, and MARGA.
Atmos. Chem. Phys., 15, 13377–13392, 2015 www.atmos-chem-phys.net/15/13377/2015/
Page 5
B. R. Ayres et al.: Organic nitrate aerosol formation in the southeastern US 13381
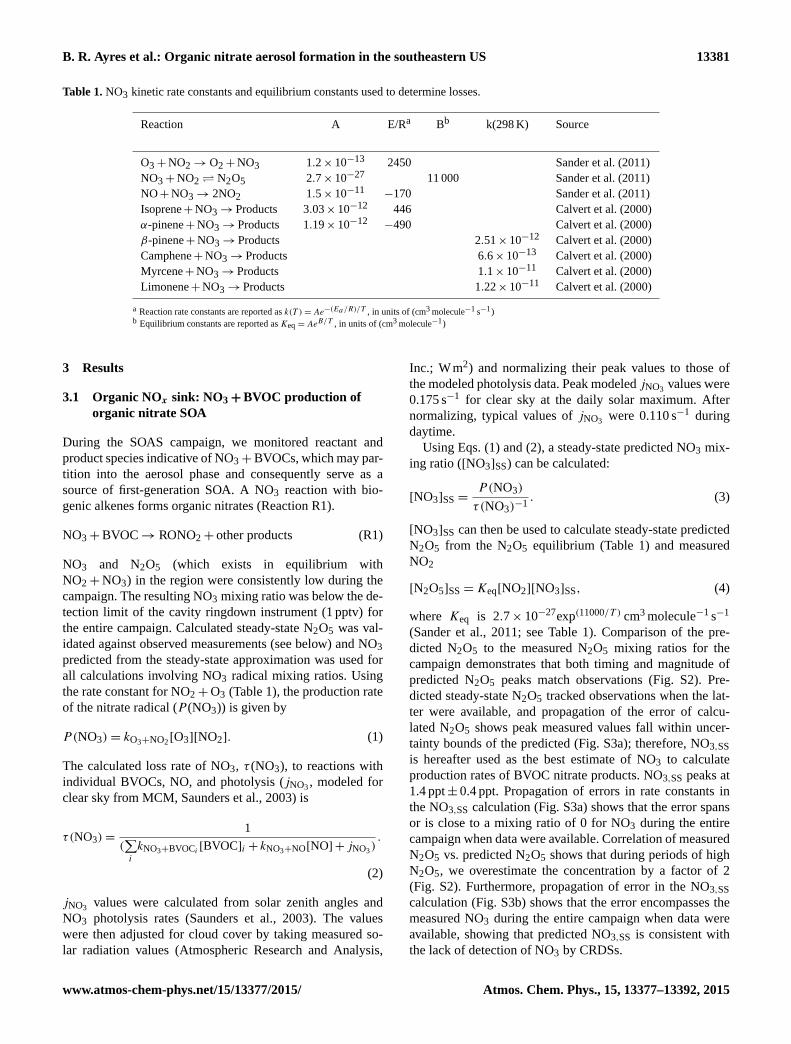
Table 1. NO3 kinetic rate constants and equilibrium constants used to determine losses.
Reaction A E/Ra Bb k(298 K) Source
O3+NO2→ O2+NO3 1.2× 10⁻¹³ 2450 Sander et al. (2011)
NO3+NO2 N2O5 2.7× 10⁻²⁷ 11 000 Sander et al. (2011)
NO+NO3→ 2NO2 1.5× 10⁻¹¹−170 Sander et al. (2011)
Isoprene+NO3→Products 3.03× 10⁻¹² 446 Calvert et al. (2000)
α-pinene+NO3→Products 1.19× 10⁻¹²−490 Calvert et al. (2000)
β-pinene+NO3→Products 2.51× 10⁻¹² Calvert et al. (2000)
Camphene+NO3→Products 6.6× 10⁻¹³ Calvert et al. (2000)
Myrcene+NO3→Products 1.1× 10⁻¹¹ Calvert et al. (2000)
Limonene+NO3→Products 1.22× 10⁻¹¹ Calvert et al. (2000)
a Reaction rate constants are reported as k(T )= Ae−(Ea/R)/T , in units of (cm3 molecule−1 s−1)b Equilibrium constants are reported as Keq = Ae
B/T , in units of (cm3 molecule−1)
3 Results
3.1 Organic NOx sink: NO3+BVOC production of
organic nitrate SOA
During the SOAS campaign, we monitored reactant and
product species indicative of NO3+BVOCs, which may par-
tition into the aerosol phase and consequently serve as a
source of first-generation SOA. A NO3 reaction with bio-
genic alkenes forms organic nitrates (Reaction R1).
NO3+BVOC→ RONO2+ other products (R1)
NO3 and N2O5 (which exists in equilibrium with
NO2+NO3) in the region were consistently low during the
campaign. The resulting NO3 mixing ratio was below the de-
tection limit of the cavity ringdown instrument (1 pptv) for
the entire campaign. Calculated steady-state N2O5 was val-
idated against observed measurements (see below) and NO3
predicted from the steady-state approximation was used for
all calculations involving NO3 radical mixing ratios. Using
the rate constant for NO2+O3 (Table 1), the production rate
of the nitrate radical (P (NO3)) is given by
P(NO3)= kO3+NO2[O3][NO2]. (1)
The calculated loss rate of NO3, τ (NO3), to reactions with
individual BVOCs, NO, and photolysis (jNO3, modeled for
clear sky from MCM, Saunders et al., 2003) is
τ(NO3)=1
(∑i
kNO3+BVOCi [BVOC]i + kNO3+NO[NO] + jNO3).
(2)
jNO3values were calculated from solar zenith angles and
NO3 photolysis rates (Saunders et al., 2003). The values
were then adjusted for cloud cover by taking measured so-
lar radiation values (Atmospheric Research and Analysis,
Inc.; Wm2) and normalizing their peak values to those of
the modeled photolysis data. Peak modeled jNO3values were
0.175 s−1 for clear sky at the daily solar maximum. After
normalizing, typical values of jNO3were 0.110 s−1 during
daytime.
Using Eqs. (1) and (2), a steady-state predicted NO3 mix-
ing ratio ([NO3]SS) can be calculated:
[NO3]SS =P(NO3)
τ (NO3)−1. (3)
[NO3]SS can then be used to calculate steady-state predicted
N2O5 from the N2O5 equilibrium (Table 1) and measured
NO2
[N2O5]SS =Keq[NO2][NO3]SS, (4)
where Keq is 2.7× 10⁻²⁷exp(11000/T ) cm3 molecule−1 s−1
(Sander et al., 2011; see Table 1). Comparison of the pre-
dicted N2O5 to the measured N2O5 mixing ratios for the
campaign demonstrates that both timing and magnitude of
predicted N2O5 peaks match observations (Fig. S2). Pre-
dicted steady-state N2O5 tracked observations when the lat-
ter were available, and propagation of the error of calcu-
lated N2O5 shows peak measured values fall within uncer-
tainty bounds of the predicted (Fig. S3a); therefore, NO3,SS
is hereafter used as the best estimate of NO3 to calculate
production rates of BVOC nitrate products. NO3,SS peaks at
1.4 ppt± 0.4 ppt. Propagation of errors in rate constants in
the NO3,SS calculation (Fig. S3a) shows that the error spans
or is close to a mixing ratio of 0 for NO3 during the entire
campaign when data were available. Correlation of measured
N2O5 vs. predicted N2O5 shows that during periods of high
N2O5, we overestimate the concentration by a factor of 2
(Fig. S2). Furthermore, propagation of error in the NO3,SS
calculation (Fig. S3b) shows that the error encompasses the
measured NO3 during the entire campaign when data were
available, showing that predicted NO3,SS is consistent with
the lack of detection of NO3 by CRDSs.
www.atmos-chem-phys.net/15/13377/2015/ Atmos. Chem. Phys., 15, 13377–13392, 2015
Page 6
13382 B. R. Ayres et al.: Organic nitrate aerosol formation in the southeastern US
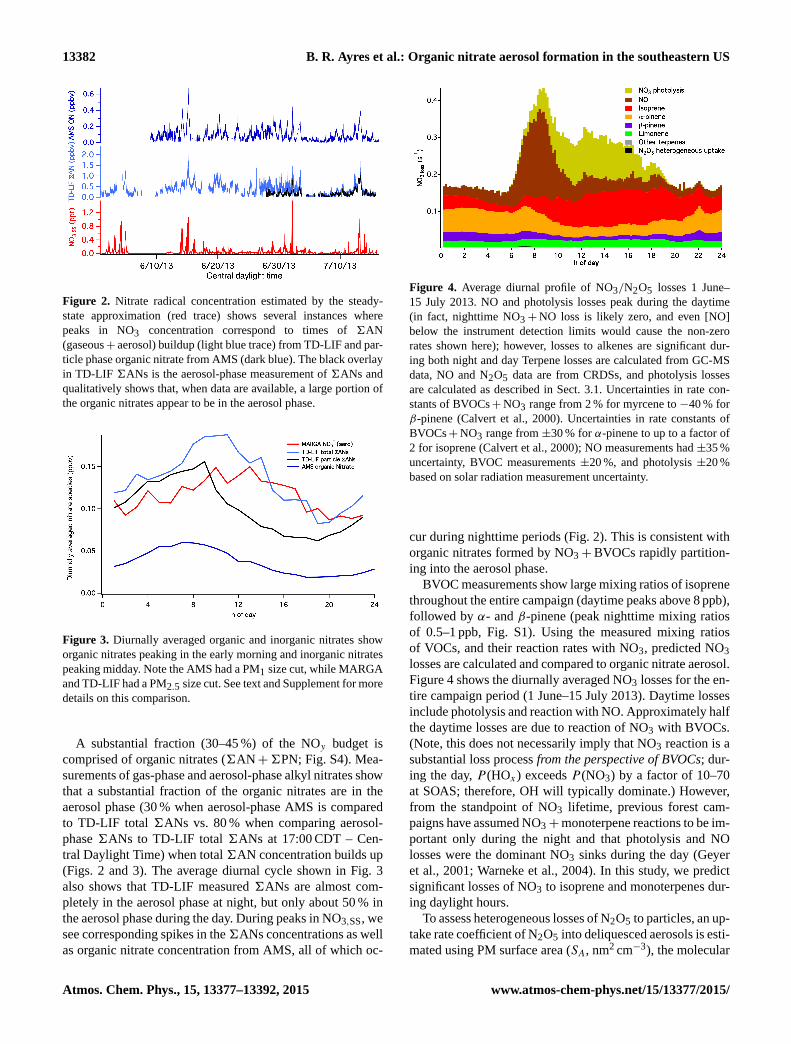
Figure 2. Nitrate radical concentration estimated by the steady-
state approximation (red trace) shows several instances where
peaks in NO3 concentration correspond to times of 6AN
(gaseous+ aerosol) buildup (light blue trace) from TD-LIF and par-
ticle phase organic nitrate from AMS (dark blue). The black overlay
in TD-LIF 6ANs is the aerosol-phase measurement of 6ANs and
qualitatively shows that, when data are available, a large portion of
the organic nitrates appear to be in the aerosol phase.
Figure 3. Diurnally averaged organic and inorganic nitrates show
organic nitrates peaking in the early morning and inorganic nitrates
peaking midday. Note the AMS had a PM1 size cut, while MARGA
and TD-LIF had a PM2.5 size cut. See text and Supplement for more
details on this comparison.
A substantial fraction (30–45 %) of the NOy budget is
comprised of organic nitrates (6AN+6PN; Fig. S4). Mea-
surements of gas-phase and aerosol-phase alkyl nitrates show
that a substantial fraction of the organic nitrates are in the
aerosol phase (30 % when aerosol-phase AMS is compared
to TD-LIF total 6ANs vs. 80 % when comparing aerosol-
phase 6ANs to TD-LIF total 6ANs at 17:00 CDT – Cen-
tral Daylight Time) when total 6AN concentration builds up
(Figs. 2 and 3). The average diurnal cycle shown in Fig. 3
also shows that TD-LIF measured 6ANs are almost com-
pletely in the aerosol phase at night, but only about 50 % in
the aerosol phase during the day. During peaks in NO3,SS, we
see corresponding spikes in the6ANs concentrations as well
as organic nitrate concentration from AMS, all of which oc-
Figure 4. Average diurnal profile of NO3/N2O5 losses 1 June–
15 July 2013. NO and photolysis losses peak during the daytime
(in fact, nighttime NO3+NO loss is likely zero, and even [NO]
below the instrument detection limits would cause the non-zero
rates shown here); however, losses to alkenes are significant dur-
ing both night and day Terpene losses are calculated from GC-MS
data, NO and N2O5 data are from CRDSs, and photolysis losses
are calculated as described in Sect. 3.1. Uncertainties in rate con-
stants of BVOCs+NO3 range from 2 % for myrcene to −40 % for
β-pinene (Calvert et al., 2000). Uncertainties in rate constants of
BVOCs+NO3 range from ±30 % for α-pinene to up to a factor of
2 for isoprene (Calvert et al., 2000); NO measurements had ±35 %
uncertainty, BVOC measurements ±20 %, and photolysis ±20 %
based on solar radiation measurement uncertainty.
cur during nighttime periods (Fig. 2). This is consistent with
organic nitrates formed by NO3+BVOCs rapidly partition-
ing into the aerosol phase.
BVOC measurements show large mixing ratios of isoprene
throughout the entire campaign (daytime peaks above 8 ppb),
followed by α- and β-pinene (peak nighttime mixing ratios
of 0.5–1 ppb, Fig. S1). Using the measured mixing ratios
of VOCs, and their reaction rates with NO3, predicted NO3
losses are calculated and compared to organic nitrate aerosol.
Figure 4 shows the diurnally averaged NO3 losses for the en-
tire campaign period (1 June–15 July 2013). Daytime losses
include photolysis and reaction with NO. Approximately half
the daytime losses are due to reaction of NO3 with BVOCs.
(Note, this does not necessarily imply that NO3 reaction is a
substantial loss process from the perspective of BVOCs; dur-
ing the day, P (HOx) exceeds P (NO3) by a factor of 10–70
at SOAS; therefore, OH will typically dominate.) However,
from the standpoint of NO3 lifetime, previous forest cam-
paigns have assumed NO3+monoterpene reactions to be im-
portant only during the night and that photolysis and NO
losses were the dominant NO3 sinks during the day (Geyer
et al., 2001; Warneke et al., 2004). In this study, we predict
significant losses of NO3 to isoprene and monoterpenes dur-
ing daylight hours.
To assess heterogeneous losses of N2O5 to particles, an up-
take rate coefficient of N2O5 into deliquesced aerosols is esti-
mated using PM surface area (SA, nm2 cm−3), the molecular
Atmos. Chem. Phys., 15, 13377–13392, 2015 www.atmos-chem-phys.net/15/13377/2015/
Page 7
B. R. Ayres et al.: Organic nitrate aerosol formation in the southeastern US 13383
Figure 5. Sample calculation of (NO3,loss)integ overlaid against
aerosol RONO2 measured by AMS (red). The monoterpene max-
ima correlate well with the AMS maxima (black dots). Minima and
maxima (black dots) were chosen for the beginning and end of AMS
buildup periods, respectively. The time period shown is arbitrarily
chosen.
speed of N2O5 (c̄, ms−1), and the uptake coefficient (γN2O5).
khet =1
4× γN2O5
× c̄N2O5× SA (5)
Conditions of high relative humidity in the SEUS necessi-
tated a higher γ of 0.02 as the uptake coefficient (Bertram
and Thornton, 2009; Crowley et al., 2011), which represents
an upper limit from previous field studies (Brown et al.,
2009, 2006). We predict heterogeneous N2O5 uptake to be
very small over the campaign despite high relative humid-
ity. When PM2.5 concentration was at its highest in mid-
July, the calculated uptake rate coefficient was calculated at
1.6× 10⁻³ s−1 in mid-July, representing less than 1 % of the
loss of NO3.
3.1.1 Calculation of NO3 loss to BVOCs
Using literature NO3+BVOC rate coefficients and calcu-
lated NO3,SS, we calculate instantaneous NO3 loss rates
((NO3,loss)inst) for the campaign.
(NO3,loss)inst =
∑i
kNO3+VOCi[VOC]i[NO3]SS (6)
BVOC mixing ratios from GC-MS and rate constants shown
in Table 1 were used to calculate the time-integrated nitrate
loss to reactions with BVOCs.
(NO3,loss)integ =
∑i,t
(NO3,loss)inst,i ×1t (7)
Specifically, time loss of NO3 radical to reaction with
BVOCs ((NO3,loss)integ) were calculated during periods of
increasing RONO2 concentrations as monitored by CIMS or
aerosol-phase RONO2 monitored by AMS or TD-LIF during
SOAS. The beginning and end of the buildup periods were
chosen as the approximate trough and peak values for the in-
dividual analyses (CIMS, AMS, and TD-LIF). This buildup
0.5
0.4
0.3
0.2
0.1
0.0
Aero
sol o
rgan
onitr
ate
(AM
S &
TDLI
F, p
pb)
1.00.80.60.40.20.0Predicted nitrate loss to monoterpene (ppb)
AMS y = 0.228x + 0.035R2 = 0.63
TD-LIF y = 0.442x + 0.058R2 = 0.81
Figure 6. Scatter plots of aerosol RONO2 (AMS and TD-LIF) com-
pared to (NO3,loss)cum. The magnitudes of the two particle phase
organic nitrate measurements differ by a factor of ≈2–4 for un-
known reasons; however, the slope can be used as a relative molar
yield of NO3 loss to monoterpenes. Time period for AMS compari-
son is 9 June–15 July 2013 and for TD-LIF is 27 June–15 July 2013.
of aerosol RONO2 was only observed after sunset with one
buildup event per night. The boundary layer during night
hours is relatively stable, such that NOx and BVOC measure-
ments can be considered an area-wide average and this sim-
ple box model can be used to calculate (NO3,loss)integ (Eqs. 6,
7).
Under the assumption of a constant nighttime boundary
layer height and an approximately uniform, area-wide source
that limits the time rate of change due to horizontal advec-
tion (i.e., a nighttime box), the time integrals of RONO2
produced provide estimates of the evolution of RONO2 con-
centrations at night (this assumption was verified using CO
to minimize first-order effects of dilution from changes in
the boundary layer (Blanchard et al., 2011)). Time periods
of CIMS RONO2 or aerosol buildup were chosen to deter-
mine time intervals for calculation of (NO3,loss)integ when
data were available.
(NO3,loss)integ is the calculated time integral of the reac-
tion products of NO3 with individual or combined mixing
ratios of BVOCs, and 1t is the time step between each cal-
culated value of (NO3,loss)inst,i . Data are averaged to 30 min
increments, a time step sufficient to resolve the observed rate
of change. Figure 5 shows an example of the resulting calcu-
lated integrated NO3 losses from Eq. (7) to both isoprene and
summed monoterpenes. These nightly loss values are corre-
lated with organic nitrate gas- and aerosol-phase measure-
ments and linear fits, and correlation coefficients were cal-
culated to aid in the interpretation of gas- and aerosol-phase
organic nitrate formation. Note that these peak times occur
during nighttime hours when the boundary layer is shallow
(Fig. S5).
www.atmos-chem-phys.net/15/13377/2015/ Atmos. Chem. Phys., 15, 13377–13392, 2015
Page 8
13384 B. R. Ayres et al.: Organic nitrate aerosol formation in the southeastern US
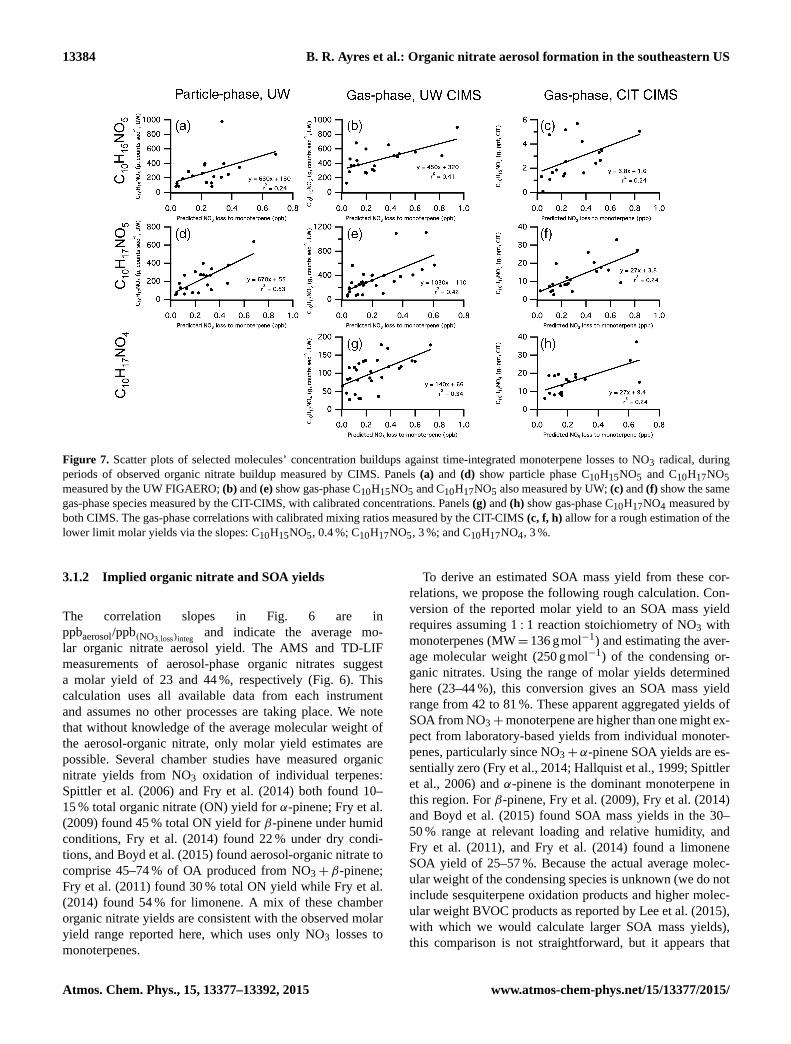
Figure 7. Scatter plots of selected molecules’ concentration buildups against time-integrated monoterpene losses to NO3 radical, during
periods of observed organic nitrate buildup measured by CIMS. Panels (a) and (d) show particle phase C10H15NO5 and C10H17NO5
measured by the UW FIGAERO; (b) and (e) show gas-phase C10H15NO5 and C10H17NO5 also measured by UW; (c) and (f) show the same
gas-phase species measured by the CIT-CIMS, with calibrated concentrations. Panels (g) and (h) show gas-phase C10H17NO4 measured by
both CIMS. The gas-phase correlations with calibrated mixing ratios measured by the CIT-CIMS (c, f, h) allow for a rough estimation of the
lower limit molar yields via the slopes: C10H15NO5, 0.4 %; C10H17NO5, 3 %; and C10H17NO4, 3 %.
3.1.2 Implied organic nitrate and SOA yields
The correlation slopes in Fig. 6 are in
ppbaerosol/ppb(NO3,loss)integand indicate the average mo-
lar organic nitrate aerosol yield. The AMS and TD-LIF
measurements of aerosol-phase organic nitrates suggest
a molar yield of 23 and 44 %, respectively (Fig. 6). This
calculation uses all available data from each instrument
and assumes no other processes are taking place. We note
that without knowledge of the average molecular weight of
the aerosol-organic nitrate, only molar yield estimates are
possible. Several chamber studies have measured organic
nitrate yields from NO3 oxidation of individual terpenes:
Spittler et al. (2006) and Fry et al. (2014) both found 10–
15 % total organic nitrate (ON) yield for α-pinene; Fry et al.
(2009) found 45 % total ON yield for β-pinene under humid
conditions, Fry et al. (2014) found 22 % under dry condi-
tions, and Boyd et al. (2015) found aerosol-organic nitrate to
comprise 45–74 % of OA produced from NO3+β-pinene;
Fry et al. (2011) found 30 % total ON yield while Fry et al.
(2014) found 54 % for limonene. A mix of these chamber
organic nitrate yields are consistent with the observed molar
yield range reported here, which uses only NO3 losses to
monoterpenes.
To derive an estimated SOA mass yield from these cor-
relations, we propose the following rough calculation. Con-
version of the reported molar yield to an SOA mass yield
requires assuming 1 : 1 reaction stoichiometry of NO3 with
monoterpenes (MW= 136 gmol−1) and estimating the aver-
age molecular weight (250 gmol−1) of the condensing or-
ganic nitrates. Using the range of molar yields determined
here (23–44 %), this conversion gives an SOA mass yield
range from 42 to 81 %. These apparent aggregated yields of
SOA from NO3+monoterpene are higher than one might ex-
pect from laboratory-based yields from individual monoter-
penes, particularly since NO3+α-pinene SOA yields are es-
sentially zero (Fry et al., 2014; Hallquist et al., 1999; Spittler
et al., 2006) and α-pinene is the dominant monoterpene in
this region. For β-pinene, Fry et al. (2009), Fry et al. (2014)
and Boyd et al. (2015) found SOA mass yields in the 30–
50 % range at relevant loading and relative humidity, and
Fry et al. (2011), and Fry et al. (2014) found a limonene
SOA yield of 25–57 %. Because the actual average molec-
ular weight of the condensing species is unknown (we do not
include sesquiterpene oxidation products and higher molec-
ular weight BVOC products as reported by Lee et al. (2015),
with which we would calculate larger SOA mass yields),
this comparison is not straightforward, but it appears that
Atmos. Chem. Phys., 15, 13377–13392, 2015 www.atmos-chem-phys.net/15/13377/2015/
Page 9
B. R. Ayres et al.: Organic nitrate aerosol formation in the southeastern US 13385
Figure 8. Gas-phase CIMS data correlated to predicted isoprene+NO3, during periods of buildup of these C5 and C4 nitrates as measured
by each CIMS. Panels (a) and (b) show C5H9NO5, which is well correlated to predicted isoprene+NO3 suggesting this is a NO3 gas-phase
product, with the calibrated mixing ratios measured by CIT enabling estimation of an approximate lower limit molar yield of 7 %. Panel (c)
shows that C5H9NO4 is poorly correlated to isoprene+NO3 suggesting that this product comes (at least in part) from another oxidative
source (ex. RO2+NO). Panel (d), C4H7NO5, also shows a poorer correlation than panels (a) and (b), suggesting it is not exclusively a
product of NO3 oxidation, or has rapid losses.
the aggregate SOA yield suggests higher ultimate SOA mass
yields than simple chamber experiments dictate, perhaps sug-
gesting that post-first-generation products create more con-
densable species.
Since nitrate product buildup occurs over multiple hours
(Fig. 5), the rapid particulate organic nitrate losses (timescale
of 2–4 h) found by researchers at the University of Washing-
ton are a lower limit. This also does not take into account
heterogeneous hydrolysis (Boyd et al., 2015; Cole-Filipiak
et al., 2010; Liu et al., 2012), photolysis (Epstein et al., 2014;
Müller et al., 2014), or reaction with the hydroxyl radical
(OH) (Lee et al., 2011). Because understanding of these ni-
trate loss processes is poor, a quantitative estimate of how
this would affect derived molar yields would be premature.
Finally, because this yield is based on total ambient
monoterpene concentrations, it incorporates nitrate radical
loss to α-pinene, which is known to produce very modest
yields of SOA (0–10 %) from NO3 reaction (Fry et al., 2014;
Spittler et al., 2006). This suggests effective overall SOA
yields from other BVOCs must be large.
3.1.3 Organic nitrate product analysis
Observations of NO3,SS compared to TD-LIF and AMS
(Fig. 2) suggest aerosol-organic nitrates are dominated by
nighttime NO3+BVOCs, rather than other known nitrate-
producing reactions (e.g., RO2+NO), which would domi-
nate during the daytime and would not coincide with peaks
in [NO3].
Researchers at University of Washington described the
observation of particle phase C10 organic nitrate concen-
trations peaking at night during SOAS (Lee et al., 2015),
consistent with high SOA yield from NO3 + monoterpenes.
Observed C10 organic nitrates include many highly oxi-
dized molecules, suggesting that substantial additional ox-
idation beyond the first-generation hydroxynitrates occurs
(Lee et al., 2015). Specific first-generation monoterpene or-
ganic nitrate compounds were identified and measured in the
gas and aerosol phases (Lopez-Hilfiker et al., 2014; Beaver
et al., 2012). Using the (NO3,loss)integ calculations, another
correlation analysis is conducted to identify key gas- and
aerosol-phase products of NO3 oxidation. Observed buildups
in gas- and aerosol-phase organic nitrate concentrations from
each CIMS are scattered against predicted (NO3,loss)integ to
monoterpenes (Fig. 7). The generally good correlations sug-
gest that all of the molecular formulae shown here have con-
tributions from NO3 chemistry. Comparisons of observed R2
values and slopes for each of these correlation plots may
then provide some mechanistic insight. For example, the
species with larger R2 (C10H17NO5) may indicate a greater
www.atmos-chem-phys.net/15/13377/2015/ Atmos. Chem. Phys., 15, 13377–13392, 2015
Page 10
13386 B. R. Ayres et al.: Organic nitrate aerosol formation in the southeastern US
contribution to these species from nitrate radical chemistry.
If we assume the same sensitivity across phases in the cases
where the same species is observed (Fig. 7a/b and d/e), we
can estimate the relative amount in each phase by the ratio
of the slopes. This would suggest that C10H15NO5 partitions
preferentially to the particle phase, while C10H17NO5 parti-
tions preferentially to the gas phase.
Although the gas-phase monoterpene nitrate product cor-
relations display substantial scatter, likely due to their mul-
tiple possible sources and rapid partitioning to the aerosol
phase, we can use the calibrated mixing ratios measured
by the CIT-CIMS to calculate approximate lower limit mo-
lar yields for C10H15NO5 (0.4 %), C10H17NO5 (3 %), and
C10H17NO4 (3 %) from NO3, based on the slope of corre-
lations shown in panels (c), (f), and (h). We estimate these
to be lower limits, because no losses of these species during
the period of buildup is taken into account in this correlation
analysis.
The median particulate fraction of C5H9NO5 (particle
phase/total) observed by the UW-CIMS was less than 1 %,
and C5H9NO5(p) comprised less than 1 % of total partic-
ulate organic nitrate (Lee et al., 2015). Those C5 species
that are observed in the particle phase constitute less than
12 % of total particulate organic nitrate mass (as measured by
the UW-CIMS; Lee et al., 2015, Supplement), and are more
highly oxidized molecules, inconsistent with first-generation
NO3+ isoprene products. This suggests that most (especially
first-generation) isoprene nitrate products remain in the gas
phase. The correlation of gas-phase first-generation isoprene
nitrate concentrations with NO3 loss again provides evi-
dence about the oxidative sources of these molecules (Fig. 8).
C5H9NO5 (panels a and b) shows the strongest correla-
tion with (NO3,loss)integ to isoprene among all the individual
molecules (R2= 0.54 for UW and 0.70 for CIT), suggesting
that this compound is a product of NO3 oxidation. The better
correlations of these C5 species than those observed in Fig. 7
may be due to slower gas-phase losses of organic nitrates
relative to the semi-volatile C10 species. Using the calibrated
mixing ratios from CIT for C5H9NO5, we calculate an ap-
proximate lower limit molar yield of 7 %. The C5H9NO4 and
C4H9NO5 isoprene products (panels c and d) show poorer
correlation with (NO3,loss)integ to isoprene (R2= 0.11 and
0.35, respectively), suggesting that these products are not
(exclusively) a NO3+ isoprene product, and may instead be
a photochemically or ozonolysis produced organic nitrate,
via RO2+NO.
We note that the two CIMS for which data are shown in
Figs. 7 and 8 were located at different heights: the CIT-CIMS
was atop the 20 m tower, collocated with the measurements
used to determine [NO3]ss, while the UW-CIMS measured at
ground level. Particularly at nighttime, it is possible that this
lower 20 m of the nocturnal surface layer can become strati-
fied, so some scatter and differences in correlations between
instruments arising from this occasional stratification are not
unexpected.
3.2 Comparison to inorganic NOx sink: NO−3 aerosol
production from heterogeneous uptake of HNO3
Partitioning of semi-volatile ammonium nitrate into aerosol
represented a small fraction of aerosol contribution through-
out the campaign based on AMS and MARGA data (Allen
et al., 2015). A more important route of NOx conversion to
nitrate aerosol occurred via HNO3 heterogeneous reaction
on the surface of dust or sea salt particles (Scheme 1). This
process, which was observed to be especially important dur-
ing periods of high mineral or sea salt supermicron aerosol
concentrations, is described in detail in a companion paper
(Allen et al., 2015). Briefly, we observe that while concen-
trations of organic and inorganic nitrate aerosol are generally
comparable (Fig. 3), the inorganic nitrate is more episodic in
nature. Periods of highest NO−3 concentration as measured
by the MARGA were observed during two multi-day coarse-
mode dust events, from 9 to 15 and 23 to 30 June, while or-
ganic nitrates have a more regular diurnal pattern indicative
of production from locally available reactants, with most of
the organic nitrate present in the condensed phase (Fig. 3).
In order to estimate the fluxes of NOx loss to aerosol via
the two pathways shown in Scheme 1, we calculate the reac-
tive losses of NO2 to organic nitrate (limiting rate is taken to
be∑i
ki[NO3][BVOC]i , with the included terpenes α-pinene,
β-pinene, limonene, and camphene) and to inorganic nitrate
via heterogeneous HNO3 uptake (Allen et al., 2015). A sub-
stantial fraction of the surface area is in the transition regime,
so HNO3 uptake is reduced due to diffusion limitations. To
account for this, a Fuchs–Sutugin correction is applied (Se-
infeld and Pandis, 2006):
Rate=
Rp∑ Sa
RpDg
(0.75α(1+Kn)
Kn2+Kn+ 0.283Knα+ 0.75α
)[HNO3],
(8)
where Sa is surface area, Rp is the radius, Dg is the diffusiv-
ity of HNO3 in air (0.118 cm2 s−1), and α is estimated at 0.1
for an upper limit.
Since we have seen that the organic nitrates are present
predominantly in the condensed phase, we take this compar-
ison to be the relative rate of production of organic nitrate
aerosol vs. inorganic nitrate aerosol (Fig. 9), and we see that
over the summer campaign, the rates are comparable in mag-
nitude, but peak at different times. This analysis suggests that
substantial nitrate aerosol (peak values of 1 µgm−3 h−1, with
average rates 0.1 µgm−3 h−1 for both inorganic and organic
nitrate rates) is produced in the SEUS by both inorganic and
organic routes (depicted in Scheme 1), converting local NOxpollution to particulate matter. We note that this calculation
accounts only for the production rates of these two types of
nitrate aerosol and does not account for the subsequent chem-
istry that may deplete one faster than the other; hence, rela-
tive mass concentrations are not necessarily expected to cor-
relate directly to these relative production rates.
Atmos. Chem. Phys., 15, 13377–13392, 2015 www.atmos-chem-phys.net/15/13377/2015/
Page 11
B. R. Ayres et al.: Organic nitrate aerosol formation in the southeastern US 13387
Figure 9. Over the campaign, similar magnitudes of the rate of for-
mation of organic and inorganic nitrate aerosol (according to the
pathways shown in Scheme 1) are observed, though peaks occur at
different times.
3.3 Implications of NO3 oxidation on SOA formation in
the SEUS
The importance of the NO3+BVOC reaction SOA has only
recently been recognized (Beaver et al., 2012; Fry et al.,
2013; Rollins et al., 2012). Pye et al. (2010) showed that
including NO3 radical oxidation increased predicted SOA
yields from terpenes by 100 % and total aerosol concentra-
tions by 30 % (Pye et al., 2010). The results of this study
underscore the importance of NO3 in SOA formation. Mea-
sured aerosol-organic nitrate concentrations are correlated
with the reaction of NO3 with BVOCs. This pathway is es-
pecially important before sunrise when competing oxidants
(O3 and OH) are at a minimum.
We can estimate the contribution of this NO3+BVOC
mechanism to total particulate matter using the 2011 NEI
data for the states included in the 2004 Southern Appalachian
Mountain Initiative study (SAMI; Odman et al., 2004): Ken-
tucky, Virginia, West Virginia, North Carolina, South Car-
olina, Tennessee, Alabama, and Georgia (http://www.epa.
gov/ttn/chief/net/2011inventory.html). In this eight-state re-
gion, the NEI reported emissions of 2.3 Tgyr−1 (2.5×
106 t yr−1) of nitrogen oxides and 0.8 Tgyr−1 (9×10⁵ t yr−1)
of PM2.5 in 2011. We can estimate the fraction of the NOxemitted that is converted to PM using several assumptions.
NO2 is estimated to contribute 50 % of the NOy budget
(Fig. S4), so we multiply the NOx emission by 0.5 to ac-
count for half of the instantaneous NOx residing in the at-
mosphere as other NOy species at any given time. An av-
erage lifetime of 16 h for O3+NO2 reaction was calculated
(1/k[O3]) and, with an average nighttime length of 9 h, we
estimate about 55 % of NO2 is converted to NO3 overnight.
Using the average molar organic nitrate aerosol yield of 30 %
determined in this study and an estimated molecular weight
of 250 gmol−1 for oxidized product (terpene hydoxynitrate
with two additional oxygen functional groups; Draper et al.,
2015), we convert from molar yield to mass yield of or-
ganic nitrate aerosol. This assumes that NOx is the limiting
reagent for SOA production from this chemistry; as noted
in the introduction, comparison of regional NOx and BVOC
emissions rates supports this assumption. Finally, using the
summed NEI NOx emissions data for the SAMI states, we
calculate a source estimate of 0.6 Tgyr−1 of NO3-oxidized
aerosol. Adding this to the NEI primary PM2.5 emissions es-
timate of 0.8 Tgyr−1 gives a total 1.4 Tgyr−1, showing that
NO3 initiated SOA formation would contribute a substantial
additional source of PM2.5 regionally, nearly doubling pri-
mary emissions. Model calculations by Odman et al. (2004)
for the SAMI states estimated 1 Tgyr−1 of total PM2.5 in
2010, including primary and secondary sources. Their mod-
eled PM2.5 emissions are lower than our rough estimate
here, despite the fact that actual 2010 NOx emissions were
2.3 Tgyr−1 rather than the 3 Tgyr−1 projected at that time.
Hence, despite successful reduction of regional NOx emis-
sions (Blanchard et al., 2013), this work suggests that sec-
ondary PM2.5 production from NO3 oxidation of regionally
abundant BVOCs remains a substantial anthropogenic source
of pollution in the SEUS.
4 Conclusions
The contribution of NO3+BVOCs to SOA formation is
found to be substantial in the terpene-rich SEUS. An es-
timated 23–44 % of nitrate radical lost to reaction with
monoterpenes becomes aerosol-phase organic nitrate. Pre-
dicted nitrate losses to isoprene and to monoterpenes are cal-
culated from the steady-state nitrate and BVOC mixing ra-
tios and then time integrated during evenings and nights as
RONO2 aerosol builds up. Correlation plots of AMS, TD-
LIF, and CIMS measurements of gas- and aerosol-phase or-
ganic nitrates against predicted nitrate losses to monoter-
penes indicate that NO3+monoterpenes contribute substan-
tially to observed nitrate aerosol. Two specific C10 structures
measured by CIMS are shown to be NO3 radical products by
their good correlation with cumulative (NO3,loss)integ; their
semi-volatile nature leads to their variable partitioning be-
tween gas and aerosol phase. Calibrated gas-phase mixing ra-
tios of selected organic nitrates allow for estimation of lower
limit molar yields of C5H9NO5, C10H17NO4, C10H17NO5
from NO3 reactions (7, 3, and 3 % respectively). The fact that
these molar yields of monoterpene nitrates are substantially
lower than the aggregated aerosol-phase organic nitrate yield
may suggest that further chemical evolution is responsible
for the large SOA yields from these reactions, consistent with
Lee et al. (2015). The NO3+BVOC source of nitrate aerosol
is comparable in magnitude to inorganic nitrate aerosol for-
mation, and is observed to be a substantial contribution to
regional PM2.5.
www.atmos-chem-phys.net/15/13377/2015/ Atmos. Chem. Phys., 15, 13377–13392, 2015
Page 12
13388 B. R. Ayres et al.: Organic nitrate aerosol formation in the southeastern US
The Supplement related to this article is available online
at doi:10.5194/acp-15-13377-2015-supplement.
Acknowledgements. We would like to acknowledge Anne Marie
Carlton, Jim Moore and all of the colleagues that helped to
set up this study. B. R. Ayres, H. M. Allen, D. C. Draper, and
J. L. Fry gratefully acknowledge funding from the National
Center for Environmental Research (NCER) STAR Program, EPA
no. RD-83539901 and NOAA NA13OAR4310063. D. A. Day,
P. Campuzano-Jost, and J. L. Jimenez thank NSF AGS-1243354
and NOAA NA13OAR4310063; R. C. Cohen thanks NSF AGS-
1120076 and AGS-1352972.
Edited by: A. Nenes
References
Ahmadov, R., McKeen, S. A., Robinson, A. L., Bahreini, R.,
Middlebrook, A. M., de Gouw, J. A., Meagher, J., Hsie, E.-
Y., Edgerton, E., Shaw, S., and Trainer, M.: A volatility basis
set model for summertime secondary organic aerosols over the
eastern United States in 2006, J. Geophys. Res., 117, D06301,
doi:10.1029/2011JD016831, 2012.
Aldener, M., Brown, S., Stark, H., Williams, E., Lerner, B., Kuster,
W., Goldan, P., Quinn, P., Bates, T., and Fehsenfeld, F.: Reac-
tivity and loss mechanisms of NO3 and N2O5 in a polluted ma-
rine environment: Results from in situ measurements during New
England Air Quality Study 2002, J. Geophys. Res.-Atmos., 111,
D23S73, doi:10.1029/2006JD007252, 2006.
Allen, H. M., Draper, D. C., Ayres, B. R., Ault, A., Bondy, A.,
Takahama, S., Modini, R. L., Baumann, K., Edgerton, E., Knote,
C., Laskin, A., Wang, B., and Fry, J. L.: Influence of crustal
dust and sea spray supermicron particle concentrations and acid-
ity on inorganic NO−3
aerosol during the 2013 Southern Oxi-
dant and Aerosol Study, Atmos. Chem. Phys., 15, 10669–10685,
doi:10.5194/acp-15-10669-2015, 2015.
Atkinson, R. and Arey, J.: Atmospheric Chemistry of Biogenic Or-
ganic Compounds, Accounts Chem. Res., 31, 574–583, 1998.
Atkinson, R. and Arey, J.: Gas-phase tropospheric chemistry of bio-
genic volatile organic compounds: a review, Atmos. Environ., 37,
197–219, 2003.
Bahreini, R., Dunlea, E. J., Matthew, B. M., Simons, C., Docherty,
K., DeCarlo, P. F., Jimenez, J. L., Brock, C. A., and Middle-
brook, A.: Design and Operation of a Pressure-Controlled In-
let for Airborne Sampling with an Aerodynamic Aerosol Lens,
Aerosol Sci. Technol., 42, 465–471, 2008.
Beaver, M. R., Clair, J. M. St., Paulot, F., Spencer, K. M., Crounse,
J. D., LaFranchi, B. W., Min, K. E., Pusede, S. E., Wooldridge, P.
J., Schade, G. W., Park, C., Cohen, R. C., and Wennberg, P. O.:
Importance of biogenic precursors to the budget of organic ni-
trates: observations of multifunctional organic nitrates by CIMS
and TD-LIF during BEARPEX 2009, Atmos. Chem. Phys., 12,
5773–5785, doi:10.5194/acp-12-5773-2012, 2012.
Bellouin, N., Rae, J., Jones, A., Johnson, C., Haywood, J., and
Boucher, O.: Aerosol forcing in the Climate Model Intercom-
parison Project (CMIP5) simulations by HadGEM2-ES and the
role of ammonium nitrate, J. Geophys. Res., 116, D20206,
doi:10.1029/2011JD016074, 2011.
Bertram, T. H. and Thornton, J. A.: Toward a general parameteriza-
tion of N2O5 reactivity on aqueous particles: the competing ef-
fects of particle liquid water, nitrate and chloride, Atmos. Chem.
Phys., 9, 8351–8363, doi:10.5194/acp-9-8351-2009, 2009.
Bertram, T. H., Kimmel, J. R., Crisp, T. A., Ryder, O. S., Yatavelli,
R. L. N., Thornton, J. A., Cubison, M. J., Gonin, M., and
Worsnop, D. R.: A field-deployable, chemical ionization time-
of-flight mass spectrometer, Atmos. Meas. Tech., 4, 1471–1479,
doi:10.5194/amt-4-1471-2011, 2011.
Blanchard, C., Hidy, G., Tanenbaum, S., and Edgerton, E.: NMOC,
ozone, and organic aerosol in the southeastern United States,
1999–2007: 3. Origins of organic aerosol in Atlanta, Georgia,
and surrounding areas, Atmos. Environ., 45, 1291–1302, 2011.
Blanchard, C., Hidy, G., Tanenbaum, S., Edgerton, E., and Hart-
sell, B.: The Southeastern Aerosol Research and Characteriza-
tion (SEARCH) study: Temporal trends in gas and PM concen-
trations and composition, 1999 – 2010, J. Air Waste Manag. As-
soc., 63, 247–259, 2013.
Boyd, C. M., Sanchez, J., Xu, L., Eugene, A. J., Nah, T., Tuet, W.
Y., Guzman, M. I., and Ng, N. L.: Secondary organic aerosol
formation from the β-pinene+NO3 system: effect of humidity
and peroxy radical fate, Atmos. Chem. Phys., 15, 7497–7522,
doi:10.5194/acp-15-7497-2015, 2015.
Brown, S. S. and Stutz, J.: Nighttime radical observations and
chemistry, Chem. Soc. Rev., 41, 6405–6447, 2012.
Brown, S. S., Osthoff, H. D., Stark, H., Dubé, W. P., Ryerson, T. B.,
Warneke, C., de Gouw, J. A., Wollny, A. G., Parrish, D. D.,
Fehsenfeld, F. C., and Ravishankara, A. R.: Aircraft observa-
tions of daytime NO3 and N2O5 and their implications for tropo-
spheric chemistry, J. Photochem. Photobiol. A: Chemistry, 176,
270–278, 2005.
Brown, S. S., Ryerson, T. B., Wollny, A. G., Brock, C. A., Peltier,
R., Sullivan, A. P., Weber, R. J., Dubé, W. P., Trainer, M.,
Meagher, J. F., Fehsenfeld, F. C., and Ravishankara, A. R.: Vari-
ability in nocturnal nitrogen oxide processing and its role in re-
gional air quality, Science, 311, 67–70, 2006.
Brown, S., Dubé, W., Fuchs, H., Ryerson, T., Wollny, A., Brock,
C., Bahreini, R., Middlebrook, A., Neuman, J., and Atlas, E.:
Reactive uptake coefficients for N2O5 determined from aircraft
measurements during the Second Texas Air Quality Study: Com-
parison to current model parameterizations, J. Geophys. Res.-
Atmos., 114, D00F10, doi:10.1029/2008JD011679, 2009.
Brown, S., Dubé, W., Peischl, J., Ryerson, T., Atlas, E., Warneke,
C., de Gouw, J., te Lintel Hekkert, S., Brock, C., and Flocke, F.:
Budgets for nocturnal VOC oxidation by nitrate radicals aloft
during the 2006 Texas Air Quality Study, J. Geophys. Res.-
Atmos., 116, D24305, doi:10.1029/2011JD016544, 2011.
Calogirou, A., Larsen, B. R., and Kotzias, D.: Gas-phase terpene
oxidation products: a review, Atmos. Environ., 33, 1423–1439,
1999.
Calvert, J. G., Atkinson, R., Kerr, J. A., Madronich, S., Moortgat,
G. K., Wallington, T. J., and Yarwood, G.: The Mechanisms of
Atmospheric Oxidation of the Alkenes, Oxford University Press,
New York, 2000.
Canagaratna, M., Jayne, J., Ghertner, D., Herndon, S., Shi, Q.,
Jimenez, J., Silva, P., Williams, P., Lanni, T., Drewnick, F., De-
merjian, K., Kolb, C., and Worsnop, D.: Chase Studies of Partic-
Atmos. Chem. Phys., 15, 13377–13392, 2015 www.atmos-chem-phys.net/15/13377/2015/
Page 13
B. R. Ayres et al.: Organic nitrate aerosol formation in the southeastern US 13389
ulate Emissions from in-use New York City Vehicles„ Aerosol
Sci. Technol., 38, 555–573, 2004.
Carlton, A. G., Pinder, R. W., Bhave, P. V., and Pouliot, G. A.: To
What Extent Can Biogenic SOA be Controlled?, Environ. Sci.
Technol., 44, 3376–3380, 2010.
Chameides, W. L.: Photo-Chemical Role of Tropospheric Nitrogen-
Oxides, Geophys. Res. Lett., 5, 17–20, 1978.
Cole-Filipiak, N. C., O’Connor, A. E., and Elrod, M. J.: Kinet-
ics of the Hydrolysis of Atmospherically Relevant Isoprene-
Derived Hydroxy Epoxides, Environ. Sci. Technol., 44, 6718–
6723, 2010.
Crounse, J. D., McKinney, K. A., Kwan, A. J., and Wennberg, P. O.:
Measurement of Gas-Phase Hydroperoxides by Chemical Ioniza-
tion Mass Spectrometry, Analyt. Chem., 78, 6726–6732, 2006.
Crounse, J. D., Nielsen, L. B., and Jørgensen, S.: Autoxidation of
Organic Compounds in the Atmosphere, J. Phys. Chem. Lett., 4,
3513–3520, 2013.
Crowley, J. N., Thieser, J., Tang, M. J., Schuster, G., Bozem, H.,
Beygi, Z. H., Fischer, H., Diesch, J.-M., Drewnick, F., Bor-
rmann, S., Song, W., Yassaa, N., Williams, J., Pöhler, D., Platt,
U., and Lelieveld, J.: Variable lifetimes and loss mechanisms for
NO3 and N2O5 during the DOMINO campaign: contrasts be-
tween marine, urban and continental air, Atmos. Chem. Phys.,
11, 10853–10870, doi:10.5194/acp-11-10853-2011, 2011.
Crutzen, P. J. and Andreae, M. O.: Biomass Burning in the Tropics –
Impact on Atmospheric Chemistry and Biogeochemical Cycles,
Science, 250, 1669–1678, 1990.
Dallmann, T., DeMartini, S., Kirchstetter, T., Herndon, S., Onasch,
T., Wood, E., and Harley, R.: On-Road measurement of gas and
particle phase pollutant emission factors for individual heavy-
duty diesel trucks, Environ. Sci. Technol., 46, 8511–8518, 2012.
Das, M. and Aneja, V.: Regional analysis of nonmethane volatile
organic compounds in the lower troposphere of the Southeast
United States, Journal of Environmental Engineering, 129, 1085–
1103, 2003.
Day, D. A., Wooldridge, P. J., Dillon, M. B., Thornton, J. A., and
Cohen, R. C.: A thermal dissociation laser-induced fluorescence
instrument for in situ detection of NO2, peroxy nitrates, alkyl
nitrates, and HNO3, J. Geophys. Res.-Atmos., 107, AH 4-1–AH
4-14, 2002.
DeCarlo, P. F., Kimmel, J. R., Trimborn, A., Northway, M. J., Jayne,
J. T., Aiken, A. C., Gonin, M., Fuhrer, K., Horvath, T., Docherty,
K. S., Worsnop, D. R., and Jimenez, J. L.: Field-deployable,
high-resolution, time-of-flight aerosol mass spectrometer, Ana-
lyt. Chem., 78, 8281–8289, 2006.
De Gouw, J. A.: Budget of organic carbon in a polluted atmosphere:
Results from the New England Air Quality Study in 2002, J. Geo-
phys. Res., 110, D16305, doi:10.1029/2004JD005623, 2005.
Dentener, F. J. and Crutzen, P. J.: Reaction of N2O5 on tropospheric
aerosols: Impact on the global distributions of NOx, O3, and OH,
J. Geophys. Res.-Atmos., 98, 7149–7163, 1993.
Draper, D. C., Farmer, D. K., Desyaterik, Y., and Fry, J. L.: A
qualitative comparison of secondary organic aerosol yields and
composition from ozonolysis of monoterpenes at varying con-
centrations of NO2, Atmos. Chem. Phys., 15, 12267–12281,
doi:10.5194/acp-15-12267-2015, 2015.
Dubé, W. P., Brown, S. S., Osthoff, H. D., Nunley, M. R., Ci-
ciora, S. J., Paris, M. W., McLaughlin, R. J., and Ravishankara,
A. R.: Aircraft instrument for simultaneous, in situ measurement
of NO3 and N2O5 via pulsed cavity ring-down spectroscopy, Re-
view Of Scientific Instruments, 77, 034101, 2006.
Eddingsaas, N. C., Loza, C. L., Yee, L. D., Seinfeld, J. H.,
and Wennberg, P. O.: α-pinene photooxidation under controlled
chemical conditions – Part 1: Gas-phase composition in low- and
high-NOx environments, Atmos. Chem. Phys., 12, 6489–6504,
doi:10.5194/acp-12-6489-2012, 2012.
Epstein, S. A., Blair, S. L., and Nizkorodov, S. A.: Direct Photolysis
of α-Pinene Ozonolysis Secondary Organic Aerosol: Effect on
Particle Mass and Peroxide Content, Environ. Sci. Technol., 48,
11251–11258, 2014.
Evans, M. J. and Jacob, D. J.: Impact of new laboratory studies of
N2O5 hydrolysis on global model budgets of tropospheric nitro-
gen oxides, ozone, and OH, Geophys. Res. Lett., 32, L09813,
doi:10.1029/2005GL022469, 2005.
Farmer, D., Matsunaga, A., Docherty, K., Surratt, J., Seinfeld, J.,
Ziemann, P., and Jimenez, J.: Response of an aerosol mass spec-
trometer to organonitrates and organosulfates and implications
for atmospheric chemistry, P. Natil. Acad. Sci. USA, 107, 6670–
6675, 2010.
Feng, Y. and Penner, J. E.: Global modeling of nitrate and ammo-
nium: Interaction of aerosols and tropospheric chemistry, J. Geo-
phys. Res.-Atmos., 112, D01304, doi:10.1029/2005JD006404,
2007.
Fry, J. L., Kiendler-Scharr, A., Rollins, A. W., Wooldridge, P. J.,
Brown, S. S., Fuchs, H., Dubé, W., Mensah, A., dal Maso,
M., Tillmann, R., Dorn, H.-P., Brauers, T., and Cohen, R.
C.: Organic nitrate and secondary organic aerosol yield from
NO3 oxidation of β-pinene evaluated using a gas-phase kinet-
ics/aerosol partitioning model, Atmos. Chem. Phys., 9, 1431–
1449, doi:10.5194/acp-9-1431-2009, 2009.
Fry, J. L., Kiendler-Scharr, A., Rollins, A. W., Brauers, T., Brown,
S. S., Dorn, H.-P., Dubé, W. P., Fuchs, H., Mensah, A., Rohrer,
F., Tillmann, R., Wahner, A., Wooldridge, P. J., and Cohen, R. C.:
SOA from limonene: role of NO3 in its generation and degrada-
tion, Atmos. Chem. Phys., 11, 3879–3894, doi:10.5194/acp-11-
3879-2011, 2011.
Fry, J. L., Draper, D. C., Zarzana, K. J., Campuzano-Jost, P., Day,
D. A., Jimenez, J. L., Brown, S. S., Cohen, R. C., Kaser, L.,
Hansel, A., Cappellin, L., Karl, T., Hodzic Roux, A., Turnipseed,
A., Cantrell, C., Lefer, B. L., and Grossberg, N.: Observations of
gas- and aerosol-phase organic nitrates at BEACHON-RoMBAS
2011, Atmos. Chem. Phys., 13, 8585–8605, doi:10.5194/acp-13-
8585-2013, 2013.
Fry, J. L., Draper, D. C., Barsanti, K. C., Smith, J. N., Ortega, J.,
Winkler, P. M., Lawler, M. J., Brown, S. S., Edwards, P. M., Co-
hen, R. C., and Lee, L.: Secondary Organic Aerosol Formation
and Organic Nitrate Yield from NO3 Oxidation of Biogenic Hy-
drocarbons, Environ. Sci. Technol., 48, 11944–11953, 2014.
Galloway, J., Dentener, F., Capone, D., Boyer, E., Howarth, R.,
Seitzinger, S., Asner, G., Cleveland, C., Green, P., and Holland,
E.: Nitrogen cycles: past, present, and future, Biogeochemistry,
70, 153–226, 2004.
Geron, C., Rasmussen, R., Arnts, R. R., and Guenther, A.: A re-
view and synthesis of monoterpene speciation from forests in the
United States, Atmos. Environ., 34, 1761–1781, 2000.
Geyer, A., Alicke, B., Konrad, S., Schmitz, T., Stutz, J., and Platt,
U.: Chemistry and oxidation capacity of the nitrate radical in the
www.atmos-chem-phys.net/15/13377/2015/ Atmos. Chem. Phys., 15, 13377–13392, 2015
Page 14
13390 B. R. Ayres et al.: Organic nitrate aerosol formation in the southeastern US
continental boundary layer near Berlin, J. Geophys. Res.-Atmos.,
106, 8013–8025, 2001.
Gilman, J. B., Burkhart, J. F., Lerner, B. M., Williams, E. J., Kuster,
W. C., Goldan, P. D., Murphy, P. C., Warneke, C., Fowler, C.,
Montzka, S. A., Miller, B. R., Miller, L., Oltmans, S. J., Ry-
erson, T. B., Cooper, O. R., Stohl, A., and de Gouw, J. A.:
Ozone variability and halogen oxidation within the Arctic and
sub-Arctic springtime boundary layer, Atmos. Chem. Phys., 10,
10223–10236, doi:10.5194/acp-10-10223-2010, 2010.
Goldan, P. D., Kuster, W. C., Fehsenfeld, F. C., and Montzka,
S. A.: Hydrocarbon measurements in the southeastern United
States: The Rural Oxidants in the Southern Environment
(ROSE) Program 1990, J. Geophys. Res.-Atmos., 100, 25945,
doi:10.1029/95JD02607, 1995.
Goldan, P. D., Kuster, W. C., Williams, E., Murphy, P. C., Fehsen-
feld, F. C., and Meagher, J.: Nonmethane hydrocarbon and
oxy hydrocarbon measurements during the 2002 New Eng-
land Air Quality Study, J. Geophys. Res.-Atmos., 109, D21309,
doi:10.1029/2003JD004455, 2004.
Goldstein, A. H. and Galbally, I. E.: Known and unexplored organic
constituents in the earth’s atmosphere, Environ. Sci. Technol., 41,
1514–1521, 2007.
Goldstein, A., Koven, C., Heald, C., and Fung, I.: Biogenic carbon
and anthropogenic pollutants combine to form a cooling haze
over the southeastern United States, P. Natl. Acad. Sci. USA,
106, 8835–8840, 2009.
Griffin, R. J., Cocker, D. R., III, Flagan, R. C., and Seinfeld, J. H.:
Organic aerosol formation from the oxidation of biogenic hydro-
carbons, J. Geophys. Res.-Atmos., 104, 3555–3567, 1999.
Hallquist, M., Wängberg, I., Ljungström, E., Barnes, I., and Becker,
K.: 121 2009 Aerosol and product yields from NO3 radical-
initiated oxidation of selected monoterpenes, Environ. Sci. Tech-
nol., 33, 553–559, 1999.
Hallquist, M., Wenger, J. C., Baltensperger, U., Rudich, Y., Simp-
son, D., Claeys, M., Dommen, J., Donahue, N. M., George,
C., Goldstein, A. H., Hamilton, J. F., Herrmann, H., Hoff-
mann, T., Iinuma, Y., Jang, M., Jenkin, M. E., Jimenez, J. L.,
Kiendler-Scharr, A., Maenhaut, W., McFiggans, G., Mentel, Th.
F., Monod, A., Prévôt, A. S. H., Seinfeld, J. H., Surratt, J. D.,
Szmigielski, R., and Wildt, J.: The formation, properties and im-
pact of secondary organic aerosol: current and emerging issues,
Atmos. Chem. Phys., 9, 5155–5236, doi:10.5194/acp-9-5155-
2009, 2009.
Heald, C. L., Jacob, D. J., Park, R. J., Russell, L. M., Huebert, B. J.,
Seinfeld, J. H., Liao, H., and Weber, R. J.: A large organic aerosol
source in the free troposphere missing from current models, Geo-
phys. Res. Lett., 32, L18809, doi:10.1029/2005GL023831, 2005.
Hidy, G. M., Blanchard, C. L., Baumann, K., Edgerton, E., Tanen-
baum, S., Shaw, S., Knipping, E., Tombach, I., Jansen, J., and
Walters, J.: Chemical climatology of the southeastern United
States, 1999–2013, Atmos. Chem. Phys., 14, 11893–11914,
doi:10.5194/acp-14-11893-2014, 2014.
Horowitz, L. W., Fiore, A. M., Milly, G. P., Cohen, R. C., Perring,
A., Wooldridge, P. J., Hess, P. G., Emmons, L. K., and Lamar-
que, J.-F.: Observational constraints on the chemistry of isoprene
nitrates over the eastern United States, J. Geophys. Res.-Atmos.,
112, D12S08, doi:10.1029/2006JD007747, 2007.
Hu, W. W., Campuzano-Jost, P., Palm, B. B., Day, D. A., Ortega,
A. M., Hayes, P. L., Krechmer, J. E., Chen, Q., Kuwata, M.,
Liu, Y. J., de Sá, S. S., McKinney, K., Martin, S. T., Hu, M.,
Budisulistiorini, S. H., Riva, M., Surratt, J. D., St. Clair, J. M.,
Isaacman-Van Wertz, G., Yee, L. D., Goldstein, A. H., Carbone,
S., Brito, J., Artaxo, P., de Gouw, J. A., Koss, A., Wisthaler, A.,
Mikoviny, T., Karl, T., Kaser, L., Jud, W., Hansel, A., Docherty,
K. S., Alexander, M. L., Robinson, N. H., Coe, H., Allan, J. D.,
Canagaratna, M. R., Paulot, F., and Jimenez, J. L.: Characteri-
zation of a real-time tracer for isoprene epoxydiols-derived sec-
ondary organic aerosol (IEPOX-SOA) from aerosol mass spec-
trometer measurements, Atmos. Chem. Phys., 15, 11807–11833,
doi:10.5194/acp-15-11807-2015, 2015.
Jimenez, J. L., Canagaratna, M. R., Donahue, N. M., Prevot, A.
S. H., Zhang, Q., Kroll, J. H., DeCarlo, P. F., Allan, J. D., Coe,
H., Ng, N. L., Aiken, A. C., Docherty, K. S., Ulbrich, I. M.,
Grieshop, A. P., Robinson, A. L., Duplissy, J., Smith, J. D., Wil-
son, K. R., Lanz, V. A., Hueglin, C., Sun, Y. L., Tian, J., Laakso-
nen, A., Raatikainen, T., Rautiainen, J., Vaattovaara, P., Ehn, M.,
Kulmala, M., Tomlinson, J. M., Collins, D. R., Cubison, M. J.,
Dunlea, E. J., Huffman, J. A., Onasch, T. B., Alfarra, M. R.,
Williams, P. I., Bower, K., Kondo, Y., Schneider, J., Drewnick,
F., Borrmann, S., Weimer, S., Demerjian, K., Salcedo, D., Cot-
trell, L., Griffin, R., Takami, A., Miyoshi, T., Hatakeyama, S.,
Shimono, A., Sun, J. Y., Zhang, Y. M., Dzepina, K., Kimmel,
J. R., Sueper, D., Jayne, J. T., Herndon, S. C., Trimborn, A. M.,
Williams, L. R., Wood, E. C., Middlebrook, A. M., Kolb, C. E.,
Baltensperger, U., and Worsnop, D. R.: Evolution of organic
aerosols in the atmosphere, Science, 326, 1525–1529, 2009.
Kroll, J. H. and Seinfeld, J. H.: Chemistry of secondary organic
aerosol: Formation and evolution of low-volatility organics in the
atmosphere, Atmos. Environ., 42, 3593–3624, 2008.
Lee, A. K. Y., Herckes, P., Leaitch, W. R., Macdonald, A. M.,
and Abbatt, J. P. D.: Aqueous OH oxidation of ambi-
ent organic aerosol and cloud water organics: Formation of
highly oxidized products, Geophys. Res. Lett., 38, L11805,
doi:10.1029/2011GL047439, 2011.
Lee, B. H., Lopez-Hilfiker, F. D., Mohr, C., Kurtén, T., Worsnop,
D. R., and Thornton, J. A.: An Iodide-Adduct High-Resolution
Time-of-Flight Chemical-Ionization Mass Spectrometer: Appli-
cation to Atmospheric Inorganic and Organic Compounds, Envi-
ron. Sci. Technol., 48, 6309–6317, 2014.
Lee, B. H., Mohr, C., Lopez-Hilfiker, F. D., Lutz, A., Hallquist, M.,
Hu, W. W., Jimenez, J., Xu, L., Ng, N. L., Romer, P., Cohen,
R. C., Wild, R. J., Kim, S., de Gouw, J., Goldstein, A. H., Shep-
son, P. B., Wennberg, P. O., and Thornton, J. A.: Highly function-
alized particle-phase organic nitrates observed in the Southeast-
ern U.S.: contribution to secondary organic aerosol and reactive
nitrogen budgets, P. Natl. Acad. Sci. USA, submitted, 2015.
Lee, T., Yu, X.-Y., Ayres, B., Kreidenweis, S., Malm, W., and Col-
lett Jr, J.: Observations of fine and coarse particle nitrate at sev-
eral rural locations in the United States, Atmos. Environ., 42,
2720–2732, 2008.
Liu, S., Shilling, J. E., Song, C., Hiranuma, N., Zaveri, R. A., and
Russell, L. M.: Hydrolysis of Organonitrate Functional Groups in
Aerosol Particles, Aerosol Sci. Technol., 46, 1359–1369, 2012.
Lopez-Hilfiker, F. D., Mohr, C., Ehn, M., Rubach, F., Kleist, E.,
Wildt, J., Mentel, Th. F., Lutz, A., Hallquist, M., Worsnop, D.,
and Thornton, J. A.: A novel method for online analysis of gas
and particle composition: description and evaluation of a Filter
Atmos. Chem. Phys., 15, 13377–13392, 2015 www.atmos-chem-phys.net/15/13377/2015/
Page 15
B. R. Ayres et al.: Organic nitrate aerosol formation in the southeastern US 13391
Inlet for Gases and AEROsols (FIGAERO), Atmos. Meas. Tech.,
7, 983–1001, doi:10.5194/amt-7-983-2014, 2014.
Makkonen, U., Virkkula, A., Mäntykenttä, J., Hakola, H., Keronen,
P., Vakkari, V., and Aalto, P. P.: Semi-continuous gas and inor-
ganic aerosol measurements at a Finnish urban site: comparisons
with filters, nitrogen in aerosol and gas phases, and aerosol acid-
ity, Atmos. Chem. Phys., 12, 5617–5631, doi:10.5194/acp-12-
5617-2012, 2012.
Müller, J.-F., Peeters, J., and Stavrakou, T.: Fast photolysis of car-
bonyl nitrates from isoprene, Atmos. Chem. Phys., 14, 2497–
2508, doi:10.5194/acp-14-2497-2014, 2014.
Myhre, G., Samset, B. H., Schulz, M., Balkanski, Y., Bauer, S.,
Berntsen, T. K., Bian, H., Bellouin, N., Chin, M., Diehl, T.,
Easter, R. C., Feichter, J., Ghan, S. J., Hauglustaine, D., Iversen,
T., Kinne, S., Kirkevåg, A., Lamarque, J.-F., Lin, G., Liu, X.,
Lund, M. T., Luo, G., Ma, X., van Noije, T., Penner, J. E., Rasch,
P. J., Ruiz, A., Seland, Ø., Skeie, R. B., Stier, P., Takemura, T.,
Tsigaridis, K., Wang, P., Wang, Z., Xu, L., Yu, H., Yu, F., Yoon,
J.-H., Zhang, K., Zhang, H., and Zhou, C.: Radiative forcing of
the direct aerosol effect from AeroCom Phase II simulations,
Atmos. Chem. Phys., 13, 1853–1877, doi:10.5194/acp-13-1853-
2013, 2013.
Nel, A.: Atmosphere. Air pollution-related illness: effects of parti-
cles, Science, 308, 804–806, 2005.
Nguyen, T. B., Crounse, J. D., Teng, A. P., Clair, J. M. S., Paulot, F.,
Wolfe, G. M., and Wennberg, P. O.: Rapid deposition of oxidized
biogenic compounds to a temperate forest, P. Natl. Acad. Sci.
USA, 112, E392–E401, 2015.
Nizich, S. V., Pope, A. A., Driver, L. M., and Pechan-Avanti Group:
NATIONAL AIR POLLUTANT EMISSION TRENDS, 1900–
1998, Tech. rep., Environmental Protection Agency, Research
Triangle Park, NC, 2000.
Odman, M. T., Boylan, J. W., and Russell, A. G.: Air Pollution Mod-
eling and Its Application XVI, Springer Science+Business Media
New York, 16 edn., 2004.
Perring, A. E., Pusede, S. E., and Cohen, R. C.: An Observational
Perspective on the Atmospheric Impacts of Alkyl and Multifunc-
tional Nitrates on Ozone and Secondary Organic Aerosol, Chem.
Rev., 113, 5848–5870, 2013.
Pope, C. A. and Dockery, D. W.: Health effects of fine particulate
air pollution: Lines that connect, J. Air Waste Manag. Assoc., 56,
709–742, 2006.
Pye, H. O. T., Chan, A. W. H., Barkley, M. P., and Seinfeld, J.
H.: Global modeling of organic aerosol: the importance of reac-
tive nitrogen (NOx and NO3), Atmos. Chem. Phys., 10, 11261–
11276, doi:10.5194/acp-10-11261-2010, 2010.
Riemer, N., Vogel, H., Vogel, B., Anttila, T., Kiendler-Scharr,
A., and Mentel, T. F.: Relative importance of organic coat-
ings for the heterogeneous hydrolysis of N2O5 during sum-
mer in Europe, J. Geophys. Res.-Atmos., 114, D17307,
doi:10.1029/2008JD011369, 2009.
Rollins, A. W., Smith, J. D., Wilson, K. R., and Cohen, R. C.: Real
time in situ detection of organic nitrates in atmospheric aerosols,
Environ. Sci. Technol., 44, 5540–5545, 2010.
Rollins, A. W., Browne, E. C., Min, K.-E., Pusede, S. E.,
Wooldridge, P. J., Gentner, D. R., Goldstein, A. H., Liu, S., Day,
D. A., Russell, L. M., and Cohen, R. C.: Evidence for NOx
Control over Nighttime SOA Formation, Science, 337, 1210,
doi:10.1126/science.1221520, 2012.
Sander, S. P., Friedl, R. R., Barker, J. R., Golden, D. M., Kurylo,
M. J., Wine, P. H., Abbatt, J. P. D., Burkholder, J. B., Kolb, C. E.,
Moortgat, G. K., Huie, R. E., and Orkin, V. L.: Chemical Kinetics
and Photochemical Data for Use in Atmospheric Studies – Eval-
uation Number 17, JPL Publication 10-6, Pasadena, California,
p. 1–684, 2011.
Saunders, S. M., Jenkin, M. E., Derwent, R. G., and Pilling, M.
J.: Protocol for the development of the Master Chemical Mech-
anism, MCM v3 (Part A): tropospheric degradation of non-
aromatic volatile organic compounds, Atmos. Chem. Phys., 3,
161–180, doi:10.5194/acp-3-161-2003, 2003.
Seinfeld, J. H. and Pandis, S. N.: Atmospheric Chemistry and
Physics: From Air Pollution to Climate Change, John Wiley &
Sons, Inc. Hoboken, New Jersey, second edn., 2006.
Spittler, M., Barnes, I., Bejan, I., Brockmann, K., Benter, T., and
Wirtz, K.: Reactions of NO3 radicals with limonene and α-
pinene: Product and SOA formation, Atmos. Environ., 40, S116–
S127, 2006.
Spracklen, D. V., Jimenez, J. L., Carslaw, K. S., Worsnop, D. R.,
Evans, M. J., Mann, G. W., Zhang, Q., Canagaratna, M. R.,
Allan, J., Coe, H., McFiggans, G., Rap, A., and Forster, P.:
Aerosol mass spectrometer constraint on the global secondary
organic aerosol budget, Atmos. Chem. Phys., 11, 12109–12136,
doi:10.5194/acp-11-12109-2011, 2011.
Stanier, C. O., Khlystov, A. Y., Chan, W. R., Mandiro, M., and Pan-
dis, S. N.: A method for the in situ measurement of fine aerosol
water content of ambient aerosols: The dry-ambient aerosol size
spectrometer (DAASS), Aerosol Sci. Technol., 38, 215–228,
2004.
Stocker, T. F., Qin, D., Plattner, G.-K., Tignor, M. M. B., Allen,
S. K., Boschung, J., Nauels, A., Xia, Y., Bex, V., and Midgley,
P. M., eds.: Climate Change 2013: The Physical Science Basis,
Working Group I Contribution to the Fifth Assessment Report
of the Intergovernmental Panel on Climate Change, Cambridge
University Press, Cambridge, UK, 2013.
Stroud, C., Roberts, J., Williams, E., Hereid, D., Angevine, W.,
Fehsenfeld, F., Wisthaler, A., Hansel, A., Martinez-Harder, M.,
Harder, H., Brune, W., Hoenninger, G., Stutz, J., and White, A.:
Nighttime isoprene trends at an urban forested site during the
1999 Southern Oxidant Study, J. Geophys. Res.-Atmos., 107,
D16, doi:10.1029/2001JD000959, 2002.
Trebs, I., Meixner, F. X., Slanina, J., Otjes, R., Jongejan, P., and
Andreae, M. O.: Real-time measurements of ammonia, acidic
trace gases and water-soluble inorganic aerosol species at a ru-
ral site in the Amazon Basin, Atmos. Chem. Phys., 4, 967–987,
doi:10.5194/acp-4-967-2004, 2004.
Vlasenko, A., Sjogren, S., Weingartner, E., Stemmler, K., Gäggeler,
H. W., and Ammann, M.: Effect of humidity on nitric acid uptake
to mineral dust aerosol particles, Atmos. Chem. Phys., 6, 2147–
2160, doi:10.5194/acp-6-2147-2006, 2006.
von Kuhlmann, R., Lawrence, M. G., Pöschl, U., and Crutzen, P. J.:
Sensitivities in global scale modeling of isoprene, Atmos. Chem.
Phys., 4, 1–17, doi:10.5194/acp-4-1-2004, 2004.
Wagner, N. L., Dubé, W. P., Washenfelder, R. A., Young, C.
J., Pollack, I. B., Ryerson, T. B., and Brown, S. S.: Diode
laser-based cavity ring-down instrument for NO3, N2O5, NO,
NO2 and O3 from aircraft, Atmos. Meas. Tech., 4, 1227–1240,
doi:10.5194/amt-4-1227-2011, 2011.
www.atmos-chem-phys.net/15/13377/2015/ Atmos. Chem. Phys., 15, 13377–13392, 2015
Page 16
13392 B. R. Ayres et al.: Organic nitrate aerosol formation in the southeastern US
Wagner, N. L., Riedel, T. P., Young, C. J., Bahreini, R., Brock, C. A.,
Dubé, W. P., Kim, S., Middlebrook, A. M., Öztürk, F., Roberts,
J. M., Russo, R., Sive, B., Swarthout, R., Thornton, J. A., Van-
denBoer, T. C., Zhou, Y., and Brown, S. S.: N2O5 uptake coef-
ficients and nocturnal NO2 removal rates determined from am-
bient wintertime measurements, J. Geophys. Res.-Atmos., 118,
9331–9350, 2013.
Warneke, C., De Gouw, J. A., Goldan, P. D., Kuster, W. C.,
Williams, E. J., Lerner, B. M., Jakoubek, R., Brown, S. S.,
Stark, H., Aldener, M., Ravishankara, A. R., Roberts, J. M.,
Marchewka, M., Bertman, S., Sueper, D. T., McKeen, S. A.,
Meagher, J. F., and Fehsenfeld, F. C.: Comparison of daytime
and nighttime oxidation of biogenic and anthropogenic VOCs
along the New England coast in summer during New England
Air Quality Study 2002, J. Geophys. Res.-Atmos., 109, D10309,
doi:10.1029/2003JD004424, 2004.
Wayne, R., Barnes, I., Biggs, P., Burrows, J., Canosa-Mas, C.,
Hjorth, J., Le Bras, G., Moortgat, G., Perner, D., and Poulet, G.:
The nitrate radical: Physics, chemistry, and the atmosphere, At-
mos. Environ.. Part A. General Topics, 25, 1–203, 1991.
Wild, R., Edwards, P., Dubé, W., Baumann, K., Edgerton, E., Quinn,
P., Roberts, J., Rollins, A., Veres, P., Warneke, C., Williams,
E., Yuan, B., and Brown, S.: A Measurement of Total Reac-
tive Nitrogen, NOy, together with NO2, NO and O3 via Cav-
ity Ring-Down Spectroscopy, Environ. Sci. Technol., 48, 9609–
9615, 2014.
Winer, A. M., Atkinson, R., and James N. Pitts, J.: Gaseous Nitrate
Radical: Possible Nighttime Atmospheric Sink for Biogenic Or-
ganic Compounds, Science, 224, 156–159, 1984.
Xie, Y., Paulot, F., Carter, W. P. L., Nolte, C. G., Luecken, D. J.,
Hutzell, W. T., Wennberg, P. O., Cohen, R. C., and Pinder, R. W.:
Understanding the impact of recent advances in isoprene pho-
tooxidation on simulations of regional air quality, Atmos. Chem.
Phys., 13, 8439–8455, doi:10.5194/acp-13-8439-2013, 2013.
Xu, L., Guo, H., Boyd, C. M., Klein, M., Bougiatioti, A., Cerully,
K. M., Hite, J. R., Isaacman-VanWertz, G., Kreisberg, N. M.,
Knote, C., Olson, K., Koss, A., Goldstein, A. H., Hering, S. V.,
de Gouw, J., Baumann, K., Lee, S.-H., Nenes, A., Weber, R. J.,
and Ng, N. L.: Effects of anthropogenic emissions on aerosol
formation from isoprene and monoterpenes in the southeastern
United States, P. Natl. Acad. Sci. USA, 112, 37–42, 2015a.
Xu, L., Suresh, S., Guo, H., Weber, R. J., and Ng, N. L.: Aerosol
characterization over the southeastern United States using high-
resolution aerosol mass spectrometry: spatial and seasonal varia-
tion of aerosol composition and sources with a focus on organic
nitrates, Atmos. Chem. Phys., 15, 7307–7336, doi:10.5194/acp-
15-7307-2015, 2015b.
Yatavelli, R., Lopez-Hilfiker, F., Wargo, J., Kimmel, J., Cubison,
M., Bertram, T., Jimenez, J., Gonin, M., Worsnop, D., and Thorn-
ton, J.: A Chemical Ionization High-Resolution Time-of-Flight
Mass Spectrometer Coupled to a Micro Orifice Volatilization Im-
pactor (MOVI-HRToF-CIMS) for Analysis of Gas and Particle-
Phase Organic Species, Aerosol Sci. Technol., 46, 1313–1327,
2012.
Zhang, Q., Jimenez, J. L., Canagaratna, M. R., Allan, J. D.,
Coe, H., Ulbrich, I., Alfarra, M. R., Takami, A., Middlebrook,
A. M., Sun, Y. L., Dzepina, K., Dunlea, E., Docherty, K., De-
Carlo, P. F., Salcedo, D., Onasch, T., Jayne, J. T., Miyoshi,
T., Shimono, A., Hatakeyama, S., Takegawa, N., Kondo, Y.,
Schneider, J., Drewnick, F., Borrmann, S., Weimer, S., Demer-
jian, K., Williams, P., Bower, K., Bahreini, R., Cottrell, L.,
Griffin, R. J., Rautiainen, J., Sun, J. Y., Zhang, Y. M., and
Worsnop, D. R.: Ubiquity and dominance of oxygenated species
in organic aerosols in anthropogenically-influenced Northern
Hemisphere midlatitudes, Geophys. Res. Lett., 34, L13801,
doi:10.1029/2007GL029979, 2007.
Atmos. Chem. Phys., 15, 13377–13392, 2015 www.atmos-chem-phys.net/15/13377/2015/