sustainability Article Organic vs. Non-Organic Food Products: Credence and Price Competition Yi Wang 1 , Zhanguo Zhu 2,3, * and Feng Chu 3,4 1 School of Management, Hangzhou Dianzi University, Hangzhou 310018, China; [email protected]2 College of Economics and Management, Nanjing Agricultural University, Nanjing 210095, China 3 Laboratoire d’informatique, biologie intégrative et systèmes complexes (IBISC), EA 4526, Université d’Evry Val d’Essonne, 91020 Evry Cedex, France; [email protected]4 Management Engineering Research Center, Xinhua University, Chengdu 610039, China * Correspondence: [email protected] or [email protected]Academic Editors: Riccardo Accorsi and Riccardo Manzini Received: 10 February 2017; Accepted: 28 March 2017; Published: 4 April 2017 Abstract: We analyze the organic and non-organic production choices of two firms by considering customers’ trust in organic food products. In the context of customers’ possible willingness to pay a premium price and their mistrust in organic food products, two firms first make choices on offering organic and non-organic food products. If offering organic products, a firm can further invest in the credence system to increase customers’ trust in their organic products. At the final stage, two firms determine prices. We provide serval insights. First, we characterize the market conditions in which only one firm, both firms or neither firm will choose to offer organic food products. We find that the higher the production costs or credence investment costs for organic food products are, the more likely firms are to choose to produce non-organic food products. Second, if it is expensive enough to invest in organic credence, offering organic food products may still be uncompetitive, even if organic production cost appears to have no disadvantage compared to non-organic food products. Third, we highlight how the prices of organic food products in equilibrium are affected by market parameters. We show that when only one firm offers organic food products, this firm tends to offer a relatively low price if organic credence investment is expensive. Fourth, we highlight how one firm’s credence investment decision in equilibrium can be affected by the product type choice of the other firm. We find that the investment in organic credence is lower when both firms offer organic food products compared with the case when only one firm offers organic food products. Keywords: organic food products; sustainability; credence; competition 1. Introduction The consumption of organic food has grown rapidly over the past two decades. Global sales for organic food increased from $23 billion in 2002 to 63 billion in 2011, accounting for 1–2% of total food production worldwide [1,2]. Such growth could be explained partially by consumers’ great concerns for personal health, and the environment since the organic production meets these two requirements [3]. The high nutritional value and the awareness of the risk of some diet-related diseases contribute to the health aspects of organic consumption motivation [3]. Besides, the belief that organic production overcomes the sustainable shortcomings of conventional farming, e.g., soil degradation, nutrient runoff, greenhouse gas emissions, biodiversity loss, and pesticide-born damage, etc. [4], contributes to sustainable aspects of organic consumption motivation. On the demand side, consumers are willing to pay a premium price for organic food, which typically costs 10% to several times more than non-organic food [5]. However, lack of consumer trust is a barrier for the development of a market for organic food in some countries. On the supply Sustainability 2017, 9, 545; doi:10.3390/su9040545 www.mdpi.com/journal/sustainability
Transcript
sustainability
Article
Organic vs. Non-Organic Food Products:Credence and Price Competition
Yi Wang 1, Zhanguo Zhu 2,3,* and Feng Chu 3,4
1 School of Management, Hangzhou Dianzi University, Hangzhou 310018, China; [email protected] College of Economics and Management, Nanjing Agricultural University, Nanjing 210095, China3 Laboratoire d’informatique, biologie intégrative et systèmes complexes (IBISC), EA 4526,
Université d’Evry Val d’Essonne, 91020 Evry Cedex, France; [email protected] Management Engineering Research Center, Xinhua University, Chengdu 610039, China* Correspondence: [email protected] or [email protected]
Academic Editors: Riccardo Accorsi and Riccardo ManziniReceived: 10 February 2017; Accepted: 28 March 2017; Published: 4 April 2017
Abstract: We analyze the organic and non-organic production choices of two firms by consideringcustomers’ trust in organic food products. In the context of customers’ possible willingness to pay apremium price and their mistrust in organic food products, two firms first make choices on offeringorganic and non-organic food products. If offering organic products, a firm can further invest in thecredence system to increase customers’ trust in their organic products. At the final stage, two firmsdetermine prices. We provide serval insights. First, we characterize the market conditions in whichonly one firm, both firms or neither firm will choose to offer organic food products. We find that thehigher the production costs or credence investment costs for organic food products are, the morelikely firms are to choose to produce non-organic food products. Second, if it is expensive enoughto invest in organic credence, offering organic food products may still be uncompetitive, even iforganic production cost appears to have no disadvantage compared to non-organic food products.Third, we highlight how the prices of organic food products in equilibrium are affected by marketparameters. We show that when only one firm offers organic food products, this firm tends to offer arelatively low price if organic credence investment is expensive. Fourth, we highlight how one firm’scredence investment decision in equilibrium can be affected by the product type choice of the otherfirm. We find that the investment in organic credence is lower when both firms offer organic foodproducts compared with the case when only one firm offers organic food products.
The consumption of organic food has grown rapidly over the past two decades. Global salesfor organic food increased from $23 billion in 2002 to 63 billion in 2011, accounting for 1–2% of totalfood production worldwide [1,2]. Such growth could be explained partially by consumers’ greatconcerns for personal health, and the environment since the organic production meets these tworequirements [3]. The high nutritional value and the awareness of the risk of some diet-related diseasescontribute to the health aspects of organic consumption motivation [3]. Besides, the belief that organicproduction overcomes the sustainable shortcomings of conventional farming, e.g., soil degradation,nutrient runoff, greenhouse gas emissions, biodiversity loss, and pesticide-born damage, etc. [4],contributes to sustainable aspects of organic consumption motivation.
On the demand side, consumers are willing to pay a premium price for organic food, whichtypically costs 10% to several times more than non-organic food [5]. However, lack of consumertrust is a barrier for the development of a market for organic food in some countries. On the supply
side, despite the potential premium price, the organic producers (farmers/farming firms) usuallyface lower yields and higher production cost than conventional (non-organic) ones. For example,Seufert et al. [6] use a comprehensive meta-analysis to examine the relative yield performance oforganic and conventional farming systems and find that organic yields are typically between 5% and34% lower than conventional ones. Production costs for organic food are typically higher due torestricting the use of certain pesticides and fertilizers in farming which means that, the greater laborinputs, the high expense on fertility, weed control, and pest and disease control, etc.
Although increasing demand and potential premium price for organic food are motivatingproducers (farmers/farming companies) to transit to organic production, they face the followingchallenging questions: First, what are the profitable market conditions for producers oforganically/non-organically produced food? Second, if organic production is chosen, how muchshould producers invest in their own credence systems to respond to consumers’ mistrust in organicproducers and control systems? Organic food belongs to credence goods which means that customerscannot verify the organic attributes even after purchase and consumption [7]. Many customers fearbeing cheated while buying organic food even in the case where the products are labeled. To build thecustomers’ trust in organic products, many producers invest heavily in their own credence systemto increase customer’s trust, e.g., by using a traceability system [8]. Pivato et al. [9] show that thecorporate social performance of organic food firms may also increase consumer trust on a firm’s organicproducts. Thirdly, how should firms set a price for organically- and conventionally-produced food in acompetitive market? To the best of our knowledge, there is no existing study on the topic of individualcredence system investment in organic production although it has great and practical significance.
To address the above questions, we construct a Bertrand game-theoretic duopoly model wheretwo firms have the choices of offering organic or non-organic products. Firms first make choices onthe products types including organic products, which fit the customers’ organic preferences but incurhigher production cost, and non-organic products, which do not fit the customers’ organic preferencesbut incur only moderate production cost. If the firm chooses to offer organic products, she can furthermake a decision on their credence systems investment to increase consumers’ trust in their organicproducts. Dependent on the previous decisions, firms finally make a pricing decision. The insightsfrom our model are: First, we find that the product-type choice strategy depends on its cost efficienciesof production and organic investment credence investment, as well as the attractiveness of organicproducts. Specifically, the organic production cost, the credence investment cost, and the attractivenessof organic products can influence firms’ likelihood of offering organic products. The smaller theorganic production cost and the credence investment cost are, the higher the attractiveness of organicproducts in the market and the more likely a firm offers organic products. Further more, we show that,even if organic production cost is the same as that of non-organic production, firms may still have nomotivations to offer organic products if it is expensive enough to invest in organic credence. Second,we show that when only one firm offers organic food products, this firm tends to offer a relatively lowprice if it is expensive to invest in organic credence systems. Third, a firm offering organic productstends to invest more in organic credence when the rival offers non-organic products than when bothfirms offer organic products.
The rest of this paper is organized as follows. In Section 2, we analyze relevant previous literature.The model formulation and equilibrium analysis are presented in Section 3. Several numericalexperiments are reported in Section 4 to examine the impacts of market parameters on the finalequilibrium. We conclude this paper in Section 5, followed by all proofs in the appendix.
2. Related Literature
Three streams of literature are related to our model: the literature on organic production, theliterature on the consumer trust and consumption of organic products, and the literature on the modelbased on the Hotelling’s model [10].
Sustainability 2017, 9, 545 3 of 23
There are considerable studies that have attempted to gain insight into producers’ decision onthe adoption of organic production [11]. The vast majority of the work in this area focuses on theeconomic determinants of adoption of organic production, although there are also some studiesinvolving noneconomic factors, such as farmers’ personal characteristics, geographical issues, etc. [12].Pietola and Lansink [13] investigate factors determining the choice between standard and organicfarming technology in Finland and foud that decreasing output prices and increasing subsidies inducea switch to organic production. Läpple [14], utilizing Irish data, investigates empirically the adoptionand abandonment of organic farming of the drystock sector, and reveal that offering fixed organic pricepremiums and better market outlets may encourage farmers not only to convert but also may securethe long-term economic viability of organic farms. Vollmer et al. [15] analyze whether the farmers’investment behavior varies when given the option to invest in organic and conventional productionmethods. Acs et al. (2009) [16] investigate the effect of yield and price risk on the conversion decisionfrom conventional to organic farming using a model maximizing the expected utility of the farmerdepending on the farmers’ risk attitude. It is revealed that, for a risk-neutral farmer, converting toorganic farming is optimal while for a more risk-averse farmer, it is optimal only if policy incentivesare applied or if the market for the organic food products becomes more stable. Doernberg et al. [17]study potentials and limitations of regional organic food supply in the Berlin metropolitan region.They show that demand for regional organic food is higher than regional supply. However, thelimitation is that regional organic food supply need to overcome some obstacles. Cavaliere et al. [3]analyze characteristics of vertical relationships of organic supply chains with a specific focus on theprocessing and retailing sectors. They show that the majority of the processing firms indicate quitea low bargaining power on the side of their customers. Brzezina et al. [4] adopt a system dynamicsapproach to study whether organic farming can reduce vulnerabilities and enhance the resilienceof the European food system. They argue that organic farming has potential to bring resilience tothe European food system, but it has to be carefully designed and implemented. Our work focuseson farmers’ choice between offering organic food products and non-organic food products in thecompetition environment, and results in several new insights.
Our work is also broadly related to the consumer trust and consumption of organic products.A large number of studies discuss consumers’ attitude and preference regarding organic food [18–23].However, the analysis about the influences of trust on consumer decision-making is very limitedalthough consumer trust is a key prerequisite for establishing a market for organic products [7,24].Pivato et al. [9] study the impact of corporate social responsibility on consumer trust and the impactof that trust on consumers behaviors. Some papers consider consumer trust in organic consumptionwithout systematically controlling for other important determinants of consumer choices [25–27].Nuttavuthisit and Thøgersen [7] first explicitly investigate the importance of consumer trust for theemergence of a market for organic products, and find that the lack of consumer trust is a barrier forthe development of a market for organic food. On the measures of building customers trust, labelingis the most widely studied. Rousseau [28] empirically investigates the effect of organic labeling onconsumers’ purchasing behavior of chocolate. They find that, for most of the consumers, the organiclabel seems to become superfluous when selecting self-indulgent products. McCluskey [29] studies aseries of game models where producers and customers sequentally make decisions. They show thatrepeat-purchase relationships and third-party monitoring are required for high-quality credence goodsto be available. Amacher et al. [30] study a three stage game model including green production choices(eco-labeling), environmental quality provision and price. In their model, the consumers are able toobserve the quality of the product; thus, customers trust is not a problem. Baksi and Bose [31] studyproducers’ optimal labeling decisions in signal game, where they can either self-label their products,or have them certified by a third party. They show that the government needs to supplement thelabeling policy with costly monitoring activities in conditions under which corrupt producers can affixspurious labels. Bonroy and Constantatos [32] analyze credence goods markets in the case of twofirms. They study the impacts of perfect labeling providing full information and imperfect labeling
Sustainability 2017, 9, 545 4 of 23
providing partial information on the outcome of the competition. A detailed and updated reviewabout the labeling on credence is referred to [33]. Our paper differs from the above studies on labelingof credence goods in that we focus on firms’ own credence system of trust, such as building firms’ owntraceability system and making advertisements.
In the model of our paper, two firms are competing on a product line, where customers arelocated. The distance from customers position to the ends of the product line represents the preferencefor a firm. This model is based on the Hotelling’s model, in which two firms compete in locationand price within a linear city. The classic model has been widely applied in much work [34–36].Gabszewicz and Thisse [34] study the product differentiation problem. Syam and Kumar [35], and Xiaand Rajagopalan [36] analyze competition with customized and standard goods. In the above models,firms’ variety or customization decisions can directly change customers’ utility. Similar to this area ofthe literature, in our model, organic food products bring additional benefits to customers. The majordifference is that we further introduce an organic trust attribute to customers. Firms’ investments oncredence influences customers’ trust, and the customers’ buying behavior is based on their trust. To thebest of our knowledge, the model in this paper first builds a connection from credence investment,to the consumer trust, then to consumer buying behavior, and finally to the firms’ demand function.
3. Model Formulation and Analysis
3.1. Model Setting
We consider a model where two symmetric firms which may be farmers/farming firms, denotedas Firm 1 and Firm 2 respectively, are competing in a market with M customers. Each firm can offerorganic or non-organic food products. The customers are distributed uniformly on a product lineof length 1 between the two firms, with Firm 1’s food products located at the left end, denoted byx = 0, and Firm 2’s food products at the right end, denoted by x = 1. A customer’s location at theproduct line is denoted as x ∈ [0, 1], representing their relative preference for two firms’ food products.A customer located at the left end of the product line (x = 0) treats Firm 1’s product as an ideal product,and a customer located at the right end (x = 1) treats Firm 2’s as their favorite. The distance from acustomer’s location to the left (or right) end of this line, which is x (or 1− x), denotes the differencebetween the customer’s ideal food products from Firm 1 (or Firm 2)’s food products. We assume thateach customer has a unitary demand.
As mentioned in Section 1, organic food products fit the customers’ organic preferences andbring extra utility, but incur lower yields and higher production cost than non-organic food products.Thus, it is reasonable to assume that co ≥ cn and define c∆ = co − cn, where co and cn denote the unitproduction cost of organic food products and non-organic food products, respectively. Note in somespecial cases, organic production cost may not be higher than non-organic production cost [37]. In ourpaper, we consider the general cases where organic production incurs higher cost.
As organic food is difficult to distinguish from non-organic food, firms offering organic productsalso need to invest in credence to respond to consumers’ potential mistrust in organic products. In thispaper, a firm’s credence investment is spent on building their own credence system, thus we assumethat the belief of consumers in two firms’ credence is independent. This setting is different from theauthority-certified labeling investment where trusts are towards all labeled firms. Thus, the credenceinvestment cost function is assumed as CB(a) = cB (1− a)−1, where a ∈ [0, 1) is the ratio of customersin the whole market who trust the credence of organic products, and cB is a parameter which capturesthe cost of organic credence investment. This function is concave and increasing, which reflects that thecost CB and the marginal cost are both increasing in a. Besides, when a tends to 1, the investment costtends to infinity. This property is in accordance with reality, where it is difficult to make all customerstrust a firm’s organic products. For analysis convenience, we also assume that when the credenceinvestment of a firm is less than a threshold value, i.e., CB ≤ cB, there will be no customers who trusttheir organic products. This assumption can be relaxed in future study. As in the more general case,
Sustainability 2017, 9, 545 5 of 23
there already exists some customer trust in a firm’s organic products even when the firm does notinvest in any credence system. The monotonicity of cost function indicates that the credence costCB(a) and the trust ratio a form a one-to-one mapping, e.g., for any fixed C′B ≥ cB, there always existsa a ∈ [0, 1) such that C′B = cB (1− a)−1. Thus, although the firms’ real decision is the investment,i.e., the value of CB, we can use ai as a decision variable of firm i in the later sections for the sake ofanalysis convenience.
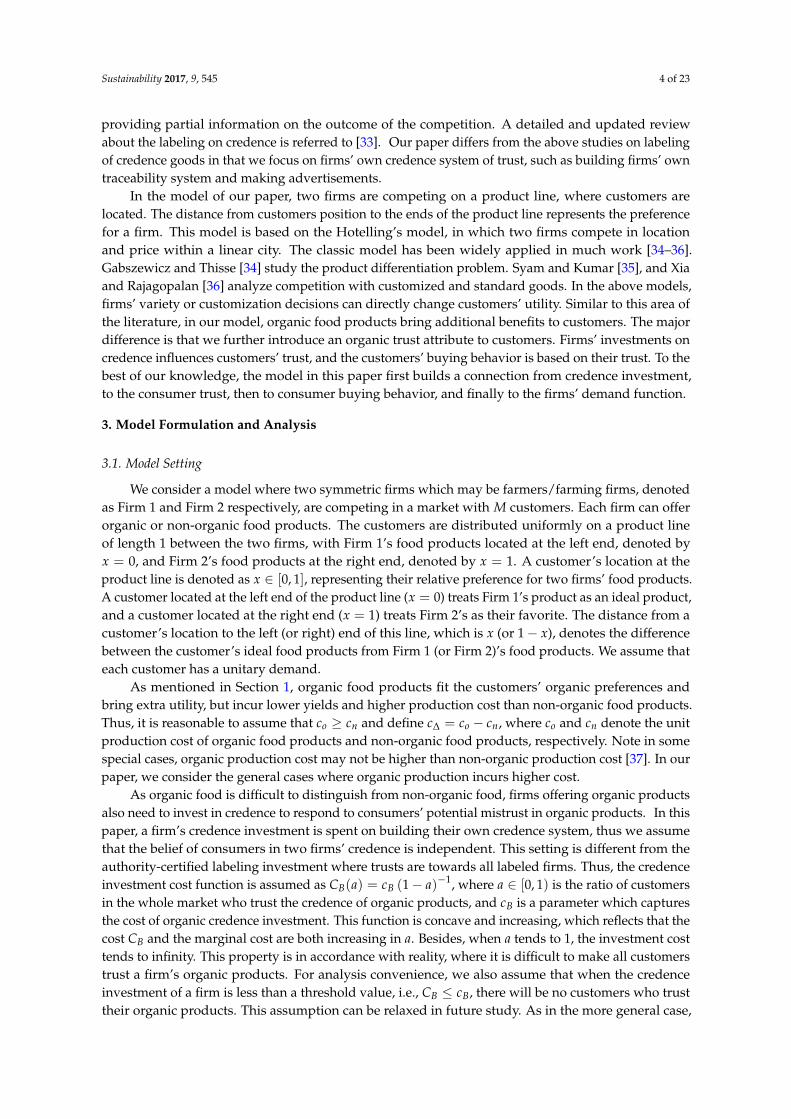
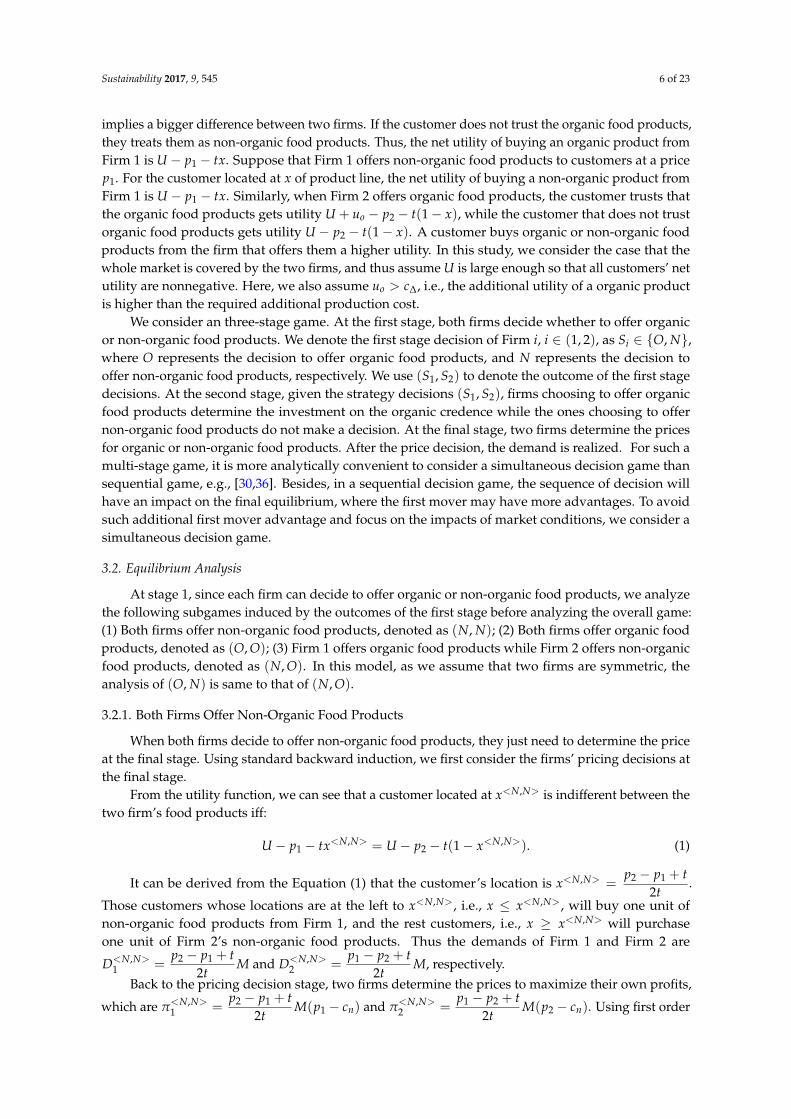
In addition to the product line, customers are also uniformly distributed along an organic trustline, where customers have different beliefs regarding the firms’ organic credence system. The productline and the trust line constitute a rectangular space, which represents the whole market where thecustomers are uniformly distributed. When both firms offer organic food products, given two firms’organic credence system investment, the trust ratio a1 and a2 are determined. Along the trust line,the probability that a customer trusts both firms’ organic food products is a1a2, the probability that acustomer trusts Firm1’s organic food products but does not trust Firm 2’s organic food products isa1(1− a2), the probability that a customer trusts in Firm2’s organic food products but does not trustFirm 1’s organic food products is a2(1− a1), and the probability that a customer does not trust bothfirms’ organic food products is (1− a1)(1− a2). Thus, we can see that the whole market can be dividedinto four parts: a1a2M customers trusting both Firms’ organic food products, a1(1− a2)M customersonly believing that firm 1’s food products are organic, a2(1− a1)M customers only believing that Firm2’s food products are organic, and the rest (1− a1)(1− a2) of the customers trust neither of the twofirms. The market structure is illustrated in Figure 1.
a a Ncustomers believe that both firms ff i d ta1a2N
a1(1-a2)NT
offers organic products
customers believe that only Firm 1 offers organic products, and do not 1( 2)Trust line
g p ,trust Firm 2’s organic products
a2(1-a1)Ncustomers believe that only Firm 2 ff i d t d d t
t d t t t b th fi ’
a2(1 a1)N offers organic products, and do not trust Firm 1’s organic products
Product line0 1
(1-a1) (1-a2)N customers do not trust both firms’ organic products
Figure 1. Four parts of market, a1 ≥ a2.
Customers choose organic or non-organic food products of the two firms based on their own foodproduct preference, the price, and their trust as to whether the food products are organic. Suppose thatFirm 1 offers organic food products to customers at a price p1. For the customer at location x of productline believing that the product is organic, the net utility of buying an organic product from Firm 1 isU + uo − p1 − tx, where U is the utility for a customer getting their ideal non-organic product for free,uo is the additional utility from an organic product compared to a non-organic product, and U and uo
are the same for all customers. In general, customers may have different utility in organic products,for example sometimes the willingness to pay for organic food is even negative [28]. However, forthe sake of analysis convenience, we assume homogeneity in organic utility. Similar homogeneity inutility assumption can be seen in [32]. This utility function is quite intuitive. A customer’s utility islinearly decreasing in the charged price p1 and the degree of difference to customer’s ideal product, x.The term tx represents the loss of utility due to the difference between Firm 1’s food products and theideal food products of a customer at x, where t is the intensity of relative preference of firms. When t isvery small, e.g., t = 0, customers have almost no preference differences between two firms. A higher t
Sustainability 2017, 9, 545 6 of 23
implies a bigger difference between two firms. If the customer does not trust the organic food products,they treats them as non-organic food products. Thus, the net utility of buying an organic product fromFirm 1 is U − p1 − tx. Suppose that Firm 1 offers non-organic food products to customers at a pricep1. For the customer located at x of product line, the net utility of buying a non-organic product fromFirm 1 is U − p1 − tx. Similarly, when Firm 2 offers organic food products, the customer trusts thatthe organic food products gets utility U + uo − p2 − t(1− x), while the customer that does not trustorganic food products gets utility U − p2 − t(1− x). A customer buys organic or non-organic foodproducts from the firm that offers them a higher utility. In this study, we consider the case that thewhole market is covered by the two firms, and thus assume U is large enough so that all customers’ netutility are nonnegative. Here, we also assume uo > c∆, i.e., the additional utility of a organic productis higher than the required additional production cost.
We consider an three-stage game. At the first stage, both firms decide whether to offer organicor non-organic food products. We denote the first stage decision of Firm i, i ∈ (1, 2), as Si ∈ {O, N},where O represents the decision to offer organic food products, and N represents the decision tooffer non-organic food products, respectively. We use (S1, S2) to denote the outcome of the first stagedecisions. At the second stage, given the strategy decisions (S1, S2), firms choosing to offer organicfood products determine the investment on the organic credence while the ones choosing to offernon-organic food products do not make a decision. At the final stage, two firms determine the pricesfor organic or non-organic food products. After the price decision, the demand is realized. For such amulti-stage game, it is more analytically convenient to consider a simultaneous decision game thansequential game, e.g., [30,36]. Besides, in a sequential decision game, the sequence of decision willhave an impact on the final equilibrium, where the first mover may have more advantages. To avoidsuch additional first mover advantage and focus on the impacts of market conditions, we consider asimultaneous decision game.
3.2. Equilibrium Analysis
At stage 1, since each firm can decide to offer organic or non-organic food products, we analyzethe following subgames induced by the outcomes of the first stage before analyzing the overall game:(1) Both firms offer non-organic food products, denoted as (N, N); (2) Both firms offer organic foodproducts, denoted as (O, O); (3) Firm 1 offers organic food products while Firm 2 offers non-organicfood products, denoted as (N, O). In this model, as we assume that two firms are symmetric, theanalysis of (O, N) is same to that of (N, O).
3.2.1. Both Firms Offer Non-Organic Food Products
When both firms decide to offer non-organic food products, they just need to determine the priceat the final stage. Using standard backward induction, we first consider the firms’ pricing decisions atthe final stage.
From the utility function, we can see that a customer located at x<N,N> is indifferent between thetwo firm’s food products iff:
U − p1 − tx<N,N> = U − p2 − t(1− x<N,N>). (1)
It can be derived from the Equation (1) that the customer’s location is x<N,N> =p2 − p1 + t
2t.
Those customers whose locations are at the left to x<N,N>, i.e., x ≤ x<N,N>, will buy one unit ofnon-organic food products from Firm 1, and the rest customers, i.e., x ≥ x<N,N> will purchaseone unit of Firm 2’s non-organic food products. Thus the demands of Firm 1 and Firm 2 are
D<N,N>1 =
p2 − p1 + t2t
M and D<N,N>2 =
p1 − p2 + t2t
M, respectively.Back to the pricing decision stage, two firms determine the prices to maximize their own profits,
which are π<N,N>1 =
p2 − p1 + t2t
M(p1 − cn) and π<N,N>2 =
p1 − p2 + t2t
M(p2 − cn). Using first order
Sustainability 2017, 9, 545 7 of 23
conditions, we can obtain the equilibrium solutions in the subgame (N, N), which are stated inProposition 1.
Proposition 1. If both firms choose to offer non-organic food products to customers at the first stage, the
equilibrium prices are: p<N,N>1 = p<N,N>
2 = t+ cn, and the equilibrium profits are: π<N,N>1 = π<N,N>
2 =tM2
.
In the subgame (N, N), both firms charge the same price that exceeds unit production cost cn by t.While t represents the difference between two firms’ food products, firms can charge a higher pricewhen t is larger. This is in accordance with the conclusion of prior literature, i.e., [38], that increasingfirm differentiation will lower the intensity of price competition. The expected profits of two firmsare the same and increasing with the market size M and t. Thus, a larger market size or a bigger firmdifferentiation will lead to higher expected profits of the two firms.
3.2.2. Both Firms Offer Organic Food Products
When both firms decide to offer organic food products to customers at the first stage, they need todetermine the investment on the credence of organic food products at the second stage and the pricesat the final stage.
We first analyze the market structure for given credence investment decisions. Given Firm 1’sdecision a1 and Firm 2’s decision a2, the whole market can be divided into four parts as discussedin Section 3. Now we analyze the two firms’ market share for given price and credence investmentdecisions. We analyze the two firms’ demand in four parts of the market respectively, and then wesum up these demands to get the total demands.
For the a1a2M customers who believe that both firms offer organic food products, a customerlocated at x<O,O>
1 is indifferent between two firm’s food products iff:
U + uo − p1 − tx<O,O>1 = U + uo − p2 − t(1− x<O,O>
1 ). (2)
It can be derived from the above equation that the customer’s location is x<O,O>1 =
p2 − p1 + t2t
.
Those customers whose locations are at the left to x<O,O>1 , i.e., x ≤ x<O,O>
1 , will buy a unit of organicfood products from Firm 1, while the rest customers will purchase a unit of organic food products from
Firm 2. Thus, the demands of Firm 1 and Firm 2 in this part of market are D<O,O>1,1 =
p2 − p1 + t2t
a1a2M
and D<O,O>2,1 =
p1 − p2 + t2t
a1a2M, respectively.
For a1 (1− a2) M customers who trust Firm 1’s organic food products and do not trust Firm 2’sorganic food products, a customer located at x<O,O>
2 is indifferent between the two firm’s foodproducts iff:
U + uo − p1 − tx<O,O>2 = U− p2 − t(1− x<O,O>
2 ). (3)
It can be derived from the above equation that the customer’s location is x<O,O>2 =
p2 − p1 + uo + t2t
. Since we are interested in a more general case when both firms are in the market,
we impose a condition x<O,O>2 ∈ [0, 1], which requires an assumption t ≥ uo, i.e., firm differentiation
is sufficiently large. Those customers located at the left to x<O,O>2 , i.e., x ≤ x<O,O>
2 , will buy oneunit of organic food products from Firm 1, and the other customers will purchase a unit of organicfood products from Firm 2. Thus, the demands of Firm 1 and Firm 2 in this part of market are
D<O,O>1,2 =
p2 − p1 + uo + t2t
a1 (1− a2) M and D<O,O>2,2 =
p2 − p1 − uo + t2t
a1 (1− a2) M, respectively.
For a2 (1− a1) M customers who trust Firm 2’s organic food products and do not trust Firm 1’sorganic food products, a customer located at x<O,O>
3 is indifferent between the two firm’s foodproducts iff:
U− p1 − tx<O,O>3 = U + uo − p2 − t(1− x<O,O>
3 ). (4)
Sustainability 2017, 9, 545 8 of 23
It can be derived from the above equation that the customer’s location is x<O,O>3 =
p2 − p1 − uo + t2t
. Those customers located at the left to x<O,O>3 , i.e., x ≤ x<O,O>
3 , will buy one unitof organic food products from Firm 1, and the other customers will purchase a unit of organicfood products from Firm 2. Thus, the demands of Firm 1 and Firm 2 in this part of market are
D<O,O>1,3 =
p2 − p1 − uo + t2t
a2 (1− a1) M and D<O,O>2,3 =
p2 − p1 + uo + t2t
a2 (1− a1) N, respectively.
For the rest (1− a1) (1− a2) M customers who do not trust both firms’ organic food products,a customer located at x<O,O>
4 is indifferent between the two firm’s food products iff:
U− p1 − tx<O,O>4 = U− p2 − t(1− x<O,O>
4 ). (5)
It can be derived from the above equation that the customer’s location is x<O,O>4 =
p2 − p1 + t2t
.
Those customers whose locations are at the left to x<O,O>4 , i.e., x ≤ x<O,O>
4 , will buy a unit of organicfood products from Firm 1, and the rest customers will purchase a unit of organic food products from
Firm 2. Thus, the demands of Firm 1 and Firm 2 in this part of market are D<O,O>1,4 =
p2 − p1 + t2t
(1− a1)
(1− a2) M and D<O,O>2,4 =
p1 − p2 + t2t
(1− a1) (1− a2) M, respectively. Thus the total demands of twoFirms are:
D<O,O>1 = D<O,O>
1,1 + D<O,O>1,2 + D<O,O>
1,3 + D<O,O>1,4 =
M2t
[p2 − p1 + t + uo(a1 − a2)] , (6)
D<O,O>2 = D<O,O>
2,1 + D<O,O>2,2 + D<O,O>
2,3 + D<O,O>2,4 =
M2t
[p1 − p2 + t− uo(a1 − a2)] . (7)
Now we analyze the equilibrium price and organic credence investment decisions. Using standardbackward induction, we first consider two firms’ pricing decisions at the final stage. Two firmsdetermine their prices to maximize their own profits:
Optimizing these profits with respect to p1 and p2, respectively, we obtain two firms’ optimal
prices: p<O,O>1 = co + t +
13
uo(a1 − a2) and p<O,O>2 = co + t− 1
3uo(a1 − a2). By substituting the
optimal prices into two firms profit functions, we can then solve the equilibrium credence investmentdecision in the subgame (O, O), which are summarized in Proposition 2.
Proposition 2. If both firms choose to offer organic food products to customers, the equilibrium organic credence
investment decisions are: a<O,O>1 = a<O,O>
2 = 1−√
3cBuo M
, the cost of organic credence investment are
CB1 = CB2 =
√cBuo M
3, the equilibrium prices are p<O,O>
1 = p<O,O>2 = t + co, and the equilibrium profits
are π<O,O>1 = π<O,O>
2 =Mt2−√
cBuo M3
.
We can see that the equilibrium profits when both firms offering organic food products, are lessthan when both firms offering non-organic food products, and the gap is just the cost of organiccredence investment. Due to the fixed market size assumption, this observation is reasonable.As compared to non-organic food products, offering organic food products leads to additionalcompetition in credence investment, but does not increase the total demand. It can also be observedthat the additional cost of credence investment is increasing in uo and cB. The former is intuitive as
Sustainability 2017, 9, 545 9 of 23
the more customers value organic food products, the more firms would invest in organic credence.The explanation of the latter maybe that firms need to invest more in credence when it costs more.
In the subgame (O, N), where Firm 1 offers organic food products and Firm 2 offers non-organicfood products, Firm 1 needs to determine the organic credence investment at the second stage andboth firms need to determine the price at the final stage.
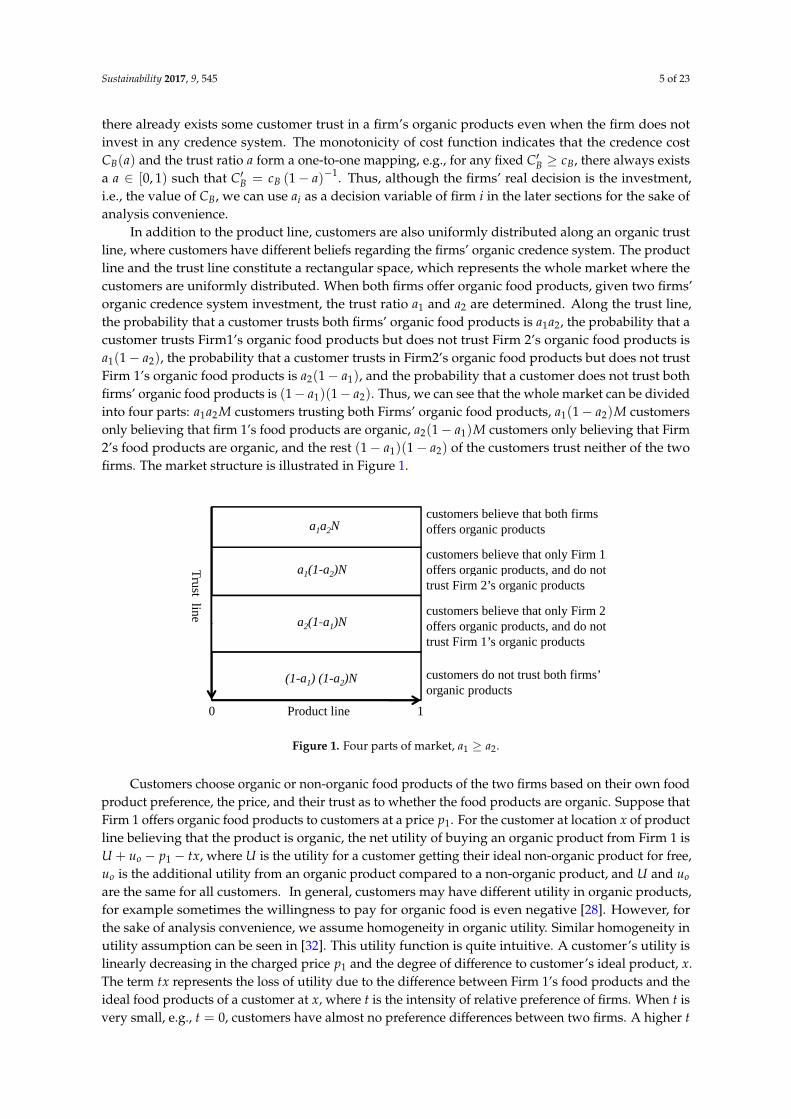
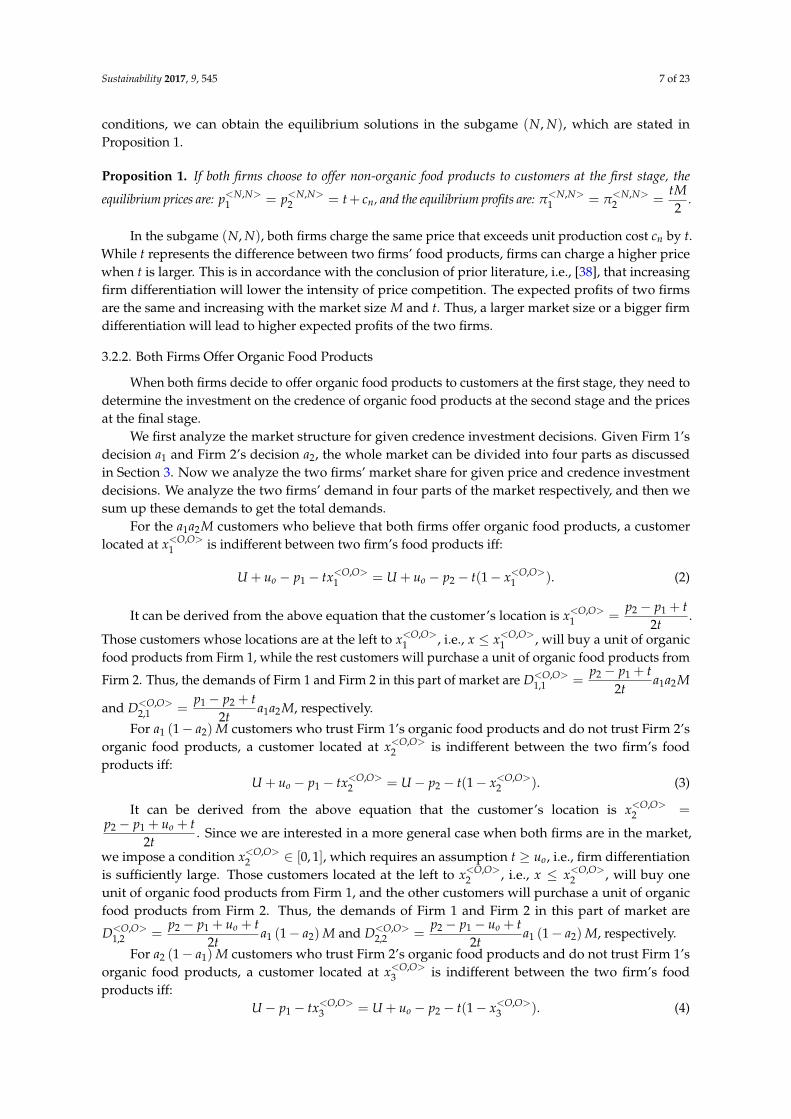
We first analyze the market structure given Firm 1’s credence investment decisions. For givena1, the whole market can be divided into two parts. a1M customers trust the organic food productsoffered by Firm 1, while (1− a1) M customers do not trust Firm 1’s organic food products, and thustreat both two firms’ food products as normal non-organic food products. The market structure isillustrated in Figure 2.
a1NT
customers believe that only Firm 1 offers organic products, and do not
1
Trust line
trust Firm 2’s organic products
(1-a1)NCustomers do not trust both firms’
i d t
Product line0 1
( 1) organic products
Figure 2. Four parts of market, a1 ≥ a2.
Following similar analysis in last subsection, we can obtain that the market share of two firms in
the first part of market are D<O,N>1,2 =
p2 − p1 + t2t
(1− a1) M and D<O,N>2,2 =
p1 − p2 + t2t
(1− a1) M,
respectively. The market share of two firms in the second part of market are D<O,N>1,2 =
p2 − p1 + t2t
(1− a1) M and D<O,N>2,2 =
p1 − p2 + t2t
(1− a1) M, respectively.The total demands of two firms are:
D<O,N>1 = D<O,N>
1,1 + D<O,N>1,2 =
M2t
(p2 − p1 + t + uoa1) , (10)
D<O,N>2 = D<O,N>
2,1 + D<O,N>2,2 =
M2t
(p1 − p2 + t− uoa1) . (11)
Now we study two firms’ optimal decisions and equilibrium outcomes. At the third stage,two firms determine price to maximize their own profits:
The first order conditions lead to the equilibrium price decisions:
p<O,N>1 = t +
13
uoa1 +23
co +13
cn, (14)
Sustainability 2017, 9, 545 10 of 23
p<O,N>2 = t− 1
3uoa1 +
13
co +23
cn. (15)
Now back to the second stage, Firm 1 makes the organic credence investment decision a1 tomaximize their profit:
π<O,N>1 =
M2t
(t +
13
uoa1 −13
c∆
)2− cB (1− a1)
−1 . (16)
From the first order condition, we can see that the optimal a∗1 satisfies:
Muo
3t
(t +
13
uoa∗1 −13
c∆
)(1− a∗1)
2 − cB = 0. (17)
Lemma 1 guarantees that there exists a unique solution for Equation (17).
Lemma 1. EquationMuo
3t
(t +
13
uoa1 −13
c∆
)(1− a1)
2 − cB = 0 has a unique solution for a1 ∈ [0, 1).
By substituting a∗1 into the expressions of equilibrium prices and profits, we can further derive allequilibrium solutions in the subgame (O, N), which are summarized in the following proposition.
Proposition 3. Let a∗1 be the solution in [0, 1) of following Equation (17). If Firm 1 offers organic food
products and Firm 2 offers non-organic food products , the equilibrium prices are p<O,N>1 = t +
13
uoa∗1 +23
co +13
cn and p<O,N>2 = t − 1
3uoa∗1 +
13
co +23
cn. Firm 1’s organic credence investment decision is
a<O,N>1 = a∗1 . The equilibrium profits are: π<O,N>
1 =M2t
(t +
13
uoa∗1 −13
c∆
)2− cB
(1− a∗1
)−1 and
π<O,N>2 =
M2t
(t− 1
3uoa∗1 +
13
c∆
)2.
Note that we do not have a closed form of a∗1 in Proposition 3, and all the equilibrium solutions aredependent on the value of a∗1 . Thus the impacts of market parameters over the equilibrium outcomesare still not clear. In the following we further uncover the impacts of market parameters over theequilibrium credence investment decision, the equilibrium prices and the equilibrium profits, whichare stated in Corollary 1.
Corollary 1. In the subgame (O, N):
1. Firm 1’s organic credence investment decision a<O,N>1 is increasing in uo and decreasing in c∆ and cB.
2. Firm 1’s equilibrium price p<O,N>1 is increasing in uo and decreasing in cB; Firm 2’s equilibrium price
p<O,N>2 is decreasing in uo and increasing in cB.
3. Firm 1’s equilibrium profit π<O,N>1 is increasing in uo and decreasing in c∆, cB; Firm 2’s equilibrium
profit π<O,N>2 is decreasing in uo and increasing in c∆, and cB.
The majority of Corollary 1 is intuitive, except one counter-intuitive result in Corollary 1-(2). It isinteresting to see that p<O,N>
1 is decreasing in cB while p<O,N>2 is increasing in cB. Usually, a higher
cost will lead to a higher price. An explanation is that cB captures the cost to make customers trustthe organic food products. A lower cB means that the firm offering organic food products is morecompetitive and thus can offer a higher price.
In Corollary 2, we compare the equilibrium solutions and market shares in different subgamesunder a general condition.
Corollary 2. If cB <Muo
3
(1− c∆
uo
)2, then:
Sustainability 2017, 9, 545 11 of 23
1. a<O,O>1 = a<O,O>
2 > a<O,N>1 .
2. the equilibrium prices in different subgames satisfy the following relationships: p<O,N>1 ≥ p<O,O>
1 =
p<O,O>2 > p<N,N>
1 = p<N,N>2 ≥ p<O,N>
2 .3. the market shares in different subgames satisfy the following relationships: D<O,N>
1 ≥ D<O,O>1 =
D<O,O>2 = D<N,N>
1 = D<N,N>2 ≥ D<O,N>
2 .
The condition cB >Muo
3
(1− c∆
uo
)2is quite general condition, which will be discussed in next
section. As CB(a) is increasing in a, Corollary 2-(1) also indicates that Firm 1 would invest more onorganic credence when only Firm 1 offers organic food products than when both firms offer organicfood products. This is an interesting result as one might expect the opposite that competitive pressureswould force firms to invest more in organic credence. The reason is that in our model, when firmsmake credence investment decisions, they can recognize its strategic effect on the price competitionof next stage. When both firms offer organic food products, investing too much in organic credenceintensifies price competition. Internalizing this effect, firms keep the equilibrium credence investmentcost low. When only one firm offers organic food products, their organic food products competes withthe rival’s non-organic food products. Although increasing the degree of competition does intensifyprices competition, but the magnitude of this effect is not the same as in the case when both firms offerorganic food products. The remaining part of Corollary 2 is quite intuitive.
3.3. Strategy Equilibrium
Now we consider two firms’ strategy choices at the first stage. We compare the outputs of allsubgames first. Define ∆1 = π<O,N>
1 − π<N,N>1 and ∆2 = π<O,N>
2 − π<O,O>2 . Notice that the sign of
∆1 (∆2) determines if Firm 1 (Firm 2) would offer organic or non-organic food products when Firm 2(Firm 1) offers non-organic (organic) food products. Thus the final equilibrium depends the signs of ∆1
and ∆2. We further rewrite ∆1 and ∆2 as follows:
∆1 =M2t
(t +
13
uoa∗1 −13
c∆
)2− cB (1− a∗1)
−1 − Mt2
, (18)
∆2 =M2t
(t− 1
3uoa∗1 +
13
c∆
)2−[
Mt2−√
cBuo M3
]. (19)
When a∗1 ≤c∆
uo, it can be seen that ∆1 < 0 and ∆2 > 0 always hold, which indicates that both
firms have no motivations to offer organic food products. To avoid such an extreme case, we need to
identify conditions ensuring a∗1 >c∆
uo. This condition is stated in Lemma 2.
Lemma 2. Let a∗1 be the solution ofMuo
3t
(t +
13
uoa1−13
c∆
)(1− a1)
2 − cB = 0. If cB <Muo
3
(1− c∆
uo
)2,
then a∗1 >c∆
uo, ∆1 < 0 and ∆2 > 0.
From Lemma 2 we have Proposition 4, which identifies a condition on organic product credenceinvestment cost under which the final equilibrium is (N, N).
Proposition 4. If cB ≥Muo
3
(1− c∆
uo
)2, ∆1 < 0 and ∆2 > 0, the equilibrium is (N, N), both firms offer
non-organic food products.
Proposition 4 shows that if the credence investment cost is sufficiently large, firms will have nomotivations offering organic food products. Note that when c∆ = 0, which is mostly favourable for
Sustainability 2017, 9, 545 12 of 23
offering organic food products, firms may still have no motivations if the credence investment is too
expensive, e.g., cB >Muo
3. Generally, production costs for organic food products are typically higher
due to restricting the use of certain pesticides and fertilizers in farming which brings the greater laborinputs, the high expense on fertility, weed control, as well as pest and disease control, etc. However,there are still several arguments that the production costs for for organic food products may be similarto those of non-organic food products. Our above result indicates that even if under the case thatproduction costs for both organic and non-organic food products are identical, firms still may notoffer organic food products. The reason is that if it is expensive to make customers trust organic foodproducts, offering organic food products still can not be competitive even if organic production costappears to have no disadvantage compared to non-organic.
Lemma 3 characterizes a condition on cB such that when c∆ = 0, ∆2 > 0, i.e., at most one firm willoffer organic food products.
Lemma 3. There exists a c∗B, such that when c∆ = 0 and cB > c∗B:
∆2 =M2t
(t− 1
3uoa∗1
)2−[
Mt2−√
cBuoM3
]> 0, (20)
where a∗1 is the solution of∆M3t
(t +
13
uoa1
)(1− a1)
2 = cB.
We can also see that c∗B is the solution of the following equations:M2t
(t− 1
3uoa1
)2−[
Mt2−√
cBuoM3
]= 0,
Muo
3t
(t +
13
uoa1
)(1− a1)
2 = cB.(21)
From Lemma 3, we have Proposition 5 which further identifies a sufficient condition of organicproduct credence investment cost under which the final equilibrium will not be (O, O).
Proposition 5. If cB > c∗B, ∆2 > 0, the equilibrium may be (N, N), (O, N) or (N, O), firms may offer organicfood products or non-organic food products, except the case that both firms offer organic food products.
Note that the conditions in Proposition 5 are independent of the value of c∆. Proposition 5further provides important managerial insights on firms strategy choices between offering organicand non-organic food products: when cB is sufficiently large, at most one firm will offer organic foodproducts, regardless of the cost of organic production. The insights from Proposition 4 and 5 areintuitive. When it is expensive to invest in organic credence, firms are less likely to offer organicfood products.
We are also interested in the impacts of organic production cost over the final equilibrium.Before introducing the main results, we have Lemma 4, which characterizes the value of ∆1 and ∆2
over different spaces of c∆.
Lemma 4. If cB <Muo
3
(1− c∆
uo
)2and cB ≤ c∗B, for c∆ ∈ [0, uo]:
(1) There exists a critical value c∗∆ such that: when c∆ ≤ c∗∆, ∆1 ≥ 0; when c∆ > c∗∆, ∆1 < 0,(2) There exists a critical value c∗∗∆ such that: when c∆ ≥ c∗∗∆ , ∆2 ≥ 0; when c∆ < c∗∗∆ , ∆2 < 0,(3) c∗∆ ≥ c∗∗∆ .
Sustainability 2017, 9, 545 13 of 23
From Lemma 4 we directly have Proposition 6, which describes how the cost difference betweenorganic and non-organic food products impacts the final equilibrium.
Proposition 6. If cB <Muo
3
(1− c∆
uo
)2and cB ≤ c∗B, then:
(1) If c∆ < c∗∗∆ , ∆1 ≥ 0, ∆2 < 0, the final equilibrium is (O, O), both firms offer organic food products.(2) If c∗∗∆ ≤ c∆ ≤ c∗∆, ∆1 ≥ 0, ∆2 ≥ 0, the final equilibrium is (O, N) or (N, O), only one firm offers organic
food products and the other firm offers non-organic food products.(3) If c∆ > c∗∆, ∆1 < 0, ∆2 > 0, the final equilibrium is (N, N), both firms offer non-organic food products.
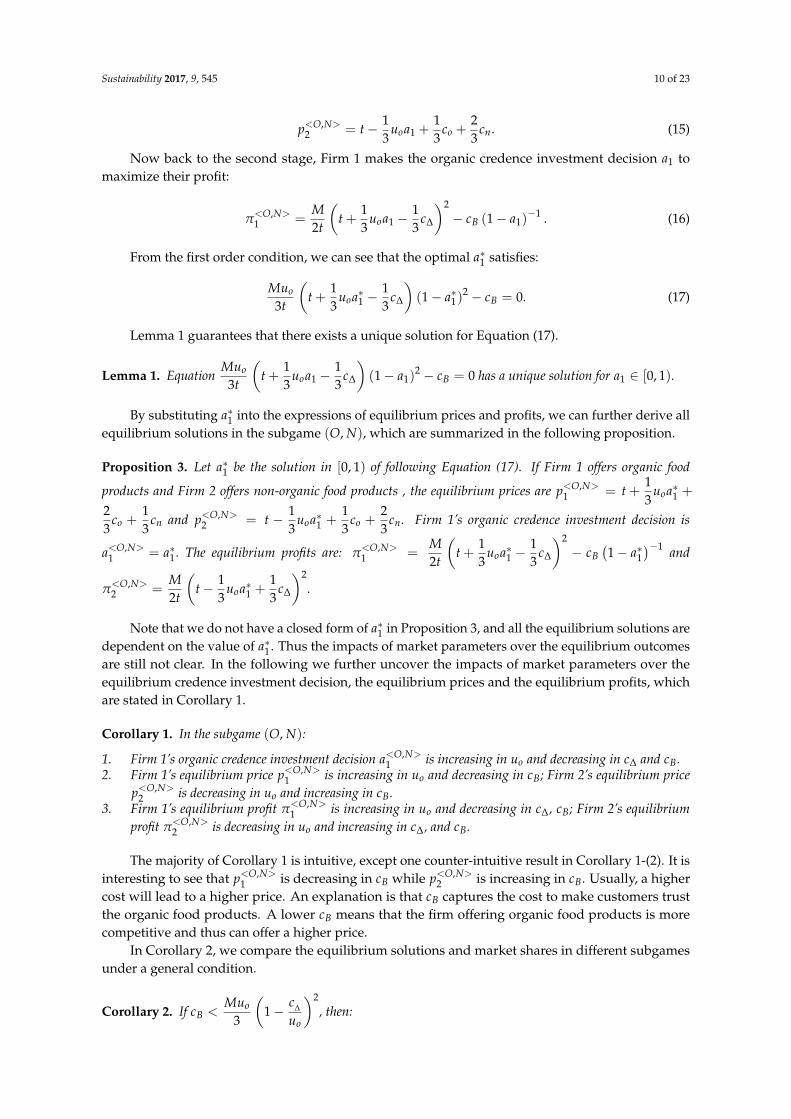
Proposition 6 has important managerial implications for firms making strategy choices betweenoffering organic and non-organic food products. For fixed organic credence investment cost, theproduction cost difference between organic and non-organic food products determines the finalequilibrium. As one may expect, firms’ choices are dependent on the production cost difference: (i) ifit is large enough, both firms will offer non-organic food products to customers; (ii) if it is moderatelylarge, only one firm offers organic food products to customers; (iii) if it is relatively low, both firms offerorganic food products to customers. These observations are consistent with the practice in industry.In 2014, a lot of organic food producers in Wuhan China abandoned organic production due to thehigh organic production costs [39].
4. The Impacts of Market Conditions on the Final Equilibrium
In this section, we numerically investigate the impacts of organic credence cost and organicproduct attractiveness on the final equilibrium. In these numerical studies, the basic model parametersare set as follows unless stated: M = 100, t = 10, uo = 3, c∆ = 0.5, cB = 20. Note these parameters
satisfy the condition cB <Muo
3
(1− c∆
uo
)2, as well as the required assumptions.
4.1. The Impacts of Organic Food Production Cost
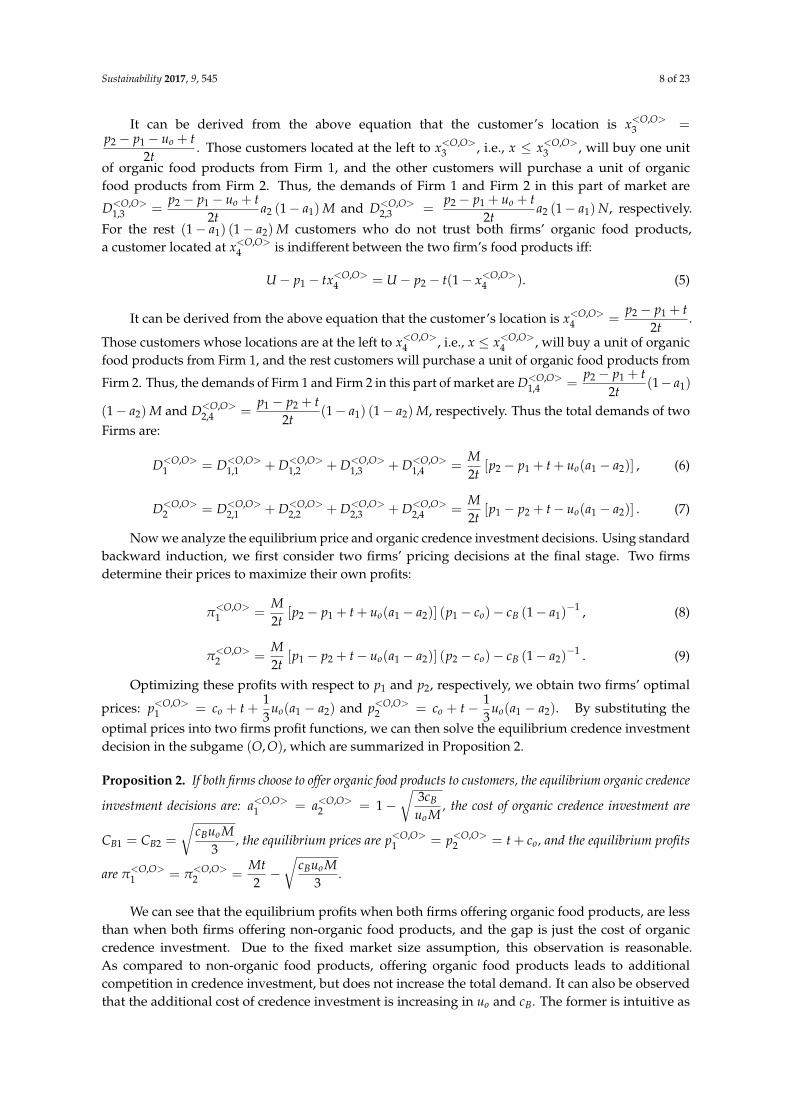
The effect of changing c∆ on final equilibrium is illustrated in Figure 3.
25
20
25
∆
10
15∆2
0
5
10
-5*c Δ
**c Δ
-15
-10
∆1
0 0.1 0.2 0.3 0.4 0.5 0.6 0.7 0.8 0.9 1-25
-20
c∆
Figure 3. Organic product cost difference and the final equilibrium.
The values of c∗∆ and c∗∗∆ in Proposition 6 can be found in Figure 3. When c∆ > c∗∆, π<O,N>1 <
π<N,N>1 and π<O,N>
2 > π<O,O>2 , if any firm offers organic food products rather than non-organic food
products, they will only earn a lower profit no matter what strategy its rival takes. Therefore, both firmsprefer to offer non-organic food products to customers. When c∗∗∆ ≤ c∆ ≤ c∗∆, π<O,N>
1 ≥ π<N,N>1 and
π<O,N>2 ≥ π<O,O>
2 , if any one firm offers organic (non-organic) food products, the other firm will prefer
Sustainability 2017, 9, 545 14 of 23
to offer non-organic (organic) food products. Consequently, the equilibrium is (O, N) or (N, O). Whenc∆ < c∗∗∆ , π<O,N>
1 > π<N,N>1 and π<O,N>
2 < π<O,O>2 , if any firm offers non-organic food products, the
other firm will prefer to offer organic food products since π<N,O>2 = π<O,N>
1 > π<N,N>1 = π<N,N>
2 ;while if any firm offers organic food products, the other firm will not like to offer non-organic foodproducts since π<N,O>
1 = π<O,N>2 < π<O,O>
2 = π<O,N>1 . Thus in this situation, both firms will offer
organic food products.
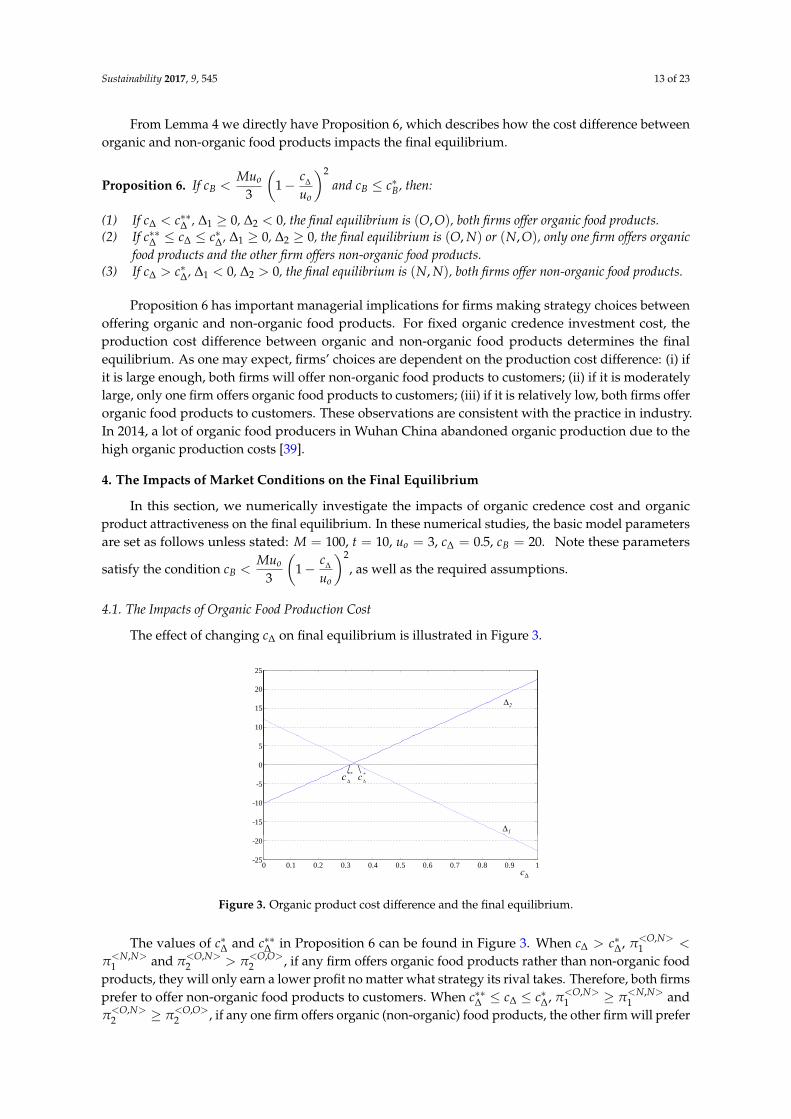
4.2. The Impacts of Organic Food Products’ Credence Investment Cost
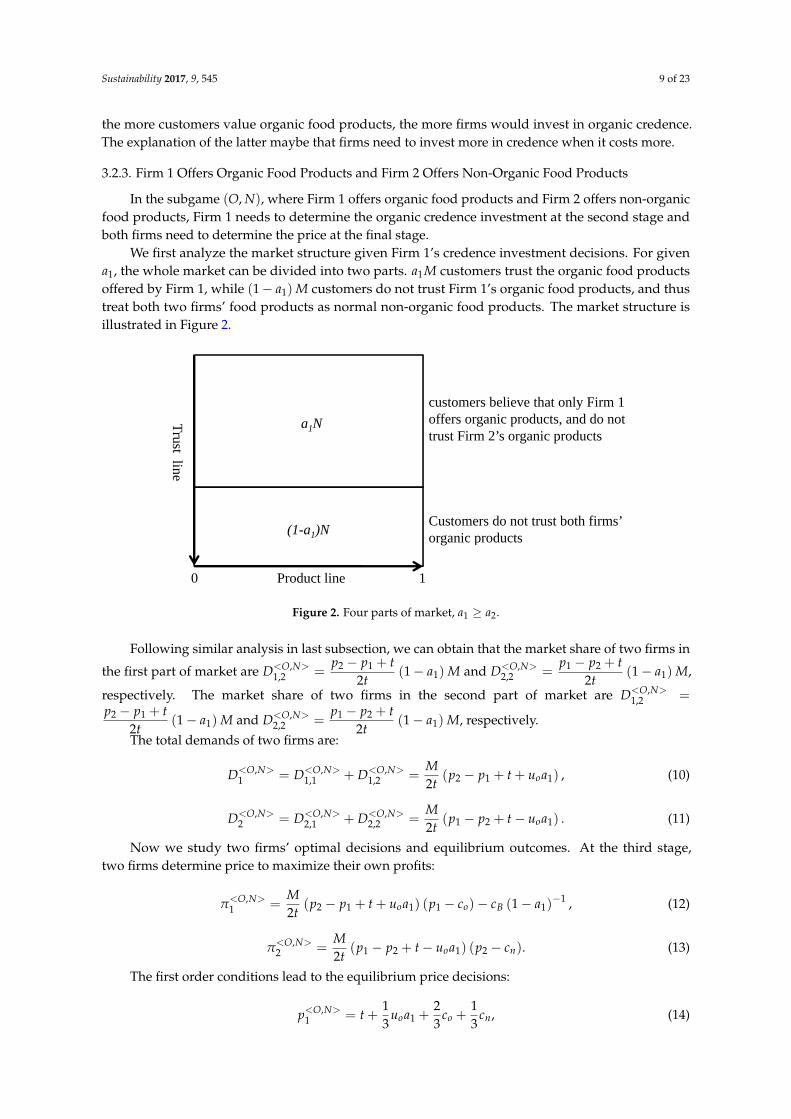
To understand the impacts of organic product credence investment cost cB on the final equilibrium,we illustrate the relationship between ∆1, ∆2 and cB in Figure 4.
10
8
10
4
6∆2
0
2
4
-2*Bc
**Bc
-6
-4∆1
14 15 16 17 18 19 20-10
-8
cB
Figure 4. Organic product credence investment cost and the final equilibrium.
We can observe that as cB increases, ∆1 decreases and ∆2 increases. Figure 4 also shows that thereare two threshold values c∗B and c∗∗B of organic product credence investment cost such that: (i) if theorganic product credence investment cost is small (cB < c∗∗B ), ∆1 > 0 and ∆2 < 0, both firms offerorganic food products to customers, and the final equilibrium is (O, O); (ii) if the organic productcredence investment cost is moderately big (c∗∗B ≤ cB ≤ c∗B), ∆1 > 0 and ∆2 > 0, one firm offers organicfood products and the other firm offers non-organic food products to customers, the final equilibriumis (O, N) or (N, O); (iii) if the market size is relatively big (cB > c∗B), ∆1 < 0 and ∆2 > 0, both firms offernon-organic food products to customers, and the final equilibrium is (N, N). As cB refers to the cost oforganic food products’ credence investment, it is easy to understand that when organic food products’credence investment is expensive, offering organic food products becomes a less competitive choice.
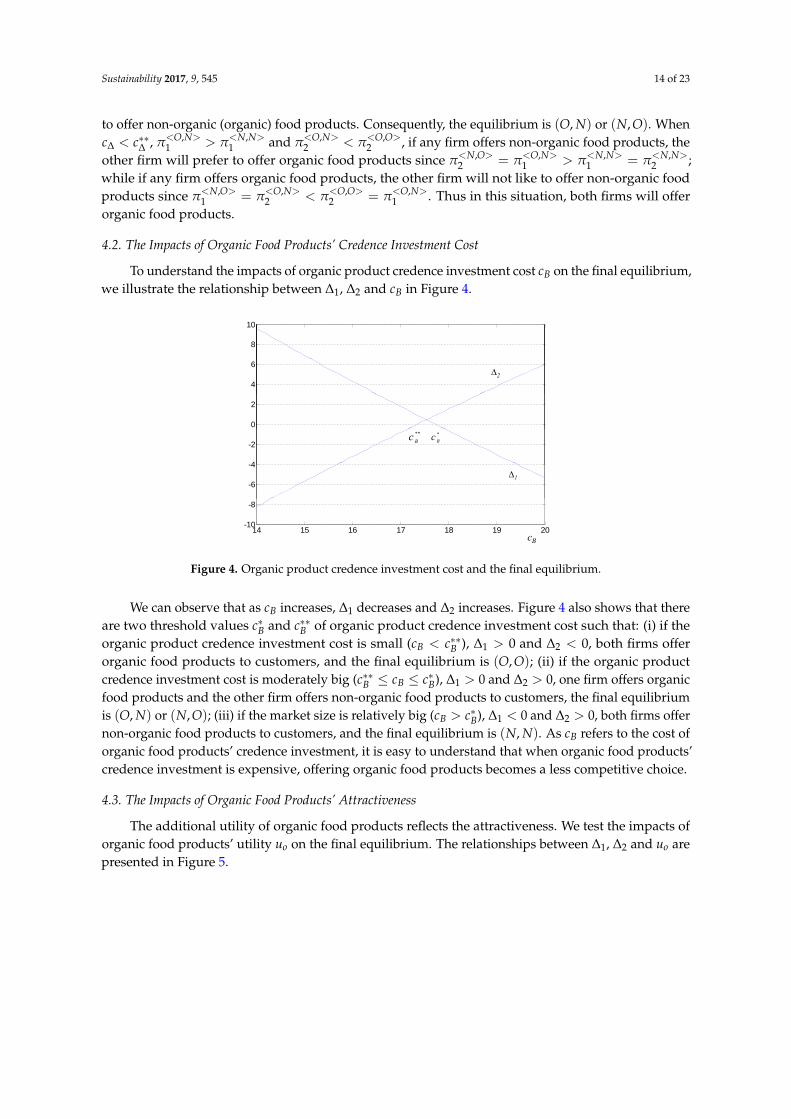
4.3. The Impacts of Organic Food Products’ Attractiveness
The additional utility of organic food products reflects the attractiveness. We test the impacts oforganic food products’ utility uo on the final equilibrium. The relationships between ∆1, ∆2 and uo arepresented in Figure 5.
Sustainability 2017, 9, 545 15 of 23
8
6
8
4∆1
2
0*ou **
ou
-4
-2∆2
3 3.1 3.2 3.3 3.4 3.5-6
uo
Figure 5. Utility of organic product and the final equilibrium.
Figure 5 shows that as uo increases, ∆1 increases and ∆2 decreases. We can observe that there aretwo threshold values u∗o and u∗∗o such that: (i) if the utility of the organic product is small (uo < u∗o ),∆1 < 0 and ∆2 > 0, both firms offer non-organic food products to customers, and the final equilibriumis (N, N); (ii) if the utility of the organic product is moderately big (u∗o ≤ uo ≤ u∗∗o ) , ∆1 > 0 and∆2 > 0, one firm offers organic food products and the other firm offers non-organic food products tocustomers, the final equilibrium is (O, N) or (N, O); (iii) if the utility of the organic product is relativelybig (uo > u∗∗o ), ∆1 > 0 and ∆2 < 0, both firms offer organic food products to customers, and the finalequilibrium is (O, O). This result is very intuitive. If customers’ utility over organic food products arehigh, offering organic food products becomes a more competitive choice. This explains why we tendto see less organic food products in the clothing industry than in the food industry, especially the babyfood industry, where safety and health are key concerns.
5. Discussion and Conclusions
In this paper, we study competition between two firms to investigate their strategy choices inoffering organic and non-organic food products. The two firms compete for customers through theirchoices of production type, organic credence investment and price. Consumers have heterogeneouspreferences for firms as well as heterogeneous sensitivity to organic credence investment. The mainresults we found are as follows: (1) We show that in equilibrium, whether firms choose to offer organicor non-organic food products depends on the cost efficiencies of production and organic credenceinvestment. The higher the production cost or credence investment costs for organic food productsare, the more likely firms would choose to offer non-organic food products. Furthermore, we findthat if it is expensive enough to invest in organic credence, offering organic food products may stillbe uncompetitive, even if organic production cost appears to have no disadvantage compared tothe non-organic case; (2) We also find that when only one firm offers organic products, they tend tooffer a relatively low price if organic credence investment is expensive. Usually, a higher cost willlead to a higher price. An explanation for this is that if it is expensive to make customers trust theorganic credence system, the firm offering organic food products is less competitive and thus canonly offer a lower price; (3) Besides, we find that when only one firm offers organic products, theinvestment on organic credence is higher than when both firms offer organic products. This is differentfrom our intuition that competitive pressures would force firms to invest more in organic credence.The explanation for this is that when both firms offer organic food products, investing too muchin organic credence intensifies price competition. Thus, firms may keep the equilibrium credenceinvestment cost low to internalize this effect. When only one firm offers organic food products, theirorganic food products competes with the rival’s non-organic food products. Although increasing the
Sustainability 2017, 9, 545 16 of 23
degree of competition does intensify price competition, the magnitude of this effect is not the same asin the case when both firms offer organic food products.
The main value of this model is that our results illustrate the key points of organic production,credence investment and pricing in determining whether a firm should offer organic food products.As the organic industry is growing in both length and breadth, the importance of exploring the thebusiness of organic food products will only increase. It is thus our hope that this work can help firmsunderstand when to offer organic or non-organic food products and how much firms should invest intheir own credence systems.
Our study has some limitations. First, in our model we assume that without firms’ own credencesystem investment, no customers will trust a firm’s organic products. While in general, the publicinvestment in certified labeling system can influence customers’ trust even firms do not invest theirown credence system. Thus an important future research direction is considering an existing levelof public trust on the market, and study the impacts of the public investment in certified labeling onfirms’ decisions. Second, we assume that the additional utility of organic products is the same for thecustomers who trust organic products. In general, even the customers trusting organic products mayhave different interests in organic products. Assuming heterogeneity in organic utility may lead tomore interesting results, which is a potential future research path. Third, we assume that the market isfully covered. Relaxing this assumption may leads to more insights. For example, in equilibrium, firmsmay tend to offer low prices or invest a lot in organic credence in order to attract more customers.
Acknowledgments: This work was in part supported by Humanity and Social Science Youth Research Foundationof Ministry of Education of China (16YJC790157), the PHC Cai Yuanpei Program (34644SB), the PHC Xu GuangqiProgram (30064QD), the Key Program of the National Natural Science Foundation of China (71333008), theFundamental Research Funds for the Central Universities (SKCX2015002), the Qing Lan Project, a project fundedby the Priority Academic Program Development of Jiangsu Higher Education Institutions (PAPD), Center forFood Economics and Management-Nanjing Agricultural University; the Natural Science Foundation of ZhejiangProvince (GK150901204027), Hangzhou Dianzi University “Management science and engineering”, Humanitiesand Social Sciences key research university base in Zhejiang Province (ZX140204304001/012), National SocialScience Fund (15BGL100), and Research Center of Information Technology & Economic and Social Development.
Author Contributions: Yi Wang and Zhanguo Zhu conceived, designed, and conducted the research;Zhanguo Zhu, Yi Wang and Feng Chu wrote the paper.
Conflicts of Interest: The authors declare no conflict of interest.
Appendix A
Appendix A.1. Proof of Lemma 1
Let G(a) =Muo
3t
(t +
13
uoa1−13
c∆
)(1− a1)
2− cB. We firstly show G(a) is monotone decreasing.
G′(a) =Muo
3t
[13
uo (1− a1)2− 2
(t +
13
uoa1−13
c∆
)(1− a1)
]
=Muo
3t
[13
uo − uoa1− 2t +23
c∆
](1− a1)
≤ 0,
where the final inequality follows from condition a ∈ [0, 1), assumptions t ≥ uo and uo ≥ c∆.
Besides, we can see G(1) = −cB < 0 and G(0) =uoM
3t
(t− 1
3c∆
)− cB ≥ 0. Thus there exists a a1
such that G(a1) = 0.
Appendix A.2. Proof of Corollary 1
Proof of Corollary 1-(1). To prove Corollary 1-(1), we first need Lemma A1, which present somestructure characters of Firm 1’s objective function π<O,N>
1 in Equation (16).
Sustainability 2017, 9, 545 17 of 23
Lemma A1. In the subgame (O, N), Firm 1’s profit π<O,N>1 is supermodular on a1 and uo; Firm 1’s profit
π<O,N>1 is submodular on a1 and c∆; Firm 1’s profit π<O,N>
1 is submodular on organic product credenceinvestment a1 and cB.
Proof of Lemma A1. By differentiating π<O,N>1 on a1 and uo, we have:
∂2π<O,N>1
∂a1∂uo=
M3t
(t +
13
uoa1−13
c∆
)+
M9t
uoa1 > 0.
By differentiating π<O,N>1 on a1 and c∆, we have:
∂2π<O,N>1
∂a1∂c∆= −∆M
9t< 0.
By differentiating π<O,N>1 on a1 and cB, we have:
∂2π<O,N>1
∂a1∂cB= −
(1− a∗1
)−2< 0.
Thus Lemma A1 holds.
The profit function is supermodular on a1 and uo implies that the firm’s additional profit from anadditional increasing in customer’s trust ration, is increasing in customers’ utility towards organic
products, e.g.,∂π<O,N>
1∂a1
is increasing in uo. This property further indicates that the maximizer a∗1is increasing in uo. While the submodularity implies that the additional profit from an additionalincreasing in customer’s trust ratio, is decreasing in the other variable. Which further indicatesthat the maximizer a∗1 is decreasing in the other variable. From Lemma A1, we can directly obtainCorollary 1-(1) [40].
Proof of Corollary 1-(2). From the proof of Corollary 1-(1) we have∂a∗1∂uo
> 0 and∂a∗1∂cB
< 0.
By differentiating p<O,N>1 on uo and cB, we have
∂p<O,N>1∂uo
=13
a∗1 +13
uo∂a∗1∂uo
> 0,
∂p<O,N>1∂cB
=13
uo∂a∗1∂cB
< 0.
By differentiating p<O,N>2 on uo and cB, we have
∂p<O,N>2∂uo
= −13
a∗1 −13
uo∂a∗1∂uo
< 0,
∂p<O,N>2∂cB
= −13
uo∂a∗1∂cB
> 0.
Thus Corollary 1-(2) holds.
Proof of Corollary 1-(3). By differentiating π<O,N>1 and π<O,N>
2 on uo, c∆ and cB, we have:
∂π<O,N>1∂uo
=Mt
(t +
13
uoa∗1 −13
c∆
)(13
a∗1 +uo
3∂a∗1∂uo
)> 0,
∂π<O,N>1∂c∆
=Mt
(t +
13
uoa∗1 −13
c∆
)(13− uo
3∂a∗1∂c∆
)> 0,
∂π<O,N>1∂cB
=Mt
(t +
13
uoa∗1 −13
c∆
)uo
3∂a∗1∂cB−[(
1− a∗1)−1− cB
(1− a∗1
)−2 ∂a∗1∂cB
]< 0,
Sustainability 2017, 9, 545 18 of 23
∂π<O,N>2∂uo
=Mt
(t− 1
3uoa∗1 +
13
c∆
)(−1
3a∗1 −
uo
3∂a∗1∂uo
)< 0,
∂π<O,N>1∂c∆
=Mt
(t− 1
3uoa∗1 +
13
c∆
)(−1
3+
uo
3∂a∗1∂c∆
)< 0,
∂π<O,N>1∂cB
=Mt
(t− 1
3uoa∗1 +
13
c∆
)(−uo
3∂a∗1∂cB
)> 0.
The inequalities follow from condition a ∈ [0, 1), assumptions t ≥ uo ≥ c∆ and Corollary 2 thata<O,N>
1 is increasing in uo and decreasing in c∆ and cB.Thus Corollary 1-(3) holds.
Appendix A.3. Proof of Corollary 2
Proof of Corollary 2-(1). We already have a<O,O>1 = a<O,O>
2 , now we show a<O,O>1 > a<O,N>
1 .
We have shown that G(a) =Muo
3t
(t +
13
uoa1−13
c∆
)(1− a1)
2− cB is decreasing in a in the proof of
Lemma 1. To prove a<O,O>1 > a<O,N>
1 , it is sufficient to show G(a<O,O>1 ) < G(a<O,N>
1 ). From a<O,O>1 =
a<O,O>2 = 1−
√3cB
uoM, we have
G(a<O,O>1 ) =
Muo
3t
[t +
13
uo
(1−
√3cB
uoM
)− 1
3c∆
]3cB
uoM− cB
=cBt
(13
uo −13
c∆
)− cBuo
3t
√3cB
uoM
<cBt
(13
uo −13
c∆
)− cBuo
3t
√3
uoMMuo
3
(1− c∆
uo
)2
= 0 = G(a<O,N>1 ).
where the inequality follows from condition cB >Muo
3
(1− c∆
uo
)2, and the final equality follows from
a<O,N>1 = a∗1 . Thus Corollary 2-(1) holds.
Proof of Corollary 2-(2). From Lemma 2, we know that a∗1 ≥c∆
uo. Thus we have:
p<O,N>1 = t +
13
uoa∗1 +23
co +13
cn
= t +13
uoa∗1 −13
c∆ + co
≥ t + co = p<O,O>1 = p<O,O>
2 .
p<O,N>2 = t− 1
3uoa∗1 +
13
co +23
cn
= t− 13
uoa∗1 +13
c∆ + cn
≤ t + cn = p<N,N>1 = p<N,N>
2 .
Besides, we can directly see that p<N,N>2 ≤ p<O,O>
2 . Thus Corollary 2-(2) holds.
Proof of Corollary 2-(3). We can see that D<N,N>1 = D<N,N>
2 = D<O,O>1 = D<O,O>
1 = M/2.From Equations (10) and (11) we can see D<O,N>
1 + D<O,N>2 = M. Now it is sufficient to
show D<O,N>1 > D<O,N>
2 . By substituting the price and credence investment decision of
Proposition 2 into (10) and (11), we have: D<O,N>1 =
M2t
(13
uoa∗1 −13
c∆ + t)≥ M
2, and
Sustainability 2017, 9, 545 19 of 23
D<O,N>2 =
M2t
(−1
3uoa∗1 +
13
c∆ + t)≤ M
2, where the inequalities follow from condition a∗1 ≥
c∆
uo.
Thus Corollary 2-(3) holds.
Appendix A.4. Proof of Lemma 2
We have shown that a∗1 is decreasing in cB in Corollary 1. Note that a1 =c∆
uois the solution
ofMuo
3t
(t +
13
uoa∗1 −13
c∆
)(1− a∗1
)2 − cB = 0 when cB =Muo
3
(1− c∆
uo
)2. Thus when cB >
Muo
3
(1− c∆
uo
)2, a1 <
c∆
uo. When a1 <
c∆
uo, we can see ∆1 =
M2t
(t +
13
uoa∗1 −13
c∆
)2− cB
(1− a∗1
)−1−
Mt2
< −cB(1− a∗1
)−1< 0 and ∆2 =
M2t
(t− 1
3uoa∗1 +
13
c∆
)2−[
Mt2−√
cBuoM3
]>
√cBuoM
3> 0.
Appendix A.5. Proof of Lemma 3
For simplicity, we use ∆i(c∆) to signify the dependence of ∆i on c∆, for i = 1, 2.
Let F(cB) = ∆2(0) =M2t
(t− 1
3uoa∗1
)2−[
Mt2−√
cBMuo
3
]. We can see that F(0) =
M2t
(t− 1
3uo
)2− Mt
2< 0, and F
(Muo
3
)=
M2t
(t)2−[
Mt2− Muo
3
]> 0.
Now we show that F(cB) is increasing in cB. By differentiate the both sides of Equation (17) on cB,we have:
Muo
3t13
uo
(∂a1
∂cB
)(1− a1)
2 +Muo
3t
(t +
13
uoa1
)2 (1− a1) (−
∂a1
∂cB) = 1,
Muo
3t(1− a1)
∂a1
∂cB
[13
uo − uoa1− 2t]= 1.
We can see that13
uo − uoa1− 2t < 0, thus∂a1
∂cB< 0.
Now we check the signs of F′(cB). F′(cB) =2M2t
(t− 1
3uoa∗1
)(−1
3uo
∂a1
∂cB) +
12
√Muo
3cB≥ 0.
Thus there exists a c∗B ∈ [0,Muo
3], such that F(c∗B) = 0.
Appendix A.6. Proof of Proposition 5
From Lemma 4, we know when c∆ = 0 and cB > c∗B, ∆2 > 0. Now it is sufficient toshow that ∆2 (c∆) is increasing in c∆. Evaluating the derivative of ∆1 with respect to c∆ we have∂∆2
∂c∆=
Mt
(t− 1
3uoa∗1 +
13
c∆
)(13− uo
3∂a∗1∂c∆
).
As a∗1 is the solution of equationuoM
3t
(t +
13
uoa1−13
c∆
)(1− a1)
2 = cB. By taking derivatives
on c∆ we have:
uoM3t
(13
uo∂a∗1∂c∆− 1
3
)(1− a1)
2 +uoM
3t
(t +
13
uoa1−13
c∆
)2(1− a1)(−
∂a∗1∂c∆
) = 0.
With some algebra transformation, above equation leads to:
∂a∗1∂c∆
=
13(1− a1)[
uo
3− 2t− uoa1 +
23
c∆
] < 0.
Sustainability 2017, 9, 545 20 of 23
Thus∂∆2
∂c∆=
Mt
(t− 1
3uoa∗1 +
13
c∆
)(13− uo
3∂a∗1∂c∆
)> 0, which shows that ∆2 (c∆) is increasing in
c∆ for c∆ ∈ [0, uo]. Thus ∆2 (c∆) ≥ ∆2 (0) > 0.
Appendix A.7. Proof of Lemma 4
We sequentially prove Lemma 4-(2), Lemma 4-(1) and Lemma 4-(3) as follows:
Proof of Lemma 4-(2). It is sufficient to prove that: (i) that ∆2 (c∆) is increasing in c∆; (ii) ∆2(0) ≤ 0;and (iii) ∆2(uo) > 0.
(i) We have shown this in the proof of Proposition 5.(ii) From the proof of Lemma 3, we know that F(cB) = ∆2(0) is increasing in cB. Besides, when
Furthermore, as ∆2 (c∆) is a continuous function, we can conclude that Lemma 4-(2) holds. Besides,we can see that c∗∗∆ is the value under which ∆2
(c∗∗∆)= 0.
Proof of Lemma 4-(1). It is sufficient to prove that: (i) ∆1 (c∆) is decreasing in c∆ for c∆ ∈ [0, uo];(ii) there exists a c∆ such that ∆1 (c∆) ≥ 0; and (iii) ∆1 (uo) ≤ 0.
(i) Evaluating the derivatives of ∆1 (c∆) with respect to c∆ we have the following equations:
∂∆1
∂c∆=
2M2t
(t +
13
uoa∗1 −13
c∆
)(uo
3∂a∗1∂c∆− 1
3
)− cB
(1− a∗1
)−2 ∂a∗1∂c∆
=
[Mt
(t +
13
uoa∗1 −13
c∆
)uo
3− cB
(1− a∗1
)−2]
∂a∗1∂c∆− M
3t
(t +
13
uoa∗1 −13
c∆
)= −M
3t
(t +
13
uoa∗1 −13
c∆
)< 0,
which shows that ∆1 (c∆) is decreasing in c∆ for c∆ ∈ [0, uo].(ii) We will show that ∆1
(c∗∗∆)≥ 0.
Note that ∆2(c∗∗∆)
= 0, thus we haveM2t
(t− 1
3uoa∗1 +
13
c∗∗∆
)2−[
Mt2−√
cBuoM3
]= 0.
Besides, a∗1 is the solution of equation∆M3t
(t +
13
uoa∗1 −13
c∗∗∆
)− cB
(1− a∗1
)−2= 0. Let S(c∆) =
13
uoa∗1 +13
c∆
t. We can see that 0 ≤ S(c∆) < 1.
From Condition 2, 1 − a∗1 =
√3cB
uoM(1+ S(c∗∗∆ )
) . From Condition 1, we have
√cBuoM
3=
Mt2(2S(c∗∗∆ )− S(c∗∗∆ )2) .
Sustainability 2017, 9, 545 21 of 23
Thus we have
∆1(c∗∗∆ ) =Mt2(2S(c∗∗∆ ) + S(c∗∗∆ )2)−√ cBuoM
(1+ S(c∗∗∆ )
)3
=Mt2(2S(c∗∗∆ ) + S(c∗∗∆ )2)−{[Mt
2(2S(c∗∗∆ )− S(c∗∗∆ )2)]√(1+ S(c∗∗∆ )
)}=
Mt2(2S(c∗∗∆ ) + S(c∗∗∆ )2)−{[Mt
2(2S(c∗∗∆ )− S(c∗∗∆ )2)]√(1+ S(c∗∗∆ )
)}=
MtS(c∗∗∆ )
2
{(2+ S(c∗∗∆ )
)−[(
2− S(c∗∗∆ ))]√(
1+ S(c∗∗∆ ))}
.
To show ∆1(c∗∗∆ ) ≥ 0, it is sufficient to show(2+ S(c∗∗∆ )
)≥[(
2− S(c∗∗∆ ))]√(
1+ S(c∗∗∆ )).
Note both sides are positive, we square two sides and have 4+ 2S(c∗∗∆ ) + S(c∗∗∆ )2 ≥ 4+ 2S(c∗∗∆ )−S(c∗∗∆ )2 + S(c∗∗∆ )3, which apparently holds for 0 ≤ S(c∆) < 1. Thus ∆1(c∗∗∆ ) ≥ 0
(iii) ∆1 (uo) =M2t
(t +
13
uoa∗1 −13
uo
)2− cB
(1− a∗1
)−1− Mt2
≤ M2t
t2− cB(1− a∗1
)−1− Mt2
≤ 0.
Furthermore, as ∆1 (c∆) is a continuous function, we can conclude that Lemma 4-(1) holds. Besides,we can see that c∗∆ is the value under which ∆1
(c∗∆)= 0.
Proof of Lemma 4-(3). From proof of Lemma 4-(2) we know that ∆1 (c∆) is decreasing in c∆ and∆1(c∗∆)= 0. Thus to prove c∗∆ ≥ c∗∗∆ , it is sufficient to prove that ∆1
(c∗∗∆)≥ 0 = ∆1
(c∗∆), which we
have shown in the proof of Lemma 4-(1).Thus Lemma 4 holds.
References
1. Cunha, L.M.; Moura, A.D. Conflicting demands of agricultural production and environmental conservation:Consumers’ perception of the quality and safety of food. In Ecological Agriculture and Rural Developmentin Central and Eastern European Countries; Filho, W.L., Ed.; Nato Science Series; IOS Press: Amsterdam,The Netherlands, 2004; pp. 137–157.
2. Global Organic Sales Reach $63 Billion, U.S. Is Largest Market; Ag Professional; Advancing Eco Agriculture:Middlefield, OH, USA, 2013.
3. Cavaliere, A.; Peri, M.; Banterle, A. Vertical coordination in organic food chains: A survey based analysis inFrance, Italy and Spain. Sustainability 2016, 8, 569.
4. Brzezina, N.; Kopainsky, B.; Mathijs, E. Can organic farming reduce vulnerabilities and enhance the resilienceof the European food system? A critical assessment using system dynamics structural thinking tools.Sustainability 2016, 8, 971; doi:10.3390/su8100971.
5. Winter, C.K.; Davis, S.F. Organic foods. J. Food Sci. 2006, 71, R117–R124.6. Seufert, V.; Ramankutty, N.; Foley, J.A. Comparing the yields of organic and conventional agriculture. Nature
2012, 485, 229–232.7. Nuttavuthisit, K.; Thøgersen, J. The importance of consumer trust for the emergence of a market for green
food products: The case of organic food. J. Bus. Ethics 2015, 140, 323–337 .8. Choe, Y.C.; Park, J.; Chung, M.; Moon, J. Effect of the food traceability system for building trust: Price
premium and buying behavior. Inf. Syst. Front. 2008, 11, 167–179.9. Pivato, S.; Misani, N.; Tencati, A. The impact of corporate social responsibility on consumer trust: The case
of organic food. Bus. Ethics Eur. Rev. 2008, 17, 3–12.10. Hotelling, H. Stability in competition. Econ. J. 1929, 39, 41–57.11. Läpple, D.; Kelley, H. Understanding the uptake of organic farming: Accounting for heterogeneities among
Irish farmers. Ecol. Econ. 2013, 88, 11–19.
Sustainability 2017, 9, 545 22 of 23
12. Serra, T.; Zilberman, D.; Gil, J.M. Differential uncertainties and risk attitudes between conventional andorganic producers: The case of Spanish arable crop farmers. Agric. Econ. 2008, 39, 219–229.
14. Läpple, D. Adoption and abandonment of organic farming: An empirical investigation of the Irish drystocksector. J. Agric. Econ. 2010, 61, 697–714.
15. Vollmer, E.; Hermann, D.; Musshoff, O. An experimental approach to the investment timing of conventionaland organic Hog farmers. Can. J. Agric. Econ./Rev. Can. D’agroeconomie 2016, doi:10.1111/cjag.12122.
16. Acs, S.; Berentsen, P.; Huirne, R.; van Asseldonk, M. Effect of yield and price risk on conversion fromconventional to organic farming. Aust. J. Agric. Resour. Econ. 2009, 53, 393–411.
17. Doernberg, A.; Zasada, I.; Bruszewska, K.; Skoczowski, B.; Piorr, A. Potentials and limitations of regionalorganic food supply: A qualitative analysis of two food chain types in the Berlin metropolitan region.Sustainability 2016, 8, 1125.
18. Vindigni, G.; Janssen, M.A.; Jager, W. Organic food consumption: A multi-theoretical framework of consumerdecision making. Br. Food J. 2002, 104, 624–642.
19. Verhoef, P.C. Explaining purchases of organic meat by Dutch consumers. Eur. Rev. Agric. Econ. 2005, 32,245–267.
20. Onyango, B.M.; Hallman, W.K.; Bellows, A.C. Purchasing organic food in US food systems: A study ofattitudes and practice. Br. Food J. 2007, 109, 399–411.
21. Barnes, A.P.; Vergunst, P.; Topp, K. Assessing the consumer perception of the term “organic”: A citizens’ juryapproach. Br. Food J. 2009, 111, 155–164.
22. Nasir, V.A.; Karakaya, F. Underlying motivations of organic food purchase intentions. Agribusiness 2014, 30,290–308.
23. Aertsens, J.; Verbeke, W.; Mondelaers, K.; Van Huylenbroeck, G. Personal determinants of organic foodconsumption: A review. Br. Food J. 2009, 111, 1140–1167.
24. Schneider, F.; Stolze, M.; Kriege-Steffen, A.; Lohscheidt, J.; Boland, H. How can consumer trust in organicfood products be enhanced? In Ethical Futures: Bioscience and Food Horizont, Proceedings of the EurSafe 2009Nottingham, Nottingham, UK, 2–4 July 2009; Wageningen Academic Publishers: Wageningen, The Netherlands,2009; pp. 271–276.
25. Padel, S.; Foster, C. Exploring the gap between attitudes and behaviour: Understanding why consumers buyor do not buy organic food. Br. Food J. 2005, 107, 606–625.
26. Hamzaoui Essoussi, L.; Zahaf, M. Exploring the decision-making process of Canadian organic foodconsumers: Motivations and trust issues. Qual. Mark. Res. Int. J. 2009, 12, 443–459.
27. Jensen, K.D.; Denver, S.; Zanoli, R. Actual and potential development of consumer demand on the organicfood market in Europe. NJAS Wagening. J. Life Sci. 2011, 58, 79–84.
28. Rousseau, S. The role of organic and fair trade labels when choosing chocolate. Food Qual. Preference 2015, 44,92–100.
29. McCluskey, J. A game theoretic approach to organic foods: An analysis of asymmetric information andpolicy. Agric. Resour. Econ. Rev. 2000, 29, 1–9.
30. Amacher, G.S.; Koskela, E.; Ollikainen, M. Environmental quality competition and eco-labeling. J. Environ.Econ. Manag. 2004, 47, 284–306.
31. Baksi, S.; Bose, P. Credence goods, efficient labelling policies, and regulatory enforcement. Environ. Resour. Econ.2007, 37, 411–430.
32. Bonroy, O.; Constantatos, C. On the use of labels in credence goods markets. J. Regul. Econ. 2008, 33, 237–252.33. Bonroy, O.; Constantatos, C. On the economics of labels: How their introduction affects the functioning of
markets and the welfare of all participants. Am. J. Agric. Econ. 2015, 97, 239–259.34. Gabszewicz, J.J.; Thisse, J.F. Handbook of Game Theory with Economic Applications; Elsevier: Amsterdam,
The Netherlands, 1992; Volume 1, pp. 281–304.35. Syam, N.B.; Kumar, N. On customized goods, standard goods, and competition. Mark. Sci. 2006, 25, 525–537.36. Xia, N.; Rajagopalan, S. Standard vs. custom food products: Variety, lead time, and price competition.
Mark. Sci. 2009, 28, 887–900.37. Post, E.; Schahczenski, J. Understanding Organic Pricing and Costs of Production; National Sustainable
Agriculture Information Service: Butte, MT, USA, 2012.
Sustainability 2017, 9, 545 23 of 23
38. Daniel M.B. Product differentiation, competition, and international trade. Can. J. Econ. 2001, 34, 1010–1023.39. Hard for Organic Food in Wuhan: Difficult to Make Money Due to the High Production Cost. Available online:
http://hb.sina.com.cn/news/qy/2013-06-03/145179426.html (accessed on 3 April 2017).40. Topkis, D.M. Supermodularity and Complementarity; Princeton University Press: Princeton, NJ, USA, 1998.