28
Chapter 14: Organizational and Institutional Genesis: The Emergence of High-Tech Clusters in the Life Sciences Walter W. Powell Kelley A. Packalen Kjersten Whittington

Chapter 14: Organizational and Institutional
Genesis: The Emergence of High-Tech Clusters in the Life Sciences
Walter W. Powell Kelley A. Packalen
Kjersten Whittington
2
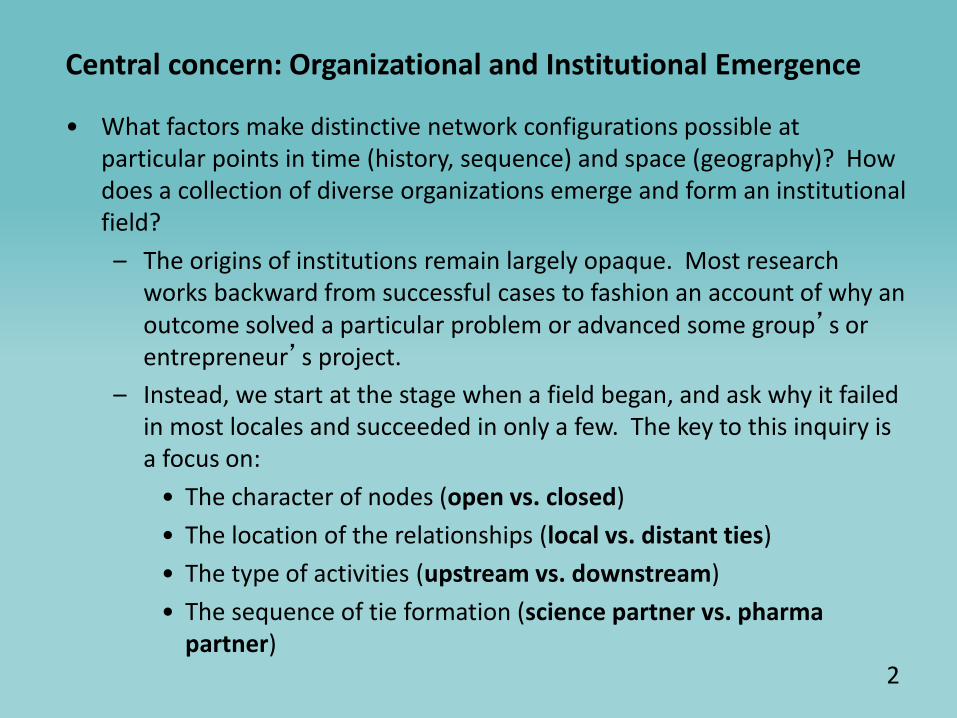
Central concern: Organizational and Institutional Emergence • What factors make distinctive network configurations possible at
particular points in time (history, sequence) and space (geography)? How does a collection of diverse organizations emerge and form an institutional field?
– The origins of institutions remain largely opaque. Most research works backward from successful cases to fashion an account of why an outcome solved a particular problem or advanced some group’s or entrepreneur’s project.
– Instead, we start at the stage when a field began, and ask why it failed in most locales and succeeded in only a few. The key to this inquiry is a focus on: • The character of nodes (open vs. closed) • The location of the relationships (local vs. distant ties) • The type of activities (upstream vs. downstream) • The sequence of tie formation (science partner vs. pharma
partner)
3
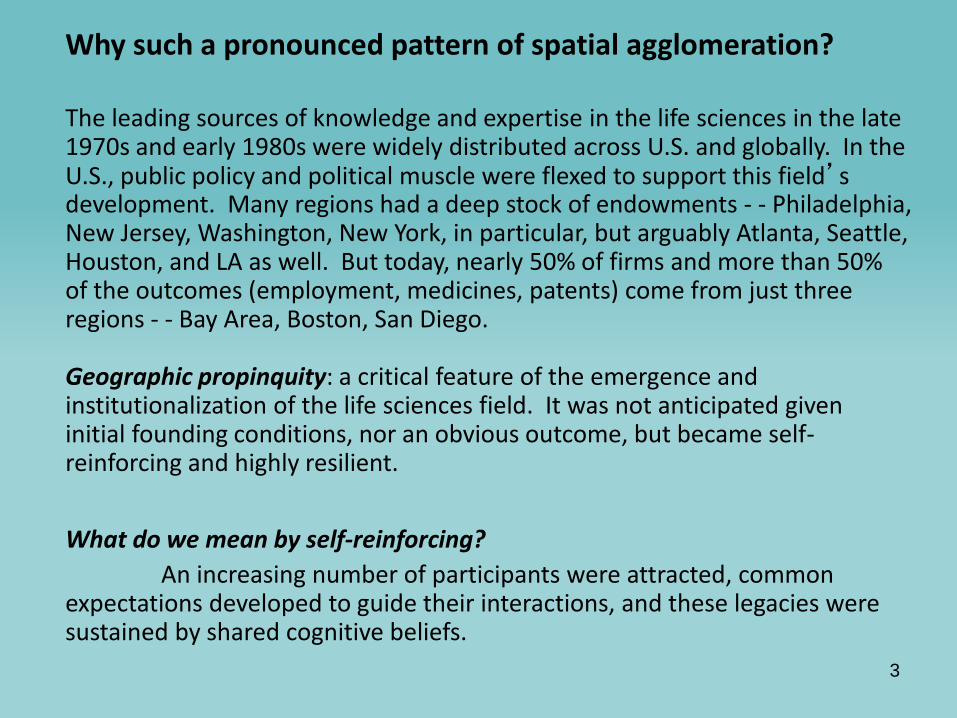
Why such a pronounced pattern of spatial agglomeration? The leading sources of knowledge and expertise in the life sciences in the late 1970s and early 1980s were widely distributed across U.S. and globally. In the U.S., public policy and political muscle were flexed to support this field’s development. Many regions had a deep stock of endowments - - Philadelphia, New Jersey, Washington, New York, in particular, but arguably Atlanta, Seattle, Houston, and LA as well. But today, nearly 50% of firms and more than 50% of the outcomes (employment, medicines, patents) come from just three regions - - Bay Area, Boston, San Diego. Geographic propinquity: a critical feature of the emergence and institutionalization of the life sciences field. It was not anticipated given initial founding conditions, nor an obvious outcome, but became self-reinforcing and highly resilient. What do we mean by self-reinforcing? An increasing number of participants were attracted, common expectations developed to guide their interactions, and these legacies were sustained by shared cognitive beliefs.

4
Biotechnology firms in U.S., 1978 (n=30)
text
5
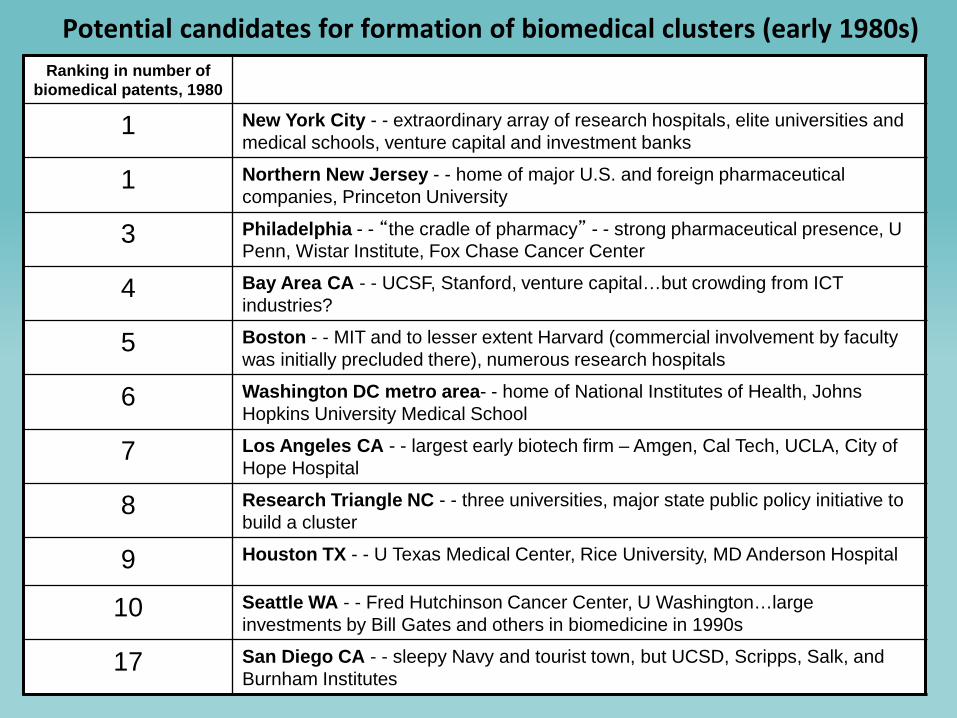
Potential candidates for formation of biomedical clusters (early 1980s) Ranking in number of
biomedical patents, 1980
1 New York City - - extraordinary array of research hospitals, elite universities and medical schools, venture capital and investment banks
1 Northern New Jersey - - home of major U.S. and foreign pharmaceutical companies, Princeton University
3 Philadelphia - - “the cradle of pharmacy” - - strong pharmaceutical presence, U Penn, Wistar Institute, Fox Chase Cancer Center
4 Bay Area CA - - UCSF, Stanford, venture capital…but crowding from ICT industries?
5 Boston - - MIT and to lesser extent Harvard (commercial involvement by faculty was initially precluded there), numerous research hospitals
6 Washington DC metro area- - home of National Institutes of Health, Johns Hopkins University Medical School
7 Los Angeles CA - - largest early biotech firm – Amgen, Cal Tech, UCLA, City of Hope Hospital
8 Research Triangle NC - - three universities, major state public policy initiative to build a cluster
9 Houston TX - - U Texas Medical Center, Rice University, MD Anderson Hospital
10 Seattle WA - - Fred Hutchinson Cancer Center, U Washington…large investments by Bill Gates and others in biomedicine in 1990s
17 San Diego CA - - sleepy Navy and tourist town, but UCSD, Scripps, Salk, and Burnham Institutes

6
Biotechnology firms in U.S., 2002 (n=368)
text
7
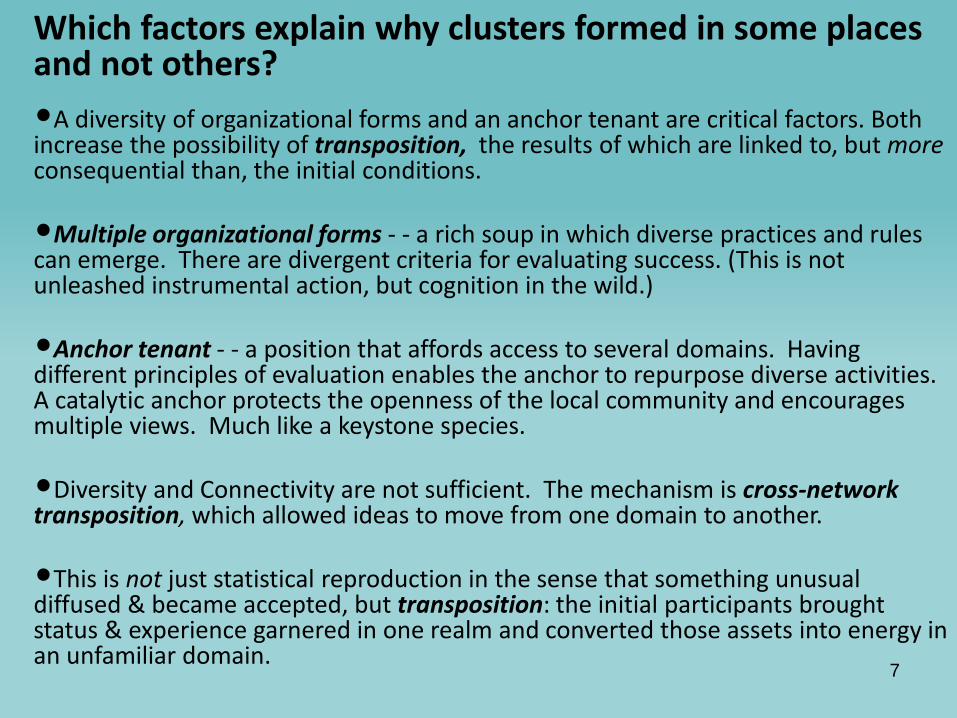
Which factors explain why clusters formed in some places and not others? •A diversity of organizational forms and an anchor tenant are critical factors. Both increase the possibility of transposition, the results of which are linked to, but more consequential than, the initial conditions.
•Multiple organizational forms - - a rich soup in which diverse practices and rules can emerge. There are divergent criteria for evaluating success. (This is not unleashed instrumental action, but cognition in the wild.)
•Anchor tenant - - a position that affords access to several domains. Having different principles of evaluation enables the anchor to repurpose diverse activities. A catalytic anchor protects the openness of the local community and encourages multiple views. Much like a keystone species.
•Diversity and Connectivity are not sufficient. The mechanism is cross-network transposition, which allowed ideas to move from one domain to another.
•This is not just statistical reproduction in the sense that something unusual diffused & became accepted, but transposition: the initial participants brought status & experience garnered in one realm and converted those assets into energy in an unfamiliar domain.
8
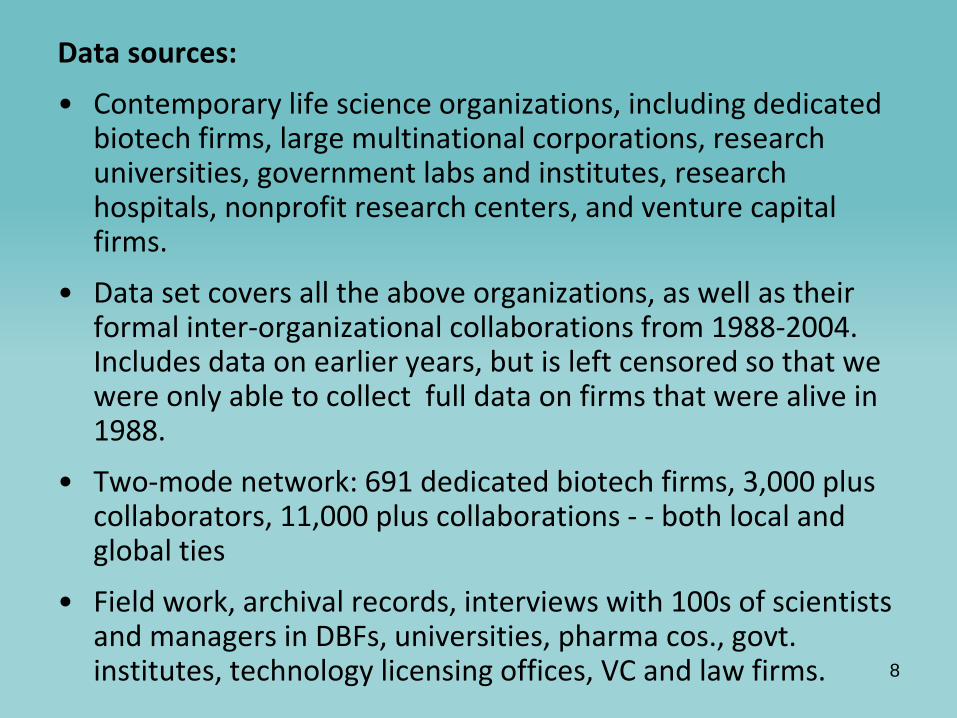
Data sources:
• Contemporary life science organizations, including dedicated biotech firms, large multinational corporations, research universities, government labs and institutes, research hospitals, nonprofit research centers, and venture capital firms.
• Data set covers all the above organizations, as well as their formal inter-organizational collaborations from 1988-2004. Includes data on earlier years, but is left censored so that we were only able to collect full data on firms that were alive in 1988.
• Two-mode network: 691 dedicated biotech firms, 3,000 plus collaborators, 11,000 plus collaborations - - both local and global ties
• Field work, archival records, interviews with 100s of scientists and managers in DBFs, universities, pharma cos., govt. institutes, technology licensing offices, VC and law firms.

9 9
Method: Network Visualization, with Pajek
• Pajek (Slovenian for ‘Spider’) is a freeware package for the analysis and visualization of large networks created by Vladimir Batagelj and Andrej Mrvar and available online at http://vlado.fmf.uni-lj.si/pub/networks/pajek/
• In Pajek, ‘spring-embedded’ network drawing algorithms enable meaningful representation of social networks in Euclidean space.
• ‘Particles’ repel one another, ‘springs’ draw attached particles together
• Drawing algorithms seek a ‘solution’ where the energy of the entire system is minimized, thus minimum energy drawings are produced
• In these representations, the positions of nodes are generated by the pattern of ties connecting the entire system
• We draw on two such algorithms
• Fruchterman-Reingold (FR) (1991) optimizes network configurations without reference to graph-theoretic conceptions of distance
• Kamada-Kawai (KK) (1989) positions connected nodes adjacent to one another and makes euclidean distances proportional to geodesic path length in the network

10
Boston Biotech Community 1988
text

Note: Organizations on the circumference are located in Boston but had no contractual relations with other Boston organizations in 1998.
Boston Biotech Community 1998
11
12
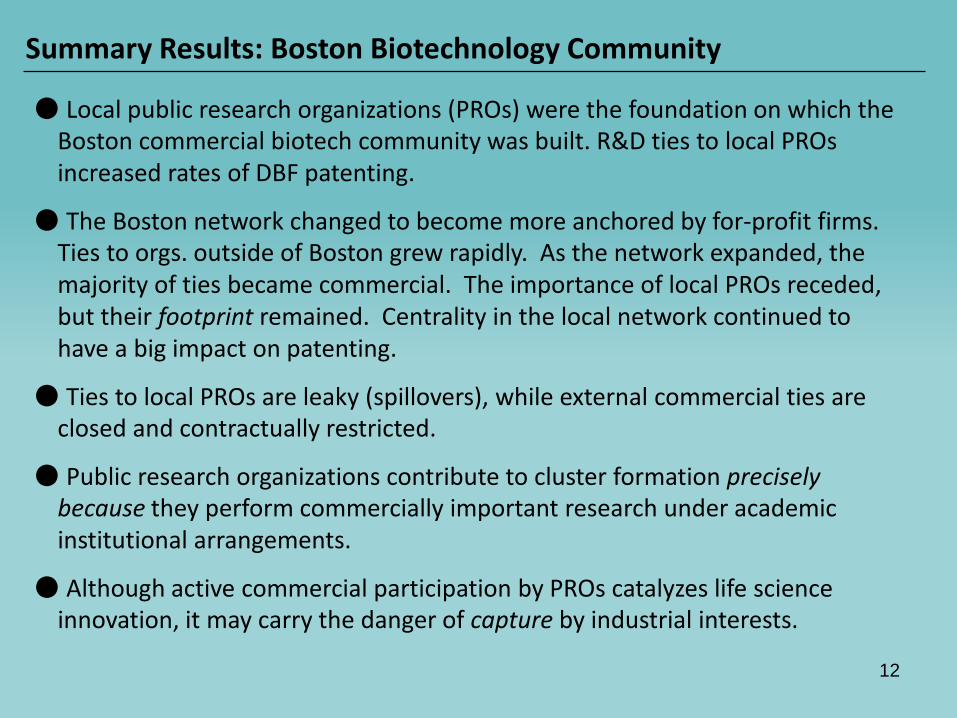
Summary Results: Boston Biotechnology Community
● Local public research organizations (PROs) were the foundation on which the Boston commercial biotech community was built. R&D ties to local PROs increased rates of DBF patenting.
● The Boston network changed to become more anchored by for-profit firms. Ties to orgs. outside of Boston grew rapidly. As the network expanded, the majority of ties became commercial. The importance of local PROs receded, but their footprint remained. Centrality in the local network continued to have a big impact on patenting.
● Ties to local PROs are leaky (spillovers), while external commercial ties are closed and contractually restricted.
● Public research organizations contribute to cluster formation precisely because they perform commercially important research under academic institutional arrangements.
● Although active commercial participation by PROs catalyzes life science innovation, it may carry the danger of capture by industrial interests.
13
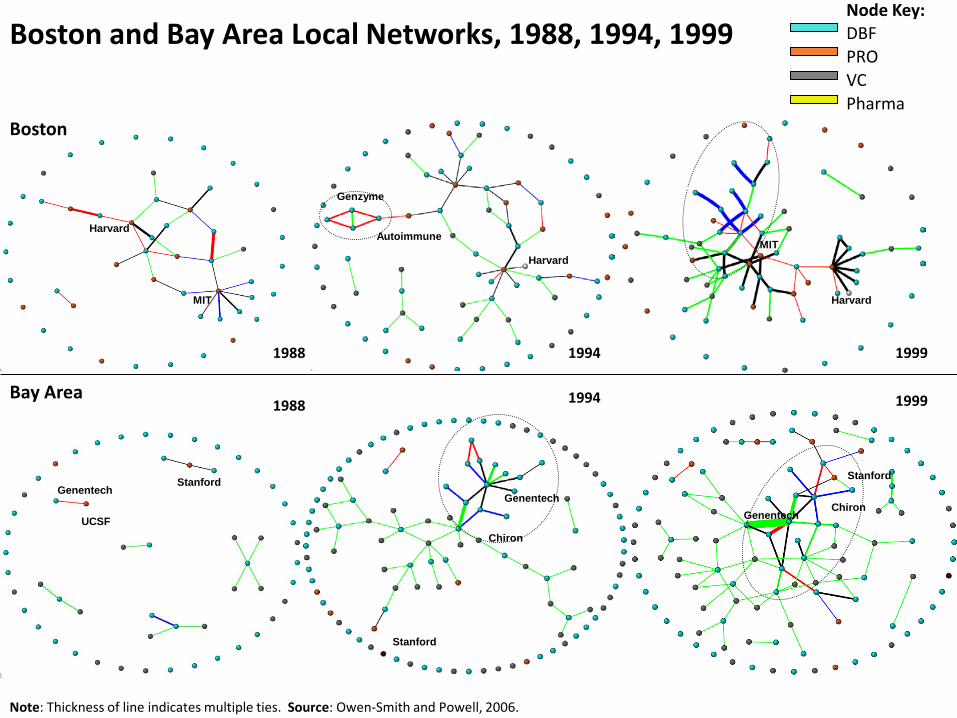
1988
Harvard
MIT
1994
Harvard
Genzyme
Autoimmune
1999
MIT
Harvard
Bay Area
Stanford
UCSF
Genentech
Stanford
Genentech
Chiron
Stanford
Chiron Genentech
1988 1994 1999
Boston
Note: Thickness of line indicates multiple ties. Source: Owen-Smith and Powell, 2006.
Boston and Bay Area Local Networks, 1988, 1994, 1999 Node Key: DBF PRO VC Pharma
14
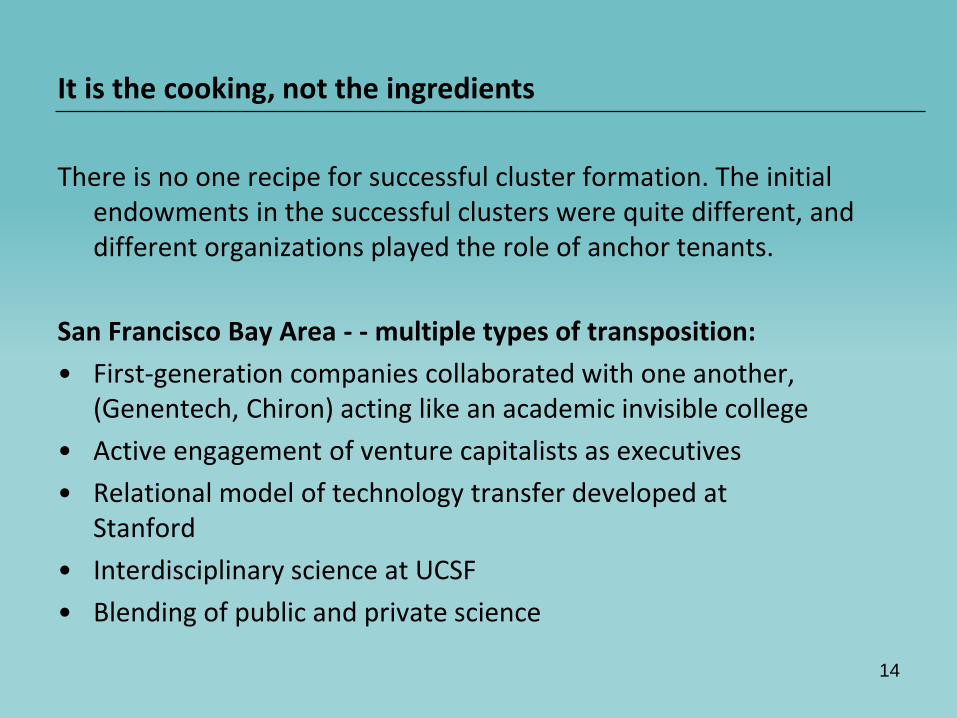
There is no one recipe for successful cluster formation. The initial
endowments in the successful clusters were quite different, and different organizations played the role of anchor tenants.
San Francisco Bay Area - - multiple types of transposition: • First-generation companies collaborated with one another,
(Genentech, Chiron) acting like an academic invisible college • Active engagement of venture capitalists as executives • Relational model of technology transfer developed at
Stanford • Interdisciplinary science at UCSF • Blending of public and private science
It is the cooking, not the ingredients

15
A sleepy Navy and tourist town became a high tech cluster in biotech and wireless in the 1990s (Walshok at al, 2001; Walcott, 2002; Simard, 2004; Casper, 2007).
1978 - - Hybritech founded by Ivor Royston, an asst prof. at UCSD and former
Stanford postdoc, and Howard Birndorf, a lab tech, who secured backing from Kleiner, Perkins and got Brook Byers as their manager.
Developed diagnostic tests based on monoclonal antibody technology, no need
for lengthy clinical trials or FDA approval, generated revenue within months of invention…one of few firms to become profitable early, had a successful IPO in 1981.
1986 - - Hybritech acquired by pharma giant Eli Lilly for $300 million and 100
million in shares. “Animal House meets the Waltons.” Huge failure! But ex-Hybritech scientists and managers stayed in San Diego and started more
than 40 biotech firms (Idec, GenProbe, Ligand, Gensia, Genta, Nanogen, Amylin, etc.) and several VC firms (Biovest, Forward Ventures, Kingsbury Partners). They partnered with scientists at the Salk Institute, Scripps, and UCSD. Bay Area VCs moved to SD. This failed merger seeded the San Diego biotech cluster.
San Diego - -
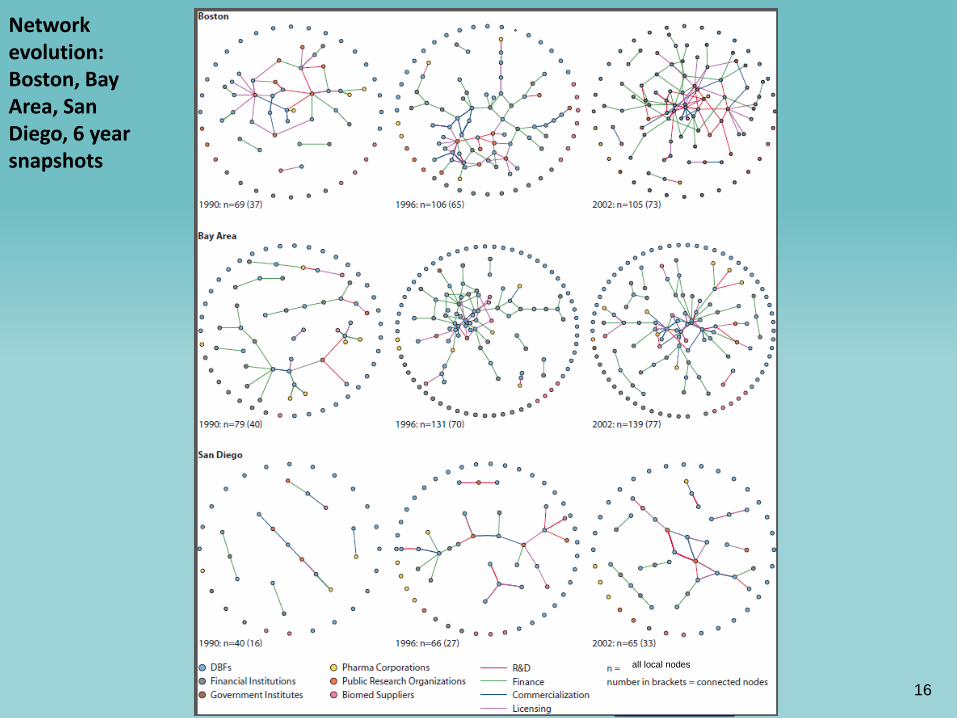
Network evolution: Boston, Bay Area, San Diego, 6 year snapshots
WHITE 16
all local nodes
17
Comparison of Boston, Bay Area, and San Diego:
• Different types of organizations serve as anchor tenants; each operates to foster interaction among disparate parties & provide means for local information sharing. These organizations spark the mixing of practices across domains (whatever one may think of the consequences for public science or corporate governance). No standard solution, instead a topology of the possible.
• Boston: Public Research Organizations
• Bay Area: Venture Capital, multidisciplinary model of UCSF, technology transfer at Stanford focused on relationships with startups, first-generation companies pursued invisible college model
• San Diego: Spinoffs from failed acquisition of Hybritech by Eli Lilly (“like working for your grandfather”); Salk, Scripps, & Burnham Institutes; UCSD and Connect, a university-sponsored nonprofit incubator
• In all three regions: considerable inter-org job mobility, local competitors collaborated, public & private science interwoven, all independent from overweening control of a dominant organization. Moreover, these three clusters combine dense local connectivity with extensive outside linkages.
Let’s look at the nascent clusters that didn’t take off
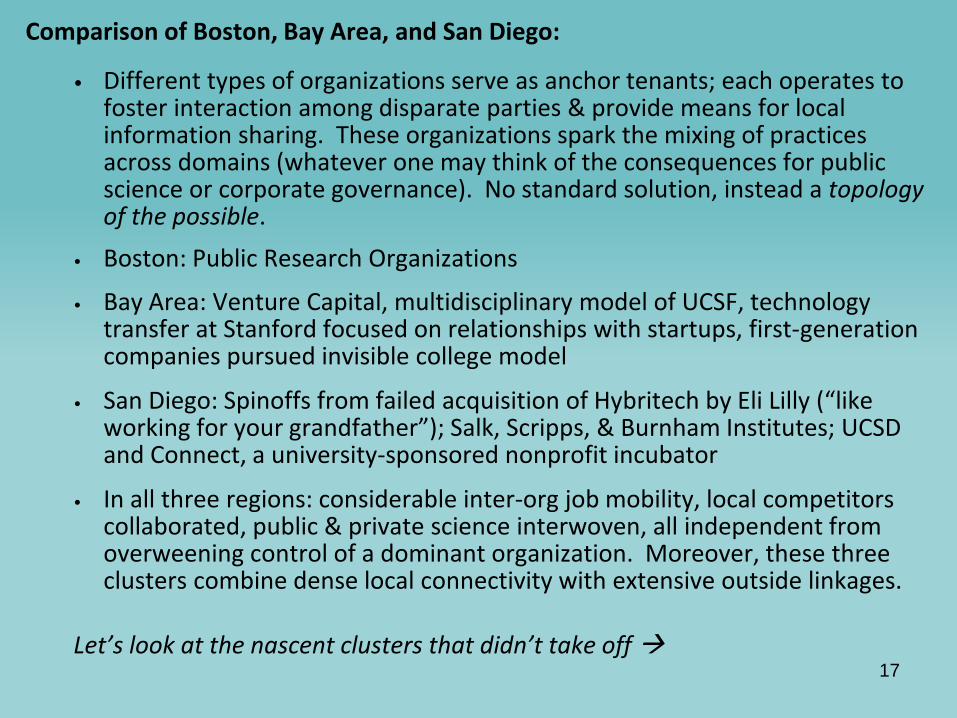
Network stagnation: New York, New Jersey, Philadelphia
WHITE 18
all local nodes
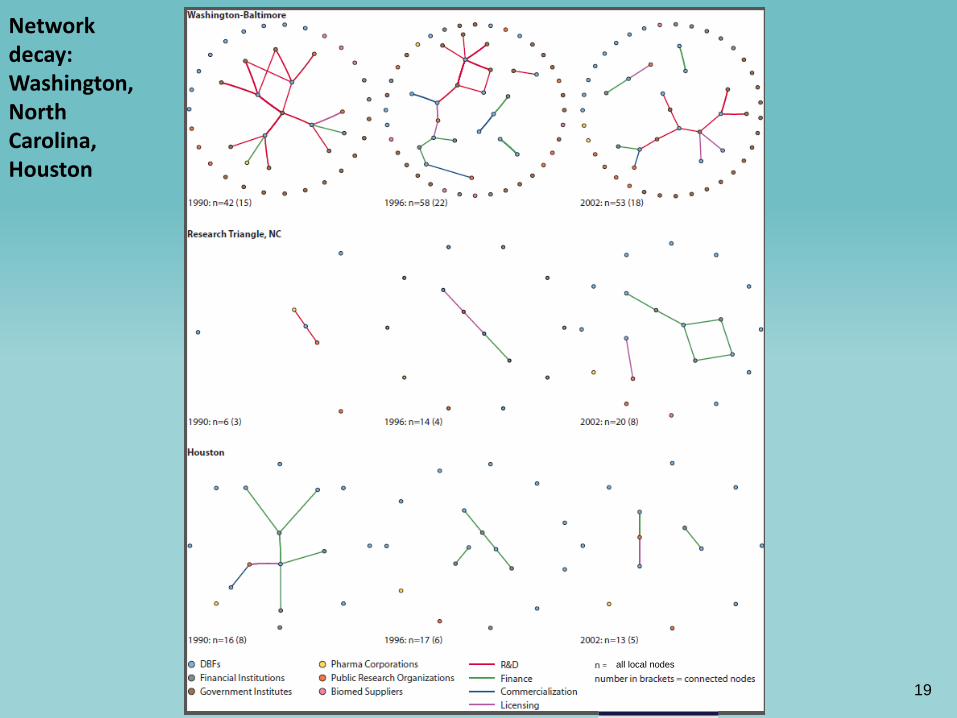
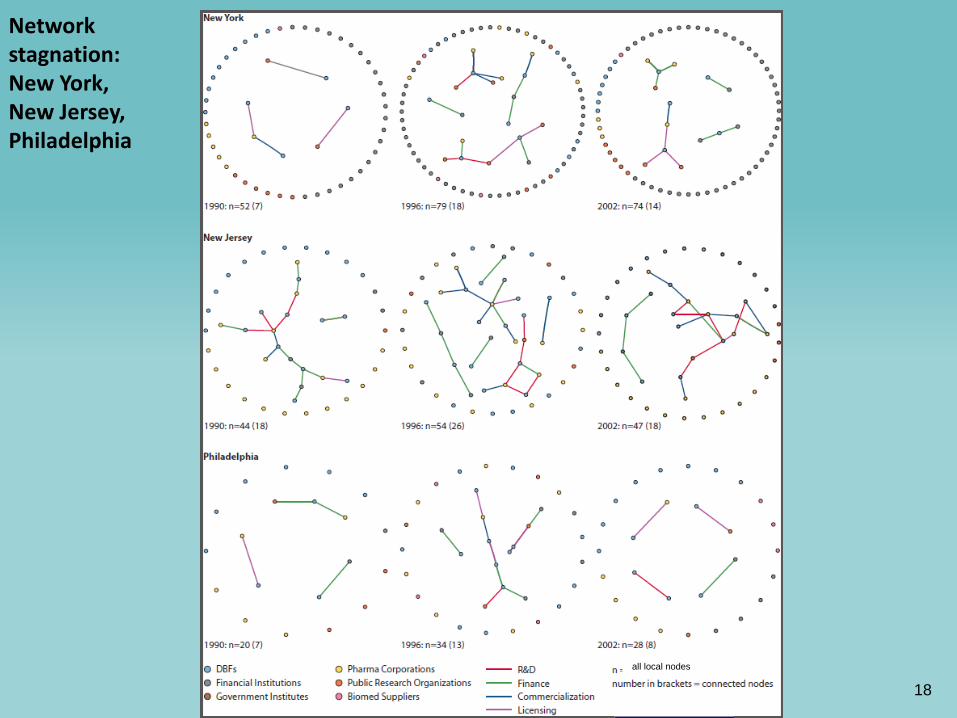
Network decay: Washington, North Carolina, Houston
WHITE 19
all local nodes

Network reshuffling: Seattle and L.A.
WHITE 20
all local nodes
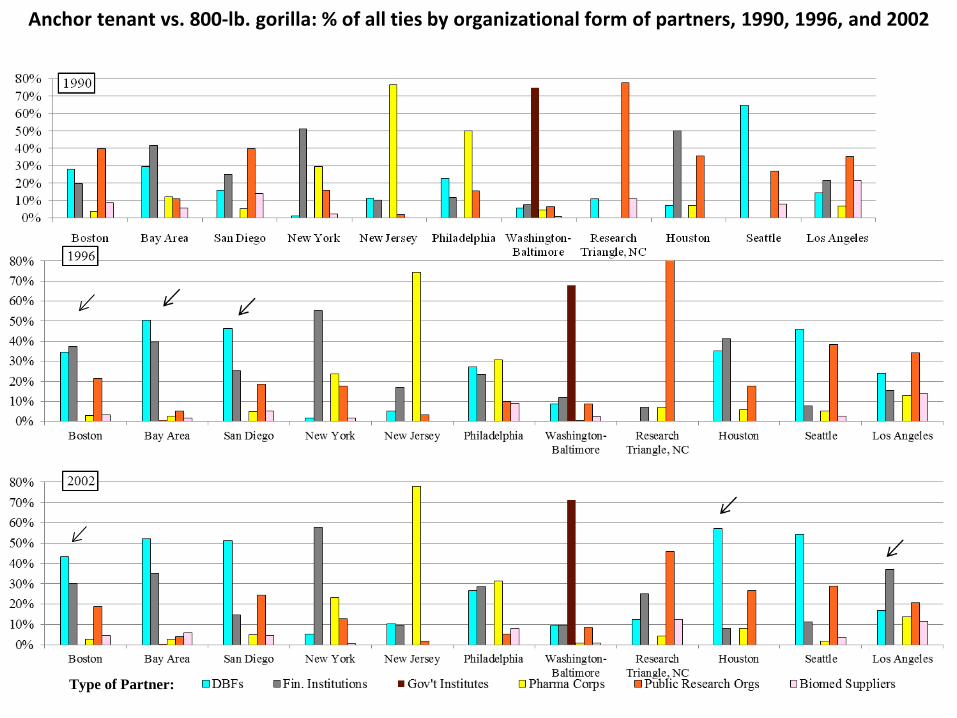
Anchor tenant vs. 800-lb. gorilla: % of all ties by organizational form of partners, 1990, 1996, and 2002
Type of Partner:

Transposition: % of local ties by organizational form of partners, 1990, 1996, and 2002
Type of Partner:
Why did clusters form communities in some locales but not others?
•All of the regions had considerable local endowments, but resources alone were insufficient.
•The anchor tenants in three ‘successful’ regions catalyzed further org. and network formation, rather than acting as a hegemonic power. The norms that characterized inter-org. relations in the three clusters bore the institutional stamp of the anchors - - open science, invisible college. (Relational imprinting.)
•Cross-network transposition:
– DBFs collaborated with other local DBFs; DBF scientists published in scientific journals – Universities and research institutes became active in commercialization and licensing – VCs became executives in DBFs and donors to universities – Serial founders of DBFs became VCs
•In sum, in three clusters with high rates of foundings and disbandings, a self-reinforcing, mutual awareness developed into communities of common fate, with intensive mixing of practices from multiple domains that, in turn, transformed science and finance. Local density increased the speed of things bumping into each other; these became networks of transformation, not mere “pipes and prisms.”
23
24
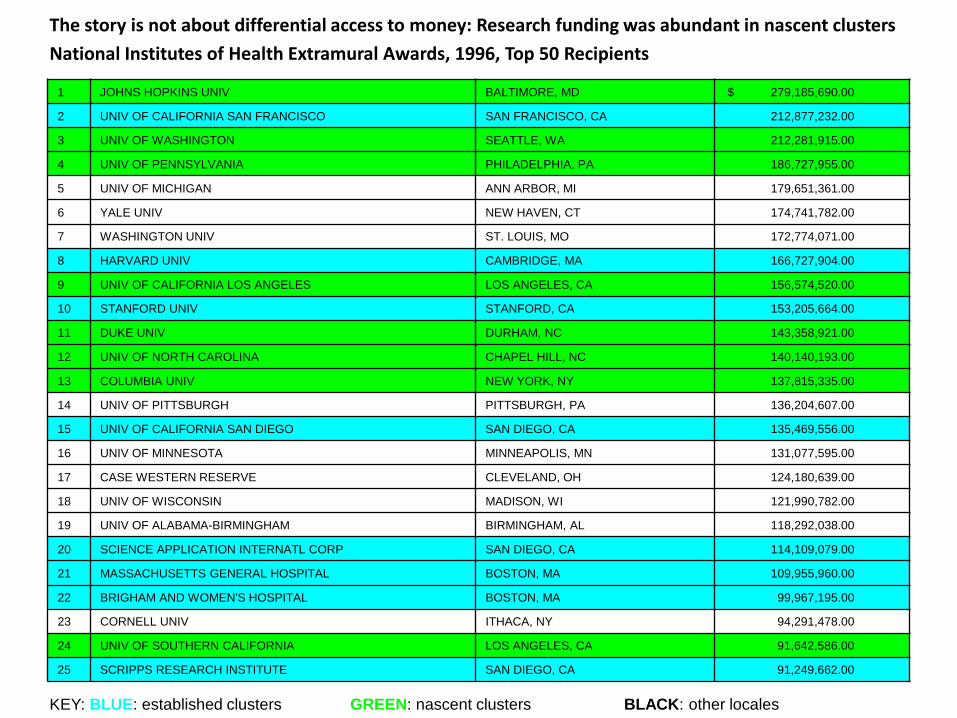
The story is not about differential access to money: Research funding was abundant in nascent clusters National Institutes of Health Extramural Awards, 1996, Top 50 Recipients
1 JOHNS HOPKINS UNIV BALTIMORE, MD $ 279,185,690.00
2 UNIV OF CALIFORNIA SAN FRANCISCO SAN FRANCISCO, CA 212,877,232.00
3 UNIV OF WASHINGTON SEATTLE, WA 212,281,915.00
4 UNIV OF PENNSYLVANIA PHILADELPHIA, PA 186,727,955.00
5 UNIV OF MICHIGAN ANN ARBOR, MI 179,651,361.00
6 YALE UNIV NEW HAVEN, CT 174,741,782.00
7 WASHINGTON UNIV ST. LOUIS, MO 172,774,071.00
8 HARVARD UNIV CAMBRIDGE, MA 166,727,904.00
9 UNIV OF CALIFORNIA LOS ANGELES LOS ANGELES, CA 156,574,520.00
10 STANFORD UNIV STANFORD, CA 153,205,664.00
11 DUKE UNIV DURHAM, NC 143,358,921.00
12 UNIV OF NORTH CAROLINA CHAPEL HILL, NC 140,140,193.00
13 COLUMBIA UNIV NEW YORK, NY 137,815,335.00
14 UNIV OF PITTSBURGH PITTSBURGH, PA 136,204,607.00
15 UNIV OF CALIFORNIA SAN DIEGO SAN DIEGO, CA 135,469,556.00
16 UNIV OF MINNESOTA MINNEAPOLIS, MN 131,077,595.00
17 CASE WESTERN RESERVE CLEVELAND, OH 124,180,639.00
18 UNIV OF WISCONSIN MADISON, WI 121,990,782.00
19 UNIV OF ALABAMA-BIRMINGHAM BIRMINGHAM, AL 118,292,038.00
20 SCIENCE APPLICATION INTERNATL CORP SAN DIEGO, CA 114,109,079.00
21 MASSACHUSETTS GENERAL HOSPITAL BOSTON, MA 109,955,960.00
22 BRIGHAM AND WOMEN'S HOSPITAL BOSTON, MA 99,967,195.00
23 CORNELL UNIV ITHACA, NY 94,291,478.00
24 UNIV OF SOUTHERN CALIFORNIA LOS ANGELES, CA 91,642,586.00
25 SCRIPPS RESEARCH INSTITUTE SAN DIEGO, CA 91,249,662.00
KEY: BLUE: established clusters GREEN: nascent clusters BLACK: other locales
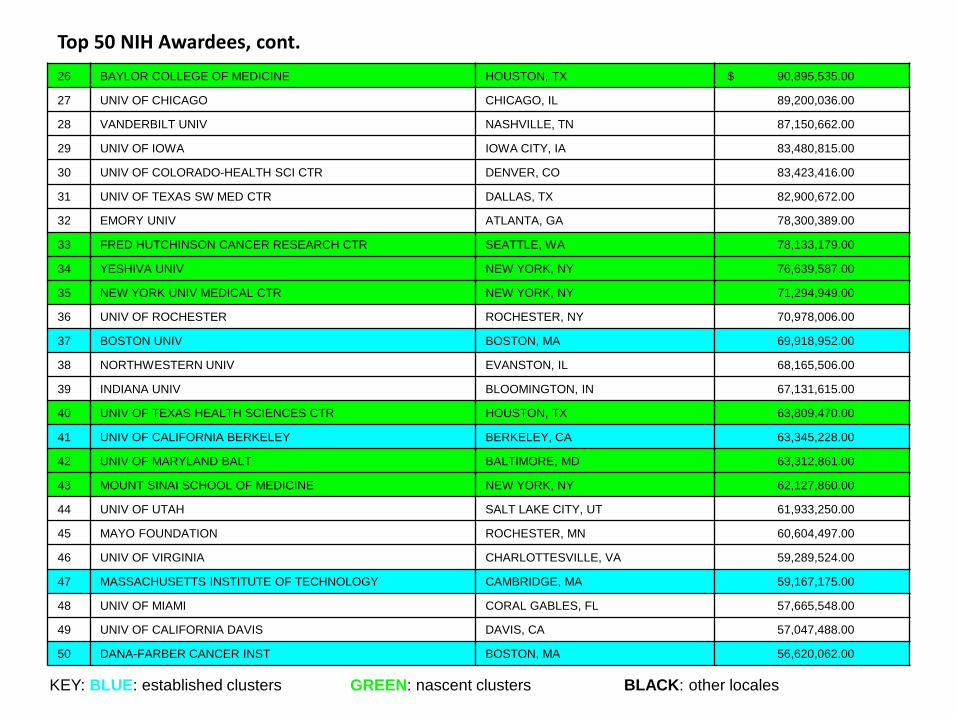
26 BAYLOR COLLEGE OF MEDICINE HOUSTON, TX $ 90,895,535.00
27 UNIV OF CHICAGO CHICAGO, IL 89,200,036.00
28 VANDERBILT UNIV NASHVILLE, TN 87,150,662.00
29 UNIV OF IOWA IOWA CITY, IA 83,480,815.00
30 UNIV OF COLORADO-HEALTH SCI CTR DENVER, CO 83,423,416.00
31 UNIV OF TEXAS SW MED CTR DALLAS, TX 82,900,672.00
32 EMORY UNIV ATLANTA, GA 78,300,389.00
33 FRED HUTCHINSON CANCER RESEARCH CTR SEATTLE, WA 78,133,179.00
34 YESHIVA UNIV NEW YORK, NY 76,639,587.00
35 NEW YORK UNIV MEDICAL CTR NEW YORK, NY 71,294,949.00
36 UNIV OF ROCHESTER ROCHESTER, NY 70,978,006.00
37 BOSTON UNIV BOSTON, MA 69,918,952.00
38 NORTHWESTERN UNIV EVANSTON, IL 68,165,506.00
39 INDIANA UNIV BLOOMINGTON, IN 67,131,615.00
40 UNIV OF TEXAS HEALTH SCIENCES CTR HOUSTON, TX 63,809,470.00
41 UNIV OF CALIFORNIA BERKELEY BERKELEY, CA 63,345,228.00
42 UNIV OF MARYLAND BALT BALTIMORE, MD 63,312,861.00
43 MOUNT SINAI SCHOOL OF MEDICINE NEW YORK, NY 62,127,860.00
44 UNIV OF UTAH SALT LAKE CITY, UT 61,933,250.00
45 MAYO FOUNDATION ROCHESTER, MN 60,604,497.00
46 UNIV OF VIRGINIA CHARLOTTESVILLE, VA 59,289,524.00
47 MASSACHUSETTS INSTITUTE OF TECHNOLOGY CAMBRIDGE, MA 59,167,175.00
48 UNIV OF MIAMI CORAL GABLES, FL 57,665,548.00
49 UNIV OF CALIFORNIA DAVIS DAVIS, CA 57,047,488.00
50 DANA-FARBER CANCER INST BOSTON, MA 56,620,062.00
KEY: BLUE: established clusters GREEN: nascent clusters BLACK: other locales
Top 50 NIH Awardees, cont.

Sample selection on networks? Count of partner ties by location, 1990, 1996, and 2002
Location of DBF:
27
How do fields evolve and change?
• Starting points and sequences matter - - what types of organizations are involved and where you begin shapes where you can go. Local ties embody a firm’s initial core knowledge and form its social capital base. Distant ties reflect cosmopolitan status, but when they come first, they hinder building a local cluster. (A process story not a recipe!)
• Windows of opening can be brief - - locational opportunities are ephemeral in science-based fields, and institutionalization may depend on catalyzing those ingredients at specific moments. (This is not a linear story!)
• Multiple logics always present - - but how you work, whom you work with, and what you work on are conditioned by micro patterns of partner choice and local norms that sustain the evolving field structure. Particular types of ties (R&D) can be repurposed in ways that others cannot.
• Multivocality - - actions can be interpreted from diverse perspectives simultaneously; multivocal actions are moves in multiple games at once.
• Change does not necessarily entail uprooting of incumbents and replacement by challengers. Elements of the old guard may find new tools to retain position, or forge alliances with new entrants, or co-opt them. Multiple network transposition does insure reshuffling of relations and identities, and altering of criteria of evaluation. For ex., Pharma corps. move R&D labs to Kendall Square and La Jolla; Novartis creates nonprofit Genomic Institute in La Jolla; Harvard endowment fund invests as VC, VCs begin entrepreneur in residence programs.

28
Conclusion: • Relational density and transposition foster multiple criteria
for evaluation, offering catalytic possibilities that no broker or strategic actor could ever anticipate. Cross-network transposition was the means by which ideas and skills were transferred into new domains, and put to novel purposes. Such cascades are unusual, but when they occur and are reinforced by multi-connected organizations, the potential for institutional change is considerable.
• Diversely anchored, multi-connected networks are much less likely to unravel than networks reliant on a few elite organizations, and the organizing practices of such networks are more likely to become institutionalized.


