Organizational Earned Value Analysis Tech.Report : TR-TOL-2010-0303 Vladimir Mandi´ c Department of Information Processing Science University of Oulu,Finland Victor Basili Fraunhofer Center for Experimental Software Engineering Maryland, USA March 3, 2010
Transcript
Organizational Earned Value AnalysisTech. Report: TR-TOL-2010-0303
Vladimir MandicDepartment of Information Processing Science
University of Oulu, Finland
Victor BasiliFraunhofer Center for Experimental Software Engineering
Maryland, USA
March 3, 2010
Abstract
We offer an approach for performing organization earned value analysis by takingadvantage of the hierarchical structure of the GQM+Strategies grid. The mergerenables us to create an integrated hierarchy of business goals, value goals, andstrategies for achieving those goals and to monitor and evaluate those goals at alllevels. It provides a means to expand the definition of earned value metrics tocover both the costs and benefits of achieving those goals through those strategiesand provides measurement support for all concepts. We demonstrate the approachthrough an example application, inspired by a real-world situation, to illustrate thefeasibility of the proposed approach.
Contents
1 Introduction 5
2 Background and Related Work 72.1 Value-Based Software Engineering and Earned Value Analysis . . 72.2 Business Value Analysis with GQM+Strategies . . . . . . . . . . 8
In recent years, the software industry has paid increasing attention to the businessvalue aspects of software engineering. A special issue of IEEE Software [12] wasdedicated to business value aspects in software engineering and ROI. The majorityof papers report cases with a value analysis performed at the ends of the investmentcycles in a variety of different aspects: software process improvement [19], soft-ware product lines [5], and software development [15]. However, the concepts ofbusiness value and added value are not explicitly addressed in software engineeringstandards or its body of knowledge.
Boehm [7] proposed the Value-Based Software Engineering (VBSE) frame-work in order to integrate all aspects of the software creation process under theperspective of the value. Value-based monitoring necessitates defining and collect-ing productivity and quality metrics. The stakeholders’ viewpoint is essential inconsidering several of the key elements of VBSE. In addition to the reconciliationof stakeholder value propositions, stakeholders’ values are the basis of risk man-agement, monitoring, and change management [6, 8]. There is a need for tools thathelp in determining, documenting, and managing stakeholders’ value goals andlinking them to the other elements of the VBSE framework. A tool that enablesvalue-based earned value tracking is particularly needed. However, according toBoehm [7], there are no such tools available today. The reason for the lack of suchtracking systems could be that in some cases the value is difficult to measure as ascalar quantity [10].
Earned value (management) is the result of positive experiences with Cost/ScheduleControl Systems used in the 1960s and 1970s [11]. Earned value management(EVM) is focused on controlling a project’s costs and schedule. However, the EVMdoes not take into account the stakeholders’ view on value [9]; and quantifying thevalue of continuous project tasks can be challenging.
At the organizational level, Boehm [6] suggests using a value-based versionof the Experience Factory [1] and Goal Question Metric (GQM) [2] approach toalign measures to business goals. GQM+Strategies1 [3] is an approach designed
1GQM+S trategies R⃝ is a registered trademark of the Fraunhofer Institute for Experimental Soft-
5
Tech. Report: TR-TOL-2010-0303
to help the software industry develop measurement programs that are aligned withbusiness goals. The resulting structure, which aligns metrics (GQM goals) andbusiness goals, is called a grid.
In this paper, we explain how to perform earned value analysis with the GQM+Strat-egies approach. This approach merges the earned value analysis with the GQM+Strat-egies grid structure. The merger enables the analysis of earned value at differentlevels and integrates them throughout the grid. The utilization of the GQM graphmakes measurable not only costs but also benefits of business goals. The trueearned value of a business goal is the combination of earned value on the cost sideand the earned value gained by materializing benefits.
The rest of the report is structured as follows. Chapter 2 reviews related workon business value analysis and value-based earned value. Earned value analysiswith GQM+Strategies is explained in Chapter 3. Chapter 4 depicts an exampleapplication of the approach. Chapter 5 presents our final remarks and concludingstatements.
ware Engineering, Germany and the Fraunhofer USA Center for Experimental Software Engineering,Maryland.
6
Chapter 2
Background and Related Work
The concept of value-based software engineering (VBSE) [9] emerged in the late1990s in the areas of product line engineering and software economics.
GQM+Strategies is the result of a 30-year-long evolution and use of the GQMmethod. The foundation of the GQM was laid out in the NASA/Software Engi-neering Laboratory (SEL) at the beginning of the 1980s [4].
2.1 Value-Based Software Engineering and Earned ValueAnalysis
The VBSE framework aims to integrate value considerations into all software en-gineering practices. The value-based approach helps focus and prioritize devel-opment efforts. For example, taking into account stakeholders’ value propositionsand considering the business value of each decision help ensure that effort is notwasted in implementing unneeded features. Thus, the value-based approach directsthe effort towards artifacts with higher perceived stakeholder value. [6]
In what follows, we present an overview of the seven key elements that Boehm[6] introduced as the foundation of value-based software engineering. The benefitsrealization analysis means that all initiatives needed to realize the potential bene-fits of a system are identified and coordinated. Linking resources to outcomes in-creases the concreteness of a software project, and helps identify stakeholders whoneed to be involved in system development. Stakeholder value proposition elic-itation and reconciliation involves identifying and documenting success-criticalstakeholder value propositions [6, 13]. Business case analysis involves determin-ing the costs, benefits, and return on investment of a system during its life cycle.Unquantifiable benefits make business case analysis challenging. Analyzing uncer-tainties helps in identifying risks related to each development option. Continuousrisk and opportunity management means that risk analysis and risk managementshould be carried out during the entire life cycle of the system. Risk managementinvolves understanding and addressing people’s utility functions and using risk todetermine how much is enough [14]. The concurrent system and software engi-
7
Tech. Report: TR-TOL-2010-0303
neering element stresses using iterative process models instead of waterfall stylemodels. Value-based monitoring and control [9] deals with monitoring the real-ization of the business value of outcomes at the project and organizational levels[6]. Finally, the change as opportunity element means that the ability to adapt tochange has business value, as the rate of change is continuously increasing. Com-panies that can react quickly will be more successful.
Brandon [11] defines earned value as the value, usually expressed in a mone-tary equivalent, of work accomplished up to a point in time based upon the planned(or budgeted) value for that work.
The earned value analysis (EVA) is composed of the following simple steps[9, 11]. Cost performance is measured by comparing the Budgeted Cost of WorkScheduled (BCWS) and Budgeted Cost of Work Performed (BCWP). The costvariance is calculated by comparing the earned value to actual cost. If actual costis less than the earned value of completed tasks at a certain point in time, it meansthat the project is achieving its goals under budget. Similarly, if the earned value ofcompleted tasks is higher than the planned value of the tasks, the project is aheadof schedule.
Boehm and Huang [9] integrated critical stakeholders’ views of value with EVAthrough the benefits–realization approach [17] and risk/opportunity managementpractices. The benefits–realization approach enables identification of outcomesand assumptions related to the realization of the outcomes. A sequence of out-comes forms a results chain. The analysis of the results chain provides a basis forrisk/opportunity management. Therefore, the value-based earned value monitoringand control is performed, as EVA contrasted with risk/opportunity managementand analyzing benefits realization.
It is important to understand the links between technical decisions, context,and value creation in different situations in order to improve decision making. Fur-thermore, dynamic monitoring and control mechanisms taking into account theselinkages and different sources of value are needed to guide decision–makers [8].
2.2 Business Value Analysis with GQM+Strategies
GQM+Strategies [3] is an extension of the GQM approach [2] that provides amethod for an organization or project to define goals, refine those goals down tospecifications of data to be collected, and then analyze and interpret the resultingdata with respect to the original goals. However, it does not provide a mechanismfor linking high-level business goals to lower-level goals or for supporting and in-tegrating different goals at different levels of the organization. Such a mechanismis provided by GQM+Strategies.
GQM+Strategies introduced several new concepts: multi-level goals, strate-gies, context/assumptions, and an enhanced multi-level interpretation model. Dis-cernment is made between a business goal and GQM goal. The former is an ob-jective for which strategies need to be developed to accomplish it. The latter is the
8
Organizational Earned Value Analysis
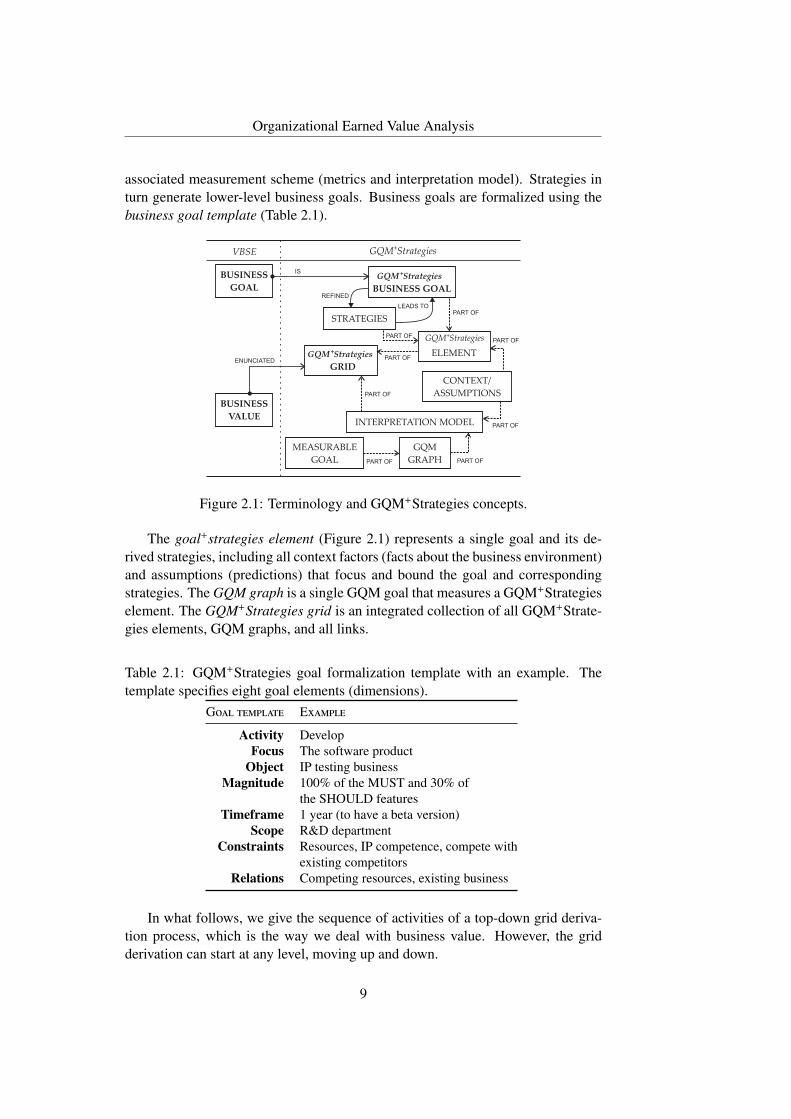
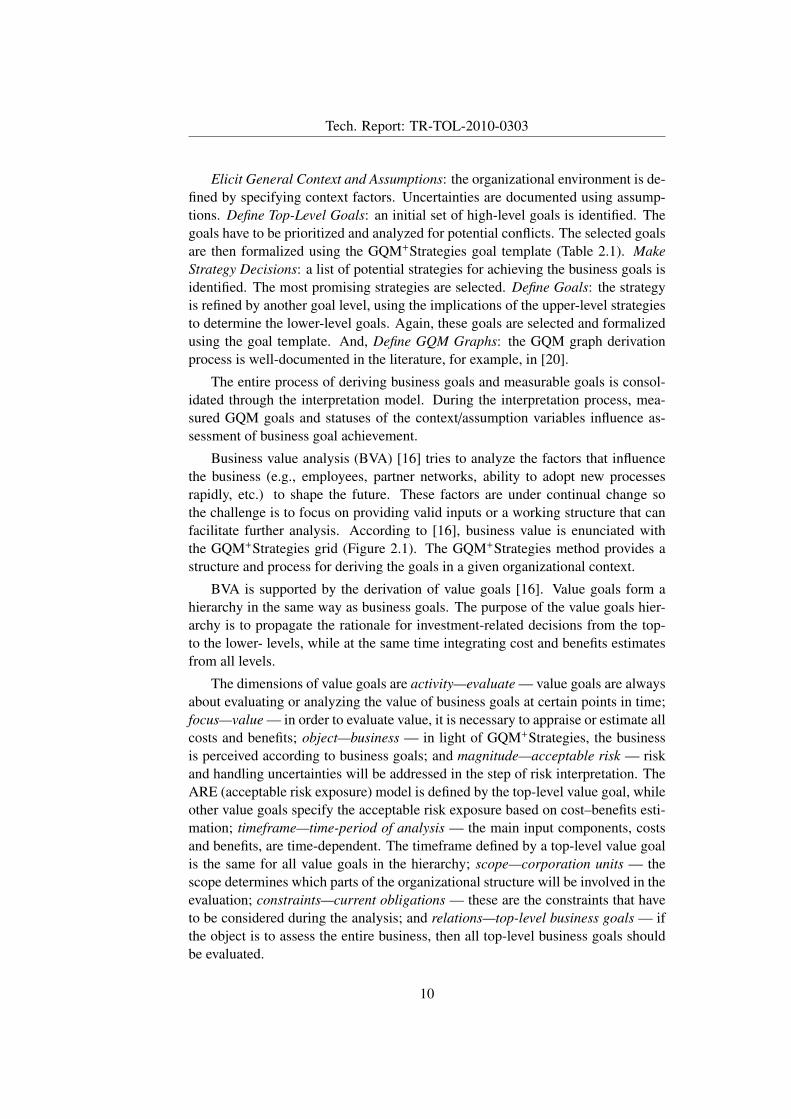
associated measurement scheme (metrics and interpretation model). Strategies inturn generate lower-level business goals. Business goals are formalized using thebusiness goal template (Table 2.1).
Figure 2.1: Terminology and GQM+Strategies concepts.
The goal+strategies element (Figure 2.1) represents a single goal and its de-rived strategies, including all context factors (facts about the business environment)and assumptions (predictions) that focus and bound the goal and correspondingstrategies. The GQM graph is a single GQM goal that measures a GQM+Strategieselement. The GQM+Strategies grid is an integrated collection of all GQM+Strate-gies elements, GQM graphs, and all links.
Table 2.1: GQM+Strategies goal formalization template with an example. Thetemplate specifies eight goal elements (dimensions).
Goal template Example
Activity DevelopFocus The software product
Object IP testing businessMagnitude 100% of the MUST and 30% of
the SHOULD featuresTimeframe 1 year (to have a beta version)
Scope R&D departmentConstraints Resources, IP competence, compete with
existing competitorsRelations Competing resources, existing business
In what follows, we give the sequence of activities of a top-down grid deriva-tion process, which is the way we deal with business value. However, the gridderivation can start at any level, moving up and down.
9
Tech. Report: TR-TOL-2010-0303
Elicit General Context and Assumptions: the organizational environment is de-fined by specifying context factors. Uncertainties are documented using assump-tions. Define Top-Level Goals: an initial set of high-level goals is identified. Thegoals have to be prioritized and analyzed for potential conflicts. The selected goalsare then formalized using the GQM+Strategies goal template (Table 2.1). MakeStrategy Decisions: a list of potential strategies for achieving the business goals isidentified. The most promising strategies are selected. Define Goals: the strategyis refined by another goal level, using the implications of the upper-level strategiesto determine the lower-level goals. Again, these goals are selected and formalizedusing the goal template. And, Define GQM Graphs: the GQM graph derivationprocess is well-documented in the literature, for example, in [20].
The entire process of deriving business goals and measurable goals is consol-idated through the interpretation model. During the interpretation process, mea-sured GQM goals and statuses of the context/assumption variables influence as-sessment of business goal achievement.
Business value analysis (BVA) [16] tries to analyze the factors that influencethe business (e.g., employees, partner networks, ability to adopt new processesrapidly, etc.) to shape the future. These factors are under continual change sothe challenge is to focus on providing valid inputs or a working structure that canfacilitate further analysis. According to [16], business value is enunciated withthe GQM+Strategies grid (Figure 2.1). The GQM+Strategies method provides astructure and process for deriving the goals in a given organizational context.
BVA is supported by the derivation of value goals [16]. Value goals form ahierarchy in the same way as business goals. The purpose of the value goals hier-archy is to propagate the rationale for investment-related decisions from the top-to the lower- levels, while at the same time integrating cost and benefits estimatesfrom all levels.
The dimensions of value goals are activity—evaluate — value goals are alwaysabout evaluating or analyzing the value of business goals at certain points in time;focus—value — in order to evaluate value, it is necessary to appraise or estimate allcosts and benefits; object—business — in light of GQM+Strategies, the businessis perceived according to business goals; and magnitude—acceptable risk — riskand handling uncertainties will be addressed in the step of risk interpretation. TheARE (acceptable risk exposure) model is defined by the top-level value goal, whileother value goals specify the acceptable risk exposure based on cost–benefits esti-mation; timeframe—time-period of analysis — the main input components, costsand benefits, are time-dependent. The timeframe defined by a top-level value goalis the same for all value goals in the hierarchy; scope—corporation units — thescope determines which parts of the organizational structure will be involved in theevaluation; constraints—current obligations — these are the constraints that haveto be considered during the analysis; and relations—top-level business goals — ifthe object is to assess the entire business, then all top-level business goals shouldbe evaluated.
10
Organizational Earned Value Analysis
Cost analysis In order to integrate the cost estimates of business goals, we haveto understand the recursive structure of the costs. The business goal represents adesired future state, while the strategy represents a means for achieving the goal.In that sense, actual cost carriers are actions that will lead to a desired future state.Further on, the cost of the strategy can be analyzed using the costs of derived busi-ness goals, and so on. The recursion is stopped when the goal derivation processreaches the operational level. At the moment a business goal is achieved, some re-sources should be allocated to maintain the desired state (goal maintenance costs).
Benefits analysis Unlike costs, benefits can be harder to estimate and quantify.It is important to analyze benefits at all levels (e.g., a benefit at the top level canbe expressed as increased market share, while a benefit at the lower level for thesame top-level business goal can be effort savings). It is not possible to calculateoverall benefit as a simple sum of benefits because the existence of conflicting valuegoals can have, as an implication, a mutual cancellation of benefits. Therefore,a step involving the analysis of conflicting value goals to re-estimate benefits isnecessary. This could occur if goals are competing for the same resources in amutually exclusive way. However, the number of conflicting goals is expected tobe small, so this kind of analysis is feasible. Benefits manifest the same recursivebehavior as costs.
Critical GQM+Strategies Sub-grid The risk-handling procedure can be dividedinto two parts. The first part is related to analyzing assumptions’ uncertainties andquantifying them as the risk exposure of business goals. The second part consistsof comparing the acceptable risk level of value goals and the risk exposure of thecorresponding business goals. This is done during the incorporation of the risk intothe interpretation model. The incorporation of the risk level into the interpretationmodel identifies a critical GQM+Strategies sub-grid [16]. The critical sub-gridcontains risky goals and goals whose realization is threatened by the risky goals.
The advantage of using GQM+Strategies is that it provides an explicit link tothe different levels, from the top level to the lowest level. This implies that valuegoals exist on different levels, analyzing benefits and costs at those organizationallevels.
The grid derivation process and BVA aim to support decision making in thestrategy-planning and business goal definition phase. In the execution of selectedstrategies, the derived GQM+Strategies grid can be utilized to monitor and controlrealization of the business goals.
11
Chapter 3
Earned Value Analysis withGQM+Strategies
For selected strategies and business goals, the support and commitment is grantedby providing real resources (e.g., financial, human, time, etc.). Each business goalBi is supported by budget ( ˆCost(Bi, t)) and planned benefits realization schedule( ˆBn f t(Bi, t)). We will assume that all costs and benefits are converted into themonetary units or into any other equivalent.
In the following section, we will explain how to track actual costs and benefitswith a cost–benefit GQM graph.
3.1 Tracking Actual Costs and Benefits
In order to measure actual costs and benefits, we have to define a cost–benefitGQM graph and incorporate it into the grid. The process used for defining thecost–benefit graph is a typical GQM process [20], albeit with several differences.First, the assumption and context elements of the value goal and correspondingbusiness goal are at disposal, easing the process of defining metrics. Second, thecosts and benefits structure has a built-in recursion that dominates and shapes theentire cost–benefit graph. Level-i GQM goal collects costs- and benefits- relateddata for the current level and all lower levels from the corresponding derived goals.
Each value goal (Vi) is linked to a GQM goal with the purpose of monitoringand tracking costs and benefits during the execution phase. The form of the GQMgoal is given in Table 3.1.
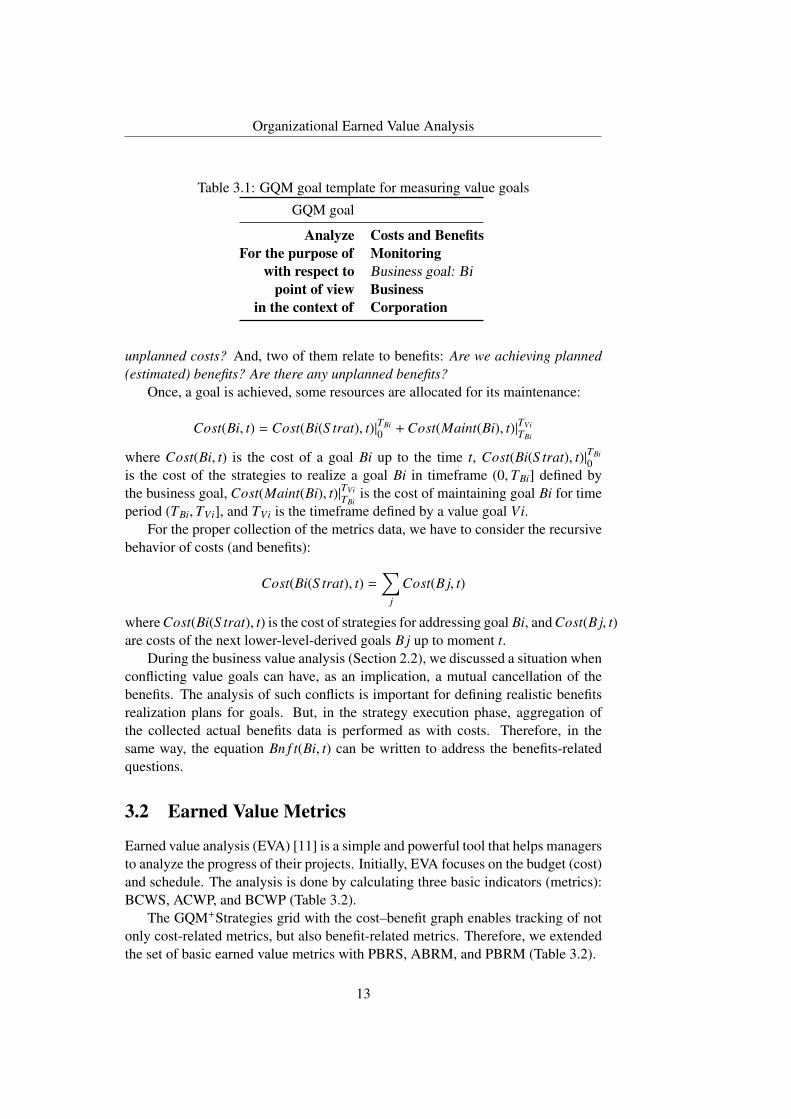
A distinguishing characteristic of cost–benefit GQM goals is that dimensionsof analyze, purpose, and viewpoint are fixed to costs and benefits, monitoring, andbusiness, respectively. The with respect to dimension is always a correspondingbusiness goal (Bi) of the linked value goal (Vi).
Further, the GQM goal is addressed by four questions. Two of them relate tocosts: What percentage of budgeted (estimated) costs have we spent? Are there any
12
Organizational Earned Value Analysis
Table 3.1: GQM goal template for measuring value goals
GQM goal
Analyze Costs and BenefitsFor the purpose of Monitoring
with respect to Business goal: Bipoint of view Business
in the context of Corporation
unplanned costs? And, two of them relate to benefits: Are we achieving planned(estimated) benefits? Are there any unplanned benefits?
Once, a goal is achieved, some resources are allocated for its maintenance:
where Cost(Bi, t) is the cost of a goal Bi up to the time t, Cost(Bi(S trat), t)|TBi0
is the cost of the strategies to realize a goal Bi in timeframe (0,TBi] defined bythe business goal, Cost(Maint(Bi), t)|TVi
TBiis the cost of maintaining goal Bi for time
period (TBi,TVi], and TVi is the timeframe defined by a value goal Vi.For the proper collection of the metrics data, we have to consider the recursive
behavior of costs (and benefits):
Cost(Bi(S trat), t) =∑
j
Cost(B j, t)
where Cost(Bi(S trat), t) is the cost of strategies for addressing goal Bi, and Cost(B j, t)are costs of the next lower-level-derived goals B j up to moment t.
During the business value analysis (Section 2.2), we discussed a situation whenconflicting value goals can have, as an implication, a mutual cancellation of thebenefits. The analysis of such conflicts is important for defining realistic benefitsrealization plans for goals. But, in the strategy execution phase, aggregation ofthe collected actual benefits data is performed as with costs. Therefore, in thesame way, the equation Bn f t(Bi, t) can be written to address the benefits-relatedquestions.
3.2 Earned Value Metrics
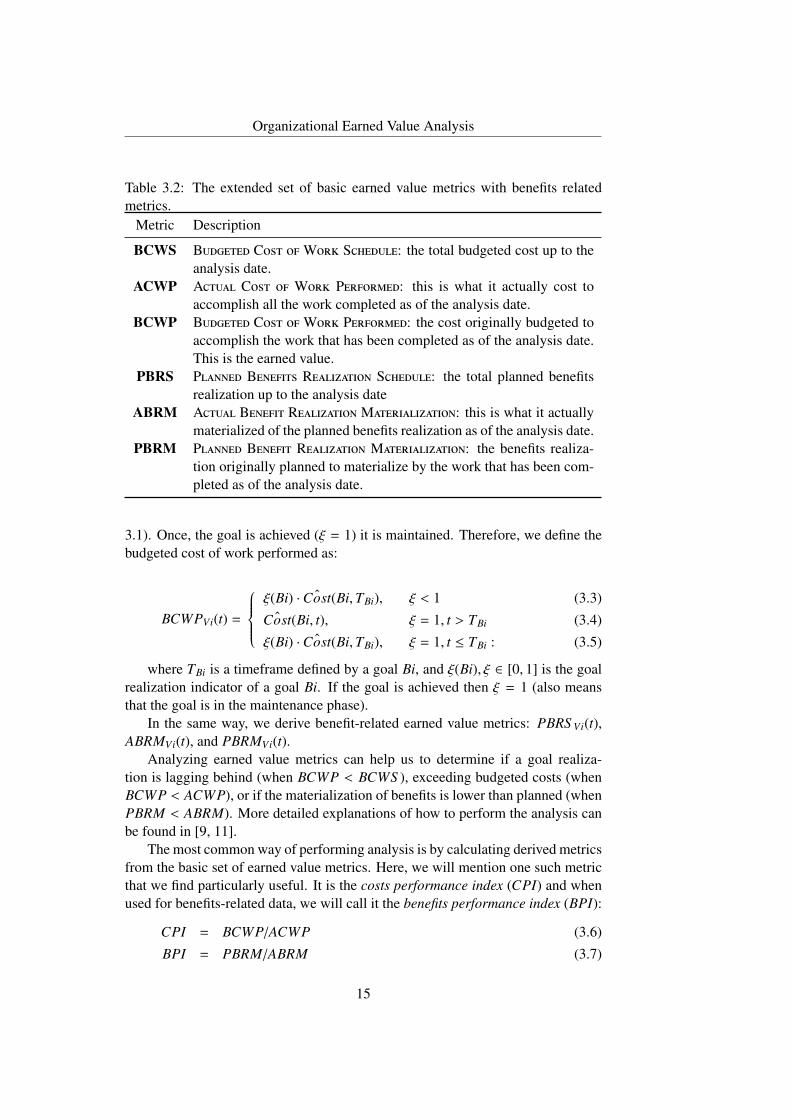
Earned value analysis (EVA) [11] is a simple and powerful tool that helps managersto analyze the progress of their projects. Initially, EVA focuses on the budget (cost)and schedule. The analysis is done by calculating three basic indicators (metrics):BCWS, ACWP, and BCWP (Table 3.2).
The GQM+Strategies grid with the cost–benefit graph enables tracking of notonly cost-related metrics, but also benefit-related metrics. Therefore, we extendedthe set of basic earned value metrics with PBRS, ABRM, and PBRM (Table 3.2).
13
Tech. Report: TR-TOL-2010-0303
Figure 3.1: Tracking actual costs–benefits and goal realization. R1 – tracks goalrealization, R2 – identifies Bi’s success-critical assumptions and context factors, R3– tracks actual costs and benefits, R4 – estimates (budgeted) costs and (planned)benefits, and R5 – analyzes the level of acceptable risk.
It is expected that the strategy and business goal implementation plan will con-tain a budget for implementing business goals and plan for benefits realization.The level of detail of the plans can vary depending on the goal level. For exam-ple, lower-level goals can have very detailed plans (same level of detail as for aproject), while the top-level goals can specify quarterly or half-year plans. Let usdefine ˆCost(Bi, t) as budgeted costs of a goal Bi; therefore:
BCWS Vi(t) = ˆCost(Bi, t) (3.1)
where BCWS Vi(t) is the budgeted cost of a value goal Vi up to the moment t col-lected through R4 in Figure 3.1.
Actual costs are collected through cost–benefit graph (R3, Figure 3.1):
ACWPVi(t) = Cost(Bi, t) (3.2)
where Cost(Bi, t) are costs of a goal Bi up to the moment t.The main difference between “classical” EVA and our approach is how we
define BCWP. The purpose of using earned value metrics is to analyze the progressof executing business strategies. Therefore, we are interested in the progress ofrealizing goals. Each goal goes through two phases. First, the phase of implement-ing strategies in order to achieve the goal. And second, after the goal is achievedit has to be maintained. In other words, the objective is to bring goals in the main-tenance phase. Resources are spent in both phases. The progress of realizing agoal is measured with a goal realization indicator. The goal realization indicator,ξ(Bi), is assessed through GQM graph that measures a business goal Bi (R1, Figure
14
Organizational Earned Value Analysis
Table 3.2: The extended set of basic earned value metrics with benefits relatedmetrics.
Metric Description
BCWS Budgeted Cost ofWork Schedule: the total budgeted cost up to theanalysis date.
ACWP Actual Cost of Work Performed: this is what it actually cost toaccomplish all the work completed as of the analysis date.
BCWP Budgeted Cost ofWork Performed: the cost originally budgeted toaccomplish the work that has been completed as of the analysis date.This is the earned value.
PBRS Planned Benefits Realization Schedule: the total planned benefitsrealization up to the analysis date
ABRM Actual Benefit Realization Materialization: this is what it actuallymaterialized of the planned benefits realization as of the analysis date.
PBRM Planned Benefit Realization Materialization: the benefits realiza-tion originally planned to materialize by the work that has been com-pleted as of the analysis date.
3.1). Once, the goal is achieved (ξ = 1) it is maintained. Therefore, we define thebudgeted cost of work performed as:
BCWPVi(t) =
ξ(Bi) · ˆCost(Bi, TBi), ξ < 1 (3.3)
ˆCost(Bi, t), ξ = 1, t > TBi (3.4)
ξ(Bi) · ˆCost(Bi, TBi), ξ = 1, t ≤ TBi : (3.5)
where TBi is a timeframe defined by a goal Bi, and ξ(Bi), ξ ∈ [0, 1] is the goalrealization indicator of a goal Bi. If the goal is achieved then ξ = 1 (also meansthat the goal is in the maintenance phase).
In the same way, we derive benefit-related earned value metrics: PBRS Vi(t),ABRMVi(t), and PBRMVi(t).
Analyzing earned value metrics can help us to determine if a goal realiza-tion is lagging behind (when BCWP < BCWS ), exceeding budgeted costs (whenBCWP < ACWP), or if the materialization of benefits is lower than planned (whenPBRM < ABRM). More detailed explanations of how to perform the analysis canbe found in [9, 11].
The most common way of performing analysis is by calculating derived metricsfrom the basic set of earned value metrics. Here, we will mention one such metricthat we find particularly useful. It is the costs performance index (CPI) and whenused for benefits-related data, we will call it the benefits performance index (BPI):
CPI = BCWP/ACWP (3.6)
BPI = PBRM/ABRM (3.7)
15
Tech. Report: TR-TOL-2010-0303
when ACWP , 0 and ABRM , 0. If it is less than 1, you are over budget/plan. Ifit is greater than 1, you are under budget/plan.
The interpretation of the benefits performance index differs from the costs per-formance index. A small value of CPI indicate situation when more resources arespent than budgeted, but if BPI has a small value it indicates better materializationof the benefits than it was planned. If the denominators of the performance indices(ACWP and ABRM) have values close to the zero, it will result with high valuesof the performance indices. Therefore, we accept interpretation of performanceindices when their values are from the interval (0, 2), meaning that a variation frombudget/plan is at most plus/minus 100%. If the value is out of the interval, it isa good indicator that something unplanned is happening and further analysis isrequired.
Costs and benefits manifest recursive behavior, meaning that budgeted costsfor a goal at one level include budgeted costs of derived lower-level goals. Simi-lar, but in a less obvious way, benefits from different levels are aggregated. In theliterature we often find examples of situations where the measurement of the ben-efits in terms of their monetary equivalent is difficult, if not impossible. One suchexample is customer satisfaction. We agree that at a certain level, i.e. where thegoal of increasing customer satisfaction is defined, it is not adequate to measureit in financial terms. But, if at a higher level, i.e. where the goal of increasingprofitability is defined with the assumption that increasing customer satisfactionwill increase profitability, then it is possible to measure the benefits of increasingcustomer satisfaction in terms of financial value in the context of the upper-levelbusiness goal.
If we compare performance indices (CPI, BPI) of two adjacent levels, theyshould converge toward a value close to 1 in the ideal case. But, if the lowerlevel’s goal realization is proceeding according to plan, and if the upper level’sgoal realization is halted, then performance indices will start to diverge from eachother. This situation indicates problems with the strategy that links those adjacentlevels. Such situations are easily noticeable when performance indices are plottedon a single graph.
3.3 Risk Monitoring
For all goals belonging to the GQM+Strategies critical sub-grid, it is necessary toreassess the goal’s risk exposure and acceptable risk level (Section 2.2), appraisedat step R5 (Figure 3.1). Situations where goal realization is not going accordingto plan can reveal changes in context factors and assumptions. Such changes haveconsequences for the goal’s risk assessment (R2, Figure 3.1).
After the risk reassessment, new goals can become risky, while known riskygoals can cease to be risky. Actually, risk monitoring is continually changing theconfiguration of the critical sub-grid. It is expected that in an ideal situation whenprediction capabilities are good and no unexpected events rise, every new critical
16
Organizational Earned Value Analysis
sub-grid is a sub grid of the previous critical sub-grids.
17
Chapter 4
Exemplar Application of theApproach
Our exemplar application of the approach is inspired by a real-world situation en-countered during a GQM+Strategies pilot in an organization, which we will callComp@ny. The goal of the example is to illustrate the feasibility of the proposedmethod rather than to validate it empirically.
Due to space limitation, we will present a partially defined GQM+Strategiesgrid here. The goal tree has only the lowest level GQM+Strategies elements com-pletely defined (made measurable). This restriction of the grid does not affectthe illustration of the method’s feasibility. First, we will give an overview ofComap@ny’s grid and business value analysis; after that, we will define the bud-geted and planned benefits realization schedule, and illustrate value-based earnedvalue analysis.
4.1 The GQM+Strategies grid derivation
Comp@ny has been present in the market for more than 15 years. The main fo-cus of the company is the development of software products for testing specificsystems. We can summarize Comp@ny’s internal environment as human inten-sive, exploiting human creativity for the purpose of creating the end product. Theexternal environment is dominated by turbulent changes in the market. In lightof those conditions, one of the Comp@ny’s objectives is to diversify its currentmarket position within the existing market segment (business domain).
General context elements that need to be characterized include: products andservices, process, business model, and measurement practices. Comp@ny offers arange of products for embedded software testing. The market for testing products isbecoming highly competitive and there is a need to safeguard Comp@ny’s marketposition.
According to Comp@ny’s objectives, the top-level business goal B1 is defined.We can summarize the goal B1 as: modernize testing services business within a
18
Organizational Earned Value Analysis
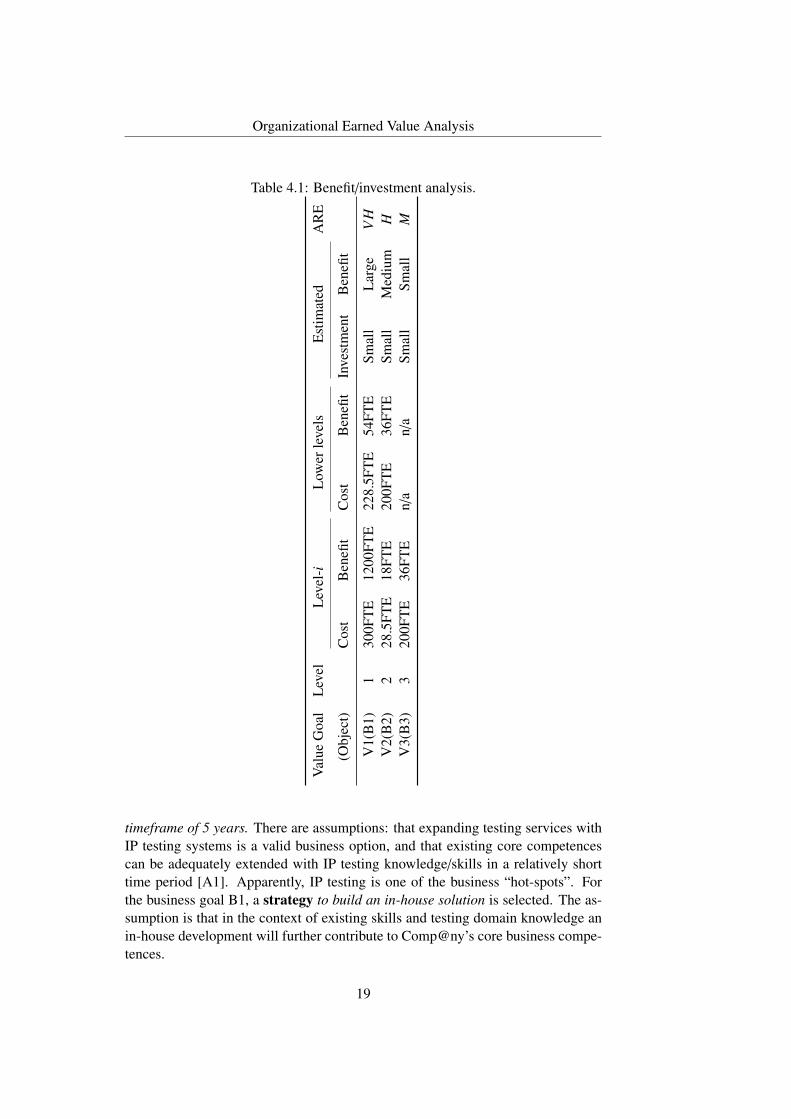
Table 4.1: Benefit/investment analysis.
Val
ueG
oal
Lev
elL
evel
-iL
ower
leve
lsE
stim
ated
AR
E
(Obj
ect)
Cos
tB
enefi
tC
ost
Ben
efit
Inve
stm
ent
Ben
efit
V1(
B1)
130
0FT
E12
00FT
E22
8.5F
TE
54FT
ESm
all
Lar
geV
HV
2(B
2)2
28.5
FTE
18FT
E20
0FT
E36
FTE
Smal
lM
ediu
mH
V3(
B3)
320
0FT
E36
FTE
n/a
n/a
Smal
lSm
all
M
timeframe of 5 years. There are assumptions: that expanding testing services withIP testing systems is a valid business option, and that existing core competencescan be adequately extended with IP testing knowledge/skills in a relatively shorttime period [A1]. Apparently, IP testing is one of the business “hot-spots”. Forthe business goal B1, a strategy to build an in-house solution is selected. The as-sumption is that in the context of existing skills and testing domain knowledge anin-house development will further contribute to Comp@ny’s core business compe-tences.
19
Tech. Report: TR-TOL-2010-0303
At the next lower level, level-2, a business goal (B2) is derived from the strategythat addresses the top-level business goal. The goal B2 is formulated as: developmarketability for IP testing products within timeframe of 2 years. There is an as-sumption [A2] that the product manager and marketing department have sufficientunderstanding of customers’ needs in the new business domain. The marketabil-ity of the new product depends on the success of implementing key functionalities(features). Therefore, for business goal B2 a strategy: use the MoSCoW method[18] is chosen and it further leads to the next level business goal.
The level-3 business goal (B3) is: develop the software product (beta version)for IP testing within timeframe of 1 year. The B3 is specified according to the goaltemplate as presented in Table 2.1. There is an assumption [A3] that stable productrequirements will be ready and specified on time.
The measurement goal associated with business goal B3 would be: Analyze theIP testing software product for the purpose of evaluation with respect to the per-centage of MUST and SHOULD features implemented in the beta release from the point of viewof the product manager in the context of the Comp@ny. This goal leads to ques-tions: How many M features are in beta release? How many S features are in betarelease? Both questions are measured with MF(x), x ∈ {M, S ,C,W} percentagesof features by category (Must, Should, Could, Would) in the product release.
Decisions regarding business goal realization are documented in the interpre-tation model as (this is a portion of the interpretation model, related to the goalB3): [. . .] if MF(M) = 100 and MF(S ) ≥ 30 then B3 is on track else re-evaluatelevel-3 decisions; [. . .]
For this example, we assume that in the short time period of 5 years, the BVAis unaffected by external factors such as inflation, the cost of capital, etc.
4.2 The Business Value Analysis
First, general context and assumptions of the BVA characterize the current business-financial situation, current and future investment initiatives, and time constraintsregarding investments. The business owners (stakeholders) are assessed with re-spect to the available size of the investment (¤10 million) and time period forwhich the business value analysis is done (5 years).
There is a context factor that quantifies size of investment (I), which is catego-rized with respect to the absolute number of investment units (money or any equiv-alent), while the benefits size (B(I)) is categorized as the relative quantity of theinvested amount. Given the available resources of ¤10 million, the Comp@ny’sbusiness owners were able to provide such quantifications, which made it possibleto define the acceptable risk model [16].
The top-level value goal (V0) is defined as: Activity to analyze the value(focus) of business (object) for the magnitude of acceptable risk exposure (AREmodel); within a timeframe of 5 years in the context (scope) of Comp@ny withconstraints of current resources availability. Relations are to the top-level business
20
Organizational Earned Value Analysis
goals.The strategy to address the level-i value goal is evaluate value (ROI) of the
level-i business goals. Applying the strategy to all business goals, in our case,results in value goals V1, V2 and V3. The value goal V3 is associated with businessgoal (B3) and documented as: estimate costs and benefits of the business goal B3for the time frame of 5 years.
All costs and benefits are estimated in FTE (Full-Time Employee) units. Esti-mated level-3 benefits were about 36 FTEs in a 5-year period, mainly due to sav-ings accomplished by the introduction of new technology. While, estimated level-3costs were about 200 FTEs in a 5-year period. The estimates include cost/benefitprojections for the goal’s realization and later for the goal’s maintenance.
In parallel with benefit/investment analysis, business goal owners are asked toidentify key assumption(s) about the realization of goals, and to assess the goal’srisk exposure (RE). Acceptable risk exposure and risk exposure are assessed on afive-point scale (VH–very high, H–high, M–medium, L–low, and VL–very low)[16]. The summary of business value analysis is given in Table 4.1.
The Comp@ny’s business goal and strategy to modernize its testing businessby extending its existing range of products with IP testing products have a businessvalue due to the large benefits realization potential. The level of overall investmentfor the period of five years is relatively small, but there is significant risk, whichexceeds the acceptable risk level, associated with the development of the IP test-ing product (a high likelihood of not having stable product requirements on time).Potential failure of the goal B3 is a threat to the top-level business goal realiza-tion. During the feedback session, business owners acknowledged the situationand approved the business goals as such.
Based on results of BVA for the business goal and strategy to modernize thetesting business, Comp@ny’s management made the decision to proceed with thestrategy implementation.
4.3 Organizational Earned Value Analysis
Budget and planned benefits do not just specify the total amount of the financialresources available and overall gains from benefits; they also specify the dynamicsof expenditures and of benefits realization materialization.
For the Comp@ny’s case, we created the budget and planned benefits accord-ing to the estimates assessed during the BVA. In order to demonstrate differentpotential situations that can occur during the execution phase, we simulated datafor four different scenarios.
Ideal case (Scenario 1) In an ideal case, the goals realization proceeds accordingto plan with minor variations in the budgeted costs and planned benefits realization.Cost-related earned value metrics (Table 3.2) have similar values. In the graph, wecan see plots that are close to each other. The cost performance index for all goals
21
Tech. Report: TR-TOL-2010-0303
converges toward a value of 1, meaning that all costs are on budget. We can observethe same situation with benefits-related earned value metrics. Both performanceindices are converging toward a value of 1, forming a kind of funnel shape.
Total disaster (Scenario 2) In the second scenario, we simulated the worst pos-sible situation. Actual costs exceed budgeted costs, while there is no sign of goalrealization. This situation is easily recognizable; BCWP and PBRM values arevery small, close to zero, meaning that there is no progress with goals realization.Furthermore, because BCWP < BCWS < ACWP is true for all goals and thegap between them is constantly increasing over time, actual cost is far over budgetwith uncorrectable delays. Cost performance indices converge toward small val-ues, while the situation with the benefits performance indices is mirrored (largervalues are an indication of benefits that are less materialized than planned).
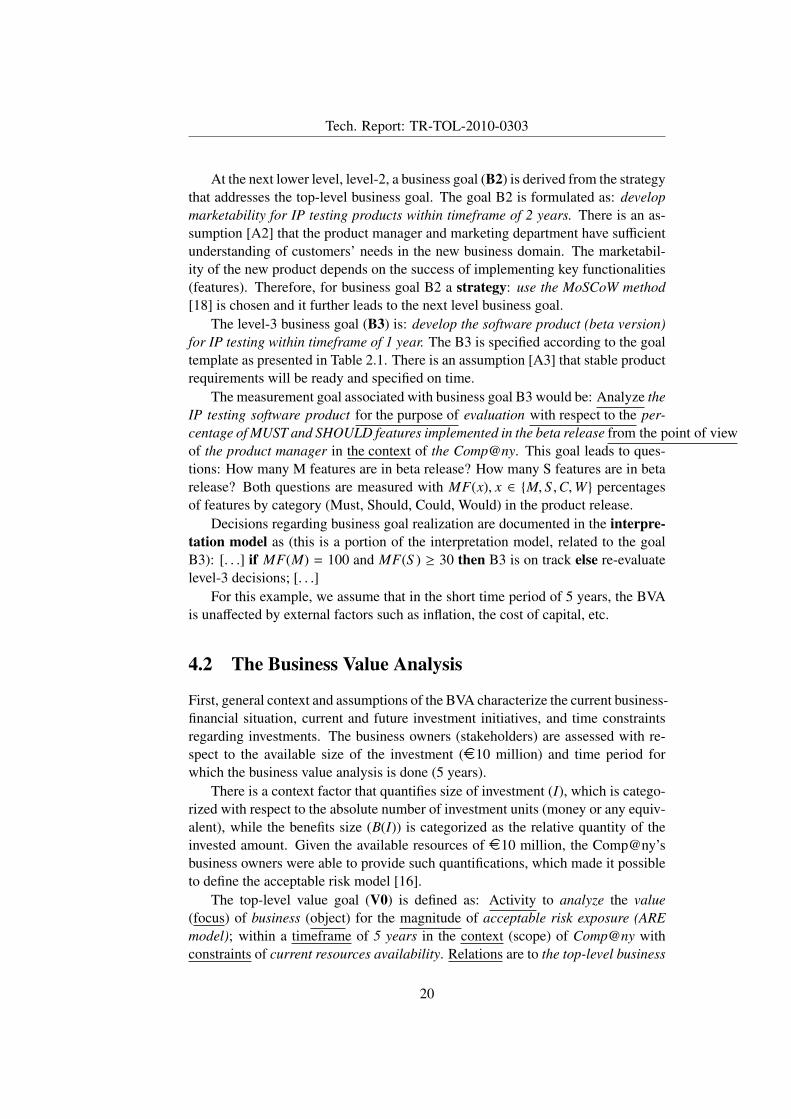
Effective realization (Scenario 3) This scenario illustrates a hypothetical situ-ation where the chosen strategies at all levels are achieving results, with limitedbut acceptable variations from the plan. Earned value metrics are plotted in Figure4.1. The top-level business goal B1 was realized in the given timeframe of 5 years(BCWS = BCWP in year 5), with around 20% more costs than budgeted (cost per-formance indices are converging toward 0.8). At the same time, there was about50% less planned benefits realized (performance indices converge toward 1.5). Ifwe further analyze the metrics, we can see that significant deviation from the plansoccurred after the first year. Earned value metrics for the goal B3 indicate that re-alization of the goal was lagging behind in the first year (BCWP < BCWS ). Also,for the same period, the goal B3 was over budget (ACWP > BCWP), and after oneyear and a half the goal B3 was achieved (BCWS = BCWP). From the funnel-likeshape formed by performance indices we can conclude that in general all chosenstrategies were achieving results. In the end, actual expenditures were about 592FTEs, while realized benefits were about 795 FTEs (calculated as explained in Sec-tion 3.1). This situation illustrates the advantage of having information regardingthe tracking of not only costs, but also of benefits. The possibility of balancingcost-related information with benefits realization increases the validity of the deci-sion to proceed with goal realization despite over-budgeted costs.
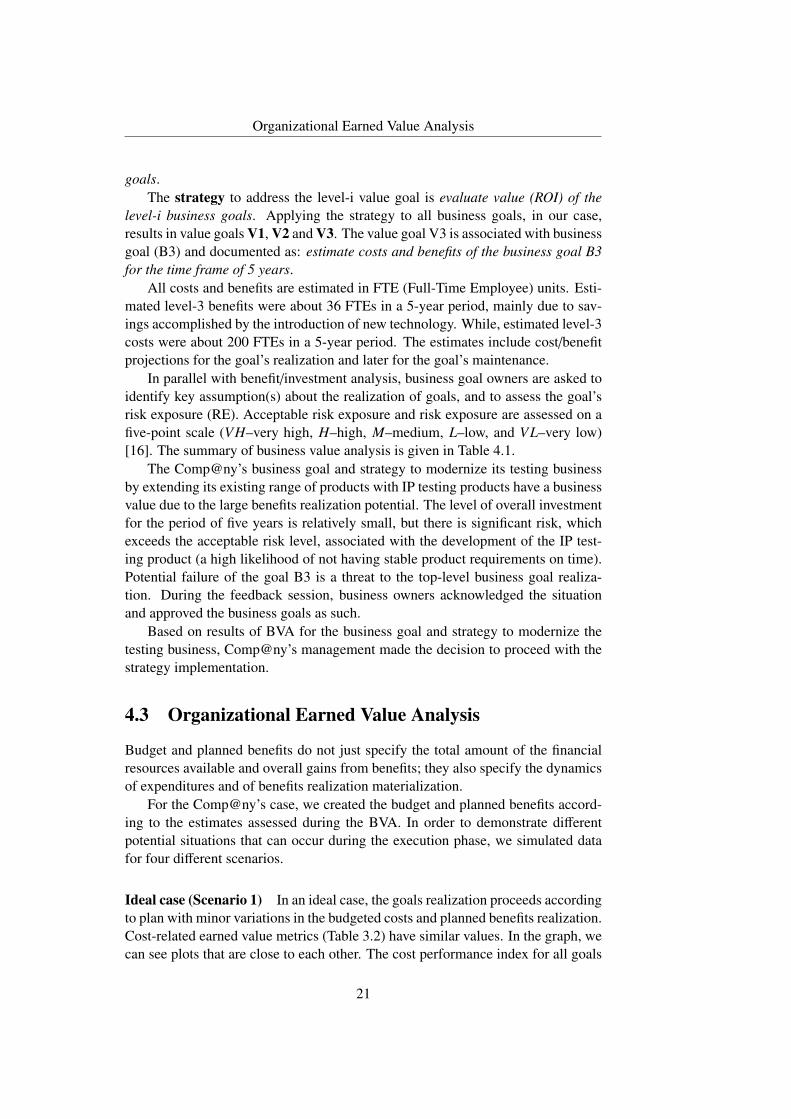
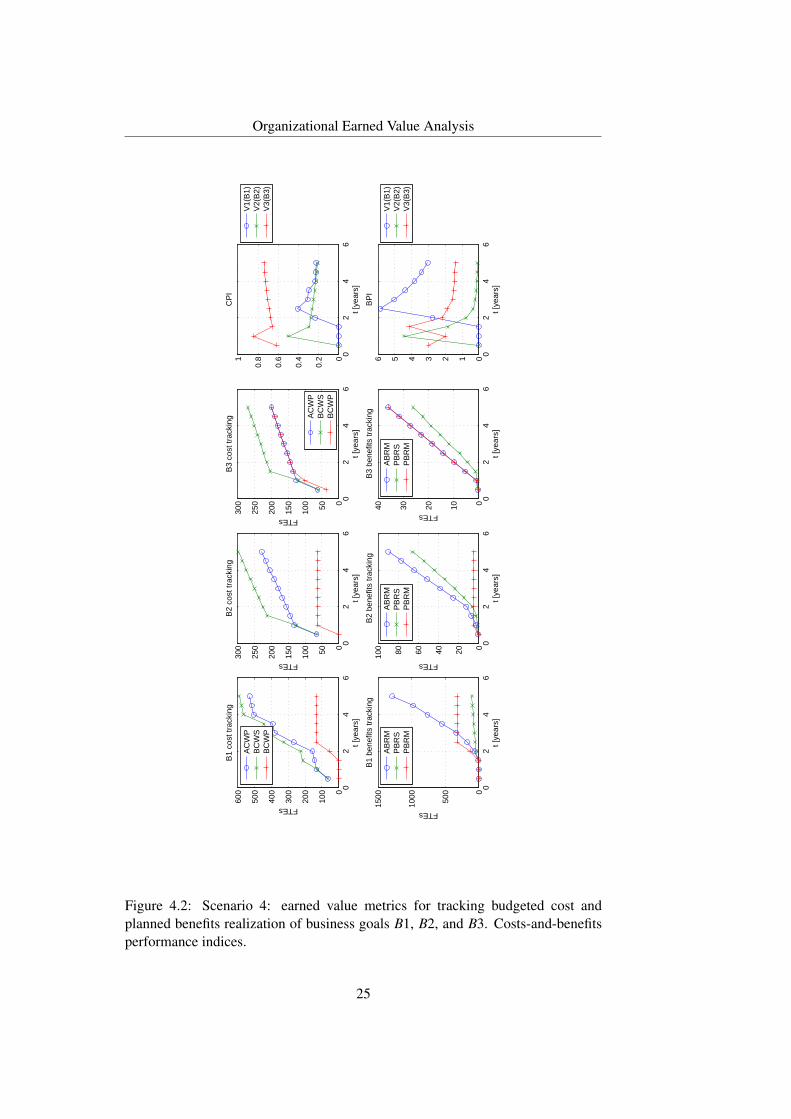
Ineffective strategy (Scenario 4) The last scenario illustrates a situation whererealization of the lower-level goal proceeds according to plan, but at the same time,the upper-level goal realization is not achieved. Earned value metrics for this sce-nario are plotted in Figure 4.2. The plots for the top-level business goal B1 in-dicate that after the second year, the goal realization was halted (no changes inBCWP and PBRM values). With further analysis, we can conclude that the B3goal was achieved after 1.5 years with additional costs of about 35% over budget(CPI = 0.66). Further, on the next upper level, we can see that the realizationof goal B2 was halted after the first year. The unsuccessful realization of B2 has
22
Organizational Earned Value Analysis
consequences for the realization of the top-level goal B1. If we compare perfor-mance indices for B3 and B2, it is clear that they are diverging from each other.Apparently, the strategy that links B3 and B2 has to be reevaluated.
4.4 Risk Monitoring
Every six months, the key assumptions of the business goals were checked andthe risk reassessed. For example, in scenario 3, the earlier identified threat of nothaving defined product requirements on time (assumption: [A3]) occurred. Thatwas the reason for the delayed realization of the goals, as the product team couldnot work to full capacity. After the product manager and marketing departmentspecified stable product requirements, the planned team of developers was rein-forced with additional members. This situation is visible from Figure 4.1 as theover-resourcing of goal B3 after the first year (ACWP > BCWP).
Using earned value metrics, we can identify situations, like in our example,when goal realization is behind schedule, or when the goal is under- or over-resourced. Understanding of the reasons for such situations is provided by riskmonitoring. In this example, the reason was not having specified product require-ments on time.
23
Tech. Report: TR-TOL-2010-0303
02
46
0
100
200
300
400
500
600
t [ye
ars]
FTEs
B1
cost
trac
king
AC
WP
BC
WS
BC
WP
02
46
0
500
1000
1500
t [ye
ars]
FTEs
B1
bene
fits
trac
king
AB
RM
PB
RS
PB
RM
02
46
050100
150
200
250
300
t [ye
ars]
FTEs
B2
cost
trac
king
AC
WP
BC
WS
BC
WP
02
46
020406080100
t [ye
ars]
FTEs
B2
bene
fits
trac
king
AB
RM
PB
RS
PB
RM
02
46
050100
150
200
250
300
t [ye
ars]
FTEs
B3
cost
trac
king
AC
WP
BC
WS
BC
WP
02
46
010203040
t [ye
ars]
FTEs
B3
bene
fits
trac
king
AB
RM
PB
RS
PB
RM
02
46
0
0.2
0.4
0.6
0.81
t [ye
ars]
CP
I
V1(
B1)
V2(
B2)
V3(
B3)
02
46
012345
t [ye
ars]
BP
I
V1(
B1)
V2(
B2)
V3(
B3)
Figure 4.1: Scenario 3: earned value metrics for tracking budgeted cost andplanned benefits realization of business goals B1, B2, and B3. Costs-and-benefitsperformance indices.
24
Organizational Earned Value Analysis
02
46
0
100
200
300
400
500
600
t [ye
ars]
FTEs
B1
cost
trac
king
AC
WP
BC
WS
BC
WP
02
46
0
500
1000
1500
t [ye
ars]
FTEs
B1
bene
fits
trac
king
AB
RM
PB
RS
PB
RM
02
46
050100
150
200
250
300
t [ye
ars]
FTEs
B2
cost
trac
king
02
46
020406080100
t [ye
ars]
FTEs
B2
bene
fits
trac
king
AB
RM
PB
RS
PB
RM
02
46
050100
150
200
250
300
t [ye
ars]
FTEs
B3
cost
trac
king
AC
WP
BC
WS
BC
WP
02
46
010203040
t [ye
ars]
FTEs
B3
bene
fits
trac
king
AB
RM
PB
RS
PB
RM
02
46
0
0.2
0.4
0.6
0.81
t [ye
ars]
CP
I
V1(
B1)
V2(
B2)
V3(
B3)
02
46
0123456
t [ye
ars]
BP
I
V1(
B1)
V2(
B2)
V3(
B3)
Figure 4.2: Scenario 4: earned value metrics for tracking budgeted cost andplanned benefits realization of business goals B1, B2, and B3. Costs-and-benefitsperformance indices.
25
Chapter 5
Conclusions
The concepts and ideas introduced by the value-based software engineering frame-work are attractive to business decision-makers. In light of those ideas, we believethat the goal-driven analysis of the business value equipped with earned value anal-ysis as presented in this paper complements the VBSE framework.
The approach presented here is fully aligned with VBSE concepts defined bykey elements. The benefits realization analysis is carried out while analyzing thecontext of goals. The process of defining goals represents stakeholder value propo-sition elicitation and reconciliation. Refining business goals with strategies anddocumenting the relevant context/assumption elements is a way of doing businesscase analysis. Identification of the critical GQM+Strategies sub-grid with regularcontext and assumption updates leads to continuous risk and opportunity manage-ment. Value-based monitoring and control is supported with earned value analysis.The GQM+Strategies grid structure enables us to act on changes by selecting thebest possible opportunity, i.e., viewing change as opportunity. Furthermore, theGQM+Strategies structure helps to better understand the relationship between con-text and the value creation process. Documenting goal+strategies elements cap-tures relevant information about a particular situation and offers an opportunity tostudy value-based decisions and actions for that situation. Such studies could be apart of the organizational learning process.
The most important contribution of this approach is the merger of earned valueanalysis with the GQM+Strategies grid structure. The approach establishes a work-ing structure that integrates the various aspects of business value and enables theanalysis of earned value at different levels of the goal hierarchy, integrating thecost and benefit analysis throughout the grid by enabling the definition and quan-tification of the compound phenomenon. The utilization of GQM graph makesmeasurable not only business goal costs, but allows business goal benefits to bequantified as well by making use of the integrated hierarchy. It allows the calcula-tion of the true earned value of a business goal as the combination of earned valueon the cost side and earned value on the materialized benefits side. For example,in section Section 3.2, we explained how the grid structure can be used to help us
26
Organizational Earned Value Analysis
measure customer satisfaction in terms of financial value.We explained how to use earned value analysis for the purpose of monitoring
the progress of strategies and business goal implementation. As a part of our futurework, we will explore the use of earned value analysis to predict the degree ofdeviation from the original plans (cost, benefit, and schedule). Such predictionscould be used by business owners to decide whether it is worth proceeding withstrategy implementation.
27
Bibliography
[1] V. Basili. The experience factory and its relationship to other improvementparadigms. In I. Sommerville et al., editors, Software Engineering – ESEC’93, LNCS 717, pages 68–83. Springer-Verlag, Berlin Heidelberg, 1993.
[2] V. Basili, G. Caldiera, and D. Rombach. Goal question metric paradigm. InJ. Marciniak, editor, Encyclopedia of Software Engineering, Volume 1, pages528–532. John Wiley & Sons, Inc., New York, 1994.
[3] V. Basili, J. Heidrich, M. Lindvall, J. Munch, M. Regardie, and A. Trendow-icz. GQM+Strategies –aligning business strategies with software measure-ment. pages 488–490, Madrid, Spain, 2007. First International Symposiumon Empirical Software Engineering and Measurement, ESEM 2007.
[4] V. Basili and D. Weiss. A methodology for collecting valid software engi-neering data. IEEE Transactions on Software Engineering, 10(6):728–738,1984.
[5] G. Bockle, P. Clements, J. McGregor, D. Muthig, and K. Schmid. CalculatingROI for software product lines. IEEE Software, 3(21):23–31, 2004.
[7] B. Boehm. Value-based software engineering: Overview and agenda. Tech-nical report, USC-CSE-2005-504, University of Southern California, ParkCampus, Los Angeles, 2005.
[8] B. Boehm. Value-based software engineering: Overview and agenda. InS. Biffl et al., editors, Value-Based Software Engineering, pages 3–14.Springer-Verlag, Berlin-Heidelberg, Germany, 2005.
[9] B. Boehm and L. Huang. Value-based software engineering: a case study.Computer, 3(36):33–41, 2003.
[10] B. Boehm and K. Sullivan. Software economics: A roadmap. pages 319–343,Limerick, Ireland, 2000. International Conference on Software Engineering2000.
28
Organizational Earned Value Analysis
[11] D. Brandon. Implementing earned value easily and effectively. Project Man-agement Journal, 29(2):11–19, 1998.
[12] H. Erdogmus, J. Favaro, and W. Strigel. Return on investment. IEEE Soft-ware, 3(21):18–22, 2004.
[13] P. Grunbacher, S. Koszegi, and S. Biffl. Stakeholder value proposition elic-itation and reconciliation. In S. Biffl et al., editors, Value-Based SoftwareEngineering, pages 133–154. Springer-Verlag, Berline Heidelberg, 2006.
[14] L. Huang and B. Boehm. How much software quality investment is enough:A value-based approach. IEEE Software, 5(23):88–95, 2006.
[15] T. Little. Value creation and capture: A model of the software developmentprocess. IEEE Software, 3(21):48–53, 2004.
[16] V. Mandic and V. Basili. An approach for evaluating business goals. Techni-cal report, TOL-2010-0001, Oulu, Finland, 2010.
[17] J. Thorp. The information paradox: realizing the business benefits of infor-mation technology. McGraw-Hill Ryerson, Toronto, Canada, 2003.
[18] L. Tierstein. Managing a designer/2000 project. pages 1–6, USA, 1997.Whitepaper, presented at the New York Oracle Users Group Conference (NY-OUG Fall ?97).
[19] R. van Solingen. Measuring the ROI of software process improvement. IEEESoftware, 3(21):32–38, 2004.
[20] R. van Solingen and E. Berghout. The Goal/Question/Metric Method: a prac-tical guide for quality improvement of software development. The McGraw-Hill Company, Maidenhead; England, 1999.


![Organizational Earned Value Analysisbasili/publications/technical/T143.pdf · Organizational Earned Value Analysis ... through the benefits–realization approach [17] and risk/opportunity](https://static.documents.pub/doc/80x56/5f1096447e708231d449d752/organizational-earned-value-analysis-basilipublicationstechnicalt143pdf-organizational.jpg)


