31
Chapters Organizational Profile
| Date post: | 17-Mar-2018 |
| Category: |
Documents |
| Upload: | truongdang |
| View: | 226 times |
| Download: | 1 times |
Chapters
Organizational Profile
Cliapter-3
Organizational Profile
The Indian paper industry is an important industry contributing
significantly toward the socio economic development of the country. The first
mechanized paper machine was set up in 1832 (Jain, Singh and Kulkami-
2005) in India. The Indian paper industry shows an unique picture, with a mix
of large and small paper mills, having capacities that range from 500 to 600
tones per year (medium sized) and average size of 11,500 tones per year (of
large size). There are more than 600 pulp and paper mills producing nearly 6.2
million tones/yr. of pqjer and board, against an installed capacity of about 8.6
million tones. The industry has turnover of more than $35 million employing
nearly 300,000 people directly and another Imillion people indirectly, hidia
can proud for Ballarpur Industries Ltd. (BILT), J.K Paper that was the
members of Million Tonners' Club. BILT entered at the position-90 of the list
of Million Tonners' Club in the year 2003 . The Hindustan Paper Corporation
(HPC) is one of the largest public sector paper indusu-ies, playing a significant
role in p^er-based economy of the country that needs a fresh preciation. In
this context, the present chapter of the study is devoted to describe the Origin
of HPC, its Competitive Positions, Production and Performance, and its
Contributions to human capital formation and development. The sources of
73
these contents/data were various published reports, in-house news journals,
unpublished records. Websites etc.
3.1. Origin of Hindustan Paper Corporation (HPC)
The Hindustan Paper Corporation (HPC), a Government of India
enterprise, owns and operates two printing and writing paper mills in Assam
State; the first, is the Nagaon Paper Mill (NPM) located at Kagajnagar,
Jagiroad (Morigaon); and the second is Cachar Paper Mill (CPM) located at
Panchgram. This is not enough to say about the birth of HPC. To recall the
history of HPC, we must be remembering the days in the end of sixties when
there had been acute shortage of paper in our country. Then paper was not
available for the textbooks, exercise books and stationary items for daily use.
Therefore, our government established Hindustan Paper Corporation Ltd. to
make available of the writing and printing papers and newsprint directly to the
consumers at a reasonable price. Thus, the Hindustan Paper Corporation came
into being 29* May 1970 in room no. 258 of Udyog Bhavan, at New Delhi.
Keeping in view, the developmental activities of the North Eastern
States of our country and to make full use of the available bamboos as raw
material, Nagaon Paper Mill (in the/then Nagoan) now in Morigaon; and
Cachar Paper Mill (in the/then Cachar) districts now Hailakandi district of
Assam were established. Both mills are identical and have installed annual
74
capacity of I Lakh M.T, writing and printing paper each, provision to produce
newsprint also exists. The government of India sanctioned both these mills on
31^ January, 1977 while the decision was formally conveyed to HPC Ltd.
Management on IS*** March, 1977. NPM started its commercial operation in
October 1985, and CPM started in April 1988. After fighting out with the
teething problems, both the mills are now in ahead on the path of progress and
bodi had operating profits during the financial year 2003-04 as appeared in the
table 3.2.
3.II.Subsidiaries of HPC
At the initial period, there were three subsidiaries of the corporation.
The government of India handed Mandiya News Print Limited to HPC after
taking over and nationalizing in a sick condition, while the other two
established by the corporation under its own supervision. The concise
description of them is as follows.
Hindustan News Print Limited: When the Govt, of India instituted HPC in
1970, Kerala News Print Project planned as one of the imits of HPC. The
same project later converted into the subsidiary of HPC and named Hindustan
News Print Limited (HNL). The foundation stone of the Mill was laid on 10*
June, 1975 by the then Honourable Industry Minister of India Sri T.A. Pai, in
presence of the chief Minister of Kerala Sri Achuta Menon. Rs. 160 cr.
75
allocated to complete the project with the capacity of 80,000 M.T. per annum.
The trial production started on 26* Feb, 1982 and commercial production
began in Nov, 1982. HNL is the biggest and unique unit of its type in Asia,
and is credited with first mill in the country to produce newsprint with
eucalyptus wood. This mill is known for the ultra modem J.M. Voith (known
as GMBH) machine, can run at the speed of 650/tainute and can produce 44 to
55 GSM p£^er on the trim of 6.8 metres. HNL is presently employing 1125 no
of persons, of which 98 (8.71%) are female employee (Annexure 11 to the
directors report, as on March 31** 2004).
Nagaland Pulp & Paper Company Limited (NPPC Ltd.): The NPPC Ltd
was registered on 14 Sept. 1971 with an initial authorized capital of Rs. 8 cr.
of which Rs. 7 cr. was contributed by the government of India through HFC
and Rs. I crore was by the govt of Nagaland. The capital contribution ratio
was maintained in the same ratio later on also. The prime objective of the mill
was overall and complete development of state and established in the
Mukoksang District of Nagaland. The Mill was ready by September 1981 and
the production of the paper started soon. The installed capacity of the mill is
33,000 M.T per armum, and produced strength, durable, bright quality of
papers in this mill was comparatively better, than the production of other
mills, which is completely based on bamboo. Though the present section of
76
the chapter-3 has covered the subsidiaries but the central focus of the study is
on the Paper Mills located in Assam, i.e. NPM and CPH the remaining part
of the chapter would concentrate on NPM, CPM, and as a whole HPC.
3.111. Competitive environment for paper industries in India
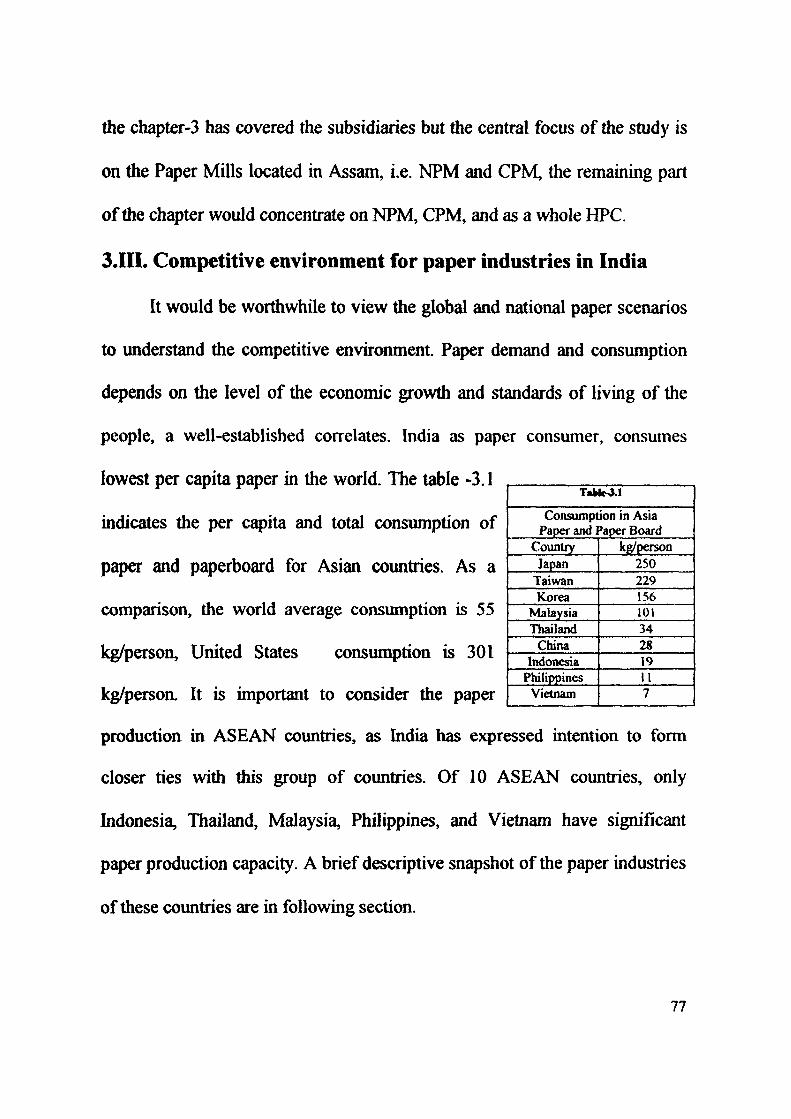
It would be worthwhile to view the global and national paper scenarios
to understand the competitive environment Paper demand and consumption
depends on the level of the economic growth and standards of living of the
people, a well-established correlates. India as paper consumer, consumes
lowest per capita paper in the world. The table -3.1
indicates the per c^ita and total consumption of
paper and paperboard for Asian countries. As a
comparison, the world average consumption is 55
kg/person. United States consumption is 301
kg/persoa It is important to consider the paper
production in ASEAN countries, as India has expressed intention to form
closer ties with this group of countries. Of 10 ASEAN countries, only
Indonesia, Thailand, Malaysia, Philippines, and Vietnam have significant
paper production capacity. A brief descriptive snapshot of the paper industries
of these countries are in following section.
TaMcs}.!
Consumption in Asia Paper and Paper Board
Country Japan
Taiwan Korea
Malaysia Thailand
China Indonesia
Philippines Vietnam
kg/person 250 229 156 101 34 28 19 11 7
77
Indonesia: Indonesia is among the ASEAN countries, having highest paper
production capacity with total paper and board production of 7.75 million
tones in the year 2003. Of this production, 2.63 million tones (i.e. 1/3 '*) were
exported. Printing and writing paper produced 3.05 million tones in the year
2003, of which 1.58 tonnes being exported. 385300 tonnes were exported out
of 592,100 tonnes of total production of Newsprints. Indonesia is significant
exporter of paper in the region and has the cq)acity for large volume-low cost,
high quality production. It will not be possible for Indian paper industry to
export Indonesia unless it able to match with Indonesian producer on low cost
production and quality.
Thailand: Among the ASEAN countries Thailand bearing 2° highest
production capacity of paper and board, produced 3.6 million tonnes in the
year 2003. Of this production, 22% (715,000 tonnes) was exported. Printing
and writing paper production was 921,000 tonnes in the year 2003, and
358,000 tonnes being exported. News print production was 120,000 tonnes in
the year 2003, represents half of domestic consumption. Expansions and
Greenfield investments in the 1990s tripled the Thailand's pulping capacity.
Growing condition of hardwood, especially availability of eucalyptus enabled
to think Thailand as the exporter of pulp ^om the hard wood. Thailand
expected to remain an exporter of hardwood pulp in the near future.
78
Malaysia: Malaysia bears the third highest production capacity of Paper
among the ASEAN countries. It produced paper and board 1.32 million tonnes
in total in 2003. It produced 165, 000 tonnes of printing and writing paper,
and 253,000 tonnes of newsprint in the year 2003. Malaysia imported 410,000
tonnes of printing and writing paper and 203,000 tonnes of newsprint in the
year 2003.
Philippines: Philippines had a total paper and board production of 0.93
million tonnes in 2003. Of this production, 14% (134,000 tonnes) was
exported. Printing and paper production was 103,000 tonnes. Newsprint
produced 299,000 tonnes, of which 133,000 tonnes had been exported.
Vietnam: Vietnam produced 642,000 tonnes of paper and board and imported
80,000 tonnes of pulp and 87,000 tonnes of wastepaper in the year 2003. This
imbalance of demand and supply conditions is strategically showing
opportunity to Indian paper industry for trading of paper with Vietoam.
China: Historically, China is a self-sufficient producer as well as consumer of
paper and board. Presently rapidly increasing consimiption of paper products
is being outpacing the internal production capacity. The consumption of paper
products in china reached 42.6 million tonnes in 2003, which is making tlie
2nd largest paper market in the world. In April 2005, India and China
announced strategic partnership for the bilateral trade and commerce between
79
the countries to $20 billion by 2008 and $13 billion in the 2004. With this new
partnership, paper market of both the country will/is being effecting. But, for
India, China will continue as the net importer of p^er. Because of
geographical proximity between the two countries, India could potentially
become and important supplier of paper to China.
Here lies the competition of Indian paper industries. The Indian paper
industry which is the 15th largest in the world consist of approximately 515
pulp and paper productions scattered throughout the country employing 1.3
million of people (the draft report of Sandwell- 114546/1, May 2005)7. The
total installed capacity is approximately 6.7 Million tones with an effective
capacity of 6.2 million tones. The paper production has had growth rate of 5.5
percent over the last 2000-01, 2001-02, and 2002-03 respectively. In the year,
2003-04 paper industry in India recorded the production of 6 percent growth
rate, which was in die line of expected growth rate of Indian GDP. However,
in the wake of economic liberalization, triggered by the new economic policy
of the government of India- 1991, the Indian paper industry found itself
confronted with intemational competition. Almost overnight, the industry was
exposed to the difficult of integrating into the global economy.
80
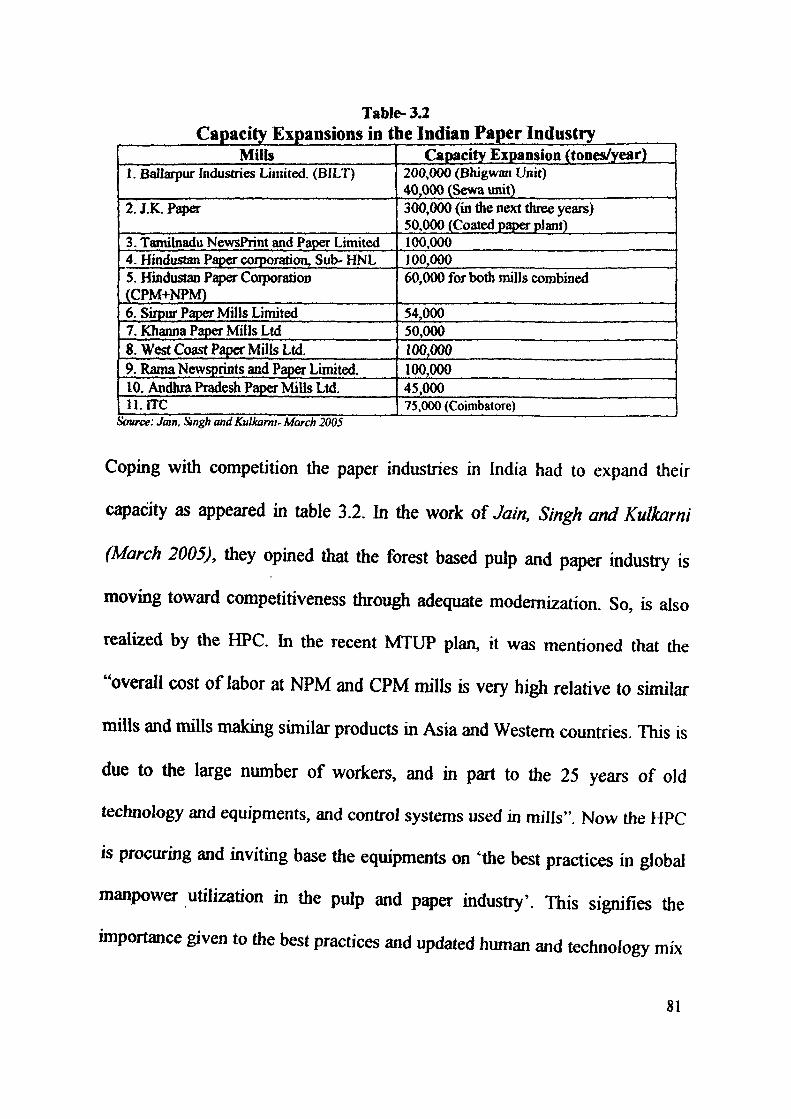
Table-3.2 Capacity Expansions in the Indian Paper Industry
Mills I. Ballarpur Industries Limited. (BILT)
2.J.K.Paper
3. Tamilnadu NewsPrint and Paper Limited 4. Hindustan Paper corporation. Sub- HNL S. Hindustan Paper Coiporatioo (CPM+NPM) 6. Siipur Paper Mills Limited 7. Khanna Paper Mills Ltd 8. West Coast Paper Mills Ltd. 9. Rama Newsprints and Paper Limited. 10. Andhra Pradesh Paper Mills Ltd. n.rrc
Source: Jain. Stngh and Kulkami-March 2005
Capacity Expansion (tones/year) 200,000 (Bhigwan Unit) 40.000 (Sewa unit) 300,000 (in the next three years) 50,000 (Coated paper plant) 100.000 100,000 60,000 for both mills combined
54,000 50,000 100,000 100,000 45,000 75,000 (Coimbatore)
Coping with competition the paper industries in India had to expand their
capacity as appeared in table 3.2. In the work of Jain, Singh and Kulkami
(March 2005), they opined that the forest based pulp and paper industry is
moving toward competitiveness through adequate modernization. So, is also
realized by the HPC. In the recent MTUP plan, it was mentioned that the
"overall cost of labor at NPM and CPM mills is very high relative to similar
mills and mills making similar products in Asia and Western countries. This is
due to the large number of woricers, and in part to the 25 years of old
technology and equipments, and control systems used in mills". Now the HPC
is procuring and inviting base the equipments on 'the best practices in global
manpower utilization in the pulp and p^er industry'. This signifies the
importance given to the best practices and updated human and technology mix
SI
at HPC to match the modem technology and know how followed by paper
industries of other part of the country and world.
3.IV. Efforts of HPC for Modernizations
Realizing the need to modernize the paper industry with an aim to
match with stiff competition, the govt, of India showed commitment to
strengthen the competitiveness of high performing Public Sector Enterprises
(PSEs) and increased the investment in this paper sector of North-East India.
As a signal of govt's commitment, Hon'ble Chief Minister Shri Tarun Gogoi,
Hon'ble Union Minister of State (independent charge). Heavy Industries and
Public Enterprises, Shri Santosh Mohan Dev, unfolded the Modernization and
Technological Up gradation Plans (MTUP) of HPC, NPM at Jagiroad on
January 19, 2005 and at CPM on 20'*' January 2005. The management
community of HPC expressed their expectation that successfiil
implementation of MTUP program within the four years, and after completion
of implementation, HPC would be able to attain the numero-uno position in
the paper industry. While unfolding the MTUP plan in CPM Hon'ble Minister
Sri Santosh Mohan Dev stated - "In spite of various constraints CPM has
shown significant achievement in the areas of Energy Conservation,
Elimination of wastage. Efficient use of Resources, production improvement
and environment management". Also, the minister complimented on the
82
workers of and HPC management team for their excellent performance and
record of accomplishment of the mill. Later on, the hon'ble minister
inaugurated the Enterprise Resource Plaiming in HPC-CPM centre. On March
31, 2005, HPC signed Memorandum of Understanding (MoU) for the
financial year 2005-06 in the Udyog Bhavan, New Delhi. HPC targeted to
achieve sales target of Rs. 1050 crores. Beside the corporation in ensures
optimum utilization of existing assets for maximizing generation of internal
resources for funding modernization and expansion of installed capacity. HPC
plans to implement technological up gradation of the existing plant, and
equipment for deriving maximum benefits in terms of increased volume of
production and improved quality for achieving overall cost effectiveness and
competitiveness, hi addition to above, HPC is also putting due emphasis on
the following dynamic parameters to attain sustained growth and
improvement:
* Quality-Surveillance Audit for 180-9001:2000 Certification;
•Customer Satisfaction-Customer Orientation(Strategic Bus.
Unit/Product wise);
* HRD (Training & Motivation)
* R&D for Sustained and Continuous Innovation;
* Project hnplementation and Capital Investment for de-bottlenecking
ofresources;
* Control on Consumption of Coal, Grid Power, and Water;
83
* Production of Value Added Paper and Increase of Open Market Sale;
* Setting up of Sheet Making Facility by Local Entrepreneurs from the
residuals.
3.V. Performance Overview of HPC
Logically, while describing the organizational profile a brief snapshot
on performance of the organization were incorporated. The following sections
are being devoted to briefly describe the performance under the following
sub-heads-
* Performance overview- Financial Performance, Contribution to
National Exchequer;
* Operational Overview, Production Trend (CPM & NPM),
* Contribution toward the human capital development and formation;
* Contributions of human capital toward HPC.
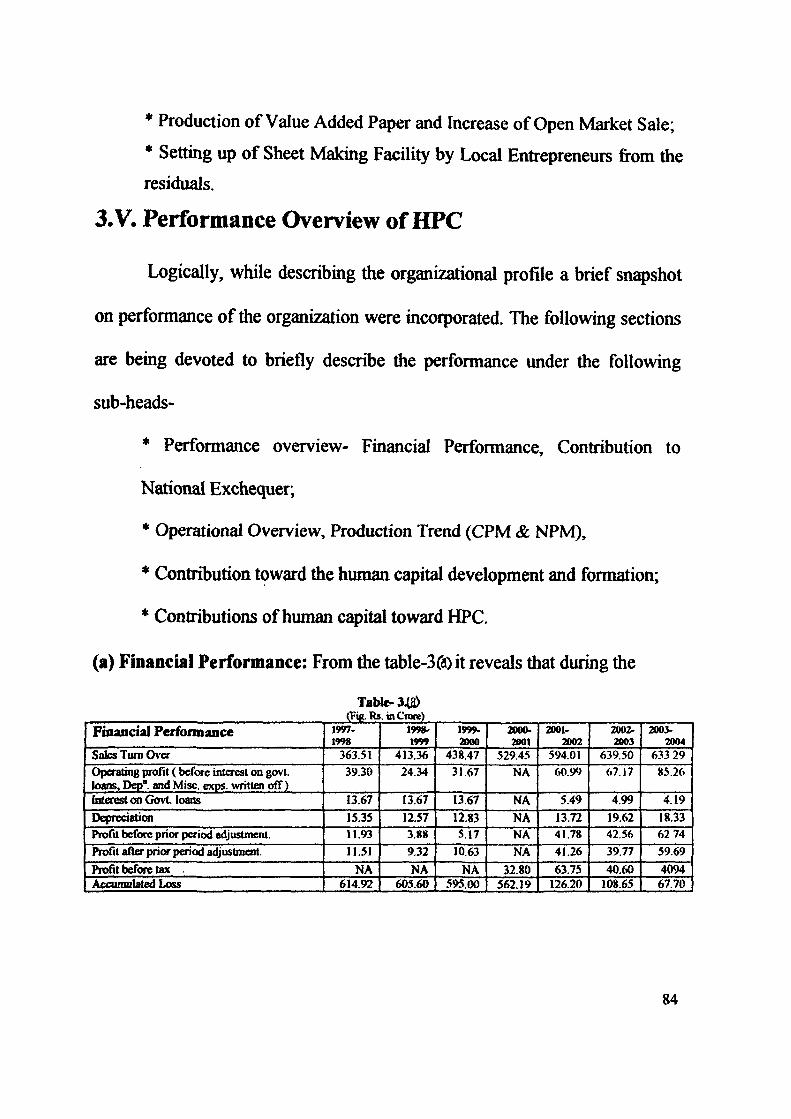
(a) Financial Performance: From the table-Bra)^ reveals that during the
Financial Perfonnance
Saks Turn Over operating profit (bcfcH e interest on govt loans, Dep". and Misc. exps. written off) (aterestcmGovL loans
Depreciation Profit before prior period adjustment. Profit after prior period adjustment.
Profit before tax . Accumulated Loss
Table-3X3) (Fig. Rs. tnCtDte)
1997. t998
363.51 39.30
13.67
15.35 11.93
11.51
NA 614.92
199»' 1999
413.36 24.34
13.67
12.57 3.8H
9.32
NA 605.60
1999-aooo
438.47 31.67
13.67
12.83 5.17
10.63
KA 595.00
2000-2001
529.45 NA
NA
NA NA NA
32.80 562.19
2001-
594.01 60.99
5.49
13.72 41.78
41.26
63.75 126.20
2002-2003
639.50 67.17
4.99
19.62 42.56
39.77
40.60 108.65
2003-2004
633 29 85.26
4.19
18.33 62 74
59.69
4094 67.70
84
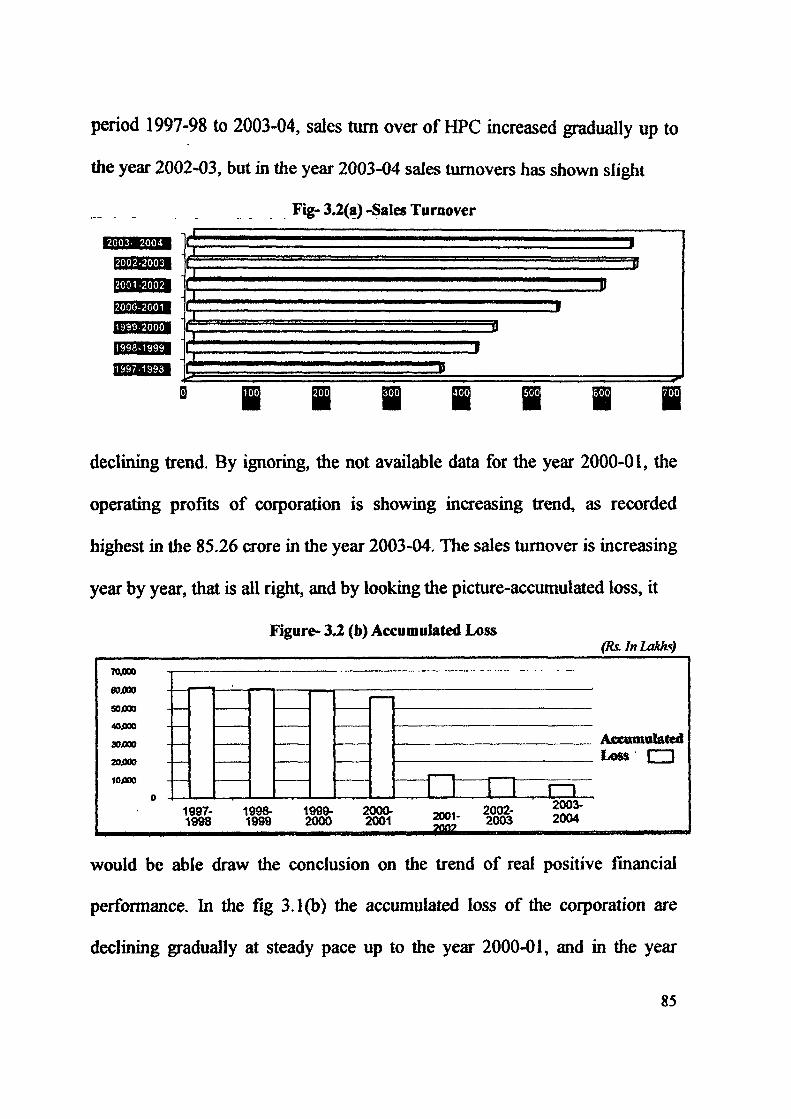
period 1997-98 to 2003-04, sales turn over of HPC increased gradually up to
the year 2002-03, but in the year 2003-04 sales turnovers has shown slight
Fig-3.2(a)-Sales Turnover
mmsM
declining trend. By ignoring, the not available data for the year 2000-01, the
operating profits of corporation is showing increasing trend, as recorded
highest in the 85.26 crore in the year 2003-04. The sales turnover is increasing
year by year, that is all right, and by looking the picture-accumulated loss, it
Figure- 3.2 (b) Accumulated Loss (Rs. In Lakhs)
90000
sofxn 40JDOO
30j000
lOJXtO
lOjOOO
—
"TTTn ,
Acconialated Loss I t
1997-1998
1998- 1999- 2000-1999 2000 2001
5001 2002-2001- 2003 JSSim
2003-2004
would be able draw the conclusion on the trend of real positive financial
performance. In the fig 3.1(b) the accumulated loss of the corporation are
declining gradually at steady pace up to the year 2000-01, and in the year
85
financial year 2003-04 it had come down to the lowest, which is showing a
real positive perfonnance trend from the financial angle.
(b) Review of Operational Performance of HPC; To describe operational
performance of the corporation the data has been collected for the year 1998-
99 to 2004-05. By compiling data for productions of both unit/year, and
capacity utilization a comparative picture of the units was depicted which
unfolded a picture of performance of the corporation.
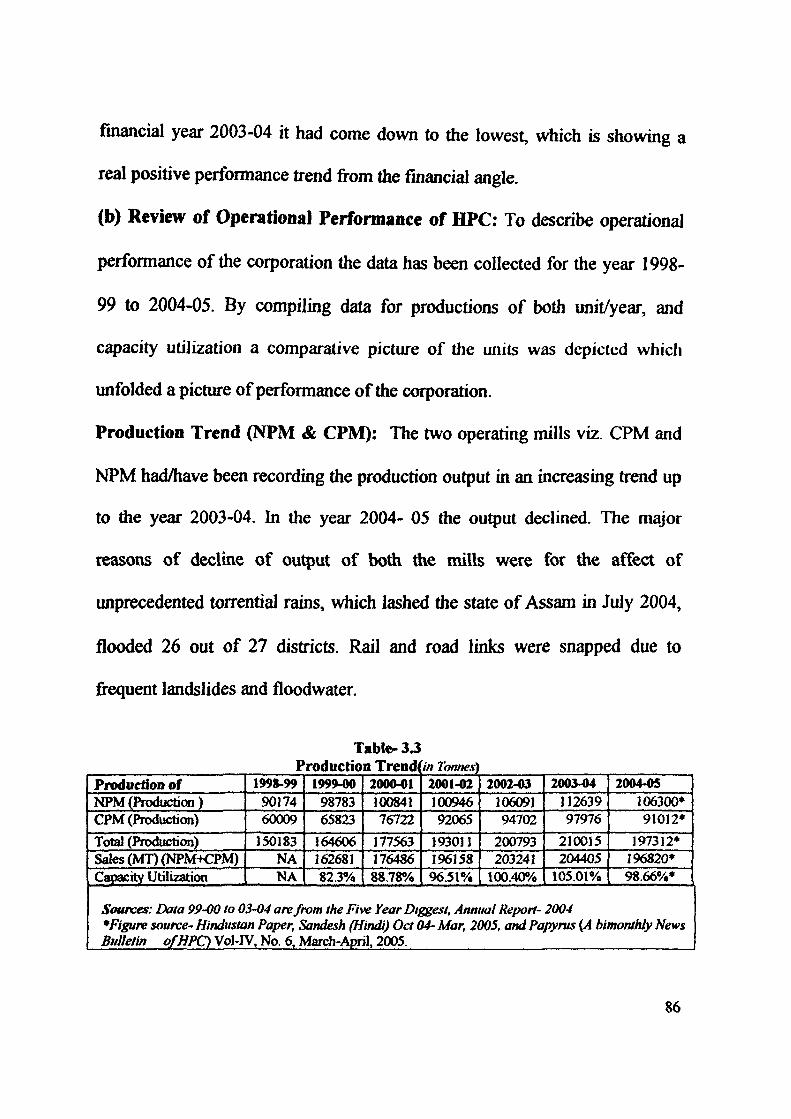
Production Trend (NPM & CPM): The two operating mills viz. CPM and
NPM had/have been recording the production output in an increasing trend up
to the year 2003-04. hi the year 2004- 05 the output declined. The major
reasons of decline of output of both the mills were for the affect of
unprecedented torrential rains, which lashed the state of Assam in July 2004,
flooded 26 out of 27 districts. Rail and road links were snapped due to
frequent landslides and fioodwater.
Production of NPM (Production ) CPM (Production)
Total (Production) Sales (MT) (NPM+CPM) Capacity Utilization
Table- 3 J Production Trend
199S-99 90174 60009
150183 NA NA
1999-00 98783 65823
164606 162681 82.3%
2000 )1 100841 76722
177563 176486 88.78%
in Tonnes) 2001-02 100946 92065
193011 196158 96.51%
2002-03 106091 94702
200793 203241
100.40%
2003-04 112639 97976
210015 204405
105.01%
2004-05 106300* 91012*
197312* 196820* 98.66%*
Sources: Data 99-00 to 03-04 are from the Five YearDiggest, Annual Report- 2004 *Figure source- Hindustan Paper, Sandesh (Hindi) Oct 04-Mar, 2005, and Papyrus {A bimonthly News Bulletin ofHPO VoWV, No. 6. March-April, 2005.
86
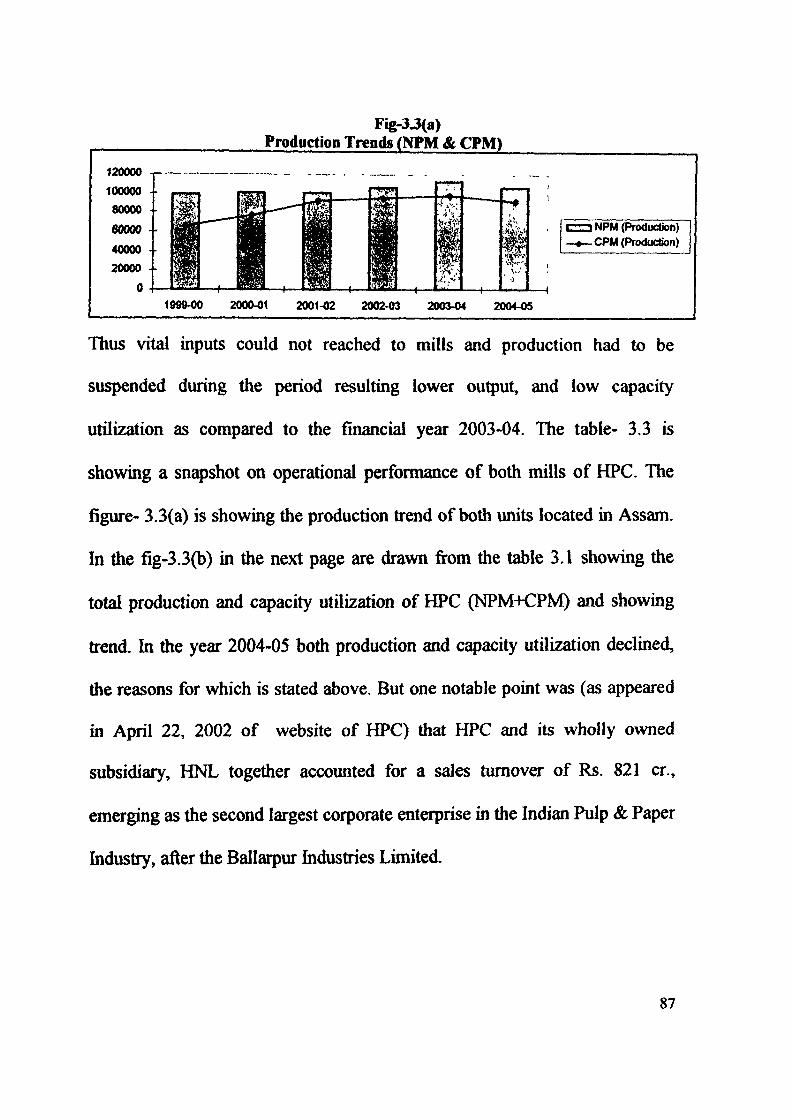
Fig-3J(a) Production Trends (NPM & CPM)
( i.it
i^
-f-
• ^ ^ i ~ - l NPM (Production) —»— CPU (Production)
1 0 9 9 ^ 200(M)1 2001-02 2002-03 2003-04 2004-05
Thus vital inputs could not reached to mills and production had to be
suspended during the period resulting lower output, and low capacity
utilization as compared to the financial year 2003-04. The table- 3.3 is
showing a snapshot on operational performance of both mills of HPC. The
figure- 3.3(a) is showing the production trend of both units located in Assam.
In the fig-3.3(b) in the next page are drawn from the table 3.1 showing the
total production and capacity utilization of HPC (NPM+CPM) and showing
trend. In the year 2004-05 both production and capacity utilization declined,
the reasons for which is stated above. But one notable point was (as appeared
in April 22, 2002 of website of HPC) that HPC and its wholly owned
subsidiary, HNL together accounted for a sales turnover of Rs. 821 cr.,
emerging as the second largest corporate enterprise in the Indian Pulp & Paper
Industry, after the Ballarpur Industries Limited.
87
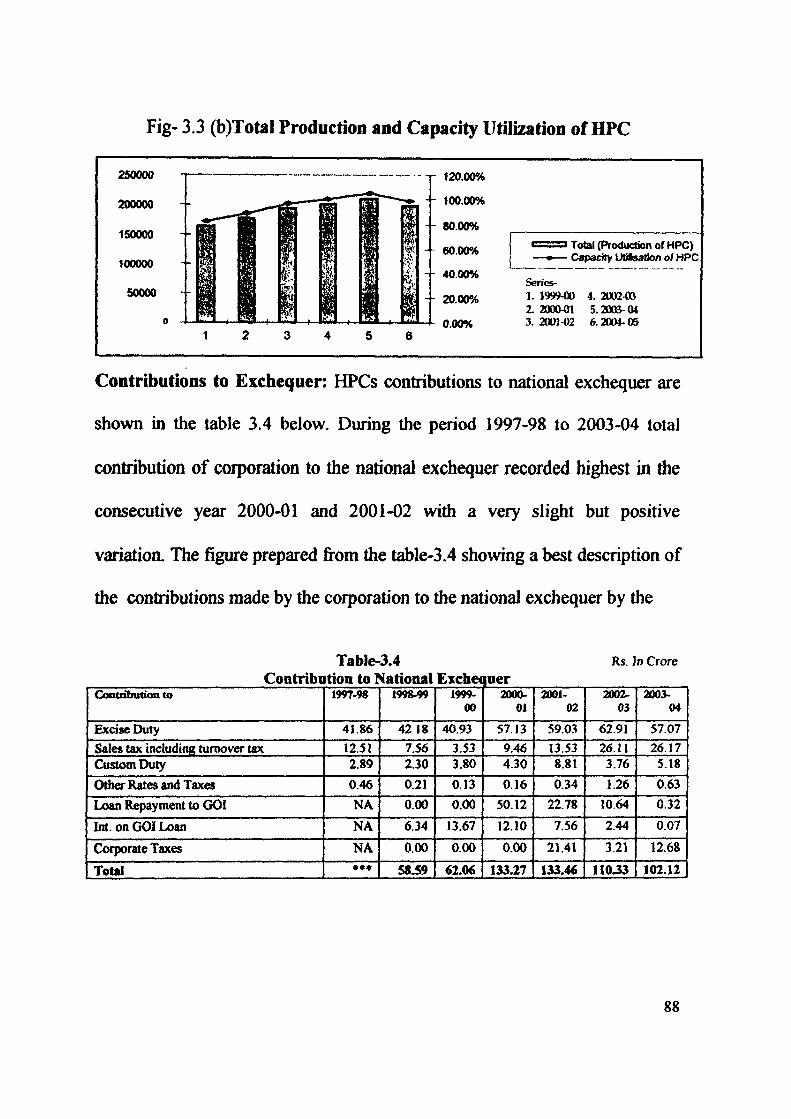
Fig- 3.3 (b)Total Production and Capacity Utilization of HPC
a Total (Production of HPC) — Capacity VOtMOon of HPC
Serics-1. 1999-0) 4. 20024» i 200(Wn 5.2D(B-0* 3.2001-02 6.200*-05
Contributions to Exchequer: HPCs contributions to national exchequer are
shown in the table 3.4 below. During the period 1997-98 to 2003-04 total
contribution of corporation to the national exchequer recorded highest in the
consecutive year 2000-01 and 2001-02 with a very slight but positive
variation. The figure prepared from the table-3.4 showing a best description of
the contributions made by the corporation to the national exchequer by the
TabIe-3.4 Contribution to National
Conti&butioa to
Excise Duty
Sales tax tacluding turnover tax Custom Duty
Other Rates and Taxes
Loan Repayment to GOI
Int. on GOI Loan
Corporate Taxes
Total
1997-98
41.86
12.51 2.89
0.46
NA
NA
NA
•«*
199g^
42 18
7.56 2.30
0.21
0.00
6.34
0.00
S»JS9
Exchequer 1999-
00
40.93
3.53 3.80
0.13
0.00
13.67
0.00
62M
2000-01
57. J 3
9.46 4.30
0.16
50.12
12.10
0.00
133J7
2001-02
59.03
13.53 8.81
0.34
22.78
7.56
21.41
133.46
Rs. In CTOTC
2002-03
62.91
26.11 3.76
1.26
10.64
2.44
3.21
110.33
2005-04
57.07
26.17 5.18
0.63
0.32
0.07
12.68
102.12
88
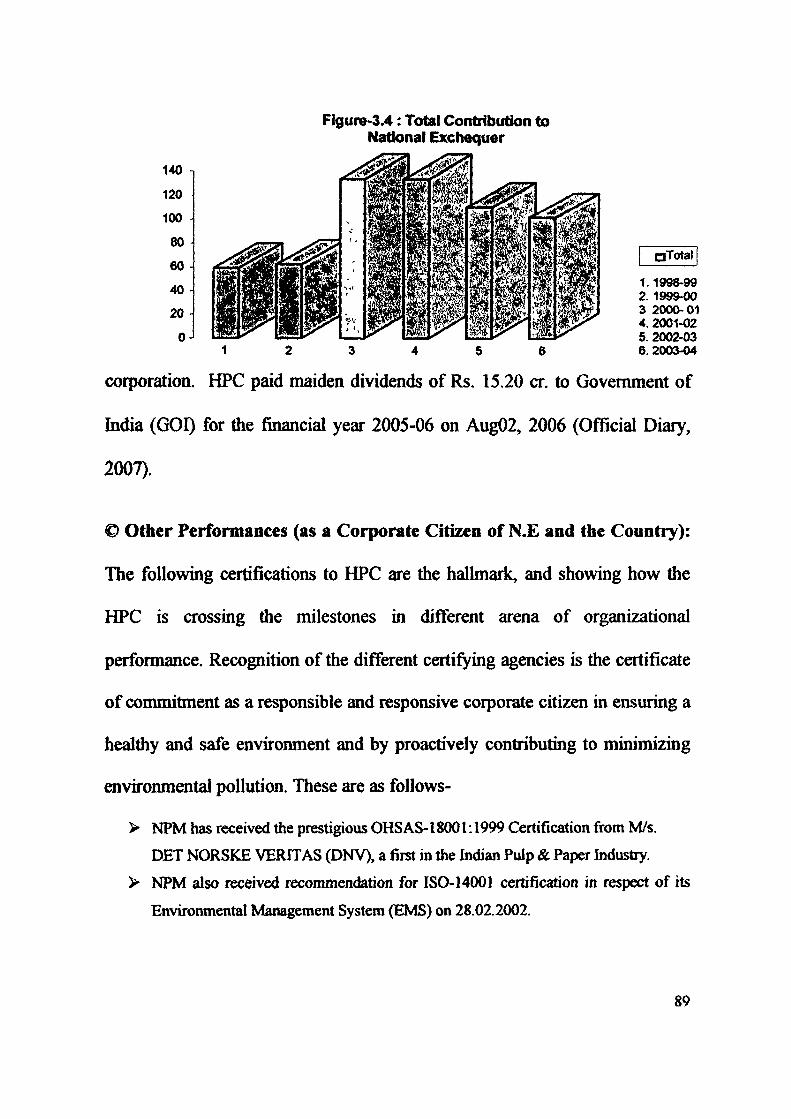
Figure-3.4: Total Contribution to National Exchequer
140
120
100
80 -I
60
40 -j
20
0->
pTotal
1.1998-99 2. 1999-00 3 2000-01 4. 2001-02 5. 2002-03 6.2003-04
corporation. HPC paid maiden dividends of Rs. 15.20 cr. to Government of
India (GOI) for the financial year 2005-06 on Aug02, 2006 (Official Diary,
2007).
<0 Other Performances (as a Corporate Citizen of N.E and the Country):
The following certifications to HPC are the hallmark, and showing how the
HPC is crossing the milestones in different arena of organizational
performance. Recognition of the different certifying agencies is the certificate
of commitment as a responsible and responsive corporate citizen in ensuring a
healthy and safe environment and by proactively contributing to minimizing
environmental pollution. These are as follows-
> NPM has received the prestigious OHSAS-I800l:l999 Certification from M/s.
DET NORSKE VERITAS (DNV), a first in the Indian Pulp & Paper Industry.
> NPM also received recommendation for ISO-14001 certification in respect of its
Environmental Management System (EMS) on 28.02.2002.
89
> CPM got ISO 14001 Certification for its Environmental Management System
(EMS) in January 2003, HPC group thus becomes the first corporate entity in the
Indian Pulp and Paper Industry to have attained both ISO 9001 and ISO 14001
Certification for its 3 operating mills.
> Salt Lake Housing Complex of HPC had been awarded the ISO: 14001: 1996,
Environmental Management Certification by Det Norkse Veritas (DNV),
Netherland.
> Received Environment Aw^rd 2003-04, conferred by Indian Paper Manufacturer
Association (IPMA) in appreciation and recognition for disj^aying sincere
commitment for environmental protection activities under very demanding and
trying circumstances by NPM
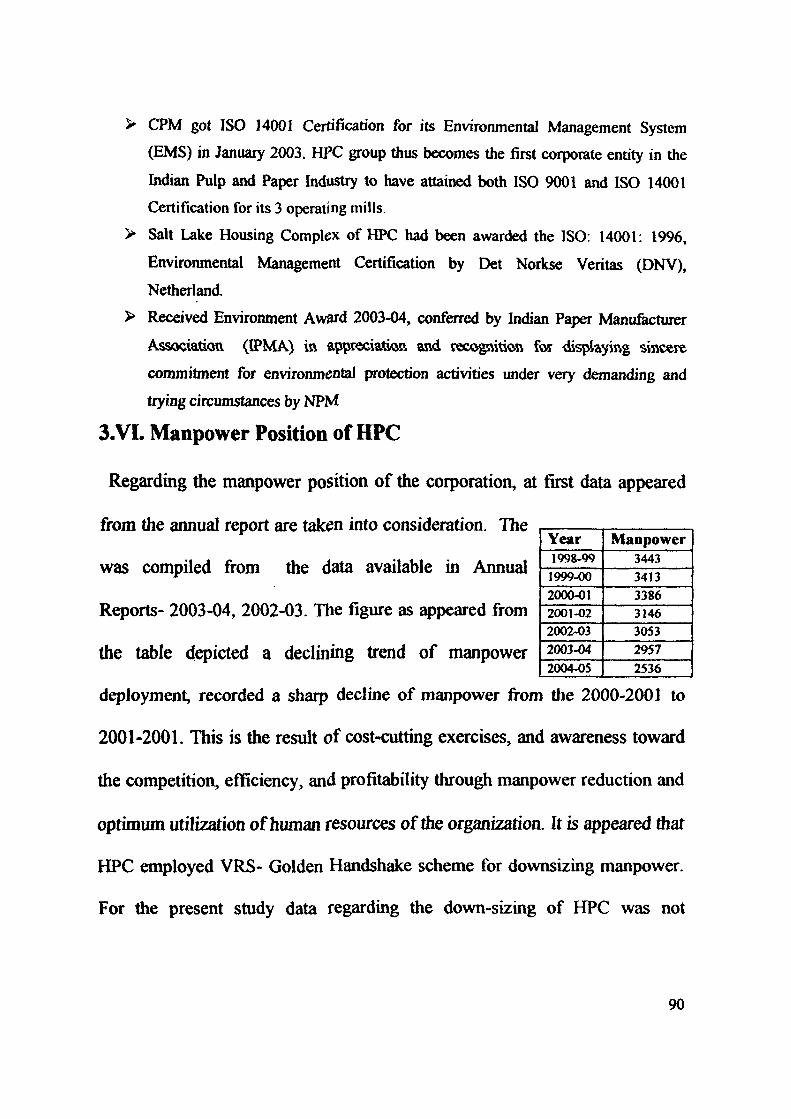
3.VL Manpower Position of HPC
Regarding the manpower position of the corporation, at first data appeared
from the annual report are taken into consideration. The
was compiled from the data available in Annual
Reports- 2003-04, 2002-03. The figure as appeared from
the table depicted a declining trend of manpower
deployment, recorded a sharp decline of manpower from the 2000-2001 to
2001-2001. This is the result of cost-cutting exercises, and awareness toward
the competition, efficiency, and profitability through manpower reduction and
optimum utilization of human resources of the organizatioa It is appeared that
HPC employed VRS- Golden Handshake scheme for downsizing manpower.
For the present study data regarding the down-sizing of HPC was not
Year 1998-99 1999-00 2000-01 2001-02 2002-03 2003-04 2004-05
Manpower 3443 3413 3386 3146 3053 2957 2536
90
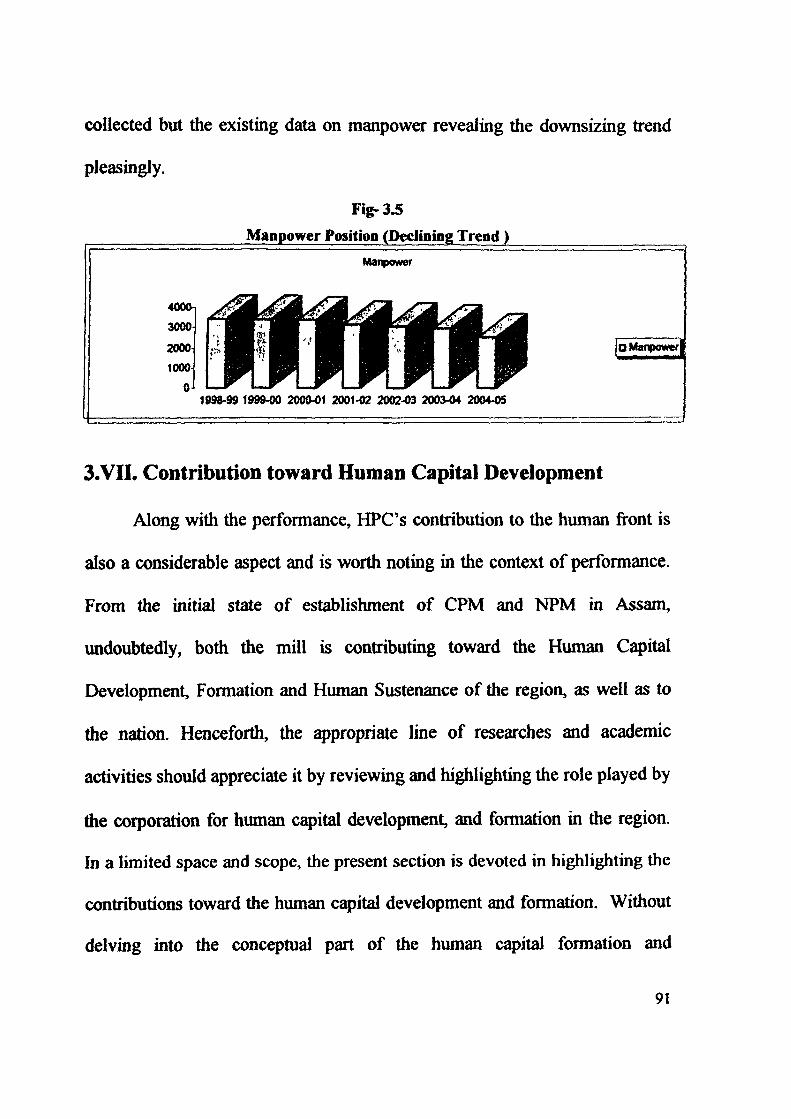
collected but the existing data on manpower revealing the downsizing trend
pleasingly.
Fig. 33
Manpower Position (Declining Trend ) Manpower
400(h
3000
2000
1000
OJ ig9&-99 1999-00 2000-01 2001-02 2002-03 2 0 0 3 ^ 2004-05
D Manpower
3.VII. Contribution toward Human Capita] Development
Along with the performance, HPC's contribution to the human front is
also a considerable aspect and is worth noting in the context of performance.
From the initial state of establishment of CPM and NPM in Assam,
undoubtedly, both the mill is contributing toward the Human Capital
Development, Formation and Human Sustenance of the region, as well as to
the nation. Henceforth, the ^propriate line of researches and academic
activities should appreciate it by reviewing and highlighting the role played by
the corporation for human c£q)ital development, and formation in the region.
In a limited space and scope, the present section is devoted in highlighting the
contributions toward the human capital development and formation. Without
delving into the conceptual part of the human capital formation and
91
development, it is better to simplify the meaning that HPC as a socially
responsive organization, contributing towards skill formation of upcoming
generation of human/work-force. HPC is facilitating to a large number of
students from technical and non-technical institutes in getting In-Plant
training. At the same time, HPC is developing their own Human Capitals
through the human resource development (HRD) programmes to match with
the demanding situation of the organization. The follovraig section under the
two subheads, first, Human Capital Development, and secondly. Human
Capital Formation would appreciate this valuable contributions of the
corporation.
Human Capital Development (Through Training and Development): The
basic method of human capital development is the training and development
(T&D). T&D activities are looked alter by the T&D section under the control
of Human Resources and Employment Services (HR&ES) department of both
mills-i.e. NPM and CPM. Realizing the need for Human Resources
development for production, productivity, and competitiveness, HPC has/had
been conducting a large number of training and development programmes
every year. The T&D division of both mills is organizing the programmes
under the three broad heads. First one is the In-Company Programmes-
covered the programs which are managed within the company, and organized
92
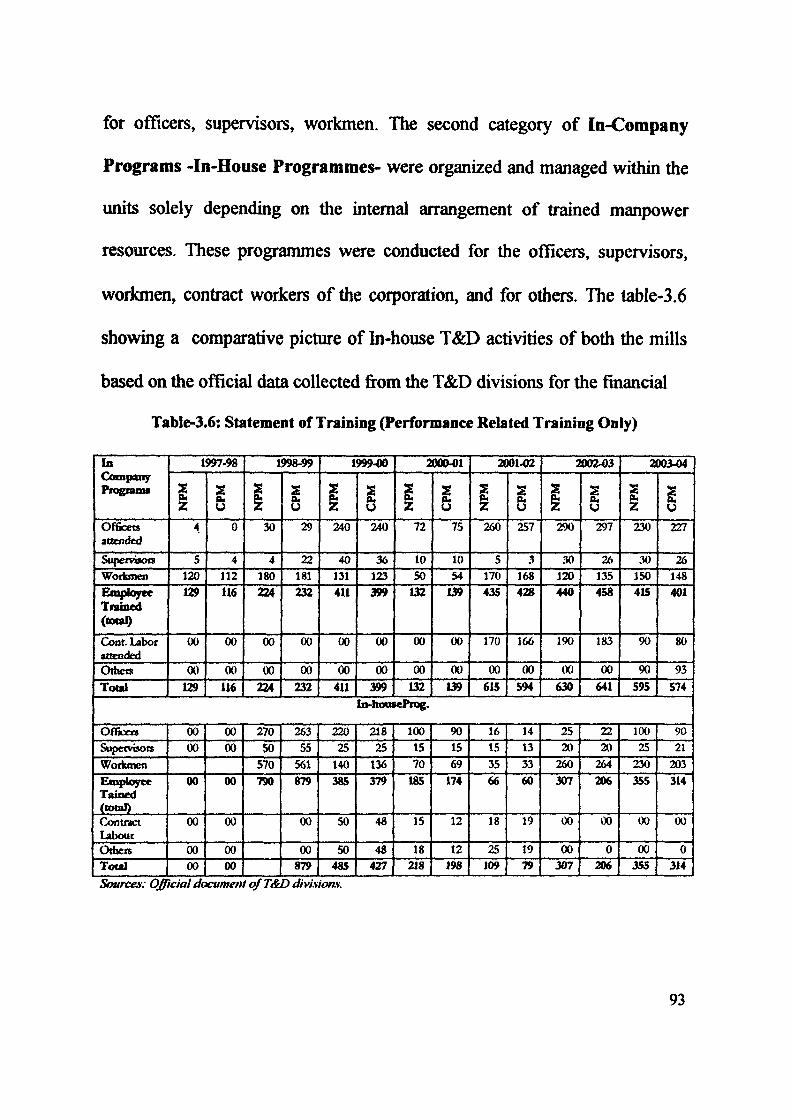
for officers, supervisors, workmen. The second category of In-Company
Programs -In-House Programmes- were organized and managed within the
units solely depending on the internal arrangement of trained manpower
resources. These programmes were conducted for the officers, supervisors,
workmen, contract workers of the corporation, and for others. The table-3.6
showing a comparative picture of In-house T&D activities of both the mills
based on the official data collected from the T&D divisions for the financial
TabIe-3.6: Statement of Training (Performance Related Training Only)
In ComfKUiy Prognun*
Officets attended
SuperviROts
Woribnen
Etapioytt Teamed (total)
Coat. Labor attended Otheo Total
1997-98
z 4
5 120 129
00
a) 129
0
4 112 116
00
00 116
1998-99
1 30
4 180 224
00
00 224
u 29
22 181 232
00
ai 232
1999-00
s
240
40 131 411
00
00 411
fiu
240
36 123 399
00
00
399
2000^1
i 72
10 50
132
00
00 132
75
10 54
139
00
00 139
2001-02
fiu
z 260
5 170 435
170
00 615
RU U
257
3 168 428
166
00 594
20024)3
1 290
30 120 440
190
(XI 630
297
26 135 458
183
00 641
20034)4
1 Z 230
30 150 415
90
90 595
S W 227
26 148 401
80
93 574
In-hoaseProg.
OfBcTrt Supetvisois Wofkmen Eaqjloyec Tained (total) Cont«a Labour Others Total
00 00
00
00
00 00
00 00
00
00
00 00
270 50
570 790
263 55
561 879
00
00 879
220 25
140 38S
50
50 485
218 25
136 379
48
48 427
100 15 70
185
15
18 218
90 15 69
174
12
12 198
16 15 35 66
18
25 109
14 13 33 60
19
19 79
25 20
260 307
00
00 307
22 20
264 206
00
0 206
UK) 25
230 355
00
00 3155
90 21
203 314
00
0 314
Sources: Official document of T&D divisions.
93
year 1997- 98 to 2003-04. The corporation is also conducting external T&D
programmes for the officers, supervisors, and workmen. The Company with
the help of other T&D institutes and HRD related agencies have/had
organized the external programs. The external T&D programmes conducted
for performance enhancement backup, development of ultradex skills, and
development of organization and management techniques. The table-3.7 (in
appead3X'3) is showing a comparative picture of external T&D programmes
organized by the both the mills of the corporation.
Organizational Development Training: The diird major type of training
organized by corporation (NPM+CPM) is organization development training
organized for the cadre of junior management development, and for the cadre
of workmen to transfer the learning of organizational development (OD). The
table -3.8 (in annexure ) is showing a comparative picture of OD training
organized by both the mills of the corporations and shows the concern for
need for OD knowledge enhancement for all cadres of employee of the
corporation/mills. By categorizing the T&D activities of the corporation on
the basis of nature and skills transferred to workplace, then can be seen that
the HPC is more concemed with developing of Ultradex, Sure-skill, and
Predicta. As defined by the Manpower Corporation, ultradex skill denotes
the skills pertaining to several important light industrial skills. Sure-skilb
94
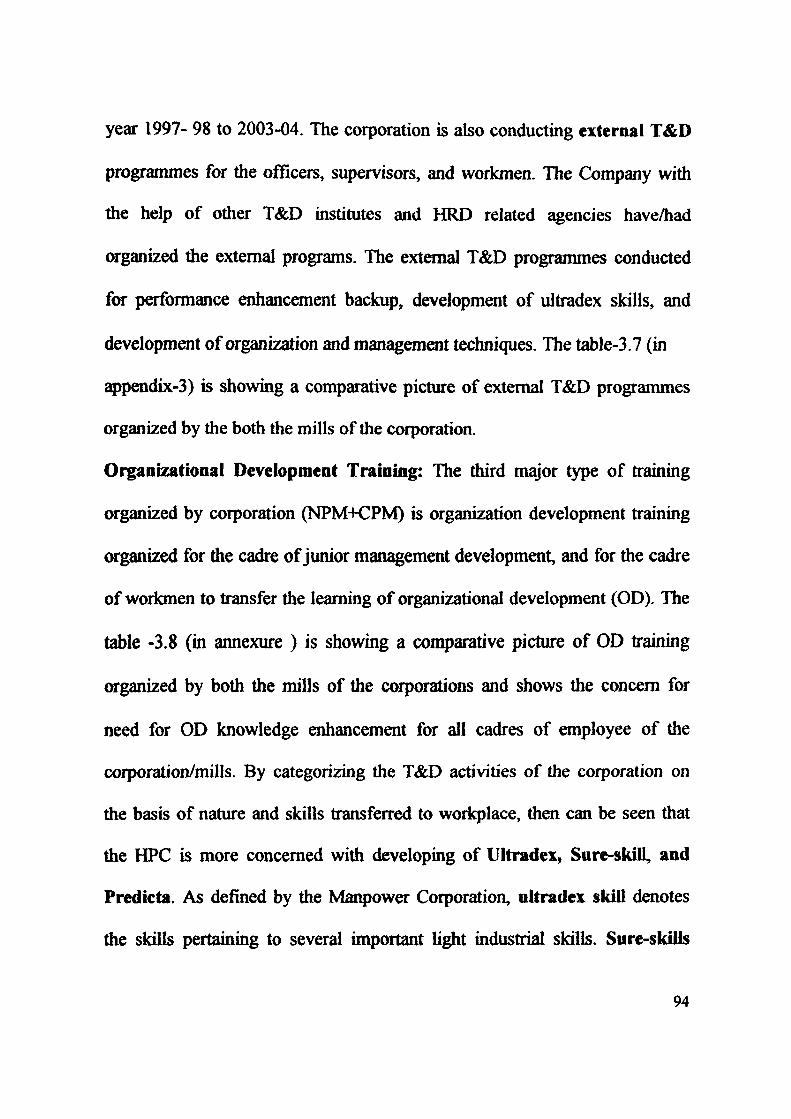
means for office automation skills, and complex software related skills
necessary in modem industries. Predicta skill denotes critical general office
Table-3.9: Programs for Different type of Skill Transfer
Programmes Use of Safety Equqpment & Emergency Preparedness
Use of Fist Aid and Fire Equqmient
Fire Training Campaign
Contract Labour Training Program: Excellence and Quality Assurance
Campaign on occupational Health and Medical Aid
Contract labour Training Programe
Chemical Recovery (for shop floor Technical staf^ executive-l cadre)
Environmental Legislation relevant to Industry
Chemical Recovery, Environmental Management
Iiulustrial Hydraulics
bidu^rial Steam Turbine Governing System
Executive development (By IIM-C)
Electrical Safety (NFC, Mumbai)
Equipment Maintenance (CD-Kolkata)
Fitter Course (Advanced Trainning Institute- Kolkata)
Negotiation Skill- Towards a positive IR environment (CD- Kolkata)
ERF- Trainning, Computer Awareness
Type of Skills Ultradcx/inhouse
UHradex/inhouse
Ultradex/inhouse
UltiBdex/inhouse
Ultradex/inhouse
Ultradex/inhouse
Ultradex/inhouse
Predicta/inhouse
Ultradex/Predicta/inhouse
Ultradex/inhouse
Uhradex/.inhouse
Predicta/Extemal
Ultradex/Extemal
Uhradex/Extemal
Ultradex/Extemal
Predicta/Extemal
SureskiU/Exlemal
Sources: KOMPOL. Darpan
and organizational skill. The table- 3.9 was prepared on the basis of available
information on HRD and T&D of the organization that appeared in the news
letters of both the mills to show various types of training organized for
knowledge and skill, formation and development of the employees of both the
mills.
95
2.VIII. Interactions with the institutes
Trainings were conducted in interaction with some nodal institutions.
Few of them are-
1. CII (Eastern Region); 2. Indium Institute of Technology, Roorkee, Institute of Paper Technology; 3. CPPRl, Saharanpur, 4. Cross Cultural Communication Centra, New Delhi; 5. National Productivity Council, New Delhi, Guwahati, 6. National Safety Council, Mumbai; 7. Advanced Trainning Institute, Kolkata; 8. CETE, STQC, Kolkata; 9. Central Board of Workers Education; 10. Fire Trainning Institute, Jamshedpur, 11. Indian Chambers of Commerce; 12. Ahmed Management Technologies Private Limited (AMTPL) Kolkata; 13. ISTM (DOP, Govt, of India, New Delhi); 14. L& T, Mumbai; 15. ICWAI; 16. Indian Institute of Material Management; 17. Indian Institute of Technology, Guwahati; 18. National Power Training Institute, Nagpur; 19. Indian Institute of Entrepreneurship, Guwahati, 20. Det Norkse Veritas (DNV) Kolkata, 21.XLRI; 22. NITIE, Mumbai, 23. CBI- Academy, Ghaziabad.
3.IX. Human Capital Formation
As a responsible corporate citizen of the country, HPC has been
playing a significant role in skill development/skill development of human
capital in the region. Both the mills of the corporation are providing support in
skill formation of technical non-technical trainees under the guidance of
apprenticeship role of govt, of India Yearly at least 20 such trainees are
96
getting facilities in both the mills of the corporation. The table-3.l0 (in
Appendix-2) is showing the picture of numbers trainers received training
facilities for skill formation in both the mills.
Other than the apprenticeships, both the mills are providing In-Plant
training facilities to students of different Institutes of technical and non
technical courses. Among Uic students of technical courses such as
Mechanical, Civil, Electrical, Electronics, Industrial Engineering., and
Industrial Safety are getting facilities for attending in-plant training in both the
mills. The students of professional courses such as MBA, MSW, Urban
Plaiming and Management are also getting facilities in conducting research-
based study with the support of the guidance of executives of both the mills.
Even the research scholars for doctoral programs are also conducting research
in botii the mills. At the time of survey within the mills, the researcher of the
present study met one scholar from economics; other is from the chemical
sciences that were conducted study with the support data, and laboratory of
the HPC. Table-3.\0{appendiX'2) of the earlier page is showing data regarding
In-Plant trainees who received training in both the mills of Assam. A notable
point is that, NPM received more requests to accommodate students from the
institutes due to location, and proximity to major educational institutions and
communication facility from the coital city- Guwahati. The statistics as
97
appeared in the KOMPAL- A in-house news journal of NPM, many students
along with their teacher also visiting the mill. In industry, institute linkage the
corporation is playing a vital role. Besides the local industry- institute
interaction, the Mills of HPC are having connections with various types of
institutes of national and International repute. HPC is exchanging knowledge,
facilitating faculty members to express themselves for academic-industry
exchanges. These are directly and indirectly contributions for knowledge
formation and development in the region, and in the country at large.
3.x. Contribution of Human Capital to HPC
So far, the foregoing section attempted delved into the contributions
made by both paper mills in human capital development and knowledge
formation in the region. While we talk about the contributions of corporation
to the human capital formation, then automatically the question of
contribution of human capital toward organization come to the researcher's
mind. The answer to the same was also a part of organizational outcomes of
engagement. Li this section, only Productivity and Human Capital Revenue
are taken into consideration to show human capital contributions to
organization- HPC as a whole. The other parameters such as Human Capital
Cost, Human Capital Return, Satisfaction Percentage, Work Environment
PercentJ^e, Work Climate Percentage, is forwarded to the next chapter-IV.
98
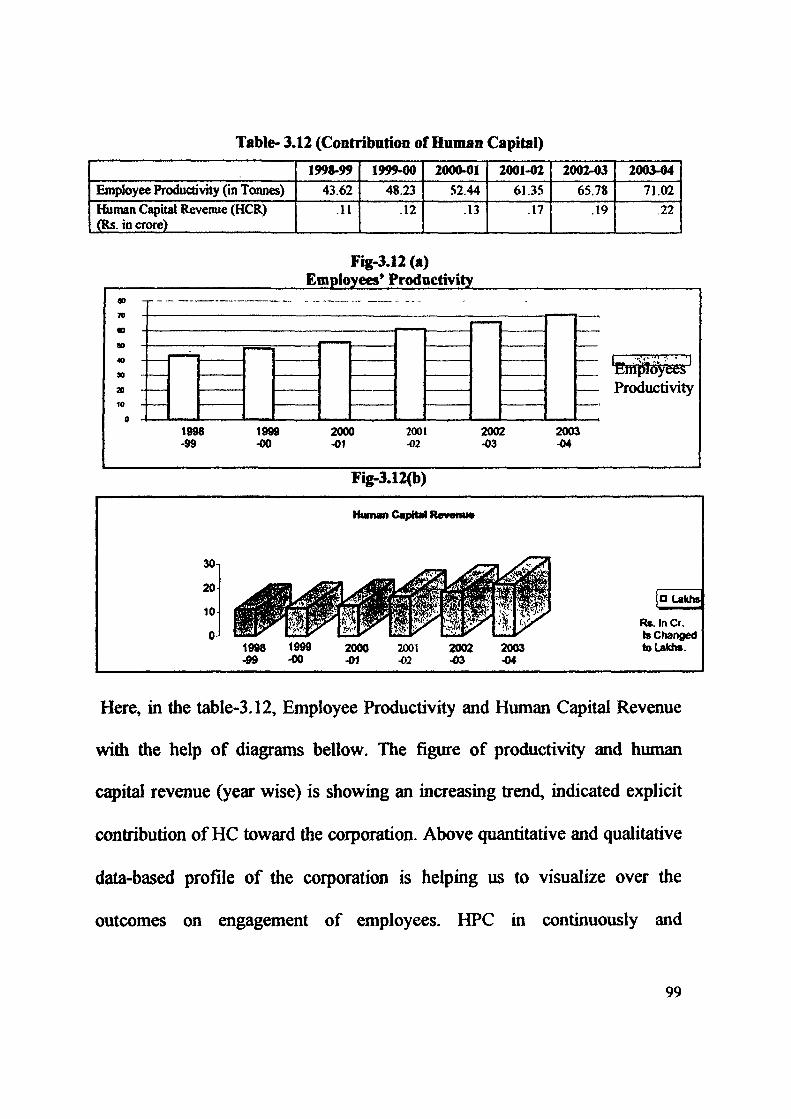
Table- 3.12 (Contribation of Hunum Capital)
Employee Productivity (in Tonnes)
Human Capital Revenue (HCR) (Rs. in crore)
I99S.99
43.62
.11
1999-00
48.23
.12
2000-01
52.44
.13
2001-02
61.35
.17
2002-03
65.78
.19
2003-04
71.02
.22
Fig-3.12(b)
00
70
«0
90
40
30
20
10
1998 199 -99 -00
Fig.3.12(a) Employees* Prodnctivit) 1
_._
9 2000 2001 2002 2003 -01 -02 -03 -04
r— .VVM'J7 ~i. •—rl
Productivity
Human Capital Revenu*
a Lakhs
R>. In Cr. Is Changed to Lakhs.
Here, in the table-3,12. Employee Productivity and Human Capital Revenue
with the help of diagrams bellow. The figure of productivity and human
capital revenue (year wise) is showing an increasing trend, indicated explicit
contribution of HC toward the corporation. Above quantitative and qualitative
data-based profile of the corporation is helping us to visualize over the
outcomes on engagement of employees. HPC in continuously and
99
consecutively improving, productive, and responsive, quality conscious work
environment are partly due to engagement Now HPC is under the wave of
change (explicit cause is MTUP and emerging competition). In this critical
situation, the organizational change with the rising trend of human capital
revenue provided a logical basis for exploration over the employee's
engagement. The next ch^ter- IV is concentrated on Engagement of
Employees in NPM and CPM, and as whole in HPC; and explored the top
drivers of engagement in the organization empirically.
100
References:
Jain, Singh and KuJkami (2005), The Indian Paper Industry: Towards Smtainability, Pulp and Paper International, March-2005, published from
326, Avenue Louise, Box 22, Brusals, Belgium, also at http://www.paperloop.com
Toland, Justin, Consolidating Their Positions- India's BILT the Highest New Entry at 90; A Year of Few Changes to the Top, Pulp and Paper International
(PPI), 326, Avenue Louise, Box -22-B 1050 Brussels, Belgiimi; September-2004, PP 13-19. Also at http7/www.Daperloop.com.
About the Hindustan Paper Corporation, Published on 1988 by OL Section of HPC Limited
Development Plan of HPC, prepared by Sendwell Consultants, at http://MDP-HPC/market.com
Thailand: Paper and Competition; at http://www.paperloop.com/thai market.com.
MTUP unfolded at NPM and CPM, Papyrus {A bimonthly News Bulletin of HPC) Vol- rv. No. 5. Jan-Feb, 2005.
Unfolding of Modernization and Technological Upgradation Plans, Darpan (A Quaiarly In House Journal ofCachar Paper Mill), Vol. 1, No. 4, Jan- March, 2005.
HPC Inks MoU with GOI for FY 2005-06, Papyrus {A bimonthly News Bulletin of HPQ Vol- IV, No. 6, March-April, 2005.
HPC achieves record production and sales, Kolkata, April 22,2002, at http://www.hindpaper.com/press/pressl .htm.
HPC Scales New Peaks, Kolkata, April 28,2004, at www.hindpaper.com/hip presscliD.htm
at http://www.hindpaper.com/tffess/pressl .htm.
HPC Group achieves record production & sales, Kolkata, May 2,2003, at http://www.hindpaper.com/press/press2003.htm
Papyrus {A bimonthly News Bulletin of HPQ, Vol. Ill, No. 2, July-Aug, 2003.
Documents incorporated by reference; Form 10-K, of Annual Report- 2005-06 Manpower Inc., United States Securities and Exchange Conmiission, Washington D.C. 20549, pp-6.
101
Diary of Hindustan Papers- 2007
iDformatlon from In-house News- Journals used: Papyrus, Vol. IV (6) March-April, 2005, (HPC) Papyrus, Vol. IV (1) May-June, 2004 (HPC) Papyrus, Vol. in (2) July-Aug, 2003 (HPC) Papyrus, Vol. IV (4) Nov-Dec, 2004 (HPC) Papyrus, Vol. IV (3) Sept.-Oct, 2004 (HPC) Papyrus, Vol. IV (6) Mar.-April, 2004 (HPC) Papyrus, Vol. Ill (3) Sept-Oct, 2003 (HPC) Papyrus, Vol. II (6) March.-April, 2003 (HPC) Papyrus, Vol. Ill (4) Nov.-Dec, 2003 (HPC) Papyrus, Vol. Ill (2) July.-Aug, 2003 (HPC) Papyrus, Vol. Ill (5) Jan.-Feb. 2004 (HPC) Papyrus, Vol. Ill (1) May.-June. 2003 (HPC) Kompal. Vol.1 (2) Jan-Feb, 2003 (NPM) Kompal. Vol.1 (3) March-April, 2003 (NPM) Kompal .Vol.1 (4) May-June, 2003 (NPM) Kompal. Vol.11 (1) Jan-Feb, 2004 (NPM) Kompal. Vol. 11 (3), May-June, 2003 (NPM) Duran, Vol.1 (4), January- March 2005 (CPM) Kompal. Vol.11 (2), March-April, 2004 (NPM) Kompal. Vol. 11 (8), Oct. Nov 2004 (NPM) Darpan, Vol. 1 (2) July-Sept, 2004 (CPM) Darpan, Vol. 1 (4) Jan-March, 2005 (CPM)
Annual Reports: Annual Reports of Financial Year 1999-00, 2000-01, 2001-02,2002-03, 2003-04.
102


