Organizational Scope and Investment: Evidence from the Drug Development Strategies and Performance of Biopharmaceutical Firms* Ilan Guedj MIT Sloan School of Management David Scharfstein Harvard Business School and NBER November 2004 ABSTRACT This paper compares the clinical trial strategies and performance of large, established (“mature”) biopharmaceutical firms to those of smaller (“early stage”) firms that have not yet successfully developed a drug. We study a sample of 235 cancer drug candidates that entered clinical trials during the period 1990-2002 and were sponsored by public firms. Early stage firms are more likely than mature firms to advance drug candidates from Phase I to Phase II clinical trials. However, early stage firms have much less promising clinical results in their Phase II trials and their Phase II drug candidates are also less likely to advance to Phase III and to receive Food and Drug Administration approval. This pattern is more pronounced for early stage firms with large cash reserves. The evidence points to an agency problem between shareholders and managers of single- product early stage firms who are reluctant to abandon development of their only viable drug candidates. By contrast, the managers of mature firms with multiple products in development are more willing to drop unpromising drug candidates. The findings appear to be consistent with the benefits of internal capital markets identified by Stein (1997). *We are grateful to Thomas Roberts, M.D. and Stan Finkelstein for collaborating with us in collecting the Phase I clinical trials data. We also appreciate their insights into the clinical trials process. Catherine Chang, Stephanie Sherman, Jimmy Sun, and Athanasios Vorvis provided exceptional research assistance. We thank Pierre Azoulay, Malcolm Baker, Patrick Bolton, Evan Beckman, Murillo Campello, Amy Hutton, Josh Lerner, Sendhil Mullainathan, Oguzhan Ozbas, Gary Pisano, Antoinette Schoar, Daniel Scharfstein, and Jeremy Stein for helpful discussions, seminar participants at Columbia, Dartmouth, Illinois, NBER, and Princeton for their comments. This research was supported by grants from the National Science Foundation, Harvard Business School Division of Research, and the Program on the Pharmaceutical Industry at MIT.
Transcript
Organizational Scope and Investment:
Evidence from the Drug Development Strategies and Performance of Biopharmaceutical Firms*
Ilan Guedj MIT Sloan School of Management
David Scharfstein
Harvard Business School and NBER
November 2004
ABSTRACT
This paper compares the clinical trial strategies and performance of large, established (“mature”) biopharmaceutical firms to those of smaller (“early stage”) firms that have not yet successfully developed a drug. We study a sample of 235 cancer drug candidates that entered clinical trials during the period 1990-2002 and were sponsored by public firms. Early stage firms are more likely than mature firms to advance drug candidates from Phase I to Phase II clinical trials. However, early stage firms have much less promising clinical results in their Phase II trials and their Phase II drug candidates are also less likely to advance to Phase III and to receive Food and Drug Administration approval. This pattern is more pronounced for early stage firms with large cash reserves. The evidence points to an agency problem between shareholders and managers of single-product early stage firms who are reluctant to abandon development of their only viable drug candidates. By contrast, the managers of mature firms with multiple products in development are more willing to drop unpromising drug candidates. The findings appear to be consistent with the benefits of internal capital markets identified by Stein (1997).
*We are grateful to Thomas Roberts, M.D. and Stan Finkelstein for collaborating with us in collecting the Phase I clinical trials data. We also appreciate their insights into the clinical trials process. Catherine Chang, Stephanie Sherman, Jimmy Sun, and Athanasios Vorvis provided exceptional research assistance. We thank Pierre Azoulay, Malcolm Baker, Patrick Bolton, Evan Beckman, Murillo Campello, Amy Hutton, Josh Lerner, Sendhil Mullainathan, Oguzhan Ozbas, Gary Pisano, Antoinette Schoar, Daniel Scharfstein, and Jeremy Stein for helpful discussions, seminar participants at Columbia, Dartmouth, Illinois, NBER, and Princeton for their comments. This research was supported by grants from the National Science Foundation, Harvard Business School Division of Research, and the Program on the Pharmaceutical Industry at MIT.
1
1. INTRODUCTION
How does organizational scope affect investment behavior and performance? We
study this question by examining the drug development behavior and performance of
biopharmaceutical firms. We believe that drug development is an ideal setting in which to
address this question for three reasons. First, there is considerable heterogeneity in how
biopharmaceutical firms are organized. Some are well-established firms with many drugs
on the market and a large portfolio of drug candidates at various stages of development.
Others are early stage firms with no products yet on the market and no more than one or
two drugs in development. Second, there is a wealth of detailed, publicly available
information on the project-level investments of biopharmaceutical firms, namely the
clinical trials required by the U.S. Food and Drug Administration (FDA) to determine the
safety and efficacy of drug candidates. Finally, these investments have measurable
outcomes. Thus, one can compare, at a very fine-grained level, the investment behavior
and performance of firms that differ in their organizational scope.
Why might we expect the scope of an organization to affect its investment
behavior and performance? Our hypothesis is a variant of Stein (1997) who identifies the
conditions under which an internal capital market that allocates funds across n competing
projects is preferable to an external capital market that funds n single-project firms. In
his framework, the problem with single-project firms is that when they have poor
investment opportunities they may still invest because their managers will be reluctant to
return funds to shareholders and lose the private benefits that come from running firms
and projects. This is less of a problem in an internal capital market because managers
2
have a broader range of projects in which to invest, allowing them to get both private
benefits and better projects.
This basic logic fits closely with the biopharmaceutical industry. The biggest
investments in this industry are the clinical trials that are required for a drug to be
approved by the Food and Drug Administration (FDA).1 A particular drug candidate
must go through three phases of clinical trials on human subjects: small Phase I trials
designed in most cases to test a drug’s safety; larger Phase II trials to test both its safety
and efficacy; and finally very large Phase III trials with as many as a several thousand
subjects. At each point along the way, a company must decide based on scientific,
clinical, and financial information whether to continue to the next, more expensive phase
of clinical trials.
We argue that the managers of early-stage biopharmaceutical firms --- those with
only one or two drugs in development --- are excessively reluctant to end clinical trials
after Phase I. Pulling the plug then would mean either that the firm would have to be
liquidated or that research on a new drug would have to be started. If the firm is
liquidated, the managers would lose the private benefits that come from running the
company. These private benefits are best thought of as firm-specific human capital. If
the firm is not liquidated, but instead a new research program is begun to replace the
failed one, the managers might also lose private benefits to the extent that their human
capital is tied to the abandoned research program. Therefore, we argue that managers of
early-stage firms would be willing to take marginally uneconomic projects forward from
Phase I to Phase II.
1The most recent estimate of the cost of getting a single drug approved is $802 million (deflated to 2000). This estimate factors in the expected costs associated with failed attempts to develop a drug.
3
This sort of problem is less severe in mature biopharmaceutical firms with
numerous drug candidates in pre-clinical and clinical testing. The managers who make
the decision to move a Phase I trial into Phase II choose among a portfolio of drug
candidates. While they may benefit from moving drugs along in the pipeline, it is
unlikely that they benefit disproportionately from any particular drug being advanced.
Thus, we would expect them to choose to advance drugs with the highest value to the
company. This is the essence of Stein’s (1997) argument on the value of internal capital
markets.
This perspective suggests that: (1) early-stage firms will be more aggressive in
taking trials from Phase I to Phase II; (2) early-stage firms will be more likely to have
unpromising clinical results at Phase II; and (3) early stage firms are less likely to take a
trial forward from Phase II to Phase III.
Financial constraints could mitigate the tendency of early stage firms to be overly
aggressive in moving forward from Phase I to Phase II. To the extent that firms lack the
cash reserves to fund Phase II trials, we would expect them to be less prone to move
forward and, conditional on moving forward, to have better clinical results. These low
cash, early-stage firms would therefore also be more likely to move forward from Phase
II trials to Phase III.
Our empirical results are in line with these predictions. The sample we analyze
consists of 235 Phase I trials for drugs to treat cancer. We find that early-stage firms are
more prone than mature firms to advance into Phase II trials within two years of initiating
their Phase I trial (61.4% vs. 45.3%). Moreover, if an early stage firm advances to Phase
II, the clinical results of the Phase II trial are worse. In Phase II trials conducted by early
4
stage firms, the percentage of patients exhibiting some shrinkage of their tumors --- a key
marker of success of a Phase II trial --- is less than half that of trials conducted by mature
firms (6% vs. 12%). Given the poor performance of Phase II trials sponsored by early
stage firms, it is not surprising that these firms are also much less likely than mature
firms to move into Phase III trials within a three-year period (13.6% vs. 34.9%). This
difference is driven to a very large extent by early stage firms with large cash reserves.
These firms bring 75.6% of their Phase I trials into Phase II, and have an even lower
tumor response rate in Phase II (4% vs. 12% for mature firms). Only 3.2% of the Phase
II drug candidates of high-cash early stage firms proceed to Phase III (i.e. once in 31
Phase II trials). Low-cash, early stage firms are only slightly more prone than mature
firms to go from Phase I to Phase II, have somewhat worse clinical results in Phase II
trials, and are less likely to proceed to Phase III.
These results point to agency problems in external capital markets that lead to
over-investment. They suggest that internal capital markets play a role in mitigating
these over-investment problems (Stein, 1997) and that large cash reserves exacerbate the
extent of over-investment (Jensen, 1986).
Our findings connect in important ways to three literatures. The first is the
literature on the costs and benefits of internal capital markets. Much of this literature
suggests that internal capital markets lead to investment inefficiencies due to cross-
subsidization of divisions in low-growth industries by those in high growth industries
(Scharfstein and Stein, 2000, Scharfstein, 1998, Shin and Stulz, 1998 and Rajan, Servaes
and Zingales, 2000). Another line of the empirical literature argues that internal capital
5
markets enable firms to redeploy capital from unprofitable sectors to more profitable ones
(Khanna and Tice, 2001, and Maksimovic and Phillips 2002).
This paper is also related to the literature on free cash flow and investment
(Jensen, 1986) claiming that firms with large cash flows, cash reserves, or debt capacity,
tend to over-invest. There are many papers that try to test this hypothesis, but the ones
closest to ours are those that look at investments at the project level. Lang, Stulz and
Walkling (1991) find that the stock price reaction to the announcement of an acquisition
is smaller when bidding firms have excess cash flow. More recently, Bertrand and
Mullainathan (2003) find that firms with excess cash flow tend to bid more for oil and
gas leases and that these leases are, on average, less productive.
Finally, our paper is related to the literature on the determinants of success in drug
development. The closest link is to Danzon, Nicholson, and Pereira (2003) who estimate
the effect of experience on the probability that firms move forward in the clinical trials
process. They find that small firms are slightly more likely than large firms to advance
from Phase I to Phase II, and that the effect is reversed for Phase II to Phase III
transitions. They interpret these findings as evidence that there is learning-by-doing in
the management of clinical trials; however, our findings suggest that the higher Phase II
success rates of large firms may not be the result of learning-by-doing but rather may be
the result of agency problems at small firms that lead them to bring poor drug candidates
into Phase II trials.2
2 Cockburn and Henderson (2001) examine the determinants of success at the level of a research program (e.g. cardiac and circulatory) rather than at the level of a particular drug candidate. They find that firms with a broader range of research program are more likely to end up with FDA-approved drugs. Given the different unit of analysis it is difficult to link their results to ours.
6
The paper is organized as follows. The next section outlines a simple framework
to structure our thinking about the agency problems that arise in biopharmaceutical firms.
Section 3 outlines the construction of the database and Section 4 presents the results.
Section 5 concludes.
2. A SIMPLE FRAMEWORK
This section outlines a very simple framework for comparing the investment
behavior of early-stage biopharmaceutical firms to that of mature biopharmaceutical
firms. We model the decision of whether to advance from a Phase I clinical trial, the
earliest and least expensive phase of clinical development, to a Phase II clinical trial.
Based on the results of the Phase I trial, the manager assesses the probability that a Phase
II trial will be “successful,” and that he would want to go forward to Phase III.
“Successful” is in quotation marks because a clinical trial does not really “succeed” or
“fail.” Rather, the results are often difficult to interpret, with reasonable people differing
on the interpretations. For simplicity, however, we suppose that if the trial is successful,
further development of the drug has an expected discounted payoff of X > 0. If the trial
is unsuccessful the expected payoff is zero. Let p2 be the probability of success. Let I2
be the cost of conducting a Phase II trial. Finally, suppose that A is the liquidation value
of the compound if it does not advance to Phase II. Then, the first-best decision rule is
to go forward to Phase II provided:
(1) p2X - I2 ≥ A.
7
Would an early stage firm use this decision rule? We argue that the answer is no
because the managers (or founders) of early stage firms derive private benefits, b, from
their projects. In this case, the condition would be
(2) p2X - I2 + b ≥ A.
As a result, an early stage firm would be more prone to advance to Phase II than would
be implied by the first-best condition (1).
What are the managers’ private benefits in the context of drug development? One
possibility is that managers have project-specific human capital that they would lose if
they abandon the project and try to develop another drug. A second possibility is that
managers have firm-specific human capital that they would lose if they abandon the
project and the firm is liquidated. Finally, one can interpret b as a measure of managerial
over-optimism about the expected payoffs from the project.
Like the managers of early stage firms, the managers of drug development
projects in mature firms are also likely to derive private benefits from drug development.
However, unlike early stage firms, the decision of whether to advance to Phase II is not
made by these managers, but rather higher-level managers who choose among a portfolio
of drug candidates. These managers might derive private benefits from drug
development, but there is no reason to believe that they derive benefits from one
particular project over another. Thus, if they cannot choose to undertake all of the
projects, they will choose those with the highest expected value exclusive of private
benefits. This is essentially Stein’s (1997) argument for the efficiency of internal capital
markets.
8
This simple framework generates two empirical predictions. From a comparison
of (1) and (2) we get the first prediction.
Prediction 1: Early stage firms will be more likely to advance from Phase I trials
to Phase II trials.
Holding X and I2 fixed, a comparison of (1) and (2) implies that early stage firms
that go ahead to Phase II, will do so, on average, at lower levels of p2. This generates a
second prediction:
Prediction 2: Early stage firms will be more likely to fail in Phase II clinical
trials.
There are additional predictions if financial constraints are introduced into the
model. These are most relevant for early stage firms, as mature firms have large cash
flows from existing drugs on the market. If early stage firms do not have the financial
resources to fund a Phase II trial, they will have to finance the trial by raising external
capital. If the project has negative net present value this will be difficult or impossible to
do. If the firm has cash, C, it will have to raise I2 – C, and will only be able to raise
outside capital if p2X - I2 > -C. If C is small, the firm will not be able to fund projects
with significant negative net present value. Thus, we have our third and fourth
predictions.
Prediction 3: Early stage firms with low cash reserves will be less likely to
advance from Phase I to Phase II trials than early stage firms with high cash reserves.
Prediction 4: Early stage firms with low cash reserves will be more likely to
succeed in Phase II trials.
9
3. DATA
In order for a drug to be marketed, the FDA requires that it go through a series of
clinical trials on human subjects. Phase I trials --- the earliest and smallest of the clinical
trials --- are typically conducted on fewer than 30 patients, are designed to determine a
drug’s safety. For most diseases, these trials are performed using healthy subjects,
although cancer drug trials, the focus of our study, are conducted on subjects with the
disease. DiMasi et. al. (2003), using a sample of 68 drug candidates in clinical trials at
large pharmaceutical firms between 1983 and 1994, estimate that the mean (median) out-
of-pocket cost of a Phase I trial was $15.2 million ($13.9 million) deflated to 2000.
Phase II trials are larger and more costly than Phase I trials. They include as
many as a few hundred subjects, use patients with the disease, and are designed to test
both safety and efficacy. The mean (median) cost of a Phase II trial in the DiMasi et. al.
sample was $23.5 million ($17.0 million).
Finally, Phase III trials are typically very large studies, including possibly
thousands of subjects. The mean (median) cost of a Phase III trial in the DiMasi sample
was $86.3 million ($62.0 million). After completing these trials, a drug sponsor can seek
regulatory approval from the Food and Drug Administration by filing a New Drug
Application (NDA)3.
The analysis focuses on clinical trials for the treatment of cancer. There are a few
reasons why we restrict attention to cancer. First, one can only make meaningful
comparisons of clinical outcomes within a disease class. The outcome of a clinical trial
for lung cancer (e.g. tumor response) cannot easily be compared to the outcome of a
3 For certain classes of drugs, a drug’s sponsor will file a Biological License Application, which is also evaluated by the FDA.
10
clinical trial for hypertension (e.g. reduction in blood pressure). Second, in the case of
cancer, there are relatively straightforward, measurable clinical outcomes such as tumor
response. Third, as noted above, Phase I cancer trials include sick patients so that, in
principle, efficacy can be measured at an early stage. We conjectured that Phase I cancer
trials might result in more useful clinical information that could inform a decision to
move to Phase II. (As we will soon see, this did not turn out to be the case.) Finally,
cancer is the disease class with the largest number of clinical trials during the last decade.
3.1 Sample Construction
The starting point for the construction of our sample is a database we assembled
in conjunction with Thomas Roberts, M.D. The database includes the Phase I clinical
oncology trials described in annual volumes of Papers/Proceedings of the American
Society of Clinical Oncology from 1990-2002. Each year, the American Society of
Clinical Oncology (ASCO) has an annual meeting for its members, mainly medical
clinicians and researchers. Coinciding with the meeting, ASCO publishes (in hard copy
and now on-line) a compilation of abstracts describing research in the field. It is standard
for oncology research groups to submit abstracts describing their research. These
abstracts are not peer-reviewed, and all submitted abstracts are published.
Phase I trials are identified by searching all the abstracts that include in their title
or in the abstract itself the words “Phase I”, “Phase I/II”, “dose-finding”, “new”, and
“novel”. From this list, only the ones that indeed describe a Phase I clinical trial are kept.
Abstracts that describe one or more of the following are excluded: combination trials
(i.e. trials using multiple drug compounds); agents targeting pediatric cancers; agents that
11
were previously reviewed by the FDA; radiation therapies or immuno-therapies; herbal
medication; supportive care; and trials on non-human subjects. Combination therapies
are excluded because it is very difficult to determine how successful a clinical trial is
when a compound is tested in conjunction with another given that it is hard to determine
the baseline response rate of the other compound. It also makes sense to exclude agents
targeting pediatric cancers because the approval process for these drugs is quite different.
Agents previously reviewed by the FDA add to the complexity of the data collection and
therefore are excluded. The other trials are excluded because they are not drugs per se.
More details about the sample can be found in Roberts et. al. (2004).
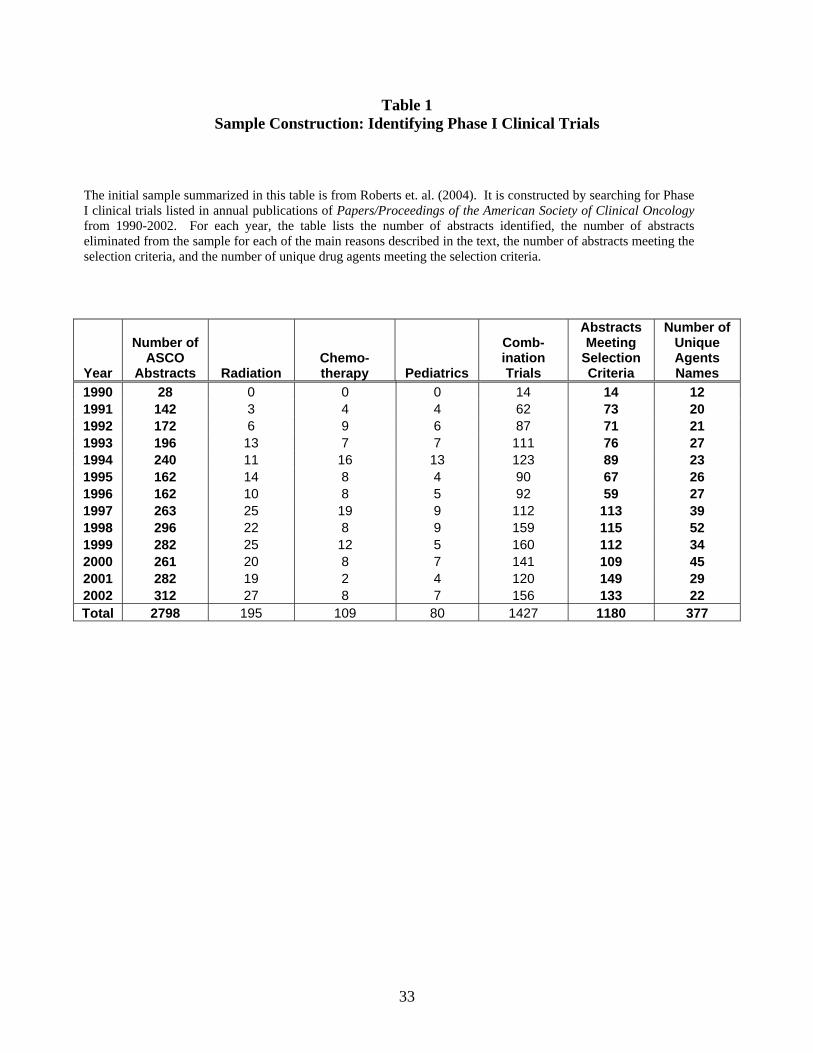
Table 1 provides information on the annual number of abstracts describing Phase
I oncology trials in the database and lists the annual number of abstracts excluded for
each reason. The main reason for exclusion is that the trial is a combination therapy.
There are a total of 2,798 Phase I abstracts identified, but only 1,180 abstracts describe
agents that meet the criteria. These 1,180 abstracts describe 377 drug agents.4 There are
more abstracts than agents both because there are multiple abstracts published to describe
a single trial, and because there are multiple Phase I trials on a single drug agent. Not
surprisingly, there is a general increase over time in the number of abstracts and agents
meeting the selection criteria.
The identity of the organization sponsoring the trial was collected from two
commercial databases: Thomson’s Investigational Drug Database (IDdb) and PJB
Publications’ PharmaProjects. The sponsors are a combination of public companies
(62.3%), private companies (27.6%), universities and government agencies (10.1%).
4 There are 351 unique drug agents in the sample, but there are 26 instances where a particular agent is being developed by two different organizations for different indications.
12
58.9% of the Phase I trials are conducted by firms with headquarters in the United States.
Many of the foreign companies in our sample, such as Novartis and Elan
Pharmaceuticals, are listed on U.S. stock exchanges and have significant research
operations in the U.S. If the drug is being developed as part of an alliance between two
organizations, we follow PharmaProjects in only counting the sponsor that developed the
agent and is sponsoring the trial. There are several cases in which there are equal co-
sponsors of the trials and we drop these from the sample. We have 175 unique sponsors
in the sample.
Our analysis centers on the 235 Phase I trials undertaken by the public firms in
our database. We exclude the 65 drug candidates sponsored by private firms at this point
because it is difficult to get balance sheet data on these firms, and because these firms
raise issues, such as the role of venture capital, that are beyond the scope of this paper.
We use Thomson Financial’s Thomson Research (formerly Global Access) to find the
tickers of the public companies, their IPO dates and financial details of the IPO. We
merge it with Standard & Poor's Compustat, Compustat Canada, and Compustat Global
Industrial/Commercial in order to get financial data about the public companies in our
sample. For comparability, all the financial numbers are converted to U.S. Dollars and
then adjusted to U.S. Dollars for the year 2000.
The PharmaProjects database also track compounds through their stages of
development, from as early as pre-clinical laboratory studies to FDA approval. Thus, we
were able to reconstruct the timeline of development including follow-on clinical trials in
Phase II and Phase III. We also collected information from this database on the kinds of
13
cancer the trials were targeting,5 the market size of the indication being targeted, and the
pharmacological properties of the drug candidate. The last of these describes a drug’s
mechanism of action in the body, through which it exerts its therapeutic effect, i.e. it
identifies the biological agent or process the drug stimulates or inhibits. This information
will be useful to us in constructing measures of the novelty of a particular drug candidate.
3.2 Information on Clinical Trials
Our study focuses on four aspects of clinical development: the decision of the
company to take the project forward from Phase I to Phase II; the clinical outcome of the
Phase II study; the decision to move from Phase II to Phase III; and ultimate FDA
approval. Table 2 provides information on the time between the initiation of the first
Phase I trial and the initiation of the first Phase II trial, as well as the time between Phase
II and Phase III trials. Panel A indicates that the average time between Phase I and Phase
II trials is 25.3 months. Panel B shows that 65% of the Phase 1 trials move forward
within two years and 80% do so within three years (Table 3, Panel B).6 This is about
twice as long as the time between initiation of Phase I and Phase II trials reported in
DiMasi et. al. (2003).
The mean time between initiation of the first Phase II trial and first Phase III trial
is 27.1 months (Table 2, Panel A), with almost 60% moving forward within two years
and 76% moving forward within three years (Table 2, Panel B). The mean length
between trials is comparable to numbers reported in the DiMasi study.
5 Note that Phase I oncology trials do not typically target a specific cancer while Phase II trials do. 6 Based on this distribution, in some of our regression analyses we will look at the decision to move to Phase II within two years following the first announcement of Phase I.
14
Of course, not all trials move forward to the next phase. As Table 2, Panel C
shows, 67% move forward from Phase I to Phase II as compared to 71% in the DiMasi
study. Note however that our sample is right censored; for Phase I trials begun later in
the sample, there are only a few years during which the trial could have moved forward.
Given that the lion’s share of Phase I trials move forward within three years, this right
censuring of Phase II trials is not a major issue. Table 2, Panel C also shows that 32% of
the trials that make it to Phase II, later move forward to Phase III. DiMasi’s study finds
that 44% of the Phase II trials move forward to Phase III. Here the right censuring might
be more of an issue, because the time between Phase I and Phase III is four to five years.7
Beginning in Phase II, drug candidates are tested for particular indications, e.g.,
lung cancer, liver cancer, or breast cancer. As Table 3, Panel A shows, 54% of the agents
are tested for two or more cancers, with the mean being 2.7 indications. In a majority of
cases (57%), sponsors only have one agent in clinical trials in our sample, while two
sponsors (Bristol Myers Squibb and Novartis) show up sixteen times. The average is 2.1
agents.
3.3 Information on Companies
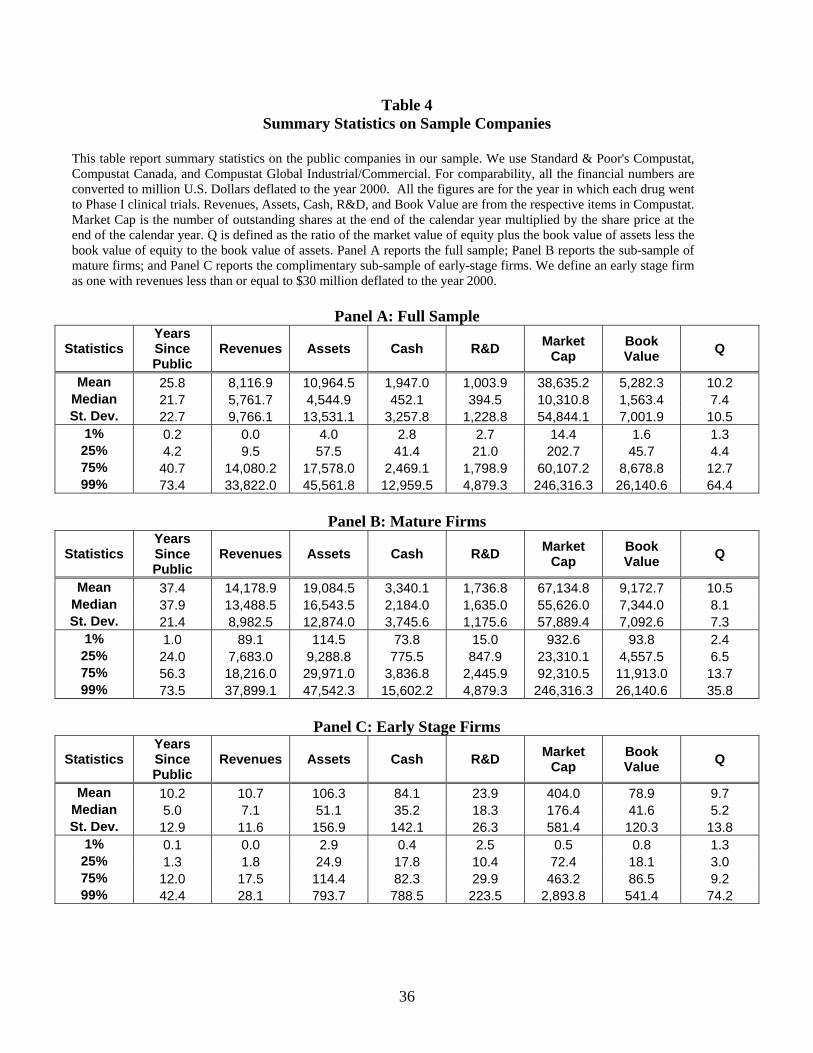
Table 4 presents summary data (deflated to the year 2000) on the public
companies sponsoring the trials in the sample. On average, the public companies are very
large, with mean revenues of over $8 billion, mean assets of almost $11 billion, mean
cash of close to $2 billion and mean R&D of about $1 billion. The average market
7As our study will show, the Phase II to Phase III probabilities depend on the type of firm that is undertaking the trial and the DiMasi study is restricted to mature biopharmaceutical firms. Also, the transition probabilities and mean time between trials are very similar for public firms and the rest of the sample.
15
capitalization is over $38 billion and mean Q is 10.2. On average, the firms were public
for almost 26 years before embarking on the Phase I trials in our sample.
These averages mask considerable heterogeneity in the data. The 25th percentile
firm has revenues of only $9.5 million, cash of $41.4 million, R&D of $21.0 million and
a market capitalization of $202.7 million. As we have suggested, there are really two
types of firms that are undertaking clinical trials in oncology. One type is the mature
biopharmaceutical firm with sizable revenues, some (or many) drugs already on the
market, and a portfolio of drug candidates in clinical trials or in the laboratory. The other
type of firm is an early stage biopharmaceutical, with no drugs on the market and a
limited portfolio of drug candidates (often only one) in clinical trials or in the laboratory.
Because we do not have direct information on drug revenues by company, our
proxy for whether a firm is early stage is whether the firm has revenues less than $30
million deflated to 2000. The revenues of these firms typically come from two sources:
milestone payments from other firms as part of alliances and contract R&D work. There
are a few firms with revenues greater than $30 million, but less than $250 million. We
found that these firms all had drugs that were on the market or about to be on the market,
so we consider them mature firms.
Panels B and C of Table 4 break out the sample into mature and early stage firms.
Fifty-nine percent of the Phase I trials are done by mature firms, and the remainder are
done by early stage firms. Not surprisingly, the differences between these firms are very
large in terms of cash, R&D, and market capitalization.
16
4. EMPIRICAL ANALYSIS
In this section we compare the decisions of early stage and mature firms to move
forward in the clinical trials process.
A. Basic Analysis
A. 1 Phase I to Phase II Transition Probabilities. We start by estimating probit
models of the decision to go from Phase I to Phase II within two years. We use a two-
year cutoff on the Phase II decision for two reasons. One reason is that, without a cutoff,
Phase I trials that were begun in the early part of the sample would be more likely to be
taken forward. If there is an over-representation of one type of firm in the early period,
this would bias our findings. The second reason to use a time cutoff is to measure the
aggressiveness with which firms move forward in the clinical trials process. Note that
69% of the agents that are taken forward to Phase II by the public companies are taken
forward within two years. To avoid making seemingly arbitrary cutoffs, we will also
estimate Cox proportional hazard models. This allows us to estimate the probability per
year that a firm takes a trial forward.
The key regressor in our model is, Early Stage, a dummy variable for whether the
drug’s sponsor is an early stage biopharmaceutical firm. We also include a set of
controls: information on the clinical outcome at Phase I --- response rate and toxicity;
whether the drug is a biologic agent (as opposed to a chemical compound); whether the
drug was sponsored at one point by the National Institutes of Health or any of its affiliate
organizations; the novelty of the agent under investigation; and the potential market size
of the drug.
17
Before getting to the regressions it is worth simply comparing the Phase II
transition probabilities of the early stage and mature firms. Of the 139 agents sponsored
by mature firms, 63 (45.3%) move from Phase I to Phase II within two years. By
contrast, early stage firms are more prone to advance to Phase II; of the 96 agents
sponsored by early stage firms, 59 (61.4%) move forward to Phase II within two years.
This difference is statistically significant at the 1% confidence level.
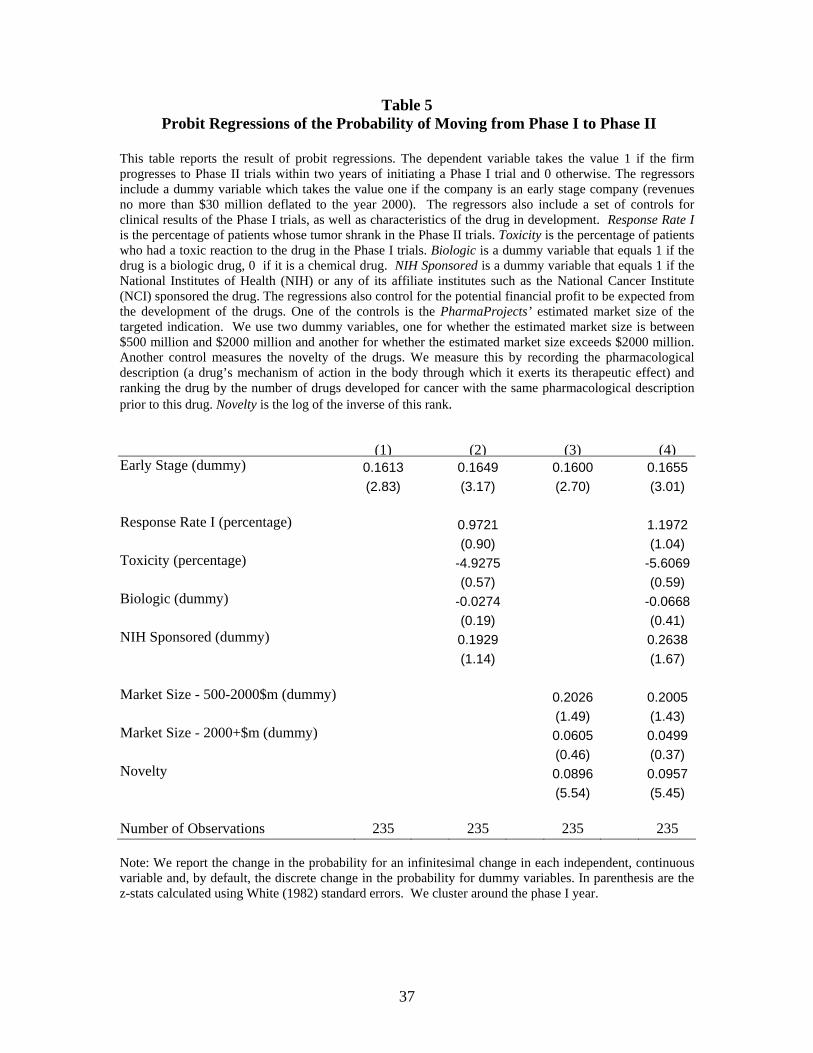
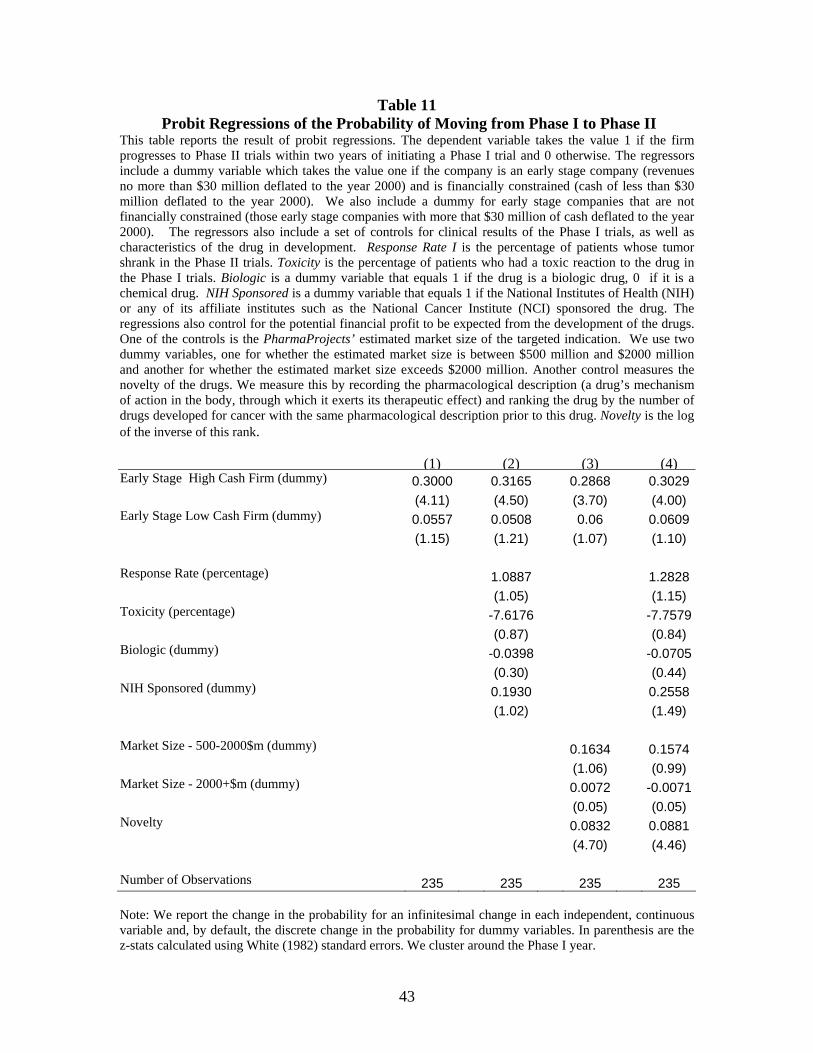
The probit regressions in Table 5 show that this finding is robust to the inclusion
of various controls. The reported numbers are the marginal effects of a unit increase in
the regressors, not coefficient estimates from the regression. The first column just
replicates the finding discussed above without the controls: the estimated marginal effect
of the Early Stage dummy is 0.161, indicating that early stage firms are 16.1% more
likely than mature firms to move forward to Phase II.
The second column of Table 5 adds Phase I clinical data to the regression, but the
Early Stage estimate is unaffected. An increase in the tumor response rate at Phase I
from zero to 10% is predicted to increase the Phase II transition probability by 9.7%. This
estimate is, however, statistically insignificant. This is true of the other regressors as
well. Whether the drug candidate is a biologic agent or a chemical compound has a small,
statistically insignificant effect. Prior NIH-sponsorship of research on the drug candidate
appears to have a large estimated effect on the probability of moving forward, but here
too the estimate is statistically insignificant.
These results are consistent with the view that early stage companies are more
aggressive in bringing drug candidates into Phase II trials because they derive private
benefits from doing so and they, unlike mature firms, do not have a portfolio of other
18
drug candidates to advance in clinical trials. An alternative explanation, however, is that
early stage are attempting to develop drug candidates that would have higher payoffs if
they succeed (a higher X in our model). In this case, they would use a lower breakeven
success probability (p2) in deciding whether to advance to Phase II. For example, early
stage companies might be targeting particular cancers with a large market size where
there are few other approved therapies. It is also possible that the drug candidates of
early stage firms are more scientifically innovative and therefore would have a higher
payoff if they were to succeed.
Column 3 of Table 5 reports results that address these possibilities by adding two
controls to the regression. The first control is a set of two market size dummies that
come from estimates in the PharmaProjects database. The first dummy is for whether
the market size is between $500 million and $2 billion, and the second dummy is for
whether the market size is greater than $2 billion. The excluded dummy is for whether
the market size is less than $500 million. Although the estimated effects of these
dummies are positive, they are not statistically significant. Given that an overwhelming
majority of the drug candidates target a market size in the $500 million to $2 billion
range, it is not a surprising finding. In addition, as noted earlier, most Phase I cancer
trials target cancer in general, not specific cancers, so it is unlikely that there would be
much variation in market size at the Phase I stage.
The last regression in Table 5 also includes a measure of the drug candidate’s
novelty. Novelty is calculated in the following way. As noted in Section 3,
PharmaProjects contains a pharmacological description of each drug candidate. Thus,
for each pharmacological description we rank drug candidates chronologically, with the
19
nth drug candidate chronologically within a certain category getting the rank of n. A drug
candidate with a higher n is considered less novel. For example, in 1989, Schering-
Plough was the first to conduct a clinical trial using a DNA antagonist (Tomozolomide).
In 2000, Access Pharma also began clinical trials of a DNA antagonist, but it was the
twentieth such clinical trial, making it less novel by our measure. The average n in our
sample of mature firms is 24.6, while the average for early stage firms is 22.0 a
statistically insignificant difference.
In the regression in column 3 of Table 5, we include the natural log of 1/n as our
measure of novelty. There is a positive, statistically significant relationship between
novelty and the probability of moving from Phase I to Phase II. Nevertheless, there is no
appreciable effect of including the novelty measure on the Early Stage dummy. This is
not surprising in light of the fact that there is little difference in the novelty of the drug
candidates developed by early stage and mature firms.
A. 2. Performance of Phase II Trials. Prediction 2 suggests that early stage firms
will be less successful than mature firms in Phase II trials. To test this prediction we
collected data on the clinical outcomes of the Phase II trials from abstracts published in
Papers/Proceeding the American Society of Clinical Oncology, the same source we used
for information on the Phase I trials. We record the percentage of patients in a trial that
exhibit some tumor shrinkage. This is a key endpoint used by the industry to measure the
success of Phase II oncology trials. We have clinical data on a total of 201 Phase II trials.
These include multiple trials conducted on a single agent for different indications. We
are unable to find clinical information on a number of the trials that we know were
20
initiated either because the study was not completed or because the study abstract was
never published in Papers/Proceedings.
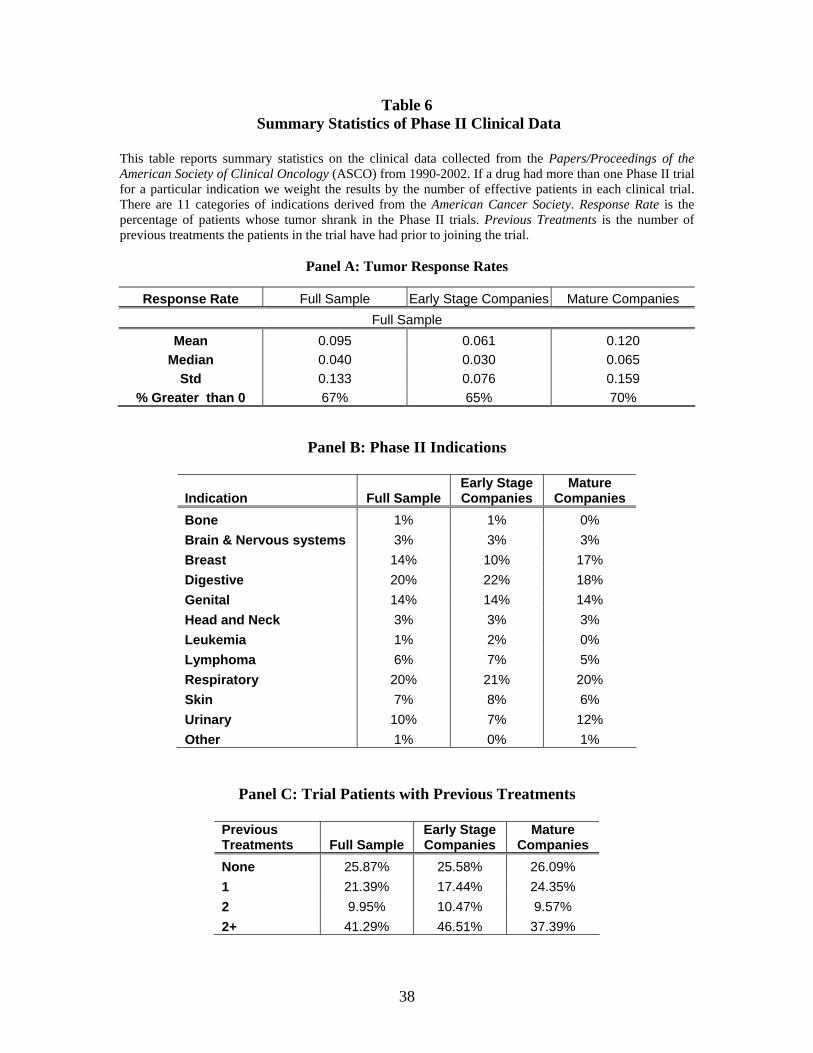
Table 6 presents summary information on the average tumor response rate
reported in the Phase II trials undertaken by the firms in our sample. On average, the
tumors of 9.5% of trial participants showed some response. Consistent with our
prediction, the table also shows that the response rate was nearly twice as high for the
mature firms (12.0%) as for the early stage firms (6.1%). The table also shows the
distribution of clinical trials across twelve different cancer types, with the most common
being respiratory, digestive, breast, and genital type cancers. There is no systematic
difference between mature and early stage firms in the distribution of trials across these
cancer types. The table also shows the percentage of patients in the trials who received
prior treatments for cancer. Again there is no difference between early stage and mature
firms.
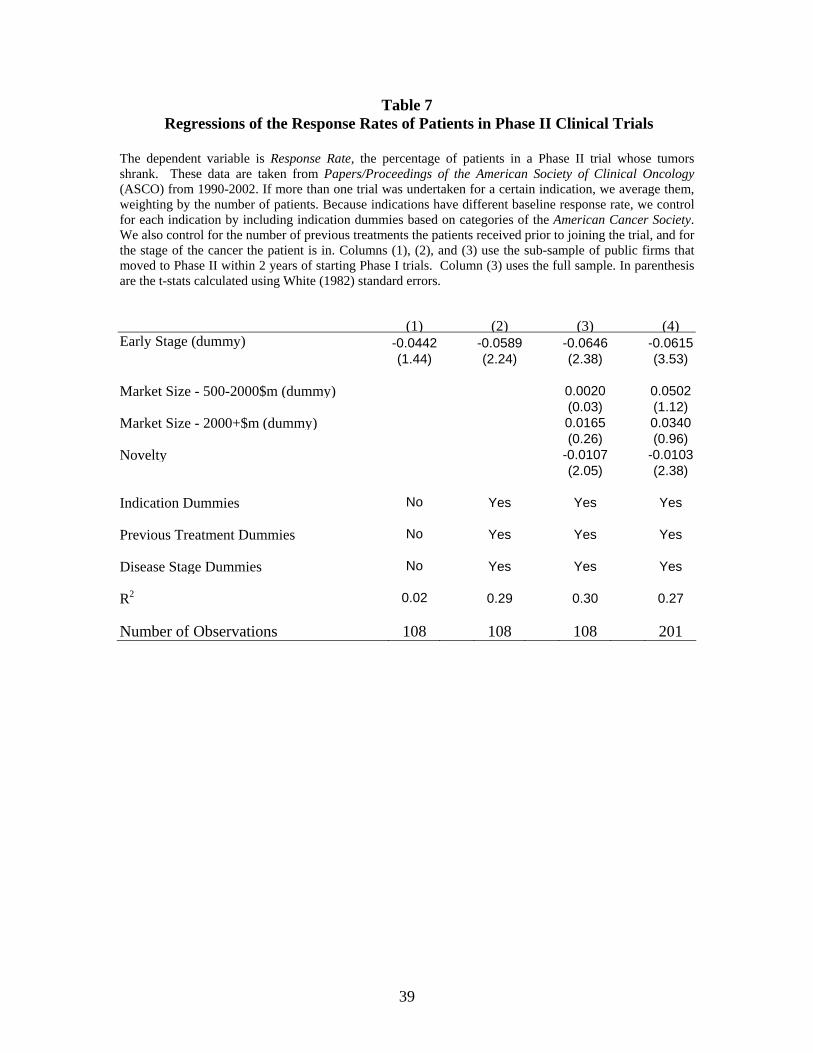
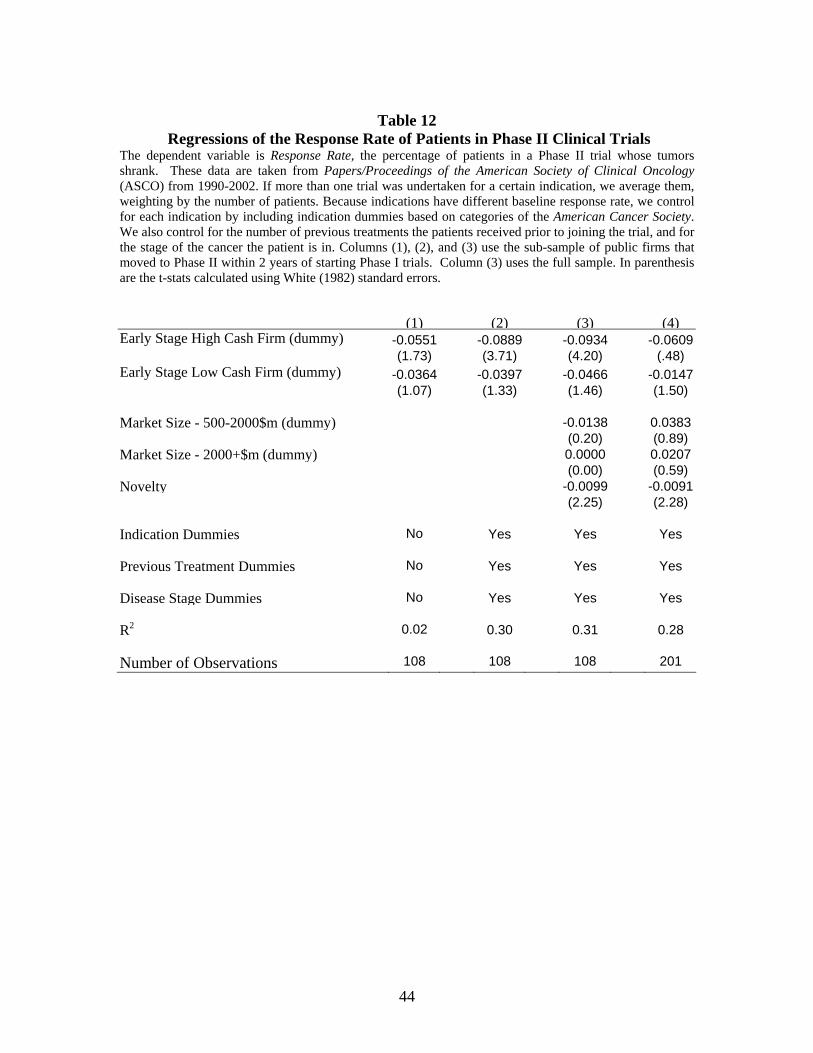
Table 7 compares the Phase II response rates of early stage and mature firms in a
regression framework. The first column of the table restricts attention to the 108 Phase II
trials begun within two years of the initiation of the Phase I trial for which we also have
Phase II clinical data. This column includes no controls and simply documents that the
average response rate in these trials is 4.4% lower for early stage firms than for mature
firms. The difference is not statistically significant. Including the controls in the
regression in the second column amplifies the difference; on average, early stage firms
have a 5.9% lower response rate than mature firms. Evaluated at the means of the
controls, this regression model predicts that the response rate of patients enrolled in Phase
II trials of mature firms will be twice as likely to exhibit some tumor shrinkage as
21
patients in Phase II trials of early stage firms. The third column of Table 7 shows that the
estimated effect is similar if we include all Phase II trials, not just those begun within two
years of Phase I initiation.
A. 3 Phase II to Phase III Transition Probabilities. Another measure of whether
Phase II trials are successful is whether firms proceed to Phase III trials. Before
discussing the regressions, it is useful to compare the mean transition rates for the two
sets of firms. Of the 63 drug candidates brought to Phase II by mature firms within two
years, 22 (34.9%) are later brought to Phase III within three years. By contrast, only 8
(13.6%) of the 59 drug candidates brought to Phase II trials within two years by early
stage firms are eventually brought to Phase III trials within three years. This 21.3%
differential is highly statistically significant.
Table 8 presents the regression analysis. The first column simply replicates the
comparison that we just presented. The other columns add the standard controls, but
none is statistically significant and they do not affect the estimated effect of the Early
Stage dummy.
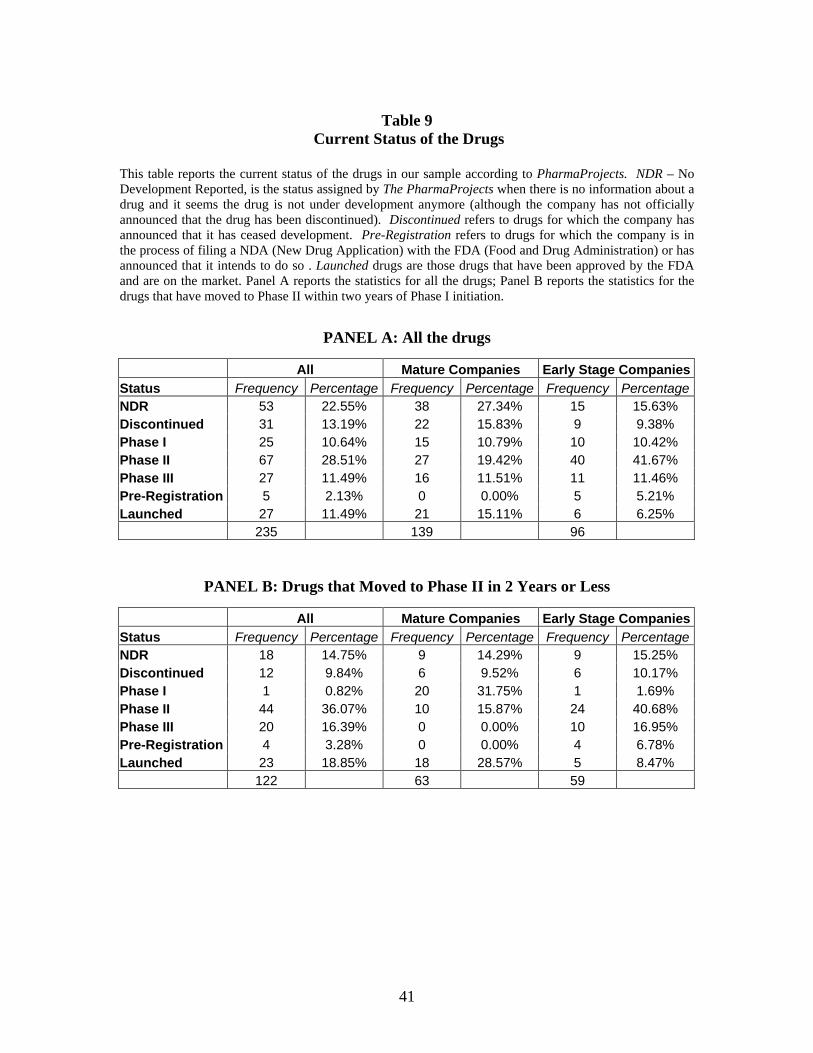
A.4. Current Status of the Drugs. Yet another measure of success is whether the
drug candidate is ultimately approved by the FDA. In Table 10, we present the current
status of the drugs. Panel A shows that 15% of the drugs of mature companies have been
approved while only 6% of the drugs of early stage companies have been approved. In
Panel B, we restrict the comparison to those drugs that had moved to Phase II in 2 years
or less. The differences are amplified for this sub-sample. For the early stage firms, only
8.5% of the drug candidates were approved by the FDA, whereas for the mature firms,
28.6% were approved. This fact also supports the view that early stage firms are less
22
selective in the drug candidates they bring forward to Phase II. One caveat to keep in
mind, however, is that given the time is takes to get FDA approval, drugs that enter our
sample relatively late will have a lower probability of getting approved. This will only
explain the difference between early stage and mature firms if mature firms begin their
trials earlier in the sample, but there is no evidence of that.
A.5. Sales Revenue. As noted earlier, it is possible that early stage firms are more
likely to advance from Phase I to Phase II not because of agency problems, but because
they have more novel therapeutic approaches and they are targeting larger markets. As
we showed, this is not the case. Moreover, including measures of novelty and market size
has no meaningful effect on the estimates.
Another way to see whether early stage firms are going after higher payoff
projects is to look at their payoffs when they actually succeed in launching a drug. There
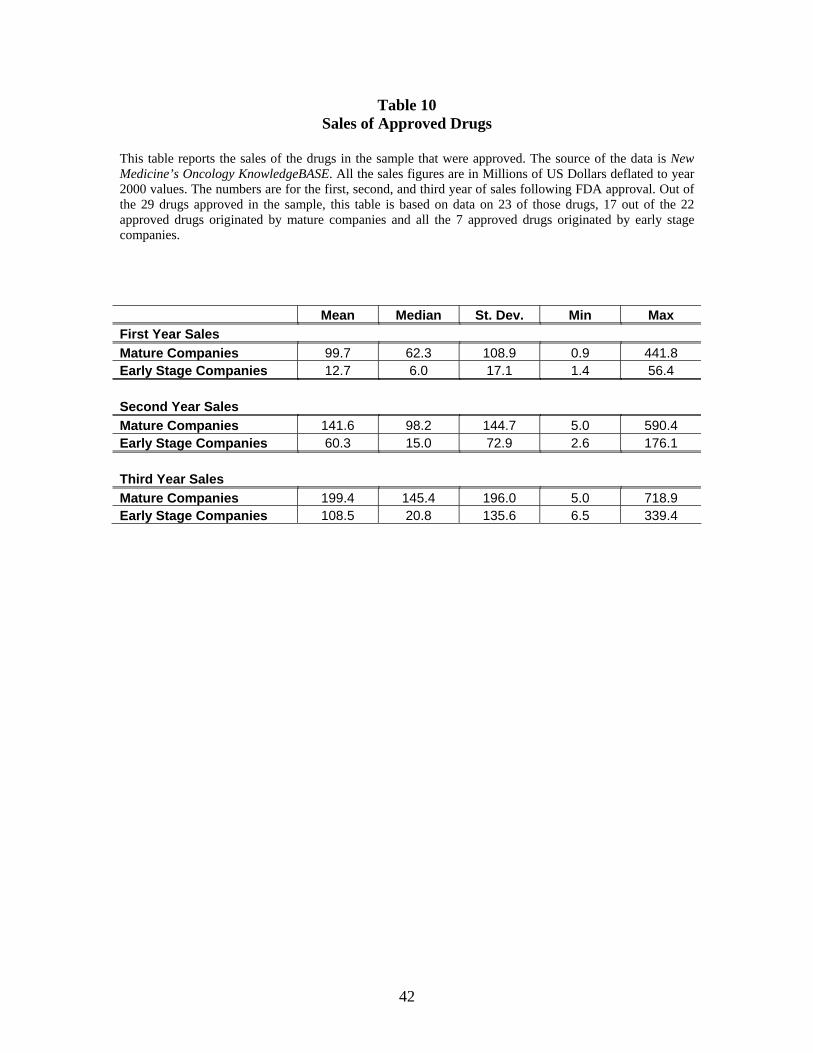
are 29 product launches in our sample, only seven of which are by early stage firms. We
were able to collect information on product sales in the first three years after the product
launch for all seven launches by early stage firms and 17 of the 22 product launches by
mature firms. The differences are quite striking, but are the opposite of what one would
expect if early stage firms are taking bigger risks. As can be seen from Table 10, in each
of the three years, the mature firms sell considerably more than the early stage firms. In
the first year after launch, the sales of products launched by early stage firms are $12.7
million on average as compared to $99.7 million for mature firms. In the second year, the
average is $61.3 million for early stage firms as compared to $141.3 million for mature
firms. In the third year, early stage firms sell $108.4 million, whereas mature firms sell
$204.3 million on average.
23
In five instances, we were unable to find information on the sales of products by
mature firms. One might be concerned that when sales are very low for such firms, this
information is less likely to be disclosed. Even so, if one assumes that sales for these
products are zero, the average sales of products launched by mature firms are still greater
that those of early stage firms in each of the three years following product launch.
A. 6. Alliances. Many of the early stage companies in the sample develop their
drug candidates as part of an alliance with a large pharmaceutical company. In these
alliances a pharmaceutical firm typically makes payments to an early stage firm to fund
clinical development in exchange for the right to license and sell the drug if it is
approved. In our sample, 62.5% of the drug candidates of early stage companies have
some kind of an alliance at the time of the Phase I trial. One might expect that the
alliance limits the ability of an early stage company to take compounds forward from
Phase I to Phase II if they have little chance of succeeding. This does not appear to be
the case in our sample; there is very little difference in the transition probabilities of drug
candidates being developed in alliances and those being developed solely by an early
stage firm. This finding is consistent with Guedj (2004) who shows that mature
pharmaceutical firms are more likely to advance Phase I clinical trials into Phase II when
they are developing a drug in an alliance with an early stage firm than when they are
developing a drug on their own.
B. The Effect of Financial Resources on the Clinical Trials of Early Stage Firms
The previous sub-section presents evidence that early stage firms are more prone
than mature firms to move forward from Phase I to Phase II, to have worse clinical
24
results in their Phase II trials (in the form of lower response rates), and to be less likely to
move from Phase II to Phase III. Our model suggests that managers of early-stage firms
are reluctant to pull the plug in early clinical trials even if doing so would be value
maximizing. However, as Prediction 3 indicates, to the extent that the firm has fewer
financial resources, this should put a limit on the ability of management to over-invest in
Phase II trials and should lead to greater success at Phase II (Prediction 4).
To test these predictions, we need a measure of financial resources. We define a
firm with limited financial resources as one with cash of less than $30 million (deflated to
2000). Our assumption is that all mature firms have ample financial resources given that
biopharmaceutical firms generate very large cash flows (even after their considerable
R&D expenses). Thus, the test really hinges on comparing the Phase I and Phase II
decisions and outcomes of early stage firms based on their cash holdings.
A simple comparison of transition probabilities for early stage firms tells the basic
story. Of the 96 Phase I trials conducted by early stage firms, 55 are conducted by firms
with low cash reserves, and the remaining 41 are conducted by firms with relatively large
cash reserves. Out of the 55 Phase I trials conducted by the low-cash firms, 28 (50.9%)
proceed to Phase II, whereas 31 (75.6%) out of the 41 Phase I trials conducted by the
high-cash firms proceed to Phase II. Thus, the Phase II transition probability for the low-
cash early-stage firms is only slightly higher than that of mature firms (45.3%), whereas
the transition probability of the high-cash firms is significantly higher than those of the
constrained early stage firms and the mature firms. This result is reflected in the probit
regressions in Table 11. As before, none of the controls is statistically significant nor do
they impact the estimated effects of Early Stage dummies.
25
Table 12 shows that the average response rate of patients in Phase II trials
conducted by high cash early stage firms is particularly low. In the full model with
controls, the response rate of these firms is 9.3% below that of mature firms; the response
rate of early stage low cash firms is 4.7% below that of mature firms. This basic pattern is
robust to including all Phase II trials, not just those begun within two years of Phase I
initiations. The estimated effects for the early stage high-cash firms are statistically
significant. Evaluated at the means of the controls, they predict that patients enrolled in
trials conducted by mature firms will be more than three times as likely to show some
tumor shrinkage as patients enrolled in a study conducted by high-cash early stage firms.
The findings on the Phase II to Phase III transition are also very striking. Of the
28 Phase II trials conducted by low-cash firms, 7 (25.0%) went on to Phase III; however,
only 1 (3.2%) out of the 31 Phase II trials conducted by high-cash firms went to Phase
III. The Phase II success rate of the high-cash firms is obviously much lower than that of
the low-cash firms and the mature firms (34.9%). The success rate of the early stage
constrained firms is lower than that of the mature firms, but the difference is not
statistically significant. Again, these finding are reflected in the probit regressions, which
are presented in Table 13.
4.3 Estimating Proportional Hazard Models
As discussed above, our data is right censored by which we mean that some drugs
may eventually advance to Phase II or Phase III, but we do not yet observe that event. A
Phase I trial begun in 2002 that has not yet transitioned to Phase II is not the same as a
Phase I trial begun in 1994 that has not transitioned to Phase II. We dealt with this
26
problem by counting as a Phase I to Phase II transition only those that occurred within
two years. Likewise for Phase III transitions, we only counted those that occurred within
three years of initiating Phase II. This approach has the added benefit of measuring how
successful each phase was on the theory that trials that transition more quickly are
probably more highly valued by their sponsors.
Another approach to dealing with right censoring is to use survival analysis.
Survival analysis examines and models the time it takes for an event to occur. Here we
use the Cox proportional hazard model, following the specification outlined in Cox
(1975). A drug is assumed to have a certain probability of succeeding in each period.
Success is defined as the event of moving from Phase I to Phase II. The instantaneous
probability of success at any given time t is called the hazard rate, h(t), defined as:
The Cox model assumes that the hazard function has the functional form:
nnxxxethth βββ +++⋅= ...0
2211)()(
However, the model assumes no restriction on the function h0(t).
We report the results of our survival analysis in Table 14. We use the same
controls as in the previous section. The numbers reported are hazard ratios. In column 1,
the estimated effect of being an early stage company is large and statistically significant;
it indicates that early stage firms have a 58% higher hazard of moving to Phase II than do
mature firms. The second column breaks out high-cash and low-cash firms. Not
surprisingly, the high-cash firms have an even higher hazard ratio; they are 123% more
27
likely than mature firms to transition from Phase I to Phase II. The increased hazard for
the low-cash firms is 24%%, but it is statistically insignificant.
Columns 3 and 4 describe a similar analysis, although in this case we measure the
hazard of moving from Phase II to Phase III. The results on Phase II to Phase III
transitions are similar to those discussed earlier. The hazard ratio for the early stage firms
is 0.39, indicating that their hazard of progressing from Phase II to Phase III is less than
half that of mature firms. This estimate is statistically significant. The effects for the
early stage high-cash firms and early stage low-cash firms are similar.
5. CONCLUSION
We show that early stage biopharmaceutical firms are more aggressive than
mature biopharmaceutical firms in bringing their drug candidates forward from Phase I to
Phase II clinical trials. However, the drug candidates they bring to Phase II appear to be
less promising; conditional on making it to Phase II, patients in trials conducted by early
stage firms are much less likely to show some tumor shrinkage and these drug candidates
are much less likely to advance to Phase III. These findings are driven to a great extent
by the sub-sample of early stage firms with large cash reserves.
Our findings point to an agency problem between shareholders and managers of
single-product early stage firms who are reluctant to pull the plug on their only viable
drug candidates. We argue that the interests of managers of mature firms are more
aligned with their shareholders. With their large portfolio of drug candidates, managers
of these firms are more willing to pull the plug on unpromising drug candidates because
28
they have other ones they can bring to clinical trials. The findings appear to be consistent
with the benefits of internal capital markets identified by Stein (1997).
There are a number of ways in which we hope to build on this research. First, it is
worth investigating why there are big differences in the behavior of early stage firms.
Part of the answer may lie in understanding why some firms have more cash on hand than
others. One possibility is that firms are more prone to raise equity capital during periods
when biopharmaceutical firms are more highly valued. These funds give managers
considerable freedom in the conduct of clinical trials. By contrast, when market
valuations in this sector are low, firms tend to rely more heavily on alliances in which
control over clinical trials is shared by the firm and its alliance partner (Lerner, Shane and
Tsai, 2003). Thus, understanding the role of the equity markets and alliances in the
clinical trials process is very high on our research agenda.8
Second, we have ignored differences that may exist in the drug development
strategies of mature firms. Although our evidence suggests that having more drugs in the
pipeline makes firms more selective on average and results in a higher Phase II success
rate, the composition of this pipeline and the organizational structure of these firms could
have an effect on their decision making. For example, if cancer drugs are a large part of a
company’s overall portfolio, is it more or less selective in its decision to move forward to
Phase II? Or if the drug candidate was acquired in a merger, how does it affect the
transition probability?
Finally, it would be worth examining the 65 trials that are conducted by the
private firms in our sample. We suspect that many of these firms are still being funded
8 Guedj (2004) is a first step in understanding the role of alliances in clinical trials. His research suggests that even with alliances early stage firms are more prone to take drugs forward from Phase I to Phase II and the fail in Phase II trials.
29
by venture capitalists. In theory, it is not clear whether the existence of venture capital
funding exacerbates or mitigates the agency problem in drug development. On the one
hand, venture capitalists fund companies in stages, disbursing funds only when they are
needed. To the extent that venture capitalists are able to assess the prospects of the drug,
they would not choose to fund drugs with low expected payoffs. On the other hand, the
goal of venture capitalists may not be to maximize the value of the portfolio company,
but rather the shorter-run probability that the firm can be taken public. Gompers (1996)
has shown that this incentive is particularly strong among young venture capital funds
with limited track records since they need to convince potential limited partners that they
have made good portfolio investments. Thus, if a company is better able to go public if it
has later stage clinical trials, venture capitalists may encourage early stage firms to move
clinical trials forward even if the expected payoffs are low.
Our findings raise broader issues about the creation and survival of
biopharmaceutical startups. If the R&D process in early stage firms is inefficient, as we
suggest, then it is natural to ask why such firms would ever be created and how they
could survive in parallel with mature biopharmaceutical firms that seem not to be plagued
by these inefficiencies. Why wouldn’t the founders of biopharmaceutical firms --- most
of whom are academic scientists --- sell their ideas to mature firms with diverse product
portfolios who can manage clinical development more efficiently? It is important to note
that many of them do in fact sell their scientific discoveries to established firms.
However, many do not because in doing so they give up control of follow-on scientific
and clinical advances that emerge in the process of development. While a scientist could,
in principle, be compensated for these follow-on discoveries, given the difficulty of
30
writing complete contracts, it is unlikely that he would be compensated as much as if he
retained control and developed the idea in his own firm. Thus, one potential benefit of
founding a firm to commercialize a scientific discovery is that it provides high-powered
incentives for discovery. The potential cost --- documented in our research --- is that it
provides high-powered incentives to advance drugs through clinical trials even though it
may be inefficient to do so. This suggests that there are costs and benefits of conducting
scientific discovery within different organizational forms. A fuller understanding of
these costs and benefits should be the goal of future research.
31
References
Bertrand, Marianne and Sendhil Mullainathan, “Cash Flow and Investment Project Outcomes: Evidence from Bidding on Oil and Gas Leases,” MIT working paper, 2003. Cockburn, Iain, and Rebecca Henderson "Scale and Scope in Drug Development: Unpacking the Advantages of Size in Pharmaceutical Research." Journal of Health Economics, 20, 2001, pp.1033-1057 Danzon, Patricia, Sean Nicholson, and Nuno Sousa Pereira, “Productivity in Pharmaceutical-Biotechnology R&D: The Role of Experience and Alliances,” National Burea of Economic Research Working Paper No. 9615, March 2003. DiMasi, Joseph A., Ronald W. Hansen and Henry G. Grabowski, “The Price of Innovation: New Estimates of Drug Development Costs,” Journal of Health Economics, Vol. 22, 2003, pp. 151-185. Guedj, Ilan, “Ownership vs. Contract: How Vertical Integration Affects Investment Decisions in Pharmaceutical R&D,” MIT working paper, 2004. Jensen, Michael C., “Agency Costs of Free Cash Flow, Corporate Finance, and Takeovers,” American Economic Review, 76, 1986, pp. 323-329. Khanna, Naveen and Sheri Tice, “The Bright Side of Internal Capital Markets,” Journal of Finance, Vol. 56, 2001, pp. 1489-1528. Lang, Larry H.P., Rene Stulz and Ralph Walkling, “ A Test of the Free Cash flow Hypothesis: The Case of Bidder Returns,” Journal of Financial Economics, 29, 1991, pp. 315-335. Lerner, Josh, Hilary Shane and Alexander Tsai, “Do Equity Financing Cycles Matter?: Evidence from Biotechnology Alliances,” Journal of Financial Economics, 67, 2003, pp. 411-446. Vojislav Maksimovic and Gordon M. Phillips “Do Conglomerate Firms Allocate Resources Inefficiently Across Industries? Theory and Evidence,” The Journal of Finance, April, 2002, 721-767. Myers, Stewart C. and Christopher Howe, “A Life_Cycle Model of Pharmaceutical R&D,” Program on the Pharmaceutical Industry, MIT, Working Paper, 1997. Rajan, Raghuram; Servaes, Henri and Zingales, Luigi. "The Cost of Diversity: The Diversification Discount and Inefficient Investment." The Journal of Finance, 2000, 55(1), pp. 35-80.
32
Roberts, Thomas, et. al., “Trends in the Risks and Benefits to Patients With Cancer Participating in Phase 1 Clinical Trials,” The Journal of the American Medical Association, 2004; No. 17, November 3, 292:2130-2140. Scharfstein, David, “The Dark Side of Internal Capital Markets II: Evidence from Diversified Conglomerates,” National Bureau of Economic Research Working Paper 6352, 1998. Scharfstein, David and Jeremy Stein, “The Dark Side of Internal Capital Markets: Divisional Rent-Seeking and Inefficient Investment,” Journal of Finance, Vol. 55, 2002, pp. 2537-2564. Shin, Hyun-Han and Rene Stulz, “ Are Internal Capital Markets Efficient?,” Quarterly Journal of Economics, 113, 1998, 531-553. Stein, Jeremy, “Internal Capital Markets and the Competition for Corporate Resources,” Journal of Finance, Vol. 52, 1997, pp. 111-133.
33
Table 1 Sample Construction: Identifying Phase I Clinical Trials
The initial sample summarized in this table is from Roberts et. al. (2004). It is constructed by searching for Phase I clinical trials listed in annual publications of Papers/Proceedings of the American Society of Clinical Oncology from 1990-2002. For each year, the table lists the number of abstracts identified, the number of abstracts eliminated from the sample for each of the main reasons described in the text, the number of abstracts meeting the selection criteria, and the number of unique drug agents meeting the selection criteria.
This table reports data on the time that elapsed between the initiation of the first Phase I clinical trial and the initiation of the first Phase II clinical trial for a particular agent, as well as information on the time elapsed between Phase II and Phase III.
Panel A: Time Distribution between Clinical Phases (in months)
Mean Median 25% 75% St. Dev. Phase I to Phase II 22.32 18 11 27 16.97 Phase II to Phase III 26.60 17 12 36 23.32
9-10 0 0.0% 9-10 0 0.0% 10-11 0 0.0% 10-11 1 2.0% Total 162 Total 50
Panel C: Percentage of the sample moving to the next clinical phase
In 2
yearsIn 3
years Ever From Phase I to Phase II 48% 58% 69% From Phase II to Phase III 19% 24% 31%
35
Table 3
Agents per Company and Indications per Agent
This table reports summary statistics of the number of agents developed by companies and the number of indications (different types of cancer) investigated for each drug developed.
This table report summary statistics on the public companies in our sample. We use Standard & Poor's Compustat, Compustat Canada, and Compustat Global Industrial/Commercial. For comparability, all the financial numbers are converted to million U.S. Dollars deflated to the year 2000. All the figures are for the year in which each drug went to Phase I clinical trials. Revenues, Assets, Cash, R&D, and Book Value are from the respective items in Compustat. Market Cap is the number of outstanding shares at the end of the calendar year multiplied by the share price at the end of the calendar year. Q is defined as the ratio of the market value of equity plus the book value of assets less the book value of equity to the book value of assets. Panel A reports the full sample; Panel B reports the sub-sample of mature firms; and Panel C reports the complimentary sub-sample of early-stage firms. We define an early stage firm as one with revenues less than or equal to $30 million deflated to the year 2000.
Panel A: Full Sample
Statistics Years Since Public
Revenues Assets Cash R&D Market Cap
Book Value Q
Mean 25.8 8,116.9 10,964.5 1,947.0 1,003.9 38,635.2 5,282.3 10.2 Median 21.7 5,761.7 4,544.9 452.1 394.5 10,310.8 1,563.4 7.4 St. Dev. 22.7 9,766.1 13,531.1 3,257.8 1,228.8 54,844.1 7,001.9 10.5
Table 5 Probit Regressions of the Probability of Moving from Phase I to Phase II
This table reports the result of probit regressions. The dependent variable takes the value 1 if the firm progresses to Phase II trials within two years of initiating a Phase I trial and 0 otherwise. The regressors include a dummy variable which takes the value one if the company is an early stage company (revenues no more than $30 million deflated to the year 2000). The regressors also include a set of controls for clinical results of the Phase I trials, as well as characteristics of the drug in development. Response Rate I is the percentage of patients whose tumor shrank in the Phase II trials. Toxicity is the percentage of patients who had a toxic reaction to the drug in the Phase I trials. Biologic is a dummy variable that equals 1 if the drug is a biologic drug, 0 if it is a chemical drug. NIH Sponsored is a dummy variable that equals 1 if the National Institutes of Health (NIH) or any of its affiliate institutes such as the National Cancer Institute (NCI) sponsored the drug. The regressions also control for the potential financial profit to be expected from the development of the drugs. One of the controls is the PharmaProjects’ estimated market size of the targeted indication. We use two dummy variables, one for whether the estimated market size is between $500 million and $2000 million and another for whether the estimated market size exceeds $2000 million. Another control measures the novelty of the drugs. We measure this by recording the pharmacological description (a drug’s mechanism of action in the body through which it exerts its therapeutic effect) and ranking the drug by the number of drugs developed for cancer with the same pharmacological description prior to this drug. Novelty is the log of the inverse of this rank. (1) (2) (3) (4)Early Stage (dummy) 0.1613 0.1649 0.1600 0.1655
(2.83) (3.17) (2.70) (3.01) Response Rate I (percentage) 0.9721 1.1972
Number of Observations 235 235 235 235 Note: We report the change in the probability for an infinitesimal change in each independent, continuous variable and, by default, the discrete change in the probability for dummy variables. In parenthesis are the z-stats calculated using White (1982) standard errors. We cluster around the phase I year.
38
Table 6 Summary Statistics of Phase II Clinical Data
This table reports summary statistics on the clinical data collected from the Papers/Proceedings of the American Society of Clinical Oncology (ASCO) from 1990-2002. If a drug had more than one Phase II trial for a particular indication we weight the results by the number of effective patients in each clinical trial. There are 11 categories of indications derived from the American Cancer Society. Response Rate is the percentage of patients whose tumor shrank in the Phase II trials. Previous Treatments is the number of previous treatments the patients in the trial have had prior to joining the trial.
Panel A: Tumor Response Rates
Panel B: Phase II Indications
Indication Full Sample Early Stage Companies
Mature Companies
Bone 1% 1% 0% Brain & Nervous systems 3% 3% 3% Breast 14% 10% 17% Digestive 20% 22% 18% Genital 14% 14% 14% Head and Neck 3% 3% 3% Leukemia 1% 2% 0% Lymphoma 6% 7% 5% Respiratory 20% 21% 20% Skin 7% 8% 6% Urinary 10% 7% 12% Other 1% 0% 1%
Table 7 Regressions of the Response Rates of Patients in Phase II Clinical Trials
The dependent variable is Response Rate, the percentage of patients in a Phase II trial whose tumors shrank. These data are taken from Papers/Proceedings of the American Society of Clinical Oncology (ASCO) from 1990-2002. If more than one trial was undertaken for a certain indication, we average them, weighting by the number of patients. Because indications have different baseline response rate, we control for each indication by including indication dummies based on categories of the American Cancer Society. We also control for the number of previous treatments the patients received prior to joining the trial, and for the stage of the cancer the patient is in. Columns (1), (2), and (3) use the sub-sample of public firms that moved to Phase II within 2 years of starting Phase I trials. Column (3) uses the full sample. In parenthesis are the t-stats calculated using White (1982) standard errors. (1) (2) (3) (4)Early Stage (dummy) -0.0442 -0.0589 -0.0646 -0.0615 (1.44) (2.24) (2.38) (3.53) Market Size - 500-2000$m (dummy) 0.0020 0.0502
(0.26) (0.96) Novelty -0.0107 -0.0103 (2.05) (2.38) Indication Dummies No Yes Yes Yes Previous Treatment Dummies No Yes Yes Yes Disease Stage Dummies No Yes Yes Yes R2 0.02 0.29 0.30 0.27 Number of Observations 108 108 108 201
40
Table 8 Probit Regressions of the Probability of Moving from Phase II to Phase III for the
Drugs Candidates that Moved to Phase II
This table reports the result of probit regressions. The dependent variable takes the value 1 if the firm progresses to Phase III trials within two years of initiating a Phase II trial and 0 otherwise. The regressors include a dummy variable which takes the value one if the company is an early stage company (revenues less than $30 million deflated to the year 2000). The regressors also include a set of controls for the characteristics of the drug in development. One of the controls is the PharmaProjects’ estimated market size of the targeted indication. We use two dummy variables, one for whether the estimated market size is between $500 million and $2000 million and another for whether the estimated market size exceeds $2000 million. Another control measures the novelty of the drugs. We measure this by recording the pharmacological description (a drug’s mechanism of action in the body, through which it exerts its therapeutic effect) and ranking the drug by the number of drugs developed for cancer with the same pharmacological description prior to this drug. Novelty is the log of the inverse of this rank.
(1) (2) Early Stage (dummy) -0.2136 -0.1931
(2.79) (2.46)
Market Size - 500-2000$m (dummy) 0.2057 (0.76)
Market Size - 2000+$m (dummy) 0.0276 (0.12)
Novelty 0.0618 (2.74)
Number of Observations 122 122
Note: We report the change in the probability for an infinitesimal change in each independent, continuous variable and, by default, the discrete change in the probability for dummy variables. In parenthesis are the z-stats calculated using White (1982) standard errors. We cluster around the phase I year.
41
Table 9
Current Status of the Drugs
This table reports the current status of the drugs in our sample according to PharmaProjects. NDR – No Development Reported, is the status assigned by The PharmaProjects when there is no information about a drug and it seems the drug is not under development anymore (although the company has not officially announced that the drug has been discontinued). Discontinued refers to drugs for which the company has announced that it has ceased development. Pre-Registration refers to drugs for which the company is in the process of filing a NDA (New Drug Application) with the FDA (Food and Drug Administration) or has announced that it intends to do so . Launched drugs are those drugs that have been approved by the FDA and are on the market. Panel A reports the statistics for all the drugs; Panel B reports the statistics for the drugs that have moved to Phase II within two years of Phase I initiation.
PANEL A: All the drugs
All Mature Companies Early Stage CompaniesStatus Frequency Percentage Frequency Percentage Frequency PercentageNDR 53 22.55% 38 27.34% 15 15.63% Discontinued 31 13.19% 22 15.83% 9 9.38% Phase I 25 10.64% 15 10.79% 10 10.42% Phase II 67 28.51% 27 19.42% 40 41.67% Phase III 27 11.49% 16 11.51% 11 11.46% Pre-Registration 5 2.13% 0 0.00% 5 5.21% Launched 27 11.49% 21 15.11% 6 6.25% 235 139 96
PANEL B: Drugs that Moved to Phase II in 2 Years or Less
All Mature Companies Early Stage CompaniesStatus Frequency Percentage Frequency Percentage Frequency PercentageNDR 18 14.75% 9 14.29% 9 15.25% Discontinued 12 9.84% 6 9.52% 6 10.17% Phase I 1 0.82% 20 31.75% 1 1.69% Phase II 44 36.07% 10 15.87% 24 40.68% Phase III 20 16.39% 0 0.00% 10 16.95% Pre-Registration 4 3.28% 0 0.00% 4 6.78% Launched 23 18.85% 18 28.57% 5 8.47% 122 63 59
42
Table 10 Sales of Approved Drugs
This table reports the sales of the drugs in the sample that were approved. The source of the data is New Medicine’s Oncology KnowledgeBASE. All the sales figures are in Millions of US Dollars deflated to year 2000 values. The numbers are for the first, second, and third year of sales following FDA approval. Out of the 29 drugs approved in the sample, this table is based on data on 23 of those drugs, 17 out of the 22 approved drugs originated by mature companies and all the 7 approved drugs originated by early stage companies. Mean Median St. Dev. Min Max First Year Sales Mature Companies 99.7 62.3 108.9 0.9 441.8 Early Stage Companies 12.7 6.0 17.1 1.4 56.4 Second Year Sales Mature Companies 141.6 98.2 144.7 5.0 590.4 Early Stage Companies 60.3 15.0 72.9 2.6 176.1 Third Year Sales Mature Companies 199.4 145.4 196.0 5.0 718.9 Early Stage Companies 108.5 20.8 135.6 6.5 339.4
43
Table 11 Probit Regressions of the Probability of Moving from Phase I to Phase II
This table reports the result of probit regressions. The dependent variable takes the value 1 if the firm progresses to Phase II trials within two years of initiating a Phase I trial and 0 otherwise. The regressors include a dummy variable which takes the value one if the company is an early stage company (revenues no more than $30 million deflated to the year 2000) and is financially constrained (cash of less than $30 million deflated to the year 2000). We also include a dummy for early stage companies that are not financially constrained (those early stage companies with more that $30 million of cash deflated to the year 2000). The regressors also include a set of controls for clinical results of the Phase I trials, as well as characteristics of the drug in development. Response Rate I is the percentage of patients whose tumor shrank in the Phase II trials. Toxicity is the percentage of patients who had a toxic reaction to the drug in the Phase I trials. Biologic is a dummy variable that equals 1 if the drug is a biologic drug, 0 if it is a chemical drug. NIH Sponsored is a dummy variable that equals 1 if the National Institutes of Health (NIH) or any of its affiliate institutes such as the National Cancer Institute (NCI) sponsored the drug. The regressions also control for the potential financial profit to be expected from the development of the drugs. One of the controls is the PharmaProjects’ estimated market size of the targeted indication. We use two dummy variables, one for whether the estimated market size is between $500 million and $2000 million and another for whether the estimated market size exceeds $2000 million. Another control measures the novelty of the drugs. We measure this by recording the pharmacological description (a drug’s mechanism of action in the body, through which it exerts its therapeutic effect) and ranking the drug by the number of drugs developed for cancer with the same pharmacological description prior to this drug. Novelty is the log of the inverse of this rank. (1) (2) (3) (4)Early Stage High Cash Firm (dummy) 0.3000 0.3165 0.2868 0.3029
Number of Observations 235 235 235 235 Note: We report the change in the probability for an infinitesimal change in each independent, continuous variable and, by default, the discrete change in the probability for dummy variables. In parenthesis are the z-stats calculated using White (1982) standard errors. We cluster around the Phase I year.
44
Table 12
Regressions of the Response Rate of Patients in Phase II Clinical Trials The dependent variable is Response Rate, the percentage of patients in a Phase II trial whose tumors shrank. These data are taken from Papers/Proceedings of the American Society of Clinical Oncology (ASCO) from 1990-2002. If more than one trial was undertaken for a certain indication, we average them, weighting by the number of patients. Because indications have different baseline response rate, we control for each indication by including indication dummies based on categories of the American Cancer Society. We also control for the number of previous treatments the patients received prior to joining the trial, and for the stage of the cancer the patient is in. Columns (1), (2), and (3) use the sub-sample of public firms that moved to Phase II within 2 years of starting Phase I trials. Column (3) uses the full sample. In parenthesis are the t-stats calculated using White (1982) standard errors. (1) (2) (3) (4)Early Stage High Cash Firm (dummy) -0.0551 -0.0889 -0.0934 -0.0609
(0.00) (0.59) Novelty -0.0099 -0.0091 (2.25) (2.28) Indication Dummies No Yes Yes Yes Previous Treatment Dummies No Yes Yes Yes Disease Stage Dummies No Yes Yes Yes R2 0.02 0.30 0.31 0.28 Number of Observations 108 108 108 201
45
Table 13
Probit Regressions of the Probability of Moving from Phase II to Phase III
The model estimated is a probit model. The dependent variable is the probability of advancing from phase II to phase III in the 3 years following phase II, thus it takes one of two values: 1 if the drug moved to phase II and 0 if not. We define an early stage company as one that has revenues (deflated to the year 2000) of less than 30$m. We define a financially constrained company as one that has less than 30$m in cash and short-term investments (Deflated to the year 2000). We regress this probability on a dummy if the company is an early stage company and not financially constrained and on another dummy if it is an early stage company that is financially constrained. Market size – We use 3 dummies whether the potential market size is up to 500$m, between 500 and 2000$m and more than 2000$m. Novelty of the drugs – for every drug we record its pharmacological description (a drug’s mechanism of action in the body, through which it exerts its therapeutic effect) and rank the drug by the number of drugs developed for cancer with the same pharmacological description prior to this drug. Novelty is the log of the inverse of this rank.
(1) (2) Early Stage High Cash Firm (dummy) -0.2974 -0.2903
(3.28) (3.54) Early Stage Low Cash Firm (dummy) -0.0762 (0.05)
(1.02) (0.67)
Market Size - 500-2000$m (dummy) 0.3092 (1.14)
Market Size - 2000+$m (dummy) 0.0918 (0.46)
Novelty 0.0396 (1.66)
Number of Observations 122 122
Note: We report the change in the probability for an infinitesimal change in each independent, continuous variable and, by default, the discrete change in the probability for dummy variables. In parenthesis are the z-stats calculated using White (1982) standard errors. We cluster around the Phase I year.
46
Table 14
Cox Proportional Hazard Model We use a Cox proportional hazard model, following the specification outlined in Cox (1975) as a methodology developed to analyze survival data. We do so in order to account for the possible right censoring in our data. A drug is assumed to have a certain probability of succeeding in each period. Success is defined as the event of moving from phase I to phase II, or the event of moving from phase II to phase III. The instantaneous probability of success at any given time t is called the hazard rate, h(t), defined as:
The Cox model assumes that the hazard function has a functional form, yet the model assumes no restriction on the function. Thus, the dependent variable is time to the defined outcome. We use the same variables and controls as described the earlier tables. Advancing from
phase I to phase II Advancing from
phase II to phase III (1) (2) (3) (4)Early Stage (dummy) 1.5790 0.3946
(3.43) (2.78) Early Stage High Cash Firm (dummy) 2.2269 0.3452
(4.71) (2.88) Early Stage Low Cash Firm (dummy) 1.2401 0.4487
(1.80) (1.23) (1.55) (1.65) Number of Observations 235 235 162 162 Note: We report the hazard rate for an infinitesimal change in time. In parenthesis are the z-stats calculated using White (1982) standard errors.