Orientation and magnitude of in situ stress to 6.5 km depth in the Baltic Shield B. Lund a, *, M.D. Zoback b a Department of Earth Sciences, Uppsala University, Villava ¨gen 16, 752 36 Uppsala, Sweden b Department of Geophysics, Stanford University, Stanford, CA 94305-2215, USA Accepted 29 November 1998 Abstract Understanding the state of stress in the earth is important for a broad range of engineering and geological problems. To obtain the state of stress in boreholes where conditions are such that conventional stress measurement techniques are impossible, we have used recent developments in the analysis of compressive and tensile wellbore failure in an integrated stress measurement strategy, involving also direct measurement of the least principal stress. The analysis is carried out in the two deep boreholes in the Siljan Ring area of the Baltic Shield. The Gravberg-1 borehole reached 6779 m true vertical depth (TVD) in the Siljan region, central Sweden, and the Stenberg-1 borehole, drilled 10 km to the south of Gravberg-1, was completed at 6529 m TVD. Analysis of vertical, drilling-induced tensile fractures in the nondeviating part of the Gravberg-1 well indicated that one principal stress is vertical and thus could be calculated from density estimates. Borehole breakouts and tensile fractures indicated that the average direction of the maximum horizontal stress, S H , is N728W278 in Gravberg-1 and N538W298 in the Stenberg-1 well. The direction of S H is on average very stable in both wells. Lower bound limits on the magnitude of the minimum horizontal stress, S h , in the Gravberg-1 well were obtained from controlled and uncontrolled hydraulic fracturing and formation integrity tests. At 5 km depth in the Gravberg-1 borehole the minimum horizontal stress is approximately two-thirds of the vertical stress. We estimated the magnitude of the maximum horizontal stress in Gravberg-1 on the basis of drilling-induced tensile fractures identified in the borehole. S H was estimated by calculating the stress at the borehole wall necessary to cause tensile failure of the formation, incorporating our lower bound S h estimates, corrections for the cooling of the wellbore by drilling fluids and dierential fluid pressures. Our results indicate a strike-slip faulting regime in the Siljan area and that the state of stress is in frictional equilibrium with a coecient of friction in the range 0.5 to 0.6. # 1999 Elsevier Science Ltd. All rights reserved. 1. Introduction Direct knowledge of the magnitudes of in situ stres- ses is important at all scales from engineering appli- cations, such as the stability of boreholes and mine shafts, to placing constraints on geological problems such as how plate-driving forces are transmitted through the lithosphere. While the methodology for determining the orientation and relative magnitude of crustal stresses is now well-established [1–3] and has been utilized at literally thousands of sites around the world, e.g. Zoback [4], there have been extremely few sites where in situ stress magnitude has been measured at depths greater than 2–3 km, see review in Brudy et al. [5]. This is in part due to the very few deep bore- holes drilled but also because conventional stress mag- nitude measurement techniques, e.g. overcoring and hydraulic fracturing, are technically extremely dicult in deep boreholes. Recent developments [6–8] in the in- terpretation and analysis of drilling-induced compres- sive and tensile failures in wellbore image data have, however, made stress orientation and magnitude esti- mation considerably easier and also allows for a con- tinuous stress profile along the borehole. An application of these techniques and a notable exception to the absence of direct measurements of International Journal of Rock Mechanics and Mining Sciences 36 (1999) 169–190 0148-9062/99/$ - see front matter # 1999 Elsevier Science Ltd. All rights reserved. PII: S0148-9062(98)00183-1 PERGAMON * Corresponding author. Tel.: +46-18-471-3328; fax: +46-18-50- 1110; E-mail address: [email protected] (B. Lund).
Transcript
Orientation and magnitude of in situ stress to 6.5 km depth inthe Baltic Shield
B. Lunda, *, M.D. Zobackb
aDepartment of Earth Sciences, Uppsala University, VillavaÈgen 16, 752 36 Uppsala, SwedenbDepartment of Geophysics, Stanford University, Stanford, CA 94305-2215, USA
Accepted 29 November 1998
Abstract
Understanding the state of stress in the earth is important for a broad range of engineering and geological problems. To
obtain the state of stress in boreholes where conditions are such that conventional stress measurement techniques are impossible,we have used recent developments in the analysis of compressive and tensile wellbore failure in an integrated stress measurementstrategy, involving also direct measurement of the least principal stress. The analysis is carried out in the two deep boreholes inthe Siljan Ring area of the Baltic Shield. The Gravberg-1 borehole reached 6779 m true vertical depth (TVD) in the Siljan
region, central Sweden, and the Stenberg-1 borehole, drilled 10 km to the south of Gravberg-1, was completed at 6529 m TVD.Analysis of vertical, drilling-induced tensile fractures in the nondeviating part of the Gravberg-1 well indicated that one principalstress is vertical and thus could be calculated from density estimates. Borehole breakouts and tensile fractures indicated that the
average direction of the maximum horizontal stress, SH, is N728W278 in Gravberg-1 and N538W298 in the Stenberg-1 well.The direction of SH is on average very stable in both wells. Lower bound limits on the magnitude of the minimum horizontalstress, Sh, in the Gravberg-1 well were obtained from controlled and uncontrolled hydraulic fracturing and formation integrity
tests. At 5 km depth in the Gravberg-1 borehole the minimum horizontal stress is approximately two-thirds of the vertical stress.We estimated the magnitude of the maximum horizontal stress in Gravberg-1 on the basis of drilling-induced tensile fracturesidenti®ed in the borehole. SH was estimated by calculating the stress at the borehole wall necessary to cause tensile failure of theformation, incorporating our lower bound Sh estimates, corrections for the cooling of the wellbore by drilling ¯uids and
di�erential ¯uid pressures. Our results indicate a strike-slip faulting regime in the Siljan area and that the state of stress is infrictional equilibrium with a coe�cient of friction in the range 0.5 to 0.6. # 1999 Elsevier Science Ltd. All rights reserved.
1. Introduction
Direct knowledge of the magnitudes of in situ stres-
ses is important at all scales from engineering appli-
cations, such as the stability of boreholes and mine
shafts, to placing constraints on geological problems
such as how plate-driving forces are transmitted
through the lithosphere. While the methodology for
determining the orientation and relative magnitude of
crustal stresses is now well-established [1±3] and has
been utilized at literally thousands of sites around the
world, e.g. Zoback [4], there have been extremely few
sites where in situ stress magnitude has been measured
at depths greater than 2±3 km, see review in Brudy et
al. [5]. This is in part due to the very few deep bore-
holes drilled but also because conventional stress mag-
nitude measurement techniques, e.g. overcoring and
hydraulic fracturing, are technically extremely di�cult
in deep boreholes. Recent developments [6±8] in the in-
terpretation and analysis of drilling-induced compres-
sive and tensile failures in wellbore image data have,
however, made stress orientation and magnitude esti-
mation considerably easier and also allows for a con-
tinuous stress pro®le along the borehole.
An application of these techniques and a notable
exception to the absence of direct measurements of
International Journal of Rock Mechanics and Mining Sciences 36 (1999) 169±190
0148-9062/99/$ - see front matter # 1999 Elsevier Science Ltd. All rights reserved.
Fig. 1. Map of Scandinavia with the Siljan region enclosed in the rectangle. Directions of maximum horizontal stress on the map are from the
World Stress Map Project [4] using their terminology and de®nitions, see legend. Inset is a geological map of the Siljan Ring impact structure
with the location of the two deep wells marked with ®lled triangles. Geological map simpli®ed after Hjelmqvist [14].
B. Lund, M.D. Zoback / International Journal of Rock Mechanics and Mining Sciences 36 (1999) 169±190170
stress magnitude at great depth are the data from theultra-deep KTB scienti®c research well in Germany.Zoback et al. [9] and Brudy et al. [5] report on an inte-grated program of in situ stress measurements to 8 kmdepth utilizing detailed observations of wellbore fail-ure. An integrated stress measurement strategy (ISMS)was utilized at KTB to estimate the magnitude andorientation of all three principal stresses. The ISMSinvolves combining direct measurement of the leastprincipal stress, made with hydraulic fracturing, anddetailed analysis of extensive drilling-induced wellborefailure. This integrated methodology was ®rst utilizedto determine stress magnitudes in the Cajon Pass bore-hole near the San Andreas fault in California [10]. Itshould be emphasized that the ISMS, using high resol-ution wellbore image tools, is a valuable method for
stress pro®ling also in shallower boreholes due to therelative ease of including the image tools in the regularlogging program.
We report here the application of an ISMS, similarto that utilized in the KTB borehole, in the Gravberg-1 and Stenberg-1 deep boreholes in Sweden. In thesearch for deep abiogenic gas within the Siljan DeepDrilling Project, two wells were drilled into the SiljanRing, a meteorite impact structure formed approxi-mately 360 Ma ago [11±13] in central Sweden, seeFig. 1. The Siljan impact is situated in the BalticShield, the crust below Siljan is about 45 km thick [15]and heat ¯ow is estimated to 60±65 mW/m2 [16]. TheGravberg-1 well was drilled into the northern part ofthe impact structure whereas the Stenberg-1 well wasdrilled into the central region of the impact.
Fig. 2. (A) N308E projection of the geometry of the Gravberg-1 well onto the N±S trending seismic section line 5 [18]. TD refers to the total
drilled depth along each borehole. The well penetrated mostly granitic rocks but also several subhorizontal dolerite intrusions, three of which
were identi®ed as prominent seismic re¯ectors [19]. (B) Deviation of the Gravberg-1 well with depth. The ®lled circles represent the original hole,
the open circles the ®rst side-track and the crosses the second side-track. Deviation increases rapidly below 4.5 km but never reaches more than
458 in the section of the well that is of interest in our study. The vertical bars to the left in the ®gure indicate the sections of the well where we
have data from the BGT, the bars to the right indicate the FMS logs. (C) Deviation of the Stenberg-1 well with depth. Data from the original
hole, which was abandoned at 4133 m, and the side-track have been merged. The vertical bar to the left indicates the section where we have
BGT data.
B. Lund, M.D. Zoback / International Journal of Rock Mechanics and Mining Sciences 36 (1999) 169±190 171
Spudded on July 1, 1986, the Gravberg-1 well wasdrilled [17] in two drilling operations down to a truevertical depth of 6779 m, see Fig. 2. The well was side-tracked three times due to severe downhole conditionswith the drill bit frequently becoming stuck. All fourholes deviate to the north-northeast, see Fig. 2, up toas much as 458 from the vertical in the lower part ofsidetrack 1. Only 8.5 m of core was recovered from thewell. The well penetrated almost exclusively granites,varying in age from 1.7 to 1.9 Ga [20, 21] and withoutany foliation. Dolerite sills at depth were identi®ed inthe well [20, 21] and the region is cut by preimpactdolerite dikes [22, 23]. A number of fracture zones ofvarying thickness were drilled through, many of themin conjunction with the dolerite intrusions [24]. Fourhigh amplitude re¯ectors were identi®ed in re¯ectionseismic investigations in the area, three of them werepenetrated by the borehole and have been correlatedwith major dolerite intrusions [19], see Fig. 2. Thestate of stress in the Gravberg-1 well has been investi-gated earlier by several authors. Stephansson et al. [25]presented directions of the maximum horizontal stress,SH, to 4 km depth and estimates of the magnitude ofthe minimum horizontal stress, Sh, based on data fromthe well [26]. They also estimated the magnitude of SH
by extrapolating results from shallower boreholes [26].Qian and Pedersen [27], corrected by Qian et al. [28],used a nonlinear inversion scheme to invert the bore-hole breakouts in Gravberg-1 for the direction of thehorizontal stresses and the ratios SH/SV and Sh/SV,assuming that SV is a principal stress. Zajac andStock [29], with an unfortunate misspelling of Siljanboth in the title and in the text of the paper, invertedthe data published by Qian and Pedersen [27] with agenetic algorithm and a nongradient N-dimensionaloptimizer to ®nd the directions of the three principalstresses and the shape factor f=(s2ÿs3)/(s1ÿs3).We will comment on the results of these investigationsin the appropriate sections below.
Spudded in July, 1991 and drilled to a true verticaldepth of 6529 m [30], see Fig. 2, the Stenberg-1 bore-hole was the second well in the Siljan deep drillingproject. The well was drilled in the central part of theSiljan impact structure, see inset Fig. 1, and as theGravberg-1 well penetrated predominantly graniticrock intersected by dolerite sills and fracture zones [31].The Stenberg-1 well was also sidetracked, when theoriginal hole had to be abandoned at 4133 m, but thedeviation problems were less severe than in theGravberg-1 well, see Fig. 2. The Stenberg-1 well hasbeen less extensively investigated than the Gravberg-1well. There are, for example, no image logs of theborehole wall from the Stenberg-1 well, and we thususe the Stenberg-1 data only to obtain the orientationof the stress tensor, using caliper information on bore-hole geometry which was measured in the entire well
below 800 m. No core was recovered in the Stenberg-1well.
In the sections below, we basically follow the ISMSas employed in the KTB boreholes [5], with somemodi®cation to the estimation of the thermally inducedstress, and attempt to utilize the observations of bore-hole failure in the Gravberg-1 and Stenberg-1 bore-holes to constrain stress orientations and magnitudesto great depth in the Siljan area. Although no speci®cstress measurement program was planned for the twoboreholes and downhole conditions, with large devi-ations and wellbore failure, were very di�cult, thereare su�cient data to use the integrated approach dis-cussed above to estimate the full stress tensor. Thestress estimates will then be tested against the hypoth-esis that the state of stress in the crust is in equilibriumwith the theoretical frictional strength as de®ned bylaboratory data and frictional faulting theory.
2. Observations of borehole failure I: in situ stressorientation
The orientation of horizontal principal stresses isroutinely measured in vertical wellbores utilizingstress-induced wellbore breakouts. These form at theazimuth of the least principal horizontal stress, thepoint around the wellbore where the compressive stressconcentration is maximum, e.g. Bell and Gough [32],Zoback et al. [33] and many others. Both 4-armcaliper [32, 34] and ultrasonic borehole televiewer [35]can be used to identify breakouts and determine stressorientation. As shown by Zoback et al. [33], Plumband Hickman [34] and Shamir and Zoback [36], bore-hole televiewers are better for determining stress orien-tation from wellbore breakouts due to their higherresolution.
As pointed out by Mastin [37], breakouts in deviatedboreholes cannot be used to assess stress directionsdirectly as the point of most compressive stress con-centration around the wellbore is a�ected by the mag-nitudes of all three principal stresses and theorientation of the wellbore. Peska and Zoback [7] ana-lyzed this problem more fully and demonstrated thatunder appropriate circumstances one could use theorientation of breakouts in deviated wellbores to assessboth stress orientation and stress magnitude. As theGravberg-1 and Stenberg-1 wellbores are deviated sig-ni®cantly below 5 km but we lack the data to do acomplete analysis according to Peska and Zoback [7],data from the deviated part of the well has not beenused in estimating stress orientation.
Following the general criterion of Plumb andHickman [34] for distinguishing stress-induced wellborebreakouts from other types of drilling-induced well-bore enlargements such as key-seats and washouts (see
B. Lund, M.D. Zoback / International Journal of Rock Mechanics and Mining Sciences 36 (1999) 169±190172
below), we devised a standard procedure to analyzethe large amounts of 4-arm caliper data at our dispo-sal. Four constraints were applied to the caliper databefore it could be accepted as breakouts. This pro-cedure is described in detail in Appendix A and thefollowing is a summary:
. The di�erence between the long and the short diam-eter of the hole should be more than X cm, whenthe original drill bit diameter was Y cm.
. The short diameter of the hole should be close tothe original diameter, to avoid washout zones, orzones of failure of the entire wellbore, where thewellbore is enlarged around its entire perimeter.
. The tool should not be allowed to rotate within abreakout more than a few degrees within a givenbreakout interval (typically Z m's).
. Data should be disregarded from the sections wherethe breakout direction is parallel to the direction ofdeviation of the borehole. In a deviated borehole thedrill string will erode the high-side of the boreholewall (key seating) which might cause an enlargementof the diameter which cannot be distinguished froma breakout.
In addition to breakouts, drilling-induced tensilewall fractures were observed in wellbore image data inthe Gravberg-1 well and these can be used to deter-mine stress orientations in the well [5, 6, 8, 38, 39]. Asdiscussed at length in Brudy and Zoback [8], thesefractures are small scale tensile fractures induced bythe stress concentration at the wellbore wall. Theyoccur when the point of least compressive stressaround the wellbore goes into tension and do not pro-pagate away from the borehole because of the rapidincrease of compressive stress with distance from thewellbore [8]. In vertical wells this is the azimuth of themaximum horizontal compressive stress if one princi-pal stress is vertical (corresponding to the overburden).The stress regime is important for the formation ofinduced tensile fractures. In near vertical wells, theyform almost exclusively in strike-slip stress regimeswhere there is an appreciable di�erence in the magni-tude of the maximum and minimum horizontal princi-pal stresses [7, 39]. These fractures are only detectablethrough borehole imaging as they do not alter theshape of the wellbore as breakouts do. As showed byBrudy and Zoback [8] and demonstrated below, withappropriate knowledge of other factors which a�ectthe stress concentration around the wellbore (princi-pally cooling of the wellbore by the drill ¯uid and thedensity and pumping pressure of the ¯uid in the bore-hole) the occurrence of these features can be used toestimate the magnitude of the maximum horizontalstress. When the wellbore axis does not coincide withone principal stress, the fractures form at an angle
inclined to the wellbore axis in an en echelonpattern [6, 7].
In practice, it is often not straight forward to deter-mine whether linear, axial marks found on wellboreimages are drilling induced tensile fractures. We utilizehere the following indicators [8].
. The fractures appear in pairs on opposite sides ofthe wellbore.
. If the borehole is parallel to one principal stress thefractures are parallel to the borehole axis.
. If the borehole deviates from the principal stresses,the induced tensile cracks form at angles to theborehole axis in an en-echelon pattern. The fracturesusually show small kinks and are not perfectlystraight.
. The tensile fractures occur at the azimuth of thedirection of the maximum horizontal stress in near-vertical wells. If there are breakouts present, there isa 908 di�erence between the azimuth of the break-outs and the tensile cracks.
Using these criteria, abundant drilling induced ten-sile fractures were identi®ed in the KTB pilot hole andthe Soultz-sous-Foreà ts GPK1 borehole as well as inthe KTB main borehole [8]. Fig. 3 is an example of aninduced tensile fracture at 5 km depth in theGravberg-1 well. This section of the well was loggedtwice with the 2-pad FMS tool and we were able tofollow the fracture trace on both sides in the wellbore.On both trips with the FMS tool one pad travelled ap-proximately to the south in the borehole, which is whythere are three strips in Fig. 3, not four.
2.1. The Gravberg-1 well
Wellbore breakout data in the Gravberg-1 wellcome from two di�erent tools, the borehole geometrytool (BGT) and the formation microscanner (FMS),an electrical imaging device [40], both equipped withfour-arm calipers and magnetic orientation sensors.The BGT has 2 cm wide arms and is able to followthe breakouts deeper than the FMS which has 7 cmwide pads at the end of the arms. The BGT was run inalmost the entire well, see the vertical bars to the leftin Fig. 2B, and thus supplied the bulk of the breakoutdata. The FMS was run in 8 short intervals in loggingsuite 3, between 1250 and 3932 m, and continuously inlogging suite 6, between 4167 and 5683 m in the orig-inal hole, see the thick vertical bars to the right inFig. 2B. All depths referred to are measured depths(MD) along the borehole and unless stated otherwiseall depths below in the remaining of the paper willalso be MD.
We received the BGT data from Gravberg-1 aftersome initial processing had been done, this is the same
B. Lund, M.D. Zoback / International Journal of Rock Mechanics and Mining Sciences 36 (1999) 169±190 173
data set that Qian and Pedersen used as a base fortheir further data reduction [27], consisting of over 7km of data sampled every 30 cm (1 ft). The data wasfurther processed by us as discussed above. The FMScaliper data were processed entirely by us according tothe above scheme. The resulting SH directions, includ-ing both BGT and FMS caliper data, is presented ascrosses in Fig. 4A. Each cross represents an averageSH direction in a 10 m interval and only intervals withmore than 5 samples left after the processing havebeen included. The horizontal bar on the data point is
the standard deviation within that interval calculated
with circular statistics according to Mardia [41]. (A
discussion of factors contributing to the uncertainty in
the SH direction estimates can be found in Appendix
A.) Note that the standard deviation is highest in the
upper part of the well, where the breakouts are gener-
ally fewer and more scattered. The mean orientation
of breakouts indicates a west-northwest direction of
maximum horizontal compression that is discussed
below.
Fig. 3. Example of a FMS image from 5 km depth in the Gravberg-1 borehole. The section was logged twice and the two images have been
joined to produce this ®gure, which is oriented as indicated by the directions on top of the ®gure. The induced tensile fracture is the obvious ver-
tical feature on the left and right pad strips. A number of natural fractures cutting through the borehole can also be seen.
B. Lund, M.D. Zoback / International Journal of Rock Mechanics and Mining Sciences 36 (1999) 169±190174
Fig. 4. Directions of the maximum horizontal stress, SH. The crosses are stress orientations from borehole breakouts averaged over 10 m sections
in the boreholes, the circles stress orientations from induced tensile fractures. Superimposed on the breakout data points are the standard devi-
ations as a horizontal bar. (A) Direction of SH in the Gravberg-1 well. The average orientation over the borehole from 0 to 4850 m, where the
deviation is less than 158, is N728W278. (B) Direction of SH in the Stenberg-1 well. The average orientation over the borehole from 0 to 5950
m, deviation less than 158, is N538W298.
B. Lund, M.D. Zoback / International Journal of Rock Mechanics and Mining Sciences 36 (1999) 169±190 175
The data presented in Fig. 4A show a remarkablesimilarity to the pro®le of maximum horizontal stressdirections determined from wellbore breakouts encoun-tered from 1.7 to 3.5 km depth in the Cajon Passscienti®c research well near the San Andreas fault [36]and in the KTB ultra-deep well in Germany [5]. Thereis a well-de®ned average stress direction that does notchange systematically with depth, but there are bothlong- and short-wavelength variations of stress orien-tation and several abrupt jumps in stress orientationthat have been interpreted to be caused by slip onactive faults [26, 36, 42]. This is discussed at greaterlength below.
The formation microscanner tool run in theGravberg-1 well was a 2-pad tool, i.e. only two of thefour pads were equipped with electrodes to create amicro-resistivity image. The tool thus gives two stripsof images of the borehole wall, 908 apart, and coversonly about 20% of the borehole circumference in awellbore with 21.6 cm diameter. From these images itis possible, but di�cult, to reconstruct the trace of anatural fracture intersected by the borehole, and thusdetermine its strike and dip. Due to the deep break-outs in long sections of the well, the FMS pad travel-ling in the breakout very often had poor contact withthe borehole wall and thus the image from the padbecame blurred. This caused problems in determiningwhether or not a feature, e.g. a fracture, seen on onepad image was continuous around the borehole or not.Drilling induced fractures along the borehole axisshould appear 908 away from the breakouts and atthat azimuth the pad usually had good contact withthe wall but without exclusive evidence from the sec-ond pad it was di�cult to be sure that the fracturetrace did not cut through the borehole. Some shortintervals were logged twice with the FMS tool thusincreasing the coverage of the borehole wall enablingus to more easily identify the drilling induced verticalfractures. Because of the low circumferential coverageof the borehole wall with the 2-pad FMS tool it wasdi�cult (and often impossible) to meet all the criteriamentioned above for drilling induced tensile fractures.We have, however, been conservative in our identi®-cation scheme and only incorporated features whichcomply with most of the indicators listed above.
The open circles in Fig. 4A are the SH directionsinferred from drilling induced tensile fractures. Wehave not included any estimates of the uncertainty inthese data points since the main uncertainty arises inthe identi®cation of the fracture. Errors in ®nding thefracture's orientation in the borehole amounts to lessthan 58. Most of the SH directions agree with thebreakout directions obtained from the caliper data butthere are a number of anomalous points where the SH
directions are almost 908 away from the caliper datadirections. It is not known if these represent actual
anomalies of the stress ®eld or whether they simplyrepresent misidenti®cation of tensile fractures. It isinteresting to note that in some cases these anomalouspoints occur where there are no breakouts. Zones withno breakouts were used as an indication of fracturezones in the Gravberg-1 well [24] and in the uppersuite 3 the FMS tool was run mainly to investigatethese zones of intense natural fracturing. Both thestrength of the rock around the borehole and the stress®eld itself might be quite di�erent to the strength andstress ®eld around the well in sections of intact rock,thus producing the anomalous tensile fractures. On theother hand, in both the KTB borehole [8] and theCajon Pass borehole [10] where numerous active faultsintersect the wellbore and produce localized pertur-bations of the stress ®eld [36, 42] rotations of the stress®eld are much smaller (typically 208±308) and 908 ro-tations are not observed. Thus, one suspects that anumber of the anomalous points indicated as tensilefractures in Fig. 4A may simply be the result of misi-denti®cation of marks on the wellbore wall, perhapsincipient breakouts that never developed, as tensilefractures.
2.2. The Stenberg-1 well
The breakout information in the Stenberg-1 wellcomes only from caliper data from a BGT. Data areavailable from 780 to 6600 m, see Fig. 2C. The caliperdata were processed by us as described brie¯y aboveand in detail in Appendix A. The resulting SH direc-tions are presented in Fig. 4B where the crosses againrepresents directions averaged over 10 m intervals andthe horizontal bars on the data points show the stan-dard deviation in each interval. In the Stenberg-1 wellthe standard deviations increase signi®cantly as we godeeper into the well. The lack of data between 1 and2.3 km and between 4.5 and 5.2 km is due to enlarge-ments of the borehole in all directions. These wereidenti®ed by both pair of caliper arms indicating enlar-gement of the borehole with respect to bit size and ro-tation of the BGT tool which occurs because there isno preferred direction for the arms to follow. It isinteresting to compare the large sections of no data inStenberg-1 to the situation in the Gravberg-1 well. It islikely that the rejected sections are due to wellbore fail-ure all around the perimeter of the borehole. This indi-cates either that the di�erential stress magnitude isgreater in Stenberg-1 than in Gravberg-1, which is lesslikely, or that the rock in Stenberg-1 is weaker.Papasikas and Juhlin [31], using other well logs fromStenberg-1, argue that the Stenberg-1 well is signi®-cantly more fractured than the Gravberg-1 well. Thisagrees with the increased failure we observed in theStenberg-1 well.
B. Lund, M.D. Zoback / International Journal of Rock Mechanics and Mining Sciences 36 (1999) 169±190176
2.3. Crustal stress orientation
Because the traces of all drilling-induced tensile frac-tures found on the FMS images from the Gravberg-1well are approximately parallel to the borehole axisand because the well is nearly vertical to 4.5 km depth,this implies that the overburden stress is also a princi-pal stress at least to this depth, see e.g. Brudy andZoback [6], Peska and Zoback [7]. To consider theorientation of crustal stress from the wellbore failuredata summarized in Fig. 4A and B for the Gravberg-1and Stenberg-1 wells, it is necessary to consider theorientation of the wellbores with respect to vertical. Ininclined wellbores (or if principal stresses are inclinedwith respect to vertical and horizontal planes), it haslong been known that the position around the wellboreat which a breakout forms depends not only on thedirection of in situ stress, but also on the deviationand deviation direction of the borehole [7, 37] withrespect to the stress ®eld as well as the magnitude of insitu stresses. As deviations from vertical of less than15±208 do not have a signi®cant e�ect on the breakoutorientation in most wells, we have decided to only usethe apparent SH directions from those sections of thetwo wells where the deviation is 158 or less when cal-culating the average SH direction for each well.Utilizing the 158 limit enables us to include the dataabove 4850 m in the Gravberg-1 well and above 5950m in the Stenberg-1 well.
In the Gravberg-1 well the borehole breakout datasupplies the bulk of the information for the determi-nation of the direction of the horizontal stresses, bothdue to the fact that the combination of the BGT andFMS caliper data covers almost the entire well andbecause the induced tensile fractures are rather scarce.There are few SH direction estimates above 1 km, asseen in Fig. 4A, and they are scattered with high stan-dard deviations. From approximately 1.5 km depth theSH estimates are more consistent. The mean orien-tation of SH averaged over the depth interval 0±4850m, is N728W278, using circular statistics [41] for thestandard deviation. Although rather stable, the orien-tation of SH is not constant over depth, as seen inFig. 4A. The shallow estimates indicate a more north-erly stress direction, albeit with large errors. Deeperdown there is a pronounced northerly rotation of theSH direction just above 4 km and then the orientationturns back westerly again below a troublesome zonewith bad borehole conditions at 4 km. At approxi-mately 5 km, the direction of SH changes very rapidlyby 15 to 208. Juhlin [24], using well log and seismicdata, suggests that there might be a fault intersectingthe borehole just below 5 km, the fault having a dipgreater than 608. The FMS data show that most highangle fractures at 5 km depth strike WNW, and theseismic data for the proposed fault does not contradict
that direction. This stress perturbation is thus verylikely explained by slip on an active fault. There isanother rapid change, now towards the west, in thestress orientation at approximately 5.5 km. As dis-cussed earlier, the breakout direction change with thedeviation of the borehole and we would thus expectchanges in the apparent SH directions in Fig. 4A withincreasing deviation. Comparing Fig. 2, with the devi-ation data, and Fig. 4A there is, however, very littleconsistent change in the SH direction data to be seen.There is an overall shift in SH to the east of approxi-mately 158 between 5 and 6 km which coincides withan increase in deviation by 258. The direction of SH
then turns to the west again below 6 km. To test thesigni®cance of borehole azimuth and deviation on thebreakout directions we simulated a stress ®eld usingthe average direction of SH that we obtained from theGravberg-1 well above and for the magnitudes of Sh
and SH we used results from the later part of thispaper, a strike-slip regime with SH/SV=1.1 and Sh/SV=0.7. The results show a remarkably stable break-out direction of approximately N728W down to 5.8km, with only a slight shift of a few degrees to the eastbetween 5 and 5.8 km. Between 5.8 and 6.2 km thereis a more pronounced shift to the east of about 5degrees and then an even more obvious shift back tothe west between 6.2 km and the end of our data ofabout 10 degrees. The amount of change in SH direc-tion depends on the stress ratios assumed and shouldnot be taken to literally, however, the direction of theshifts remain valid. The simulation thus show thatthere is a component of borehole deviation dependenceon the SH directions in the lower section of Fig. 4A,but that much of the behaviour of the direction of SH
has to be explained in other terms, such as slip onactive faults.
In the Stenberg-1 well, the directions span a depthfrom 780 to 6600 m, see Fig. 4B. As seen in Fig. 4Bthe data is overall more scarce than in the Gravberg-1well and the data errors become increasingly largerwith depth. The mean direction of SH in the Stenberg-1 well, averaged over the interval 780 to 5950 m, wasfound to be N538W298. Due to frequent failure allaround the wellbore, the Stenberg-1 data comes fromthree intervals in the well and the SH directions arerelatively stable within the three intervals. There is aslight shift to the east below 2.8 km but then there areno more data until 3 km where the SH orientationsequal that at 2.8 km. The orientation of SH between 3and 4.5 km is stable and the interval has a slightlymore northerly SH direction than the interval below 5km. Because of the lack of data in between these inter-vals it is di�cult to assess whether this is a slow trendor a rapid change at some depth. The ¯uctuations inthe deviation of the well, which are small above 6 km,are not obvious in the SH orientation data. The rapid
B. Lund, M.D. Zoback / International Journal of Rock Mechanics and Mining Sciences 36 (1999) 169±190 177
increase in hole deviation below 6 km is not very wellre¯ected in the SH orientation data, simulations as inthe Gravberg-1 case above show that changes in theSH direction due to borehole deviation should beslightly to the east and then westward. Just as in theGravberg-1 borehole the variations in the direction ofSH in Stenberg-1 needs to be explained by othermeans, such as slip on active faults.
Our results indicate that the mean stress orientationsat Gravberg-1 and Stenberg-1 are not within one stan-dard deviation of one another despite the fact that thetwo wells are only 10 km apart. The direction of SH inthe Gravberg-1 well is slightly more westerly than SH
in the Stenberg-1 well. The two wells are drilled intodi�erent parts of the impact structure which mightcause the di�erence in stress orientation although con-sidering the age of the impact, 360 Ma, regional stressperturbations should now be relaxed.
The SH directions published by Stephansson etal. [25] to 4 km depth agree well with our results. Theinversion of the Gravberg-1 breakout data by Qianand Pedersen [27] and Qian et al. [28] gave a stableestimate of the direction of SH N71.68W20.38, in per-fect agreement with our result, except for the di�erencein standard deviation. Zajac and Stock's [29] inversion®nds the maximum principal stress, s1, very well con-strained in the direction N73.28W plunging 3.58, alsoin excellent agreement with our result. The fact thatthe di�erent investigations of the direction of SH agreeso well is not surprising considering the stability of thebreakout directions, see Fig. 4A. Earlier investigationsin the Siljan area prior to drilling the two deep wellswere conducted in a pilot hole at StajsaÊ s, see inset mapin Fig. 1, which was hydrofractured at 11 depthsbetween 39 and 492 m to infer the stress state [43].The results indicate an east±westerly direction of SH inthe upper 200 m rotating to the north with depth toapproximately N608W at 450 m depth, albeit withlarge ¯uctuations. Considering the fractured nature ofthe upper 1 km of the crust in Siljan the agreementwith the results from Gravberg-1 and Stenberg-1 is sat-isfactory.
The mean stress direction at Gravberg-1 andStenberg-1 agrees very well with earthquake focalmechanisms [44] for south and central Sweden. Theearthquakes were predominantly of strike-slip type andthe orientations of horizontal principal compressionshowed remarkable consistency in the directionN608W.
The mean stress orientations in these wells are gen-erally consistent with other stress orientation data inCentral Fennoscandia (see Fig. 1). The data in the®gure are taken from the world stress map (WSM)data base [4] and include data such as breakouts,earthquake focal mechanisms, over-coring and hydrau-lic fracturing stress measurements. The two data points
on the map in the Siljan region are the estimates fromGravberg-1 and Stenberg-1 determined here.
3. Pore pressure, vertical stress and minimum horizontalstress
The pore pressure, P0, in the Gravberg-1 well hasbeen estimated by drillstem tests [45]. Two successfultests performed at approximately 1.3 and 2 km showedhydrostatic conditions and a third drillstem test at5.5±6.9 km indicated that the pore pressure was some-what lower than hydrostatic, see the open squares inFig. 5. The data from the deep drillstem test is, how-ever, uncertain. Pore pressure measurements in theshallow pilot holes, down to 500 m, drilled in theSiljan area prior to drilling the deep wells all show ap-proximately hydrostatic conditions [45]. When refer-ring to the pore pressure later we will assumehydrostatic conditions throughout the borehole.
For reference we have also included the drill ¯uidpressure, Pb, in the original hole in the Gravberg-1well, thin full line in Fig. 5. Down to 3.9 km waterwas used as drill ¯uid, deeper down in the well di�er-ent density bentonite muds were used.
The common assumption that one principal stress isapproximately vertical in the upper crust seems to beborne out by the fact that the orientation of drilling-induced tensile fractures are essentially parallel to thenear vertical wellbore (except for localized pertur-bations) to approximately 8 km depth in the KTBwellbore [5]. The similar observations to approximately5 km in the Gravberg-1 well quoted above supportsthis hypothesis. Thus, we assume that at this site wecan consider the stress ®eld to be characterized bythree principal stresses, two of which are horizontal,SH and Sh, and one of which is vertical and can beestimated by integration of rock density. The verticalstress in the Gravberg-1 well, see Fig. 5, was calculatedfrom a density pro®le obtained from a combination ofborehole density logs and modelling of the gravity®eld [46].
The next step in constraining the magnitude of thestress tensor is the determination of the least principalhorizontal stress, Sh. This is often measured with rela-tive ease and reliability by hydraulic fracturing [47].The magnitude of the least principal stress is obtainedfrom both the pressure required to propagate the frac-ture away from the wellbore and the instantaneousshut in pressure [48, 49]. In very deep boreholes wherehigh temperature, high pressure and signi®cant well-bore failures preclude use of conventional open-holehydraulic fracturing with in¯atable packers [50], sec-tions of the wellbore must be hydraulically isolated inother ways.
B. Lund, M.D. Zoback / International Journal of Rock Mechanics and Mining Sciences 36 (1999) 169±190178
The magnitude of the minimum horizontal stress,
Sh, was estimated from a number of di�erent measure-ments shown in Fig. 5. During drilling, 148 m3 of dril-
ling ¯uid was lost at 6047 m and an additional 50 m3
was lost later in a sidetrack at nearly the same depth.
When the ®rst ¯uid loss occurred there was a sudden
increase in penetration rate and the lithology fromthat interval in the borehole showed increased micro-
fracturing and decomposition minerals [26]. It is thus
likely that the ¯uid was lost in a zone of preexisting
Fig. 5. Pore pressure, P0, drill ¯uid pressure, Pb, minimum horizontal stress, Sh, vertical stress, SV, and maximum horizontal stress, SH, in the
Gravberg-1 well. For the pore pressure there are three data points from the well, open squares, we have then assumed hydrostatic pressure. The
drill ¯uid pressure was continuously measured during drilling, we have included only the data from the original hole. The minimum horizontal
stress has been estimated from leak-o� tests, pluses, which did not fracture the formation and hydrofracs, open circles. Two of the hydrofracs
have large error bars, the third, at 6 km is more well de®ned. The vertical stress was calculated from borehole density logs and surface gravity
modelling. The maximum horizontal stress estimates from induced tensile fractures are shown as horizontal lines ranging from the lower bound
of measured di�erential pressure, DP, and a temperature di�erence, DT, of 108C to an upper limit where DP=DT=0. We have only included
SH estimates in the depth interval where Sh is best constrained. The ®gure shows a strike-slip faulting regime.
B. Lund, M.D. Zoback / International Journal of Rock Mechanics and Mining Sciences 36 (1999) 169±190 179
fractures. None of the ¯uid was noted to have returned
to the borehole and when the mud weight was reducedfrom 1.62 to 1.2 g/cm3 drilling could continue without
further loss of circulation [26]. This indicates that the
mud was not lost by large scale injection into an openfracture zone but that the high mud pressure caused
hydraulic fracture propagation into the formation.
When the mud weight was reduced the hydraulic frac-
ture closed and circulation could be reestablished.Since the fracture propagation pressure rapidly
approaches Sh as the fracture length increases beyond
several meters [48, 49], the downhole mud pressure at
which circulation was lost gives us an indication of themagnitude of Sh. From the second ¯uid loss, in side
track 3, we have less data [24] but it seems to have
occurred by the same mechanism as the ®rst. Depthcontrol on the second ¯uid loss was not very accurate,
causing large error bars on the pressure in the well at
the hydrofrac. These data points are indicated by the
open circles in Fig. 5.
After the completion of drilling, the well was stimu-
lated in order to open the preexisting subvertical joints
believed to exist in the rock, down to the target seismicre¯ector at approximately 7.5 km depth, see Fig. 2.
Approximately 250 m3 of heavy, nonuniform density,
¯uids where displaced into the formation during thestimulation. There is operational evidence suggesting
that the ¯uid injection initiated below 6.3 km in the
borehole [24, 51] and it has been suggested [26, 51] that
the ¯uids would have left the borehole close to totaldepth (TD) 6957 m. The mud weight at the stimulation
was estimated by Juhlin and Moore [24]. We estimate
Sh from the mud pressure at the time the reopenedfracture started to grow, due to the uncertainties in the
estimates of mud weight and depth the error bars on
the deepest data point in Fig. 5 are rather large.
Despite the large uncertainties, the three data points
shown in Fig. 5 indicate a value of Sh that is approxi-
mately two-thirds that of the vertical stress.
Additionally, there were 12 formation integrity testsperformed in the well [45], seven below the casing shoe
at 1250 m and an additional ®ve below the casing shoe
at 4167 m. None of these tests fractured the formation
and thus they only provide a lower bound on the mag-nitude of Sh. These lower bound estimates of Sh are
indicated by pluses in Fig. 5. In general, they indicate
minimum values of Sh that are only slightly lower thanthose indicated by the observations of lost circulation
and the hydrofrac experiment. Although only lower
bounds of Sh the formation integrity tests constrain
the slope of our estimated Sh and thus also constrainthe estimation of the state of stress in Siljan below.
Stephansson et al. [26], using the equations of
Rummel [52], estimated the ratio Sh/SV at 5 km depthto 0.68 which is in good agreement with our result.
4. Observations of borehole failure II: magnitude of themaximum horizontal stress
Due to limitations in data availability and quality inthe Gravberg-1 borehole our ISMS will only includedata from drilling-induced tensile failure in the esti-mation of SH. Following the procedure in Brudy andZoback [8] we calculate the principal stresses at theborehole wall necessary to cause tensile failure of theformation, which is assumed to occur when the mini-mum principal stress falls below the tensile strength ofthe rock. These stresses at the borehole wall include,as described in detail in [8], the tangential stresses, con-centrated by drilling, the radial stress from the di�er-ence between wellbore ¯uid pressure and formationpore pressure, the pumping pressure and the thermalstress from the cooling of the wellbore by the drill¯uid, see equations in Appendix B and Appendix C.The equation for the hoop stress at tensile failure is:
where sij are the e�ective stresses; SijÿP0, where Sij
are the absolute stresses and P0 the pore pressure, yb isthe azimuth in the borehole cross-section measuredfrom the bottom side of the borehole, n is Poisson'sratio, sTherm the thermal stress, DP is the di�erencebetween the borehole ¯uid pressure, including thepumping pressure, and the pore pressure in the rockand T is the tensile strength of the intact rock. For avertical borehole where the vertical stress is a principalstress and yb is measured from the direction of SH,Eq. (1) simpli®es to:
syy � 3Sh ÿ SH � sTherm ÿ 2P0 ÿ DPRT �2�
Since almost all of the identi®ed drilling-induced ten-sile fractures in Gravberg-1 occur in zones of naturalfracturing, i.e. zones of higher permeability, we haveincluded the pore pressure, as discussed above, in ourestimates of SH. This is in contrast to the estimatesfrom KTB, where tensile cracks were observed inintact, low porosity and low permeability rock and thepore pressure thus neglected [8]. The well head press-ure, necessary to circulate the drill ¯uid, never reachedhigh levels [53], implying that after dynamic pressurelosses in the drillpipe the resulting pressure increase atdepth due to pumping can be ignored in comparisonwith the pressure from the drill ¯uid column [8]. DPadds uncertainty to our estimates of SH since we donot know if the stress state is such that the tensile frac-tures would have formed even if there had been nodi�erential pressure.
The thermal stress is discussed in detail in AppendixC, we will only note here that the thermal stress
B. Lund, M.D. Zoback / International Journal of Rock Mechanics and Mining Sciences 36 (1999) 169±190180
depends on the temperature di�erence between theundisturbed formation temperature and the tempera-ture in the borehole wall shortly after drilling and cir-culation of colder drill ¯uids. Since the thermalexpansion coe�cient, a, of the rock is temperaturedependent the thermal stress also depends on the ab-solute temperature in the well at the time of failure ofthe formation. The temperature dependence of a issubstantial and is responsible for most of the increaseof sTherm with depth, see Appendix C. As with DPabove, the thermal stress will add uncertainty to theSH estimates since we do not know if the tensile frac-tures would have formed even if there had been nocooling. In the Gravberg-1 well temperatures wererecorded in each section of the well shortly after dril-ling the section and we use these temperatures as ameasure of the amount of cooling experienced by thewellbore. 11 months after completing the boreholetemperatures were once again measured [16] to obtainthe equilibrium, or undisturbed formation, tempera-ture. As discussed further in Appendix C, the maxi-mum temperature di�erence measured in the well wasno more than 78C. The actual cooling during drillingcould however been somewhat larger [8], so to obtaina conservative lower bound we use 108C as our maxi-mum temperature di�erence in the calculation of SH.
No tests of the tensile strength were carried out onthe Siljan granites but for the purpose of estimatingSH from induced tensile fractures we consider the ten-sile strength to be zero. This is motivated by the hy-pothesis that drilling induced tensile fractures initiatemost easily at preexisting ¯aws in the borehole wallwhere no tensile strength has to be overcome [8].Using zero tensile strength also ensures a lower boundestimate of SH.
When calculating the magnitude of SH we have in-terpolated between the lower bound estimates of Sh
established above. Noting, however, that the Sh magni-tude is well constrained only in the lower section ofthe well we chose only to estimate SH below 4 km, seeFig. 5. Fortunately, the drilling-induced tensile frac-tures on the FMS images are also more easily identi®-able in this section. The lower bound nature of the Sh
magnitudes imply that the calculated SH magnitudesshould also be interpreted as lower bounds. However,to explicitly show the uncertainties in SH magnitudesthat DP and the thermal stress imposes we have calcu-lated error bars on the SH estimates, see Fig. 5, usinga DP range from zero to the actual measured DP anda temperature di�erence range from zero to 108C. Thelower bound is then the magnitudes associated withthe measured DP and a 108C temperature di�erenceand the upper bound has zero pressure and tempera-ture di�erences. Uncertainties in other parameters usedin the calculations further contributes to the overallerror in the SH estimates, as do the low coverage of
the borehole wall by the FMS tool which made it verydi�cult to properly assess the induced tensile fractures.
The SH estimates in Fig. 5 indicates a strike-slipfaulting regime in the Siljan region, con®rming obser-vations of more than 100 earthquakes with strike-slipfault plane solutions in south and central Sweden [44].The lower bound nature of our Sh and SH estimatesalso rules out the possibility of a normal faultingregime. The ratio of our lower bound SH estimates tothe vertical stress is approximately 1.1 at 5 km depth,as seen in Fig. 5, decreasing slightly over the depthinterval with data. The Sh/SV ratio is approximately0.68 at 5 km. Qian and Pedersen [27], later correctedin Qian et al. [28], in their linearized inversion schemeusing the breakouts from Gravberg-1 and assumingone principal stress to be vertical, estimated the SH/SV
ratio to 1.220.2 and the Sh/SV ratio to 0.620.5, forthe entire depth of the well. In a nonlinear search forthe uncertainty in the parameters they could, however,only put an upper bound of 1.05 on the SH/SV ratio,the lower bound being unconstrained by the data.Similarly their nonlinear Sh/SV ratio has an upperbound of 0.98 and a lower bound of 0.0. Their optimalresults thus agree surprisingly well with ours, consider-ing their large uncertainties. The best ®tting stress ten-sor of Zajac and Stock [29] shows a reverse faultingregime with the maximum principal stress, s1, in thedirection N73.28W plunging 3.58, s2 also almost hori-zontal, N16.78E plunging 2.58 and s3 almost verticalplunging 85.78 in the direction N108.38W. The relativesize of s2, de®ned by Zajac and Stock [29] asf=(s2ÿs3)/(s1ÿs3), was estimated to f=0.40, forreference our shape factor is f=0.76. However, their95% con®dence level shows that the directions of s2and s3 are almost unconstrained about an arbitraryrotation around s1 and f is unconstrained between 0and approximately 0.7. Although not absolutely de®-nite from the ®gures Zajac and Stock [29] presents itseems that their 95% con®dence limit does not encom-pass the result of our analysis of the Siljan state ofstress. The data we have presented above from theGravberg-1 well indicates that a reverse faulting regimeat depths below 1 km is unlikely.
The Gravberg-1 well deviates from vertical in ap-proximately the same direction as Sh and the deviationis approximately 458 at the most. This, in combinationwith the ®nding that the breakout directions show verylittle consistent change with increasing deviation but alot of changes that have other causes, as discussedthoroughly in the section on the crustal stress orien-tation above, causes problems for the two inversionapproaches referred to above. The inversions are bothbased on only breakout data, where the deepest datapoint is not deeper than 6.05 km. Simulation of theformation of breakouts in the borehole down to 6 kmshow that there are a large number of stress states;
B. Lund, M.D. Zoback / International Journal of Rock Mechanics and Mining Sciences 36 (1999) 169±190 181
reverse, strike-slip and some weakly normal, that could®t these breakout data. Below 6 km the borehole devi-ates approximately 408 and comparison between simu-lated breakout directions down to 6.7 km, as describedearlier in the section on the crustal stress orientation,and observed breakout directions to this depth indicatethat the observed breakout directions are ®t signi®-cantly better by a strike-slip state of stress. The short-comings of the inversion methods emphasize the im-portance of including all available data when assessingthe state of stress, which is done in our ISMS.
The minimum and maximum principal stresses from5 depths have been plotted as Mohr circles in Fig. 6.The dashed semi-circles correspond to the lower boundSH estimates and the solid semi-circles to our upperlimit SH estimates. Envelopes of the Mohr circlesdemonstrate that the state of stress in Gravberg-1 isconsistent with the assumption of frictional equili-brium on preexisting faults oriented optimally in thestress ®eld, with a coe�cient of sliding friction, m,somewhere between 0.5 and 0.6.
5. Conclusions
We have estimated the orientation and magnitude ofin situ stress in the Gravberg-1 and Stenberg-1 deepboreholes in central Sweden using an integrated stressmeasurement strategy (ISMS) incorporating direct
measurements of the least principal stress and detailed
observations of borehole breakouts and drilling-
induced tensile wall fractures. Utilizing wire-line and
image logs for the stress estimations have enabled us
to obtain valuable stress estimates in spite of the severe
conditions encountered in the two deviated, with large
breakouts, deep boreholes.
Both boreholes were drilled into granitic rock and
reached a true vertical depth of more than 6.5 km.
Caliper tools were run in both boreholes and in
Gravberg-1 an electrical image tool, the formation
microscanner (FMS), was also run providing us with
strips of images of the borehole wall. The caliper data
revealed borehole breakouts in large sections of the
two wells and on the Gravberg-1 image logs we ident-
induced tensile fractures in the nondeviated part of the
well indicated that one principal stress is vertical and
using both breakouts and induced tensile fractures we
estimated the orientation of the maximum horizontal
principal stress in the two wells. The average direction
of SH in the Gravberg-1 well is N728W278 and in the
Stenberg-1 well, approximately 10 km south of
Gravberg, N538W298. The SH directions are not
within one standard deviation of each other, in spite
of the proximity of the two boreholes and the stability
of the average SH directions in the individual bore-
holes. This might be a consequence of the impact
Fig. 6. Mohr circles for the stress states shown in Fig. 5. The Mohr circles are drawn for ®ve of the SH, Sh estimates in Fig. 5. The dashed Mohr
circles are for the lower bound SH estimates, the solid are for the upper SH estimates. The straight lines are the Mohr envelopes for coe�cients
of sliding friction ms=0.5 and 0.6. The state of stress in the Gravberg-1 well is seen to agree well with the hypothesis of frictional equilibrium on
optimally oriented faults, in our case with a lower bound coe�cient of friction close to 0.5.
B. Lund, M.D. Zoback / International Journal of Rock Mechanics and Mining Sciences 36 (1999) 169±190182
structure the wells are drilled into, but we have notinvestigated this further.
The magnitude of the vertical stress was calculatedfrom density logs and modelling of the gravity ®eld inthe Siljan area. We estimated the magnitude of theminimum horizontal stress through records of con-trolled and uncontrolled hydraulic fracturing of thewellbore in the Gravberg-1 well. There were also for-mation integrity test performed in the well, none ofwhich fractured the formation, these are used as lowerbounds on Sh in the upper section of the well. Thedata indicate a minimum horizontal stress approxi-mately two-thirds the magnitude of the vertical stress.
Identifying drilling-induced tensile wall fractures onthe images from a 2-pad FMS is di�cult due to thelow coverage of the borehole wall. Once identi®ed thetensile fractures provide stringent constraint on themagnitude of the maximum horizontal stress.Assuming that the tensile fractures initiate on preexist-ing ¯aws in the borehole wall, i.e. no tensile strengthhas to be overcome, we calculate the magnitude of SH
necessary to bring a point in the borehole wall intotensional failure. Cooling of the borehole wall by thedrill ¯uid introduces a thermal stress which enhancesthe likelihood of tensile failure. The thermal stresscause a measure of uncertainty in our SH estimatessince we do not know if the formation would havefailed without cooling. The amount of cooling wasestimated from temperature measurements immediatelyafter drilling and equilibrium temperature measure-ments 11 months after completing the well and was ap-proximately 78C at 5 km depth. The temperature logswere also used to correct the mineral thermal expan-sion coe�cients which vary signi®cantly with tempera-ture, thus a�ecting the thermal stress. The di�erentialpressure, i.e the di�erence between borehole ¯uidpressure and the pore pressure in the surroundingrock, also adds to the uncertainty in SH since the bore-hole wall might have failed at lower pressure di�er-ence. To obtain a lower bound estimate on SH weused 108C cooling and the actual, measured di�erentialpressure. We then calculated a range of SH estimatesfor temperature di�erences of 108C to 08C and di�er-ential pressures from the measured down to zero. Theresults indicate a strike-slip faulting regime in theGravberg-1 area and a lower bound SH/SV ratio of ap-proximately 1.1 at 5 km depth. Plotting the maximumand minimum horizontal stresses in a Mohr diagramcon®rms that the stress state at Gravberg-1 is con-trolled by frictional equilibrium on preexisting faultsoriented optimally in the stress ®eld with a lowerbound coe�cient of friction of approximately 0.5.Considering the uncertainties and lower bound natureof our estimates, the coe�cient of friction could wellbe closer to 0.6, our results are consistent with labora-tory measurements [54].
The integrated stress measurement strategy (ISMS)was developed to utilize all available in situ stress re-lated data, from a variety of methods, to establish ascomplete a stress pro®le as possible. Adding the recentdevelopments in borehole image data analysis to morecommonly used stress measurement methods, i.e.hydraulic fracturing, signi®cantly improves the conti-nuity of the stress pro®le along the borehole. Includingas much information as possible when making the®nal assessment of the stress ®eld is especially import-ant when data from individual methods prove incon-clusive. The ISMS proved very valuable in the CajonPass and KTB deep drilling projects and comparisonto earlier analyses of the stress state in Gravberg-1show that the ISMS, taking all available stress datainto account, gives a more consistent picture of thestate of stress.
Acknowledgements
This work would have been much more di�cult ifnot JoÈ rg Angehrn had let us use the FMS processingfacilities at Chevron PTC. Thanks JoÈ rg! ChristopherJuhlin provided a wealth of information about theSiljan boreholes and helped us ®nding the right logs,GoÈ ran Rissler-AÊ kesson supplied the initial FMS blueline logs and details about the logging and DalaDjupgas AB kindly provided the Stenberg-1 data. Wealso bene®tted from discussions with Martin Brudyand the folks in the Stanford Borehole Group.
Appendix A. Caliper analysis
Processing the caliper data from a borehole geome-try or formation microscanner tool is a straight for-ward matter but care has to be taken not to includewellbore enlargements due to other causes than purebreakout mechanisms. We utilized the followingscheme, based on the work of Plumb andHickman [34], when processing our caliper data fromthe Gravberg-1 and Stenberg-1 boreholes, to yield thedirection of the maximum horizontal stress in 10 mintervals throughout the boreholes:
1. A breakout is an elongation of the borehole diam-eter in the direction of the minimum horizontalstress, Sh, so that the cross-section of the boreholebecomes elliptical, and is due to compressional frac-turing and spalling. The primary indication of abreakout is thus that one caliper pair shows a largerborehole diameter than the other.
2. Washouts are sections of the well bore where thecross-section is enlarged in more than one direction
B. Lund, M.D. Zoback / International Journal of Rock Mechanics and Mining Sciences 36 (1999) 169±190 183
due to fractured parts of the rock being washed outby the drill ¯uid, fragmentation of the boreholewall during drilling, complete failure around theborehole perimeter etc. To ensure that we do notregister washouts or combined washouts and break-outs as pure breakouts we require the small caliperto show approximately the same diameter as thedrill bit, within a certain tolerance.
3. Assuming that the stress tensor is reasonably stablewith depth, breakouts in the borehole should beconstrained to a certain azimuth and follow thatdirection for a considerable vertical length. Thisimplies that if the arms of the tool are following abreakout the tool should not be rotating signi®-cantly. We thus require that the tool does notrotate. Quantifying which amount of rotationshould be allowed over a certain depth range issomewhat subjective but a visual inspection of thedata usually gives good indications. Rapid rotationsare easily detected and discarded whereas slower ro-tations or `wiggles' have to be analyzed more care-fully.
4. If the borehole deviates from vertical the drill stringwill invariably chafe at the high-side of the borehole
wall and cause an elongation of the borehole cross-
section, a so called key seat. These show up in the
caliper data just as true breakouts would. To assure
that these are not included in the breakout data we
discard all breakouts in the direction of the devi-
ation of the borehole. If, for example, the borehole
deviates 108 in the direction N328E all breakouts,
within a certain tolerance, in the direction N328Eare discarded.
We illustrate the procedure outlined above with an
example from the FMS log in suite 6 in the Gravberg-
1 borehole. The FMS calipers sample the borehole
geometry every 15 cm (0.5 ft) whereas the preprocessed
BGT data we used had a sampling rate of 30 cm (1 ft).
This is a section between 4.2 and 4.7 km depth which
was processed using the following parameters. Figs. 7
and 8 are included as examples of progress in the data
reduction.
1. Large caliper at least 2.54 cm (1 inch) larger than
the small caliper.
2. Small caliper within 1.27 cm (0.5 inch) of the 21.6
cm (8.5 inch) bit size, i.e. 21.621.27 cm.
Fig. 7. Stages in the processing of caliper data to ®nd the direction of SH in the Gravberg-1 well. (A) Raw data showing the orientation, 08 is N,
of pad 1 in the borehole. (B) Processed pad 1 directions where the data from the sections where the tool rotates has been discarded. (C)
Breakout directions, dots, and the azimuthal direction of the borehole, open circles, showing large sections of overlap. (D) Breakout directions
remaining after discarding data within2108 of the borehole azimuth. Data rotated into 08 to 1808.
B. Lund, M.D. Zoback / International Journal of Rock Mechanics and Mining Sciences 36 (1999) 169±190184
3. The tool was allowed a 58 rotation over 10 m.Fig. 7A show the azimuth data for pad 1 beforeprocessing and Fig. 7B show the data remainingafter discarding the sections that did not complywith the rotation criteria.
4. Breakout directions within2108 of the borehole azi-muth were discarded. In Fig. 7C the breakout direc-tions and the azimuth of the borehole deviation,open circles, are displayed. After excluding thebreakout directions within2108 of the borehole azi-muth, Fig. 7D show the remaining directions. Notethat in Fig. 7D the data have been rotated into the0 to 1808 interval. It should also be noted that thebreakout directions displayed in Fig. 7D are not the®nal product of the processing, they merely showthe result of the key seat reduction.
Fig. 8A show the raw caliper sizes. After all re-ductions have been applied the remaining calipers aredisplayed in Fig. 8B and the corresponding breakoutdirections in Fig. 8C. We see that although much datahave been discarded there are enough data left to out-line a de®nite breakout direction.
The resulting breakout directions were binned into10 m intervals and we calculated an average breakout
direction and a standard deviation for the intervalusing circular statistics [41]. To further stabilize thebreakout directions and ensure that only the best datawere included, only intervals with 5 or more samplesremaining after the reduction were used in the ®nalpresentation. The direction of SH was calculated bysubtracting 908 from the breakout directions and theresult is presented in Fig. 4.
Some sources of possible errors should be noted.The assumption that the direction of the principalstresses is rather stable with depth is usually valid butcould be violated. If the direction would changerapidly over some interval then the new direction isprobably stable, at least for some depth, and the pro-cedure above will ®nd the new direction. If the changeof direction is due to a speci®c geologic feature, suchas a fault, then correlation with other logs can be usedas an indication that the interval needs special analysis.The key seat reduction in item 4 above could be moretroublesome. If the borehole deviates in approximatelythe same direction as the direction of Sh for a longdepth interval we will introduce a bias in the estimateof the stress directions by discarding the data in thatinterval. In our experience, however, a borehole rarelykeeps exactly the same direction for a long depth inter-
Fig. 8. Caliper data processing from the Gravberg-1 well. (A) Raw caliper sizes. Some parts of the depth interval show very deep breakouts.
Sections with washouts are seen between 4.2 and 4.25 km and between 4.6 and 4.7 km. The straight line at 21.6 cm is the bit-size. (B) Remaining
caliper data after processing. These are the true breakouts. (C) Breakout directions, 08 is N, after processing. Although much data has been dis-
carded there is still a well de®ned breakout direction.
B. Lund, M.D. Zoback / International Journal of Rock Mechanics and Mining Sciences 36 (1999) 169±190 185
val so it is usually possible to extract enough data, seee.g. Fig. 7C and D where the Gravberg-1 borehole de-viates in approximately the same direction as Sh, toobtain a good estimate of SH. This is, however, an im-portant point. When measuring bottom-up with a cali-per tool the cable-torque will induce a slow rotation ofthe tool clockwise [27]. If the breakouts are continuousthe rotation is only noticed as sudden 908 jumps in thecalipers, which the processing handles automatically.Breakouts that are more discontinuous are more likelyto be a�ected by the cable-torque e�ect, some of thise�ect can, however, be removed by averaging over themeasurements in longer intervals, as our 10 m bins.The averaging procedure itself also produce a morestable estimate of the breakout direction.
The errors presented in the text and Fig. 4 are thoseof the circular statistics calculation, we have not triedto include tool errors or bias introduced by key seatreduction or cable-torque.
Appendix B. Stresses at the borehole wall
In our analysis we use the e�ective stresses at thewall of an arbitrarily inclined borehole, drilled into anisotropic, elastic rock with pressure independent elasticmoduli, as described by Hiramatsu and Oka [55] andFairhurst [56]. For our purposes we add the thermalstress, sTherm as described in Appendix C, to the hoopstress syy and the equations can then be written as
srr � DP, �A:4�where yb is the azimuth in the borehole cross-section, nis Poisson's ratio and DP is the di�erence between theborehole ¯uid pressure (including pumping e�ects) andthe pore pressure in the rock. In our coordinate sys-tem, as in [7], the angle yb is measured in the boreholecross-section from the bottom side of the borehole.Using these equations to calculate the principal stressesat the borehole wall we ®nd
srr � DP, �A:7�where st max and st min are the maximum and mini-mum e�ective stresses in the plane tangential to theborehole circumference. Breakouts occur in the wellbore at the azimuth where st max has its maximum andtensile fractures where st min has its minimum. Thetangential stresses are periodic, with period 1808, butnot necessarily sinusoidal and for some orientations ofthe borehole in some stress ®elds there is not a uniquemaximum or minimum [7].
Appendix C. Thermal stress
During the drilling process the circulation of drill¯uid in the borehole will cool the borehole wall in thelower part of the well. The temperature decreaseinduces a thermal tensile stress in the tangential direc-tion at the borehole wall which will act to contract therock at the wall. This thermal stress has to be takeninto account when trying to estimate the magnitude ofSH through wellbore failure [8]. The thermal stress willboth increase the likelihood of induced tensile failureand decrease the likelihood of compressive failure.Fracture initiation only depends on the stress directlyat the borehole wall [8] and the thermal stress can thusbe calculated from the simple expression
sTherm � ÿ aE DT1ÿ n
, �A:8�
where a is the linear coe�cient of thermal expansion,E Young's modulus, n Poisson's ratio and DT the tem-perature di�erence between the undisturbed formationtemperature and the temperature of the rock after cir-culation of the drilling mud.
The linear coe�cient of thermal expansion, a, of arock can be calculated as the average of the linearthermal expansion coe�cients of the mineralconstituents [57]. These expansion coe�cients varywith temperature and pressure, the pressure variation,however, is slow and at 155 MPa, corresponding to 6km depth in the Gravberg-1 well, the thermal expan-sion coe�cient for quartz has decreased by approxi-mately 3% [58±60] from the value at normal pressure.Quartz was used for the calculation since it is the min-eral with the strongest pressure dependence. We willthus neglect the decrease in a due to pressure. Theincrease in the thermal expansion coe�cient due toincreasing temperature has to be taken into accountsince it is substantial [57, 58]. The Gravberg-1 well wasdrilled mainly through granites intersected by doleriteintrusions so the minerals composing the bulk of thematerial are quartz, plagioclase, microcline, biotite,pyroxene, hornblende, pyrite and ilmenite. For the cal-
B. Lund, M.D. Zoback / International Journal of Rock Mechanics and Mining Sciences 36 (1999) 169±190186
culation of the thermal expansion coe�cient for gran-
ite we utilized a weighted average, according to min-
eral content reported in Rissler-AÊ kesson [61], of the
quartz coe�cient, a joint coe�cient for ilmenite, pyrite
and ma®c minerals and a joint coe�cient for plagio-
clase and microcline. All values of the thermal expan-
sion coe�cients cited in Table 1 are volume
coe�cients. These are easily converted to linear coe�-
cients since according to Skinner [57] the linear ther-mal expansion coe�cient is one third of the volumecoe�cient.
The minerals were grouped together according totheir thermal expansion coe�cients, see Table 1. Thecoe�cient for granite was calculated using theequation:
agranite � xqaq � xothersaothers � �1ÿ �xq
� xothers��aPl,Mi, �A:9�
where xq is the quartz content, which was continuouslymeasured on the cuttings from the well, and xothers isthe ilmenite, pyrite and ma®c content, which wasusually around 10%, a value we will consider constantand utilize in the equation. The variation of the min-eral expansion coe�cients with temperature is calcu-lated with the equation
a�T � � a0 � a1T� a2Tÿ2, �A:10�
where a0, a1 and a2 are parameters determined by ®t-ting to experimental data [58] and T is the tempera-
Table 1
Volume thermal expansion coe�cients for common granite and
dolerite minerals
Mineral Temperature (K) a0(10ÿ6) (1/K)
a-quartz 298 24.3
Plagioclase 293 15.4
Microcline 293 15.6
Pyroxene (enstatite) 293 24.1
Hornblende 297 23.8
Ilmenite 297 27.9
Pyrite 293 25.7
The coe�cients vary with temperature [58] and are valid only at
the stated temperature. After Fei, 1995 [58].
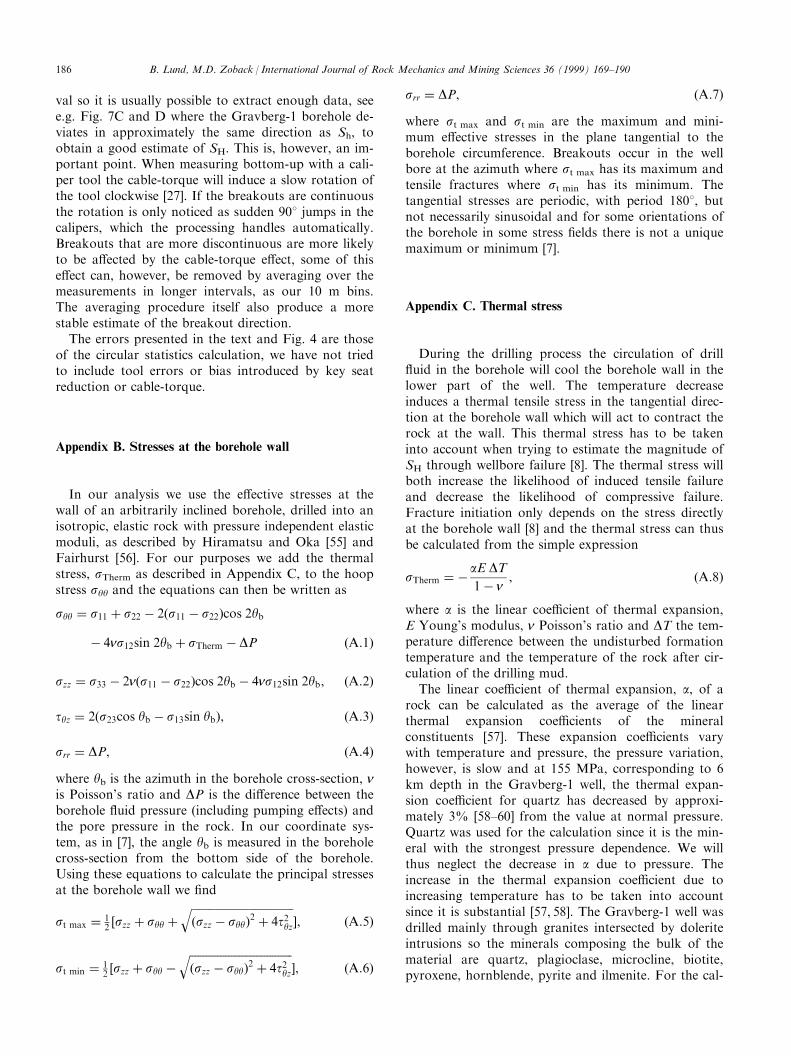
Fig. 9. (A) Variation with depth of the linear thermal expansion coe�cient for Siljan granite. The variation is due to the increase in the thermal
expansion coe�cient with temperature and the variation in the granites quartz content. (B) Temperature data from the Gravberg-1 borehole.
Crosses are the temperatures measured in the logging suites shortly after drilling, the line shows the equilibrium temperature measured 11 months
after drilling had stopped. The average thermal gradient is 16.18C/km [16]. (C) Thermal stress induced in the borehole wall due to cooling of the
wellbore by the drill ¯uid. We have assumed a constant temperature di�erence of 108C, a Young's modulus of 65.1 GPa and a Poisson's ratio of
0.26 [26]. The increase in thermal stress with depth is determined by the increase in the thermal expansion coe�cient.
B. Lund, M.D. Zoback / International Journal of Rock Mechanics and Mining Sciences 36 (1999) 169±190 187
ture. We use the same approach for the dolerite intru-sions, which do not contain any quartz, and grouppyroxene, hornblende and other trace minerals intoone group, plagioclase and microcline into another.The lack of quartz in the dolerite intrusions causesmost of the di�erence between agranite and adol and soalthough the composition of the individual doleriteintrusions change slightly we will use the same compo-sition throughout the borehole.
adol � xothersaothers � xPl,MiaPl,Mi, �A:11�
where xothers=39% is the content of pyroxene, horn-blende and others and xPl,Mi=61% is the plagioclase,microcline content.
We used the temperature measurements from theGravberg-1 well to calculate the variation of the ther-mal expansion coe�cients with depth and shown inFig. 9A is the granite coe�cient. The dolerite coe�-cient was only used in a few short sections of the welland has not been included in the ®gure. This coe�-cient will not agree perfectly with the true coe�cientof thermal expansion in the rock. This is not onlybecause of the approximations in the calculations butalso because the di�erent mineral grains have varyingamount of volumetric contraction which will a�ect themicro-porosity.
The static Young's modulus and Poisson's ratiowere measured in tri-axial loading tests on Siljan gran-ite from two di�erent core holes in the Siljanregion [62]. The tests were performed at 50, 75 and100 MPa con®ning pressures. The dynamic moduli canbe estimated from P-wave sonic logs and VSP datasupplying P- and S-wave velocities [24]. The S-wavevelocity estimate is, however, not continuous along theentire borehole and the spread in both P- and S-wavevelocities is substantial. A slight decrease in Poisson'sratio with depth was estimated [24], from n=0.25 at1.5 km to n=0.23 at 4 km, with no estimates below 4km. This is slightly lower than the average value ofn=0.26 obtained from the loading tests. The limi-tations of the downhole velocities, the observation thatthe rock type is approximately the same in the entirewell, with the exception of the dolerite intrusions, andthe notion that static moduli should be utilized in thefailure equations convinced us to use Young's mod-ulus, E=65.122.7 GPa, and Poisson's ratio, n=0.26from the tri-axial tests.
Temperature measurements were run in theGravberg-1 well in conjunction with other logs afterthe completion of each drilling interval. In loggingsuite 3 a high resolution thermometer (HRT) wasused, in suite 6 the auxiliary monitoring system(AMS), which has a lower resolution mud ther-mometer. 11 months after the completion of the wellthe equilibrium temperature, i.e. the undisturbed for-
mation temperature, was measured [16]. Fig. 9B showsthe temperature after drilling as crosses and the equili-brium temperatures as a straight line. Comparing thetemperatures just after drilling with the equilibriumtemperatures gives us some guidance to the amount ofcooling experienced by the borehole wall.Temperatures in the Gravberg-1 well are moderate, thetemperature gradient is on average 16.18C/km [16],and the equilibrium temperature at 5 km about 858C.The temperature di�erences estimated from the logsand equilibrium temperatures are not very large, at 5km they are approximately 78C. We believe that theactual cooling during drilling was higher, as observedin the KTB borehole [8], and to obtain a conservativelower bound estimate of SH we have used a standardcooling temperature of 108C. The thermal stress in theGravberg-1 well was then calculated and is shown inFig. 9C. We see that the thermal stress varies from ap-proximately 6.5 MPa at 1.5 km and increases to about9.5 MPa at 6 km.
References
[1] Zoback ML, Zoback MD. State of stress in the conterminous
United States. J. Geophys. Res. 1980;85:6113±56.
[2] Zoback ML, Zoback MD. Tectonic stress ®eld of the contermi-
nous United States. Mem. Geol. Soc. Am. 1989;172:523±39.
[3] Zoback MD, Zoback ML, Tectonic stress ®eld of North
America and relative plate motions. In: Slemmons B et al., edi-
tors. The Geology of North America, Decade Map, Vol. 1,
Neotectonics of North America. Boulder, CO: 1991. p. 339±
366.
[4] Zoback ML. First and second order patterns of stress in the
lithosphere: The World Stress Map Project. J. Geophys. Res.
1992;97:11703±28.
[5] Brudy M, Zoback MD, Fuchs K, Rummel F, BaumgaÈ rtner J.
Estimation of the complete stress tensor to 8 km depth in the
KTB scienti®c drill holes: implications for crustal strength. J.
Geophys. Res. 1997;102:18453±75.
[6] Brudy M, Zoback MD. Compressive and tensile failure of bore-
holes arbitrarily-inclined to principal stress axes: application to
the KTB boreholes, Germany. Int. J. Rock. Mech. Min. Sci.
Geomech. Abstr. 1993;30:1035±8.
[7] Peska P, Zoback MD. Compressive and tensile failure of
inclined well bores and determination of in situ stress and rock
strength. J. Geophys. Res. 1995;100:12791±811.
[8] Brudy M, Zoback MD. Drilling-induced tensile wall fractures:
implications for determination of in situ stress orientation and