1 Origin Enterprises plc INTERIM RESULTS STATEMENT Solid start to trading in seasonally quiet first half 8 March 2018 Origin Enterprises plc (‘Origin’ or ‘the Group’), the Agri-Services group, today announces its interim results for the half year ended 31 January 2018. Highlights Good first half performance in seasonally quiet trading period with operating profit 12.6 per cent higher at €2.3 million Improved working capital performance with a working capital cash inflow of €10.7 million for the twelve months to 31 January 2018 Favourable autumn and winter cropping base established for seasonally important second half Bunn Fertiliser, acquired in August 2017, fully integrated in period Acquisition of Belgium based fertiliser and nutrition business, Pillaert-Mekoson Digital agronomy enablement through launch of new data driven information service and crop monitoring tools Appointment of Rafal Prendke as CEO of the Group’s Continental European Division Interim dividend of 3.15 cent per share (2017: 3.15 cent per share) Results Summary 6 months ended 31 Jan 2018 €’000 6 months ended 31 Jan 2017 €’000 Change €’000 Group revenue 586,909 564,436 22,473 Operating profit 1 2,263 2,010 253 Associates and joint venture 2 1,707 1,742 (35) Total group operating profit 1 3,970 3,752 218 Finance cost, net (4,001) (3,816) (185) Loss before tax 1 (31) (64) 33 Basic loss per share (cent) (1.61) (8.09) 6.48 Adjusted diluted earnings per share (cent) 3 0.27 0.25 0.02 Group net debt 171,378 161,584 (9,794) Interim dividend per ordinary share (cent) 3.15 3.15 - 1 Before amortisation of non-ERP intangible assets and exceptional items 2 Profit after interest and tax 3 Before amortisation of non-ERP intangible assets, net of related deferred tax (2018: €2.4 million, 2017: €2.0 million) and exceptional items, net of tax (2018: €Nil, 2017: €8.5 million)
Transcript
1
Origin Enterprises plc
INTERIM RESULTS STATEMENT
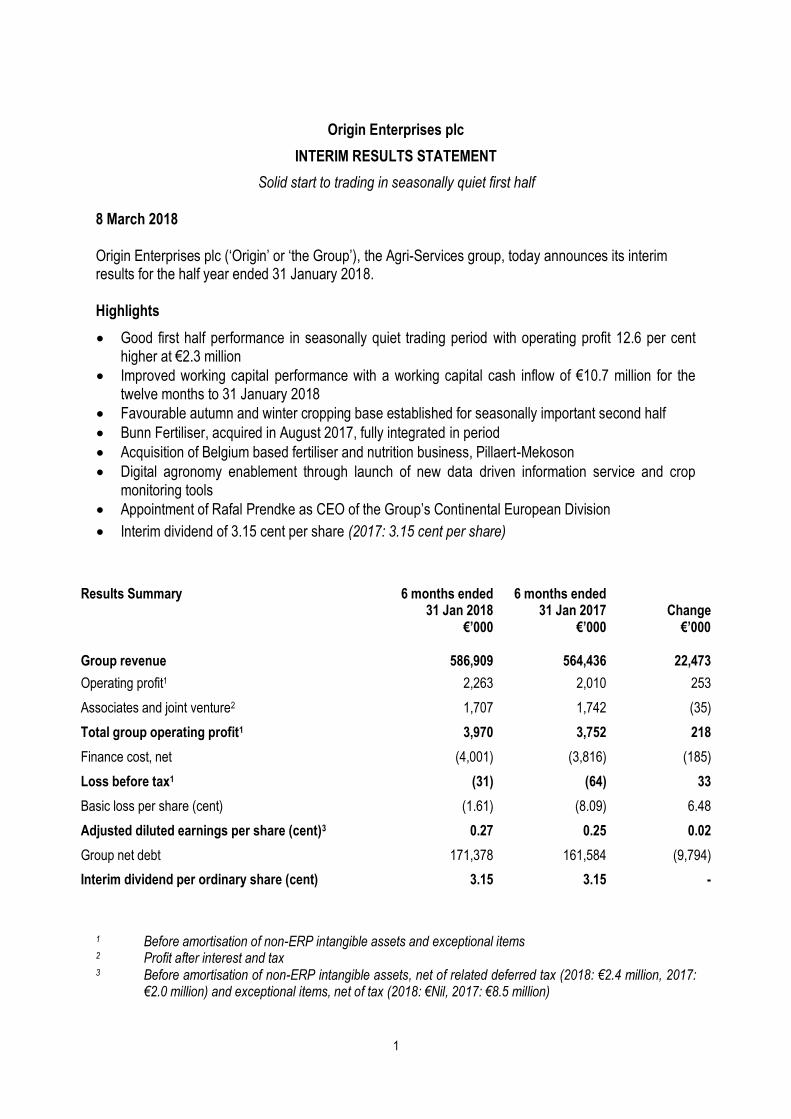
Solid start to trading in seasonally quiet first half 8 March 2018 Origin Enterprises plc (‘Origin’ or ‘the Group’), the Agri-Services group, today announces its interim results for the half year ended 31 January 2018. Highlights
Good first half performance in seasonally quiet trading period with operating profit 12.6 per cent higher at €2.3 million
Improved working capital performance with a working capital cash inflow of €10.7 million for the twelve months to 31 January 2018
Favourable autumn and winter cropping base established for seasonally important second half
Bunn Fertiliser, acquired in August 2017, fully integrated in period
Acquisition of Belgium based fertiliser and nutrition business, Pillaert-Mekoson
Digital agronomy enablement through launch of new data driven information service and crop monitoring tools
Appointment of Rafal Prendke as CEO of the Group’s Continental European Division
Interim dividend of 3.15 cent per share (2017: 3.15 cent per share)
Results Summary 6 months ended 31 Jan 2018
€’000
6 months ended 31 Jan 2017
€’000
Change €’000
Group revenue
586,909
564,436
22,473
Operating profit1 2,263 2,010 253
Associates and joint venture2 1,707 1,742 (35)
Total group operating profit1 3,970 3,752 218
Finance cost, net (4,001) (3,816) (185)
Loss before tax1 (31) (64) 33
Basic loss per share (cent) (1.61) (8.09) 6.48
Adjusted diluted earnings per share (cent)3 0.27 0.25 0.02
Group net debt 171,378 161,584 (9,794)
Interim dividend per ordinary share (cent) 3.15 3.15 -
1 Before amortisation of non-ERP intangible assets and exceptional items 2 Profit after interest and tax 3 Before amortisation of non-ERP intangible assets, net of related deferred tax (2018: €2.4 million, 2017:
€2.0 million) and exceptional items, net of tax (2018: €Nil, 2017: €8.5 million)
2
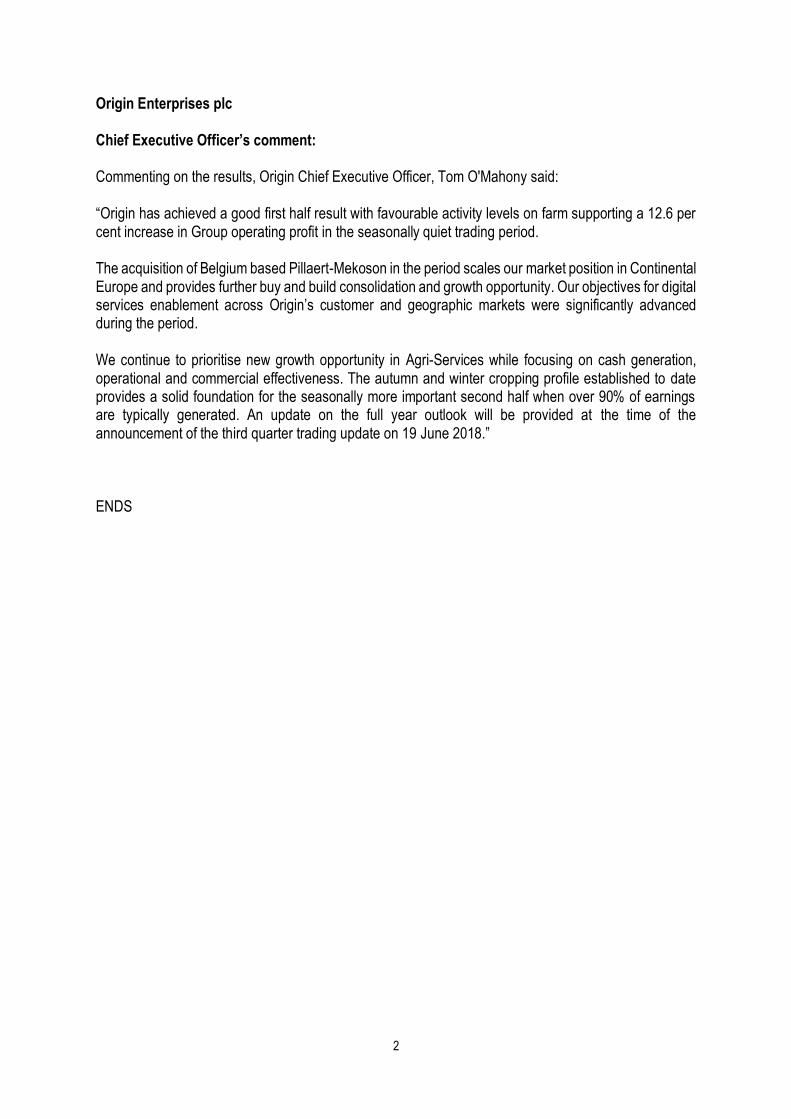
Origin Enterprises plc Chief Executive Officer’s comment: Commenting on the results, Origin Chief Executive Officer, Tom O'Mahony said: “Origin has achieved a good first half result with favourable activity levels on farm supporting a 12.6 per cent increase in Group operating profit in the seasonally quiet trading period. The acquisition of Belgium based Pillaert-Mekoson in the period scales our market position in Continental Europe and provides further buy and build consolidation and growth opportunity. Our objectives for digital services enablement across Origin’s customer and geographic markets were significantly advanced during the period. We continue to prioritise new growth opportunity in Agri-Services while focusing on cash generation, operational and commercial effectiveness. The autumn and winter cropping profile established to date provides a solid foundation for the seasonally more important second half when over 90% of earnings are typically generated. An update on the full year outlook will be provided at the time of the announcement of the third quarter trading update on 19 June 2018.” ENDS
3
Conference Call The results announcement is available on the Company website www.originenterprises.com. There will be a live conference call at 8.30am (GMT) today. To participate in this conference call, please dial the number below. Participants are requested to dial in 5 to 10 minutes prior to the scheduled start time.
About Origin Enterprises plc Origin Enterprises plc is a focused Agri-Services group providing specialist On-Farm Agronomy Services, Digital Agricultural Services and the supply of crop technologies and inputs. The Group has leading market positions in Ireland, the United Kingdom, Belgium, Poland, Romania and Ukraine. Origin is listed on the ESM and AIM markets of the Irish and London Stock Exchanges. ESM ticker symbol: OIZ AIM ticker symbol: OGN Website: www.originenterprises.com
€’000 Group revenue 586,909 564,436 Operating profit1 2,263 2,010 Associates and joint venture, net2 1,707 1,742 Group operating profit3 3,970 3,752 Finance cost, net (4,001) (3,816) Pre-tax loss (31) (64) Income tax credit 366 373 Adjusted net profit 335 309 Adjusted diluted earnings per share (cent)3 0.27 0.25 Adjusted net profit reconciliation Reported net loss (2,024) (10,157) Amortisation of non-ERP intangible assets 2,726 2,307 Tax on amortisation of non-ERP related intangible assets (367) (304) Exceptional items, net of tax - 8,463 Adjusted net profit 335 309 Adjusted diluted earnings per share (cent)3 0.27 0.25
Origin delivered adjusted diluted earnings per share3 for the period of 0.27 cent compared to adjusted diluted earnings per share of 0.25 cent in the corresponding period last year. On a like for like basis (excluding the impact of currency movements and acquisitions) the underlying increase was 0.06 cent. The Group’s earnings profile is significantly weighted towards the second half of the financial year , when over 90 per cent of earnings are typically generated. Group revenue Group revenue was €586.9 million compared to €564.4 million in the corresponding period last year, an increase of 4.0 per cent. On an underlying basis at constant currency, revenues increased by €20.3 million (3.6 per cent), reflecting increased agronomy service revenue and crop input volumes in addition to increased fertiliser prices. Underlying growth in agronomy services and crop input volumes, excluding crop marketing, was 1.2 per cent in the period compared to the corresponding period last year.
6
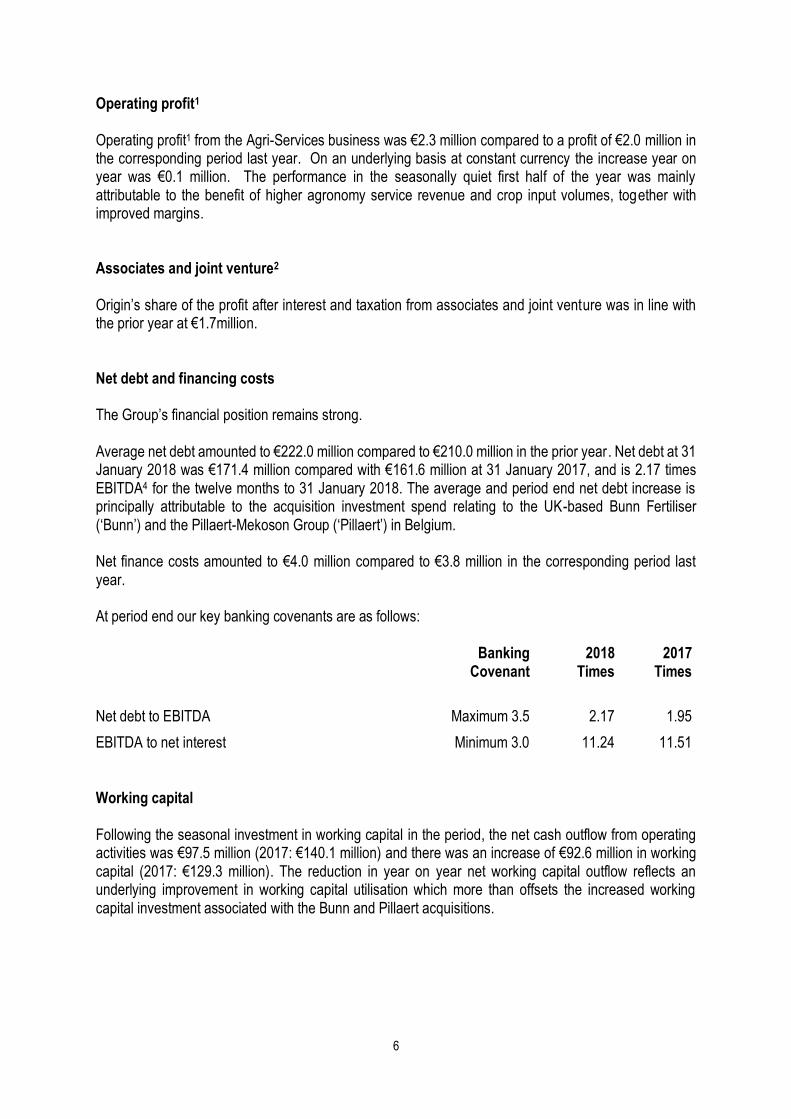
Operating profit1 Operating profit1 from the Agri-Services business was €2.3 million compared to a profit of €2.0 million in the corresponding period last year. On an underlying basis at constant currency the increase year on year was €0.1 million. The performance in the seasonally quiet first half of the year was mainly attributable to the benefit of higher agronomy service revenue and crop input volumes, together with improved margins. Associates and joint venture2 Origin’s share of the profit after interest and taxation from associates and joint venture was in line with the prior year at €1.7million. Net debt and financing costs The Group’s financial position remains strong. Average net debt amounted to €222.0 million compared to €210.0 million in the prior year . Net debt at 31 January 2018 was €171.4 million compared with €161.6 million at 31 January 2017, and is 2.17 times EBITDA4 for the twelve months to 31 January 2018. The average and period end net debt increase is principally attributable to the acquisition investment spend relating to the UK-based Bunn Fertiliser (‘Bunn’) and the Pillaert-Mekoson Group (‘Pillaert’) in Belgium. Net finance costs amounted to €4.0 million compared to €3.8 million in the corresponding period last year. At period end our key banking covenants are as follows: Banking
Covenant 2018
Times 2017
Times
Net debt to EBITDA Maximum 3.5 2.17 1.95
EBITDA to net interest Minimum 3.0 11.24 11.51
Working capital Following the seasonal investment in working capital in the period, the net cash outflow from operating activities was €97.5 million (2017: €140.1 million) and there was an increase of €92.6 million in working capital (2017: €129.3 million). The reduction in year on year net working capital outflow reflects an underlying improvement in working capital utilisation which more than offsets the increased working capital investment associated with the Bunn and Pillaert acquisitions.
7
Dividend An interim dividend of 3.15 cent per share will be paid on 20 April 2018 to shareholders on the register on 6 April 2018. 1 Operating profit and Group operating profit are stated before amortisation of non-ERP intangible assets
and exceptional items 2 Profit after interest and tax 3 Before amortisation of non-ERP intangible assets, net of related deferred tax (2018: €2.4 million, 2017:
€2.0 million) and exceptional items, net of tax (2018: €Nil, 2017: €8.5 million) 4 Net debt/EBITDA ratio as per the requirements of the Group’s syndicated bank loan agreement
8
Review of Operations Commentary is on a constant currency basis throughout Ireland and the United Kingdom
Change on prior year 2018
€m 2017 €m
Change %
Underlying3 %
Revenue 377.5 354.9 6.4% 5.0% Operating profit1 1.2 0.9 35.4% 24.5% Associates and joint venture2 1.7 1.7 - - 1 Before amortisation of non-ERP intangible assets and exceptional items 2 Profit after interest and tax 3 Excluding currency movements and the impact of acquisitions
Underlying agronomy service and crop input volume growth was 0.4 per cent in the period compared to the corresponding period last year which benefited from the earlier timing of fertiliser demand. On an underlying basis at constant currency there was a 24.5% per cent increase in operating profit, driven principally by higher margins reflecting an improved sales mix. Integrated On-Farm Agronomy Services The Group’s Integrated Agronomy and On-Farm Services business, Agrii, achieved a satisfactory performance in the first half with all service and input portfolios maintaining solid momentum in competitive trading conditions. Whilst a later harvest combined, with wet and cold conditions during September, resulted in a delayed start to field operations, overall autumn and winter planting activity was not adversely impacted. Good sowing and growing conditions in October and November enabled significant catch up in drilling activity and crops are generally well established ahead of the spring growing season. Total autumn and winter plantings for the principal combinable crops are estimated to be marginally above last year at 2.8 million hectares. Total autumn, winter and spring plantings for the 2018 growing season are forecasted to be in line with last year at 4.5 million hectares. The business continues to embed new organisational design changes successfully throughout its operations as part its overall performance improvement agenda. Digital Agricultural Services Digital Agricultural Services performed satisfactorily in the period, recording both profit and margin momentum underpinned by increased software service revenue.
9
Significant progress was achieved in the period to broaden and enhance Origin’s overall customer value and service offering. This organisational and product development activity has culminated in the launch of a new digital platform to coincide with the main second half trading period, called Contour. Contour is a new digital information service which incorporates an integrated suite of whole farm and field level crop monitoring tools. Contour brings farmers and agronomists closer together by providing highly functional and shared applications which deliver real time content to support in-field decision making. Contour also provides greater empowerment to our agronomists by creating more opportunity for technical conversations with less time required for physical field observation activity. The development of Origin’s digital products and services proposition, alongside the Group’s established sector positions in crop technology and serviced farmer relationships, will enable the rapid delivery of more targeted and localised crop advice and agronomy recommendations at field level. This will provide opportunity to increase the number of our serviced hectares of existing and new customers. Business-to-Business Agri-Inputs Business-to-Business Agri-Inputs recorded a satisfactory result in the period, with an improved performance from Feed and Amenity set against a lower underlying contribution from Fertiliser. Fertiliser Excluding the impact of the Bunn acquisition, the Group recorded lower sales volumes in the first six months of the financial year. Fertiliser demand in 2018 is reflecting a more normal sales offtake pattern, with primary producers planning a higher proportion of their procurement requirements in the second half of the financial year. Sales margins continue to be positively supported by growth in sales of differentiated fertiliser and bespoke nutrition applications. Bunn has performed in line with expectations in the first six months, with the business fully integrated in the period. Procurement, sales and customer management functions are centralised, with the blending and distribution facilities fully operational under Origin protocols. Amenity Origin Amenity achieved a good result in the period as new go-to-market strategies drove strong early season service and volume growth into the speciality and professional sectors. The acquisitions completed in 2016 and 2017 maintained solid momentum in the period as they continue to provide new service and customer extension. Feed Ingredients Feed Ingredients continues to perform well, with the result in the period principally supported by higher volumes. Sustained demand levels are reflecting the impact of fodder shortages and the extended period of housing of animals due to poor ground and grazing conditions. Forward buying momentum was positive in the first six months with customers taking advantage of generally favourable pricing opportunity.
10
Continental Europe1
Change on prior year 2018
€m 2017 €m
Change %
Underlying3 %
Revenue 121.6 108.5 12.1% 14.7% Operating profit2 0.9 0.7 28.5% 24.9% 1 Excluding crop marketing. While crop marketing has a significant impact on revenue, its impact on operating profit is
insignificant. An analysis of revenues, profits and margins attributable to agronomy services and inputs more accurately reflects the underlying drivers of business performance.
2 Before amortisation of non-ERP intangible assets and exceptional items 3 Excluding currency movements and the impact of acquisitions
Underlying business volume growth was 3.9 per cent in the period compared to the corresponding period last year. Overall there was a satisfactory performance in the seasonally quiet trading per iod, with good early season momentum in the case of value added crop technologies. On an underlying basis at constant currency, there was an increase in operating profit of 24.9 per cent. Poland Poland performed well in the period, with the business achieving higher revenues and margins across the main agronomy portfolios. The result was delivered against the backdrop of a challenging operating environment for primary producers and reflects the benefit of realised efficiency gains and solid growth in differentiated agronomy packages targeted to meet farmers’ individual requirements. Above average rainfall in many growing regions of northern Poland delayed the completion of the harvest and curtailed new crop planting activity in the period. As a result, autumn and winter plantings are estimated to be approximately 2.9 per cent lower than the prior year at 4.6 million hectares. This shortfall is expected to be recovered through an increase in spring plantings leaving the total cropping area for the growing year broadly equivalent to last year at 8.1 million hectares. Romania Romania delivered a satisfactory result in the period with performance underpinned by increased volumes supported by new customer gains delivered against the backdrop of competitive trading conditions. Specialised nutrition portfolios grew solidly in the period reflecting the business meeting the increased demand from primary producers as this market develops. The development of enhanced technical sales support remains an area of focus for the business together with the advancement of our knowledge transfer infrastructure through our dedicated research and development function, Agricultura Plus. This function leverages knowledge from across our geographies, to localise solutions for the Romanian market. In addition, our digital offering has gained solid momentum with encouraging initial uptake across the market. The total sown area for the principal autumn and winter crops is estimated to be in line with the prior year at 3.2 million hectares. The cropping area is well established and in generally good condition,
11
notwithstanding some localised challenges encountered by unseasonally dry weather at the planting stage. Combined winter and spring plantings for the growing season as a whole are currently estimated to be in line with last year at 8.4 million hectares. Ukraine Ukraine achieved a solid performance in the seasonally quiet first half of the year against the backdrop of currency volatility and sustained input price inflation. The result in the period was primarily driven by an improved sales mix of value added technologies. The business continues to benefit from new customer gains with an increased level of sales commitments achieved ahead of the main seasonal activity in the second half. Trading conditions are highly competitive with primary producers firmly focused on crop investment return and flexible financing solutions. Autumn and winter crop plantings are estimated to be in line with the prior year at 7.8 million hectares with crops generally well established and in good condition. Total autumn, winter and spring plantings are currently forecast at 22.7 million hectares against 22.4 million hectares for the prior year. Corporate development In August 2017 the Group completed the acquisition of Bunn in the United Kingdom. Bunn is a leading provider of prescription fertiliser blends and nutrition management systems servicing arable, grassland and horticultural farm enterprises. In January 2018 Origin announced the completion of the acquisition of the Belgian based Pillaert. Headquartered in Ghent, Pillaert is a leading provider of standard and prescription fertilisers in Belgium and surrounding regions. Pillaert, which enjoys a brand heritage of over 50 years, markets an extensive range of technically based nutrition applications and operates a strong business-to-business and retail customer franchise. The total cost of both businesses on an enterprise valuation basis inclusive of average working capital was €26 million approximately. Maintainable EBIT for the combined businesses is €3.2 million. Board and management changes In February 2018 the Group announced that Imelda Hurley, Chief Financial Officer, indicated her decision to step down from the Board on 28 February 2018 and leave the Group effective 30 April 2018. Origin has initiated a search for a new CFO and an appointment will be made in due course. Peter Dunne, who joined the Group in 2016, was appointed Group Finance Director in February 2018. Rafal Prendke has been appointed Chief Executive Officer of the Continental European Division of Origin (‘Continental Europe’ or ‘the Division’).
12
Rafal joined Origin in 2015 as CEO of Dalgety Polska. He has been the driving force behind the creation of the leading agronomy services and input distribution business in Poland under the Agrii brand. Continental Europe incorporates the Group’s operations in Belgium, Poland, Romania and Ukraine which have sales revenue of over €0.6 billion and 1,100 employees approximately. The establishment of the Division last year optimally leverages Group and in-country organisational strengths to spearhead future business development, technical innovation and growth. Outlook Sector sentiment currently remains stable against an improved short term planning environment for primary food producers. The Group is well positioned to respond to current market conditions, and the solid start to the seasonally quiet first half of the financial year provides a good foundation for the seasonally more important second half when over 90 per cent of earnings typically arise. A further update will be provided at the timing of the announcement of the third quarter trading update on 19 June 2018. ENDS
13
Origin Enterprises plc
Condensed Interim Consolidated Income Statement for the six months ended 31 January 2018
Six months Six months Year
ended ended ended
January January July
2018 2017 2017
Total Total Total
€'000 €'000 €'000
Notes Note 5 Note 5
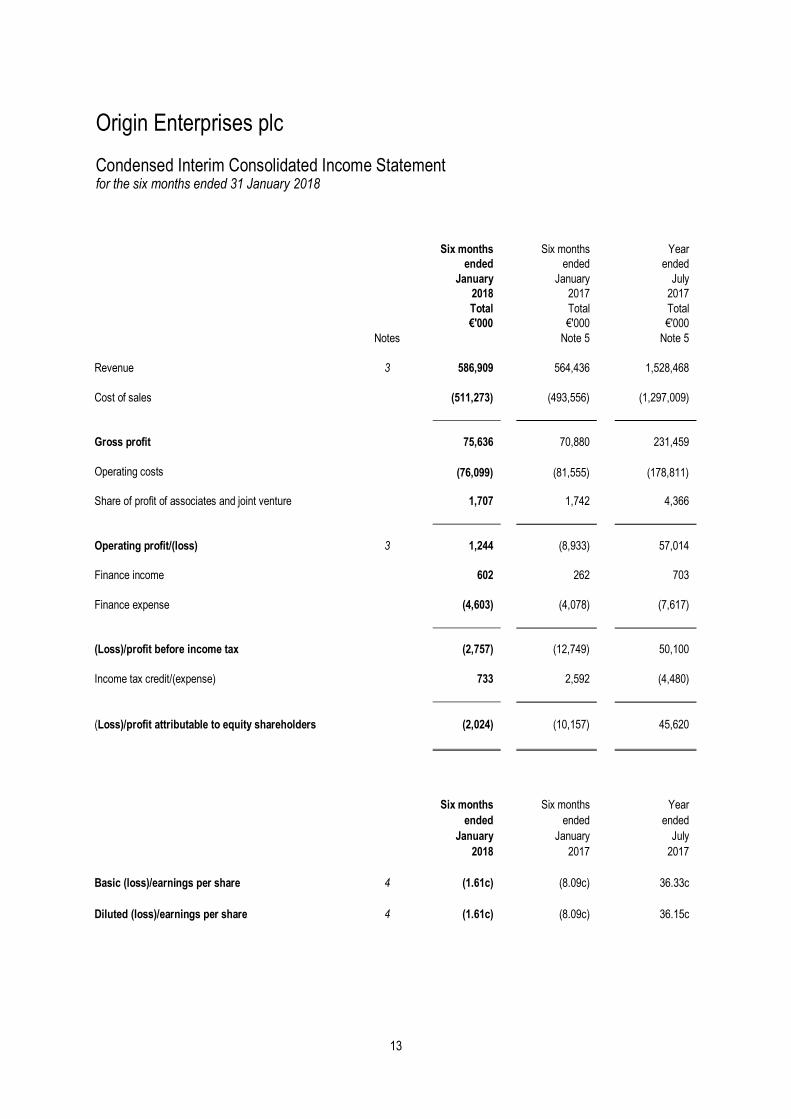
Revenue 3 586,909 564,436 1,528,468
Cost of sales (511,273) (493,556) (1,297,009)
Gross profit 75,636 70,880 231,459
Operating costs (76,099) (81,555) (178,811)
Share of profit of associates and joint venture 1,707 1,742 4,366
Operating profit/(loss) 3 1,244 (8,933) 57,014
Finance income 602 262 703
Finance expense (4,603) (4,078) (7,617)
(Loss)/profit before income tax (2,757) (12,749) 50,100
Income tax credit/(expense) 733 2,592 (4,480)
(Loss)/profit attributable to equity shareholders (2,024) (10,157) 45,620
Six months Six months Year
ended ended ended
January January July
2018 2017 2017
Basic (loss)/earnings per share 4 (1.61c) (8.09c) 36.33c
Diluted (loss)/earnings per share 4 (1.61c) (8.09c) 36.15c
14
Origin Enterprises plc
Condensed Interim Consolidated Statement of Comprehensive Income for the six months ended 31 January 2018
Six months Six months Year
ended ended ended
January January July
2018 2017 2017
€'000 €'000 €'000
(Loss)/profit for the period (2,024) (10,157) 45,620
Other comprehensive (expense)/income
Items that are not reclassified subsequently to the Group income statement:
Group/Associate defined benefit pension obligations
- remeasurements of Group's defined benefit pension schemes 2,205 (777) 3,407
- deferred tax effect of remeasurements (365) 193 (519)
- share of remeasurements on associate’s defined benefit pension schemes
-
(3,058)
(614)
- share of deferred tax effect of remeasurements - associates - 551 135
Items that may be reclassified subsequently to the Group income statement:
Group foreign exchange translation details
- exchange difference on translation of foreign operations (948) (2,489) (10,674)
Group/Associate cash flow hedges - effective portion of changes in fair value of cash flow hedges (3,243) 1,566 (2,025)
- fair value of cash flow hedges transferred to operating costs 760 (1,721) 1,754
Post employment benefit obligations 813 7,575 3,646
Derivative financial instruments - 100 204
Total non-current liabilities 274,993 255,630 212,779
Current liabilities
Interest-bearing borrowings 15,116 18,720 16,227
Trade and other payables 353,028 343,140 548,130
Corporation tax payable 7,657 8,343 11,090
Provision for liabilities 9 4,130 8,071 7,392
Derivative financial instruments 3,745 1,183 680
Total current liabilities 383,676 379,457 583,519
TOTAL LIABILITIES 658,669 635,087 796,298
TOTAL EQUITY AND LIABILITIES 918,210 875,096 1,083,027
17
Origin Enterprises plc
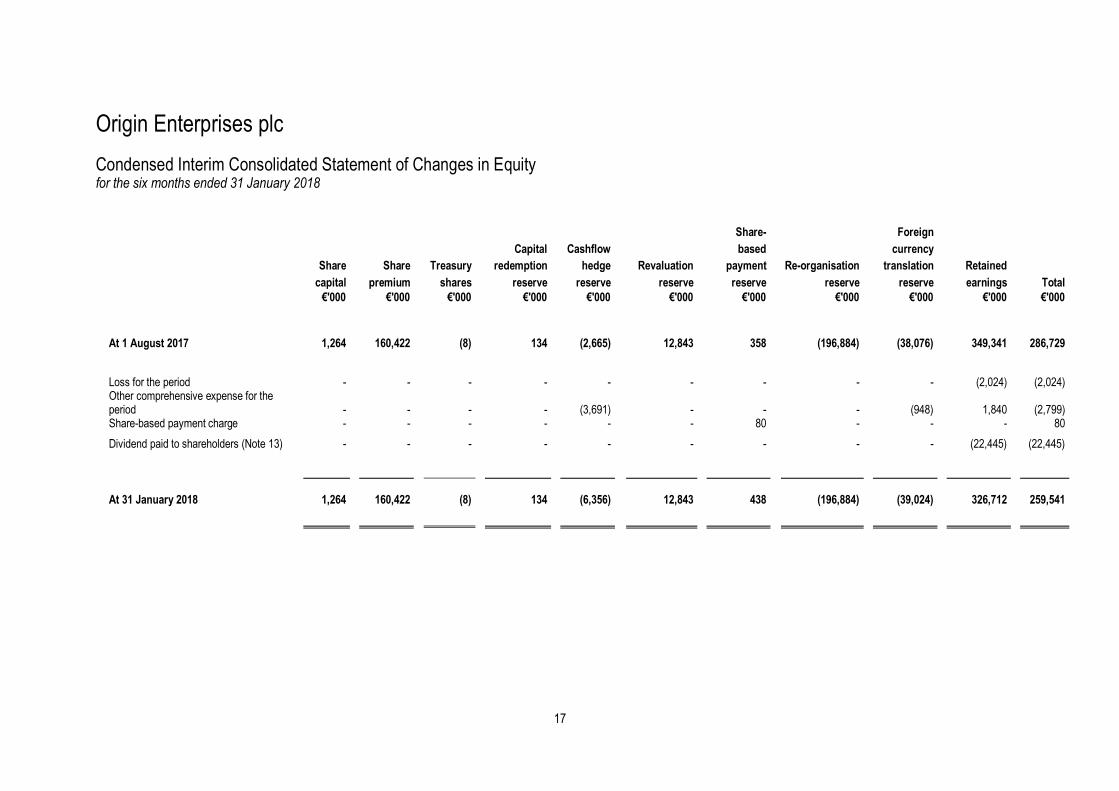
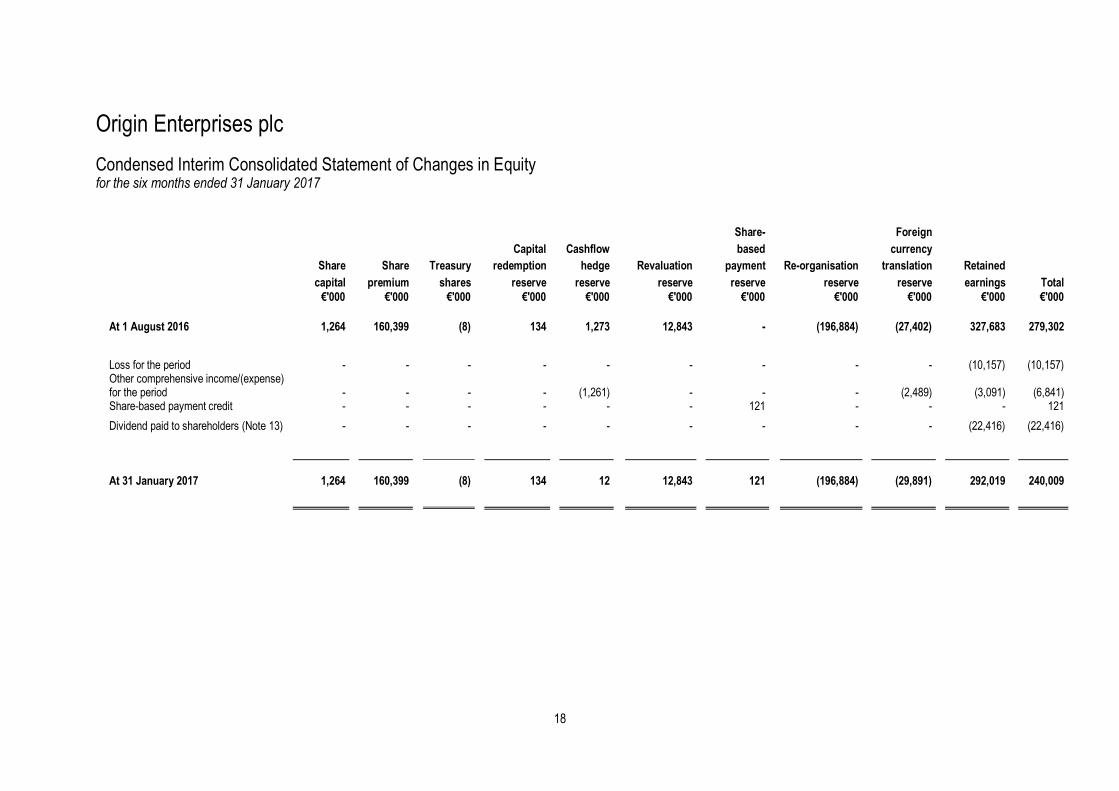
Condensed Interim Consolidated Statement of Changes in Equity for the six months ended 31 January 2018 Share- Foreign Capital Cashflow based currency Share Share Treasury redemption hedge Revaluation payment Re-organisation translation Retained capital premium shares reserve reserve reserve reserve reserve reserve earnings Total
At 31 January 2017 1,264 160,399 (8) 134 12 12,843 121 (196,884) (29,891) 292,019 240,009
19
Origin Enterprises plc
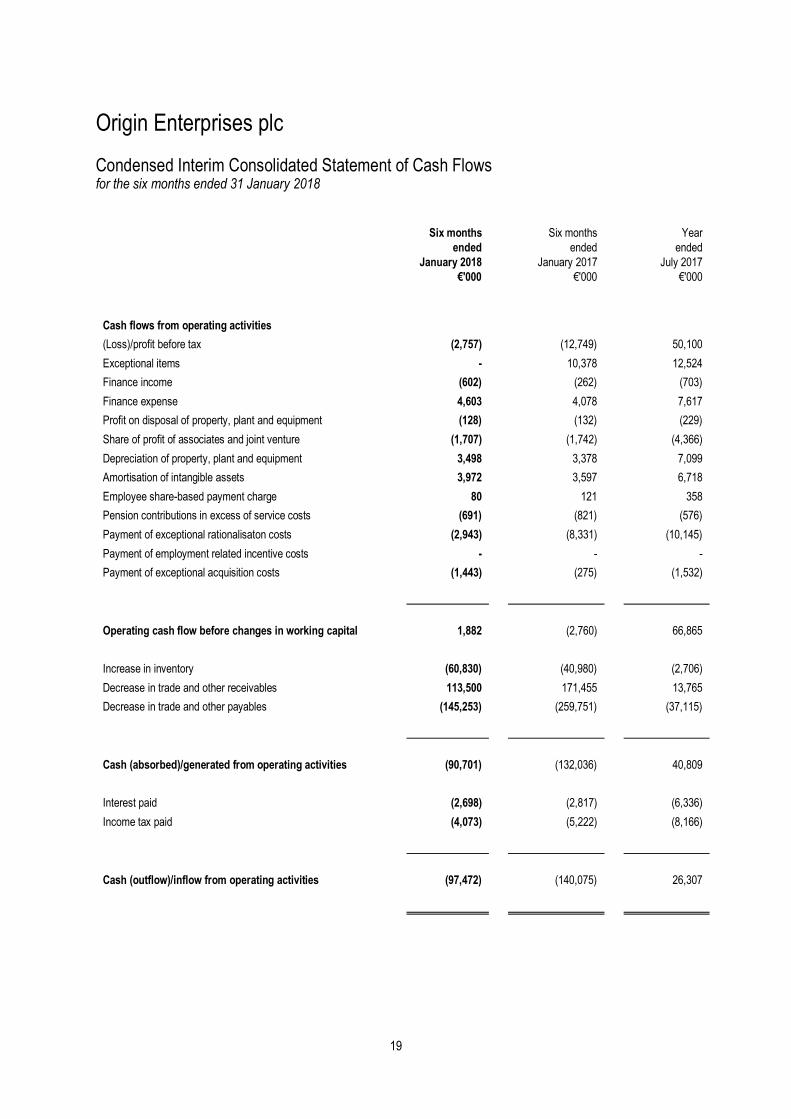
Condensed Interim Consolidated Statement of Cash Flows for the six months ended 31 January 2018
Six months Six months Year
ended ended ended
January 2018 January 2017 July 2017
€'000 €'000 €'000
Cash flows from operating activities
(Loss)/profit before tax (2,757) (12,749) 50,100
Exceptional items - 10,378 12,524
Finance income (602) (262) (703)
Finance expense 4,603 4,078 7,617
Profit on disposal of property, plant and equipment (128) (132) (229)
Share of profit of associates and joint venture (1,707) (1,742) (4,366)
Depreciation of property, plant and equipment 3,498 3,378 7,099
Amortisation of intangible assets 3,972 3,597 6,718
Employee share-based payment charge 80 121 358
Pension contributions in excess of service costs (691) (821) (576)
Payment of exceptional rationalisaton costs (2,943) (8,331) (10,145)
Payment of employment related incentive costs - - -
Payment of exceptional acquisition costs (1,443) (275) (1,532)
Operating cash flow before changes in working capital 1,882 (2,760) 66,865
Increase in inventory (60,830) (40,980) (2,706)
Decrease in trade and other receivables 113,500 171,455 13,765
Decrease in trade and other payables (145,253) (259,751) (37,115)
Cash (absorbed)/generated from operating activities (90,701) (132,036) 40,809
Interest paid (2,698) (2,817) (6,336)
Income tax paid (4,073) (5,222) (8,166)
Cash (outflow)/inflow from operating activities (97,472) (140,075) 26,307
20
Origin Enterprises plc
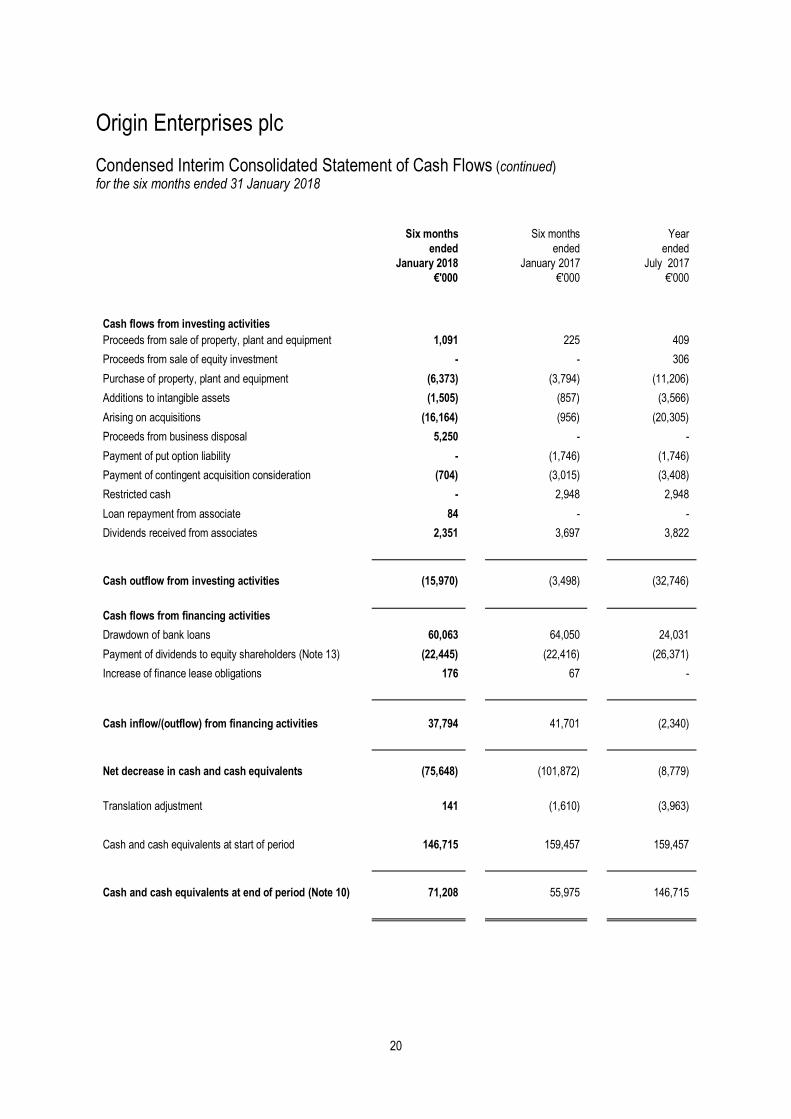
Condensed Interim Consolidated Statement of Cash Flows (continued) for the six months ended 31 January 2018
Six months Six months Year
ended ended ended
January 2018 January 2017 July 2017
€'000 €'000 €'000
Cash flows from investing activities
Proceeds from sale of property, plant and equipment 1,091 225 409
Proceeds from sale of equity investment - - 306
Purchase of property, plant and equipment (6,373) (3,794) (11,206)
Additions to intangible assets (1,505) (857) (3,566)
Arising on acquisitions (16,164) (956) (20,305)
Proceeds from business disposal 5,250 - -
Payment of put option liability - (1,746) (1,746)
Payment of contingent acquisition consideration (704) (3,015) (3,408)
Restricted cash - 2,948 2,948
Loan repayment from associate 84 - -
Dividends received from associates 2,351 3,697 3,822
Cash outflow from investing activities (15,970) (3,498) (32,746)
Cash flows from financing activities
Drawdown of bank loans 60,063 64,050 24,031
Payment of dividends to equity shareholders (Note 13) (22,445) (22,416) (26,371)
Increase of finance lease obligations 176 67 -
Cash inflow/(outflow) from financing activities 37,794 41,701 (2,340)
Net decrease in cash and cash equivalents (75,648) (101,872) (8,779)
Translation adjustment 141 (1,610) (3,963)
Cash and cash equivalents at start of period 146,715 159,457 159,457
Cash and cash equivalents at end of period (Note 10) 71,208 55,975 146,715
21
Origin Enterprises plc
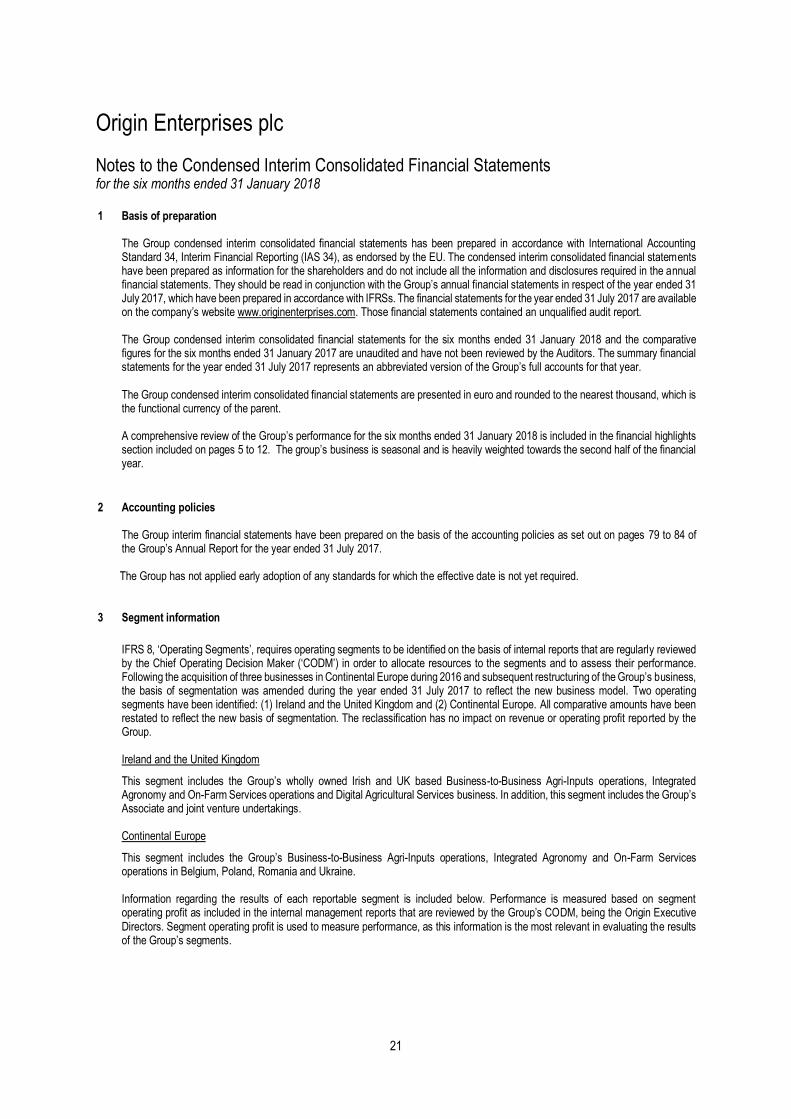
Notes to the Condensed Interim Consolidated Financial Statements for the six months ended 31 January 2018 1 Basis of preparation
The Group condensed interim consolidated financial statements has been prepared in accordance with International Accounting Standard 34, Interim Financial Reporting (IAS 34), as endorsed by the EU. The condensed interim consolidated financial statements have been prepared as information for the shareholders and do not include all the information and disclosures required in the annual financial statements. They should be read in conjunction with the Group’s annual financial statements in respect of the year ended 31 July 2017, which have been prepared in accordance with IFRSs. The financial statements for the year ended 31 July 2017 are available on the company’s website www.originenterprises.com. Those financial statements contained an unqualified audit report.
The Group condensed interim consolidated financial statements for the six months ended 31 January 2018 and the comparative figures for the six months ended 31 January 2017 are unaudited and have not been reviewed by the Auditors. The summary financial statements for the year ended 31 July 2017 represents an abbreviated version of the Group’s full accounts for that year.
The Group condensed interim consolidated financial statements are presented in euro and rounded to the nearest thousand, which is the functional currency of the parent. A comprehensive review of the Group’s performance for the six months ended 31 January 2018 is included in the financial highlights section included on pages 5 to 12. The group’s business is seasonal and is heavily weighted towards the second half of the financial year.
2 Accounting policies
The Group interim financial statements have been prepared on the basis of the accounting policies as set out on pages 79 to 84 of the Group’s Annual Report for the year ended 31 July 2017.
The Group has not applied early adoption of any standards for which the effective date is not yet required.
3 Segment information
IFRS 8, ‘Operating Segments’, requires operating segments to be identified on the basis of internal reports that are regularly reviewed by the Chief Operating Decision Maker (‘CODM’) in order to allocate resources to the segments and to assess their performance. Following the acquisition of three businesses in Continental Europe during 2016 and subsequent restructuring of the Group’s business, the basis of segmentation was amended during the year ended 31 July 2017 to reflect the new business model. Two operating segments have been identified: (1) Ireland and the United Kingdom and (2) Continental Europe. All comparative amounts have been restated to reflect the new basis of segmentation. The reclassification has no impact on revenue or operating profit reported by the Group.
Ireland and the United Kingdom
This segment includes the Group’s wholly owned Irish and UK based Business-to-Business Agri-Inputs operations, Integrated Agronomy and On-Farm Services operations and Digital Agricultural Services business. In addition, this segment includes the Group’s Associate and joint venture undertakings. Continental Europe
This segment includes the Group’s Business-to-Business Agri-Inputs operations, Integrated Agronomy and On-Farm Services operations in Belgium, Poland, Romania and Ukraine. Information regarding the results of each reportable segment is included below. Performance is measured based on segment operating profit as included in the internal management reports that are reviewed by the Group’s CODM, being the Origin Executive Directors. Segment operating profit is used to measure performance, as this information is the most relevant in evaluating the results of the Group’s segments.
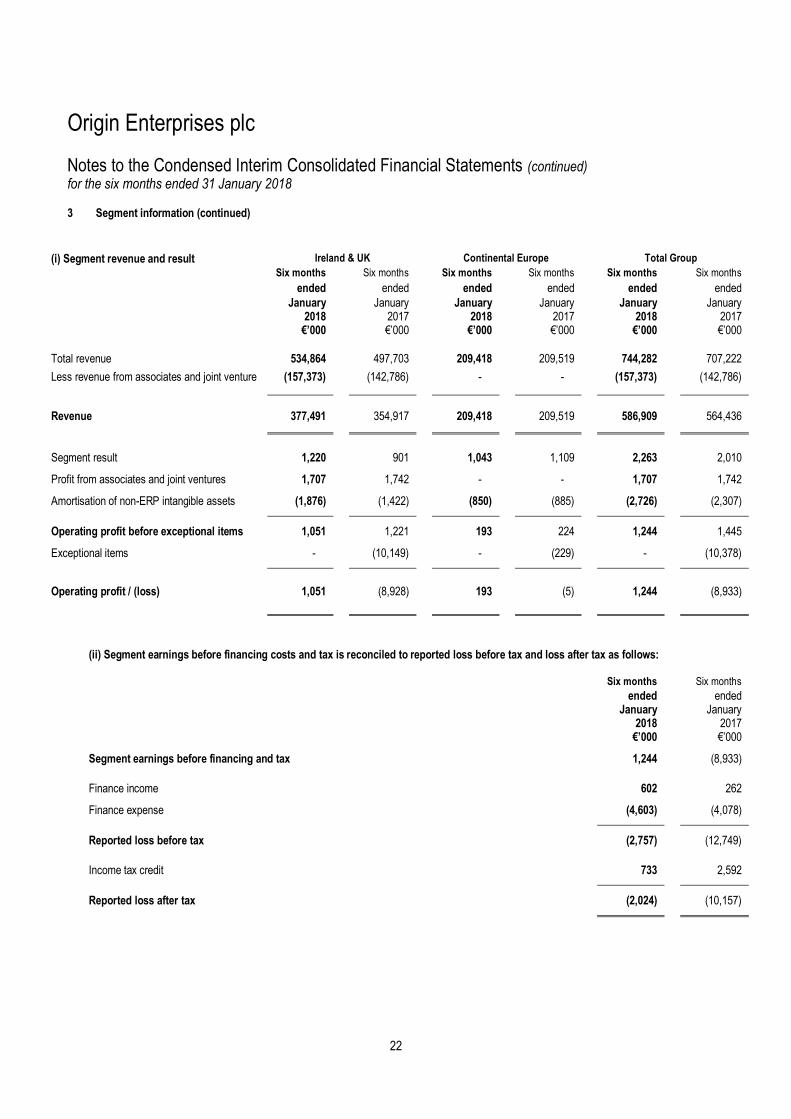
Notes to the Condensed Interim Consolidated Financial Statements (continued) for the six months ended 31 January 2018 3 Segment information (continued)
(i) Segment revenue and result Ireland & UK Continental Europe Total Group
Six months Six months Six months Six months Six months Six months
ended ended ended ended ended ended
January 2018
January 2017
January 2018
January 2017
January 2018
January 2017
€’000 €’000 €’000 €’000 €’000 €’000
Total revenue 534,864 497,703 209,418 209,519 744,282 707,222
Less revenue from associates and joint venture (157,373) (142,786) - - (157,373) (142,786)
Revenue
377,491
354,917
209,418
209,519
586,909
564,436
Segment result 1,220 901 1,043 1,109 2,263 2,010
Profit from associates and joint ventures 1,707 1,742 - - 1,707 1,742
(ii) Segment earnings before financing costs and tax is reconciled to reported loss before tax and loss after tax as follows:
Six months Six months
ended ended January
2018 January
2017 €’000 €’000
Segment earnings before financing and tax 1,244 (8,933)
Finance income 602 262
Finance expense
(4,603)
(4,078)
Reported loss before tax (2,757) (12,749)
Income tax credit 733 2,592
Reported loss after tax (2,024) (10,157)
23
Origin Enterprises plc
Notes to the Condensed Interim Consolidated Financial Statements (continued) for the six months ended 31 January 2018 3 Segment information (continued)
(iii) Segment assets Ireland & UK Continental Europe Total Group
Six months Six months Six months Six months Six months Six months
ended ended ended ended ended ended
January 2018
January 2017
January 2018
January 2017
January 2018
January 2017
€’000 €’000 €’000 €’000 €’000 €’000
Assets excluding investment in associates and joint venture and investment properties 543,842 517,215 250,003 241,355 793,845 758,570
Investment in associates and joint venture
(including other financial assets) 32,725 33,650 - - 32,725 33,650
Segment assets
576,567
550,865
250,003
241,355
826,570
792,220
Reconciliation to total assets as reported in Condensed Interim Consolidated Statement of Financial Position
Cash and cash equivalents 85,869 74,499
Derivative financial instruments 1,108 1,245
Deferred tax assets 4,663 7,132
Total assets as reported in Condensed Interim Consolidated Statement of Financial Position 918,210 875,096
(iv) Segment liabilities Ireland & UK Continental Europe Total Group
Six months Six months Six months Six months Six months Six months
ended ended ended ended ended ended
January 2018
January 2017
January 2018
January 2017
January 2018
January 2017
€’000 €’000 €’000 €’000 €’000 €’000
Segment liabilities
259,920
260,210
111,828
110,571
371,748
370,781
Reconciliation to total liabilities as reported in Condensed Interim Consolidated Statement of Financial Position Interest-bearing loans and liabilities 257,247 236,083
Derivative financial instruments 3,745 1,283
Current and deferred tax liabilities 25,929 26,940
Total liabilities as reported in Condensed Interim Consolidated Statement of Financial Position 658,669 635,087
24
Origin Enterprises plc
Notes to the Condensed Interim Consolidated Financial Statements (continued) for the six months ended 31 January 2018
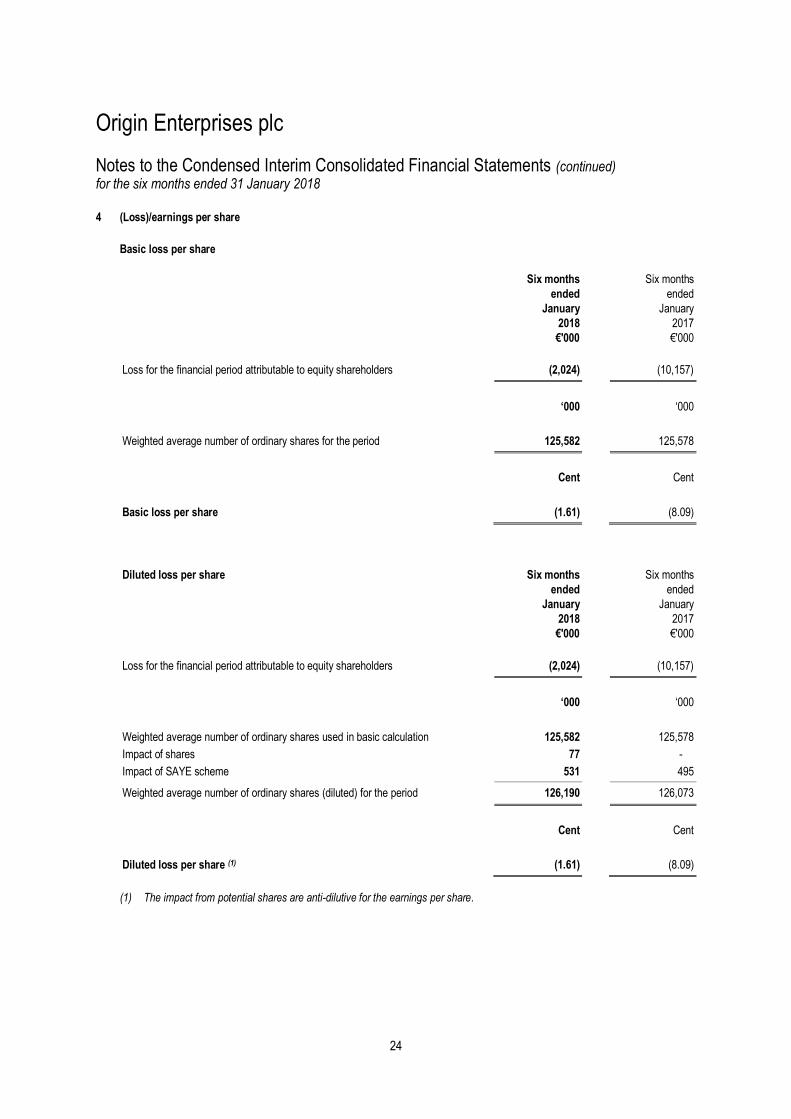
4 (Loss)/earnings per share
Basic loss per share
Six months Six months
ended ended
January January
2018 2017
€'000 €'000
Loss for the financial period attributable to equity shareholders (2,024) (10,157)
‘000 ‘000
Weighted average number of ordinary shares for the period 125,582 125,578
Cent Cent
Basic loss per share (1.61) (8.09)
Diluted loss per share Six months Six months
ended ended
January January
2018 2017
€'000 €'000
Loss for the financial period attributable to equity shareholders (2,024) (10,157)
‘000 ‘000
Weighted average number of ordinary shares used in basic calculation 125,582 125,578
Impact of shares 77 -
Impact of SAYE scheme 531 495
Weighted average number of ordinary shares (diluted) for the period 126,190 126,073
Cent Cent
Diluted loss per share (1) (1.61) (8.09)
(1) The impact from potential shares are anti-dilutive for the earnings per share.
25
Origin Enterprises plc
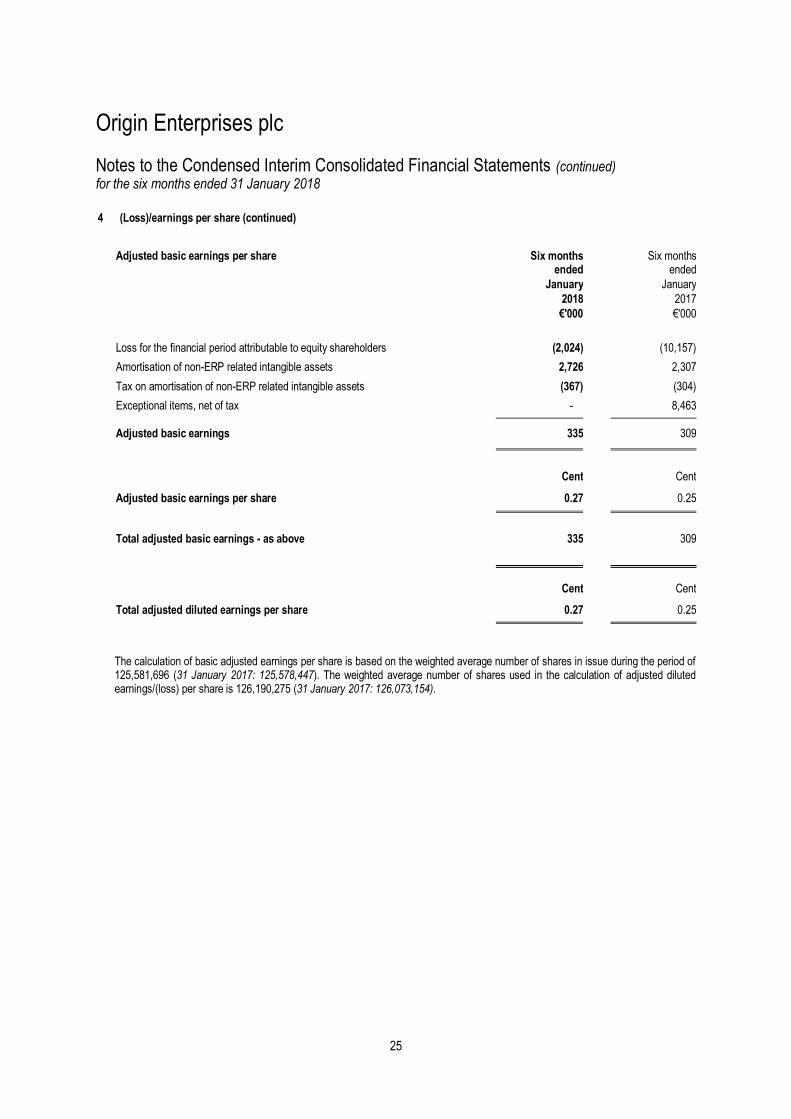
Notes to the Condensed Interim Consolidated Financial Statements (continued) for the six months ended 31 January 2018 4 (Loss)/earnings per share (continued)
Adjusted basic earnings per share Six months Six months ended ended
January January
2018 2017
€'000 €'000
Loss for the financial period attributable to equity shareholders (2,024) (10,157)
Amortisation of non-ERP related intangible assets 2,726 2,307
Tax on amortisation of non-ERP related intangible assets (367) (304)
Exceptional items, net of tax - 8,463
Adjusted basic earnings 335 309
Cent Cent
Adjusted basic earnings per share 0.27 0.25
Total adjusted basic earnings - as above 335 309
Cent Cent
Total adjusted diluted earnings per share 0.27 0.25
The calculation of basic adjusted earnings per share is based on the weighted average number of shares in issue during the period of 125,581,696 (31 January 2017: 125,578,447). The weighted average number of shares used in the calculation of adjusted diluted earnings/(loss) per share is 126,190,275 (31 January 2017: 126,073,154).
26
Origin Enterprises plc
Notes to the Condensed Interim Consolidated Financial Statements (continued) for the six months ended 31 January 2018
5 Condensed Interim Consolidated Income Statements for the six months ended 31 January 2017 and year ended 31 July
2017 An analysis of the Condensed Interim Consolidated Income Statement (including exceptional items) for the six months ended 31
January 2017 and year ended 31 July 2017 is set out below. Six months ended 31 January 2017
Six months
ended Six months Six months
January ended ended
2017 January January
Pre- 2017 2017
Exceptional Exceptional Total
€’000 €’000 €'000
Revenue 564,436 - 564,436
Cost of sales (493,556) - (493,556)
Gross profit 70,880 - 70,880
Operating costs (71,177) (10,378) (81,555)
Share of profit of associates and joint venture
1,742
-
1,742
Operating (loss) 1,445 (10,378) (8,933)
Finance income 262 - 262
Finance expense (4,078) - (4,078)
Loss before income tax (2,371) (10,378) (12,749)
Income tax credit 677 1,915 2,592
Loss for the period
(1,694)
(8,463)
(10,157)
27
Origin Enterprises plc
Notes to the Condensed Interim Consolidated Financial Statements (continued) for the six months ended 31 January 2018
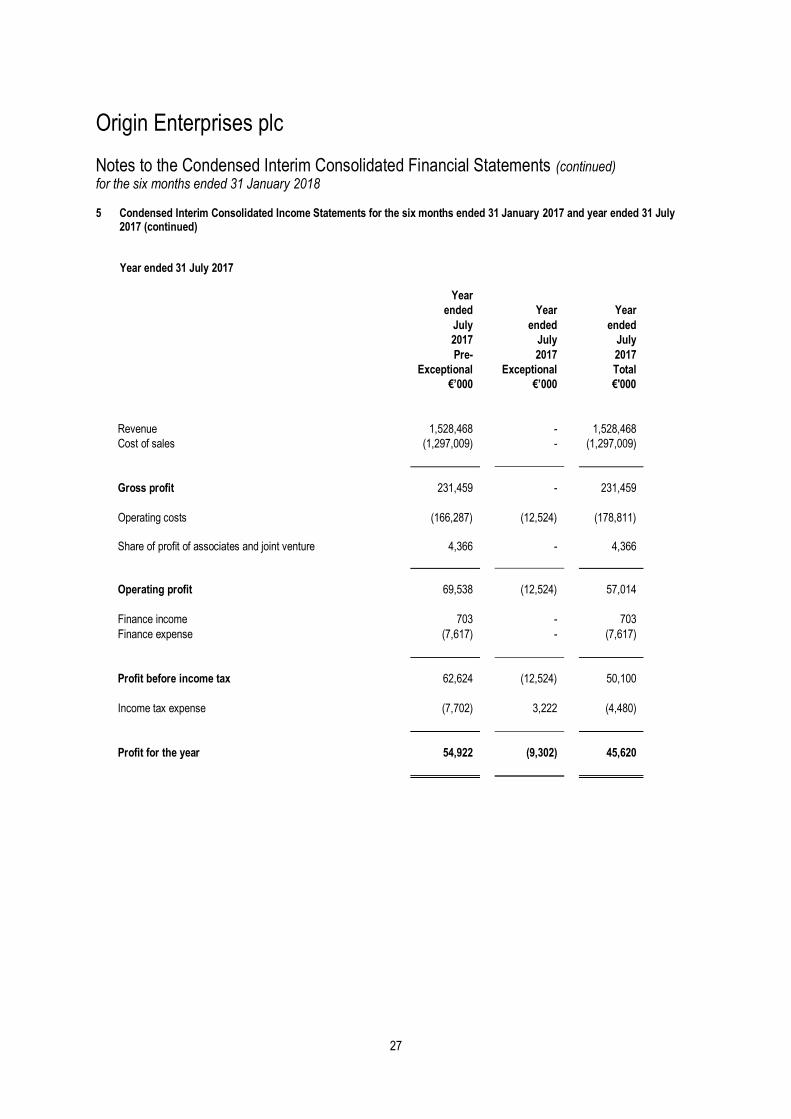
5 Condensed Interim Consolidated Income Statements for the six months ended 31 January 2017 and year ended 31 July
2017 (continued) Year ended 31 July 2017
Year
ended Year Year
July ended ended
2017 July July
Pre- 2017 2017
Exceptional Exceptional Total
€’000 €’000 €'000
Revenue 1,528,468 - 1,528,468
Cost of sales (1,297,009) - (1,297,009)
Gross profit 231,459 - 231,459
Operating costs (166,287) (12,524) (178,811)
Share of profit of associates and joint venture
4,366
-
4,366
Operating profit 69,538 (12,524) 57,014
Finance income 703 - 703
Finance expense (7,617) - (7,617)
Profit before income tax 62,624 (12,524) 50,100
Income tax expense (7,702) 3,222 (4,480)
Profit for the year
54,922
(9,302)
45,620
28
Origin Enterprises plc
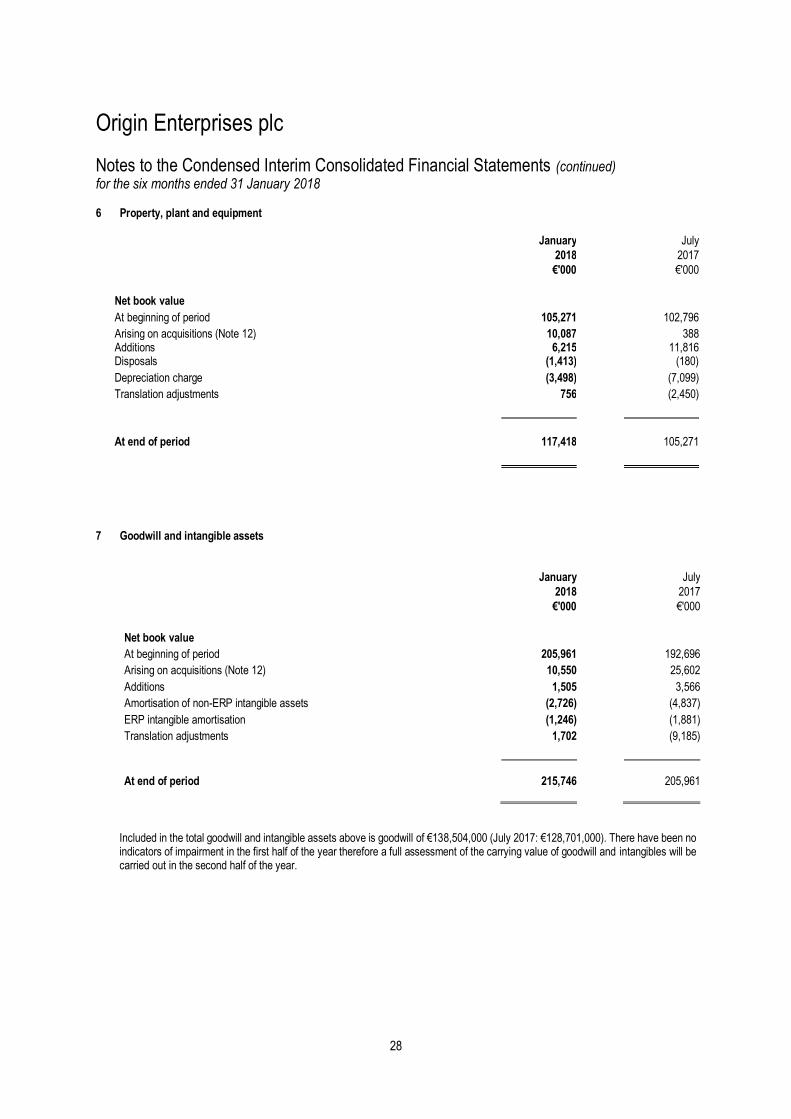
Notes to the Condensed Interim Consolidated Financial Statements (continued) for the six months ended 31 January 2018 6 Property, plant and equipment
Amortisation of non-ERP intangible assets (2,726) (4,837)
ERP intangible amortisation (1,246) (1,881)
Translation adjustments 1,702 (9,185)
At end of period 215,746 205,961
Included in the total goodwill and intangible assets above is goodwill of €138,504,000 (July 2017: €128,701,000). There have been no
indicators of impairment in the first half of the year therefore a full assessment of the carrying value of goodwill and intangibles will be carried out in the second half of the year.
29
Origin Enterprises plc
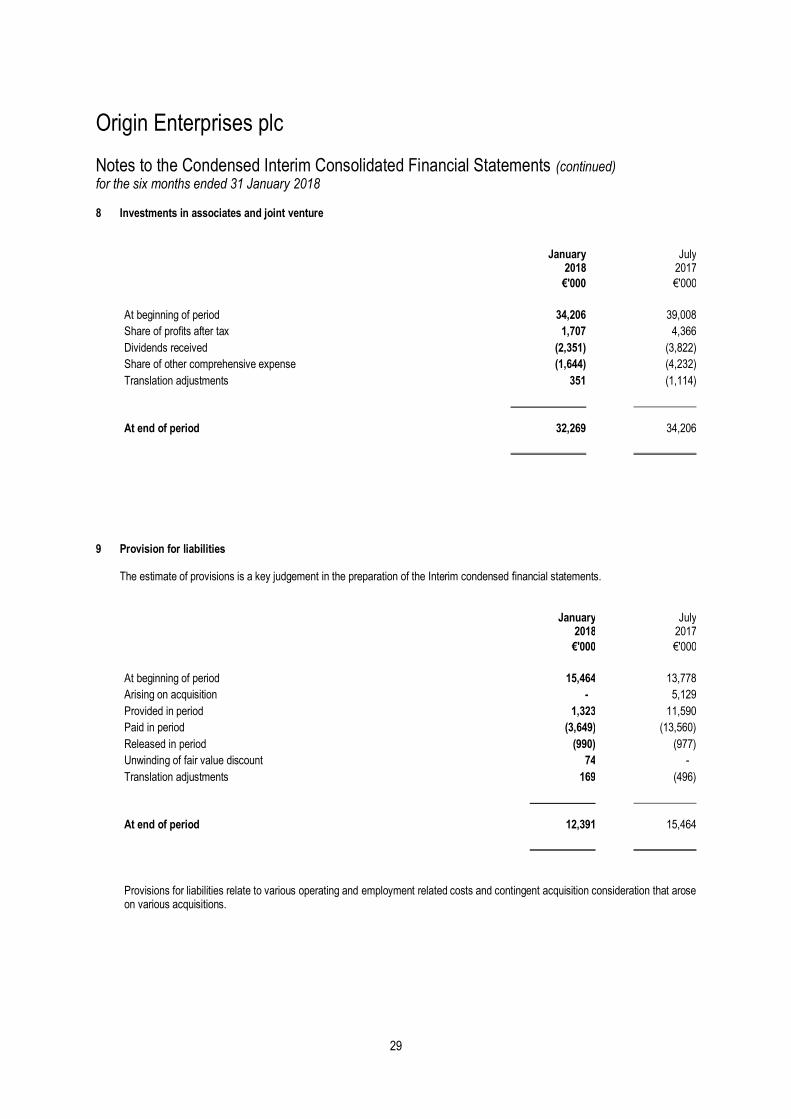
Notes to the Condensed Interim Consolidated Financial Statements (continued) for the six months ended 31 January 2018 8 Investments in associates and joint venture
January
July
2018 2017
€'000 €'000
At beginning of period 34,206 39,008
Share of profits after tax 1,707 4,366
Dividends received (2,351) (3,822)
Share of other comprehensive expense (1,644) (4,232)
Translation adjustments 351 (1,114)
At end of period 32,269 34,206
9 Provision for liabilities The estimate of provisions is a key judgement in the preparation of the Interim condensed financial statements.
January
July
2018 2017
€'000 €'000
At beginning of period 15,464 13,778
Arising on acquisition - 5,129
Provided in period 1,323 11,590
Paid in period (3,649) (13,560)
Released in period (990) (977)
Unwinding of fair value discount 74 -
Translation adjustments 169 (496)
At end of period 12,391 15,464
Provisions for liabilities relate to various operating and employment related costs and contingent acquisition consideration that arose on various acquisitions.
30
Origin Enterprises plc
Notes to the Condensed Interim Consolidated Financial Statements (continued) for the six months ended 31 January 2018
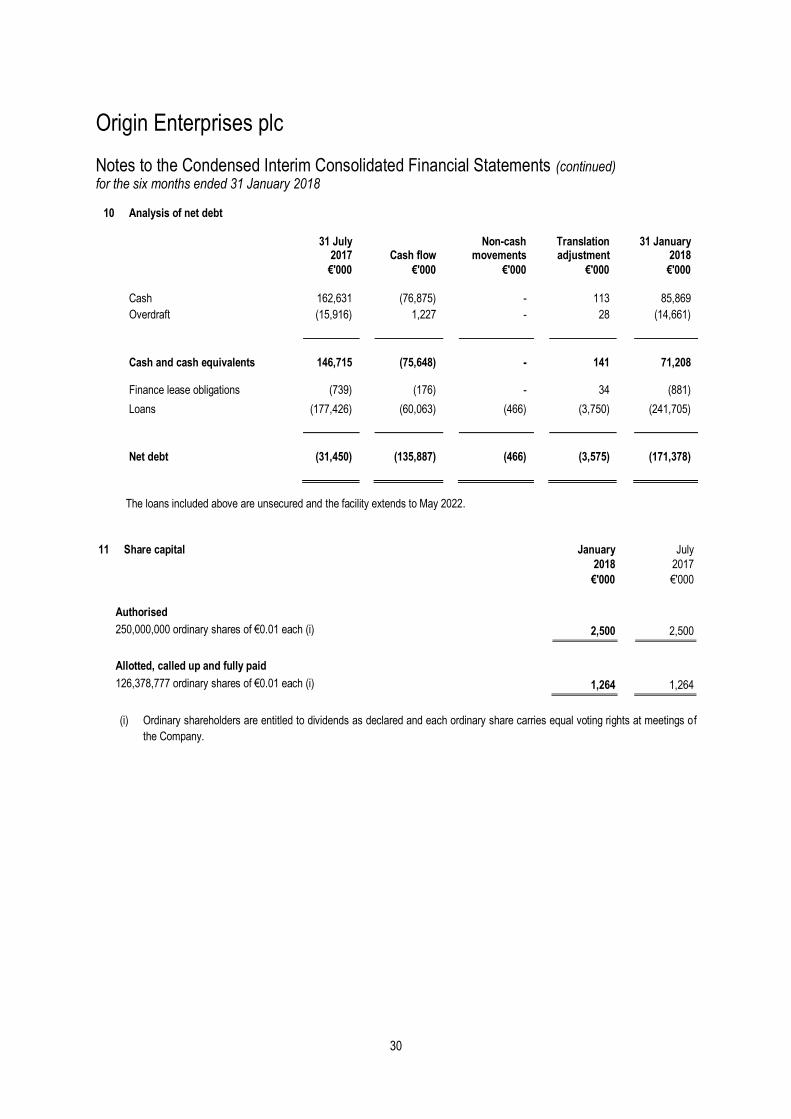
The loans included above are unsecured and the facility extends to May 2022.
11 Share capital January July
2018 2017
€'000 €'000
Authorised
250,000,000 ordinary shares of €0.01 each (i) 2,500 2,500
Allotted, called up and fully paid
126,378,777 ordinary shares of €0.01 each (i) 1,264 1,264
(i) Ordinary shareholders are entitled to dividends as declared and each ordinary share carries equal voting rights at meetings of
Net debt (31,450) (135,887) (466) (3,575) (171,378)
31
Origin Enterprises plc
Notes to the Condensed Interim Consolidated Financial Statements (continued) for the six months ended 31 January 2018
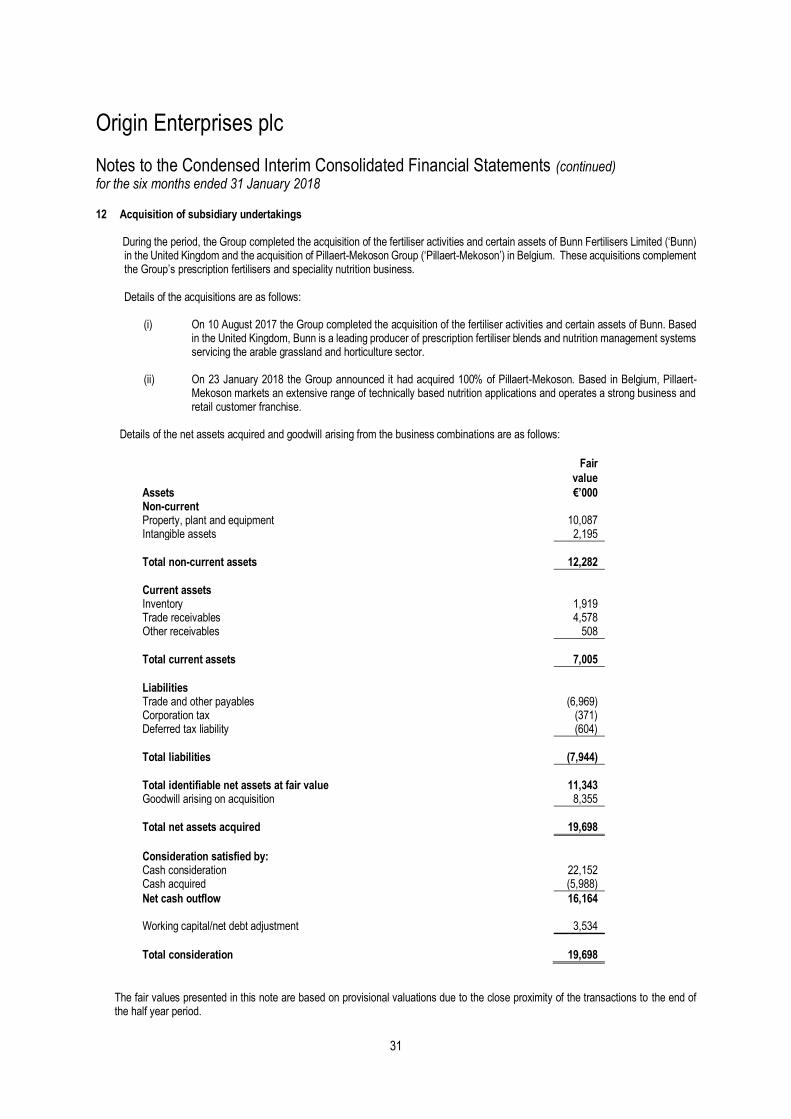
12 Acquisition of subsidiary undertakings During the period, the Group completed the acquisition of the fertiliser activities and certain assets of Bunn Fertilisers Limited (‘Bunn)
in the United Kingdom and the acquisition of Pillaert-Mekoson Group (‘Pillaert-Mekoson’) in Belgium. These acquisitions complement the Group’s prescription fertilisers and speciality nutrition business.
Details of the acquisitions are as follows:
(i) On 10 August 2017 the Group completed the acquisition of the fertiliser activities and certain assets of Bunn. Based in the United Kingdom, Bunn is a leading producer of prescription fertiliser blends and nutrition management systems servicing the arable grassland and horticulture sector.
(ii) On 23 January 2018 the Group announced it had acquired 100% of Pillaert-Mekoson. Based in Belgium, Pillaert-
Mekoson markets an extensive range of technically based nutrition applications and operates a strong business and retail customer franchise.
Details of the net assets acquired and goodwill arising from the business combinations are as follows:
The fair values presented in this note are based on provisional valuations due to the close proximity of the transactions to the end of the half year period.
Net cash outflow 16,164 Working capital/net debt adjustment 3,534
Total consideration 19,698
32
Origin Enterprises plc
Notes to the Condensed Interim Consolidated Financial Statements (continued) for the six months ended 31 January 2018 13 Dividends
On 15 December 2017 a final dividend of 17.85 cent per ordinary share was paid in respect of the year ended 31 July 2017 which when combined with the interim dividend of 3.15 cent per ordinary share brings the total dividend for the year ended 31 July 2017 to 21 cent per ordinary share. An interim dividend of 3.15 cent (2017: 3.15 cent) per ordinary share will be paid on 20 April 2018 to shareholders on the register on 6 April 2018. These condensed interim consolidated financial statements do not reflect this dividend payable.
14 Taxation
The taxation credit for the interim period is an estimate based on the expected full year effective tax rate on full year profits.
15 Contingent liabilities
The Group is not aware of any major changes with regard to contingent liabilities in comparison with the situation as of 31 July 2017.
16 Financial commitments
The Group has a financial commitment of €7.8 million attributable to a strategic partnership with University College Dublin (‘UCD’). The commitment is over a four year period.
17 Related party transactions
Related party transactions occurring in the period were similar in nature to those described in the 2017 Annual Report.
18 Release of half yearly condensed interim consolidated financial statements
The Group condensed interim consolidated financial information was approved for release by the Board on 7 March 2018.
19 Distribution of Interim Report
This interim report is available on the Group’s website (www.originenterprises.com). A printed copy is available to the public at the Company’s registered office.