Int J Clin Exp Pathol 2016;9(11):11289-11300 www.ijcep.com /ISSN:1936-2625/IJCEP0039176 Original Article Advanced oxidation protein products (AOPPs) accelerate bone loss in rats Shuai Zheng 1* , Shuai Qin 1,2* , Zhao-Ming Zhong 1 , Qian Wu 1 , Ruo-Ting Ding 1 , Cong-Rui Liao 1 , Jian-Ting Chen 1 1 Department of Orthopedic Spinal Surgery, Nanfang Hospital, Southern Medical University, Guangzhou, Guang- dong, PR China; 2 Department of Ophthalmology, The People’s Hospital of Zhuhai, Zhuhai, Guangdong, PR China. * Equal contributors. Received August 23, 2016; Accepted September 22, 2016; Epub November 1, 2016; Published November 15, 2016 Abstract: Purpose: Advanced oxidation protein products (AOPPs), markers of oxidative stress, can inhibit the prolif- eration and differentiation of rat osteoblast-like cells. Osteoporosis, a disease mainly results in bone loss, is closely related to oxidative stress. Whether AOPPs have any effect on bone loss in rats remains unclear. Therefore, the ob- jective of our research is to investigate the effect of AOPPs on the bone loss of rats in vivo. Methods: Sprague-Dawley rats were divided into 4 groups (Control, RSA, AOPPs, AOPPs+SOD). PBS, rat serum albumin (RSA) and AOPPs were delivered daily by intraperitoneal injection with or without intragastric administration of superoxide dismutase (SOD) to the respective groups. Every 4 weeks, eight rats from each group were sacrificed and their blood, tibia and femur were harvested. The expression of osteocalcin and CTX in the serum was measured by ELISA, and the tibias were subjected to metaphyseal three-point bending and μCT analysis. Results: AOPPs unregulated the serum level of osteocalcin and CTX compared to the Control and RSA groups. The measurement results of μCT showed AOPPs had an effect on the decline of bone mass, while the three-point bending test revealed no significant differences in F max , energy absorption and stiffness among the AOPPs and Control group throughout the investigation. No significant difference was found between the AOPPs and AOPPs+SOD group for any of the investigated parameters. Conclu- sion: This study demonstrated that AOPPs induced bone loss in rats. Therefore, we can infer AOPPs accelerate the development of osteoporosis in rats. Keywords: Advanced oxidation protein products, μCT, tibia and femur of rats, osteoporosis, oxidative stress Introduction Osteoporosis is a systemic skeletal disease characterized by microarchitectural reduction of bone tissue leading to low bone mass and increased bone fragility. The occurrence of fra- ctures attributable to osteoporosis can contrib- ute to the disability and mortality of patients and may add to the economic burden of the dis- ease. Although the etiology of osteoporosis is not well understood, previous studies have con- firmed that oxidative stress is involved in the onset of the disease [1, 2]. Oxidative stress, a pathological condition char- acterized by a disturbance in the prooxidant- antioxidant balance, plays an important role in the development of many diseases [2-4]. Oxi- dative stress is a pivotal pathogenic factor of age-related bone loss and strength in mice, leading to, among other changes, a decrease in osteoblast number and bone formation [5]. The generation and survival of osteoclasts, osteo- blasts, and osteocytes are greatly influenced by oxidative stress and reactive oxygen species (ROS), the main cause of oxidative stress [6, 7]. Epidemiological evidence in humans and recent mechanistic studies in rodents indicate that aging and the associated increase in ROS are the proximal culprits of osteoporosis [6]. ROS, the main cause of oxidative stress, mainly consist of H 2 O 2 , O 2 - and OH - , which are generat- ed as byproducts of the mitochondrial respira- tory chain [8, 9]. The accumulation of these byproducts could damage proteins, lipids, nucleic acids and other cellular components [10]. Oxidized lipids in atherogenesis could attenuate Wnt3a-stimulated proliferation and osteoblast differentiation and stimulate the
Transcript
Int J Clin Exp Pathol 2016;9(11):11289-11300www.ijcep.com /ISSN:1936-2625/IJCEP0039176
Original ArticleAdvanced oxidation protein products (AOPPs) accelerate bone loss in rats
1Department of Orthopedic Spinal Surgery, Nanfang Hospital, Southern Medical University, Guangzhou, Guang-dong, PR China; 2Department of Ophthalmology, The People’s Hospital of Zhuhai, Zhuhai, Guangdong, PR China. *Equal contributors.
Received August 23, 2016; Accepted September 22, 2016; Epub November 1, 2016; Published November 15, 2016
Abstract: Purpose: Advanced oxidation protein products (AOPPs), markers of oxidative stress, can inhibit the prolif-eration and differentiation of rat osteoblast-like cells. Osteoporosis, a disease mainly results in bone loss, is closely related to oxidative stress. Whether AOPPs have any effect on bone loss in rats remains unclear. Therefore, the ob-jective of our research is to investigate the effect of AOPPs on the bone loss of rats in vivo. Methods: Sprague-Dawley rats were divided into 4 groups (Control, RSA, AOPPs, AOPPs+SOD). PBS, rat serum albumin (RSA) and AOPPs were delivered daily by intraperitoneal injection with or without intragastric administration of superoxide dismutase (SOD) to the respective groups. Every 4 weeks, eight rats from each group were sacrificed and their blood, tibia and femur were harvested. The expression of osteocalcin and CTX in the serum was measured by ELISA, and the tibias were subjected to metaphyseal three-point bending and μCT analysis. Results: AOPPs unregulated the serum level of osteocalcin and CTX compared to the Control and RSA groups. The measurement results of μCT showed AOPPs had an effect on the decline of bone mass, while the three-point bending test revealed no significant differences in Fmax, energy absorption and stiffness among the AOPPs and Control group throughout the investigation. No significant difference was found between the AOPPs and AOPPs+SOD group for any of the investigated parameters. Conclu-sion: This study demonstrated that AOPPs induced bone loss in rats. Therefore, we can infer AOPPs accelerate the development of osteoporosis in rats.
Keywords: Advanced oxidation protein products, μCT, tibia and femur of rats, osteoporosis, oxidative stress
Introduction
Osteoporosis is a systemic skeletal disease characterized by microarchitectural reduction of bone tissue leading to low bone mass and increased bone fragility. The occurrence of fra- ctures attributable to osteoporosis can contrib-ute to the disability and mortality of patients and may add to the economic burden of the dis-ease. Although the etiology of osteoporosis is not well understood, previous studies have con-firmed that oxidative stress is involved in the onset of the disease [1, 2].
Oxidative stress, a pathological condition char-acterized by a disturbance in the prooxidant-antioxidant balance, plays an important role in the development of many diseases [2-4]. Oxi- dative stress is a pivotal pathogenic factor of age-related bone loss and strength in mice,
leading to, among other changes, a decrease in osteoblast number and bone formation [5]. The generation and survival of osteoclasts, osteo-blasts, and osteocytes are greatly influenced by oxidative stress and reactive oxygen species (ROS), the main cause of oxidative stress [6, 7]. Epidemiological evidence in humans and recent mechanistic studies in rodents indicate that aging and the associated increase in ROS are the proximal culprits of osteoporosis [6].
ROS, the main cause of oxidative stress, mainly consist of H2O2, O2
- and OH-, which are generat-ed as byproducts of the mitochondrial respira-tory chain [8, 9]. The accumulation of these byproducts could damage proteins, lipids, nucleic acids and other cellular components [10]. Oxidized lipids in atherogenesis could attenuate Wnt3a-stimulated proliferation and osteoblast differentiation and stimulate the
AOPPs accelerate bone loss in rats
11290 Int J Clin Exp Pathol 2016;9(11):11289-11300
apoptosis of osteoblastic cells, which may pro-vide a mechanistic explanation for the link bet- ween atherosclerosis and osteoporosis [11]. Recent studies have indicated that proteins are more susceptible to oxidative damage than lip-ids, and therefore, proteins are generally con-sidered to be the main original targets of ROS [12, 13].
Advanced oxidation protein products (AOPPs) were first discovered in the plasma of patients with dialysis [14]. AOPPs are a group of dityro-sine-containing and cross-linking protein prod-ucts formed during oxidative stress by the reac-tion of plasma albumin with chlorinated oxida- nts [15]. The plasma concentration of AOPPs is closely correlated with the level of dityrosine, a hallmark of oxidized proteins and pentosidine. These serve as markers of protein glycoxida-tion, which are tightly related to oxidative stress [16]. Oxidative damage to proteins is reflected in increased levels of AOPPs, which serve as novel biomarkers of oxidative stress [15].
In addition to serving as a marker of oxidative stress, AOPPs have also been shown to play a significant role as effector molecules in a num-ber of biological events. AOPPs have been re- ported to induce mesangial cell perturbation through the PKC-dependent activation of NAD- PH oxidase [17], and the accumulation of AO- PPs promote NADPH oxidase-dependent podo-cyte depletion by a p53-Bax apoptotic pathway both in vivo and in vitro [18]. Moreover, AOPPs are cable of inhibiting the differentiation of pre-adipocytes and activate inflammation in these cells [19].
The accumulation of advanced oxidation pro-tein products (AOPPs) has been observed in many diseases, such as diabetes [17], athero-sclerosis [20], rheumatoid arthritis [21] and chronic kidney disease [22]. Furthermore, all of these diseases, including diabetes [23], ath-erosclerosis [11], rheumatoid arthritis [24], and chronic kidney disease [25, 26], have a close relationship with osteoporosis. Additionally, we have also demonstrated that AOPPs can inhibit the proliferation and differentiation of rat os- teoblasts, key cells during the genesis and development of osteoporosis, through the ROS-dependent NF-κB pathway [27]. Therefore, ba- sed on our preliminary studies, we postulate that the accumulation of AOPPs might play a
role in the pathophysiological progress of osteoporosis. However, to our knowledge, there is no information available in the literature regarding the effect of AOPPs on the develop-ment of osteoporosis in vivo. Consequently, in this study, we investigated the effect of AOPPs on the development of osteoporosis using Sprague Dawley rats.
Material and methods
AOPPs-RSA preparation and determination
AOPPs-Rat Serum Albumin (RSA) was prepared as described earlier [14, 28] with minor modi- fications. Briefly, an RSA solution (20 mg/ml, St Louis, MO, USA) was exposed to 200 mmol/L of HOCl (Fluke, Buchs, Switzerland) for 30 min at room temperature and then dialyzed against PBS at 4°C for 24 h to remove free HOCl. Control incubation was performed in native RSA dissolved in phosphate buffer solution (PBS) alone. All of the preparations were passed through a Detoxi-Gel column (Thermo, Massa- chusetts, USA) to remove any endotoxin. An amebocyte lysate assay kit (Sigma, USA) was used to determine the level of endotoxin in AOPP-RSA, and the concentration of endotoxin was below 0.025 EU/ml. The AOPP content in the sample was determined as described previ-ously [15]. Briefly, 200 µl of sample or chlora-mine-T was placed in a 96-well plate and 20 µl of acetic acid was added. A microplate reader was used to immediately measure the absor-bance at 340 nm. The AOPP content in the AO- PP-RSA and unmodified RSA was 40.10±2.23 µmol/g protein and 0.12±0.07 µmol/g protein, respectively.
Animals
Fifty-six female Sprague-Dawley rats (8 weeks old) were purchased from the Laboratory Animals center of Southern Medical University and raised in a 12 h light/dark cycle and given free access to food and tap water. The experi-mental animals were randomly assigned to four groups [Control, RSA, AOPPs, AOPPs+Supero- xide Dismutase (SOD)] according to body weight with a daily injection of either PBS (50 mg/kg per day), native RSA (50 mg/kg per day), AOPPs (50 mg/kg per day) or AOPPs (50 mg/kg per day) with intragastric administration of SOD (Sigma Chemical, 100 mg/kg per day) sepa-rately until they were sacrificed [18].
AOPPs accelerate bone loss in rats
11291 Int J Clin Exp Pathol 2016;9(11):11289-11300
The rats were sacrificed at 4 predetermined time points for the Control group (0, 4, 8 and 12 weeks) and 3 time points for the remaining three groups (4, 8 and 12 weeks). There were
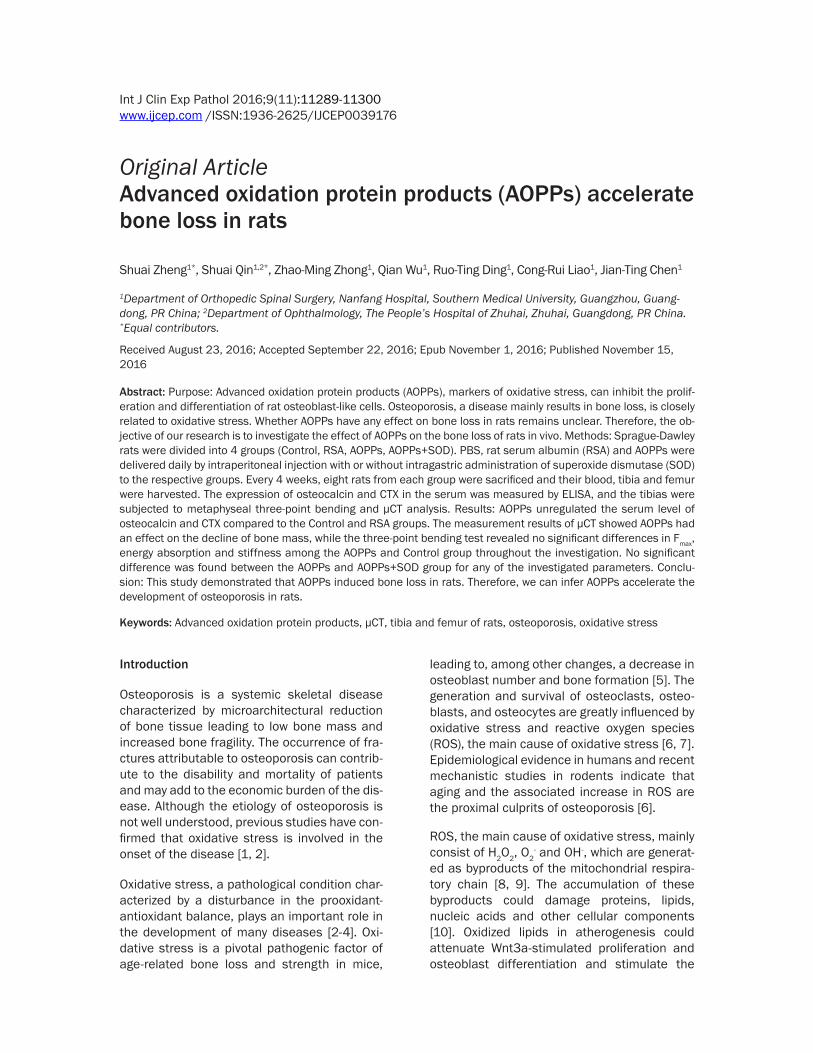
ular bone architecture was analyzed at the proximal tibia, and a 2-mm region of the trabec-ular bone starting from 2-mm distal to the prox-imal growth plates (Figure 1A and 1C) was
Figure 1. The general chart of the experimental methods of μCT and three-point bending test. Some of the experimental parameters of rat tibia (A) and femur (D) scanned by μCT. The design details of the three-point bending test consisting of an aluminum block and a rounded edge-free notch (B), (E). The volume of interest tested by μCT and three-point bending test (C) and (F).
32 animals in the control group and 24 animals in each of the treatment groups. The bilateral tibias and femurs were collected, with the soft tissues thoroughly removed; wrapped in normal saline so- aked gauze; and stored at -20°C until use. None of the rats exhibited signs of dis-tress or illness from the differ-ent treatments during the course of the study, and none were excluded from the study.
Serum biomarker measure-ments
Blood was collected from the abdominal aorta of the rats before they were sacrificed. The serum was separated by centrifugation at 4°C and stored at -80°C until required for further analysis. Osteocal- cin (OC), bone formation mar- kers, and C-terminal cross-linked telopeptides of type I collagen (CTX), which bone resorption markers, in the serum were quantified by OC and CTX ELISA kits (Cusabio, Wu Han, China), respectively, according to the protocol pro-vided by the manufacturer. The absorbance at 450 nm was measured by a spectro-photometric plate reader.
Micro-computed tomography analysis
The micro-architecture of the trabecular and cortical bone were assessed using a high resolution micro-CT system (μCT80, Scanco Medical AG, Bassersdorf, Switzerland) eq- uipped with a 10-μm focal spot microfocus X-ray tube as the source. Briefly, the trabec-
AOPPs accelerate bone loss in rats
11292 Int J Clin Exp Pathol 2016;9(11):11289-11300
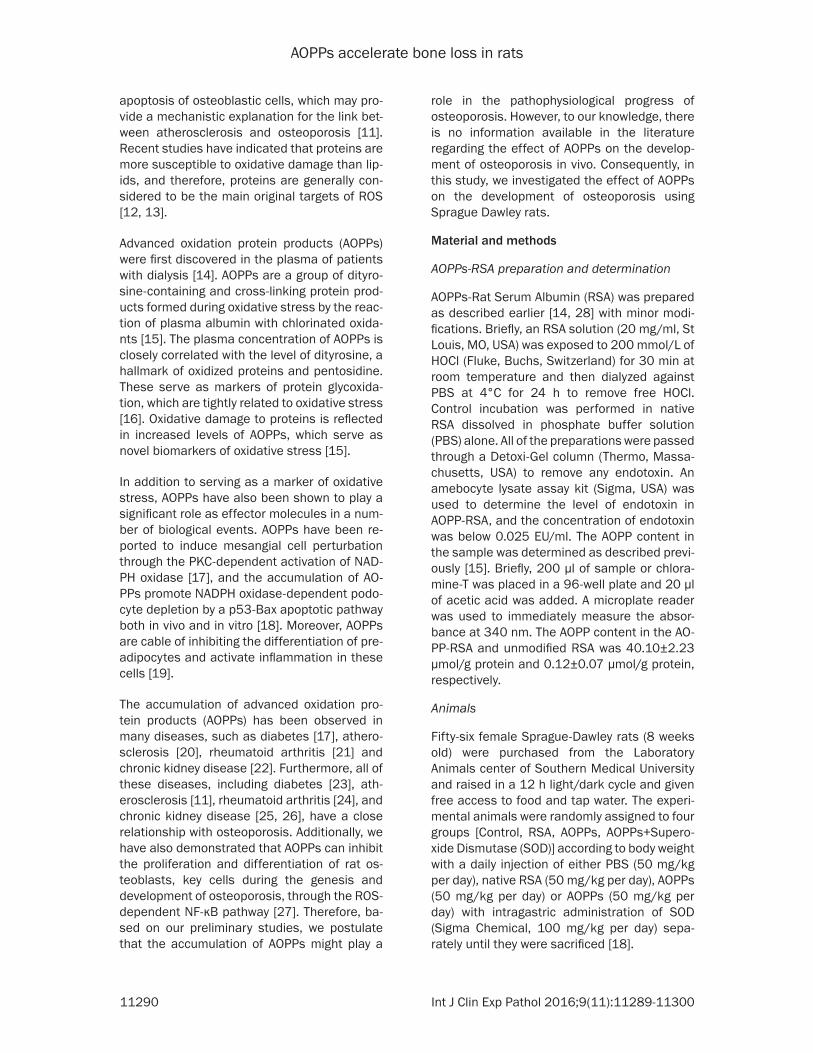
Figure 2. All of the morphological parameters (bone volume/tissue volume (BV/TV), TV apparent, BV material, structure model index (SMI), connect density (Conn.D), trabecula number (Tb.N), trabecula thickness (Tb.Th) and trabecular space (Tb.Sp)) of trabecular changes measured by μCT. The rats were randomly assigned to four groups (Control, RSA, AOPPs, AOPPs+Superoxide Dismutase (SOD)) with a daily injection of either PBS (50 mg/kg per day), native RSA (50 mg/kg per day), AOPPs (50 mg/kg per day) or AOPPs (50 mg/kg per day) with intragastric administration of SOD (100 mg/kg per day), separately. Each value was derived from a single serial cross section taken from the tibia. The X axis indicates the time in weeks after treatment. The data were presented as the mean ± SD. #: Significant difference was found between the Control group and AOPPs group (P < 0.05); *: Significant difference was found between the Control group and AOPPs+SOD group (P < 0.05); &: Significant difference was found between the RSA group and AOPPs group (P < 0.05); $: Significant difference was found between the RSA group and AOPPs+SOD group (P < 0.05).
AOPPs accelerate bone loss in rats
11293 Int J Clin Exp Pathol 2016;9(11):11289-11300
used for structural evaluation. The cortical bone architecture was analyzed at the mid-diaphyseal compartment, and a 1-mm region of the cortical bone starting at 56% of the whole femur length (calculated from the greater tro-chanter) was used for structural evaluation (Figure 1D and 1F) according to Kohler [29]. Low-density foam was used to position the specimen tightly in the sample holder to ensure that no relative movement occurred between the specimen and the sample holder during the scan. The resultant grayscale images obtained had an isotropic voxel size of 12 μm, and the X-ray tube was operated at 55 kVp and 49 μA.
Three-point mechanical strength testing
The mechanical properties of the tibias and femurs were tested using the three-point bend-
ing method described by Sturmer [30] and per-formed by a miniature Instron materials testing machine (Electroplus E1000 Test System) with a 2000-N load cell (Figure 1B and 1E). The tib-ias were thawed at room temperature for 30 min prior to testing, and the region of interest shown in Figure 1C and 1F was determined using digital calipers. The samples were con-tinuously moistened with an isotonic saline solution during the test. The speed of the feed motion was 5 mm/min with a 5% strain rate. The motion was automatically ended by a loss of strength of > 20 N or a linear change of > 2 mm. The maximum load (Fmax), energy absorp-tion and stiffness (S) were collected via Bluehill 2 (version 2.28.832, Instron, a Division of Illin- ois Tool Works, Inc.). The experiment was per-formed blinded with regard to the association between the bones and animal groups.
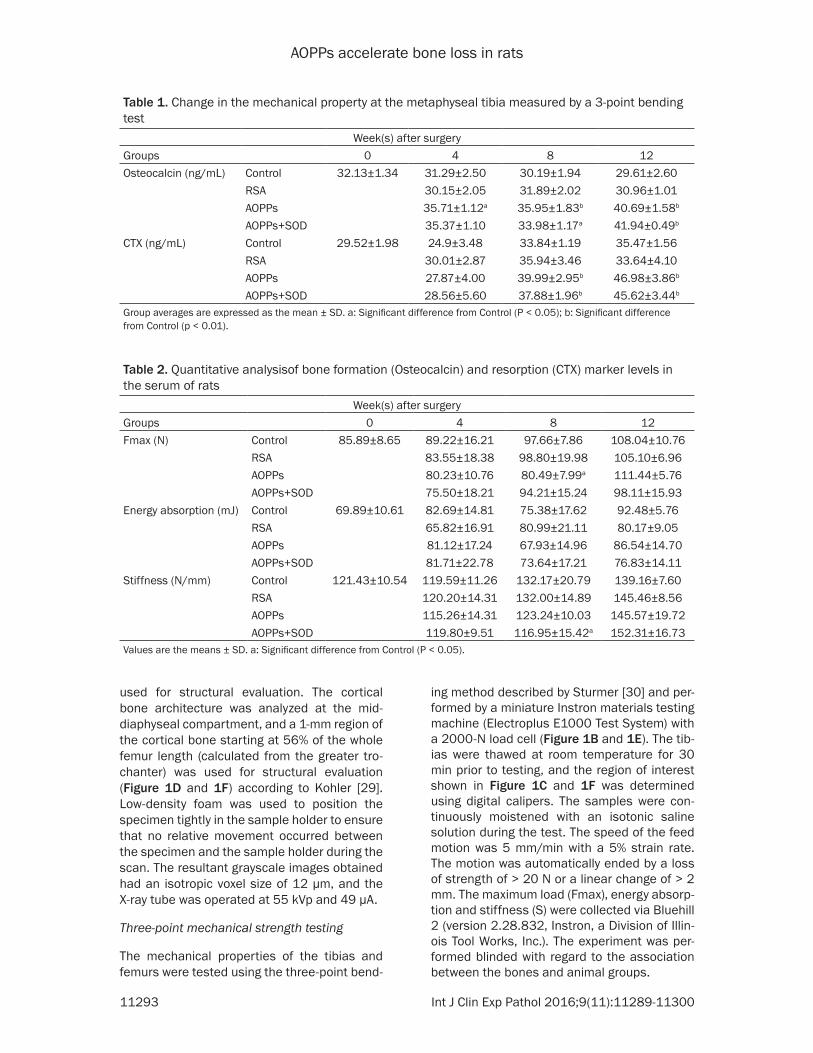
Table 1. Change in the mechanical property at the metaphyseal tibia measured by a 3-point bending test
Week(s) after surgeryGroups 0 4 8 12Osteocalcin (ng/mL) Control 32.13±1.34 31.29±2.50 30.19±1.94 29.61±2.60
Values are the means ± SD. a: Significant difference from Control (P < 0.05).
AOPPs accelerate bone loss in rats
11294 Int J Clin Exp Pathol 2016;9(11):11289-11300
Statistical analysis
The results were expressed as the mean ± standard deviation. Significant differences bet- ween different groups for the same time or over the entire period were compared using one-way ANOVA. The homogeneity variance was com-pared among the groups first. Multiple compari-sons were performed using the LSD or Dun- nett’s C method. The statistical significance was assumed at P < 0.05, and the statistical analyses were performed with SPSS 13.0 software.
Results
Micro-computed tomography (μCT)
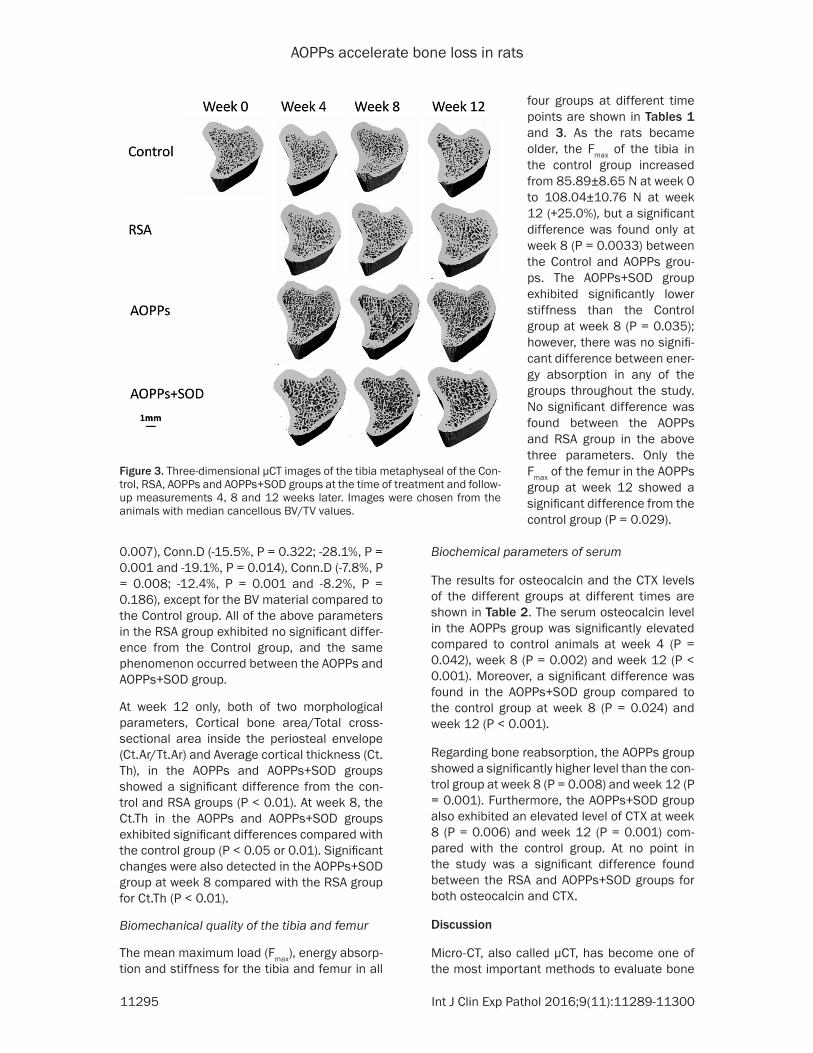
The morphological alterations of the trabecular microarchitecture in the tibial and cortical bone in the femur measured from μCT are shown in Figure 2 and Table 3. The representative three-dimensional micro-CT reconstruction images of the tibia and femur are illustrated in Figures 3 and 4.
From 4 to 12 weeks, all of the morphological parameters in the AOPPs and AOPPs+SOD groups showed a significant difference from the control and RSA groups (bone volume/tis-sue volume (BV/TV), TV apparent, structure model index (SMI), connect density (Conn.D), trabecula number (Tb.N), trabecula thickness (Tb.Th) and trabecular space (Tb.Sp)) (P < 0.05 or 0.01), except for the BV material. The dam-age effect of AOPPs on the trabecular architec-ture was apparent at week 4, but the effect was not aggravated at week 8 and week 12.
Compared with their respective control groups, significant changes were detected in the AOPPs group at week 4, week 8 and week 12 for almost all of the tested indices: TV apparent (-13.6%, P = 0.006; 18.4%, P = 0.001 and -13.3%, P = 0.019), BV/TV (-16.0%, P = 0.016; 16.7%, P = 0.032 and -14.7%, P = 0.015), Tb.Th (-51.4%, 50.4%, and -45.6%, P < 0.001 for all), SMI (+122.7%, P = 0.043; +130.1%, P = 0.002 and +99.9%, P < 0.001), Tb.Sp (+14.9%, P = 0.409; +31.8%, P = 0.035 and +38.6%, P =
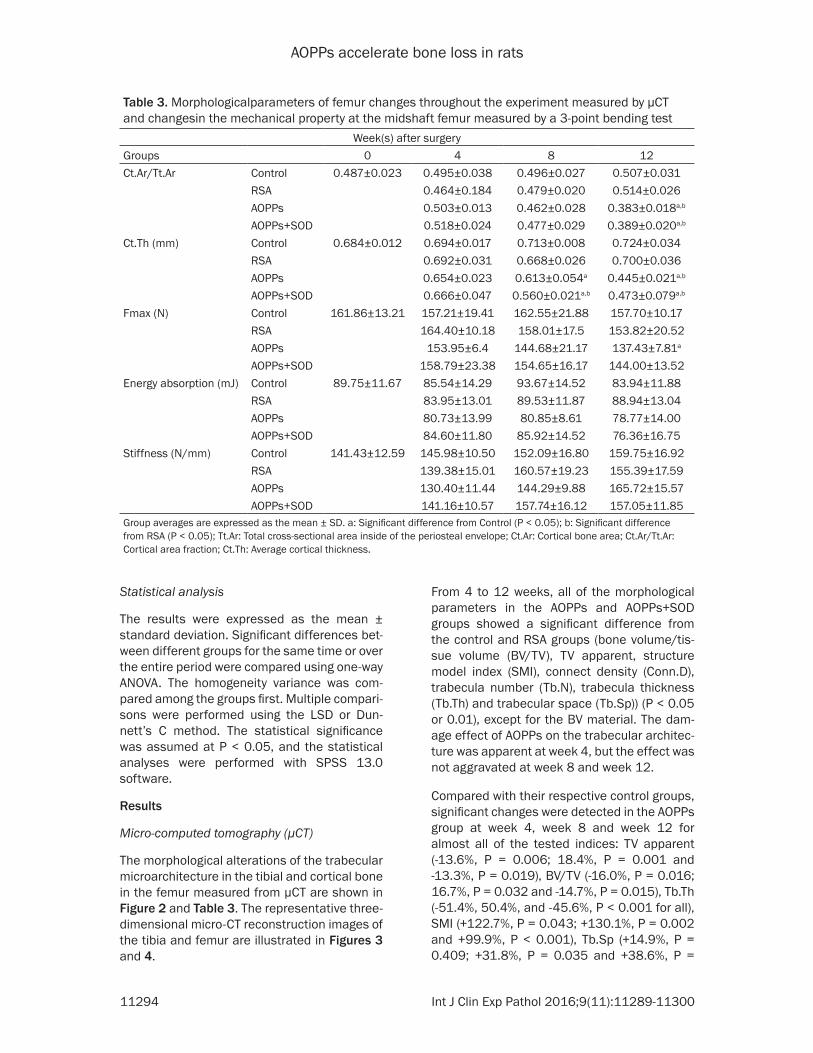
Table 3. Morphologicalparameters of femur changes throughout the experiment measured by μCT and changesin the mechanical property at the midshaft femur measured by a 3-point bending test
Week(s) after surgeryGroups 0 4 8 12Ct.Ar/Tt.Ar Control 0.487±0.023 0.495±0.038 0.496±0.027 0.507±0.031
Group averages are expressed as the mean ± SD. a: Significant difference from Control (P < 0.05); b: Significant difference from RSA (P < 0.05); Tt.Ar: Total cross-sectional area inside of the periosteal envelope; Ct.Ar: Cortical bone area; Ct.Ar/Tt.Ar: Cortical area fraction; Ct.Th: Average cortical thickness.
AOPPs accelerate bone loss in rats
11295 Int J Clin Exp Pathol 2016;9(11):11289-11300
0.007), Conn.D (-15.5%, P = 0.322; -28.1%, P = 0.001 and -19.1%, P = 0.014), Conn.D (-7.8%, P = 0.008; -12.4%, P = 0.001 and -8.2%, P = 0.186), except for the BV material compared to the Control group. All of the above parameters in the RSA group exhibited no significant differ-ence from the Control group, and the same phenomenon occurred between the AOPPs and AOPPs+SOD group.
At week 12 only, both of two morphological parameters, Cortical bone area/Total cross-sectional area inside the periosteal envelope (Ct.Ar/Tt.Ar) and Average cortical thickness (Ct.Th), in the AOPPs and AOPPs+SOD groups showed a significant difference from the con-trol and RSA groups (P < 0.01). At week 8, the Ct.Th in the AOPPs and AOPPs+SOD groups exhibited significant differences compared with the control group (P < 0.05 or 0.01). Significant changes were also detected in the AOPPs+SOD group at week 8 compared with the RSA group for Ct.Th (P < 0.01).
Biomechanical quality of the tibia and femur
The mean maximum load (Fmax), energy absorp-tion and stiffness for the tibia and femur in all
Biochemical parameters of serum
The results for osteocalcin and the CTX levels of the different groups at different times are shown in Table 2. The serum osteocalcin level in the AOPPs group was significantly elevated compared to control animals at week 4 (P = 0.042), week 8 (P = 0.002) and week 12 (P < 0.001). Moreover, a significant difference was found in the AOPPs+SOD group compared to the control group at week 8 (P = 0.024) and week 12 (P < 0.001).
Regarding bone reabsorption, the AOPPs group showed a significantly higher level than the con-trol group at week 8 (P = 0.008) and week 12 (P = 0.001). Furthermore, the AOPPs+SOD group also exhibited an elevated level of CTX at week 8 (P = 0.006) and week 12 (P = 0.001) com-pared with the control group. At no point in the study was a significant difference found between the RSA and AOPPs+SOD groups for both osteocalcin and CTX.
Discussion
Micro-CT, also called μCT, has become one of the most important methods to evaluate bone
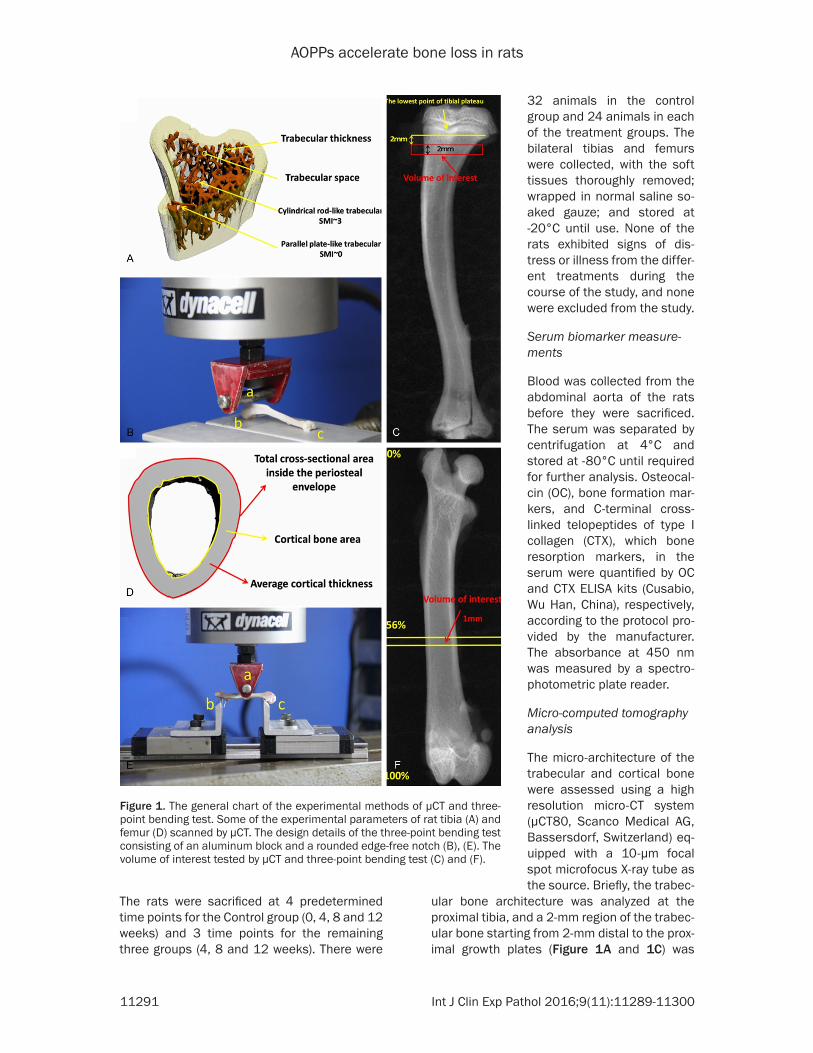
Figure 3. Three-dimensional μCT images of the tibia metaphyseal of the Con-trol, RSA, AOPPs and AOPPs+SOD groups at the time of treatment and follow-up measurements 4, 8 and 12 weeks later. Images were chosen from the animals with median cancellous BV/TV values.
four groups at different time points are shown in Tables 1 and 3. As the rats became older, the Fmax of the tibia in the control group increased from 85.89±8.65 N at week 0 to 108.04±10.76 N at week 12 (+25.0%), but a significant difference was found only at week 8 (P = 0.0033) between the Control and AOPPs grou- ps. The AOPPs+SOD group exhibited significantly lower stiffness than the Control group at week 8 (P = 0.035); however, there was no signifi-cant difference between ener-gy absorption in any of the groups throughout the study. No significant difference was found between the AOPPs and RSA group in the above three parameters. Only the Fmax of the femur in the AOPPs group at week 12 showed a significant difference from the control group (P = 0.029).
AOPPs accelerate bone loss in rats
11296 Int J Clin Exp Pathol 2016;9(11):11289-11300
morphology in animal models. The accuracy of the μCT morphology measurements has been evaluated by comparison with traditional mea-sures from 2D histomorphometry both in ani-mal [31-33] and human specimens [34, 35]. These studies show that morphologic measure-ments by μCT are generally highly correlated with those from histomorphometry. Compared with histological analyses, μCT can measure the bone microarchitecture directly without relying on stereological models, and therefore, μCT has become the “gold standard” for the evaluation of bone morphology and microarchi-tecture in rats and other small animal models [36]. Furthermore, the assessment of bone morphology by μCT scanning is nondestructive, and thus, samples can be used subsequently for other assays, such as mechanical testing. Therefore, to perform a three-point bending test, histomorphometry was replaced by μCT to evaluate the bone morphology of the rats in our experiment.
μCT 80 was used in this study, where it provid-ed the bone microarchitecture parameters of
almost all of the test parameters. Hence, we concluded that the AOPPs, and not RSA, affect-ed the tibia in the rats.
In addition, the data of the tibia provided by μCT revealed that the micro-architectural bone parameters in the AOPPs group showed a sig-nificant difference from the control group in almost all of the tested indices at week 4. Therefore, we speculated that AOPPs could aggravate the bone loss of the tibia in rats; however, at week 8 and week 12 in the AOPPs group, the difference was not obvious com-pared with week 4. Furthermore, TV apparent, BV/TV, Conn.D and Tb.N at week 12 were high-er than that of week 8, which indicated that at 12 weeks, the bone mass loss was less than at 8 weeks. On the basis of these results, AOPPs had limited effects on trabecular architecture. Furthermore, as the rats grew older, the tibia became increasingly stronger, allowing it to counteract some of the damaging effects of AOPPs on the trabeculae. Therefore, the degree of bone mass loss at week 12 was less than that of week 8. The data of the femur measured
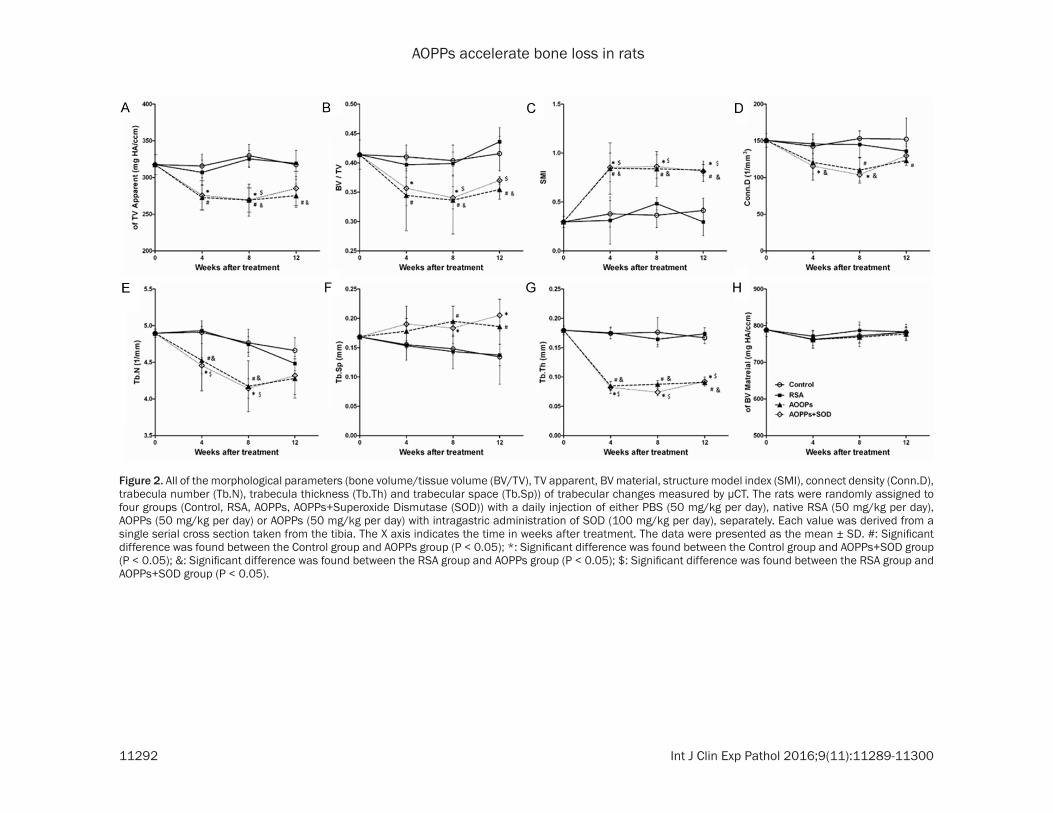
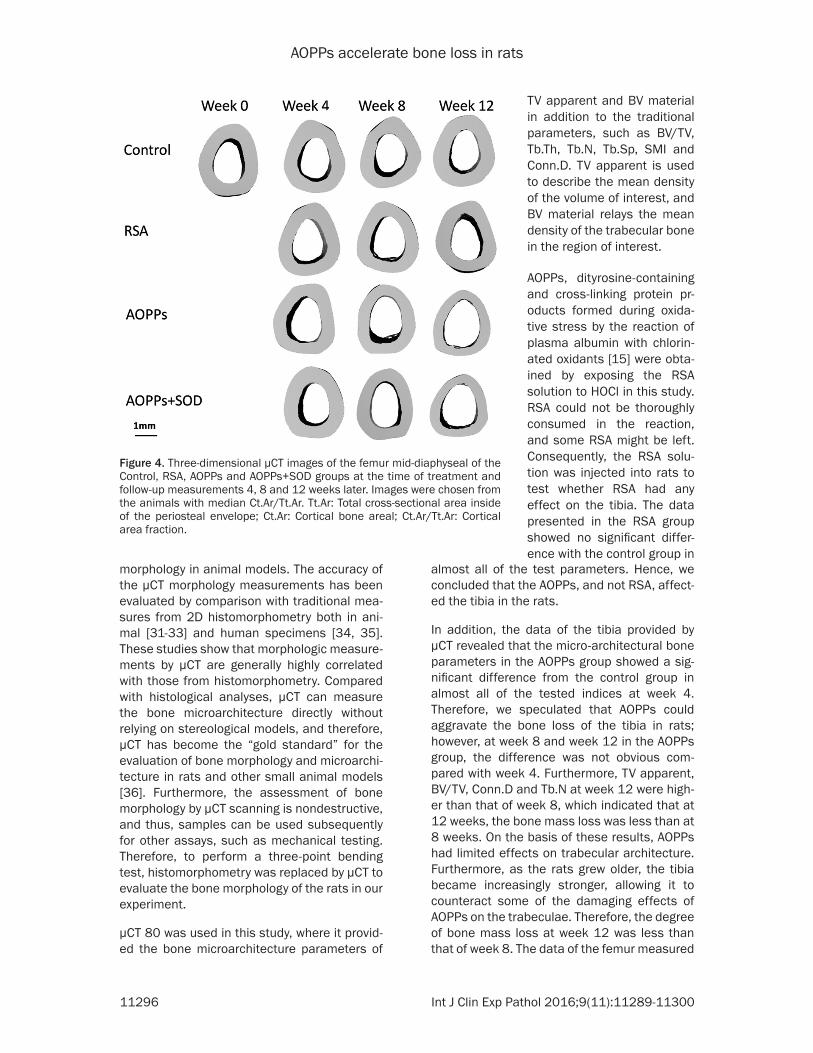
Figure 4. Three-dimensional μCT images of the femur mid-diaphyseal of the Control, RSA, AOPPs and AOPPs+SOD groups at the time of treatment and follow-up measurements 4, 8 and 12 weeks later. Images were chosen from the animals with median Ct.Ar/Tt.Ar. Tt.Ar: Total cross-sectional area inside of the periosteal envelope; Ct.Ar: Cortical bone areal; Ct.Ar/Tt.Ar: Cortical area fraction.
TV apparent and BV material in addition to the traditional parameters, such as BV/TV, Tb.Th, Tb.N, Tb.Sp, SMI and Conn.D. TV apparent is used to describe the mean density of the volume of interest, and BV material relays the mean density of the trabecular bone in the region of interest.
AOPPs, dityrosine-containing and cross-linking protein pr- oducts formed during oxida-tive stress by the reaction of plasma albumin with chlorin- ated oxidants [15] were obta- ined by exposing the RSA solution to HOCl in this study. RSA could not be thoroughly consumed in the reaction, and some RSA might be left. Consequently, the RSA solu-tion was injected into rats to test whether RSA had any effect on the tibia. The data presented in the RSA group showed no significant differ-ence with the control group in
AOPPs accelerate bone loss in rats
11297 Int J Clin Exp Pathol 2016;9(11):11289-11300
by μCT revealed that the cortical bone was more solid than the trabeculae and was not susceptible to AOPPs. The data of the tibia showed that compared with the control group, a significant difference was found in the AOPPs group at week 4, while a significant difference was found at week 12 regarding the femur. On the basis of these results, AOPPs had continu-ous damaging effects on the bone of rats, and thus, AOPPs may play an important role in the development of osteoporosis.
A three-point bending test was adopted in this experiment to evaluate bone strength. At week 8, the tibia treated with AOPPs had a signifi-cantly lower Fmax than the control group. When stiffness was studied, there was a significant difference at week 8 between the AOPPs+SOD group and control group; however, there was no significant difference in energy absorption with-in all four of the groups. In addition, almost no significant difference was found in the three-point bending test regarding the femur. These observations could be due to AOPPs having a limited impact on bone mass loss or because the bone strength was not weakened enough to be detected by the three-point bending test. Furthermore, a large standard deviation of the test subjects may have limited the significant differences found in the three-point bending test.
Osteocalcin, a non-collagenous protein synt- hesized by mature osteoblasts, is generally regarded as a specific marker of bone forma-tion [37, 38], and CTX, a collagen degradation product released by osteoclasts, is considered as a marker of bone resorption [39, 40]. Lerner [41] reported that in postmenopausal osteopo-rosis, bone-resorption as well as bone-forma-tion was increased. Osteocalcin level increases were not due to individual osteoblasts produc-ing more osteocalcin, but rather because of the increasing number of bone-forming osteo-blasts. From Table 2 we can observe that both osteocalcin and CTX were elevated in the AOPPs-treated animals, especially in the AOPPs group. These results suggested that the AOPPs challenge activated both osteoblasts and osteoclasts in rats. Therefore, we believe that the number of active osteoblasts and osteo-clasts was increased by AOPPs, which resulted in the upregulation of osteocalcin in the serum as well as CTX.
SOD is antioxidant enzymes that can convert superoxide to hydrogen peroxide and thus can prevent superoxide accumulation [42]. An inc- rease of AOPPs and MDA and a decrease in SOD has been observed in some pathophysio-logic processes, including aging [43] and post-menopausal bone loss [44]. Our previous study demonstrated that SOD could reverse the AOPPs-induced inhibition of ROB cell prolifera-tion and differentiation in vitro [27], and conse-quently, we hypothesized that SOD could pr- event the occurrence and development of osteoporosis induced by AOPPs. However, in contrast to our supposition, the AOPPs+SOD group did not show any significant difference compared to the AOPPs group in almost all of the experimental results. The effect of AOPPs could be reversed by SOD in vitro, but did not produce the same result in vivo. In addition, some studies reported that SOD also played an important role in bone resorption. Frasr et al [45] reported that the combination of xanthine and xanthine oxidase, which generates super-oxide anions, failed to stimulate bone resorp-tion, except in the presence of SOD, which resulted in a modest increase in bone resorp-tion. Furthermore, Suda et al. [46] found that SOD enhanced the formation of osteoclast-like cells, implying that the generation of H2O2 by SOD from endogenously produced superoxide may play a role in osteoclast formation. Therefore, the exact mechanism of SOD’s effect on AOPPs in vivo requires more investigations.
Conclusion
This study demonstrated that AOPPs increase bone loss in rats and that the progress could not be altered by the antioxidant enzyme, SOD. These results suggest that the serum level of AOPPs might accelerate the development of osteoporosis, which may provide new targets for intervention.
Acknowledgements
This work was supported in part by the National Natural Science Foundation of China (No. 816- 01944 and No. 81272042), Guangdong Natural Science Foundation (No. 2015A030310481), Guangdong Science and Technology Program key projects (N0. 2016A020215100 and No. 2013B021800144).
AOPPs accelerate bone loss in rats
11298 Int J Clin Exp Pathol 2016;9(11):11289-11300
Disclosure of conflict of interest
None.
Address correspondence to: Shuai Zheng and Jian-Ting Chen, Department of Spinal Surgery, Nanfang Hospital, Southern Medical University, 1838 North Guangzhou Avenue, Guangzhou, PR China. Tel: +86-20-61641723; Fax: +86-20-61641721; E-mail: zhe- [email protected] (SZ); [email protected] (JTC)
References
[1] Valli A, Suliman ME, Meert N, Vanholder R, Lindholm B, Stenvinkel P, Watanabe M, Barany P, Alvestrand A, Anderstam B. Overestimation of advanced oxidation protein products in ure-mic plasma due to presence of triglycerides and other endogenous factors. Clin Chim Acta 2007; 379: 87-94.
[2] Garrett IR, Boyce BF, Oreffo RO, Bonewald L, Poser J, Mundy GR. Oxygen-derived free radi-cals stimulate osteoclastic bone resorption in rodent bone in vitro and in vivo. J Clin Invest 1990; 85: 632-639.
[3] Stanojkovic I, Kotur-Stevuljevic J, Milenkovic B, Spasic S, Vujic T, Stefanovic A, Llic A, Ivanisevic J. Pulmonary function, oxidative stress and in-flammatory markers in severe COPD exacerba-tion. Respir Med 2011; 105 Suppl 1: S31-S37.
[4] Zhang Y, Zhong Z, Hou G, Jiang H, Chen J. In-volvement of Oxidative Stress in Age-Related Bone Loss. J Surg Res 2011; 169: e37-e42.
[5] Almeida M, Han L, Martin-Millan M, O’Brien CA, Manolagas SC. Oxidative stress antagoniz-es Wnt signaling in osteoblast precursors by diverting beta-catenin from T cell factor- to forkhead box O-mediated transcription. J Biol Chem 2007; 282: 27298-27305.
[6] Manolagas SC. From estrogen-centric to aging and oxidative stress: a revised perspective of the pathogenesis of osteoporosis. Endocr Rev 2010; 31: 266-300.
[7] Manolagas SC, Parfitt AM. What old means to bone. Trends Endocrinol Metab 2010; 21: 369-374.
[8] Cabiscol E, Piulats E, Echave P, Herrero E, Ros J. Oxidative stress promotes specific protein damage in Saccharomyces cerevisiae. J Biol Chem 2000; 275: 27393-27398.
[9] Karihtala P, Soini Y. Reactive oxygen species and antioxidant mechanisms in human tissues and their relation to malignancies. APMIS 2007; 115: 81-103.
[10] Valentine JS, Wertz DL, Lyons TJ, Liou LL, Goto JJ, Gralla EB. The dark side of dioxygen bio-chemistry. Curr Opin Chem Biol 1998; 2: 253-262.
[11] Almeida M, Ambrogini E, Han L, Manolagas SC, Jilka RL. Increased lipid oxidation causes oxi-dative stress, increased peroxisome prolifera-tor-activated receptor-gamma expression, and diminished pro-osteogenic Wnt signaling in the skeleton. J Biol Chem 2009; 284: 27438-27448.
[13] Piwowar A, Knapik-Kordecka M, Warwas M. AOPP and its relations with selected markers of oxidative/antioxidative system in type 2 dia-betes mellitus. Diabetes Res Clin Pract 2007; 77: 188-192.
[14] Witko-Sarsat V, Friedlander M, Capeillere-Blan-din C, Nguyen-Khoa T, Nguyen AT, Zingraff J, Jungers P, Descamps-Latscha B. Advanced oxi-dation protein products as a novel marker of oxidative stress in uremia. Kidney Int 1996; 49: 1304-1313.
[15] Witko-Sarsat V, Friedlander M, Nguyen KT, Ca-peillere-Blandin C, Nguyen AT, Canteloup S, Dayer JM, Jungers P, Drüeke T, Descamps-Latscha B. Advanced oxidation protein prod-ucts as novel mediators of inflammation and monocyte activation in chronic renal failure. J Immunol 1998; 161: 2524-2532.
[16] Zhou QG, Zhou M, Lou AJ, Xie D, Hou FF. Ad-vanced oxidation protein products induce in-flammatory response and insulin resistance in cultured adipocytes via induction of endoplas-mic reticulum stress. Cell Physiol Biochem 2010; 26: 775-786.
[17] Wei XF, Zhou QG, Hou FF, Liu BY, Liang M. Ad-vanced oxidation protein products induce me-sangial cell perturbation through PKC-depen-dent activation of NADPH oxidase. Am J Physiol Renal Physiol 2009; 296: F427-F437.
[18] Zhou LL, Hou FF, Wang GB, Yang F, Xie D, Wang YP, Tian JW. Accumulation of advanced oxida-tion protein products induces podocyte apop-tosis and deletion through NADPH-dependent mechanisms. Kidney Int 2009; 76: 1148-1160.
[19] Zhou QG, Peng X, Hu LL, Xie D, Zhou M, Hou FF. Advanced oxidation protein products inhibit differentiation and activate inflammation in 3T3-L1 preadipocytes. J Cell Physiol 2010; 225: 42-51.
[20] Guo ZJ, Hou FF, Liu SX, Tian JW, Zhang WR, Xie D, Zhou ZM, Liu ZQ, Zhang X. Picrorhiza scroph-ulariiflora improves accelerated atherosclero-sis through inhibition of redox-sensitive inflam-mation. Int J Cardiol 2009; 136: 315-324.
[21] Baskol G, Demir H, Baskol M, Kilic E, Ates F, Karakukcu C, Ustdal M. Investigation of protein oxidation and lipid peroxidation in patients
11299 Int J Clin Exp Pathol 2016;9(11):11289-11300
with rheumatoid arthritis. Cell Biochem Funct 2006; 24: 307-311.
[22] Yang XB, Hou FF, Wu Q, Zhou H, Liu ZR, Yang Y, Zhang X. [Increased levels of advanced oxida-tion protein products are associated with ath-erosclerosis in chronic kidney disease]. Zhong-hua Nei Ke Za Zhi 2005; 44: 342-346.
[23] Montagnani A, Gonnelli S, Alessandri M, Nuti R. Osteoporosis and risk of fracture in patients with diabetes: an update. Aging Clin Exp Res 2011; 23: 84-90.
[24] Sambrook PN. The skeleton in rheumatoid ar-thritis: common mechanisms for bone erosion and osteoporosis? J Rheumatol 2000; 27: 2541-2542.
[25] Stehman-Breen C. Osteoporosis and chronic kidney disease. Semin Nephrol 2004; 24: 78-81.
[26] Cunningham J, Sprague SM, Cannata-Andia J, Coco M, Cohen-Solal M, Fitzpatrick L, Goltz- mann D, Lafage-Proust MH, Leonard M, Ott S, Rodriguez M, Stehman-Breen C, Stern P, Weis-inger J; Osteoporosis Work Group. Osteoporo-sis in chronic kidney disease. Am J Kidney Dis 2004; 43: 566-571.
[27] Zhong ZM, Bai L, Chen JT. Advanced oxidation protein products inhibit proliferation and differ-entiation of rat osteoblast-like cells via NF-kap-paB pathway. Cell Physiol Biochem 2009; 24: 105-114.
[28] Li HY, Hou FF, Zhang X, Chen PY, Liu SX, Feng JX, Liu ZQ, Shan YX, Wang GB, Zhou ZM, Tian JW, Xie D. Advanced oxidation protein products accelerate renal fibrosis in a remnant kidney model. J Am Soc Nephrol 2007; 18: 528-538.
[29] Kohler T, Beyeler M, Webster D, Muller R. Com-partmental bone morphometry in the mouse femur: reproducibility and resolution depen-dence of microtomographic measurements. Calcif Tissue Int 2005; 77: 281-290.
[30] Sturmer EK, Seidlova-Wuttke D, Sehmisch S, Rack T, Wille J, Frosch KH, Wuttke W, Stürmer KM. Standardized bending and breaking test for the normal and osteoporotic metaphyseal tibias of the rat: effect of estradiol, testoster-one, and raloxifene. J Bone Miner Res 2006; 21: 89-96.
[31] Alexander JM, Bab I, Fish S, Muller R, Uchiya-ma T, Gronowicz G, Nahounou M, Zhao Q, White DW, Chorev M, Gazit D, Rosenblatt M. Human parathyroid hormone 1-34 reverses bone loss in ovariectomized mice. J Bone Min-er Res 2001; 16: 1665-1673.
[32] Waarsing JH, Day JS, Weinans H. An improved segmentation method for in vivo microCT im-aging. J Bone Miner Res 2004; 19: 1640-1650.
[33] Bonnet N, Laroche N, Vico L, Dolleans E, Cour-teix D, Benhamou CL. Assessment of trabecu-
lar bone microarchitecture by two different x-ray microcomputed tomographs: a comparative study of the rat distal tibia using Skyscan and Scanco devices. Med Phys 2009; 36: 1286-1297.
[34] Chappard D, Retailleau-Gaborit N, Legrand E, Basle MF, Audran M. Comparison insight bone measurements by histomorphometry and mi-croCT. J Bone Miner Res 2005; 20: 1177-1184.
[35] Akhter MP, Lappe JM, Davies KM, Recker RR. Transmenopausal changes in the trabecular bone structure. Bone 2007; 41: 111-116.
[36] Bouxsein ML, Boyd SK, Christiansen BA, Guld-berg RE, Jepsen KJ, Müller R. Guidelines for assessment of bone microstructure in rodents using micro-computed tomography. J Bone Miner Res 2010; 25: 1468-1486.
[37] Akesson K, Ljunghall S, Jonsson B, Sernbo I, Johnell O, Gärdsell P, Obrant KJ. Assessment of biochemical markers of bone metabolism in relation to the occurrence of fracture: a retro-spective and prospective population-based study of women. J Bone Miner Res 1995; 10: 1823-1829.
[38] Valimaki MJ, Farrerons-Minguella J, Halse J, Kroger H, Maroni M, Mulder H, Muñoz-Torres M, Sääf M, Snorre Øfjord E. Effects of risedro-nate 5 mg/d on bone mineral density and bone turnover markers in late-postmenopaus-al women with osteopenia: a multinational, 24-month, randomized, double-blind, placebo-controlled, parallel-group, phase III trial. Clin Ther 2007; 29: 1937-1949.
[39] Calvo MS, Eyre DR, Gundberg CM. Molecular basis and clinical application of biological markers of bone turnover. Endocr Rev 1996; 17: 333-368.
[40] Rosen HN, Moses AC, Garber J, Iloputaife ID, Ross DS, Lee SL, Greenspan SL. Serum CTX: a new marker of bone resorption that shows treatment effect more often than other mark-ers because of low coefficient of variability and large changes with bisphosphonate therapy. Calcif Tissue Int 2000; 66: 100-103.
[41] Lerner UH. Bone remodeling in post-meno-pausal osteoporosis. J Dent Res 2006; 85: 584-595.
[42] Keller JN, Kindy MS, Holtsberg FW, St CD, Yen HC, Germeyer A, Steiner SM, Bruce-Keller AJ, Hutchins JB, Mattson MP. Mitochondrial man-ganese superoxide dismutase prevents neural apoptosis and reduces ischemic brain injury: suppression of peroxynitrite production, lipid peroxidation, and mitochondrial dysfunction. J Neurosci 1998; 18: 687-697.
[43] Linnane AW, Eastwood H. Cellular redox regu-lation and prooxidant signaling systems: a new
AOPPs accelerate bone loss in rats
11300 Int J Clin Exp Pathol 2016;9(11):11289-11300
perspective on the free radical theory of aging. Ann N Y Acad Sci 2006; 1067: 47-55.
[44] Sendur OF, Turan Y, Tastaban E, Serter M. Anti-oxidant status in patients with osteoporosis: a controlled study. Joint Bone Spine 2009; 76: 514-518.
[45] Fraser JH, Helfrich MH, Wallace HM, Ralston SH. Hydrogen peroxide, but not superoxide, stimulates bone resorption in mouse calvari-ae. Bone 1996; 19: 223-226.
[46] Suda N, Morita I, Kuroda T, Murota S. Participa-tion of oxidative stress in the process of osteo-clast differentiation. Biochim Biophys Acta 1993; 1157: 318-323.