Human Thermal Comfort and its Analysis Yadeta et al. 102 ORIGINAL ARTICLE Human Thermal Comfort and Its Analysis by Computational Fluid Dynamics for Naturally Ventilated Residential Buildings of Jimma Town, South West Ethiopia Chali Yadeta 1* , Gudina Terefe Tucho 2 , Eshetu Tadesse 3 , Esayas Alemayehu 4 1 Department of Physics, College of Natural Sciences, Jimma University, Ethiopia; 2 Department of Environmental Health Sciences and Technology, Jimma University, Ethiopia; 3 Faculty of Mechanical Engineering, Jimma University, Ethiopia; 4 Faculty of Civil and Environmental Engineering, Jimma University, Ethiopia *Corresponding Author: [email protected]ABSTRACT Human thermal comfort level investigation was made in naturally ventilated residential house of warm temperate oceanic climate of Ethiopia – Jimma town. Thermal variables (air temperature, wind speed and relative humidity) of purposely selected brick wall and wooden wall residential buildings were measured. Analysis was made using SPSS (version 20) statistical software and compared with thermal comfort standard (ASHRAE standard 55-2004). Computational fluid dynamics (CFD) with its fluent software was used to visualize the temperature distribution and air speed pattern in the residential buildings. The thermal comfort in the buildings was found outside the limits specified in the set standard. The result shows that residential houses in Jimma Town generate thermal discomfort to their residents due to their improper designing and construction. The CFD simulation suggests the use of adaptive mechanisms such as opening windows, changing cloths, and internal window insulation to improve indoor thermal comfort level of residential buildings in Jimma town. Setting indoor thermal comfort by adaptive mechanism is a means to conserve final energy as it is environmentally friendly and generates no toxic substances. Thus, it is recommended that all stakeholders including architects, engineers and environmentalists should work collaboratively in designing residential houses, with better natural ventilation are thermally comfortable to their residents. Keywords: Air movement; Air temperature; Computational Fluid Dynamics (CFD); Residential buildings; Thermal comfort _________________________________________________________________________ INTRODUCTION Thermal comfort is the state of mind that expresses satisfaction with thermal environment (Eduardo and Juarez, 2014). Thermal comfort can be maintained when the heat generated by human metabolism is
Transcript
Human Thermal Comfort and its Analysis Yadeta et al. 102
ORIGINAL ARTICLE
Human Thermal Comfort and Its Analysis by Computational Fluid Dynamics for Naturally Ventilated
Residential Buildings of Jimma Town, South West Ethiopia
1Department of Physics, College of Natural Sciences, Jimma University, Ethiopia; 2 Department of Environmental Health Sciences and Technology, Jimma University, Ethiopia; 3Faculty of Mechanical Engineering, Jimma University, Ethiopia; 4Faculty of Civil and Environmental Engineering,
ABSTRACT Human thermal comfort level investigation was made in naturally ventilated residential house of warm temperate oceanic climate of Ethiopia – Jimma town. Thermal variables (air temperature, wind speed and relative humidity) of purposely selected brick wall and wooden wall residential buildings were measured. Analysis was made using SPSS (version 20) statistical software and compared with thermal comfort standard (ASHRAE standard 55-2004). Computational fluid dynamics (CFD) with its fluent software was used to visualize the temperature distribution and air speed pattern in the residential buildings. The thermal comfort in the buildings was found outside the limits specified in the set standard. The result shows that residential houses in Jimma Town generate thermal discomfort to their residents due to their improper designing and construction. The CFD simulation suggests the use of adaptive mechanisms such as opening windows, changing cloths, and internal window insulation to improve indoor thermal comfort level of residential buildings in Jimma town. Setting indoor thermal comfort by adaptive mechanism is a means to conserve final energy as it is environmentally friendly and generates no toxic substances. Thus, it is recommended that all stakeholders including architects, engineers and environmentalists should work collaboratively in designing residential houses, with better natural ventilation are thermally comfortable to their residents.
Keywords: Air movement; Air temperature; Computational Fluid Dynamics (CFD); Residential buildings; Thermal comfort
allowed to dissipate making a person in thermal equilibrium with the surroundings. Any heat gain or loss beyond the normal level generates a sense of thermal discomfort in buildings (Romana et al., 2014). Thermal discomfort in buildings generates sick building symptoms like head ache, heat stroke, dehydration, diseases related to breathing systems, etc. These health symptoms ultimately reduce the productivity level and well-beings of inhabitants of the buildings, and the public at large (Jamei et al., 2016; Lu et al., 2018).
Human sensation of feeling hot or cold in a building is mainly affected and expressed in terms of environmental factors (air temperature, air speed, mean radiant temperature and relative humidity) and personal factors (clothing insulation, metabolic rate or activity level) (Rupp et al., 2015). In tropical climate, thermal comfort becomes the main problem to the occupants for the fact that many residential buildings have no proper ventilation systems. Most residential buildings in tropical climate regions are naturally ventilated and have the potential to provide significant energy savings as compared to mechanically ventilated buildings while maintaining good indoor air quality and thermal comfort at the same time (Deng et al., 2017).
The effectiveness of natural ventilation in a building is usually influenced by a combination of internal factors (e.g. floor layout, opening configuration) and external factors (e.g. urban form, building typology). A number of studies have indicated that configuration of windows is one of the most influential factors driven by wind pressure differences and by buoyant force (Prakash and Ravikumar, 2015; Deng et al., 2017; Tan and Deng, 2017).
Indoor thermal environment studies are part of indoor environmental quality assessment studies. Indoor thermal comfort studies target identifying the parameter that affects human thermal comfort in the existing climatic condition and psychological setups. Different countries made series of thermal comfort studies to identify the degree at which thermal variables affect human thermal comfort under specific climatic conditions (Yanget al., 2014). Most thermal comfort studies were conducted in developed countries but in developing countries, the studies are not far from the awareness creation stage (Subramanian et al., 2017).
In most developing countries, like Ethiopia, there are no thermal comfort studies with respect to climate change, energy conservation, or contribution to human health and well-being. Indoor thermal comfort studies in various climate scenarios enable the citizens to identify setups that could make them thermally comfortable, wellbeing and productive in the indoor environments. The findings of this study create awareness about the importance of indoor environmental studies and may motivate researchers to undertake different indoor thermal comfort studies hereafter.
METHODOLOGY
Description of the study area This study was conducted in Jimma town. Jimma is one of the largest and historic towns in the south-west part of Ethiopia. It is located at 7o40‟N latitude and 36o50‟E longitude at 1780 m above sea level (Seifu and Záhořík, 2018). The town hosts about 120,690 peoples in about 30,016 housing units. Jimma town has warm temperate oceanic climate (cfb) according to Köppen climate classification with the long annual wet season from March to October. Temperature varies between the dry and
Human Thermal Comfort and its Analysis Yadeta et al. 104 wet seasons, with a considerable variation on a daily basis ranging between10°C to 30°C, or sometimes above (Peel et al., 2007; Seifu and Záhořík, 2018).
Description of the studied residential buildings
The residential buildings found in the town are made of wooden (88%), local bricks (6%) and others (6%). All these residential buildings have no mechanical devices for indoor ventilation. Most buildings have three rooms (living, bed and store/kitchen) (CSA 2007). The residential buildings in the area were constructed from materials of emissivity of nearly 0 -1(El-darwish and El-gendy, 2018) value in which their emission of thermal radiations into the inner space is negligible. Hence we approximated the value of mean radiant temperature to be similar in both building types and rooms in them (Walikewitz et al., 2015). For this study, two similar residential buildings, with nearly the same size and the same orientation, were identified. They differ by their wall types: one brick wall, and the other mud and wood wall. Their floors are plastered and cemented. They are V-shaped; east-west oriented, and has a total surface area of 45-47 m2 each. Their two front and one back side windows are operable and with frames made of metal and covered by glass. The brick and mud wall buildings considered in this study represent more than 65% of residential buildings of Jimma town based on their building materials, number of rooms, and the number of windows they had (Abelti et al., 2001). The back isomeric view of the selected residential building is as shown below (Figure 1).
Figure 1. Back isometric view of the selected residential building Data collection and analysis Actual measurements of indoor air temperature, relative humidity, and wind speed were undertaken by digital thermometer and anemometer. The measurement of thermal variables in the building was done for five consecutive days on February 15-19, 2019 from 6:00 a.m. to 6:00 p.m. The thermal variables were measured at location where one can observe their effects on thermal comfort. The comparison was made between the average values of the measured air temperature, relative humidity, and airspeed in the residential buildings with the upper and lower limits of ASHRAE thermal comfort standard. The acceptable values of air temperature, relative humidity, and air speed acceptable at indoor environment are 22°C – 26°C, 30%-60%, and 0.8m/s-1.2m/s, respectively (ASHRAE 2004). Out of all the measurement days, data taken on Sunday, 17 February, 2019, were analyzed separately to compare with CFD simulation analysis. As Sunday is not working day, we find most occupants' performing various control measures to set their indoor thermal comfortable. Due to difficulty of finding the standardized measurements, CFD/ ANSYS analysis was applied on burnt brick wall building to describe the effect of occupants' actions on setting indoor thermal comfort.
The residential building considered for this study was modeled by Analysis System Simulation (ANSYS) in the Computational Fluid Dynamics (CFD) software(Tap et al., 2011). After modeling the geometry of fluid domain for the simulation, the 3D model was discretized into smaller segments called mesh or grid that are defined as a discrete cell or elements into which the domain/ model is divided. After meshing, the boundary conditions and solver parameters are set as per the orientation of the residential buildings. All physics and thermal setups for simulation were done in the solver setting and the output parameters to be displayed on results were adjusted.
RESULT AND DISCUSSION Thermal Comfort Study of a Residential House The maximum and minimum outdoor temperature, recorded on the data collection date, were 29.4oC and 11.4oC, respectively. The relative humidity of the air was about 72% with calm wind in reverse and forward directions (NMA, 2018). Summary of measured air temperature, relative humidity, and air-speed at three rooms of the residential buildings are as given in Tables 1 and 2.
Table 1: Mean air temperature, relative humidity, and air speed in brick wall residence (number of measurements, n= 7x5x3x3 = 315).
In residential buildings of a brick wall, the living room temperature and air speed are in the acceptable limits of the standard from 6:00 am to 10:00 am in the morning and at 6:00 pm in the evening (Table 1). The relative humidity in the living room has a value greater than acceptable standard from 6:00 am to 10:00 am. The air speed at this time is almost calm and below the standard and still below the standard then after. The temperature in the bedroom is in the acceptable range from early 6:00 am up to 2:00 pm and becomes out of the standard range then after. The relative humidity in the bedroom is in the acceptable range at all times. The air speed in the bedroom was
very low; and from 6:00 to 8:00 am it was very calm followed by near acceptable lower range of the standard. The temperature in the store/kitchen room is only in comfort range up to 8:00 am in the morning and higher than the standard in the other times. The relative humidity in the kitchen area was in the acceptable range but it has higher value at 10:00am in the afternoon. The average value of air speed in the kitchen has an average value of very lower than the standard from 6:00 am to 10:00 am. At other times, the values were still below the lower limit of the standard but not as such so calm. This implies that the living room stays comfortable only in
Human Thermal Comfort and its Analysis Yadeta et al. 106 the morning and evening for a short period of time compared to other rooms.
Table 2: Mean air temperature, relative humidity, and air speed in mud and wood wall residence (number of measurements, n= 7x5x3x3 = 315).
At the living room of mud and wood wall residential building, the measured air temperature is below the ASHRAE standard from 6.00 am -10.00 am (Table 2). In the other measuring times, the average air temperature is acceptable in the living room. The relative humidity in the living room is above the limit of an acceptable standard at all times. The air speed in the living room is calm and much below standard from 6.00 am to 10.00 am and below the standard value at the other times of measurement. The air temperature in the bedroom is below the minimum value from 6:00 am to 8:00 am but it is above the maximum standard value at 2:00 pm in the afternoon. The relative humidity in the bedroom is above the standard value from 6:00 am to 12:00 am but in a time of 2:00 pm to 6:00 pm, it is in the limit of acceptability in the standard. At other times, at bedroom and kitchen, the average air speeds are below the minimum standard for acceptability.
The residential buildings in this study are naturally ventilated by using operable windows and doors. As observed during the measurement, the windows are open only for a short period of time in a day, between 11:00 am and 1:30 pm, and it accounted for the low air speed and an increase in air temperature. It also affects the relative humidity in the buildings. With East-West orientation of buildings and the strong solar radiations in the region, the incoming radiation to the buildings has a capacity to increase the air temperature as the surrounding air is calm and the existence of no sufficient vegetation around the buildings. On the other hand, closing the windows and other inlets to protect direct fall of solar radiations into the interior space avoided the passage, and outward flow making burnt air to stay indoors and increased the indoor air temperature (Huizenga 2000). We examined the acceptability of the thermal variables with respect to the stated thermal comfort standard and described the ranges for the separate variables. But human thermal comfort sensation, in residential buildings, is from cumulative
effect of each variable (Van Hoof et al., 2010). A person feels thermal discomfort when either of the thermal variables enters outside the range of acceptability. As a solution, people should be able to control the indoor thermal environment by simple natural means. To exactly identify the effects and describe possible means to overcome the indoor thermal discomfort coming from each variable separately or in combination, the study continued on simulation study and used it to make general conclusion and recommendations. The simulation study examines the effect of human control in residential buildings to fix temperature and relative humidity of the buildings in the acceptable range, and to examine the influence of air speed on other similar kinds of brick wall residential buildings found in the town. We simulated the brick wall residential buildings by software called CFD-ANSYS(Nilsson and Holmér, 2003). Brick wall residential
building is selected for the simulation study as it is simple to identify the properties of materials used in the construction. The simulation study describes the air velocity pattern, air temperature distributions and wall flux at various setups. Modeling of the residential building The boundary conditions used in CFD simulations for the residential buildings in terms of various parameters are summarized in Table 6. The air inlet, pressure, solar radiation, and ambient temperature values were taken from National Meteorology Agency, Jimma Branch (NMA 2018) and from SWERA data for adiabatic ground floor (Mekonnen, 2007).The simulation is done for clay brick wall residential building as its building materials have proper specification and values in the selected CFD analysis software.
Table 3: Boundary conditions used in CFD simulations of the residential building
Boundary parameters Boundary Condition Values Air inlet 1.2 m/s, 23°C Pressure 1atm. Solar radiation 780 KW/m2
Ambient (atmospheric) Temperatures 23°C
Ground floor Adiabatic
The residential buildings have no store room, constructed with local materials of low durability and without scientific specification as they are built by non-professionals. Table 4 describes some dimensional values measured in the selected residential buildings to be used for modeling.
Hum
an T
herm
al C
omfo
rt an
d its
Ana
lysi
s
Yad
eta
et a
l.
1
08
T
able
4: D
imen
sion
s of t
he ro
om (d
esig
n pa
ram
eter
s)
The
CFD
mod
els o
f the
resi
dent
ial b
uild
ings
wer
e de
velo
ped
in th
e st
udy
and
the
mod
els r
epre
sent
the
build
ings
with
nat
ural
ven
tilat
ion
mod
e. T
he C
FD
sim
ulat
ions
wer
e pe
rfor
med
on
thes
e m
odel
s to
inve
stig
ate
the
dist
ribut
ion
for a
ir te
mpe
ratu
re a
nd a
ir ve
loci
ty in
side
the
build
ing
for t
he g
iven
ven
tilat
ion
cond
ition
s (Fi
gure
2).
Hei
ght
(m)
Wid
th(m
) Le
ngth
(m
) D
oor a
rea
(m m
) W
indo
w
area
(m m
) W
ind
ows
Win
dow
m
ater
ials
Ex
tern
al
door
s A
vera
ge
no o
f oc
cupa
nts
Elec
tric
appl
ianc
es
2.95
7
7
3
LTZ,
6m
thic
k cl
ear
louv
er
glas
s
2 (m
etal
sh
eets
) 6
3 flo
resc
ent
lam
ps
Human Thermal Comfort and its Analysis Yadeta et al. 108 Table4: Dimensions of the room (design parameters)
The CFD models of the residential buildings were developed in the study and the models represent the buildings with natural ventilation mode. The CFD
simulations were performed on these models to investigate the distribution for air temperature and air velocity inside the building for the given ventilation
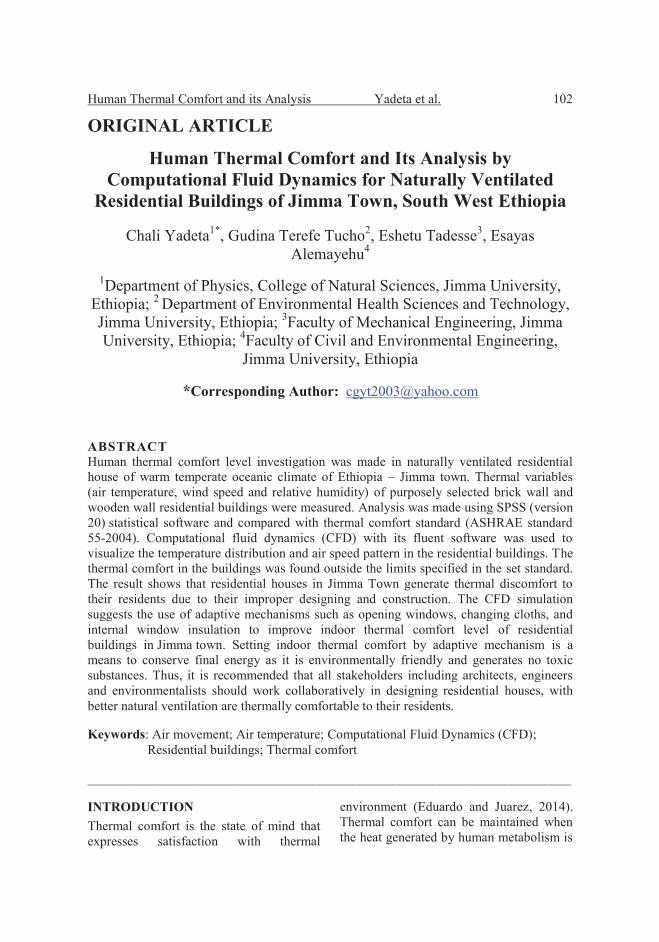
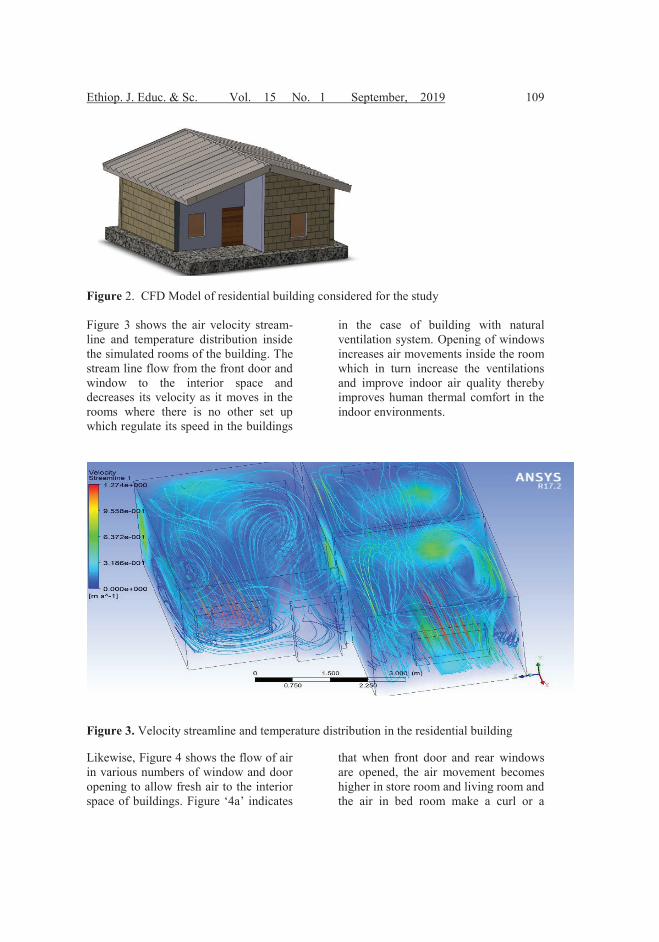
Figure 2. CFD Model of residential building considered for the study Figure 3 shows the air velocity stream-line and temperature distribution inside the simulated rooms of the building. The stream line flow from the front door and window to the interior space and decreases its velocity as it moves in the rooms where there is no other set up which regulate its speed in the buildings
in the case of building with natural ventilation system. Opening of windows increases air movements inside the room which in turn increase the ventilations and improve indoor air quality thereby improves human thermal comfort in the indoor environments.
Figure 3. Velocity streamline and temperature distribution in the residential building
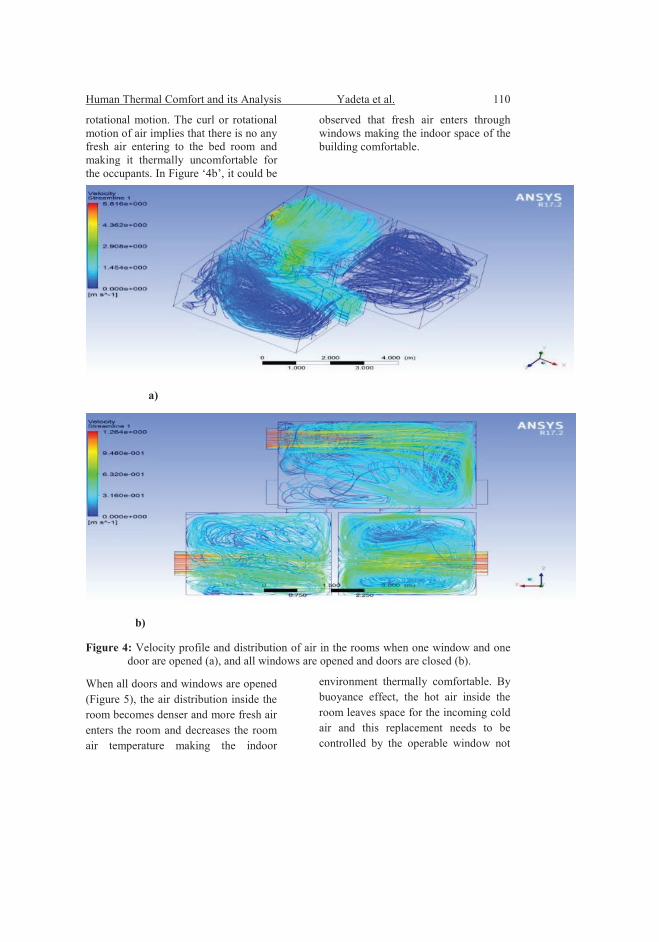
Likewise, Figure 4 shows the flow of air in various numbers of window and door opening to allow fresh air to the interior space of buildings. Figure „4a‟ indicates
that when front door and rear windows are opened, the air movement becomes higher in store room and living room and the air in bed room make a curl or a
Human Thermal Comfort and its Analysis Yadeta et al. 110 rotational motion. The curl or rotational motion of air implies that there is no any fresh air entering to the bed room and making it thermally uncomfortable for the occupants. In Figure „4b‟, it could be
observed that fresh air enters through windows making the indoor space of the building comfortable.
a)
b)
Figure 4: Velocity profile and distribution of air in the rooms when one window and one door are opened (a), and all windows are opened and doors are closed (b).
When all doors and windows are opened (Figure 5), the air distribution inside the room becomes denser and more fresh air enters the room and decreases the room air temperature making the indoor
environment thermally comfortable. By buoyance effect, the hot air inside the room leaves space for the incoming cold air and this replacement needs to be controlled by the operable window not
to generate another thermal discomfort due to high amount of cold air (Hussain
and Oosthuizen, 2012).
Figure 5 Air velocity streamline inside the room for different windows and doors openings
Figure 6 shows airflow and distribution inside the rooms of the studied residential buildings in the various window and door openings showing similar effects. Hence, window and door size openings must supply sufficient amount of air ventilation
with an appropriate temperature for the residential building.
Figure 6 The Volume rendering view of air flow and distribution inside the room for different doors and windows openings.
Human Thermal Comfort and its Analysis Yadeta et al. 112 Figure 7 shows temperature distribution of the room on vertical plane and wall adjacent of the building (i.e. the temperature variation from top to bottom of the room). Figure 7a shows the room temperature distribution on vertical plane. The temperature gradient on the wall increases in vertical plane as we go from ground to roof (i.e. from bottom to upper surface of the room), the temperature of the
room increases due to solar radiation coming from the sun and that enters the room through roof and it becomes strong when the roof material is highly heat conductive. Figure 7b shows the air temperature distribution on the wall, the heat on the wall near the windows and doors becomes small due to the latent heat and the atmospheric air-cooling effects on wall through the windows and doors.
(a)
(b)
Figure 7 Temperature distribution of the room on vertical plane (a), and wall adjacent (b)
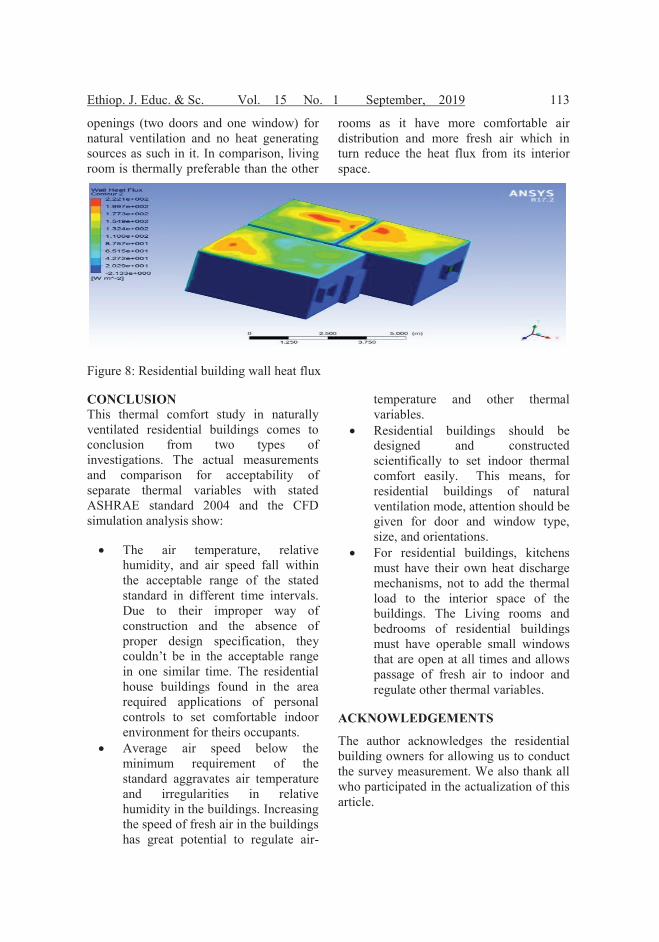
Figure 8: represents the heat flux (transfer) through all partitions of the building rooms. As shown in the simulation, the heat flux through the store/kitchen room was high, this is due to the combined effect of presence of high heat gain of cooking medias, high heat coming through roof and
lack of proper window sizes for natural ventilation as it contains maximum heat in it and requires large amount of fresh air continuously to stabilize the high heat flux in it. The heat flux in living room was lower than the bed room and store rooms. The living room contains large number of
openings (two doors and one window) for natural ventilation and no heat generating sources as such in it. In comparison, living room is thermally preferable than the other
rooms as it have more comfortable air distribution and more fresh air which in turn reduce the heat flux from its interior space.
Figure 8: Residential building wall heat flux
CONCLUSION This thermal comfort study in naturally ventilated residential buildings comes to conclusion from two types of investigations. The actual measurements and comparison for acceptability of separate thermal variables with stated ASHRAE standard 2004 and the CFD simulation analysis show:
The air temperature, relative humidity, and air speed fall within the acceptable range of the stated standard in different time intervals. Due to their improper way of construction and the absence of proper design specification, they couldn‟t be in the acceptable range in one similar time. The residential house buildings found in the area required applications of personal controls to set comfortable indoor environment for theirs occupants.
Average air speed below the minimum requirement of the standard aggravates air temperature and irregularities in relative humidity in the buildings. Increasing the speed of fresh air in the buildings has great potential to regulate air-
temperature and other thermal variables.
Residential buildings should be designed and constructed scientifically to set indoor thermal comfort easily. This means, for residential buildings of natural ventilation mode, attention should be given for door and window type, size, and orientations.
For residential buildings, kitchens must have their own heat discharge mechanisms, not to add the thermal load to the interior space of the buildings. The Living rooms and bedrooms of residential buildings must have operable small windows that are open at all times and allows passage of fresh air to indoor and regulate other thermal variables.
ACKNOWLEDGEMENTS
The author acknowledges the residential building owners for allowing us to conduct the survey measurement. We also thank all who participated in the actualization of this article.
Human Thermal Comfort and its Analysis Yadeta et al. 114 REFERENCES ASHRAE (2004). “Ashrae Standard
Thermal Environmental Conditions for Human Occupancy 55-2004.” ASHRAE 2004 (5): 1–27.
CSA (2007). House and Population Census of Ethiopia. Addis Ababa, Ethiopia.
Deng, X., Paul C., Zhenjun, M., and Georgios, K. (2017). “Numerical Analysis of Indoor Thermal Comfort in a Cross-Ventilated Space with Top-Hung Windows.” Energy Procedia, 121: 222–29. http://dx.doi.org/10.1016/j.egypro.2017.08.021.
Eduardo, C., and Mora, J. (2014). “Impact of Thermal Mass on Energy and Comfort.” MSc Thesis, Chalmers University of Technology, Göteborg, Sweden.
El-darwish, I.I., and Rana, A. El-gendy (2018).“Post Occupancy Evalu-ation of Thermal Comfort in Higher Educational Buildings in a Hot Arid Climate.” Alexandria Engineering Journal, 57(4): 3167–77.
Abeltim G., Brazzoduro, M. and Gebremedhin, B. (2001). Housing conditions and demand for housing in urban Ethiopia. Report on “In-Depth Studies from the 1994 Population and Housing Census in Ethiopia Italian Multi-Bi Research Project ETH/92/P01”.
van Hoof, J., Mitja M., and Jan L.M. H. (2010). “Thermal Comfort: Research and Practice.” Frontiers in Bioscience 15(2): 765–88.
Hooi, D. and Chyee, T. (2013). “Application of Passive Cooling Techniques to Improve Indoor Thermal Comfort of Modern Urban Houses in Hot-Humid
Climate of Malaysia.” Department of Medicine, Faculty of Medicine, University of Malaya.
Huizenga, C. (2000). “Window Perfor-mance for Human Thermal Comfor.” In: ASHRAE Winter Meeting, 1–14.
Jamei, E., Priyadarsini, R., Moham-madmehdi, S., and Yashar, J. (2016). “Review on the Impact of Urban Geometry and Pedestrian Level Greening on Outdoor Thermal Comfort.” Renewable and Sustainable Energy Reviews, 54(2016): 1002–17. http://dx.doi.org/10.1016/j.rser.2015.10.104.
Lu, S., Bo, P., Yunfang, Q., and Kun, F. (2018). “Field Study of Thermal Comfort in Non-Air-Conditioned Buildings in a Tropical Island Climate.” Applied Ergonomics, 66(2018): 89–97.
Mekonnen, S. A. (2007). “Solar Energy Assessment in Ethiopia:Modelling and Measurement.” MSc Thesis, Addis Ababa University, Addis Ababa.
Mishra, A.K., and Maddali, R. (2013). “Field Studies on Human Thermal Comfort - An Overview.” Build-ing and Environment , 64(April 2016): 94–106. http://dx.doi.org /10.1016/j.buildenv.2013.02.015.
Nilsson, H. O., and Holmér, I. (2003). 13 Indoor Air Comfort Climate Evaluation with Thermal Manikin Methods and Computer Simulation Models. Indoor Air.13 (1):28-37.
NMA. (2018). National Metrology Ageny of Ethiopia. [email protected]. Pdf.
Peel, M.C, Finlayson, B.L. and McMahon, T.A.(2007). “Updated World Map of the Köppen Geiger Climate Classification.” Hydrol. Earth
Systm. Sci. Discuss, 4: 439–73. Prakash, D., and Ravikumar, P. (2015).
“Analysis of Thermal Comfort and Indoor Air Flow Characteristics for a Residential Building Room under Generalized Window Opening Position at the Adjacent Walls.” International Journal of Sustainable Built Environment, 4(1): 42–57.
Romana, F., Bjarne, W., Olesen, B.I., and Giuseppe, R. (2014). “Thermal Comfort : Design and Assessment for Energy Saving.” Energy & Buildings, 81: 326–36. http://dx. doi.org/10.1016/j.enbuild.2014.06.033.
Rupp, R.F., Natalia, G.V., and Roberto, L. (2015). Thermal Comfort in the Built Environment.” Energy and Buildings, 105(2015): 178–205.
Seifu, Y. and Jan, Z. (2018). “Jimma Town: Foundation and Early Growth from ca. 1830 to 1936.” Ethnologia Actualis, 17(2): 46–63. https://www.degruyter.com /downloadpdf/j/eas.2017.17.issue-2/eas-2018-0003/eas-2018-0003.pdf.
Subramanian, C. V., Ramachandran, N. and Kumar, S.S. (2017). “Areview
of Passing Cooling Architectural Design Interventions for Thermal Comfort in Residential Build-ings.” Indian J.Sci.Res., 14(1): 163–72.
Tan, Z. and Xiang, D. (2017). “Assessment of Natural Ventilation Potential for Residential Buildings across Different Climate Zones in Australia.” Atmosphere, 8(9): 3-5.
Tap, M. Md., Kamar, H. M., Marsono, A. K., Kamsah, N., Amry, K. and Salimin, M. (2011). “Simulation of Thermal Comfort of a Residential House.” International Journal of Computer Science, 8(5): 200–208.
Walikewitz, N., Jeanicke, B., Langner, M. and Meier, F. (2015). “The Difference between the Mean Radiant Temperature and the Air Temperature within Indoor Environments: A Case Study during Summer Conditions.” Building and Environment, 84: 151–61.
Yang, L., Haiyan, Y. and Joseph, C. L. (2014). “Thermal Comfort and Building Energy Consumption Implications - A Review.” Applied Energy, 115: 164–73.