Background: To analyze the factors associated with women's vasomotor symptoms (VMS) using machine learning.Methods: Data on 3,298 women, aged 40–80 years, who attended their general health check-up from January 2010 to December 2012 were obtained from Korea University Anam Hospital in Seoul, Korea. Five machine learning methods were applied and compared for the prediction of VMS, measured by the Menopause Rating Scale. Variable importance, the effect of a variable on model performance, was used for identifying the major factors associated with VMS.Results: In terms of the mean squared error, the random forest (0.9326) was much better than linear regression (12.4856) and artificial neural networks with one, two, and three hidden layers (1.5576, 1.5184, and 1.5833, respectively). Based on the variable importance from the random forest, the most important factors associated with VMS were age, menopause age, thyroid-stimulating hormone, and monocyte, triglyceride, gamma glutamyl transferase, blood urea nitrogen, cancer antigen 19-9, C-reactive protein, and low-density lipoprotein cholesterol levels. Indeed, the following variables were ranked within the top 20 in terms of variable importance: cancer antigen 125, total cholesterol, insulin, free thyroxine, forced vital capacity, alanine aminotransferase, forced expired volume in 1 second, height, homeostatic model assessment for insulin resistance, and carcinoembryonic antigen.Conclusion: Machine learning provides an invaluable decision support system for the prediction of VMS. For managing VMS, comprehensive consideration is needed regarding thyroid function, lipid profile, liver function, inflammation markers, insulin resistance, monocyte count, cancer antigens, and lung function.
Keywords: Vasomotor Symptoms; Hot Flashes; Menopause Age; Thyroid Stimulating Hormone; Monocyte; Cancer Antigen
INTRODUCTION
Vasomotor symptoms (VMS), referring to hot flashes and sweating, are major symptoms of peri-menopausal and post-menopausal women and a main cause of their hospital visit.1 Once
J Korean Med Sci. 2021 May 3;36(17):e122https://doi.org/10.3346/jkms.2021.36.e122eISSN 1598-6357·pISSN 1011-8934
Original Article
Received: Dec 16, 2020Accepted: Mar 18, 2021
Address for Correspondence: Kwang-Sig Lee, PhDAI Center, Korea University College of Medicine, 73 Goryeodae-ro, Seongbuk-gu, Seoul 02841, Korea.E-mail: [email protected]
Hyuntae Park, MD, PhDDepartment of Obstetrics & Gynecology, Korea University College of Medicine, 73 Goryeodae-ro, Seongbuk-gu, Seoul 02841, Korea.E-mail: [email protected]
ORCID iDsKi-Jin Ryu https://orcid.org/0000-0002-3013-8284Kyong Wook Yi https://orcid.org/0000-0001-7059-640XYong Jin Kim https://orcid.org/0000-0001-8684-2126Jung Ho Shin https://orcid.org/0000-0001-7559-5457Jun Young Hur https://orcid.org/0000-0001-5480-7203
Ki-Jin Ryu ,1 Kyong Wook Yi ,1 Yong Jin Kim ,1 Jung Ho Shin ,1 Jun Young Hur ,1 Tak Kim ,1 Jong Bae Seo ,2,3 Kwang-Sig Lee ,4 and Hyuntae Park 1
1Department of Obstetrics & Gynecology, Korea University College of Medicine, Seoul, Korea2Department of Biosciences, Mokpo National University, Muan, Korea3Department of Biomedicine, Health & Life Convergence Science, Mokpo National University, Muan, Korea4AI Center, Korea University College of Medicine, Seoul, Korea
Machine Learning Approaches to Identify Factors Associated with Women's Vasomotor Symptoms Using General Hospital Data
Tak Kim https://orcid.org/0000-0002-1752-237XJong Bae Seo https://orcid.org/0000-0001-5058-5156Kwang-Sig Lee https://orcid.org/0000-0002-0576-0098Hyuntae Park https://orcid.org/0000-0002-3364-4860
FundingThis research was supported by the MSIT (Ministry of Science and ICT), Korea, under the ITRC (Information Technology Research Center) support program (IITP-2018-0-01405) supervised by the IITP (Institute for Information & Communications Technology Planning & Evaluation), and a National Research Foundation of Korea (NRF) grant funded by the Korea government (MSIT) (No. 2020R1C1C1013579).
DisclosureThe authors have no potential conflicts of interest to disclose.
Author ContributionsConceptualization: Ryu KJ, Lee KS, Park H. Data curation: Ryu KJ, Park H. Formal analysis: Lee KS. Funding acquisition: Ryu KJ, Lee KS. Investigation: Lee KS, Park H. Methodology: Lee KS. Software: Lee KS. Validation: Park H. Writing - original draft: Ryu KJ, Lee KS. Writing - review & editing: Ryu KJ, Yi KY, Kim YJ, Shin JH, Hur JY, Kim T, Seo JB, Lee KS, Park H.
Data StatementData will be made available on request.
it was considered to be a temporary symptom but now it is reported to exert a lasting effect on their quality of life.2 A decline in hormone concentration is considered to be one of its risk factors, disrupting brain neurotransmission and hypothalamic thermoregulation.3 However, hormonal changes could not fully explain the pathophysiology of VMS, and more research is warranted to analyze the major determinants and exact mechanisms of these symptoms in menopausal women.
Several risk factors of VMS have been addressed in epidemiologic studies, including age, body mass index, race, smoking, and depressive symptoms.4-6 Based on increasing evidence, VMS are also expected to associate with major chronic diseases such as cognitive impairment, sleep disorder, diabetes mellitus, osteoporosis, and cardiovascular disease.7-9 However, the interaction between these various factors has not been fully elucidated, and it is unclear which variables are actually more important than others for the prediction of VMS. These limitations might be due to the traditional statistical methods such as regression analysis used in most previous epidemiologic studies, which were based on an unrealistic assumption of ceteris paribus, “all the other variables staying constant.” However, machine learning methods are free from unrealistic assumptions.10,11 Machine learning is a statistical tool that uses artificial intelligence to allow computers to perform tasks by learning from examples without being explicitly programmed.12 As data from electronic medical records become available, machine learning extracts knowledge from this large data pool and produces output that can be used for individual outcome prediction analysis and clinical decision making.12 To our knowledge, no study has applied a machine learning approach to investigate the determinants of menopausal symptoms.
The purpose of the present study was to investigate which factors are more closely associated than others with the severity of VMS in Korean women using the machine learning methods.
METHODS
Participants and variablesData on 3,298 women, aged 40–80 years, who attended their health check-ups from January 2010 to December 2012, were obtained from Korea University Anam Hospital in Seoul, Korea. In the early 1990s, the Menopause Rating Scale (MRS) was introduced as a standardized scale to measure women's aging symptoms and health-related quality of life. The MRS consists of 11 items, including VMS (MRS-1), heart discomfort (MRS-2), and sleep problems (MRS-3), and each item has a scoring system from 0 (no symptoms) to 4 (very severe symptoms).13 The dependent variable in the present study was VMS measured by the MRS item on hot flashes and sweating (MRS-1), and 104 independent variables, including age (years), menopause age (years), thyroid-stimulating hormone (μU/mL), monocytes (%), and triglyceride (mg/dL) (see Tables 1 and 2 for details) were evaluated.
AnalysisFive machine learning approaches were used for predicting VMS, the dependent variable of this study: linear regression, random forest, and artificial neural networks (ANNs) with one, two, and three hidden layers.14 Based on linear regression, a linear line is found in such a way that it minimizes, among an infinite number of linear lines, the sum of the squares of errors (errors are gaps between actual and predicted values of the dependent variable). A decision tree consists of 1) internal nodes (each meaning a test on an independent variable),
Atrophic change on Papanicolaou test 21.9%Non-alcoholic fatty liver disease 34%Positive for hepatitis B virus surface antigen 2.8%Positive for anti-hepatitis B virus surface antibody 83.7%Positive for anti-hepatitis B core antibody 43.6%AHA/NHLBI = American Heart Association/National Heart, Lung and Blood Institute, IDF = International Diabetes Federation.
Table 1. (Continued) Descriptive statistics of continuous variables
2) branches (each denoting an outcome of the test), and 3) terminal nodes (each representing a value of the dependent variable). A random forest creates many training sets, trains many decision trees, and makes a prediction with a majority vote (“bootstrap aggregation”). An ANN includes one input layer, one, two or three hidden layers, and one output layer. Neurons in a previous layer combine with “weights” in the next layer (Here, the weights are numerical values showing how much effect neurons in a previous layer have on neurons in the next layer). This operation is done in the order of weights in a layer next to the input layer, its following layer, and so on. This process is called the feedforward algorithm. Then, these weights are adjusted based on how much contribution they made to the errors of the ANN (Here, errors are gaps between actual and predicted values of the dependent variable). This operation is done in the order of weights in the output layer, its previous layer, and so on. This process is called the backpropagation algorithm. These algorithms are repeated until a certain standard is achieved for the accurate prediction of the dependent variable.14
Data on 3,298 participants were divided into training and validation sets with a 75:25 ratio. The models were built (or trained) based on the training set with 2,474 observations then the models trained were validated based on the validation set with 824 observations. The mean squared error (MSE), the average of the squares of errors among 824 observations, was introduced as a criterion for validating the models trained. Here, errors are gaps between actual and predicted values of the dependent variable, VMS. Variable importance from the random forest, a mean-impurity gap between a complete model and a model excluding a certain variable, was adopted for identifying major associated factors of VMS (mean impurity, or the degree of data being mixed at a node on average, is proportional to the MSE). The greater “mean-impurity increase” is defined as the greater variable importance. R-Studio was employed for the analysis in April 2020.
Ethics statementThis retrospective study complied with the tenets of the Helsinki Declaration and was approved by the Institutional Review Board (IRB) of Korea University Anam Hospital on January 20, 2020 (2020AN0031). Informed consent was waived by the IRB.
RESULTS
Descriptive statistics for continuous and categorical variables in this study are summarized in Tables 1 and 2, respectively. The mean MRS-1 scores (VMS), age, and menopause age of 3,298 participants were 0.8093, 52 years, and 49 years, respectively. Their mean thyroid-stimulating hormone, monocyte, and triglyceride levels were 2.98 μU/mL, 6.47%, and 104.20 mg/dL, respectively. The MSEs of the five machine learning models are shown in Table 3. A single 75:25 split of the training and validation sets would reduce the validity and generalizability of the results. Therefore, the random split and the statistical analysis were repeated three times and their average MSE was calculated for each of the five statistical methods, i.e.,
Table 3. Model performance: mean squared errorModel Run 1 Run 2 Run 3 AverageLinear regression 6.9343 1.0119 29.5104 12.4856Random forest 0.9180 0.9351 0.9448 0.9326Artificial neural network 1 layer 1.5894 1.5616 1.5218 1.5576Artificial neural network 2 layers 1.4014 1.4321 1.7217 1.5184Artificial neural network 3 layers 1.5652 1.3787 1.8060 1.5833
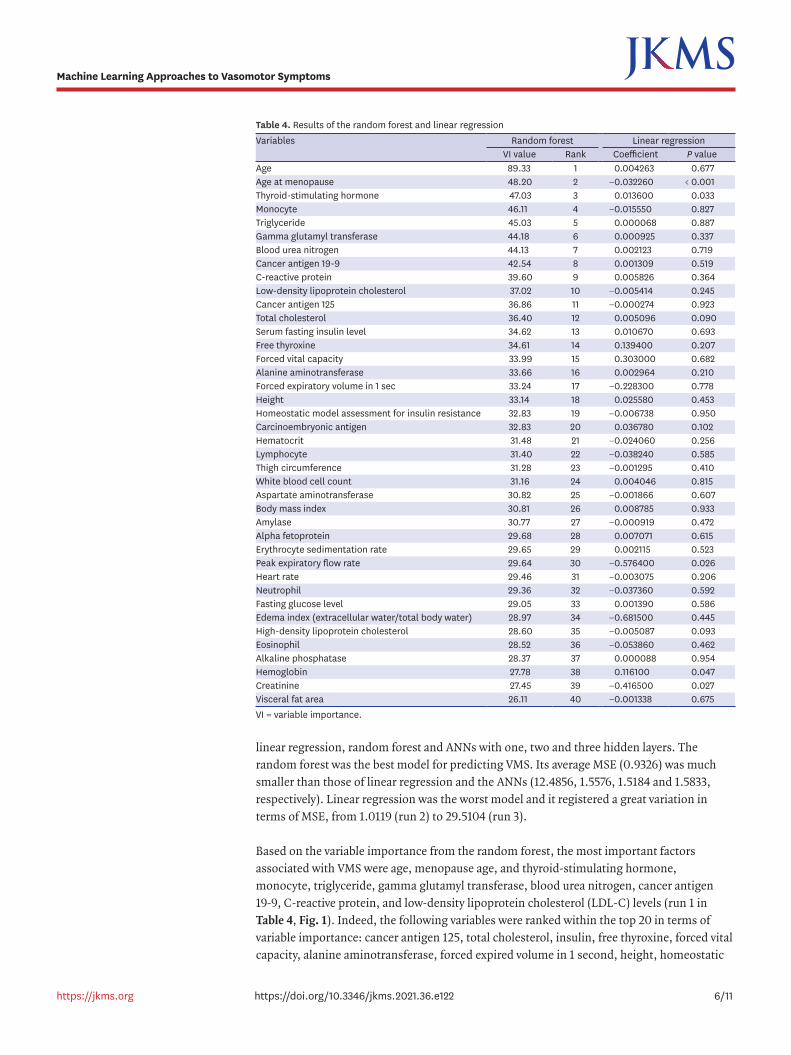
linear regression, random forest and ANNs with one, two and three hidden layers. The random forest was the best model for predicting VMS. Its average MSE (0.9326) was much smaller than those of linear regression and the ANNs (12.4856, 1.5576, 1.5184 and 1.5833, respectively). Linear regression was the worst model and it registered a great variation in terms of MSE, from 1.0119 (run 2) to 29.5104 (run 3).
Based on the variable importance from the random forest, the most important factors associated with VMS were age, menopause age, and thyroid-stimulating hormone, monocyte, triglyceride, gamma glutamyl transferase, blood urea nitrogen, cancer antigen 19-9, C-reactive protein, and low-density lipoprotein cholesterol (LDL-C) levels (run 1 in Table 4, Fig. 1). Indeed, the following variables were ranked within the top 20 in terms of variable importance: cancer antigen 125, total cholesterol, insulin, free thyroxine, forced vital capacity, alanine aminotransferase, forced expired volume in 1 second, height, homeostatic
model assessment for insulin resistance, and carcinoembryonic antigen. The findings of linear regression present useful information about the effect of a major factor associated with VMS. For example, VMS will decrease by 0.03 if menopause age increases by 1 year. Likewise, VMS will increase by 0.01 if thyroid-stimulating hormone increases by 1 unit (μU/mL). It should be noted, however, that the linear regression results are based on an unrealistic assumption of ceteris paribus, that is, “all the other variables staying constant.” In this context, the linear regression findings are considered as supplementary information to the variable importance from the random forest.
DISCUSSION
The results of this study are consistent with previous findings on the association of VMS with age,4 liver function,9 inflammation markers,15 and insulin resistance.16,17 A previous cohort study reported that VMS were associated with higher low-density lipoprotein cholesterol, high-density lipoprotein cholesterol, and triglyceride levels,18 and our machine learning results also showed that low-density lipoprotein cholesterol and triglyceride are important factors even when they were analyzed simultaneously with more than 100 variables.
This study provides the following additional information to the existing literature as well. First, menopause age was the second most important factor associated with VMS, and their linkage was found to be negative in this study. Few studies have been conducted on this topic, and only a few independent suggestions have been made on a negative association between menopause age and cardiovascular disease19 and a positive linkage between cardiovascular disease and VMS.20,21 In a similar context, one would expect a negative relationship between menopause age and VMS, and this study supports this expectation given the high ranking of menopause age from the random forest in this study (second highest). More effort should be made to identify the underlying mechanism of this relationship. Second, thyroid-stimulating
Fig. 1. Top 20 variables from random forest variable importance.
hormone was one of the top three factors associated with VMS, and this association was found to be positive for participants aged 40–80 years in this study. According to previous results, however, the linkage was 1) neutral for pre- or perimenopausal women aged 42–52 years22 and 2) negative for euthyroid menopausal women aged 49–59 years.23 Age and thyroid status would be important mediating variables here, and further examination is needed to determine the relationship among thyroid-stimulating hormone, VMS, and their mediating variables.
Third, monocyte count ranked fourth among the most important variables associated with VMS in this study. It has been reported that the ratio of monocyte to high-density lipoprotein cholesterol is positively associated with the risks of coronary artery disease,24 metabolic syndrome,25 and polycystic ovary syndrome.26 One possible explanation for these results is that a higher monocyte ratio is associated with systematic inflammation,26-28 which leads to the higher risks of these diseases. This explanation can be extended to an association between monocytes and VMS. More effort needs to be made in this direction, and this study makes a good starting point. Fourth, it was unexpected that cancer antigen 19-9, cancer antigen 125, and carcinoembryonic antigen would be among the top 20 factors associated with VMS. There have been a couple of studies on the effect of hormone replacement therapy on these cancer antigens among postmenopausal women.29,30 However, no study has been conducted and more investigation is needed on a direct relationship between VMS and these cancer antigens. In a similar vein, forced vital capacity and forced expiratory volume in 1 second ranked 15th and 17th, respectively, among the most important factors associated with VMS in this study. There have been a few studies on the impact of hormone replacement therapy on these lung function indicators among postmenopausal women.31,32 However, no literature on this subject is available, and more research is needed on a direct relationship between VMS and these lung function indicators. Other unexpected variables such as gamma glutamyl transferase, blood urea nitrogen, and height were addressed; however, the meaning of those findings is unclear owing to a lack of evidence supporting them. It is noteworthy that height was an important factor, rather than body weight or body mass index which have been regarded as important determinants of VMS.6,7 Further studies are needed to confirm our findings and the actual relative importance of these variables to predict VMS in women.
This study is the first machine-learning study to predict women's VMS and analyze their associated factors. Based on the results of this study, the random forest could determine which variables are more important for the prediction of VMS, and its performance was much better and much more stable than that of linear regression, a popular statistical approach in conventional studies. In addition, the study population and factors evaluated in this study are greater than those in previous studies: 3,298 women and 104 independent variables. The findings of this study demonstrate that machine learning provides an invaluable decision support system for the prediction of VMS. The following application can be a good example. Age at menopause, thyroid-stimulating hormone, and total cholesterol ranked around the top 10 and their coefficients were statistically significant at 10% in this study. Eight sub-groups can be defined, that is, (Low, Low, Low), (Low, Low, High), …, (High, High, Low), (High, High, High) in terms of age at menopause, thyroid stimulating hormone and total cholesterol. Then, a random forest can be trained and a decision tree can be obtained from the random forest as a clinically effective decision rule for each of the 8 subgroups regarding the diagnosis and prognosis of women's VMS.
This study had some limitations. First, this study adopted a cross-sectional design. Expanding data with a longitudinal design is expected to significantly improve the accuracy
of machine learning. Second, this study did not consider possible mediating effects among variables. Third, data came from a single center in this study. Expanding data with a multicenter design will be a good topic for future research. Fourth, our data from health check-ups lacked information on sex hormones, such as follicle-stimulating hormone and estradiol levels. Because these hormones are important for understanding menopausal symptoms and their associated factors, further studies are warranted to confirm our findings by adjusting for major sex hormone levels. Fifth, deep learning (the deep neural network) was not included in this study. Deep learning is the ANN with five or more hidden layers, including the convolutional neural network and the recurrent neural network. Usually, the former is popular for image data and the latter for sequence data (e.g., electronic health records). But these cutting-edge methods require big data, hence they are not useful when big data is not available (as in the case of women's VMS). However, this situation might change and more effort needs to be made in this direction.
In conclusion, machine learning provides an invaluable decision support system to predict women's VMS and analyze the major factors associated with these symptoms. To manage VMS, it is necessary to comprehensively consider various factors including age, menopausal age, thyroid function, lipid profile, liver function, inflammation markers, insulin resistance, monocyte count, cancer antigens, and lung function. Further studies are warranted to confirm the causal relationships of our findings and to implement a practical system that makes the best use of those findings.
REFERENCES
1. Boulet MJ, Oddens BJ, Lehert P, Vemer HM, Visser A. Climacteric and menopause in seven south-east Asian countries. Maturitas 2008;61(1-2):34-53. PUBMED | CROSSREF
2. Avis NE, Crawford SL, Greendale G, Bromberger JT, Everson-Rose SA, Gold EB, et al. Duration of menopausal vasomotor symptoms over the menopause transition. JAMA Intern Med 2015;175(4):531-9. PUBMED | CROSSREF
3. Stearns V, Ullmer L, López JF, Smith Y, Isaacs C, Hayes D. Hot flushes. Lancet 2002;360(9348):1851-61. PUBMED | CROSSREF
4. Gallicchio L, Miller SR, Kiefer J, Greene T, Zacur HA, Flaws JA. Risk factors for hot flashes among women undergoing the menopausal transition: baseline results from the Midlife Women’s Health Study. Menopause 2015;22(10):1098-107. PUBMED | CROSSREF
5. Whiteman MK, Staropoli CA, Benedict JC, Borgeest C, Flaws JA. Risk factors for hot flashes in midlife women. J Womens Health (Larchmt) 2003;12(5):459-72. PUBMED | CROSSREF
6. Gold EB, Crawford SL, Shelton JF, Tepper PG, Crandall CJ, Greendale GA, et al. Longitudinal analysis of changes in weight and waist circumference in relation to incident vasomotor symptoms: the Study of Women’s Health Across the Nation (SWAN). Menopause 2017;24(1):9-26. PUBMED | CROSSREF
7. Sturdee DW, Hunter MS, Maki PM, Gupta P, Sassarini J, Stevenson JC, et al. The menopausal hot flush: a review. Climacteric 2017;20(4):296-305. PUBMED | CROSSREF
8. Biglia N, Cagnacci A, Gambacciani M, Lello S, Maffei S, Nappi RE. Vasomotor symptoms in menopause: a biomarker of cardiovascular disease risk and other chronic diseases? Climacteric 2017;20(4):306-12. PUBMED | CROSSREF
9. Ryu KJ, Park H, Kim YJ, Yi KW, Shin JH, Hur JY, et al. Moderate to severe vasomotor symptoms are risk factors for non-alcoholic fatty liver disease in postmenopausal women. Maturitas 2018;117:22-8. PUBMED | CROSSREF
10. Lee KS, Ahn KH. Artificial neural network analysis of spontaneous preterm labor and birth and its major determinants. J Korean Med Sci 2019;34(16):e128. PUBMED | CROSSREF
11. Lee KS, Park KW. Social determinants of the association among cerebrovascular disease, hearing loss and cognitive impairment in a middle-aged or older population: recurrent neural network analysis of the Korean Longitudinal Study of Aging (2014-2016). Geriatr Gerontol Int 2019;19(8):711-6. PUBMED | CROSSREF
12. Lee KS, Ahn KH. Application of artificial intelligence in early diagnosis of spontaneous preterm labor and birth. Diagnostics (Basel) 2020;10(9):733. PUBMED | CROSSREF
13. Heinemann K, Ruebig A, Potthoff P, Schneider HP, Strelow F, Heinemann LA, et al. The Menopause Rating Scale (MRS) scale: a methodological review. Health Qual Life Outcomes 2004;2(1):45. PUBMED | CROSSREF
14. Han J, Kamber M. Data Mining: Concepts and Techniques. 2nd ed. San Francisco, CA, USA: Morgan Kaufmann; 2006.
15. Thurston RC, El Khoudary SR, Sutton-Tyrrell K, Crandall CJ, Gold E, Sternfeld B, et al. Are vasomotor symptoms associated with alterations in hemostatic and inflammatory markers? Findings from the Study of Women's Health Across the Nation. Menopause 2011;18(10):1044-51. PUBMED | CROSSREF
16. Thurston RC, El Khoudary SR, Sutton-Tyrrell K, Crandall CJ, Sternfeld B, Joffe H, et al. Vasomotor symptoms and insulin resistance in the study of women’s health across the nation. J Clin Endocrinol Metab 2012;97(10):3487-94. PUBMED | CROSSREF
17. Kwon DH, Lee JH, Ryu KJ, Park HT, Kim T. Vasomotor symptoms and the homeostatic model assessment of insulin-resistance in Korean postmenopausal women. Obstet Gynecol Sci 2016;59(1):45-9. PUBMED | CROSSREF
18. Thurston RC, El Khoudary SR, Sutton-Tyrrell K, Crandall CJ, Gold EB, Sternfeld B, et al. Vasomotor symptoms and lipid profiles in women transitioning through menopause. Obstet Gynecol 2012;119(4):753-61. PUBMED | CROSSREF
19. Zhu D, Chung HF, Dobson AJ, Pandeya N, Giles GG, Bruinsma F, et al. Age at natural menopause and risk of incident cardiovascular disease: a pooled analysis of individual patient data. Lancet Public Health 2019;4(11):e553-64. PUBMED | CROSSREF
20. Thurston RC. Vasomotor symptoms: natural history, physiology, and links with cardiovascular health. Climacteric 2018;21(2):96-100. PUBMED | CROSSREF
21. Muka T, Oliver-Williams C, Colpani V, Kunutsor S, Chowdhury S, Chowdhury R, et al. Association of vasomotor and other menopausal symptoms with risk of cardiovascular disease: a systematic review and meta-analysis. PLoS One 2016;11(6):e0157417. PUBMED | CROSSREF
22. Sowers M, Luborsky J, Perdue C, Araujo KL, Goldman MB, Harlow SD, et al. Thyroid stimulating hormone (TSH) concentrations and menopausal status in women at the mid-life: SWAN. Clin Endocrinol (Oxf ) 2003;58(3):340-7. PUBMED | CROSSREF
23. Slopien R, Owecki M, Slopien A, Bala G, Meczekalski B. Climacteric symptoms are related to thyroid status in euthyroid menopausal women. J Endocrinol Invest 2020;43(1):75-80. PUBMED | CROSSREF
24. Cetin MS, Ozcan Cetin EH, Kalender E, Aydin S, Topaloglu S, Kisacik HL, et al. Monocyte to HDL cholesterol ratio predicts coronary artery disease severity and future major cardiovascular adverse events in acute coronary syndrome. Heart Lung Circ 2016;25(11):1077-86. PUBMED | CROSSREF
25. Vahit D, Akboga MK, Samet Y, Hüseyin E. Assessment of monocyte to high density lipoprotein cholesterol ratio and lymphocyte-to-monocyte ratio in patients with metabolic syndrome. Biomarkers Med 2017;11(7):535-40. PUBMED | CROSSREF
26. Usta A, Avci E, Bulbul CB, Kadi H, Adali E. The monocyte counts to HDL cholesterol ratio in obese and lean patients with polycystic ovary syndrome. Reprod Biol Endocrinol 2018;16(1):34. PUBMED | CROSSREF
27. Linker R, Gold R, Luhder F. Function of neurotrophic factors beyond the nervous system: inflammation and autoimmune demyelination. Crit Rev Immunol 2009;29(1):43-68. PUBMED | CROSSREF
28. Canpolat U, Çetin EH, Cetin S, Aydin S, Akboga MK, Yayla C, et al. Association of monocyte-to-HDL cholesterol ratio with slow coronary flow is linked to systemic inflammation. Clin Appl Thromb Hemost 2016;22(5):476-82. PUBMED | CROSSREF
29. Cecchi E, Lapi F, Vannacci A, Banchelli G, Mazzei T, Mugelli A. Increased levels of CA 125 and CA 19.9 serum tumour markers following cyclic combined hormone replacement therapy. J Clin Pharm Ther 2009;34(1):129-32. PUBMED | CROSSREF
30. Cengiz B, Atabekoglu C, Cetinkaya E, Cengiz SD. Effect of hormone replacement therapy on serum levels of tumor markers in healthy postmenopausal women. Maturitas 2003;46(4):301-6. PUBMED | CROSSREF
31. Carlson CL, Cushman M, Enright PL, Cauley JA, Newman ABCardiovascular Health Study Research Group. Hormone replacement therapy is associated with higher FEV1 in elderly women. Am J Respir Crit Care Med 2001;163(2):423-8. PUBMED | CROSSREF
32. Cevrioglu AS, Fidan F, Unlu M, Yilmazer M, Orman A, Fenkci IV, et al. The effects of hormone therapy on pulmonary function tests in postmenopausal women. Maturitas 2004;49(3):221-7. PUBMED | CROSSREF