Annals of Medical and Health Sciences Research | Jan-Feb 2015 | Vol 5 | Issue 1 | 71 Introduction Hypertension or high blood pressure is a chronic medical condition in which the blood pressure in the arteries is elevated, requiring the heart to work harder than normal to circulate blood through the blood vessels. [1‑3] It has been described as the “silent killer” because initially the disease presents no apparent symptoms, and hence an individual can have hypertension without realizing it. [4‑6] Blood pressure is regarded as normal, if the level is 120/80 mmHg or less. Blood pressure between 120/80 mmHg and 138/89 mmHg is regarded as pre‑hypertension, which denotes increased risk of hypertension, whereas a blood pressure of 140/90 mmHg and above is considered to be hypertension. [1,7] Hypertension can be classified as either primary (essential) or secondary. Over 90% of all cases of hypertension are primary hypertension, with no obvious identifiable cause, although there are recognizable risk factors. [8] The remaining 10% of cases are usually secondary hypertension, and this is hypertension that results from other diseases present in the body such as kidney disease, cardiovascular disease (CVD), coronary heart disease, etc. [9,10] Although the exact cause of primary hypertension is unknown, there are several risk factors that have been associated with the condition. These risk factors are also associated with other non‑communicable diseases (NCDs) such as diabetes mellitus, cancers, CVD, chronic respiratory disease, asthma, musculo‑skeletal disorders, etc. These factors can be categorized into modifiable and non‑modifiable risk factors. [11‑13] The non‑modifiable risk factors are attributes or characteristics in the individual that cannot be changed or adjusted, hence they are out of our control and little or nothing can be done to control them; such factors include age, sex, race, family history, Modifiable Risk factors of Hypertension and Socio‑demographic Profile in Oghara, Delta State; Prevalence and Correlates Ibekwe RU Department of Community Medicine, Delta State University Teaching Hospital, Oghara, Delta State, Nigeria Abstract Background: Factors associated with the development of hypertension can be categorized into modifiable and non‑modifiable risk factors. The modifiable risk factors include obesity, physical inactivity, high salt diet, smoking alcohol consumption and others. Aim: This study was aimed to determine the prevalence of modifiable risk factors of hypertension in a rural community; Oghara and to ascertain if any association exists with these risk factors and socio‑demographic variables. Subjects and Methods: Descriptive cross‑sectional study design was utilized for the study and it was carried out over a period of 6 months (Feburary 2012 to August 2012). Cluster sampling was utilized to select a total of 272 respondents for the study. An interviewer administered questionnaire was used to collect data and data analysis was performed by SPSS version 16.0 (Chicago II, USA). Results: The prevalence of hypertension is 21.0% (57/272), while the prevalence of modifiable risk factors of hypertension such as smoking, alcohol consumption and obesity are 15.8% (43/272), 43.4% (118/272) and 18.8% (51/272) respectively. There is a statistical significant association between hypertension and smoking (P < 0.001), as well as hypertension and alcohol. (P < 0.001), on the other hand socio‑demographic variables were significantly associated with smoking (P < 0.001). Conclusion: The study showed high prevalence of modifiable risk factors of hypertension. This underscores the need for preventive efforts to encourage changes in life style pattern in order to reverse the impending epidemic of hypertension and other non‑communicable diseases. Keywords: Delta State, Hypertension, Modifiable risk factors, Oghara Access this article online Quick Response Code: Website: www.amhsr.org DOI: 10.4103/2141-9248.149793 Original Article Address for correspondence: Dr. Rebecca Ugochi Ibekwe, Department of Community Medicine, Delta State University Teaching Hospital, Oghara, Delta State, Nigeria. E-mail: drbecky4fl[email protected][Downloaded free from http://www.amhsr.org]
Transcript
Annals of Medical and Health Sciences Research | Jan-Feb 2015 | Vol 5 | Issue 1 | 71
Introduction
Hypertension or high blood pressure is a chronic medical condition in which the blood pressure in the arteries is elevated, requiring the heart to work harder than normal to circulate blood through the blood vessels.[1‑3] It has been described as the “silent killer” because initially the disease presents no apparent symptoms, and hence an individual can have hypertension without realizing it.[4‑6] Blood pressure is regarded as normal, if the level is 120/80 mmHg or less. Blood pressure between 120/80 mmHg and 138/89 mmHg is regarded as pre‑hypertension, which denotes increased risk
of hypertension, whereas a blood pressure of 140/90 mmHg and above is considered to be hypertension.[1,7] Hypertension can be classified as either primary (essential) or secondary. Over 90% of all cases of hypertension are primary hypertension, with no obvious identifiable cause, although there are recognizable risk factors.[8] The remaining 10% of cases are usually secondary hypertension, and this is hypertension that results from other diseases present in the body such as kidney disease, cardiovascular disease (CVD), coronary heart disease, etc.[9,10] Although the exact cause of primary hypertension is unknown, there are several risk factors that have been associated with the condition. These risk factors are also associated with other non‑communicable diseases (NCDs) such as diabetes mellitus, cancers, CVD, chronic respiratory disease, asthma, musculo‑skeletal disorders, etc. These factors can be categorized into modifiable and non‑modifiable risk factors.[11‑13] The non‑modifiable risk factors are attributes or characteristics in the individual that cannot be changed or adjusted, hence they are out of our control and little or nothing can be done to control them; such factors include age, sex, race, family history,
Modifiable Risk factors of Hypertension and Socio‑demographic Profile in Oghara, Delta State; Prevalence and Correlates
Ibekwe RUDepartment of Community Medicine, Delta State University Teaching Hospital, Oghara, Delta State, Nigeria
AbstractBackground: Factors associated with the development of hypertension can be categorized into modifiable and non‑modifiable risk factors. The modifiable risk factors include obesity, physical inactivity, high salt diet, smoking alcohol consumption and others. Aim: This study was aimed to determine the prevalence of modifiable risk factors of hypertension in a rural community; Oghara and to ascertain if any association exists with these risk factors and socio‑demographic variables. Subjects and Methods: Descriptive cross‑sectional study design was utilized for the study and it was carried out over a period of 6 months (Feburary 2012 to August 2012). Cluster sampling was utilized to select a total of 272 respondents for the study. An interviewer administered questionnaire was used to collect data and data analysis was performed by SPSS version 16.0 (Chicago II, USA). Results: The prevalence of hypertension is 21.0% (57/272), while the prevalence of modifiable risk factors of hypertension such as smoking, alcohol consumption and obesity are 15.8% (43/272), 43.4% (118/272) and 18.8% (51/272) respectively. There is a statistical significant association between hypertension and smoking (P < 0.001), as well as hypertension and alcohol. (P < 0.001), on the other hand socio‑demographic variables were significantly associated with smoking (P < 0.001). Conclusion: The study showed high prevalence of modifiable risk factors of hypertension. This underscores the need for preventive efforts to encourage changes in life style pattern in order to reverse the impending epidemic of hypertension and other non‑communicable diseases.
Address for correspondence: Dr. Rebecca Ugochi Ibekwe, Department of Community Medicine, Delta State University Teaching Hospital, Oghara, Delta State, Nigeria. E-mail: [email protected]
[Downloaded free from http://www.amhsr.org]
Ibekwe: Correlation between modifiable risk factors of hypertension and socio‑demographic profile in Oghara, Delta State
72 Annals of Medical and Health Sciences Research | Jan-Feb 2015 | Vol 5 | Issue 1 |
genetic composition, etc. On the other hand modifiable risk factors of hypertension are attributes, characteristics, exposures or life style patterns that can be adjusted or changed to prevent the development of the disease. These modifiable risk factors include; obesity, excessive salt intake, inactivity or lack of exercise, high fat diet, tobacco use, alcohol consumption, etc. Hypertension that is sustained elevation of the blood pressure to 140/90 mmHg is the most common Non Communicable Disease (NCD) globally and it affects all races with variable prevalence.[14‑16] It is becoming a public health challenge in many developing countries including Nigeria. The prevalence of hypertension varies across regions and countries, the prevalence of the disease in adult males in the United States in the year 2000 was 27%, while in Nigeria it was 34.8%; meaning that over 56 million Nigerians are hypertensive[17‑19] According to World Health Organization (WHO), Africa has the highest prevalence of hypertension and it is estimated that over 46% of adult Africans have the disease.[20,21] It has been described as a disease of the African race, as statistics has shown that Africans were more genetically predisposed to developing the disease[22‑24] Hypertension has been adjudged as the number one CVD; affecting approximately 1 billion people globally, it also accounts for about 7.5 million deaths annually. Which is about 12.8% of all total deaths.[25‑27] It also accounts for 57 million disability adjusted life years (DALYS) or 3.7% of total DALYs.[28,29] In Nigeria the disease and other NCD are currently responsible for at least 20% of all deaths in the country.[30,31] It is a major risk factor for coronary heart disease, ischemic heart disease as well as hemorrhagic stroke, excluding complications such as heart failure, peripheral vascular disease, renal impairments, retinal hemorrhage and visual impairments[32,33]. In Nigeria, hypertension and its complications also constitute 25% of all emergency medical admission and 60% of all hospital admissions. It is the most frequently diagnosed disease in the elderly[34,35] Hypertension has been described as a disease of the African race,[36,37] and despite this high prevalence among the African population, many Nigerians do not know their blood pressure, neither do they have access to education and services required to treat and prevent the disease. In view of the high level of complications associated with hypertension, early screening and prevention have great importance in achieving the goal of reduction in the frequency of the disease. One approach to such prevention is through the struggle against the development of the risk factors. A study was therefore carried out to determine the prevalence of modifiable risk factors of hypertension in Oghara and to ascertain if any association exists between these risk factors and socio‑demographic variables. Data generated from this study will serve as a tool for advocacy in sensitizing and mobilizing the members in the community to adjust their life style.
Subjects and Methods
The study was carried out in Oghara, a community in Ethiope west Local government Area of Delta state. It occupies
an area of 1175 km2 within the tropical rain forest belt in the South‑South geographical zone of Nigeria. It is on longitude 5.7 West and latitude 5.9160 South. It has a total adult population of 288,070 according to the 2014 projected population from the national population commission.[34] It is made up of five wards; Oghara efe‑one, Oghara efe‑ two, Oghara efe‑three, Oghara eki‑one and Oghara eki‑two. Oghara is a semi urban community with a tertiary health facility; the Delta State university teaching Hospital. Majority of the people are farmers; others are petty traders, artisans and civil servants. A descriptive cross‑sectional study was utilized and it was carried out over a period of 6 months from February 2012 to August 2012. All persons aged 18 years and above in Oghara Community and who are willing to participate in the study were included. Sample size was calculated using Cochrane formula for descriptive cross‑sectional studies.
n pqd
= Z2 [38]
2
Where n = minimum size required for the study.
Z = standard normal deviate.
P = prevalence of hypertension = 20% (from a study carried out in Port Harcourt)[24]
Q = 1–p
d = level of accuracy; which is set at 5%.
Substituting in the formula and adding 10% of the calculated sample size to make up for non‑response cases, a sample size of 272 was arrived at. The total population of Oghara efe‑one is 178,455, Oghara efe‑two is 30,583, Oghara efe‑thee is 22,092, Oghara eki‑one is 27,017 while Oghara eki‑two is 29,923. By proportional allocation, a total of 168, 29, 21, 25 and 28 were selected from these wards. Ogharefe‑one has 13 communities/settlement, Ogharefe‑two had 6 communities, Ogharaefe‑three had 7 communities, Ogharaeki‑one had 3 communities, while Ogharaeki‑two had 3 communities. For each ward random sampling technique was used to select communities/settlements and all the respondents that met the criteria required for the study in these selected communities were included and surveyed until the required number of respondents proportionally allocated to that ward was complete. Ethical clearance was obtained from the ethical committee of the Delta State University Teaching Hospital before commencement of the study. Permission to conduct the study was obtained from the community leaders, whereas individual informed consent was sought from the respondents and only the respondents who gave their consent participated in the study. Data was collected using a pre‑tested, interviewer administered questionnaire that was modified from the WHO stepwise instrument for chronic disease risk factor surveillance[39]. The questionnaire consisted of two parts. In the first part, data on socio‑demographic variables of the
[Downloaded free from http://www.amhsr.org]
Ibekwe: Correlation between modifiable risk factors of hypertension and socio‑demographic profile in Oghara, Delta State
Annals of Medical and Health Sciences Research | Jan-Feb 2015 | Vol 5 | Issue 1 | 73
participants was collected, as well as on their behavioral life styles, which included smoking habit, alcohol consumption, physical activity and dietary pattern. A smoker is one who smoke at least 1 cigarette/day in the last 30 days, while a non‑smoker is one who has never smoked or who had smoked <1 cigarette/day for 1 year. An alcohol drinker was one who drinks any amount of alcohol, while non‑alcohol drinker was life time abstainers from alcohol. Alcohol drinkers were further classified into; occasional drinkers, mild drinkers, moderate drinkers and heavy drinkers. An occasional drinker was one who consumed <1 standard unit of alcohol in a week, while alcohol drinker was one who consumed <14 standard units of alcohol in a week. Moderate alcohol drinker consumed between 15 – 21 standard units of alcohol in a week and heavy alcohol drinkers consumed >21 standard units of alcohol in a week. One standard unit of alcohol is defined as half bottle of beer or 1 glass of alcoholic wine or 1 shot of gin/whisky. Physical active was assessed by asking question about average activity during work and leisure. Physical activity was further classified into; not active physically, moderately active and very active physically. Not active physically included activities such as desk top jobs, petty trading etc., Moderately active; included, household chores, hawking, tailoring, cycling to school or place of work, walking to school or place of work that involved 10‑30 minutes of trekking. The second part of the questionnaire also involved taking anthropometric measurements and calculating the body mass index (BMI) using the standard formula. Interviewers had a common training program with standardization of the method of questionnaire administration, measurements of blood pressure and anthropometric indices. Height was measured using a metric rule fitted with a sliding head‑piece to avoid parallax effect. While measuring height, each participant was made to stand erect and against the wall, the head coverings and the shoes were also removed. Weight was measured using a bathroom scale and with heavy clothing removed but light clothes were allowed to remain, the footwear were also removed. The zero mark was checked each day and the scale was standardized by reference to an individual of known weight who was weighed each day on a standard hospital scale. The scale was also placed on a firm horizontal surface during the weighing procedure. BMI was calculated and classified into underweight, normal weight, over weight and obesity type I, II and III. Other measurements taken were blood pressure, and it was measured using sphygmomanometer and stethoscope. The questionnaire was sorted out, coded and entered into the spread‑sheet of SPSS version 16.0 (Chicago II, USA) Frequency tables and contingency tables were constructed and where applicable results were tested for significance at 0.05 (5%) using chi‑square inferential statistics.
Results
Cluster sampling technique was used to select 272 respondents who participated in the study. About half, 51.1% (139/272) of respondents were males. The mean age was 36.7 (14.0) years, with a majority 30.5% (83/272) of the respondents being
within the 18‑27 years age bracket. Most 58.1% (158/272) of the respondents were married, followed by singles 32.7% (89/272), and a majority 39.3% (107/272) of the respondents had at least secondary level of education [Table 1].
Result of this study has shown that the prevalence of hypertension is 21.0% (57/272), also about 15.8% (43/272) of the study population are smokers, while 43.4% (118/272) of the respondents consume alcohol. About 18.8% (51/272) of the study population are obese, of which the majority 66.7% (34/51) are females.
Table 2, describes the association between hypertension and modifiable risk factors of hypertension. Respondents who are hypertensive and smoke are 53.5% (23/43), compared to 46.5% (20/43) who do not smoke. This difference is statistically significant. (P < 0.001). Respondents who are hypertensive and consume alcohol are 33.1% (39/118), compared to 66.9% (79/118) who do not consume alcohol. This difference is statistically significant (P < 0.001).
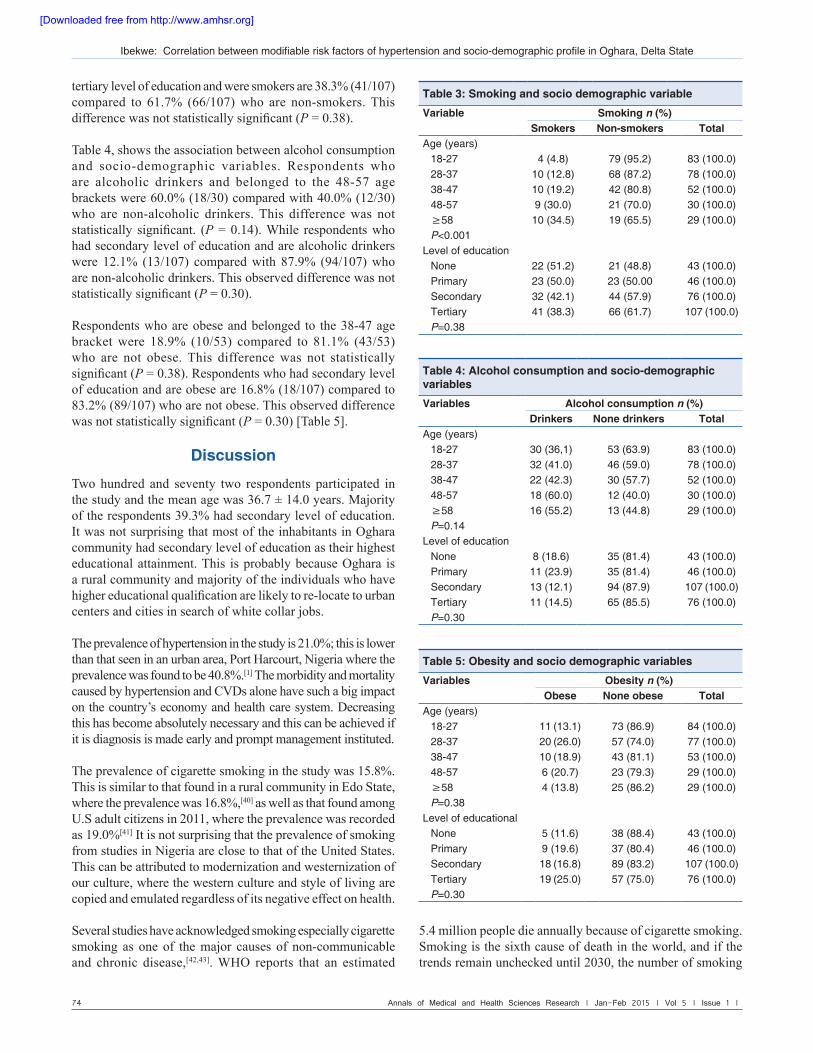
Table 3, describes the association between smoking and socio‑demographic variables. Respondents who are smokers and belonged to 18‑27 age range were 4.8% (4/83) compared to 95.2% (79/83) who are non‑smokers. This difference was statistically significant (P < 0.001). Respondents who had
Ibekwe: Correlation between modifiable risk factors of hypertension and socio‑demographic profile in Oghara, Delta State
74 Annals of Medical and Health Sciences Research | Jan-Feb 2015 | Vol 5 | Issue 1 |
tertiary level of education and were smokers are 38.3% (41/107) compared to 61.7% (66/107) who are non‑smokers. This difference was not statistically significant (P = 0.38).
Table 4, shows the association between alcohol consumption and socio‑demographic variables. Respondents who are alcoholic drinkers and belonged to the 48‑57 age brackets were 60.0% (18/30) compared with 40.0% (12/30) who are non‑alcoholic drinkers. This difference was not statistically significant. (P = 0.14). While respondents who had secondary level of education and are alcoholic drinkers were 12.1% (13/107) compared with 87.9% (94/107) who are non‑alcoholic drinkers. This observed difference was not statistically significant (P = 0.30).
Respondents who are obese and belonged to the 38‑47 age bracket were 18.9% (10/53) compared to 81.1% (43/53) who are not obese. This difference was not statistically significant (P = 0.38). Respondents who had secondary level of education and are obese are 16.8% (18/107) compared to 83.2% (89/107) who are not obese. This observed difference was not statistically significant (P = 0.30) [Table 5].
Discussion
Two hundred and seventy two respondents participated in the study and the mean age was 36.7 ± 14.0 years. Majority of the respondents 39.3% had secondary level of education. It was not surprising that most of the inhabitants in Oghara community had secondary level of education as their highest educational attainment. This is probably because Oghara is a rural community and majority of the individuals who have higher educational qualification are likely to re‑locate to urban centers and cities in search of white collar jobs.
The prevalence of hypertension in the study is 21.0%; this is lower than that seen in an urban area, Port Harcourt, Nigeria where the prevalence was found to be 40.8%.[1] The morbidity and mortality caused by hypertension and CVDs alone have such a big impact on the country’s economy and health care system. Decreasing this has become absolutely necessary and this can be achieved if it is diagnosis is made early and prompt management instituted.
The prevalence of cigarette smoking in the study was 15.8%. This is similar to that found in a rural community in Edo State, where the prevalence was 16.8%,[40] as well as that found among U.S adult citizens in 2011, where the prevalence was recordedas 19.0%[41] It is not surprising that the prevalence of smokingfrom studies in Nigeria are close to that of the United States.This can be attributed to modernization and westernization ofour culture, where the western culture and style of living arecopied and emulated regardless of its negative effect on health.
Several studies have acknowledged smoking especially cigarette smoking as one of the major causes of non‑communicable and chronic disease,[42,43]. WHO reports that an estimated
5.4 million people die annually because of cigarette smoking. Smoking is the sixth cause of death in the world, and if the trends remain unchecked until 2030, the number of smoking
[Downloaded free from http://www.amhsr.org]
Ibekwe: Correlation between modifiable risk factors of hypertension and socio‑demographic profile in Oghara, Delta State
Annals of Medical and Health Sciences Research | Jan-Feb 2015 | Vol 5 | Issue 1 | 75
induced deaths will increase to eight to ten million. Smoking is a recognized cause of cancer, lung disease, coronary heart disease and stroke. It is considered to be the single most important avoidable cause of premature morbidity and mortality in the world,[44] yet our people have coped this culture and style of living. There is therefore an urgent need to swing into action and reverse this ugly trend and unhealthy style of living in order to forestall these impending epidemics of NCDs. The prevalence of cigarette smoking increased with increasing age in the study and this has also been reported in other studies elsewhere.[45‑47] Similar to that found in other studies, the prevalence of smoking was inversely associated with educational status.[48,49] This is probably because with increase in educational attainment, there is increase in the level of knowledge and the individual is likely to have access to diverse kind of health information, and as a result is able to make better choices concerning his health.
The prevalence of alcohol consumption in the study was 43.4%. It is not surprising that the prevalence of alcohol consumption in Oghara community was very high; this can be attributable to the fact that in the community just as in many parts of the state alcoholic beverages is a common feature of many social gatherings, also among the Urhobo tribe which is the predominant tribe in Oghara, it is believed that alcoholic drink should be consumed first thing in the morning in order to be agile and active all day long. Extensive reviews of several studies in different parts of the world have shown that moderate alcohol consumption is beneficial to the heart. It has also been shown that alcohol consumption is related to total mortality in a U‑shaped manner, where moderate consumers have a reduced total mortality compared with non‑consumers and heavy consumers,[50,51]. Hence moderate alcohol consumption is encouraged. Heavy alcohol consumption, on the other hand carries adverse health and social consequences due to its intoxicating and addictive properties. As a result of this addictive property light to moderate consumer can easily drift and become a heavy alcohol consumer. Heavy alcohol consumption has been established to be associated with many adverse health effects such as liver diseases, cancer, cardiomyopathy, etc.[52] The draw back in encouraging moderate alcohol consumption is that there is a thin line separating moderate alcohol consumption from heavy alcohol consumption because of this addictive property. The prevalence of overweight in the study was 33.5%, while the prevalence of obesity was 16.9%. This is similar to that found in a nationwide survey in the United State In 2008, where the prevalence of overweight among adults aged 20 years and above was 35%and 11% for obesity. Previously overweight and obesity was thought to be a disorder of the developed countries,[52] but recently evidence has shown that many low and middle income countries are now facing a “double burden” of disease. While they continue to deal with the problem of infectious diseases and under nutrition, they are now experiencing a rapid upsurge in NCD risk factors such as overweight and obesity. Overweight and obesity is characterized by raised
body mass index (BMI), and as BMI increases, so does the risk for coronary heart diseases, angina heart failure, hypertension, stroke, osteoarthritis, type II diabetes, cancers, to mention but a few. There is therefore need to make policies that will encourage regular physical activity and healthier dietary choices while making them available, affordable and accessible to all. The findings of the study have revealed high levels of modifiable risk factors of hypertension. These values are as high as those found in the developed countries, hence a likely increase in the burden of hypertension and other non‑communicable diseases in the near future. There is therefore need to encourage changes in behavior and style of living in order to forestall this impending epidemic of non‑communicable diseases among our population.
Conclusion
The prevalence of modifiable risk factors of hypertension in Oghara is comparable to the values seen in developed countries. It therefore means that if nothing is done to reverse this ugly trend and style of living; hypertension and other NCDs will soon become an epidemic in the country coupled with epidemics of communicable diseases still plaguing us.
AcknowledgmentsI acknowledge all the assistance rendered by the final year medical students of Delta State University, Abraka during the stage of data collection. The research was self‑funded and there is no conflict of interest.
References1. Akpa MR, Emem‑Chioma PC and Odia OJ. Current
epidemiology of hypertension in Port Harcourt Metropolis,Rivers State, Nigeria. Available from: http: www.ajol.info/index.php/phmedj/article/view/38922: [Last accessed on2013 May 10].
2. Kumar P, Clark M. Clinical Medicine. 7th ed. Spain: Saunders Elsevier; 2009. p. 798‑805.
3. Shaikh RB, Mattew E, Sreedharan J, Muttappallymyatlil J,Al Sharbalti S and Basha SA. Knowledge regarding riskfactors of hypertension among entry year students ofa medical university. J Family Community Med. 2011;18:124‑9.
4. Asekun‑Olarinmoye E, Akinwusi P, Adebimpe W, IsawumiMA, Hassan MB, Olowe O, et al. Prevalence of hypertensionin the rural adult population of Osun State, South WesternNigeria. Int J Gen Med 2013; 6:317‑22.
5. Parr JD, Lindeboom W, Khanam MA, Perez Koehlmoos TL.Diagnosis of chronic conditions with modifiable life style riskfactors in selected urban and rural areas of Bangladesh andsocio‑demographic variability there in. BMC Health serv Res 2011; 11:309.
6. Bani IA. Prevalence and related risk factors of essentialhypertension in Jazan region, Saudi Arabia. Sudanese J Public Health. 2011; 6:45‑50.
7. Bunker CH, Ukoli FA, Nwankwo MU, Omene JA, CurrierGW, Holifield‑Kennedy L, et al. Factors associated with
[Downloaded free from http://www.amhsr.org]
Ibekwe: Correlation between modifiable risk factors of hypertension and socio‑demographic profile in Oghara, Delta State
76 Annals of Medical and Health Sciences Research | Jan-Feb 2015 | Vol 5 | Issue 1 |
hypertension in Nigerian civil servants. Prev Med 1992; 21:710‑22.
8. Burt VL. Whelton P, Roccella EJ, Brown C, Cutler JA,Higgins M, et al. Prevalence of hypertension in the US adultpopulation. Results from the Third National Health andNutrition Examination Survey, 1988‑1991. Hypertension 1995; 25:305‑13.
9. Center for Disease control and Prevention (CDC). Datafrom National health and Nutrition Examination Survey,2009‑2010; Hypertension Among Adults in the United States, 2009‑2010. Available from: http://www.cdc.gov/nchs/data/databriefs/db107.html. [Last accessesed on 2013 Feb 06].
10. Hypertension among Adult in the United States, 2009‑2010.Results from National Health and Nutrition ExaminationSurvey, 2009‑2010. Available from: http://www.cdc.gov/nchs/data/data briefs/db107. [Last accessed on 2013 May 05].
11. Cooper R, Rotimi C, Ataman S, McGee D, Osotimehin B,Kadiri S, et al. The prevalence of hypertension in sevenpopulations of West African Origin. Am J Public Health. 1997; 87:160‑8.
12. Mayega RW, Makumbi F, Rutebemberwa E, Peterson S,Ostenson CG, Tomson G, et al. Modifiable socio‑behaviouralfactors associated with overweight and hypertension among persons aged 35 to 60 years in eastern Uganda. PLoS one. 2012; 7:e47632.
13. Ahmed NU, Rahman M, Islam MD, Ali SY, Hossain AM,Fatema K, et al. socio‑demographic clinical characteristicsand status of hypertension control among rural hypertensive patients. Faridpur Med Coll J 2011; 6:5‑9.
14. Cooper R, Rotimi C. Hypertension in West African origin: Is there a genetic predisposition? J Hypertens 1994; 12:215‑27.
15. Sani MU, Wahab KW, Yusuf BO, Gbadamosi M, Johnson OV and Gbadamosi A. Modifiable cardiovascular risk factorsamong apparently healthy adult Nigerian population‑A cross sectional study. BMC Res Notes 2010; 3:11.
16. Abed Y and Abu‑Haddaf S. Risk factors of hypertension atUNRWA primary health care centres in Gaza Governorates.ISRN Epidemiol 2013; 10:760‑69.
17. Forman JP, Stampfer MJ, Curhan GC. Diet and Life style Riskfactor associated with incident hypertension in women. JAMA 2009; 302:401‑11.
18. Freeman V, Rotimi C, Cooper R. Hypertension prevalence,awareness, treatment and control among African Americanin the 1990s: Estimates from the Maywood cardiovascularsurvey. Am J Prev Med 1996; 12:177‑85.
19. Jiang B, LIU H, RU X, Zhang H, WU S and Wang W.Hypertension detection, management, control and associated factors among residents accessing community health services in Beijing. Sci Rep 2014; 4:4845.
20. Hajjar I, Kotchen JM, Kotchen TA. Hypertension: Trends inprevalence, incidence and control. Annu Rev Public Health2006; 27:465‑90.
21. Hossain AM, Ahmed NU, Rahman M, Islam MR, Sadhya G,Fatema K. Analysis of socio‑demographic and clinical factors associated with hospitalized stroke patients of Bangladesh.Faridpur Med Coll J 2011; 6:19‑23.
22. He J, Klag MJ, Whelton PK, Chen JY, Mo JP, Qian MC, et al.Migration, blood pressure pattern and hypertension: The Yimigrant study. Am J Epidemol 1991; 134:1085‑101.
23. Phaswana‑Mafuya N, Peltzer K, Chirinda W, Musekiwa A,
Kose Z. Sociodemographic predictors of multiple non‑communicable disease risk factors among older adults in South Africa. Glob Health Action. 2013; 6:20680.
24. Ogunmola OJ, Olaifa AO, Oladapo OO, Babatunde OA.Prevalence of cardiovascular risk factors among adultswithout obvious cardiovascular disease in a rural community in Ekiti state, South‑west, Nigeria. BMC cardiovasc Disord2013; 13:89.
25. Ike SO, Onwubere BJ. The relationship between diastolicdysfunction and level of blood pressure in Blacks. Ethn Dis2003; 13:463‑9.
26. Kaufman JS, Owoaje EE, James SA, Potimi CN, Cooper RS.Determinants of hypertension in West Africa: Contributionof anthropometric and dietary factors to urban‑rural andsocioeconomic gradients. Am J Epidemiol 1996; 143:1203‑18.
27. Zafar SN, Gowani SA, Irani FA, Ishaq M. Awareness of the risk factors, presenting features and complications of hypertensionamongst hypertensive and normotensives. J Pak Med Assoc2008; 58:711‑5.
28. Keamey PM, Whelton M, Raynold K, Whelton PK. Worldwide prevalence of hypertension. Available from: http://www.ncbi. Nim. Nih. Gov/1510678. (Last accessed on 2013 Feb 02).
29. Kumar BP, Jyothi K, Sravya NR, Swamy MK, Sowmya M.Evaluation of risk factors in hypertensive patients visiting arural tertiary care teaching hospital. J Pharm Sci 2012; 2:57‑61.
30. Akpa MR, Emem‑Chioma PC, Odia JC. Current epidemiology of hypertension in Port Harcourt metropolis, Rivers, Nigeria. Port Harcourt Med J 2008; 2:218‑23.
31. Altobelli E, Petrocelli R, Maccarone M, Altomare G,Argenziano G, Giannetti A, et al. Risk factors of hypertension,diabetes and obesity in Italian psoriasis patients: A surveyon socio‑demographic characteristics, smoking habits andalcohol consumption. Eur J Dermatol 2009; 19:252‑6.
32. Macleod J, Edwards C, Bouchier I. Davidson’s principles and practice of medicine. 19th ed. London, UK: Elsevier Ltd. 2002. p. 492‑8.
33. Ekpenyong CE, Udokang NE, Akpan EE, Samson TK.Double burden, Non communicable diseases and risk factorevaluation in sub‑Saharan Africa: The Nigerian experience.Eur J Sustain Dev 2012; 1:249‑70.
34. National Population Commission. Nigeria’s Housing andPopulation Census. Available from: http://www.population.gov.ng/. [Last accessed on 2013 May 15].
35. Nieto FJ, Alonso J, Chambless LE, Zhong M, Ceraso M,Romm FJ, et al. Population awareness and control ofhypertension and hypercholesterolaemia. The Atherosclerosis Risk in Communities study. Arch Intern Med 1995; 155:677‑84.
36. World Health Organization. 57 million Nigerians arehypertensive. Available from: http://www.nigeriaintel.com/2013/04/07/57‑million‑nigerians‑are‑hypertensive.[Last accessed on 2013 May 10].
37. Ogah OS, Okpechi I, Chukwuonye II, Akinyemi JO,Onwubere BJ, Falase AO, et al. Blood pressure, prevalenceof hypertension and hypertension related complications INigerian Africans: A review. World J Cardiol 2012; 4:327‑40.
38. Araoye MO, editor. Research Methodology with statistics for health and Social Sciences. Ilorin: Nathadex; 2003. p. 118‑9.
39. WHO. The WHO STEPwise approach to chronic disease risk factor surveillance. Geneva: WHO Press; 2011. p. 1‑4.
40. World Health Organization. Raised blood pressure; situation
[Downloaded free from http://www.amhsr.org]
Ibekwe: Correlation between modifiable risk factors of hypertension and socio‑demographic profile in Oghara, Delta State
Annals of Medical and Health Sciences Research | Jan-Feb 2015 | Vol 5 | Issue 1 | 77
and trends. Available from: http://www.who.int/gho/ndc/risk_ factors/blood_pressure_prevalence_te. [Last accessed on 2013 May 29].
41. Omemu VO, Okojie OH, Omemu CE. Socio‑demographiccorrelates of modifiable risk factors for hypertension in arural community in Edo State, Nigeria. J Community MedPrim Health Care 2008; 20:25‑34.
42. Stein L, Urban MI, Weber M, Ruff P, Hale M, Donde B, et al.Effect of tobacco smoking on cancer and cardiovasculardisease in urban black South African. Br J Cancer 2008;98:1586‑92.
44. Ezzati M, Henley SJ, Lopez AD, Thun MJ. Role of smokingin global and regional cancer epidemiology: Current patterns and data needs. Int J Cancer 2005;116:963‑71.
45. World Health Organization. Tobacco key facts; 2008. Available from: http://www.who.int/topics/tobacco/facts/en/index.html. [Last accessed 2013 Jun 02].
46. Akinkugbe OO. Non‑Communicable disease in Nigeria, series4. Final report of the National survey. Lagos: Federal Ministryof Health and Human Services; 1997. P. 12‑14.
47. Ordinioha B. The prevalence of hypertension and its
modifiable risk factors among lecturers of a medical school in Port Harcourt, south‑south Nigeria: Implications for control effort. Niger J Clin Pract 2013;16:1‑4.
48. Wiecha JM. Differences in patterns of tobacco use in Vietnamese, African‑Americans, Hispanics and Caucasian adolescents inWorcester, Massachusetts. Am J Prev Med 1996;12:29‑37.
49. Jekins CHN. Tobacco use in Vietnam. Prevalence predictorsand the role of the transitional Prev Medicine 1991;7:161‑5.
50. World health Organization. Epidemiology of smoking amongKuwaiti adults: Prevalence, characteristics and attitudes. Bull World Health organ 2000;78:1‑4.
51. Power C, Rodgers B, Hope S. U‑shaped relation for alcoholconsumption and health in early adulthood and implications for mortality. Lancet 1998;352:877.
52. World Health Organization. Obesity and overweight.Available from: http://www.who.int/meduacenter/factsheet/fs311/en. [Last accessed on 2013 Jun 19].
How to cite this article: Ibekwe R U. Modifiable risk factors of hypertension and socio-demographic profile in Oghara, Delta State; prevalence and correlates. Ann Med Health Sci Res 2015;5:71-7.
Source of Support: Nil. Conflict of Interest: None declared.