Int J Clin Exp Pathol 2016;9(12):12446-12458 www.ijcep.com /ISSN:1936-2625/IJCEP0035445 Original Article Sex-specific association of the PLA2G6 rs2760114 and serum lipid-related phenotypes in two Chinese ethnic groups Tao Guo, Rui-Xing Yin, Ling Pan, Wei Wang, Feng Huang, Jin-Zhen Wu Department of Cardiology, Institute of Cardiovascular Diseases, The First Affiliated Hospital, Guangxi Medical University, Nanning, Guangxi, China Received July 10, 2016; Accepted July 20, 2016; Epub December 1, 2016; Published December 15, 2016 Abstract: Little is known about the association of the phospholipase A2 group VI gene (PLA2G6) rs2760114 muta- tion and serum lipid phenotypes in the south Chinese populations. This study aimed to detect the association of the PLA2G6 rs2760114 mutation and several environmental factors with serum lipid phenotypes between males and females in the Jing and Han populations. Genotyping of the PLA2G6 rs2760114 mutation was performed in 785 Jing subjects and 844 Han participants using polymerase chain reaction and restriction fragment length poly- morphism. The genotype and allele frequencies were significantly different between Jing and Han populations (GG, 64.46% vs. 70.02%; CT, 30.32% vs. 26.18%; and TT, 5.22% vs. 3.80%; P = 0.045; C, 79.62% vs. 83.12%; T, 20.38% vs. 16.88%; P = 0.010). The levels of triglyceride (TG), high-density lipoprotein cholesterol (HDL-C), apolipoprotein (Apo) A1, ApoB and the ratio of ApoA1 to ApoB in Jing; TG and the ratio of ApoA1 to ApoB in Han; TG and ApoB in Jing males; TG and ApoA1 in Jing females; total cholesterol (TC), TG and low-density lipoprotein cholesterol (LDL-C) in Han males; and TG and ApoA1 in Han females were different among the CC, CT and TT genotypes. These finding suggest that the association of the PLA2G6 rs2760114 mutation and serum lipid phenotypes might have an ethnic- and/or sex-specificity. Keywords: Phospholipase A2 group VI (PLA2G6), rs2760114, serum lipid phenotypes, sex-specific association, environmental factors Introduction Cardiovascular disease (CVD) is the major glob- al cause of morbidity and mortality [1]. It is a well-established association between dyslipid- emia and an increased risk of CVD [2]. There is increasing evidence that sex and gender differ- ences are important in epidemiology, patho- physiology, treatment, and outcomes in dyslip- idemia [3]. The relative risk of CVD in subjects with high plasma triglyceride (TG) levels is high- er in women than in men [4]. It has also report- ed that regulating serum TG and high-density lipoprotein cholesterol (HDL-C) level is more essential in women than in men [5]. Women have been shown to have less well-controlled low-density lipoprotein cholesterol (LDL-C) lev- els than men and to be less likely to have received lipid-lowering medications even tho- ugh their risk of developing coronary artery dis- ease (CAD) is similar to that of men with dyslip- idemia [6-8]. To achieve the greatest possible reduction in CVD risk, antihyperlipidemic treat- ment strategies should also be aimed at reduc- ing elevated serum lipid levels in women. Recently, several genome-wide association stu- dies (GWASs) have reported the association of many mutations near the phospholipase A2 group VI gene (PLA2G6; Gene ID: 8398; MIM: 603604; formerly known as GVI; PLA2; INAD1; NBIA2; iPLA2; NBIA2A; NBIA2B; PARK14; PNPLA9; CaI-PLA2; IPLA2-VIA and iPLA2beta, located on Chromosome 22q13.1 NC_0000- 22.11 38111495…38192109; exon count: 29) and serum lipid phenotypes [9, 10] through the biological function of the A2 phospholipase, a class of enzyme that catalyzes the release of fatty acids from phospholipids [11]. The gene encoded protein may play a role in phospholipid remodeling, arachidonic acid release, leukotri- ene and prostaglandin synthesis, fas-mediated apoptosis, and transmembrane ion flux in glu- cose-stimulated B-cells. Several transcript vari-
Transcript
Int J Clin Exp Pathol 2016;9(12):12446-12458www.ijcep.com /ISSN:1936-2625/IJCEP0035445
Original Article Sex-specific association of the PLA2G6 rs2760114 and serum lipid-related phenotypes in two Chinese ethnic groups
Department of Cardiology, Institute of Cardiovascular Diseases, The First Affiliated Hospital, Guangxi Medical University, Nanning, Guangxi, China
Received July 10, 2016; Accepted July 20, 2016; Epub December 1, 2016; Published December 15, 2016
Abstract: Little is known about the association of the phospholipase A2 group VI gene (PLA2G6) rs2760114 muta-tion and serum lipid phenotypes in the south Chinese populations. This study aimed to detect the association of the PLA2G6 rs2760114 mutation and several environmental factors with serum lipid phenotypes between males and females in the Jing and Han populations. Genotyping of the PLA2G6 rs2760114 mutation was performed in 785 Jing subjects and 844 Han participants using polymerase chain reaction and restriction fragment length poly-morphism. The genotype and allele frequencies were significantly different between Jing and Han populations (GG, 64.46% vs. 70.02%; CT, 30.32% vs. 26.18%; and TT, 5.22% vs. 3.80%; P = 0.045; C, 79.62% vs. 83.12%; T, 20.38% vs. 16.88%; P = 0.010). The levels of triglyceride (TG), high-density lipoprotein cholesterol (HDL-C), apolipoprotein (Apo) A1, ApoB and the ratio of ApoA1 to ApoB in Jing; TG and the ratio of ApoA1 to ApoB in Han; TG and ApoB in Jing males; TG and ApoA1 in Jing females; total cholesterol (TC), TG and low-density lipoprotein cholesterol (LDL-C) in Han males; and TG and ApoA1 in Han females were different among the CC, CT and TT genotypes. These finding suggest that the association of the PLA2G6 rs2760114 mutation and serum lipid phenotypes might have an ethnic- and/or sex-specificity.
Keywords: Phospholipase A2 group VI (PLA2G6), rs2760114, serum lipid phenotypes, sex-specific association, environmental factors
Introduction
Cardiovascular disease (CVD) is the major glob-al cause of morbidity and mortality [1]. It is a well-established association between dyslipid-emia and an increased risk of CVD [2]. There is increasing evidence that sex and gender differ-ences are important in epidemiology, patho-physiology, treatment, and outcomes in dyslip-idemia [3]. The relative risk of CVD in subjects with high plasma triglyceride (TG) levels is high-er in women than in men [4]. It has also report-ed that regulating serum TG and high-density lipoprotein cholesterol (HDL-C) level is more essential in women than in men [5]. Women have been shown to have less well-controlled low-density lipoprotein cholesterol (LDL-C) lev-els than men and to be less likely to have received lipid-lowering medications even tho- ugh their risk of developing coronary artery dis-ease (CAD) is similar to that of men with dyslip-idemia [6-8]. To achieve the greatest possible
reduction in CVD risk, antihyperlipidemic treat-ment strategies should also be aimed at reduc-ing elevated serum lipid levels in women.
Recently, several genome-wide association stu- dies (GWASs) have reported the association of many mutations near the phospholipase A2 group VI gene (PLA2G6; Gene ID: 8398; MIM: 603604; formerly known as GVI; PLA2; INAD1; NBIA2; iPLA2; NBIA2A; NBIA2B; PARK14; PNPLA9; CaI-PLA2; IPLA2-VIA and iPLA2beta, located on Chromosome 22q13.1 NC_0000- 22.11 38111495…38192109; exon count: 29) and serum lipid phenotypes [9, 10] through the biological function of the A2 phospholipase, a class of enzyme that catalyzes the release of fatty acids from phospholipids [11]. The gene encoded protein may play a role in phospholipid remodeling, arachidonic acid release, leukotri-ene and prostaglandin synthesis, fas-mediated apoptosis, and transmembrane ion flux in glu-cose-stimulated B-cells. Several transcript vari-
Sex-specific association of PLA2G6 rs2760114 and lipid-related phenotypes
12447 Int J Clin Exp Pathol 2016;9(12):12446-12458
ants encoding multiple isoforms have been described, but the full-length nature of only three of them have been determined to date (http://www-ncbi-nlm-nih-gov.ezp-prod1.hul.harvard.edu/gene/8398).
As one of China’s 55 minority groups, Jing is an oceanian ethnic minority come from Vietnam and continue to speak the Vietnamese lan-guage and persist in fishing for a living until today, with a population of 22,517 (in 2000 the fifth national census statistics of China). Among 56 nationalities in China, the Han is the biggest one. Compared with Han populations, Jing pop-ulation is a relatively conservative and isolated minority, and preserves their custom of intra-ethnic marriages. Thus, their genetic back-ground may be less heterogeneous within the population [12, 13].
Materials and methods
Ethical considerations
The study protocol was approved by the Ethics Committee of the First Affiliated Hospital, Guangxi Medical University. Written informed consent for all the participants was obtained as per the guidelines.
Subjects
Two groups of study populations including 785 unrelated participants (387 males, 49.3% and 398 females, 50.7%) of Jing and 844 unrela- ted subjects (418 males, 49.5% and 426 fe- males, 50.5%) of Han were randomly selected from our previous stratified randomized sam-ples [14]. All participants were agricultural workers (Han) or fishermen (Jing) from Dongxing City, Guangxi Zhuang Autonomous Region, People’s Republic of China. The participants’ age ranged from 18-80 years with the mean age of 54.88±12.45 years in Jing and 52.99± 8.82 years in Han; respectively. The age distri-bution and gender ratio matched between the two populations. The participants were not tak-ing medications known to affect serum lipid lev-els (lipid lowering drugs such as statins or fibrates, beta-blockers, diuretics, or hormones).They did not show any signs of CVD from their health questionnaires, clinical examinations.
Epidemiological survey
The epidemiological survey was carried out using internationally standardized methods, following a common protocol [15]. Information on demographics and exposure factors was collected with standardized questionnaires. Alcohol consumption was categorized into sub-groups of grams of alcohol per day: 0, ≤ 25 and > 25. Cigarette smoking was categorized into subgroups of cigarettes per day: 0, ≤ 20 and > 20. Several parameters including height, weight, body mass index (BMI), waist circumfer-ence, blood pressure and fasting blood glucose were measured using methods described in our previous studies [12-16].
Analyses of serum lipid phenotypes
Blood samples were drawn from all subjects after an overnight fast. Sera were separated immediately and stored at -20°C. Serum lipid levels were measured. The levels of total cho-
Figure 1. Electrophoresis of PCR products of the PLA2G6 rs2760114 mutation. Lane M, 100-bp mark-er ladder; lanes 1-6, 476-bp band of PCR products.
Figure 2. Electrophoresis of genotyping of the PLA2G6 rs2760114 mutation. Lane M, 100-bp marker ladder; lanes 1 and 2, TT genotype (258- and 218-bp); lanes 3 and 4, CT genotype (476-, 258- and 218-bp); and lanes 5 and 6, CC genotype (476-bp).
Sex-specific association of PLA2G6 rs2760114 and lipid-related phenotypes
12448 Int J Clin Exp Pathol 2016;9(12):12446-12458
lesterol (TC), TG, HDL-C and LDL-C in the sam-ples were determined by enzymatic methods with commercially available kits. Serum apoli-poprotein (Apo) A1 and ApoB levels were ass- essed by the immuneturbidimetric immun- oassay.
Diagnostic criteria
The normal values of serum TC, TG, HDL-C, LDL-C, ApoA1 and ApoB levels, and the ratio of ApoA1 to ApoB in our Clinical Science Ex- periment Center were 3.10-5.17, 0.56-1.70, 1.16-1.42, 2.70-3.10 mmol/L, 1.20-1.60, 0.80-1.05 g/L, and 1.00-2.50; respectively [16].
Isolation of DNA
Genomic DNA was extracted from EDTA whole blood sample using a spin column method according to the protocol (QIAamp Blood Kit; Qiagen GmbH, Hilden, Germany). DNA was stored at -20°C till the time of use.
Genetic polymorphism detection
Genotyping of the PLA2G6 rs2760114 muta-tion was performed by polymerase chain reac-tion and restriction fragment length polymor-phism (PCR-RFLP). PCR amplification (Figure 1) was carried out with forward primer 5’-GGG- ATTACAGGGTGAGCG-3’ and reverse primer 5’-AGGCCAACAAGGTGAAGAAA-3’. After initial denaturing at 95°C for 5 min, the reaction mix-ture was subjected to 33 cycles of 45 s dena-turation at 95°C, 30 s annealing at 65°C and extension 60 s at 72°C, followed by a final 10 min extension at 72°C. After restriction enzyme (TaqI [C]) digestion of the amplified DNA, the genotypes were identified by electrophoresis on 2% agarose gels and visualized with ethid-ium-bromide staining ultraviolet illumination. Three genotypes were detected: CC genotype (476-bp), CT genotype (476-, 258- and 218-bp) and TT genotype (258- and 218-bp; Figure 2). Six samples (each genotype in two; respective-ly) detected by the PCR-RFLP were also con-
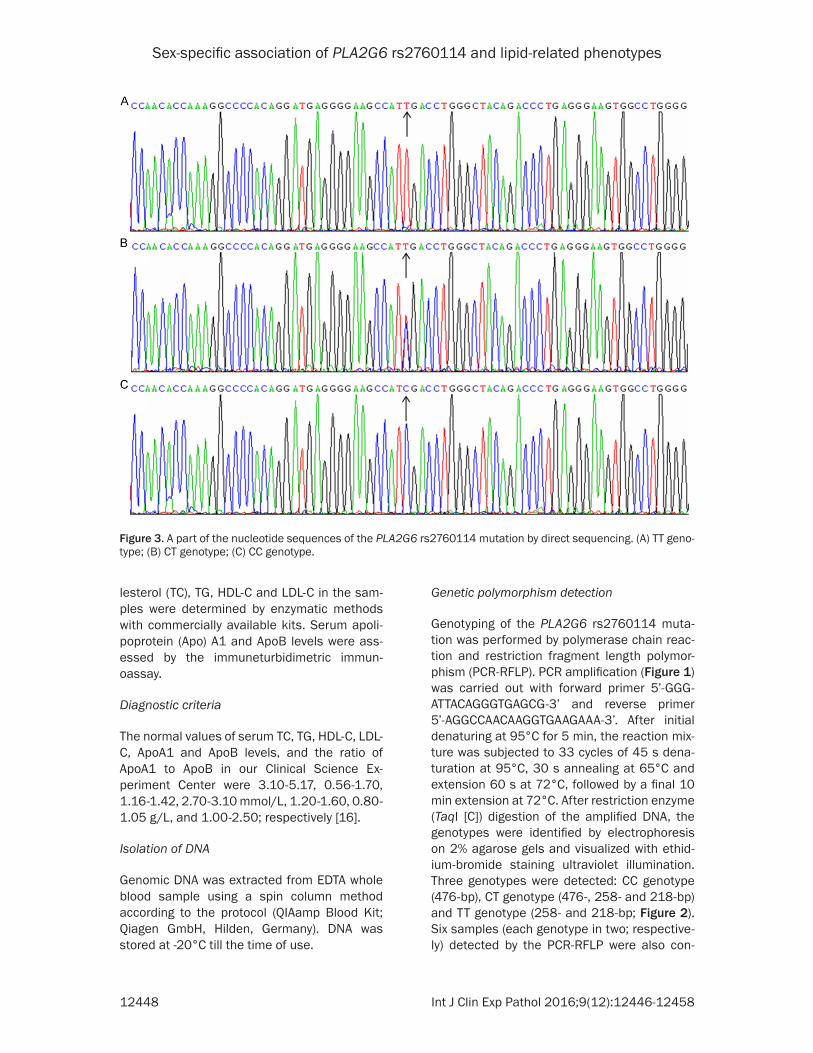
Figure 3. A part of the nucleotide sequences of the PLA2G6 rs2760114 mutation by direct sequencing. (A) TT geno-type; (B) CT genotype; (C) CC genotype.
Sex-specific association of PLA2G6 rs2760114 and lipid-related phenotypes
12449 Int J Clin Exp Pathol 2016;9(12):12446-12458
firmed by direct sequencing. The PCR products were purified by low melting point gel electro-phoresis and phenol extraction, and then the DNA sequences were analyzed using an ABI Prism 3100 (Applied Biosystems) in Shanghai Sangon Biological Engineering Technology & Services Co., Ltd., People’s Republic of China (Figure 3).
Statistical analyses
Descriptive parameters are presented as mean ± SD (serum TG levels were presented as medi-ans and interquartile ranges) and Categorical variables were presented using frequency counts. Comparisons between groups of means were compared by the Student’s unpaired t-test. Chi-square test (χ2) was used to compare categorical variables between the groups. Genotype frequencies in Jing and Han were
tested for Hardy-Weinberg equilibrium, and any deviation between the observed and expected frequencies was tested for significance using the χ2 test. The association between genotypes and serum lipid parameters was performed using analysis of covariance (ANCOVA). Age, gender, BMI, waist circumference, smoking, and alcohol consumption were adjusted for the statistical analysis. Multivariable linear regres-sion analyses with stepwise modeling were used to determine the correlation between gen-otypes (CC = 1, CT = 2, TT = 3) or alleles (the T allele non-carrier = 1, the T allele carrier = 2) and several environmental factors with serum lipid phenotypes in subgroups. Two sided P value < 0.05 was considered statistically sig-nificant. All data were evaluated using SPSS version 21.0 (SPSS Inc., Chicago, Illinois) of windows 10.
Table 1. Anthropometric and biochemical characteristics of the participantsParameter Jing (n = 785) Han (n = 844)
Apoliprotein (Apo) A1 (g/L) 1.31±0.24 1.32±0.21 1.32±0.21 1.33±0.20ApoB (g/L) 1.07±0.26 1.05±0.25 1.05±0.24 1.03±0.24ApoA1/ApoB 1.30±0.41 1.32±0.11 1.34±0.43 1.35±0.34HDL-C: high-density lipoprotein; LDL-C, low-density lipoprotein; Apo: apolipoprotein. aP < 0.001; bP < 0.01; cP < 0.05 in compari-son with males from the same ethnic group.
Sex-specific association of PLA2G6 rs2760114 and lipid-related phenotypes
12450 Int J Clin Exp Pathol 2016;9(12):12446-12458
Results
General and biochemical characteristics of the participants
Table 1 compares the general characteristics and serum lipid phenotypes between males and females in Jing and Han populations. The values of height, weight and serum HDL-C lev-els were significant different between men and women in the two populations (P < 0.001 for all). The values of waist circumference, the per-centages of subjects who smoked cigarettes and the percentages of participants who con-sumed alcohol were different between males and females in Jing (P < 0.001 for all). The lev-els of serum TC and LDL-C were different between males and females in Han (P < 0.01 for each).
Genotypic and allelic frequencies
As shown in Table 2, the genotype frequency of PLA2G6 rs2760114 mutation agrees with the
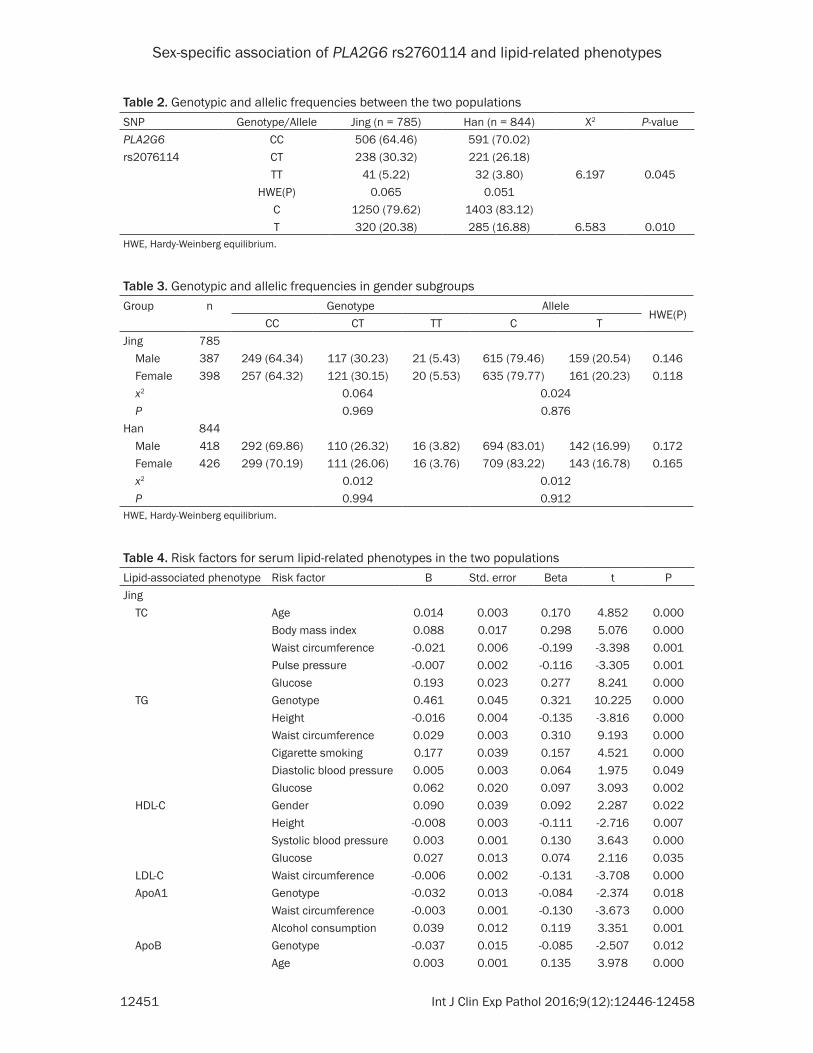
Hardy-Weinberg equilibrium in the two popula-tions (P > 0.05 for each). The genotype and allele frequencies of PLA2G6 rs2760114 muta-tion were significantly different between Jing and Han populations (GG, 64.46% vs. 70.02%; CT, 30.32% vs. 26.18%; TT, 5.22% vs. 3.80%; P = 0.045; C, 79.62% vs. 83.12%; T, 20.38% vs. 16.88%; P = 0.010). There were no significant differences among genotype and/or allele fre-quencies of PLA2G6 rs2760114 mutation in gender-subgroups in the two populations (P > 0.05 for all; Table 3).
Genotypes and serum lipid phenotypes
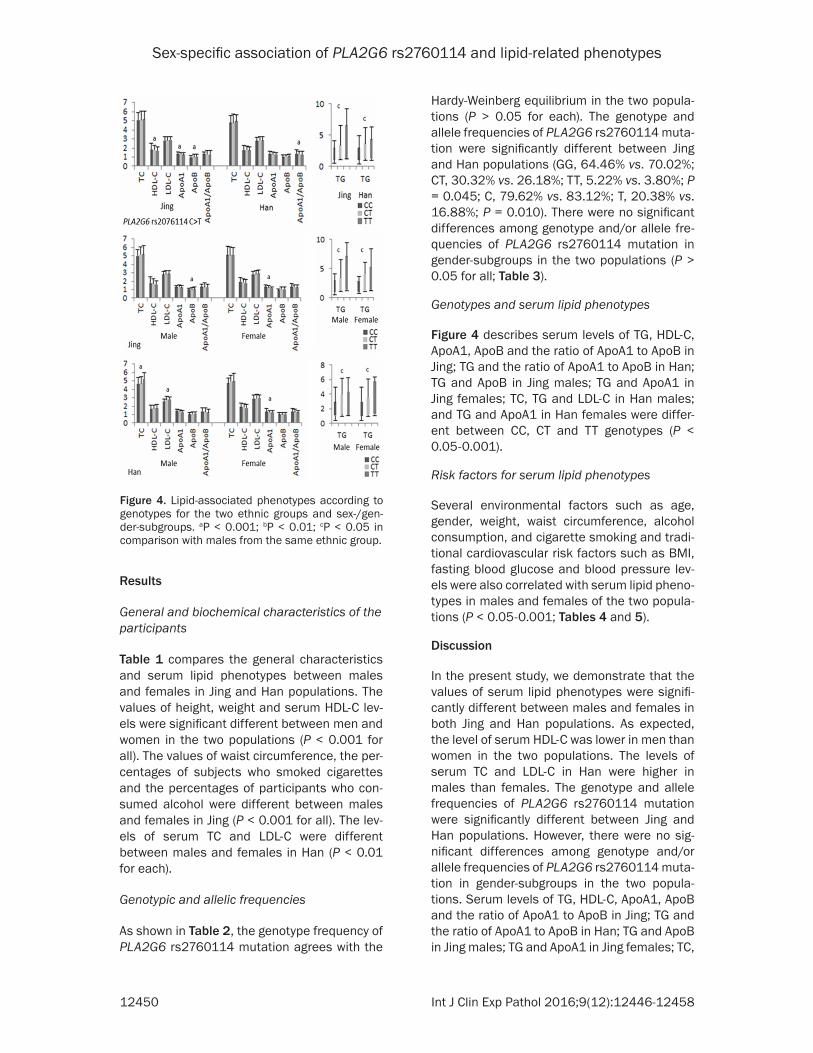
Figure 4 describes serum levels of TG, HDL-C, ApoA1, ApoB and the ratio of ApoA1 to ApoB in Jing; TG and the ratio of ApoA1 to ApoB in Han; TG and ApoB in Jing males; TG and ApoA1 in Jing females; TC, TG and LDL-C in Han males; and TG and ApoA1 in Han females were differ-ent between CC, CT and TT genotypes (P < 0.05-0.001).
Risk factors for serum lipid phenotypes
Several environmental factors such as age, gender, weight, waist circumference, alcohol consumption, and cigarette smoking and tradi-tional cardiovascular risk factors such as BMI, fasting blood glucose and blood pressure lev-els were also correlated with serum lipid pheno-types in males and females of the two popula-tions (P < 0.05-0.001; Tables 4 and 5).
Discussion
In the present study, we demonstrate that the values of serum lipid phenotypes were signifi-cantly different between males and females in both Jing and Han populations. As expected, the level of serum HDL-C was lower in men than women in the two populations. The levels of serum TC and LDL-C in Han were higher in males than females. The genotype and allele frequencies of PLA2G6 rs2760114 mutation were significantly different between Jing and Han populations. However, there were no sig-nificant differences among genotype and/or allele frequencies of PLA2G6 rs2760114 muta-tion in gender-subgroups in the two popula-tions. Serum levels of TG, HDL-C, ApoA1, ApoB and the ratio of ApoA1 to ApoB in Jing; TG and the ratio of ApoA1 to ApoB in Han; TG and ApoB in Jing males; TG and ApoA1 in Jing females; TC,
Figure 4. Lipid-associated phenotypes according to genotypes for the two ethnic groups and sex-/gen-der-subgroups. aP < 0.001; bP < 0.01; cP < 0.05 in comparison with males from the same ethnic group.
Sex-specific association of PLA2G6 rs2760114 and lipid-related phenotypes
12451 Int J Clin Exp Pathol 2016;9(12):12446-12458
Table 2. Genotypic and allelic frequencies between the two populationsSNP Genotype/Allele Jing (n = 785) Han (n = 844) X2 P-valuePLA2G6 CC 506 (64.46) 591 (70.02)rs2076114 CT 238 (30.32) 221 (26.18)
Table 4. Risk factors for serum lipid-related phenotypes in the two populationsLipid-associated phenotype Risk factor B Std. error Beta t PJing TC Age 0.014 0.003 0.170 4.852 0.000
Body mass index 0.088 0.017 0.298 5.076 0.000Waist circumference -0.021 0.006 -0.199 -3.398 0.001Pulse pressure -0.007 0.002 -0.116 -3.305 0.001Glucose 0.193 0.023 0.277 8.241 0.000
TC, total cholesterol; TG, triglyceride; HDL-C, high-density lipoprotein cholesterol; LDL-C, low-density lipoprotein cholesterol; ApoA1, apolipoprotein A1; ApoB, apolipoprotein B; ApoA1/ApoB, the ratio of apolipoprotein A1 to apolipoprotein B; B, unstan-dardized coefficient; Beta, standardized coefficient.
Table 5. Risk factors for serum lipid-related phenotypes in gender subgroups between two Chinese ethnic groupsLipid-associated phenotype Risk factor B Std. error Beta t PJing/Male TC Age 0.012 0.004 0.182 3.456 0.001
Body mass index 0.107 0.024 0.412 4.528 0.000Waist circumference -0.020 0.008 -0.216 -2.328 0.020
Sex-specific association of PLA2G6 rs2760114 and lipid-related phenotypes
12453 Int J Clin Exp Pathol 2016;9(12):12446-12458
Sex-specific association of PLA2G6 rs2760114 and lipid-related phenotypes
12454 Int J Clin Exp Pathol 2016;9(12):12446-12458
TG and LDL-C in Han males; and TG and ApoA1 in Han females were different among the geno-types. These findings suggest that the associa-tion of the PLA2G6 rs2760114 mutation and
serum lipid phenotypes might have an ethnic-specificity. But it can’t deny the sex-specific association of the PLA2G6 rs2760114 muta-tion and serum lipid phenotypes. Because sev-
TC, total cholesterol; TG, triglyceride; HDL-C, high-density lipoprotein cholesterol; LDL-C, low-density lipoprotein cholesterol; ApoA1, apolipoprotein A1; ApoB, apolipoprotein B; ApoA1/ApoB, the ratio of apolipoprotein A1 to apolipoprotein B; B, unstan-dardized coefficient; Beta, standardized coefficient.
Sex-specific association of PLA2G6 rs2760114 and lipid-related phenotypes
12455 Int J Clin Exp Pathol 2016;9(12):12446-12458
eral environmental factors such as age, gender, weight, waist circumference, alcohol consump-tion, and cigarette smoking and traditional car-diovascular risk factors such as BMI, fasting blood glucose and blood pressure levels were also correlated with serum lipid parameters in males and females of the two populations according our present results.
PLA2G6 is modulated by n-3 PUFA supplemen-tation, since it was differentially expressed in peripheral blood mononuclear cells (PBMCs) after supplementation [17]. PLA2G6 was sh- own to be influenced by n-3 PUFA supplementa-tion since its gene product is a secreted enzy- me whose activity is associated with CAD bio- markers. In a previous study [18], five SNPs (rs5750546, rs132989, rs133016, rs2235346 and rs2284060) of the PLA2G6 influenced TG levels independently of the supplementation. In addition, genotypes × n-3 PUFA supplementa-tion interaction was observed for the five SNPs as previously mentioned [19, 20]. These SNPs and the interaction considerably contributed to explain inter-individual variability in plasma TG levels after n-3 PUFA supplementation.
A previous study reported that genotype-phe-notype association of the rs132984 was asso-ciated with TG levels (P = 0.022, empirical P = 0.044) [21]. Another study demonstrated that fatty acid metabolism-related PLA2G6 SNPs (rs4821737, rs2076370 and rs4821767) as contributing factors play a crucial role of bio-logical processes of metabolism-related dis-ease [22].
Little is known about the association of the PLA2G6 rs2760114 mutation and serum lipid phenotypes in the south Chinese population. Our data showed that it might be due to the dif-ferences in genetic backgrounds, dietary hab-its, and environmental factors between the two ethnic populations and/or simply due to the low power of this study. It is well accepted that eth-nic differences in serum lipid levels were partly due to the differences in the dietary intakes [23]. Diet alone could account for up to 2.5% of the variability on serum lipid levels [24-28]. Therefore, it is possible that the difference in dietary habit between Jing and Han ethnic groups partly contribute variability in the effect of PLA2G6 rs2760114 mutation on serum lipid phenotypes.
To the best of our knowledge, this study is the first report about the sex-specific association of the PLA2G6 rs2760114 mutation and ser- um lipid phenotypes. Therefore, further studies with larger sample size are still needed to con-firm this association. In addition, several envi-ronmental factors were also correlated with serum lipid levels in males and females of both Jing and Han populations. In the current study, the general characteristics and the values of serum lipid phenotypes in the Jing and Han populations had significantly different between males and females. For every 1-kg decrease in body weight, TG decreased by 0.011 mmol/L and HDL-C increased by 0.011 mmol/L [29]. In this study, the percentages of subjects who smoked cigarettes and consumed alcohol were significantly higher in males than in females. Rimm et al. documented that consuming of 30 g of ethanol per day increased the concentra-tions of HDL-C by 3.99 mg/dl, ApoA1 by 8.82 mg/dl, and TG by 5.69 mg/dl [30]. Therefore, the results of exposure to different environ-mental factors may further modify the effect of genetic variation on serum lipid levels in our study populations.
There are some potential limitations in our study. First, it is undeniable that this study has insufficient power to produce a robust conclu-sion; therefore, such a small-scale study needs to replicate in independent cohorts. Second, the cross-sectional study design limits the abil-ity to determine any causality of the relation-ships observed. Third, the impact of diet, such as including TFA, SFA, PUFA (including n-3 PUFA and n-6 PUFA) and MUFA was not evaluated in this study. It is possible that part of the relation-ship observed in this study may be partly influ-enced by the effect of dietary intake.
Conclusion
The genotype and allele frequencies were sig-nificantly different between Jing and Han popu-lations. The subjects with TT genotype in Jing (higher TG and ApoB, lower HDL-C and ApoA1), Han (higher TG, lower the ratio of ApoA1 to ApoB), Jing males (higher TG and ApoB), Jing females (higher TG, lower ApoA1), Han males (higher TC, TG and LDL-C), and Han females (higher TG, lower ApoA1) have different serum lipid levels compared with other genotypes. These findings suggest that the association
Sex-specific association of PLA2G6 rs2760114 and lipid-related phenotypes
12456 Int J Clin Exp Pathol 2016;9(12):12446-12458
between the PLA2G6 rs2760114 and serum lipid phenotypes might have an ethnic- and/or sex-specificity.
Acknowledgements
This study was supported by the National Natural Science Foundation of China (No: 81160111) and the Innovation Project of Guangxi Graduate Education.
Disclosure of conflict of interest
None.
Address correspondence to: Rui-Xing Yin, Depart- ment of Cardiology, Institute of Cardiovascular Diseases, The First Affiliated Hospital, Guangxi Medical University, 22 Shuangyong Road, Nanning 530021, Guangxi, China. E-mail: [email protected]
References
[1] Global Burden of Disease Study 2013 Collaborators. Global, regional, and national incidence, prevalence, and years lived with dis-ability for 301 acute and chronic diseases and injuries in 188 countries, 1990-2013: a sys-tematic analysis for the Global Burden of Disease Study 2013. Lancet 2015; 386: 743-800.
[2] Stone NJ, Robinson JG, Lichtenstein AH, Bairey Merz CN, Blum CB, Eckel RH, Goldberg AC, Gordon D, Levy D, Lloyd-Jones DM, McBride P, Schwartz JS, Shero ST, Smith SC Jr, Watson K, Wilson PW; American College of Cardiology/American Heart Association Task Force on Practice Guidelines. 2013 ACC/AHA guideline on the treatment of blood cholesterol to re-duce atherosclerotic cardiovascular risk in adults: a report of the American College of Cardiology/American Heart Association Task Force on Practice Guidelines. J Am Coll Cardiol 2014; 63: 2889-2934.
[3] Magnussen CG, Venn A, Thomson R, Juonala M, Srinivasan SR, Viikari JS, Berenson GS, Dwyer T, Raitakari OT. The Association of Pediatric LDL-cholesterol and HDL-cholesterol Dyslipidemia Classifications and Change in Dyslipidemia Status with Carotid Intima-Media Thickness in Adulthood: Evidence from the Cardiovascular Risk in Young Finns Study, the Bogalusa Heart Study, and the Childhood Determinants of Adult Health (CDAH) Study. J Am Coll Cardiol 2009; 53: 860-869.
[4] Cullen P. Evidence that triglycerides are an in-dependent coronary heart disease risk factor. Am J Cardiol 2000; 86: 943-949.
[5] Meagher EA. Addressing cardiovascular dis-ease in women: focus on dyslipidemia. J Am Board Fam Pract 2004; 17: 424-437.
[6] Gouni-Berthold I, Berthold HK, Mantzoros CS, Böhm M and Krone W. Sex disparities in the treatment and control of cardiovascular risk factors in type 2 diabetes. Diabetes Care 2008; 31: 1389-1391.
[7] Wexler DJ, Grant RW, Meigs JB, Nathan DM and Cagliero E. Sex disparities in treatment of cardiac risk factors in patients with type 2 dia-betes. Diabetes Care 2005; 28: 514-520.
[8] Kalyani RR, Lazo M, Ouyang P, Turkbey E, Chevalier K, Brancati F, Becker D and Vaidya D. Sex differences in diabetes and risk of incident coronary artery disease in healthy young and middle-aged adults. Diabetes Care 2014; 37: 830-838.
[9] Lu Y, Day FR, Gustafsson S, Buchkovich ML, Na J, Bataille V, Cousminer DL, Dastani Z, Drong AW, Esko T, Evans DM, Falchi M, Feitosa MF, Ferreira T, Hedman ÅK, Haring R, Hysi PG, Iles MM, Justice AE, Kanoni S, Lagou V, Li R, Li X, Locke A, Lu C, Mägi R, Perry JR, Pers TH, Qi Q, Sanna M, Schmidt EM, Scott WR, Shungin D, Teumer A, Vinkhuyzen AA, Walker RW, Westra HJ, Zhang M, Zhang W, Zhao JH, Zhu Z, Afzal U, Ahluwalia TS, Bakker SJ, Bellis C, Bonnefond A, Borodulin K, Buchman AS, Cederholm T, Choh AC, Choi HJ, Curran JE, de Groot LC, De Jager PL, Dhonukshe-Rutten RA, Enneman AW, Eury E, Evans DS, Forsen T, Friedrich N, Fumeron F, Garcia ME, Gärtner S, Han BG, Havulinna AS, Hayward C, Hernandez D, Hillege H, Ittermann T, Kent JW, Kolcic I, Laatikainen T, Lahti J, Mateo Leach I, Lee CG, Lee JY, Liu T, Liu Y, Lobbens S, Loh M, Lyytikäinen LP, Medina-Gomez C, Michaëlsson K, Nalls MA, Nielson CM, Oozageer L, Pascoe L, Paternoster L, Polašek O, Ripatti S, Sarzynski MA, Shin CS, Narančić NS, Spira D, Srikanth P, Steinhagen-Thiessen E, Sung YJ, Swart KM, Taittonen L, Tanaka T, Tikkanen E, van der Velde N, van Schoor NM, Verweij N, Wright AF, Yu L, Zmuda JM, Eklund N, Forrester T, Grarup N, Jackson AU, Kristiansson K, Kuulasmaa T, Kuusisto J, Lichtner P, Luan J, Mahajan A, Männistö S, Palmer CD, Ried JS, Scott RA, Stancáková A, Wagner PJ, Demirkan A, Döring A, Gudnason V, Kiel DP, Kühnel B, Mangino M, Mcknight B, Menni C, O’Connell JR, Oostra BA, Shuldiner AR, Song K, Vandenput L, van Duijn CM, Vollenweider P, White CC, Boehnke M, Boe- ttcher Y, Cooper RS, Forouhi NG, Gieger C, Grallert H, Hingorani A, Jørgensen T, Jousilahti P, Kivimaki M, Kumari M, Laakso M, Langenberg C, Linneberg A, Luke A, Mckenzie CA, Palotie A, Pedersen O, Peters A, Strauch K, Tayo BO, Wareham NJ, Bennett DA, Bertram L,
Sex-specific association of PLA2G6 rs2760114 and lipid-related phenotypes
12457 Int J Clin Exp Pathol 2016;9(12):12446-12458
Blangero J, Blüher M, Bouchard C, Campbell H, Cho NH, Cummings SR, Czerwinski SA, Demuth I, Eckardt R, Eriksson JG, Ferrucci L, Franco OH, Froguel P, Gansevoort RT, Hansen T, Harris TB, Hastie N, Heliövaara M, Hofman A, Jordan JM, Jula A, Kähönen M, Kajantie E, Knekt PB, Koskinen S, Kovacs P, Lehtimäki T, Lind L, Liu Y, Orwoll ES, Osmond C, Perola M, Pérusse L, Raitakari OT, Rankinen T, Rao DC, Rice TK, Rivadeneira F, Rudan I, Salomaa V, Sørensen TI, Stumvoll M, Tönjes A, Towne B, Tranah GJ, Tremblay A, Uitterlinden AG, van der Harst P, Vartiainen E, Viikari JS, Vitart V, Vohl MC, Völzke H, Walker M, Wallaschofski H, Wild S, Wilson JF, Yengo L, Bishop DT, Borecki IB, Chambers JC, Cupples LA, Dehghan A, Deloukas P, Fatemifar G, Fox C, Furey TS, Franke L, Han J, Hunter DJ, Karjalainen J, Karpe F, Kaplan RC, Kooner JS, McCarthy MI, Murabito JM, Morris AP, Bishop JA, North KE, Ohlsson C, Ong KK, Prokopenko I, Richards JB, Schadt EE, Spector TD, Widén E, Willer CJ, Yang J, Ingelsson E, Mohlke KL, Hirschhorn JN, Pospisilik JA, Zillikens MC, Lindgren C, Kil- peläinen TO and Loos RJ. New loci for body fat percentage reveal link between adiposity and cardiometabolic disease risk. Nat Commun 2016; 7: 10495.
[10] Falchi M, Bataille V, Hayward NK, Duffy DL, Bishop JA, Pastinen T, Cervino A, Zhao ZZ, Deloukas P, Soranzo N, Elder DE, Barrett JH, Martin NG, Bishop DT, Montgomery GW and Spector TD. Genome-wide association study identifies variants at 9p21 and 22q13 associ-ated with development of cutaneous nevi. Nat Genet 2009; 41: 915-919.
[11] Zhang L, Zhong S, Li Y, Ji G, Sundaram M and Yao Z. Global Inactivation of the Pla2g6 Gene in Mice Does Not Cause Dyslipidemia under Chow or High-fat Diet Conditions. J Cancer Prev 2013; 18: 235-248.
[12] Liao PJ, Xie RB, Yin RX, Wei DX, Huang J, Huang F, Li H, Lin WX, Wu JZ and Pan SL. Serum lipid profiles, the prevalence of dyslipidemia and the risk factors in two isolated Chinese minori-ties. Int J Clin Exp Med 2015; 8: 19200-19211.
[13] Xie RB, Liao PJ, Yin RX, Hu XJ, Huang J, Wei DX, Li H, Huang F, Yao LM, Pan SL, Yang DZ and Lin WX. Prevalence of hypertension and associat-ed risk factors in Chinese Jing compared with Mulao populations. J Int Med Res 2015; 43: 819-833.
[14] Sun JQ, Yin RX, Shi GY, Shen SW, Chen X, Bin Y, Huang F, Wang W, Lin WX and Pan SL. Association of the ARL15 rs6450176 SNP and serum lipid levels in the Jing and Han popula-tions. Int J Clin Exp Pathol 2015; 8: 12977-12994.
[15] Guo T, Yin RX, Huang F, Yao LM, Lin WX and Pan SL. Association between the DOCK7, PCSK9 and GALNT2 Gene Polymorphisms and Serum Lipid levels. Sci Rep 2016; 6: 19079.
[16] Guo T, Yin RX, Lin WX, Wang W, Huang F and Pan SL. Association of the variants and haplo-types in the DOCK7, PCSK9 and GALNT2 genes and the risk of hyperlipidaemia. J Cell Mol Med 2016; 20: 243-265.
[17] Rudkowska I, Paradis AM, Thifault E, Julien P, Barbier O, Couture P, Lemieux S and Vohl MC. Differences in metabolomic and transcriptom-ic profiles between responders and non-re-sponders to an n-3 polyunsaturated fatty acids (PUFAs) supplementation. Genes Nutr 2013; 8: 411-423.
[18] Tremblay BL, Cormier H, Rudkowska I, Lemieux S, Couture P and Vohl MC. Association be-tween polymorphisms in phospholipase A2 genes and the plasma triglyceride response to an n-3 PUFA supplementation: a clinical tri-al. Lipids Health Dis 2015; 14: 12.
[19] Caslake MJ, Miles EA, Kofler BM, Lietz G, Curtis P, Armah CK, Kimber AC, Grew JP, Farrell L, Stannard J, Napper FL, Sala-Vila A, West AL, Mathers JC, Packard C, Williams CM, Calder PC and Minihane AM. Effect of sex and genotype on cardiovascular biomarker response to fish oils: the FINGEN Study. Am J Clin Nutr 2008; 88: 618-629.
[20] Thifault E, Cormier H, Bouchard-Mercier A, Rudkowska I, Paradis AM, Garneau V, Ouellette C, Lemieux S, Couture P and Vohl MC. Effects of age, sex, body mass index and APOE geno-type on cardiovascular biomarker response to an n-3 polyunsaturated fatty acid supplemen-tation. J Nutrigenet Nutrigenomics 2013; 6: 73-82.
[21] Yan J, Hu C, Jiang F, Zhang R, Wang J, Tang S, Peng D, Chen M, Bao Y and Jia W. Genetic vari-ants of PLA2G6 are associated with Type 2 dia-betes mellitus and triglyceride levels in a Chinese population. Diabet Med 2015; 32: 280-286.
[22] Hoeft B, Linseisen J, Beckmann L, Müller-Decker K, Canzian F, Hüsing A, Kaaks R, Vogel U, Jakobsen MU, Overvad K, Hansen RD, Knüppel S, Boeing H, Trichopoulou A, Kou- mantaki Y, Trichopoulos D, Berrino F, Palli D, Panico S, Tumino R, Bueno-de-Mesquita HB, van Duijnhoven FJ, van Gils CH, Peeters PH, Dumeaux V, Lund E, Huerta Castaño JM, Muñoz X, Rodriguez L, Barricarte A, Manjer J, Jirström K, Van Guelpen B, Hallmans G, Spencer EA, Crowe FL, Khaw KT, Wareham N, Morois S, Boutron-Ruault MC, Clavel-Chapelon F, Chajes V, Jenab M, Boffetta P, Vineis P, Mouw T, Norat T, Riboli E and Nieters A. Polymorphisms in fatty-acid-metabolism-related genes are as-
Sex-specific association of PLA2G6 rs2760114 and lipid-related phenotypes
12458 Int J Clin Exp Pathol 2016;9(12):12446-12458
sociated with colorectal cancer risk. Carcino- genesis 2010; 31: 466-472.
[23] Bermudez OI, Velez-Carrasco W, Schaefer EJ and Tucker KL. Dietary and plasma lipid, lipo-protein, and apolipoprotein profiles among el-derly Hispanics and non-Hispanics and their association with diabetes. Am J Clin Nutr 2002; 76: 1214-1221.
[24] Garcia-Palmieri MR, Tillotson J, Cordero E, Costas R Jr, Sorlie P, Gordon T, Kannel WB and Colon AA. Nutrient intake and serum lipids in urban and rural Puerto Rican men. Am J Clin Nutr 1977; 30: 2092-2100.
[25] Solá R1, Fitó M, Estruch R, Salas-Salvadó J, Corella D, de La Torre R, Muñoz MA, López-Sabater Mdel C, Martínez-González MA, Arós F, Ruiz-Gutierrez V, Fiol M, Casals E, Wärnberg J, Buil-Cosiales P, Ros E, Konstantinidou V, Lapetra J, Serra-Majem L and Covas MI. Effect of a traditional Mediterranean diet on apolipo-proteins B, A-I, and their ratio: a randomized, controlled trial. Atherosclerosis 2011; 218: 174-180.
[26] Valente EA, Sheehy ME, Avila JJ, Gutierres JA, Delmonico MJ and Lofgren IE. The effect of the addition of resistance training to a dietary edu-cation intervention on apolipoproteins and diet quality in overweight and obese older adults. Clin Interv Aging 2011; 6: 235-241.
[27] Watts GF, Jackson P, Burke V and Lewis B. Dietary fatty acids and progression of coronary artery disease in men. Am J Clin Nutr 1996; 64: 202-209.
[28] Grundy SM and Denke MA. Dietary influences on serum lipids and lipoproteins. J Lipid Res 1990; 31: 1149-1172.
[29] Yu-Poth S, Zhao G, Etherton T, Naglak M, Jonnalagadda S and Kris-Etherton PM. Effects of the National Cholesterol Education Pro- gram’s Step I and Step II dietary intervention programs on cardiovascular disease risk fac-tors: a meta-analysis. Am J Clin Nutr 1999; 69: 632-646.
[30] Rimm EB, Williams P, Fosher K, Criqui M and Stampfer MJ. Moderate alcohol intake and lower risk of coronary heart disease: meta-analysis of effects on lipids and haemostatic factors. BMJ 1999; 319: 1523-1528.