Page 1
ORIGINAL PAPER
Effect of inoculation method on the determinationof decontamination efficacy against Bacillus spores
Shawn P. Ryan • Sang Don Lee • M. Worth Calfee •
Joseph P. Wood • Stella McDonald • Matt Clayton •
Nicole Griffin-Gatchalian • Abderrahmane Touati •
Luther Smith • Melissa Nysewander
Received: 6 March 2014 / Accepted: 3 June 2014 / Published online: 14 June 2014
� The Author(s) 2014. This article is published with open access at Springerlink.com
Abstract Decontamination studies investigating the
effectiveness of products and processes for the inactivation
of Bacillus species spores have traditionally utilized
metering viable spores in a liquid suspension onto test
materials (coupons). The current study addresses the rep-
resentativeness of studies using this type of inoculation
method compared to when coupons are dosed with a
metered amount of aerosolized spores. The understanding
of this comparability is important in order to assess the
representativeness of such laboratory-based testing when
deciding upon decontamination options for use against
Bacillus anthracis spores. Temporal inactivation of B.
anthracis surrogate (B. subtilis) spores on representative
materials using fumigation with chlorine dioxide, spraying
of a pH-adjusted bleach solution, or immersion in the
solution was investigated as a function of inoculation
method (liquid suspension or aerosol dosing). Results
indicated that effectiveness, measured as log reduction,
was statistically significantly lower when liquid inoculation
was used for some material and decontaminant combina-
tions. Differences were mostly noted for the materials
observed to be more difficult to decontaminate (i.e., wood
and carpet). Significant differences in measured effective-
ness were also noted to be a function of the pH-adjusted
bleach application method used in the testing (spray or
immersion). Based upon this work and the cited literature,
it is clear that inoculation method, decontaminant appli-
cation method, and handling of non-detects (i.e., or
detection limits) can have an impact on the sporicidal
efficacy measurements.
Keywords Decontamination � Sporicide � Anthrax �Bacillus anthracis
Introduction
The release of Bacillus anthracis spores from envelopes
mailed through the U.S. Postal Service (USPS) in 2001
(henceforth, Amerithrax) resulted in the first bioterrorism-
related anthrax cases in the U.S. (Jernigan et al. 2001)
Twenty-three facilities were confirmed contaminated to at
least some degree (Sharp and Roberts 2006). In total,
remediation occurred over several years (Sharp and Rob-
erts 2006) and decontamination costs alone (not overall
remediation costs) were estimated to have exceeded $290
million (Schmitt and Zacchia 2012).
At the time of the 2001 incident, the need to decon-
taminate entire public facilities for bioweapons was
unprecedented. No decontamination products or technolo-
gies were registered by the EPA under the Federal Insec-
ticide, Fungicide and Rodenticide Act (FIFRA), and hence
proven, for use against B. anthracis spores (Martin 2003;
Canter 2003). Through on-site trials and vendor-supplied
S. P. Ryan (&) � S. D. Lee � M. W. Calfee � J. P. Wood
US EPA, Office of Research and Development, National
Homeland Security Research Center, MD E343-06; 109 TW
Alexander Dr., Research Triangle Park, NC 27711, USA
e-mail: [email protected]
S. McDonald � M. Clayton � N. Griffin-Gatchalian � A. Touati
Arcadis Geraghty and Miller, Inc., Durham, NC, USA
L. Smith
Alion Science and Technology, Inc., Durham, NC, USA
M. Nysewander
Formerly Alion Science and Technology, Inc., Durham,
NC, USA
123
World J Microbiol Biotechnol (2014) 30:2609–2623
DOI 10.1007/s11274-014-1684-2
Page 2
data, products and application conditions for successful
remediation of the facilities were ultimately selected and
employed. The techniques used, often in combination,
included several liquids with claimed sporicidal efficacy,
fumigants, and removal and off-site treatment of equipment
and materials (Sharp and Roberts 2006). During the overall
remediation efforts, considerable expertise was gained, but
review of these efforts concluded that improved methods
were needed for effective remediation following contami-
nation with B. anthracis spores (Whitney et al. 2003).
One important data gap highlighted from a review of the
Amerithrax incident response was that laboratory data
generated for the assessment of sterilants or disinfectants
for B. anthracis were difficult to interpret relative to the
specific application needs (Whitney et al. 2003). In a
review of data published from 1930 to 2002 on the
chemical inactivation of B. anthracis spores, Spotts Whit-
ney et al. (2003) reported on several difficulties associated
with the homeland security application. One highlighted
difficulty was that results from laboratory experiments do
not specifically address questions regarding the best
methods for inactivating spores on commonly encountered
materials such as mail, carpet, and other porous objects. A
second gap was understanding the relationship between
sporicidal efficacy testing in the laboratory and use in field-
level decontamination.
With regard to efficacy testing, the EPA’s regulatory
standard for performance testing of sporicides (for regis-
tration under FIFRA) remains the Association of Official
Analytical Chemists (AOAC� International) Official
MethodTM 966.04, Sporicidal Activity of Disinfectants
(AOAC International 2006). The AOAC� International test
method also has importance to the U.S. Food and Drug
Administration’s approval process for chemical sterilants
related to sterilization of medical equipment (Tomasino
et al. 2008). However, data generated from Official
MethodTM 966.04 are more relevant to clinical settings
than decontamination of buildings and environmental sur-
faces (Tomasino et al. 2008; AOAC International 2008).
Based upon the recognized needs, as highlighted in Spotts
Whitney et al. (2003), EPA has developed additional
quantitative test methods to determine the efficacy of
sporicidal decontaminants on surfaces relevant to field-use
(Ryan et al. 2010). Currently, demonstration of a [6-log
inactivation of B. anthracis or an appropriate surrogate
spore (e.g., B. subtilis) using a quantitative test method,
such as AOAC� International Method 2008.05 (AOAC
International 2008), ASTM 2197-02 (ASTM International
2002), or ASTM 2414-05 (ASTM International 2005), by a
decontaminant is being considered as a requirement for
product registration as a sporicidal agent against spores of
B. anthracis (U.S. Environmental Protection Agency FI-
FRA SAP Meeting No. 2007-50 2007).
Considerable data have been generated using the
methods cited above or similar, acceptable, quantitative
methods regarding product efficacy against B. anthracis
spores on complex material surfaces, such as those found in
facilities and outdoors (U.S. EPA 2011b; Wood et al. 2011;
Calfee et al. 2011; U.S. EPA 2007, 2010; Wood 2009;
Rogers et al. 2005, 2006, 2007; Ryan et al. 2012; Calfee
2012; Rastogi et al. 2010). These results helped bridge a
critical knowledge gap with respect to relevant product
efficacy. However, as summarized by Ryan et al. (2010) all
of these methods are carrier-based in which a piece of test
material is inoculated with a spore suspension. An advan-
tage of liquid inoculation is accuracy and precision in the
application of the target organism onto the materials; i.e., a
predetermined and highly repeatable amount of an organ-
ism can be applied to carriers. However, during the
Amerithrax incident, surfaces were contaminated with a
dry powder (Weis et al. 2002). While there are many
advantages to the use of liquid inoculation, the correlation
between such testing and the decontamination of aerosol-
deposited biological organisms (primarily dried spores)
remains undetermined. Potential clumping, penetration of
the liquid within materials, and layering during the physi-
cal drying process on non-porous materials (i.e., outer edge
of the droplet becoming higher in concentration of the
organism as the spot dries) suggest that biological organ-
isms deposited as liquids may be more difficult to inacti-
vate on some surfaces than the same organisms deposited
as aerosols (Sansoe-bourget 2006). Along the same lines,
Edmonds et al. (Edmonds et al. 2009) reported a difference
in recovery when sampling liquid- and aerosol-deposited
spores.
The focus of the current study was to assess the impact
of the inoculation method on the determination of spori-
cidal efficacy determined at various contact times related to
Bacillus spores. Two decontaminants were chosen for this
effort, chlorine dioxide gas and pH-adjusted bleach. These
decontaminants were chosen based upon the breadth of
existing data utilizing these chemicals, their effectiveness,
and likelihood of being used in the case of future incidents
(Ryan et al. 2010). These data further our understanding of
the relationship between laboratory-determined efficacy
via traditional methods and anticipated effectiveness of
products in field applications.
Materials and methods
For this study, uniform pieces of building materials
(henceforth, referred to as coupons) were inoculated with
spores of Bacillus subtilis and treated using one of three
decontamination procedures. Decontamination efficacy
was determined based upon the comparison of the number
2610 World J Microbiol Biotechnol (2014) 30:2609–2623
123
Page 3
of spores [measured as colony forming units (CFUs)]
recovered from coupons not exposed to decontamination
versus the recovered CFUs from decontaminated coupons.
Temporal differences in decontamination efficacy were
used to elucidate the impact of the inoculation method as a
function of coupon material type and decontamination
procedure. The test matrix included a variation of the latter
two parameters (material type and decontamination pro-
cedure) in order to ensure that the impact could be as
broadly understood as possible, within the bounds of the
study. This section discusses the spore preparation, coupon
preparation, decontamination methods, sample analysis
protocols, and statistical data analysis methodology.
Spore preparation
The Bacillus subtilis spores (ATCC 19659, Manassas VA)
were prepared as previously reported by Rastogi et al.
(2009), Rogers et al. (2005) and further described in Lee
et al. (2011). Briefly, a seed culture was initiated in tryptic
soy broth (TSB) and then sporulated on sporulation media
at 37 �C for 10 ± 4 days. The sporulation media was a
mixture of 23 g Lab Lemko (Oxoid Ltd., Hampshire, UK)
agar, 2 g tryptone (Fisher Scientific, Fair Lawn, NJ), 23 g
yeast extract (Becton–Dickinson, Sparks, MD), 1 % MnCl2(Sigma Chemical Co., St. Louis, MO) and 2 g agar (Bec-
ton–Dickinson, Sparks, MD). Microscopy (BX50, Olym-
pus�, Miami, FL) was used to determine at least 90 % of
the cells had sporulated. The spores were then harvested
and triple washed (centrifugation followed by resuspension
with chilled deionized water). The resulting spore prepa-
ration was reconstituted in chilled deionized water and
heat-shocked at 65 �C for 30 min.
For use in aerosol inoculation of the coupons, the spore
preparations were then loaded into metered dose inhalers
(MDIs) by the aerosol science laboratory at Edgewood
Chemical and Biological Center (Aberdeen Proving
Ground, MD) as described in Carrera et al. (2005). Each
MDI contained Bacillus subtilis spores in an ethanol
(analytical reagent grade, Mallinckrodt Inc., Paris, KY)
solution and propellant. The spore concentration in an MDI
was 0.5 or 0.05 % w/w (resulting in approximately 108 and
109 CFU per MDI actuation, respectively).
Material coupon preparation
The material types used in this study were chosen based
upon results from previously published decontamination
studies (U.S. EPA 2011b; Wood et al. 2011; Calfee et al.
2011; Rogers et al. 2005, 2006, 2007; U.S. EPA 2007,
2010; Wood 2009; Ryan et al. 2012; Calfee 2012; Rastogi
et al. 2010). The intent was to utilize materials that are
common to indoor decontamination scenarios and cover a
range of outcomes (i.e., efficacies), as partial inactivation
was desirable for robust comparisons (Rastogi et al. 2010).
The four selected materials included industrial carpet
(Mannington� Integra HPTM, The Home Depot�, Cary,
NC), latex primed and painted wallboard paper (Georgia
Pacific sheetrock facing painted with Painter’s Select�
(True Value�) Interior PVA drywall primer (PVA-1
white), then Interior Flat finish EZF-1 White Acabado
paint), bare structural fir wood (The Home Depot�, Cary,
NC), and galvanized steel (East Coast Metal, Durham,
NC). Each material type was cut into 18 mm diameter
discs with thicknesses of *6 mm (carpet), 0.5 mm (pain-
ted wallboard paper), *5 mm wood, or 0.6 mm (galva-
nized steel). Each material disc was then affixed to an
18 mm diameter aluminum stub (Ted Pella Inc., Redding,
CA) using double-sided carbon tape (Ted Pella Inc.,
Redding, CA). This combination of material/stub was
referred to as a material coupon. All coupons were steril-
ized by autoclaving (121 �C for 60 min) prior to inocula-
tion and used in the testing described below. Further
information on the coupon preparation process can be
found in Lee et al. (2011).
Coupon inoculation
Coupons were inoculated with spores using one of two
distinct methods, inoculation with a liquid suspension or
via aerosol deposition using the MDI. Regardless of
method, the target loading of viable spores was 107
(measured as CFU) per coupon. For liquid inoculation, B.
subtilis spores were suspended in distilled water at a con-
centration of 108 CFU/ml and one, 100 ll droplet of this
solution was applied to the material surface using a
micropipette. The coupons were allowed to dry overnight
in a BioSafety Cabinet (BSC); the liquid inoculum
remained on the surface as a droplet until the water evap-
orated (used the same day as inoculation). One exception to
the observed drying was the wood coupons, in which the
inoculum rapidly soaked into the material.
Test treatments and controls
For the aerosol-based method, coupons were inoculated
using MDIs, as described in Lee et al. (2011). The steril-
ized coupon was positioned inside the particle deposition
chamber. The coupon center and the MDI nozzle were
aligned and the distance between the coupon surface and
the MDI actuator nozzle was adjusted. After the coupon
and MDI were set up, each coupon was inoculated one time
by activating the MDI canister. The aerosol-impacted
coupon was then immediately removed from the chamber
using a sterilized gripper and transported to a circular
stainless steel transporting disc. The inoculated coupons
World J Microbiol Biotechnol (2014) 30:2609–2623 2611
123
Page 4
were then transported for analysis to the microbiology
laboratory.
Four designations of coupons were used in this study:
test, positive control, negative control, and blank. Test and
positive control coupons were inoculated with spores via
one of the two methods described above. Test coupons
underwent one of the decontamination methods described
below, after their inoculation. Positive controls were not
exposed to the decontamination method, however, they
were inoculated and extracted along-side the test coupons.
Positive controls provided for the determination of viable
spore (as CFUs) prior to any decontamination treatment
applied to the test coupons. Blank coupons were not
inoculated, but they underwent the same decontamination
method as the test coupons. The blank coupons were used
to indicate any issues related to cross-contamination within
this study. For the liquid decontaminant testing, negative
control coupons were also used. These coupons were not
inoculated nor underwent the decontamination process.
The negative control coupons were used to indicate any
cross-contamination due to laboratory analysis. The test
treatments and replicates per treatment are presented in
Tables 1, 2 and 3.
Decontamination methods
Three different decontamination methods were used in this
study, utilizing two different chemical decontaminants.
These decontamination methods were chosen for this study
based upon their effectiveness in previous studies, among
the many decontaminants considered (Ryan et al. 2010).
The first decontamination method (Decontamination
Method 1) was fumigation of the coupons with chlorine
dioxide gas (ClO2). The second and third methods utilized
a pH-adjusted bleach solution (pAB) applied to the cou-
pons either by spraying the solution onto the coupon
(Decontamination Method 2) or by immersion of the cou-
pon into the solution (Decontamination Method 3).
In Decontamination Method 1, a 730 l glove box
(Compact Glove Box 830-ABD, Plas Labs, Inc., Lansing,
MI) was covered with foil-backed insulation to make it
opaque (because ClO2 is light sensitive) and used as the
Table 1 Test matrix for fumigation ClO2 (750 ppmv ClO2, 24 �C, 75 % RH)
Test Material type Inoculation
method
Actual chamber Contact times (h) Coupon numbers
ClO2
concentration
(ppmv) (SD)
Temperature
(�C) (SD)
% RH (SD) Positive
controlsaTestb Field
blanksb
1 Carpet Aerosol 688 (21) 23.9 (0.06) 75.2 (0.2) 1, 2, 4, 6, 12 3 3 1
Liquid 3 3 1
2 Galvanized steel Aerosol 699 (17) 24.0 (0.11) 77 (0.5) 1, 2, 4, 6, 12 3 3 1
Liquid 3 3 1
3 Wood Aerosol 670 (57) 23.2 (0.38) 75.8 (2.6) 1, 2, 4, 6, 12 3 3 1
Liquid 3 3 1
4 Painted wallboard
Paper
Aerosol 698 (24) 23.9 (0.08) 84.2 (0.6) 1, 2, 4, 6, 12 3 3 1
Liquid 3 3 1
a Number of coupons per testb Number of coupons per time point within a test
Table 2 Test matrix for the
pAB spray tests
a Number of coupons per testb Number of coupons per time
point within a test
Test Material type Inoculation
method
Contact times
(min)
Coupon numbers
Positive
controlsaTestb Field
blanksb
1A Galvanized steel Aerosol 10, 30, 60 5 5 1
1L Liquid 5 5 1
2A Carpet Aerosol 10, 30, 60 5 5 1
2L Liquid 5 5 1
3A Wood Aerosol 10, 30, 60 5 5 1
3L Liquid 5 5 1
4A Painted wallboard
paper
Aerosol 10, 30, 60 5 5 1
4L Liquid 5 5 1
2612 World J Microbiol Biotechnol (2014) 30:2609–2623
123
Page 5
fumigation chamber. The glove box, with anti-chamber,
provided a leak-free atmosphere for fumigations, and
allowed the periodic addition or removal of coupons during
testing. ClO2 was generated on-site by a Sabre S07-012
ClO2 generator (Sabre Technical Services, LLC, Albany,
NY). The S07-012 generates ClO2 on a laboratory scale in
the same manner as the fumigant is generated for a large-
scale fumigation. An aqueous solution of chlorine dioxide
is made by mixing hydrochloric acid and sodium chlorite in
the presence of aqueous hypochlorite. The chlorine dioxide
is then stripped from solution into an air stream moving
through a column, thus generating ClO2 gas.
ClO2 was fed into the fumigation chamber through an
actuated valve via polyethylene tubing (1 cm diameter)
from the stripping column. The concentration of ClO2 was
measured in real-time via a ClorDiSys EMS monitor
(ClorDiSys Solutions, Inc., Lebanon, NJ) and confirmed
every 30 min throughout a fumigation cycle by air sam-
pling and analysis done via adaption of a standard
amperometric method (4500-ClO2 Chlorine Dioxide, E.
Amperometric Method II 1995). This adapted method for
gas sampling for ClO2 is described in detail in Wood et al.
(2010). Briefly, gas from the chamber is sampled through a
series of impingers containing a potassium iodide phos-
phate buffer (KIPB) solution. The ClO2 absorbs and reacts
with the potassium iodide. After sampling a predetermined
volume of air, the ClO2 concentration in the chamber air
was determined following titration of the sample with
sodium thiosulphate (STS). The real-time concentration
measured by the ClorDiSys EMS monitor was used for
feedback control, via the actuation of the valve to allow
ClO2 into the chamber as needed.
The relative humidity (RH) inside the fumigation
chamber was also controlled via a feedback loop, with
measurement made by the ClorDiSys EMS monitor. The
monitor utilized a Vaisala RH/Temperature sensor (model
HMD40Y, Vaisala, Helsinki, Finland) to measure RH in
real-time. When the RH reading was lower than the RH
setpoint, solenoid valves were opened to inject humid air
from a gas humidity bottle (LF-HBA, Fuel Cell Technol-
ogies, Albuquerque, NM). The gas humidity bottle, heated
to 60 �C, passed compressed air through Nafion� tubes
surrounded by de-ionized water, creating a warm air stream
saturated with water vapor. Similarly, temperature was
measured with the Vaisala sensor, and via the ClorDiSys
EMS monitor. Temperature control was achieved by fans
passing air over temperature-controlled water in radiators.
In addition to the three switched fans in operation during
heating or cooling, a single fan was always in operation to
provide mixing. A pressure relief valve was added to the
chamber to prevent over-pressurization (above a set-point);
the chamber was maintained under a slight vacuum.
A fumigation cycle consisted of placing the Petri dishes
containing the test and blank coupons into the chamber,
equilibrating the chamber to the desired temperature and
RH for the cycle, introducing ClO2 as necessary to achieve
and maintain the target concentration (±10 % target) for
the duration of the cycle (longest time point, see Table 1),
followed by aeration of the chamber to reduce the chamber
atmosphere to a non-detectable ClO2 concentration. The
target temperature and RH were maintained within
±0.5 �C and 10 %, respectively. Sets of coupons in Petri
dishes were removed at discrete time points during the
fumigation cycle in order to determine decontamination
efficacy as a function of exposure duration at each ClO2
target concentration. Coupons were aerated inside the air-
lock prior to removal from the glove box; this aeration was
considered neutralization of the samples following decon-
tamination in accordance with previous ClO2 studies
(Rogers et al. 2006). All coupons were transferred to the
on-site microbiology lab in sealed Petri dishes, for analysis
as described in the ‘‘Sample extraction and enumeration’’
section.
Coupons were fumigated with 750 ppmv ClO2 for up to
12 h at 24 �C and 75 % RH. Sets of coupons were removed
at 1, 2, 4, 6, and 12 h. The test matrix is shown in Table 1.
A coupon set consisted of 3 test coupons inoculated by
aerosol deposition, three test coupons inoculated via liquid
Table 3 Test matrix for the
pAB immersion tests
a Number of coupons per testb Number of coupons per time
point within a test
Test Material type Inoculation
method
Contact
times (min)
Coupon numbers
Positive
controlsaTestb Negative
controlsaField
blanksb
1 Galvanized steel Aerosol 1, 15, 20, 30, 60 3 5 3 1
Liquid 3 5 3 1
2 Carpet Aerosol 1, 10, 20, 30, 60 3 5 3 1
Liquid 3 5 3 1
3 Wood Aerosol 1, 10, 20, 30, 60 3 5 3 1
Liquid 3 5 3 1
4 Painted wallboard paper Aerosol 1, 10, 20, 30, 60 3 5 3 1
Liquid 3 5 3 1
World J Microbiol Biotechnol (2014) 30:2609–2623 2613
123
Page 6
suspension, and one blank coupon. A complete fumigation
cycle included five coupon sets (one for each exposure
duration); each material type was run as a separate fumi-
gation cycle. Three positive controls from each inoculation
method (liquid and aerosol) were included in with each test
(cycle).
For Decontamination Methods 2 and 3, pAB was pre-
pared in accordance with the U.S. EPA crisis exemption
requirements for use against B. anthracis spores. (U.S.
EPA 2007) pAB was prepared by mixing one part Clorox�
bleach (5–6 % sodium hypochlorite; within 1 year of
manufacture), nine parts deionized water, and enough 5 %
white distilled vinegar (Great Value Model 35255, Wal-
mart, Bentonville, Arkansas) to yield a solution having a
mean pH of 6.8 and a mean total chlorine content of
6,000–6,700 ppm. Concentration was determined using a
Hach CN-HRDT Hypochlorite test kit (Hach Company,
Loveland, CO), which uses Hach iodometric Method
10100. An Oakton Acorn pH5 meter was used to measure
the acidity of the solution.
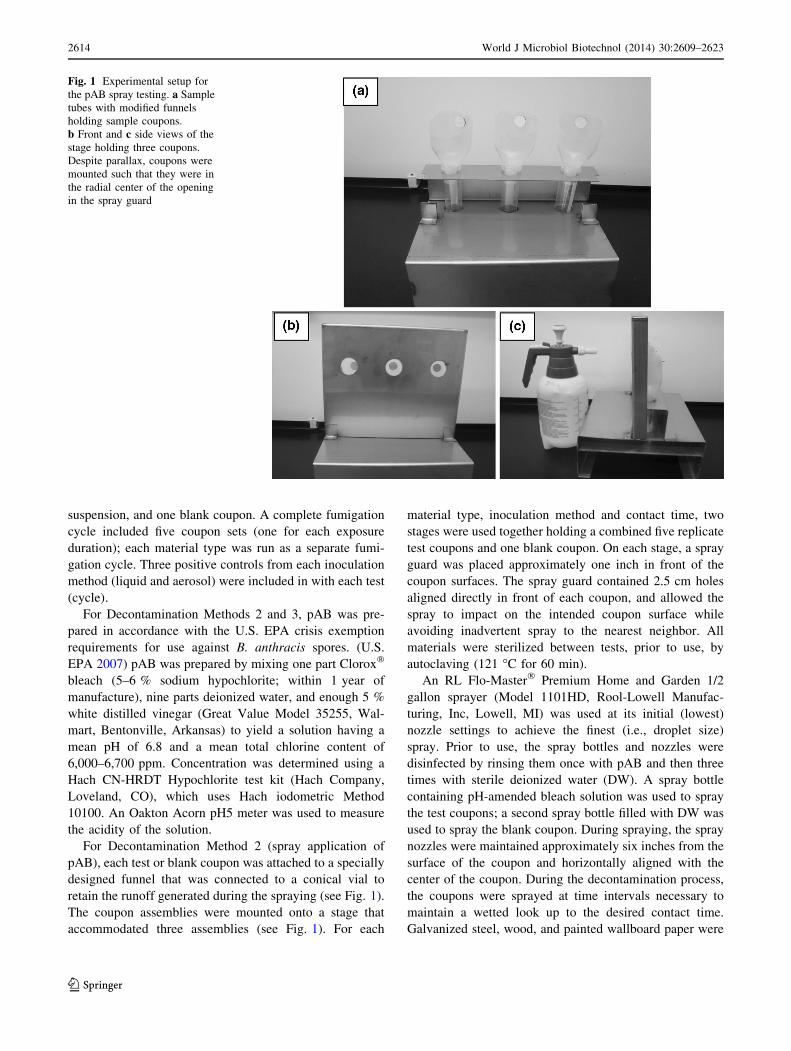
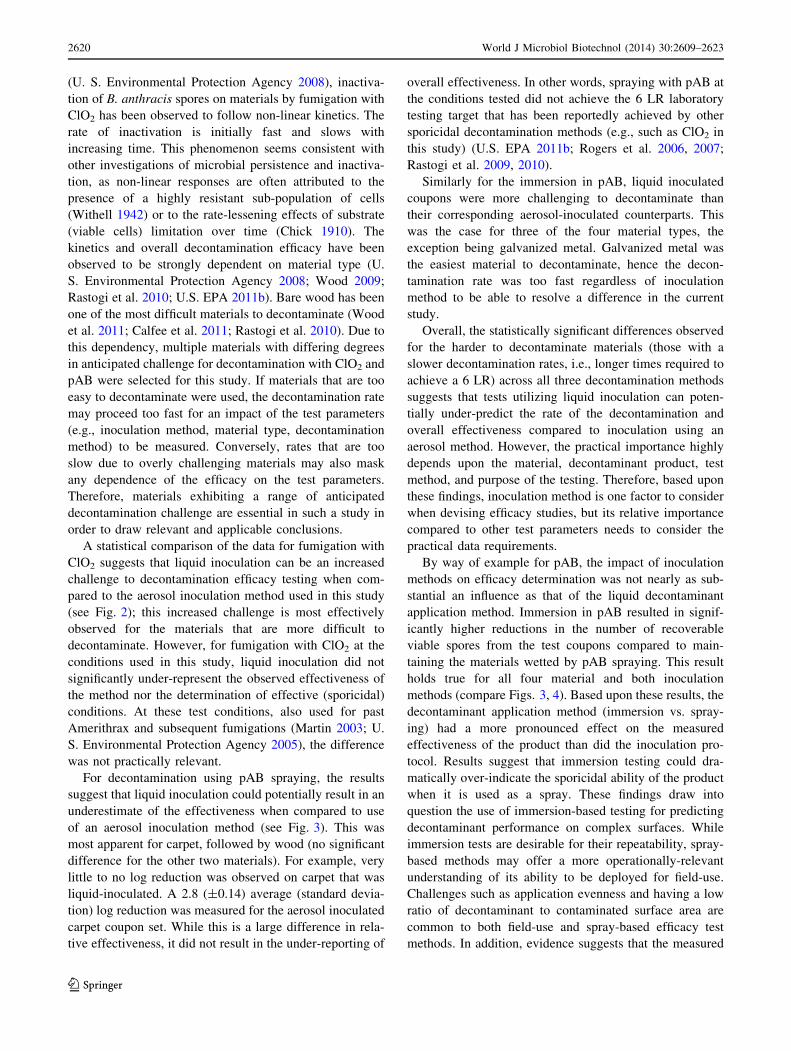
For Decontamination Method 2 (spray application of
pAB), each test or blank coupon was attached to a specially
designed funnel that was connected to a conical vial to
retain the runoff generated during the spraying (see Fig. 1).
The coupon assemblies were mounted onto a stage that
accommodated three assemblies (see Fig. 1). For each
material type, inoculation method and contact time, two
stages were used together holding a combined five replicate
test coupons and one blank coupon. On each stage, a spray
guard was placed approximately one inch in front of the
coupon surfaces. The spray guard contained 2.5 cm holes
aligned directly in front of each coupon, and allowed the
spray to impact on the intended coupon surface while
avoiding inadvertent spray to the nearest neighbor. All
materials were sterilized between tests, prior to use, by
autoclaving (121 �C for 60 min).
An RL Flo-Master� Premium Home and Garden 1/2
gallon sprayer (Model 1101HD, Rool-Lowell Manufac-
turing, Inc, Lowell, MI) was used at its initial (lowest)
nozzle settings to achieve the finest (i.e., droplet size)
spray. Prior to use, the spray bottles and nozzles were
disinfected by rinsing them once with pAB and then three
times with sterile deionized water (DW). A spray bottle
containing pH-amended bleach solution was used to spray
the test coupons; a second spray bottle filled with DW was
used to spray the blank coupon. During spraying, the spray
nozzles were maintained approximately six inches from the
surface of the coupon and horizontally aligned with the
center of the coupon. During the decontamination process,
the coupons were sprayed at time intervals necessary to
maintain a wetted look up to the desired contact time.
Galvanized steel, wood, and painted wallboard paper were
Fig. 1 Experimental setup for
the pAB spray testing. a Sample
tubes with modified funnels
holding sample coupons.
b Front and c side views of the
stage holding three coupons.
Despite parallax, coupons were
mounted such that they were in
the radial center of the opening
in the spray guard
2614 World J Microbiol Biotechnol (2014) 30:2609–2623
123
Page 7
sprayed initially and at 3 min intervals while carpet
required 4 min intervals, for the duration of the contact
time. After the desired contact time, each coupon was
aseptically transferred to a sample tube containing 10 ml
BBLTM buffered peptone water (BDTM; Becton, Dickinson,
and Company; Franklin Lakes, NJ) containing 0.01 %
Tween-80TM (Fisher Scientific, Pittsburgh, PA)10 ml of
buffered peptone water (BPW) (make model, manufac-
turer, location). Each funnel was rinsed with 20 ml of DW
and 10 ml of BPW was then added to the rinsate. All
samples were capped and transferred to the on-site
microbiology lab for analysis as described in the ‘‘Sample
extraction and enumeration’’ section.
For Decontamination Method 3 (immersion in pAB),
test coupons were aseptically transferred to individual
50 ml sterile centrifuge tubes into which 10 ml of pAB was
added to each using a sterile serological pipette. The cou-
pons remained submerged in the pAB for the desired
contact time, after which point the solution was neutralized
with the addition of 10 ml of a sterile STS solution to each
centrifuge tube. The solution from each tube was then
decanted into separate sterile 50 ml sample tubes, and
retained. BPW (10 ml) was then added to each tube con-
taining the coupon. All samples (centrifuge tubes with
coupons and decanted, neutralized pAB) were capped and
transferred to the on-site microbiology lab for analysis as
described in the ‘‘Sample extraction and enumeration’’
section. The matrices of tests involving pAB can be found
in Tables 2 (spray) and 3 (immersion).
Sample extraction and enumeration
As described in Lee et al. (2011), coupons from Decon-
tamination Methods 1 testing were aseptically removed
from the Petri dishes and placed in 50 ml sterile vials with
10 ml BPW with Tween 80. For Decontamination Methods
2 and 3, coupons were already in sterile vials in the buffer
solution (see above). To extract the spores from the coupon
surface, coupons were subjected to a 10 min sonication
(Ultrasonic Cleaner FS140, Fisher Scientific, Pittsburg,
PA) followed by 2 min vortexing (Mini Vortexer 128,101,
Fisher Scientific, Pittsburg PA). Ten-fold serial dilutions
were then prepared for each sample, as needed, by adding
0.1 ml of the aqueous buffer from the sample to 0.9 ml of
BPW using a micropipette. Appropriate dilutions were
spread in triplicate (0.1 ml each) onto TSA (BDTM; Bec-
ton, Dickinson, and Company; Franklin Lakes, NJ) plates
and incubated at 35 ± 2 �C for approximately 18 h. Col-
onies consistent with the morphology of the target organ-
ism were then counted manually for all plates. Results
(CFU) were reported for all plates having between 0 and
300 colonies. The surface spore concentration (CFU/cou-
pon) reported for each sample was determined by
averaging the results from triplicate subsamples and cal-
culating per Eq. (1).
CFU
coupon¼ P� V
I � Dð1Þ
In Eq. (1), P is the average of the CFU on the triplicate
plates, I is the volume of sample added to each plate
(0.1 ml), D is the tube dilution factor, and V is the total
volume of liquid in the sample extract (typically, 10 ml in
this study as described above). The initial tube containing
the 10 ml of extraction solution is considered the zero
dilution (10�). Therefore, as an example, an average of
100 CFU on the triplicate plates determined from the third
dilution (10-3) would equate to 1.0 9 107 CFU/coupon. At
the lowest limit of observable growth, 1 CFU on one of
three triplicate plates at the zero dilution would equate to a
mean value of 33 CFU/coupon. While this mean value is
the lowest non-zero average spore recovery that can be
determined from the current method, it is not the method
detection limit (MDL) since it does not account for the
probability of detection due to sub-sampling (e.g., sam-
pling a total of 0.3 ml out of 10 ml).
When no viable spores were detected on a plate, a value
of 0.5 CFU (one-half the quantitation limit of detection,
1 CFU) was substituted for zero (i.e., 0.5 CFU/sample
(coupon)). The substitution of the quantitation limit (or
one-half this limit) is consistent with the treatment of non-
detects in similar published work (U.S. EPA 2011b;
Rastogi et al. 2009, 2010; U.S. EPA 2010).
Data analysis
For statistical analysis, the data were fit to an exponential
model (Eq. (2)) of the form:
log10ðy=yoÞ ¼ að1� ebCTÞ ð2Þ
Here, y is the average number of spores on each plate (in
CFUs) from test coupon extracts, yo is the average number
of spores (CFU) recovered from the corresponding positive
control coupon extracts, a is the multiplicative term used
for scaling, b is a term indicating the rate of decontami-
nation, C is the concentration of ClO2 (in ppmv), and T is
the time (in hours) the coupon was in contact with the
decontaminant. For the pAB data, C was set to unity since
concentration was not a parameter in this part of this study.
The resulting fit parameters (a, b) for each combination of
inoculation method, material type, and decontamination
method (ClO2, pAB spray, and pAB immersion) were
determined (using Origin� 7, OriginLab�, Northampton,
MA), including the best-fit values, approximate error, and
95 % confidence interval. These data were used to test for
statistically significant differences due to variations in
study parameters, at the 95 % confidence level. This model
World J Microbiol Biotechnol (2014) 30:2609–2623 2615
123
Page 8
was used to provide a best empirical fit to the data and not
to imply understanding of the inactivation kinetics.
Expressing the data as log10 (y/yo), as in Eq. (2), is
consistent with the reporting of log reduction (LR) as done
in other relevant efficacy studies (U.S. EPA 2010, 2011b;
Rastogi et al. 2009, 2010; Calfee et al. 2011; Wood et al.
2011). However, in these citations, LR is typically reported
as the inverse (i.e., log10 (yo/y)). In both cases, the mag-
nitude of the reported value is the equivalent and can be
compared across studies.
Direct comparisons of average values, e.g., positive
controls or LR values from two test groups, were per-
formed where discussed using the Student’s t Test. An
unpaired test with a confidence interval of 0.05 (95 %) was
used to calculate statistical probabilities. A two-tail pvalue
was used to indicate the chance that randomly selected
samples could have means at least as far apart as observed
if the null hypothesis were to be true. The null hypothesis
was that there was no difference in the means of the test
groups; i.e., the means are likely from the same population.
It should be noted that although a small pvalue (i.e.,\0.05)
may suggest that the null hypothesis is false, other factors
may also contribute. The evidence should not automati-
cally be taken to disprove the truth of the hypothesis. For
example, 95 % confidence intervals lying entirely within
the range of indifference may tend to provide further
support that the means were truly different to experimental
parameters (e.g., inoculation method).
Results
The average recoveries for all positive controls used in this
study are reported in Table 4, as a function of inoculation
method and material type.
For the fumigation cycles, the actual chamber ClO2
concentration, temperature, and RH for the four tests are
shown in Table 1. For the spray and immersion tests, the
pAB was determined to be within the target pH and chlo-
rine content ranges prior to use in all tests. The pAB
solution was prepared fresh on each day of testing and used
within 3 h of preparation.
None of the negative control and blank coupons used
throughout this study indicated any evidence of cross-
contamination. No viable target organism was recovered
from any of the blanks or negative controls.
The reduction in viable spores recovered from the
liquid- and aerosol-inoculated test coupons was evaluated
as a function of exposure time for fumigation with ClO2,
spraying with pAB, or immersion in pAB. The average log
of the reduction (with standard deviation) is plotted as a
function of time for each of the decontamination treatments
in Figs. 2, 3 and 4. Additionally, the data fits using Eq. (2)
and the 95 % confidence intervals are plotted. Where
confidence intervals do not overlap, significant difference
in the resulting fits is suggested. The rate of decontami-
nation can be observed in Figs. 2, 3 and 4 as the increasing
magnitude of LR as a function of time.
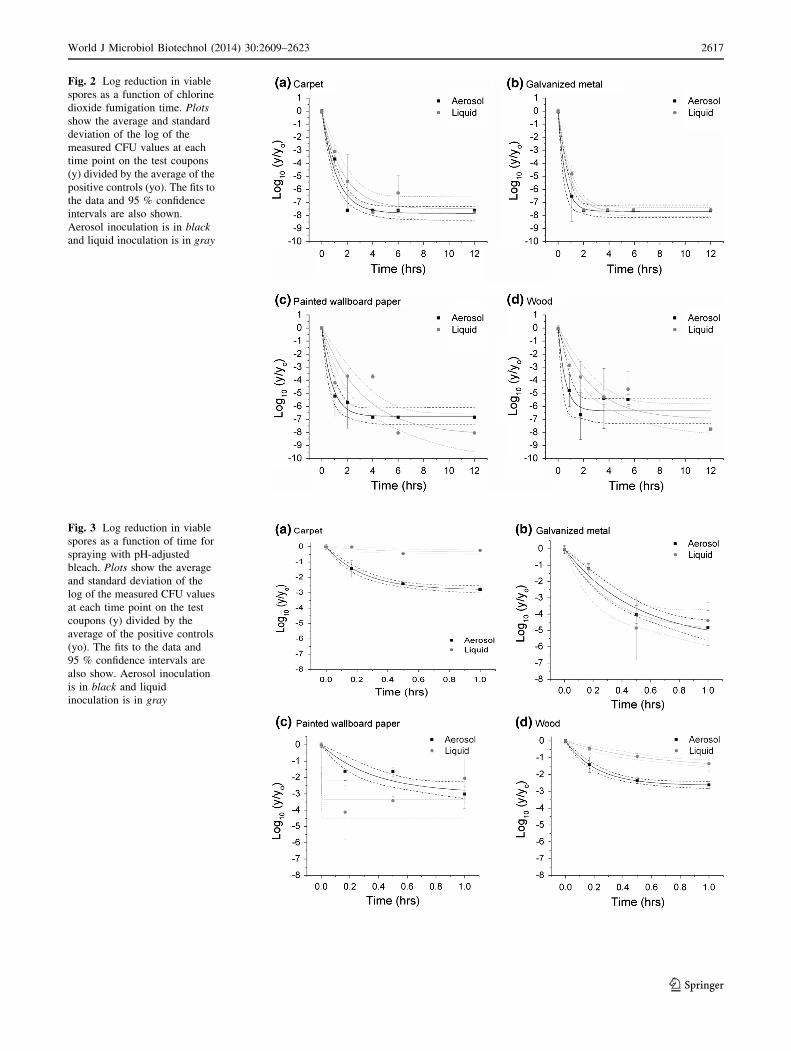
Based upon statistical analysis of fit comparisons, no
impact of the inoculation method on the overall log reduc-
tion was observed for fumigation with ClO2 under the con-
ditions used in this test (i.e., at the 12 h time point). A greater
than 6 LR was observed for all materials by 6 h of fumiga-
tion at 750 ppmv (75 % RH and 24 �C). In all cases, no
detectable CFUs were recovered from any test coupons by at
least the maximum fumigation time (12 h) for all four
material types. However, the actual time required to achieve
that 6 LR was a function of the material type, and (depending
upon the material) inoculation method.
In general, the rate of decontamination was lower for the
liquid inoculated coupons compared to the aerosol inocu-
lation on the same material type. However, the difference
was not statistically significant for all material types.
Galvanized metal was the easiest to decontaminate, as
noted by the most rapid decrease in recovered viable spores
compared to the positive controls for that material (i.e.,
decrease in Log10 (y/yo)). Wood was the most difficult. For
liquid inoculation, the order of increasing difficulty in
decontamination was: galvanized metal, painted wallboard
paper, carpet, and wood. For aerosol inoculation, the order
of increasing difficulty (slower rate of decontamination)
was: galvanized metal, painted wallboard paper & car-
pet & wood. A statistically significant difference in the
rate of decontamination was not observed for the latter
three materials. For painted wallboard paper and wood, the
rate of decontamination was significantly slower for liquid-
compared to aerosol-inoculated coupon sets. Although the
rate for the liquid inoculated coupon sets was also esti-
mated to be less than that of aerosol-inoculated sets for
carpet and galvanized metal, this difference was not quite
statistically significant.
Table 4 Average CFU and residual standard deviation (RSD) from
positive controls
Material type Inoculation
method
Average
CFU
RSD
(%)
Number of
replicates
Galvanized steel Aerosol 3.46E?07 36 10
Liquid 2.50E?07 29 9
Carpet Aerosol 6.84E?07 61 11
Liquid 3.84E?07 41 11
Wood Aerosol 1.04E?08 25 11
Liquid 2.66E?07 59 11
Painted
wallboard
paper
Aerosol 8.22E?06 34 9
Liquid 4.83E?07 27 10
2616 World J Microbiol Biotechnol (2014) 30:2609–2623
123
Page 9
Fig. 2 Log reduction in viable
spores as a function of chlorine
dioxide fumigation time. Plots
show the average and standard
deviation of the log of the
measured CFU values at each
time point on the test coupons
(y) divided by the average of the
positive controls (yo). The fits to
the data and 95 % confidence
intervals are also shown.
Aerosol inoculation is in black
and liquid inoculation is in gray
Fig. 3 Log reduction in viable
spores as a function of time for
spraying with pH-adjusted
bleach. Plots show the average
and standard deviation of the
log of the measured CFU values
at each time point on the test
coupons (y) divided by the
average of the positive controls
(yo). The fits to the data and
95 % confidence intervals are
also show. Aerosol inoculation
is in black and liquid
inoculation is in gray
World J Microbiol Biotechnol (2014) 30:2609–2623 2617
123
Page 10
Similarly, during the pAB spray-based tests, the liquid-
inoculated coupon sets were more difficult to decontami-
nate than their aerosol counterparts (see Fig. 3) for some
materials based upon comparison of decontamination rates
and overall log reductions. The difference was greatest for
carpet and wood, the two most difficult to decontaminate
materials by this method. No observed difference in the
rate of decontamination as a function of inoculation
method was observed on galvanized metal, the easiest
material to decontaminate using pAB spraying. The model
did not fit well for the liquid inoculated painted wallboard
paper; this was due to the wide variability observed at each
time point for this coupon set/decontaminant combination.
In all cases, regardless of material type or inoculation
method, a 6 LR was not achieved within a 1 h contact time
(with repeated decontaminant applications as noted in the
‘‘Materials and methods’’ section).
Immersion in pAB resulted in significantly greater
magnitude log reduction values for both liquid and aerosol
inoculation compared to the results from the spray testing
(see Fig. 4). This was true for all materials and both
inoculation methods. Statistically significant differences in
efficacy were noted for liquid versus aerosol inoculation
for carpet, painted wallboard paper, and wood coupon sets.
Decontamination of three of the four materials was sig-
nificantly more difficult for the liquid inoculated coupons
both in terms of an observed slower rate of decontamina-
tion and the final log reduction values, However, no
observable, statistically significant, difference with respect
to the impact of inoculation method was detected for gal-
vanized metal; this material was again among the easiest to
decontaminate. In the case of the other three materials, the
inoculation method had a dramatic impact on the efficacy.
The magnitude of the log reduction measured by the aer-
osol inoculation method was at least 5, and reached 6 for
painted wallboard paper. Alternatively, for the liquid
inoculated coupon sets, the magnitude of the log reduction
was less than 4 for painted wallboard paper and less than 2
for both carpet and wood.
Discussion
The target spore loading in this study was at least 107 CFU
(7 logs) per coupon with a relative standard deviation
(RSD) of less than 50 % for each material type. This target
loading (Table 4), based upon the analysis of the positive
controls, allowed for a greater than 6 LR to be determined
with respect to the effectiveness of the decontamination
parameters. A 6 LR has been used as a standard for the
definition of an effective decontaminant against B. an-
thracis (U.S. Environmental Protection Agency FIFRA
Fig. 4 Log reduction in viable
spores as a function of time for
immersion in pH-adjusted
bleach. Plots show the average
and standard deviation of the
log of the measured CFU values
at each time point on the test
coupons (y) divided by the
average of the positive controls
(yo). The fits to the data and
95 % confidence intervals are
also show. Aerosol inoculation
is in black and liquid
inoculation is in gray
2618 World J Microbiol Biotechnol (2014) 30:2609–2623
123
Page 11
SAP Meeting No. 2007-50 2007; Ryan et al. 2010; U.S.
EPA 2010); hence, test protocols meant to produce data
with respect to the quantitative effectiveness of decon-
tamination methods should have at least a 6 log dynamic
range.
Consistent with the findings reported by Lee et al.
(2011), the results from the positive controls from all
coupons inoculated via aerosol deposition achieved the
target loading (see Table 4). With the exception of carpet,
the RSD was less than the target of 50 % for all other
aerosol-inoculated coupon types. The RSD criteria was set
at 50 % for the aerosol inoculation method development
(refer to Lee et al. 2011) in order to be comparable to the
RSD typically observed with liquid inoculation. Compa-
rable RSDs for liquid and aerosol inoculation methods can
be observed from the data set. For galvanized metal and
painted wallboard paper, the RSD values are quite com-
parable. A *20 % difference is noted for carpet and wood.
The aerosol method resulted in a lower RSD on wood,
while the liquid method was more consistent on carpet.
However, both methods resulted in greater than 6-log CFU
recoverable from the surfaces and RSD were factored in
during the statistical analysis, i.e., the determination of the
impact of decontamination method parameters in the par-
tial-inactivation regimes.
Recoveries from carpet, painted wallboard paper, and
wood positive control samples varied significantly by
inoculation method. For carpet and wood, the recoveries
from the positive controls were greater from inoculation
with aerosol than that from liquid-inoculated samples. The
difference was greatest for wood, with recovered CFU after
aerosol inoculation being nearly a full log higher than
liquid-inoculated samples. As discussed in the previous
study by Lee et al. (2011), the spores by liquid inoculation
may be transported through the wood crevices while the
liquid inoculum soaked into the wood surface. The spores
by aerosol inoculation method are deposited by impaction
to the wood surfaces, so the penetration of spores through
the wood crevices is limited. The spores by aerosol inoc-
ulation are mostly deposited near the top of the wood
surface and are relatively easy to be extracted compared to
the liquid inoculation. For painted wallboard, the average
recovered loading was higher with liquid inoculation. Per
the surface analysis reported in Lee et al. (2011), the
deposition pattern on the painted wallboard coupons that
were liquid inoculated showed spore bands at the outer
edge of the inoculated area. This was consistent with spore
migration to the outer edge of the droplet during the water
evaporation. For the aerosol inoculation method, deposi-
tion created a center-crowded pattern produced by the
spray action from the MDI actuator nozzle. Although the
mechanism is unclear based upon this information alone,
this noted variance may contribute to the observed
difference in recovery. However, although similarly dif-
ferent deposition patterns were observed for galvanized
metal based upon the inoculation method, no statistically
significant difference in recovered spore loading was
evident.
The difference in recovered loading can be attributed to
many complex factors that are difficult, if not impractical,
to control in such a study. For example, recovery efficiency
of Bacillus spores can vary greatly as a function of material
substrate type (Rastogi et al. 2009; Calfee et al. 2011;
Wood et al. 2011). All of these cited studies used liquid
inoculation. These results were expected and consistent
with the finding reported by Edmonds et al. (Edmonds et al.
2009), using a similar aerosol deposition method. The
authors concluded that recovery of spores differed by
inoculation method and as a function of material type; in
some cases recovery of liquid-inoculated spores was higher
than aerosol-deposited spores, and vice versa. As discussed
above, the interaction of the liquid with the substrate can be
one factor that impacts the distribution of the spores on the
coupon and, hence, the recovery from the material via the
chosen sampling method (here, liquid extraction).
Addressing the challenges associated with the recovery of
spores from materials was well beyond the scope of this
study. In addition, the resulting differences in observed
starting loading (as determined from the positive controls)
could confound such conclusions from the current study.
Therefore, during statistical analyses, the data were nor-
malized to the positive control values to assess the impact
of inoculation method on decontamination effectiveness.
Testing with aerosolized B. anthracis Ames presents
significant biological safety concerns. Hence, the use of
appropriate non-pathogenic surrogates is necessary to
conduct many of the applied studies without the safety
restrictions necessitated when using fully virulent B. an-
thracis. As concluded by Spotts Whitney et al. (2003)
surrogates do not always adequately predict the behavior of
the target species. Appropriate surrogates for decontami-
nation efficacy testing can be highly dependent upon the
decontaminant being tested. For example, conclusions
drawn from numerous test data have indicated that B.
subtilis (consistent with the preparation used in this work)
can appropriately represent B. anthracis with respect to
decontamination efficacy testing using fumigation with
ClO2 or inactivation with pAB (Tomasino et al. 2008; U.S.
EPA 2011b). However, this is not the case for methyl
bromide, as B. subtilis is significantly more resistant to this
decontaminant than B. anthracis Ames (U.S. EPA 2011b).
The observed exponential decay of efficacy (LR) with
increasing decontamination time suggests a slowing
decontamination rate (or tailing off of the spore
inactivation), and is common with quantitative spori-
cidal efficacy testing. As reported by Ryan and Rastogi
World J Microbiol Biotechnol (2014) 30:2609–2623 2619
123
Page 12
(U. S. Environmental Protection Agency 2008), inactiva-
tion of B. anthracis spores on materials by fumigation with
ClO2 has been observed to follow non-linear kinetics. The
rate of inactivation is initially fast and slows with
increasing time. This phenomenon seems consistent with
other investigations of microbial persistence and inactiva-
tion, as non-linear responses are often attributed to the
presence of a highly resistant sub-population of cells
(Withell 1942) or to the rate-lessening effects of substrate
(viable cells) limitation over time (Chick 1910). The
kinetics and overall decontamination efficacy have been
observed to be strongly dependent on material type (U.
S. Environmental Protection Agency 2008; Wood 2009;
Rastogi et al. 2010; U.S. EPA 2011b). Bare wood has been
one of the most difficult materials to decontaminate (Wood
et al. 2011; Calfee et al. 2011; Rastogi et al. 2010). Due to
this dependency, multiple materials with differing degrees
in anticipated challenge for decontamination with ClO2 and
pAB were selected for this study. If materials that are too
easy to decontaminate were used, the decontamination rate
may proceed too fast for an impact of the test parameters
(e.g., inoculation method, material type, decontamination
method) to be measured. Conversely, rates that are too
slow due to overly challenging materials may also mask
any dependence of the efficacy on the test parameters.
Therefore, materials exhibiting a range of anticipated
decontamination challenge are essential in such a study in
order to draw relevant and applicable conclusions.
A statistical comparison of the data for fumigation with
ClO2 suggests that liquid inoculation can be an increased
challenge to decontamination efficacy testing when com-
pared to the aerosol inoculation method used in this study
(see Fig. 2); this increased challenge is most effectively
observed for the materials that are more difficult to
decontaminate. However, for fumigation with ClO2 at the
conditions used in this study, liquid inoculation did not
significantly under-represent the observed effectiveness of
the method nor the determination of effective (sporicidal)
conditions. At these test conditions, also used for past
Amerithrax and subsequent fumigations (Martin 2003; U.
S. Environmental Protection Agency 2005), the difference
was not practically relevant.
For decontamination using pAB spraying, the results
suggest that liquid inoculation could potentially result in an
underestimate of the effectiveness when compared to use
of an aerosol inoculation method (see Fig. 3). This was
most apparent for carpet, followed by wood (no significant
difference for the other two materials). For example, very
little to no log reduction was observed on carpet that was
liquid-inoculated. A 2.8 (±0.14) average (standard devia-
tion) log reduction was measured for the aerosol inoculated
carpet coupon set. While this is a large difference in rela-
tive effectiveness, it did not result in the under-reporting of
overall effectiveness. In other words, spraying with pAB at
the conditions tested did not achieve the 6 LR laboratory
testing target that has been reportedly achieved by other
sporicidal decontamination methods (e.g., such as ClO2 in
this study) (U.S. EPA 2011b; Rogers et al. 2006, 2007;
Rastogi et al. 2009, 2010).
Similarly for the immersion in pAB, liquid inoculated
coupons were more challenging to decontaminate than
their corresponding aerosol-inoculated counterparts. This
was the case for three of the four material types, the
exception being galvanized metal. Galvanized metal was
the easiest material to decontaminate, hence the decon-
tamination rate was too fast regardless of inoculation
method to be able to resolve a difference in the current
study.
Overall, the statistically significant differences observed
for the harder to decontaminate materials (those with a
slower decontamination rates, i.e., longer times required to
achieve a 6 LR) across all three decontamination methods
suggests that tests utilizing liquid inoculation can poten-
tially under-predict the rate of the decontamination and
overall effectiveness compared to inoculation using an
aerosol method. However, the practical importance highly
depends upon the material, decontaminant product, test
method, and purpose of the testing. Therefore, based upon
these findings, inoculation method is one factor to consider
when devising efficacy studies, but its relative importance
compared to other test parameters needs to consider the
practical data requirements.
By way of example for pAB, the impact of inoculation
methods on efficacy determination was not nearly as sub-
stantial an influence as that of the liquid decontaminant
application method. Immersion in pAB resulted in signif-
icantly higher reductions in the number of recoverable
viable spores from the test coupons compared to main-
taining the materials wetted by pAB spraying. This result
holds true for all four material and both inoculation
methods (compare Figs. 3, 4). Based upon these results, the
decontaminant application method (immersion vs. spray-
ing) had a more pronounced effect on the measured
effectiveness of the product than did the inoculation pro-
tocol. Results suggest that immersion testing could dra-
matically over-indicate the sporicidal ability of the product
when it is used as a spray. These findings draw into
question the use of immersion-based testing for predicting
decontaminant performance on complex surfaces. While
immersion tests are desirable for their repeatability, spray-
based methods may offer a more operationally-relevant
understanding of its ability to be deployed for field-use.
Challenges such as application evenness and having a low
ratio of decontaminant to contaminated surface area are
common to both field-use and spray-based efficacy test
methods. In addition, evidence suggests that the measured
2620 World J Microbiol Biotechnol (2014) 30:2609–2623
123
Page 13
effectiveness can be influenced by spray parameters (e.g.,
flowrate, pressure, duration, frequency) (Ryan et al. 2012;
Calfee 2012). Although the application procedure for this
study was designed to keep the materials wetted, the results
may not be indicative of a procedure using different spray
parameters. The immersion versus spray results for pAB
highly suggests that the end application procedure of the
decontaminant be thoroughly considered when developing
specific efficacy test method procedures or parameters.
The data used for the analysis described above used one-
half the quantitation limit for non-detects (0.5 CFU), as
discussed in the ‘‘Materials and methods’’ section. For
comparison, the method detection limit (MDL) was
determined from the experimental results as the one-sigma
MDL in accordance with US EPA 40 CFR (U.S. EPA
2011a). The MDL was determined by calculating the
average standard deviation of measurements near the
detection limit, and modifying this calculated value by the
appropriate t-score for the desired confidence limit (one-
sigma, 68 %) and degrees of freedom (&5). Assuming
homogeneity between the measurements for each data set
and that the data used for this analysis are near the MDL,
the MDL was determined to be 101 CFU (204 CFU at
95 % confidence, or 341 CFU at 99 % confidence) per
sample (coupon). This MDL was not determined to be
statistically significantly different for the two inoculation
methods. The use of this MDL to replace all non-detects
did not result in any differences with respect to the impact
of inoculation method (compared to when 0.5 CFU/coupon
was used). Using the MDL value did truncate the dynamic
range of the test method, i.e., reducing the range by 2 logs,
hence, the maximum quantifiable magnitude of the log
reduction when considering this MDL (101 CFU) and
starting with a 7 log inoculation target is 5. This is a full log
less than the target value of a 6 LR used as the measured of
a sporicidal decontaminant in laboratory-scale efficacy
testing.
It should be noted that the MDL determined statistically
post hoc from the data generated in this study is consistent
with the values report by Brown et al. (2007) in their
sampling studies. For wipe sampling, Brown et al. (2007)
reported quantitative limits of detection per unit of sampled
area of 90 CFU for stainless steel and 105 CFU for painted
wallboard. For vacuum sampling, Brown et al. (2007)
reported quantitative limits of detection per unit of sampled
area of 105 CFU for stainless steel and carpet, 120 CFU
for painted wallboard, and 160 CFU from bare concrete.
The detection limits reported in the cited work are for the
combination of the surface sampling, extraction of the
sampling media and spread plate culturing and counting.
These MDLs are consistent with those found in our work
using coupon extract, spread plating, culturing, and
counting. The importance here is that the results of the
small scale laboratory testing are consistent with more
application-related studies (e.g., utilizing field sampling
procedures rather than material extraction). While larger
scale studies incorporating field methodologies may offer
some advantages related to ensuring efficacy testing relates
to field use (e.g., immersion vs. spray testing), it should be
pointed out that smaller scale studies are not irrelevant
based upon some perceived methodology differences.
Smaller scale studies using standardized laboratory proce-
dures, e.g., coupon extraction, may offer more control of
confounding factors. However, an important aspect of this
discussion for future consideration is the impact of not
using an actual MDL on the artificial expansion of the
dynamic range of an efficacy test method.
Based upon this work and the cited literature, it is clear
that inoculation method, decontaminant application
method, and treatment of detection limits can have an
impact on the sporicidal efficacy measurements. The rela-
tive importance of each of these factors with respect to each
other and other test parameters is highly dependent upon the
ultimate intended use of the data, i.e., the practical appli-
cation. Each parameter should be considered with respect to
its impact on the anticipated data during study design. The
results of this work are intended to aid in the consideration
of sporicidal efficacy test data when determining which
decontamination options might be appropriate options
based upon site specific needs and intended use.
Acknowledgments The authors acknowledge the expert contribu-
tions of Dr. Vipin Rastogi and his colleagues at the Edgewood
Chemical and Biological Center for their helpful advice and for
providing access to the MDIs used in this work. The U.S. Environ-
mental Protection Agency through its Office of Research and
Development directed the research described herein under EP-C-04-
023 with ARCADIS Inc. The statistical analysis was funded under
EP-D-10-070 with Alion Science and Technology, Inc. This manu-
script has been subject to an administrative review but does not
necessarily reflect the views of the Agency. No official endorsement
should be inferred. EPA does not endorse the purchase or sale of any
commercial products or services.
Open Access This article is distributed under the terms of the
Creative Commons Attribution License which permits any use, dis-
tribution, and reproduction in any medium, provided the original
author(s) and the source are credited.
References
4500-ClO2 Chlorine Dioxide, E. Amperometric Method II (1995) In:
Eaton AD, Clesceri LS, Rice EW, Greenberg AE (eds) Standard
methods for the examination of water and waste water, 20th edn.
American Public Health Association, Water Environment Fed-
eration, and American Water Works Association, Baltimore,
MD, pp 4-77–74-79
AOAC International (2006) Method 966.04 Sporicidal activity of
disinfectants (Methods I and II). In: Official methods of analysis,
18th edn. AOAC International, Gaithersburg, MD
World J Microbiol Biotechnol (2014) 30:2609–2623 2621
123
Page 14
AOAC International (2008) Method 2008.05 determining efficacy of
liquid sporicides against spores of Bacillus subtilis on a hard
nonporous surface using the quantitative three step method (TSM)
ASTM International (2002) Standard test method E-2197-02. Stan-
dard quantitative disk carrier test method for determining the
bactericidal, virucidal, fungicidal, mycobactericidal, and spori-
cidal activities of liquid chemical germicides. American Society
for Testing and Materials, West Conshohocken, PA
ASTM International (2005) ASTM Standard Test Method E 2414-05.
Standard Test Method for Quantitative Sporicidal Three-Step
Method (TSM) to Determine Sporicidal Efficacy of Liquids,
Liquid Sprays, and Vapor or Gases on Contaminated Carrier
Surfaces. American Society for Testing and Materials, West
Conshohocken, PA
Brown GS, Betty RG, Brockmann JE, Lucero DA, Souza CA, Walsh
KS, Boucher RM, Tezak M, Wilson MC, Rudolph T (2007)
Evaluation of a wipe surface sample method for collection of
Bacillus spores from nonporous surfaces. Appl Environ Micro-
biol 73(3):706–710
Calfee MW (2012) Laboratory evaluation of large-scale decontam-
ination approaches. J Appl Microbiol 112(5):874–882
Calfee MW, Choi Y, Rogers J, Kelly T, Willenberg Z, Riggs K (2011)
Lab-scale assessment to support remediation of outdoor surfaces
contaminated with Bacillus anthracis spores. J Bioterrorism
Biodefense 2(3):1–8
Canter DA (2003) Remediating sites with anthrax contamination:
building on experience. In: AWMA/EPA Indoor air quality
problems and engineering solutions specialty conference and
exhibition, Research Triangle Park, N.C., July 21–23 2003
Carrera M, Kesavan J, Zandomeni R, Sagripanti J-L (2005) Method to
determine the number of bacterial spores within aerosol parti-
cles. Aerosol Sci Technol 39(10):960–965
Chick H (1910) The process of disinfection by chemical agencies and
hot water. J Hygiene 10(2):237–286
Edmonds JM, Collett PJ, Valdes ER, Skowronski EW, Pellar GJ,
Emanuel PA (2009) Surface sampling of spores in dry-deposi-
tion aerosols. Appl Environ Microbiol 75(1):39–44
Jernigan JA, Stephens DS, Ashford DA, Omenaca C, Topiel MS,
Galbraith M, Tapper M, Fisk TL, Zaki S, Popovic T, Meyer RF,
Quinn CP, Harper SA, Fridkin SK, Sejvar JJ, Shepard CW,
McConnell M, Guarner J, Shieh WJ, Malecki JM, Gerberding
JL, Hughes JM, Perkins BA (2001) Bioterrorism-related inha-
lational anthrax: the first 10 cases reported in the United States.
Emerg Infect Dis 7(6):933–944
Lee SD, Ryan SP, Snyder EG (2011) Development of surface
deposition method for Bacillus spores. Appl Environ Microbiol
77(5):1638–1645
Martin GB (2003) Practical experiences with technologies for
decontamination of B. anthracis in large buildings. In:
AWMA/EPA Indoor air quality problems and engineering
solutions specialty conference and exhibition, Research Triangle
Park, N.C., July 21–23 2003
Rastogi VK, Wallace L, Smith LS, Ryan SP, Martin B (2009) Quantitative
method to determine sporicidal decontamination of building surfaces
by gaseous fumigants, and issues related to laboratory-scale studies.
Appl Environ Microbiol 75(11):3688–3694
Rastogi VK, Ryan SP, Wallace L, Smith LS, Shah SS, Martin GB
(2010) Systematic evaluation of chlorine dioxide efficacy in
decontamination of building interior surfaces contaminated with
anthrax spores. Appl Environ Microbiol 76(10):3343–3351
Rogers JV, Sabourin CLK, Choi YW, Richter WR, Rudnicki DC,
Riggs KB, Taylor ML, Chang J (2005) Decontamination assess-
ment of Bacillus anthracis, Bacillus subtilis, and Geobacillus
stearothermophilus spores on indoor surfaces using a hydrogen
peroxide gas generator. J Appl Microbiol 99(4):739–748
Rogers J, Richter WR, Choi YW, Waugh JD, Taylor ML, Riggs KB,
Stone HJ, Willenberg ZJ, Krile RT, Wood JP (2006) Technology
evaluation report—evaluation of sporicidal decontamination
technology—sabre technical services chlorine dioxide gas gen-
erator. U.S. Environmental Protection Agency, Research Trian-
gel Park, NC
Rogers JV, Choi YW, Richter WR, Rudnicki DC, Joseph DW,
Sabourin CLK, Taylor ML, Chang JCS (2007) Formaldehyde
gas inactivation of Bacillus anthracis, Bacillus subtilis, and
Geobacillus stearothermophilus spores on indoor surface mate-
rials. J Appl Microbiol 103(4):1104–1112
Ryan SP, Calfee MW, Wood JP, Attwood BC, Frank W, Schaeffer I
(2010) Research to support the decontamination of surfaces and
buildings contaminated wiht biothreat agents. In: WA Rutala
(ed) Disinfection, sterilization, and antisepsis. APIC, Washing-
ton, DC, pp 260–306
Ryan SP, Calfee MW, Mickelsen RL, Nalipinski M, Bazenas T,
Kempter C, Tomasino S (2012) Assessment of liquid and
physical decontamination methods for environmental surfaces
contaminated with bacterial spores. U.S. Environmental Protec-
tion Agency, Washington, DC
Sansoe-bourget E (2006) Risk assessment paradigm: an opportunity
for rationalizing the choice of biological indicator druing the
valdiation of isolator biodecontamination cycles. PDA J Phar-
meceutical Sci Technol 60(3):156–163
Schmitt K, Zacchia NA (2012) Total decontamination cost of the
anthrax letter attacks. Biosecur Bioterror Biodefense Strategy
Pract Sci 10(1):1–10
Sharp RJ, Roberts AG (2006) Anthrax: the challenges for decontam-
ination. J Chem Technol Biotechnol 81:1612–1625
Tomasino SF, Pines RM, Cottrill MP, Hamilton MA (2008)
Determining the efficacy of liquid sporicides against spores of
Bacillus subtilis on a hard nonporous surface using the
quantitative three step method: Collaborative study. J AOAC
Int 91(4):833–852
U. S. Environmental Protection Agency (2005) Compilation of data
on building decontamination alternatives, Washington, DC
U. S. Environmental Protection Agency (2008) Report on the 2007
workshop on decontamination, cleanup, and associated issues for
sites contaminated with chemical, biological, or radiological
materials, Washington, DC
U.S. Environmental Protection Agency FIFRA SAP Meeting No.
2007-50 (2007) A set of scientific issues being considered by the
Environmental Protection Agency regarding: guidance on test
methods for demonstrating the efficacy of antimicrobial products
for inactivating Bacillus anthracis spores on environmental
surfaces. http://www.epa.gov/scipoly/sap/meetings/2007/071707_
mtg.htm. Accessed 26 Jan 2010
U.S. EPA (2007) Anthrax spore decontamination using bleach
(sodium hypochlorite). http://www.epa.gov/pesticides/factsheets/
chemicals/bleachfactsheet.htm
U.S. EPA (2010) Determining the efficacy of liquids and fumigants
in systematic decontamination studies for Bacillus anthracis
using multiple test methods. U.S. Environmental Protection
Agency, Washington, DC
U.S. EPA (2011a) 40 CFR Appendix B to part 136—definition and
procedure for the determination of the method detection limit-
revision 1.11. U.S. Environmental Protection Agency, Washing-
ton, DC
U.S. EPA (2011b) Systematic investigation of liquid and fumigant
decontamination efficacy against biological agents deposited on
test coupons of common indoor materials. U.S. Environmental
Protection Agency, Washington, DC
Weis CP, Intrepido AJ, Miller AK, Cowim PG, Durno MA, Gennardt
JS, Bull R (2002) Secondary aerosolization of viable Bacillus
2622 World J Microbiol Biotechnol (2014) 30:2609–2623
123
Page 15
anthracis spores in a contaminated U.S. Senate office. J Am Med
Assoc 288(22):2853–2858
Whitney EAS, Beatty ME, Thomas H, Taylor J, Weyant R, Sobel J,
Arduino MJ, Ashford DA (2003) Inactivation of Bacillus
anthracis spores. Emerg Infect Dis 9(6):623–637
Withell ER (1942) The significance of the variation in shape of time-
survivor curves. J Hyg 42(2):124–183
Wood JP (2009) Evaluation of liquid and foam technologies for the
decontamination of B. anthracis and B. subtilis spores on
building and outdoor materials. U.S. Environmental Protection
Agency, Washington, DC
Wood JP, Ryan SP, Snyder EG, Serre SD (2010) Adsorption of
chlorine dioxide gas on activated carbons. J Air Waste Manag
Assoc 60:898–906
Wood JP, Choi YW, Rogers JV, Kelly TJ, Riggs KB, Willenberg ZJ
(2011) Efficacy of liquid spray decontaminants for inactivation
of Bacillus anthracis spores on building and outdoor materials.
J Appl Microbiol 110(5):1262–1273
World J Microbiol Biotechnol (2014) 30:2609–2623 2623
123