Sharma and Harinarayana International Journal of Energy and Environmental Engineering 2012, 3:12http://www.journal-ijeee.com/content/3/1/12
ORIGINAL RESEARCH Open Access
Enhancement of energy generation from twolayer solar panelsPragya Sharma1* and Tirumalachetty Harinarayana1,2
Abstract
The enhancement of energy using solar photovoltaic in a limited space is important in urban areas due toincreased land cost in the recent years. Although there exist different procedures and methodologies to focus thesunlight on solar panels, we have suggested a new approach to enhance the energy generation from thephotovoltaic panels, i.e., by keeping the two layers of photovoltaic panels as collectors of energy one above theother with the same size and orientation. Our results of two layer solar panels have shown about 75% increase inefficiency as compared to a single layer solar panel. This study can also be extended to n number of photovoltaiclayers piled up one above the other, if the cost economics are justified with respect to the land cost.
Keywords: Simulation, PVSYST software program, Efficiency, Shade analysis, Land cost
BackgroundAmong all possible alternative energy options, for ex-ample, wave energy, geothermal energy, solar energy,wind energy, and hydro energy, solar energy is becomingmore popular in India. This is mainly due to (1) theavailability of plenty of sunlight in all the seasons andalso at all the locations of India and (2) the recent initi-ation of solar mission by the government of India withattractive incentives to the developers [1]. If we look atthe world total renewable energy generation, which isaround 5 × 10²⁰ J per year, solar thermal contributes to0.5%, wind 0.3%, geothermal 0.2%, biofuel 0.2%, andsolar photovoltaic (PV) is only about 0.04% as per statis-tical review of world energy during 2007 [2]. In recentyears, the technology upgradation has not only madesolar photovoltaic technology price competitive but alsoas a viable technology. It is projected that by the year2030, the solar PV electricity will also dominate com-pared to other sources of energy [3]. From the studygrowth of photovoltaic, an average about 45% annual in-crease is noticed during the years 2000 to 2009 [3,4].From the study of cost economics of a solar photovoltaicpower plant, PV modules cost about 45% and the other55% is due to components, like transformers, cables,
* Correspondence: [email protected] RIIC (Research and Innovation Centre), Gandhinagar, Gujarat 382007,IndiaFull list of author information is available at the end of the article
inverters, and civil works [5]. Additionally, cost of thepower plant also depends on the land value. If the solarpower plant is close to the substation near the populatedarea, the transmission of energy losses will be minimum,but the cost of the land will be high [6]. If the powerplant is at a remote location, the cost of the land is lowbut the energy losses will be high. On the other hand,with less population and in a remote location, the use ofenergy is limited to the local community. Ideally, thesolar power plant needs to be located at a place wherethe energy generation from the plant can be connecteddirectly to the power grid at an optimum distance fromthe plant. Apart from the government of India's nationalsolar mission program, the recent initiation by the gov-ernment of Gujarat to establish the solar photovoltaicplants is commendable. While Gujarat alone crosses600 MW power through solar, the rest of the country isfar behind with only about 200 MW.The Gandhinagar Photovoltaic Rooftop Programme
for solar energy generation using PV modules has set anexample by government of Gujarat to save the land cost(see http://www.gpclindia.com/gpcl_rsg/index.html). An-other way to save the land cost is to adopt a new meth-odology to get maximum output from the solar powerplant in a limited area. In India, the cost of the land hasgrown up five to ten times for the last 10 years. This istrue in all the urban and semi urban regions of India. Inview of the above problem, an attempt has been made to
inger. This is an Open Access article distributed under the terms of the Creativemmons.org/licenses/by/2.0), which permits unrestricted use, distribution, andinal work is properly cited.
Inclination 25°aWorld Meteorological Organisation - station code for Ahmedabad, India.
Sharma and Harinarayana International Journal of Energy and Environmental Engineering 2012, 3:12 Page 2 of 9http://www.journal-ijeee.com/content/3/1/12
study different configuration of solar panels to enhancethe energy generation from a solar power plant. For thispurpose, the PVSYST modeling software [7] has beenused, and a design with a new concept for the solar PVmodule is suggested, and its advantages over conven-tional design are discussed.The rationale behind the present work is to enhance
the energy generation for the limited space availability.In recent years several methods have been suggested.For example, in concentrating solar power technology[8], the lens or mirror for concentration of sunlight isused by refracting the rays and focusing them in a smallarea. In another recent study, a 3D type of solar panelsis also reported [9]. Here we present another way ofenhanced solar energy with two layers of solar panels asdiscussed in more detail below. Accordingly, the presentstudy aimed to investigate the advantages of two layersolar panels with the same dimension and orientationlying one above the other. Additionally, the cost benefitanalysis is also described to highlight the advantages ofconsidering the suggested solar panel configuration fromthe present study.
MethodsThe new design suggested in the present study is the re-sult of several different design attempts using PVSYSTsoftware program. Before presenting the methodology,brief details of the software is presented in the following.
The software programAmong the various software programs, PVSYST simula-tion software is the most popular to analyze the detailed
Table 2 Monthly data from Meteonorm
Month H_Gh H_Dh H
(kWh/m2) (kWh/m2) (kW
January 147 32
February 157 36
March 203 50
April 214 64
May 225 78
June 184 93
July 139 97
August 137 92
September 163 71
October 171 57
November 144 39
December 137 34
Total 2022 742 2aAnnual average temperature; H_Gh, irradiation of global radiation, horizontal; H_Dradiation, tilted plane; H_Dk, irradiation of diffuse radiation, tilted plane; H_Bn, irrad
performance of the plant in field conditions. It can beused for many ways, for example, to investigate differentloads on the system, estimate the size of the system, de-termine the optimal size of the panel, and assess the en-ergy production in the system Various other capabilitiesand options available in the PVSYST software simulationcan be seen in [7]. PVSYST, a personal computer-basedsoftware package, can also be used to study the sizingand data analysis of complete PV system. It is used fordifferent designs and sizes of the systems. It can evaluatemonthly production and performance. It also performseconomic evaluation of the PV system at the designstage itself. Its application performs a detailed simulationand also shading analysis according to several dozens ofvariables. PVSYST also considers the shading of a diffuseradiation [7,10-12]. The limitation of the software is thatit can compute only a single layer of PV module. This
_Gk H_Dk H_Bn Ta
h/m2) (kWh/m2) (kWh/m2) (°C)
201 42 211 19.6
195 44 193 22.4
227 57 225 27.9
215 67 205 31.6
208 77 202 33.0
165 88 125 31.7
128 92 56 29.1
131 89 63 28.1
171 74 131 28.9
201 65 180 27.9
188 48 181 24.1
188 43 188 20.3
218 786 1961 27.1a
h, irradiation of diffuse radiation, horizontal; H_Gk, irradiation of globaliation of beam; Ta, air temperature.
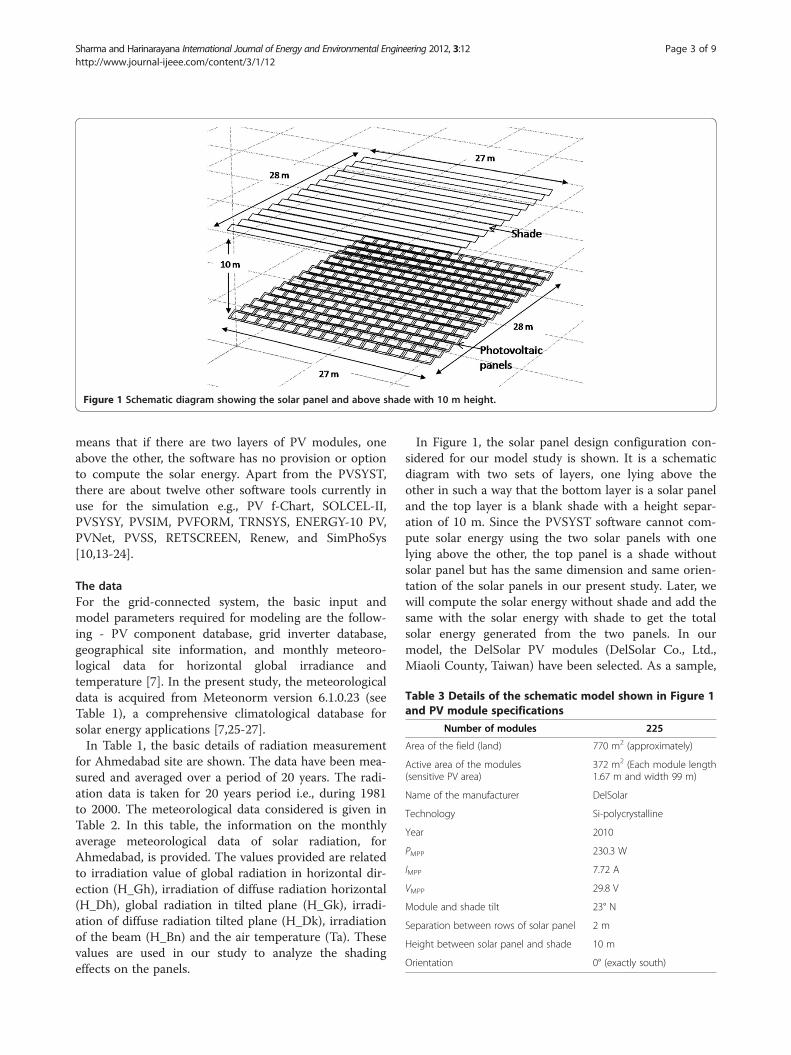
Figure 1 Schematic diagram showing the solar panel and above shade with 10 m height.
Table 3 Details of the schematic model shown in Figure 1and PV module specifications
Number of modules 225
Area of the field (land) 770 m2 (approximately)
Active area of the modules(sensitive PV area)
372 m2 (Each module length1.67 m and width 99 m)
Name of the manufacturer DelSolar
Technology Si-polycrystalline
Year 2010
PMPP 230.3 W
IMPP 7.72 A
VMPP 29.8 V
Module and shade tilt 23° N
Separation between rows of solar panel 2 m
Height between solar panel and shade 10 m
Orientation 0° (exactly south)
Sharma and Harinarayana International Journal of Energy and Environmental Engineering 2012, 3:12 Page 3 of 9http://www.journal-ijeee.com/content/3/1/12
means that if there are two layers of PV modules, oneabove the other, the software has no provision or optionto compute the solar energy. Apart from the PVSYST,there are about twelve other software tools currently inuse for the simulation e.g., PV f-Chart, SOLCEL-II,PVSYSY, PVSIM, PVFORM, TRNSYS, ENERGY-10 PV,PVNet, PVSS, RETSCREEN, Renew, and SimPhoSys[10,13-24].
The dataFor the grid-connected system, the basic input andmodel parameters required for modeling are the follow-ing - PV component database, grid inverter database,geographical site information, and monthly meteoro-logical data for horizontal global irradiance andtemperature [7]. In the present study, the meteorologicaldata is acquired from Meteonorm version 6.1.0.23 (seeTable 1), a comprehensive climatological database forsolar energy applications [7,25-27].In Table 1, the basic details of radiation measurement
for Ahmedabad site are shown. The data have been mea-sured and averaged over a period of 20 years. The radi-ation data is taken for 20 years period i.e., during 1981to 2000. The meteorological data considered is given inTable 2. In this table, the information on the monthlyaverage meteorological data of solar radiation, forAhmedabad, is provided. The values provided are relatedto irradiation value of global radiation in horizontal dir-ection (H_Gh), irradiation of diffuse radiation horizontal(H_Dh), global radiation in tilted plane (H_Gk), irradi-ation of diffuse radiation tilted plane (H_Dk), irradiationof the beam (H_Bn) and the air temperature (Ta). Thesevalues are used in our study to analyze the shadingeffects on the panels.
In Figure 1, the solar panel design configuration con-sidered for our model study is shown. It is a schematicdiagram with two sets of layers, one lying above theother in such a way that the bottom layer is a solar paneland the top layer is a blank shade with a height separ-ation of 10 m. Since the PVSYST software cannot com-pute solar energy using the two solar panels with onelying above the other, the top panel is a shade withoutsolar panel but has the same dimension and same orien-tation of the solar panels in our present study. Later, wewill compute the solar energy without shade and add thesame with the solar energy with shade to get the totalsolar energy generated from the two panels. In ourmodel, the DelSolar PV modules (DelSolar Co., Ltd.,Miaoli County, Taiwan) have been selected. As a sample,
Table 4 Shading factor table for no shade over panelsAzimuth −180 −160 −140 −120 −100 −80 −60 −40 −20 0 20 40 60 80 100 120 140 160 180
Sharma and Harinarayana International Journal of Energy and Environmental Engineering 2012, 3:12 Page 4 of 9http://www.journal-ijeee.com/content/3/1/12
15 solar panel modules in X direction and a series of 15rows of solar panels in another, say Y direction, are con-sidered. Such a design is arbitrary and helps to computeparameters quickly. This configuration approximatelyprovides about 50 kW of power output from the PVpower plant. However, the same model can be extendedto any length as required.In Table 3, the information and details for the solar
panels considered are shown. Details of the solar moduleand technology, power rating, and related module speci-fications are also provided. The technology considered isSi-polycrystalline DelSolar photovoltaic module which isavailable in PVSYST PV module library [7]. Each mod-ule can provide a maximum power output of 230.3 W.Accordingly, the 225 number of modules used in ourstudy can provide a power output of about 50 kW. Themodules are oriented in the south direction and accord-ingly, the azimuth angle is assumed as 0°. Both the mod-ules and shade panels are tilted at the same angle of 23°.This tilt is chosen as the latitude (degrees) for theAhmedabad site is 23.067°.
Table 5 Shading factor table for shade at a height 10 m abovAzimuth −180 −160 −140 −120 −100 −80 −60 −40 −20
Shading factor analysisThe shading factor analysis provides the energy loss fromphotovoltaic panels due to near shading. Near shadingmeans partial shading that affects a part of the panel(s)[7]. The shaded part changes during the day and also overa season. The shading factor is a ratio between the energygenerated from the illuminated part and the total area ofthe field, or inversely, the energy loss [7].In Table 4, the information of a single module mounting
during no shade over the panels is provided. The shadingloss is only a function of the sun's height and azimuth fora near shading scene. The values in the table represent theshading factor defined above, and are the ratios of the illu-minated part to the total area of the field as a function ofheight and azimuth of the sun position. The value variesas per the season and time of the day. For example, value1.000 represents 100% illumination or available radiationover the panels during any particular time of the day and.961 represent 96.1% illumination and so on. In ‘no shade’layout, the illumination over the panel is 100% most of thetimes except during morning and evening hours, when
e the solar panels0 20 40 60 80 100 120 140 160 180
Table 6 Energy supplied to the grid by single layer with shade and two layer PV panel system
Height between the panels No shade (a) 1 m (b) 3 m (c) 5 m (d) 10 m (e)
Total annual energy generated by solar panels and shade both of equal dimensions(372 m2) (in kWh)
77,980 28,100 40,887 45,775 55,942
Total annual energy generated by two layer panels both of equal dimensions(372 m2) (in kWh)
- 106,080 118,867 123,755 133,922
(a + b) (a + c) (a + d) (a + e)
Sharma and Harinarayana International Journal of Energy and Environmental Engineering 2012, 3:12 Page 5 of 9http://www.journal-ijeee.com/content/3/1/12
the height of the sun is 20° or below, with respect to sitelocation, causes maximum shade.Table 5 presents analysis for a shade at a height of
10 m above the photovoltaic panels. In our study, it is ofthe same dimension as of the bottom photovoltaic panel.Due to the presence of the shade, the shading factor inTable 5 showed lower value as compared to no shadingscene in Table 4. Accordingly, the energy output reducesfrom the panels.
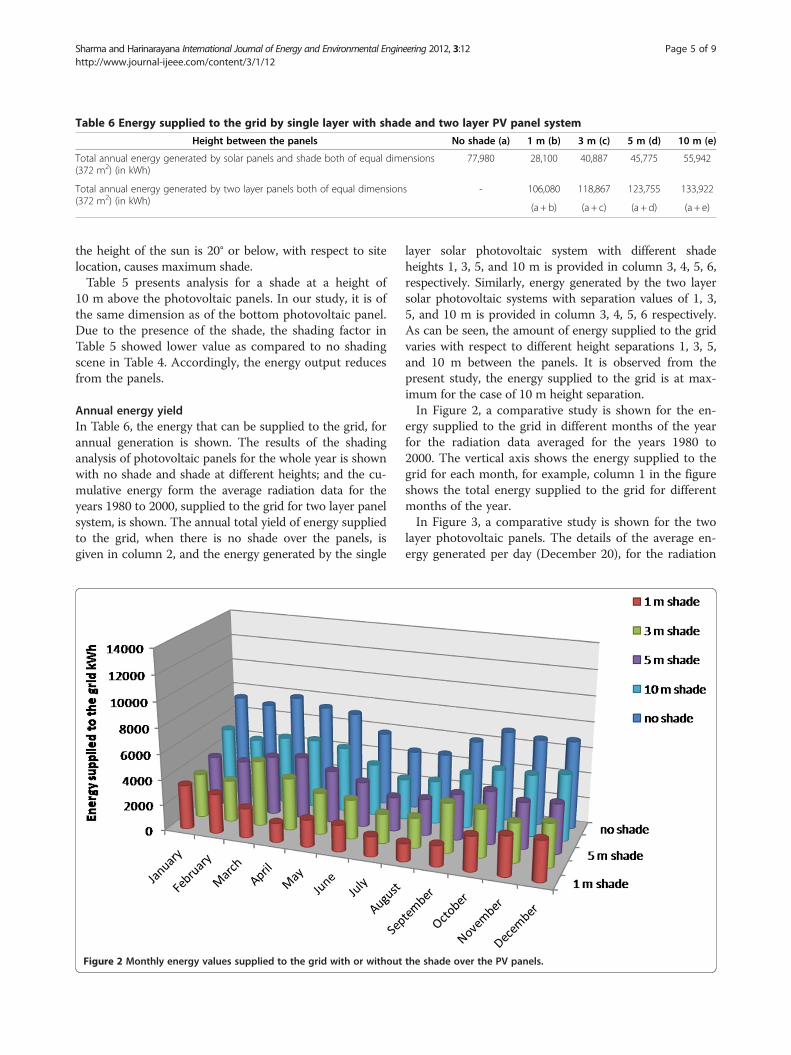
Annual energy yieldIn Table 6, the energy that can be supplied to the grid, forannual generation is shown. The results of the shadinganalysis of photovoltaic panels for the whole year is shownwith no shade and shade at different heights; and the cu-mulative energy form the average radiation data for theyears 1980 to 2000, supplied to the grid for two layer panelsystem, is shown. The annual total yield of energy suppliedto the grid, when there is no shade over the panels, isgiven in column 2, and the energy generated by the single
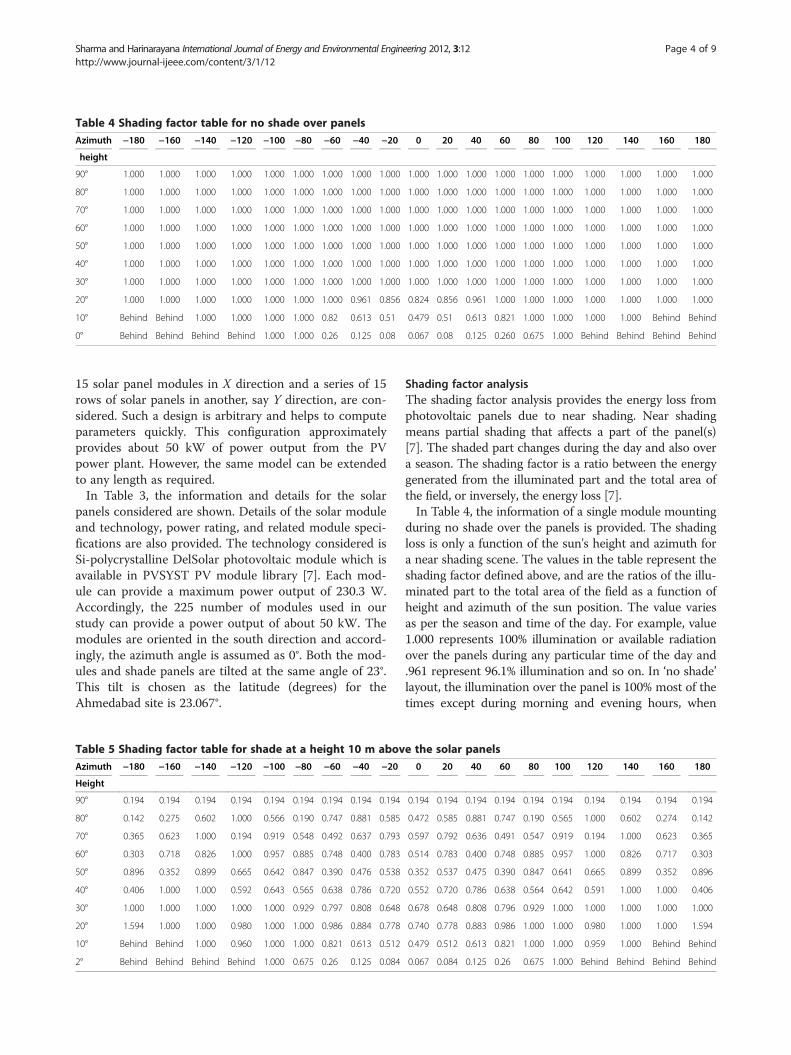
Figure 2 Monthly energy values supplied to the grid with or without
layer solar photovoltaic system with different shadeheights 1, 3, 5, and 10 m is provided in column 3, 4, 5, 6,respectively. Similarly, energy generated by the two layersolar photovoltaic systems with separation values of 1, 3,5, and 10 m is provided in column 3, 4, 5, 6 respectively.As can be seen, the amount of energy supplied to the gridvaries with respect to different height separations 1, 3, 5,and 10 m between the panels. It is observed from thepresent study, the energy supplied to the grid is at max-imum for the case of 10 m height separation.In Figure 2, a comparative study is shown for the en-
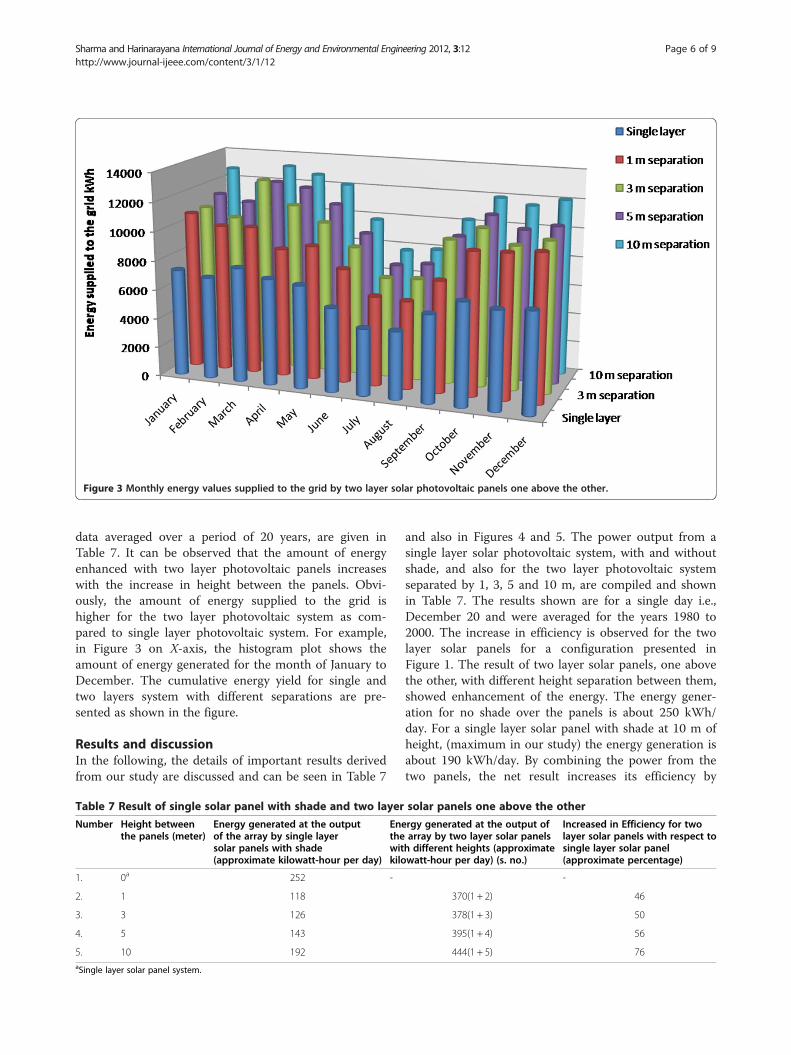
ergy supplied to the grid in different months of the yearfor the radiation data averaged for the years 1980 to2000. The vertical axis shows the energy supplied to thegrid for each month, for example, column 1 in the figureshows the total energy supplied to the grid for differentmonths of the year.In Figure 3, a comparative study is shown for the two
layer photovoltaic panels. The details of the average en-ergy generated per day (December 20), for the radiation
the shade over the PV panels.
Figure 3 Monthly energy values supplied to the grid by two layer solar photovoltaic panels one above the other.
Sharma and Harinarayana International Journal of Energy and Environmental Engineering 2012, 3:12 Page 6 of 9http://www.journal-ijeee.com/content/3/1/12
data averaged over a period of 20 years, are given inTable 7. It can be observed that the amount of energyenhanced with two layer photovoltaic panels increaseswith the increase in height between the panels. Obvi-ously, the amount of energy supplied to the grid ishigher for the two layer photovoltaic system as com-pared to single layer photovoltaic system. For example,in Figure 3 on X-axis, the histogram plot shows theamount of energy generated for the month of January toDecember. The cumulative energy yield for single andtwo layers system with different separations are pre-sented as shown in the figure.
Results and discussionIn the following, the details of important results derivedfrom our study are discussed and can be seen in Table 7
Table 7 Result of single solar panel with shade and two layer
Number Height betweenthe panels (meter)
Energy generated at the outputof the array by single layersolar panels with shade(approximate kilowatt-hour per day)
Enethewitkilo
1. 0a 252 -
2. 1 118
3. 3 126
4. 5 143
5. 10 192aSingle layer solar panel system.
and also in Figures 4 and 5. The power output from asingle layer solar photovoltaic system, with and withoutshade, and also for the two layer photovoltaic systemseparated by 1, 3, 5 and 10 m, are compiled and shownin Table 7. The results shown are for a single day i.e.,December 20 and were averaged for the years 1980 to2000. The increase in efficiency is observed for the twolayer solar panels for a configuration presented inFigure 1. The result of two layer solar panels, one abovethe other, with different height separation between them,showed enhancement of the energy. The energy gener-ation for no shade over the panels is about 250 kWh/day. For a single layer solar panel with shade at 10 m ofheight, (maximum in our study) the energy generation isabout 190 kWh/day. By combining the power from thetwo panels, the net result increases its efficiency by
solar panels one above the other
rgy generated at the output ofarray by two layer solar panelsh different heights (approximatewatt-hour per day) (s. no.)
Increased in Efficiency for twolayer solar panels with respect tosingle layer solar panel(approximate percentage)
-
370(1 + 2) 46
378(1 + 3) 50
395(1 + 4) 56
444(1 + 5) 76
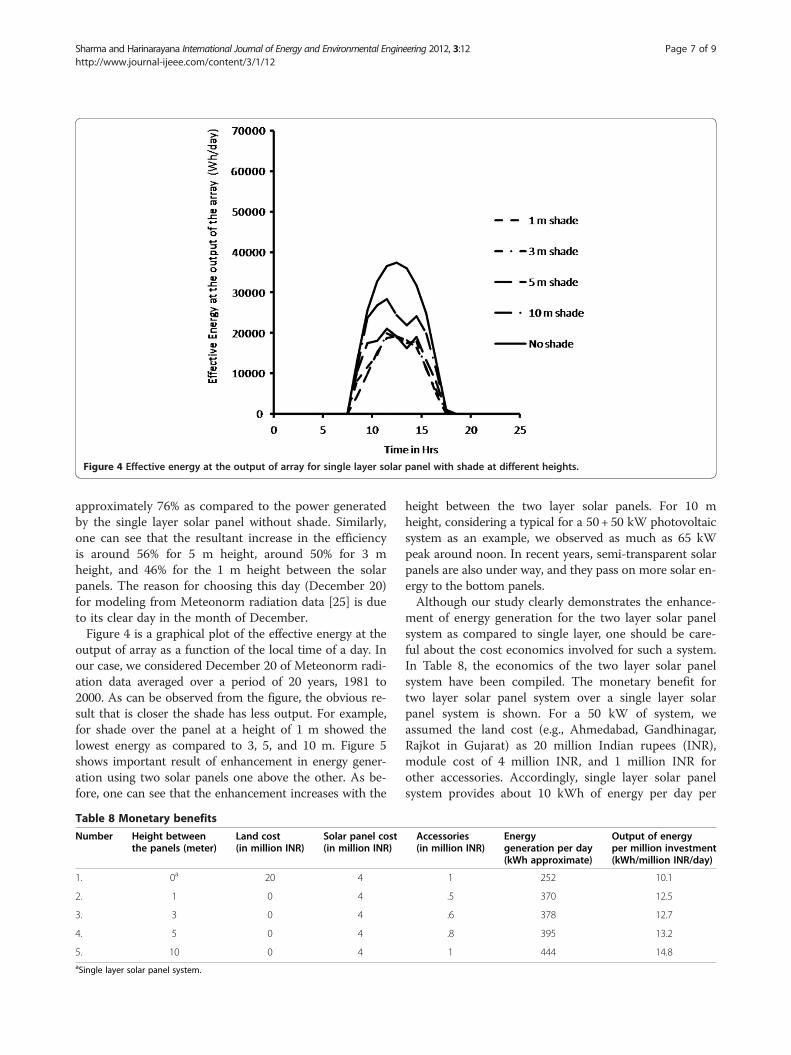
Figure 4 Effective energy at the output of array for single layer solar panel with shade at different heights.
Sharma and Harinarayana International Journal of Energy and Environmental Engineering 2012, 3:12 Page 7 of 9http://www.journal-ijeee.com/content/3/1/12
approximately 76% as compared to the power generatedby the single layer solar panel without shade. Similarly,one can see that the resultant increase in the efficiencyis around 56% for 5 m height, around 50% for 3 mheight, and 46% for the 1 m height between the solarpanels. The reason for choosing this day (December 20)for modeling from Meteonorm radiation data [25] is dueto its clear day in the month of December.Figure 4 is a graphical plot of the effective energy at the
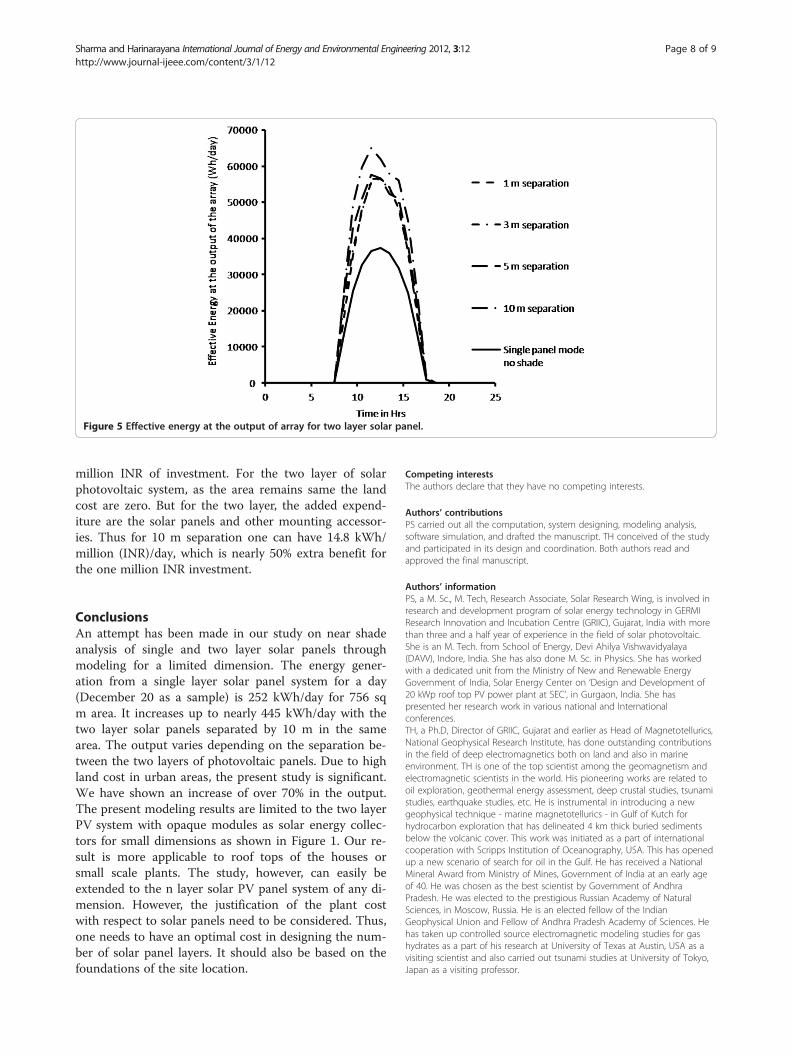
output of array as a function of the local time of a day. Inour case, we considered December 20 of Meteonorm radi-ation data averaged over a period of 20 years, 1981 to2000. As can be observed from the figure, the obvious re-sult that is closer the shade has less output. For example,for shade over the panel at a height of 1 m showed thelowest energy as compared to 3, 5, and 10 m. Figure 5shows important result of enhancement in energy gener-ation using two solar panels one above the other. As be-fore, one can see that the enhancement increases with the
Table 8 Monetary benefits
Number Height betweenthe panels (meter)
Land cost(in million INR)
Solar panel cost(in million INR)
1. 0a 20 4
2. 1 0 4
3. 3 0 4
4. 5 0 4
5. 10 0 4aSingle layer solar panel system.
height between the two layer solar panels. For 10 mheight, considering a typical for a 50+ 50 kW photovoltaicsystem as an example, we observed as much as 65 kWpeak around noon. In recent years, semi-transparent solarpanels are also under way, and they pass on more solar en-ergy to the bottom panels.Although our study clearly demonstrates the enhance-
ment of energy generation for the two layer solar panelsystem as compared to single layer, one should be care-ful about the cost economics involved for such a system.In Table 8, the economics of the two layer solar panelsystem have been compiled. The monetary benefit fortwo layer solar panel system over a single layer solarpanel system is shown. For a 50 kW of system, weassumed the land cost (e.g., Ahmedabad, Gandhinagar,Rajkot in Gujarat) as 20 million Indian rupees (INR),module cost of 4 million INR, and 1 million INR forother accessories. Accordingly, single layer solar panelsystem provides about 10 kWh of energy per day per
Accessories(in million INR)
Energygeneration per day(kWh approximate)
Output of energyper million investment(kWh/million INR/day)
1 252 10.1
.5 370 12.5
.6 378 12.7
.8 395 13.2
1 444 14.8
Figure 5 Effective energy at the output of array for two layer solar panel.
Sharma and Harinarayana International Journal of Energy and Environmental Engineering 2012, 3:12 Page 8 of 9http://www.journal-ijeee.com/content/3/1/12
million INR of investment. For the two layer of solarphotovoltaic system, as the area remains same the landcost are zero. But for the two layer, the added expend-iture are the solar panels and other mounting accessor-ies. Thus for 10 m separation one can have 14.8 kWh/million (INR)/day, which is nearly 50% extra benefit forthe one million INR investment.
ConclusionsAn attempt has been made in our study on near shadeanalysis of single and two layer solar panels throughmodeling for a limited dimension. The energy gener-ation from a single layer solar panel system for a day(December 20 as a sample) is 252 kWh/day for 756 sqm area. It increases up to nearly 445 kWh/day with thetwo layer solar panels separated by 10 m in the samearea. The output varies depending on the separation be-tween the two layers of photovoltaic panels. Due to highland cost in urban areas, the present study is significant.We have shown an increase of over 70% in the output.The present modeling results are limited to the two layerPV system with opaque modules as solar energy collec-tors for small dimensions as shown in Figure 1. Our re-sult is more applicable to roof tops of the houses orsmall scale plants. The study, however, can easily beextended to the n layer solar PV panel system of any di-mension. However, the justification of the plant costwith respect to solar panels need to be considered. Thus,one needs to have an optimal cost in designing the num-ber of solar panel layers. It should also be based on thefoundations of the site location.
Competing interestsThe authors declare that they have no competing interests.
Authors’ contributionsPS carried out all the computation, system designing, modeling analysis,software simulation, and drafted the manuscript. TH conceived of the studyand participated in its design and coordination. Both authors read andapproved the final manuscript.
Authors’ informationPS, a M. Sc., M. Tech, Research Associate, Solar Research Wing, is involved inresearch and development program of solar energy technology in GERMIResearch Innovation and Incubation Centre (GRIIC), Gujarat, India with morethan three and a half year of experience in the field of solar photovoltaic.She is an M. Tech. from School of Energy, Devi Ahilya Vishwavidyalaya(DAVV), Indore, India. She has also done M. Sc. in Physics. She has workedwith a dedicated unit from the Ministry of New and Renewable EnergyGovernment of India, Solar Energy Center on ‘Design and Development of20 kWp roof top PV power plant at SEC’, in Gurgaon, India. She haspresented her research work in various national and Internationalconferences.TH, a Ph.D, Director of GRIIC, Gujarat and earlier as Head of Magnetotellurics,National Geophysical Research Institute, has done outstanding contributionsin the field of deep electromagnetics both on land and also in marineenvironment. TH is one of the top scientist among the geomagnetism andelectromagnetic scientists in the world. His pioneering works are related tooil exploration, geothermal energy assessment, deep crustal studies, tsunamistudies, earthquake studies, etc. He is instrumental in introducing a newgeophysical technique - marine magnetotellurics - in Gulf of Kutch forhydrocarbon exploration that has delineated 4 km thick buried sedimentsbelow the volcanic cover. This work was initiated as a part of internationalcooperation with Scripps Institution of Oceanography, USA. This has openedup a new scenario of search for oil in the Gulf. He has received a NationalMineral Award from Ministry of Mines, Government of India at an early ageof 40. He was chosen as the best scientist by Government of AndhraPradesh. He was elected to the prestigious Russian Academy of NaturalSciences, in Moscow, Russia. He is an elected fellow of the IndianGeophysical Union and Fellow of Andhra Pradesh Academy of Sciences. Hehas taken up controlled source electromagnetic modeling studies for gashydrates as a part of his research at University of Texas at Austin, USA as avisiting scientist and also carried out tsunami studies at University of Tokyo,Japan as a visiting professor.
Sharma and Harinarayana International Journal of Energy and Environmental Engineering 2012, 3:12 Page 9 of 9http://www.journal-ijeee.com/content/3/1/12
AcknowledgementsPS is very much thankful and express sincere gratitude to Dr. Jayanta DebMondol, Ulster University, for providing his quick comments on themanuscript. PS and TH would like to acknowledge all the research technicaland scientific staff of GERMI for their encouragement, motivation, andsupport.
Author details1GERMI RIIC (Research and Innovation Centre), Gandhinagar, Gujarat 382007,India. 2CSIR-NGRI (National Geophysical Research Institute), Hyderabad500007, India.
Received: 9 April 2012 Accepted: 29 June 2012Published: 17 July 2012
References1. Goswami, D: India’s solar sunrise. Renewable Energy Focus 13(2), 28–30
(2012)2. BP Statistical Review of World Energy. (2007). www.bp.com. Accessed 22
January 20113. European Photovoltaic Industry association: Solar Photovoltaics competing
in the Energy sector, on the road to competitiveness. EPIA (2011). http://www.epia.org/publications/epiapublications. Accessed 21 January 2012
4. European Photovoltaic Industry association: Solar generation 6 solarPhotovoltaic electricity Empowering the World. EPIA (2011). http://www.epia.org/publications/epiapublications. Accessed 21 January 2012
5. Sharma, A: A comprehensive study of solar power in India and World.Renew Sustain Energy Rev 15(4), 1767–1776 (2011)
6. Raman, P, Murali, J, Sakthivadivel, D, Vigneswaran, VS: Opportunities andchallenges in setting up solar photovoltaic based micro grids forelectrification in rural areas of India. Renew Sustain Energy Rev 16(5),3320–3325 (2012)
7. University of Geneva: User’s Guide, PVsyst Contextual Help, (1994–2010).www.pvsyst.com. Accessed 8 December 2011
8. Ummadisingu, A, Soni, MS: Concentrating solar power – technology,potential and policy in India. Renew Sustain Energy Rev 15(9), 5169–5175(2011)
9. Bernardi, M, Ferralis, N, Wan, JH, Villalon, R, Grossman, JC: Solar energygeneration in three dimensions. Energy and Environmental Science 5,6880–6884 (2012). doi:10.1039/C2EE21170J
10. Mondol, JD, Yohanis, YG, Norton, B: Comparison of measured and predictedlong term performance of grid a connected photovoltaic system.Conversion and Management 48(4), 1065–1080 (2007)
11. International Energy Agency: SHC State-of-the-art of digital tools used byarchitects for solar esign. Task 41 – Solar Energy and Architecture T.41.B.1.http://iea-shc.org. Accessed 25 February 2012
12. Bayod-Rújula, AA, Ortego-Bielsa, A, Martínez-Gracia, A: Photovoltaics on flatroofs: energy considerations. Energy 36(4), 1996–2010 (2011)
13. Klise, GT, Stein, JS, Sandia National Laboratories Report SAND2009-8285:Models Used to Assess the Performance of Photovoltaic Systems., (2009).http://photovoltaics.sandia.gov. Accessed 14 and 18 March 2012
14. Hoover, ER, Sandia National Laboratories Report: SOLCEL II-an improvedphotovoltaic system analysis program. SAND, 79–1785 (1980). http://www.sandia.gov/index.html. Accessed 12 January 2009
15. Mermoud, A: Use and validation of PVSYST, a user-friendly software forPV-system design, pp. 736–739. 13th European Photovoltaic Solar EnergyConference, Nice, France (1995)
16. King, DL, Dudley, JK, Boyson, WE: PVSIM: a simulation program forphotovoltaic cells, modules, and arrays, pp. 1295–1297. 25th IEEEPhotovoltaic Specialists Conference, Washington (DC, USA) (1996)
17. Menicucci, DF, Fernandez, JP, Sandia National Laboratories Report: User’smanual for PVFORM: a photovoltaic system simulation program for stand-alone and grid interactive applications. SAND, 85–0376 (1988). http://prod.sandia.gov Accessed 5 February 2012
18. Mondol, JD, Yohanis, YG, Smyth, M, Norton, B: Long term validatedsimulation of a building integrated photovoltaic system. Solar Energy 78(2),163–176 (2005)
19. National Renewable Energy Laboratory Report, Balcomb, JD, Hayter, SJ,Weaver, NL: Hourly simulation of grid connected PV systems using realisticbuilding loads. NREL/CP, 550–29638 (2001). http://www.nrel.gov. Accessed25 February 2012
20. Bishop, JW: Computer simulation of the effects of electrical mismatches inphotovoltaic cell interconnection circuits. Solar Cells 25, 73–89 (1988)
21. Goldstein, LH, Case, GR: PVSS—a photovoltaic system simulation program.Solar Energy 21, 37–43 (1978)
22. Bakos, GC, Soursos, M, Tsagas, NF: Technoeconomic assessment of abuilding-integrated PV system for electrical energy saving in residentialsector. Energy Build 35, 757–762 (2003)
23. Woolf, J: Renew: a renewable energy design tool for architects. RenewEnergy 28, 1555–1561 (2003)
24. Schmitt, W: Modeling and simulation of photovoltaic hybrid energy systemsoptimization of sizing and control, pp. 1656–1659. 29th IEEE photovoltaicspecialists conference, New Orleans (LA) (2002)
25. Global Meteorological Database. Meteonorm, Switzerland (2012). www.metonorm.com, version 6.1.0.23. Accessed 17 Feb 2012
26. Marinopoulos, AG, Bouhouras, AS, Papaioannou, IT, Labridis, DP, Exioglou,MD, Theodoridis, AN: Siting and installation of PV systems in Greece andtheir contribution in the reliability of the distribution network. ElectricityMarket, 5th International Conference on European 28–30, 1–6 (2008).doi:10.1109/EEM.2008.4579059
27. Hatwaambo, S, Jain, PC, Perers, B, Karlsson, B: Projected beam irradiation at lowlatitudes using meteonorm database. Renew Energy 34, 1394–1398 (2009)
doi:10.1186/2251-6832-3-12Cite this article as: Sharma and Harinarayana: Enhancement of energygeneration from two layer solar panels. International Journal of Energy andEnvironmental Engineering 2012 3:12.
Submit your manuscript to a journal and benefi t from: