Copyright 2015 American Medical Association. All rights reserved. CPAP vs Mandibular Advancement Devices and Blood Pressure in Patients With Obstructive Sleep Apnea A Systematic Review and Meta-analysis Daniel J. Bratton, PhD; Thomas Gaisl, MD; Annette M. Wons, MD; Malcolm Kohler, MD IMPORTANCE Obstructive sleep apnea is associated with higher levels of blood pressure (BP), which can lead to increased cardiovascular risk. OBJECTIVE To compare the association of continuous positive airway pressure (CPAP), mandibular advancement devices (MADs), and inactive control groups (placebo or no treatment) with changes in systolic BP (SBP) and diastolic BP (DBP) in patients with obstructive sleep apnea. DATA SOURCES The databases of MEDLINE, EMBASE, and the Cochrane Library were searched up to the end of August 2015 and study bibliographies were reviewed. STUDY SELECTION Randomized clinical trials comparing the effect of CPAP or MADs (vs each other or an inactive control) on BP in patients with obstructive sleep apnea were selected by consensus. Of 872 studies initially identified, 51 were selected for analysis. DATA EXTRACTION AND SYNTHESIS Data were extracted by one reviewer and checked by another reviewer. A network meta-analysis using multivariate random-effects meta-regression was used to estimate pooled differences between each intervention. Meta-regression was used to assess the association between trial characteristics and the reported effects of CPAP vs inactive control. MAIN OUTCOMES AND MEASURES Absolute change in SBP and DBP from baseline to follow-up. RESULTS Of the 51 studies included in the analysis (4888 patients), 44 compared CPAP with an inactive control, 3 compared MADs with an inactive control, 1 compared CPAP with an MAD, and 3 compared CPAP, MADs, and an inactive control. Compared with an inactive control, CPAP was associated with a reduction in SBP of 2.5 mm Hg (95% CI, 1.5 to 3.5 mm Hg; P < .001) and in DBP of 2.0 mm Hg (95% CI, 1.3 to 2.7 mm Hg; P < .001). A 1-hour-per-night increase in mean CPAP use was associated with an additional reduction in SBP of 1.5 mm Hg (95% CI, 0.8 to 2.3 mm Hg; P < .001) and an additional reduction in DBP of 0.9 mm Hg (95% CI, 0.3 to 1.4 mm Hg; P = .001). Compared with an inactive control, MADs were associated with a reduction in SBP of 2.1 mm Hg (95% CI, 0.8 to 3.4 mm Hg; P = .002) and in DBP of 1.9 mm Hg (95% CI, 0.5 to 3.2 mm Hg; P = .008). There was no significant difference between CPAP and MADs in their association with change in SBP (−0.5 mm Hg [95% CI, −2.0 to 1.0 mm Hg]; P = .55) or in DBP (−0.2 mm Hg [95% CI, −1.6 to 1.3 mm Hg]; P = .82). CONCLUSIONS AND RELEVANCE Among patients with obstructive sleep apnea, both CPAP and MADs were associated with reductions in BP. Network meta-analysis did not identify a statistically significant difference between the BP outcomes associated with these therapies. JAMA. 2015;314(21):2280-2293. doi:10.1001/jama.2015.16303 Supplemental content at jama.com Author Affiliations: Department of Pulmonology, University Hospital Zurich, Zurich, Switzerland (Bratton, Gaisl, Wons, Kohler); Zurich Center for Integrative Human Physiology, University of Zurich, Zurich, Switzerland (Kohler); Center for Interdisciplinary Sleep Research, University of Zurich, Zurich, Switzerland (Kohler). Corresponding Author: Malcolm Kohler, MD, University Hospital Zürich, Rämistrasse 100, 8091 Zürich, Switzerland ([email protected]). Research Original Investigation 2280 (Reprinted) jama.com Copyright 2015 American Medical Association. All rights reserved. Downloaded From: http://jama.jamanetwork.com/ by a UZH Hauptbibliothek / Zentralbibliothek Zuerich User on 12/02/2015
Transcript
Copyright 2015 American Medical Association. All rights reserved.
CPAP vs Mandibular Advancement Devices and Blood Pressurein Patients With Obstructive Sleep ApneaA Systematic Review and Meta-analysisDaniel J. Bratton, PhD; Thomas Gaisl, MD; Annette M. Wons, MD; Malcolm Kohler, MD
IMPORTANCE Obstructive sleep apnea is associated with higher levels of blood pressure (BP),which can lead to increased cardiovascular risk.
OBJECTIVE To compare the association of continuous positive airway pressure (CPAP),mandibular advancement devices (MADs), and inactive control groups (placebo or notreatment) with changes in systolic BP (SBP) and diastolic BP (DBP) in patients withobstructive sleep apnea.
DATA SOURCES The databases of MEDLINE, EMBASE, and the Cochrane Library weresearched up to the end of August 2015 and study bibliographies were reviewed.
STUDY SELECTION Randomized clinical trials comparing the effect of CPAP or MADs (vs eachother or an inactive control) on BP in patients with obstructive sleep apnea were selected byconsensus. Of 872 studies initially identified, 51 were selected for analysis.
DATA EXTRACTION AND SYNTHESIS Data were extracted by one reviewer and checked byanother reviewer. A network meta-analysis using multivariate random-effectsmeta-regression was used to estimate pooled differences between each intervention.Meta-regression was used to assess the association between trial characteristics and thereported effects of CPAP vs inactive control.
MAIN OUTCOMES AND MEASURES Absolute change in SBP and DBP from baseline to follow-up.
RESULTS Of the 51 studies included in the analysis (4888 patients), 44 compared CPAP with aninactive control, 3 compared MADs with an inactive control, 1 compared CPAP with an MAD,and 3 compared CPAP, MADs, and an inactive control. Compared with an inactive control, CPAPwas associated with a reduction in SBP of 2.5 mm Hg (95% CI, 1.5 to 3.5 mm Hg; P < .001) and inDBP of 2.0 mm Hg (95% CI, 1.3 to 2.7 mm Hg; P < .001). A 1-hour-per-night increase in meanCPAP use was associated with an additional reduction in SBP of 1.5 mm Hg (95% CI, 0.8 to2.3 mm Hg; P < .001) and an additional reduction in DBP of 0.9 mm Hg (95% CI, 0.3 to 1.4 mmHg; P = .001). Compared with an inactive control, MADs were associated with a reduction inSBP of 2.1 mm Hg (95% CI, 0.8 to 3.4 mm Hg; P = .002) and in DBP of 1.9 mm Hg (95% CI, 0.5 to3.2 mm Hg; P = .008). There was no significant difference between CPAP and MADs in theirassociation with change in SBP (−0.5 mm Hg [95% CI, −2.0 to 1.0 mm Hg]; P = .55) or in DBP(−0.2 mm Hg [95% CI, −1.6 to 1.3 mm Hg]; P = .82).
CONCLUSIONS AND RELEVANCE Among patients with obstructive sleep apnea, both CPAPand MADs were associated with reductions in BP. Network meta-analysis did not identifya statistically significant difference between the BP outcomes associated with these therapies.
Author Affiliations: Department ofPulmonology, University HospitalZurich, Zurich, Switzerland (Bratton,Gaisl, Wons, Kohler); Zurich Centerfor Integrative Human Physiology,University of Zurich, Zurich,Switzerland (Kohler); Center forInterdisciplinary Sleep Research,University of Zurich, Zurich,Switzerland (Kohler).
Copyright 2015 American Medical Association. All rights reserved.
O bstructive sleep apnea is characterized by recurringcessations or reductions in respiratory flow due to up-per airway collapse during sleep. The estimated preva-
lence of symptomatic obstructive sleep apnea in Western coun-tries is 2% to 4%; however, prevalence is increasing due to levelsof obesity in these populations.1 The condition is associatedwith oxygen desaturations and arousals from sleep, which canlead to increases in blood pressure (BP) and risk of cardiovas-cular disease.2
Continuous positive airway pressure (CPAP) has beenshown to be an effective treatment for improving symptomsof obstructive sleep apnea, such as daytime sleepiness,3 andmeta-analyses have shown it to be associated with a reduc-tion of about 2 mm Hg in BP.4-8 However, the estimated asso-ciation of trial-level characteristics (mean nightly CPAP use inparticular) with the effects of CPAP reported in individual ran-domized clinical trials (RCTs) has been less consistent.5,6
Alternative treatments often used by patients unable to tol-erate CPAP are mandibular advancement devices (MADs),which work by protruding the mandible and tongue to keepairways open during sleep.9 The association of use of MADswith reductions in BP is less clear. A recent meta-analysis thatincluded only 2 RCTs was inconclusive.10 To our knowledge,no meta-analysis has comprehensively compared CPAP vsMADs on change in BP, perhaps due to a lack of RCTs. The mostrecent meta-analysis5 briefly reviewed 2 trials,11,12 comparingthe effects of CPAP with MADs on change in BP, and found con-flicting results between the studies.
The primary aim of our study was to perform a networkmeta-analysis13 comparing the association of CPAP vs MADsand vs an inactive control (eg, placebo or no treatment) withchanges in systolic BP (SBP) and diastolic BP (DBP) in patientswith obstructive sleep apnea. A secondary aim was to ex-plore the association of trial-level characteristics, such as meannightly CPAP use, with the reported treatment effects of CPAPvs inactive control therapy on BP outcomes.
MethodsInclusion CriteriaThe studies must have randomized participants aged 18 yearsor older with a diagnosis of obstructive sleep apnea (definedby an apnea-hypopnea index of ≥5/h) to at least 2 of the fol-lowing treatments: (1) CPAP, (2) MADs, or (3) inactive control,such as sham CPAP, placebo MADs, or conservative treat-ment (no active therapy). Trials must also have measured andreported data on SBP or DBP at a follow-up visit and prefer-ably also at enrollment or randomization, or reported a treat-ment effect for either outcome. If 2 eligible studies containeda significant overlap in patients, the larger of the 2 studies wasused in the analysis. The protocol for this meta-analysis ap-pears in Supplement 1.
Identification of TrialsLiterature searches were performed independently by 2 ofthe authors (D.J.B. and A.M.W.) using the databases ofMEDLINE, EMBASE, and the Cochrane Library from incep-
tion to the end of August 2015. The RCTs were identifiedusing the Cochrane Collaboration highly sensitive searchstrategy (sensitivity-maximizing and precision-maximizingversion).14 The general electronic search strategy appears inSupplement 2. The bibliographies of all eligible trials andreview articles were also screened for relevant trials thatmight have been missed in the database search. Inclusionwas restricted to trials reported in English.
Selection of Studies and Data ExtractionTwo of the authors (D.J.B. and A.M.W.) assessed the eligibil-ity of studies found in the literature searches. One author(D.J.B.) extracted the relevant data from eligible studies, whichwas then independently checked by another author (T.G.). Trialcharacteristics, such as sample size, length of follow-up, typeof control group (eg, placebo or no treatment), and type of study(eg, crossover or parallel), were recorded. The main outcomeof interest was the change in SBP and DBP between baselineand follow-up in the 3 treatment groups (CPAP, MADs, inac-tive control). Treatment effects were extracted directly fromthe studies along with standard errors, 95% confidence inter-vals, or P values. If treatment effects were not reported, otherdata, such as mean (standard deviation) for SBP and DBP foreach treatment group at each visit or the change in SBP andDBP between visits in each group, were recorded and used toestimate the treatment effect of interest.
Measurements of BP during the daytime (while the pa-tient was ambulatory), during the morning, or during an of-fice visit were preferable (in that order). Otherwise, 24-hourambulatory BP measurements were used. Summary statis-tics for the following baseline data were also recorded: age,body mass index (calculated as weight in kilograms dividedby height in meters squared), apnea-hypopnea index, oxy-gen desaturation index, Epworth Sleepiness Scale score, andproportion of male participants. We also extracted the meannightly use of CPAP from trials comparing CPAP with an inac-tive control.
End PointsThe primary outcomes were the absolute changes in SBP andDBP from baseline to follow-up in each of the following treat-ment comparisons: (1) CPAP vs inactive control, (2) MADs vsinactive control, and (3) CPAP vs MADs. For the first compari-son (CPAP vs inactive control), we also investigated the asso-ciation of mean CPAP use with the treatment effects reportedin each trial for both outcomes of SBP and DBP. We also ex-plored the association between the reported treatment ef-fects and mean baseline apnea-hypopnea index, oxygen-desaturation index, baseline BP, length of follow-up, type ofcontrol group (sham CPAP, no treatment, or other placebo), andtype of BP measurement (daytime, morning, office, or 24 hour).Similar investigations for the second and third comparisonswere not made due to the insufficient number of studies di-rectly comparing these treatments.
Risk of Bias AssessmentTwo authors (D.J.B. and T.G.) evaluated the risk of bias ineach study included in the meta-analysis using the Cochrane
Treatment for Obstructive Sleep Apnea Original Investigation Research
jama.com (Reprinted) JAMA December 1, 2015 Volume 314, Number 21 2281
Copyright 2015 American Medical Association. All rights reserved.
Downloaded From: http://jama.jamanetwork.com/ by a UZH Hauptbibliothek / Zentralbibliothek Zuerich User on 12/02/2015
Copyright 2015 American Medical Association. All rights reserved.
Collaboration tool for assessing risk of bias.15 This toolassesses studies on different sources of bias (selection, detec-tion, performance, attrition, or reporting bias) and catego-rizes studies by low, unclear, or high risk of bias in eachdomain. We then planned to compare the reported treatmenteffects on SBP and DBP in studies at low and high risk of biasin each domain using meta-regression.
Statistical MethodsIf treatment effects or changes in SBP and DBP in each treat-ment group were not reported in studies, then the mean (stan-dard deviation) values for each outcome, in each group, andat each visit were extracted and used to estimate treatment ef-fects. To calculate standard error, an estimate of the correla-tion between SBP and DBP measurements at baseline andfollow-up was required. Previous meta-analyses6,7 have as-sumed this correlation to be 0.5, which might not be appro-priate. We instead estimated the correlation in all studies forwhich it was possible (ie, those reporting standard deviationsor standard errors of treatment effects or changes during fol-low-up and the standard deviations at each visit) and used themean correlation to impute the treatment effect standard er-ror in studies for which estimation was not possible. To as-sess the sensitivity of our results to this correlation, we re-peated the meta-analysis using the minimum and maximumcorrelations estimated from the studies. In crossover studiesnot reporting treatment effects from paired t tests (or tests ac-counting for the between-period correlation), the between-period correlation was assumed to be zero, slightly increas-
ing the conservatism of the analysis.16 In studies not reportingdata on baseline BP, conservative estimates of treatment ef-fects were obtained by estimating the differences betweentreatment groups in follow-up BP measurements.
Separate meta-analyses of direct evidence only (pairwisemeta-analyses) were conducted for each of the 3 treatmentcomparisons listed above using the metan command in Stataversion 14.0 (StataCorp).17 Heterogeneity was assessed usingthe estimated between-study variance (τ2), Cochran χ2 test,and the I2 statistic.18 Only random-effects models were usedto be consistent with the network meta-analysis. To assessthe association of trial characteristics and risk of bias with thereported effects of CPAP compared with an inactive control,we used random-effects meta-regression (metareg commandin Stata19), and only included studies directly comparingthese 2 interventions. To be consistent with the pairwiserandom-effects meta-analyses, we performed each meta-regression without the use of the adjustment method byKnapp and Hartung,20 but also applied the adjustment in asensitivity analysis.
Because there are relatively few trials directly comparingCPAP vs MADs on change in BP, a meta-analysis of only directevidence is likely to lack power. To strengthen this and all othertreatment comparisons, we performed a network meta-analysis. Unlike traditional meta-analyses, this method has theadvantage of allowing trials comparing CPAP or MADs withsome other common treatment (eg, placebo) to be incorpo-rated into the analysis, thus increasing power and enabling abetter comparison of CPAP and MADs to be made.13
We used multivariate, random-effects meta-regressionsto perform each analysis using the network family of com-mands in Stata.21 We first fitted a consistency model, whichassumes that treatment effects from direct and indirect com-parisons are in agreement. An unstructured between-studycovariance matrix was used to allow for the possibility ofunequal levels of heterogeneity in each comparison. We alsoperformed a sensitivity analysis for which heterogeneity wasassumed to be the same in each comparison. To test forinconsistency, design × treatment interactions were addedto the consistency model, in which design refers only to theset of treatments in a trial (4 sets in total). To further investi-gate the plausibility of the consistency assumption, we alsochecked whether potential effect modifiers were similaracross different designs.22 If inconsistency was not rejected,we estimated the probability of each treatment having thestrongest association with BP reduction by applying theparametric bootstrap procedure (with 5000 draws), whichwas described by White.23 Forest plots were used to summa-rize study level and pooled treatment comparisons andcomparison-adjusted funnel plots were used to assess publi-cation bias.24 All analyses were conducted at the 2-sided sig-nificance level of .05.
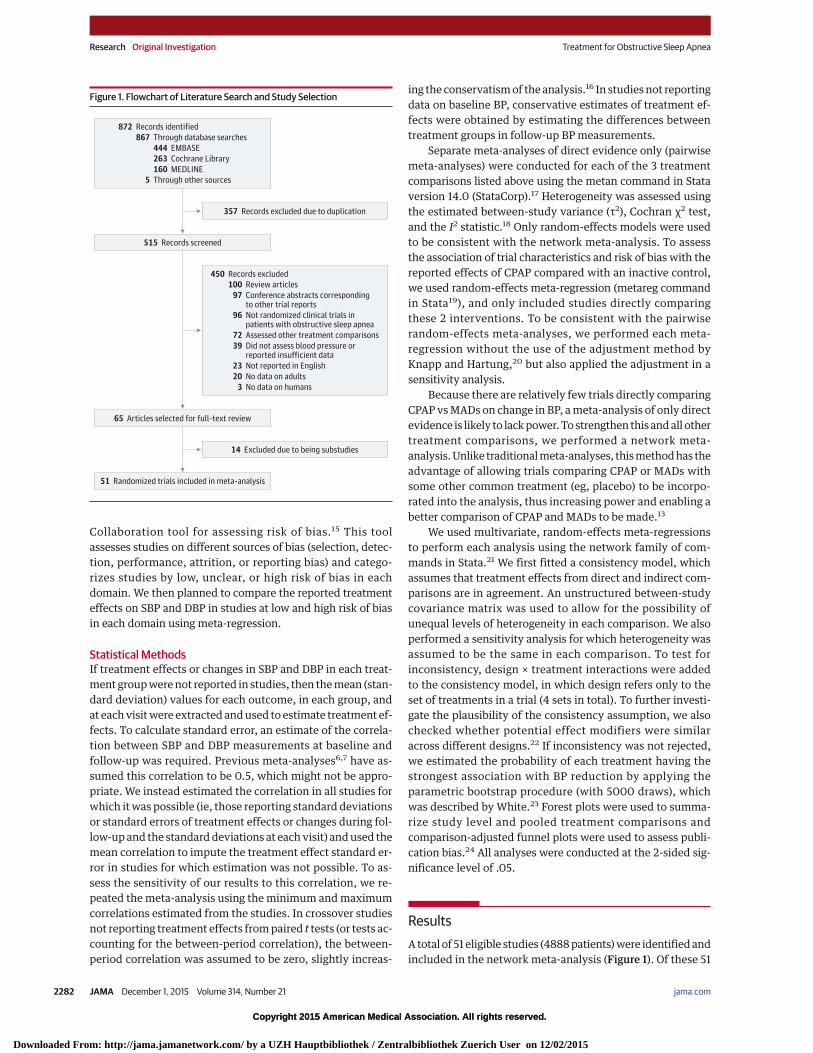
ResultsA total of 51 eligible studies (4888 patients) were identified andincluded in the network meta-analysis (Figure 1). Of these 51
Figure 1. Flowchart of Literature Search and Study Selection
357 Records excluded due to duplication
65 Articles selected for full-text review
51 Randomized trials included in meta-analysis
450 Records excluded
100 Review articles
97 Conference abstracts correspondingto other trial reports
96 Not randomized clinical trials inpatients with obstructive sleep apnea
72 Assessed other treatment comparisons
39 Did not assess blood pressure orreported insufficient data
23 Not reported in English
20 No data on adults
3 No data on humans
14 Excluded due to being substudies
872 Records identified
867 Through database searches
5 Through other sources
444 EMBASE
263 Cochrane Library
160 MEDLINE
515 Records screened
Research Original Investigation Treatment for Obstructive Sleep Apnea
2282 JAMA December 1, 2015 Volume 314, Number 21 (Reprinted) jama.com
Copyright 2015 American Medical Association. All rights reserved.
Downloaded From: http://jama.jamanetwork.com/ by a UZH Hauptbibliothek / Zentralbibliothek Zuerich User on 12/02/2015
Copyright 2015 American Medical Association. All rights reserved.
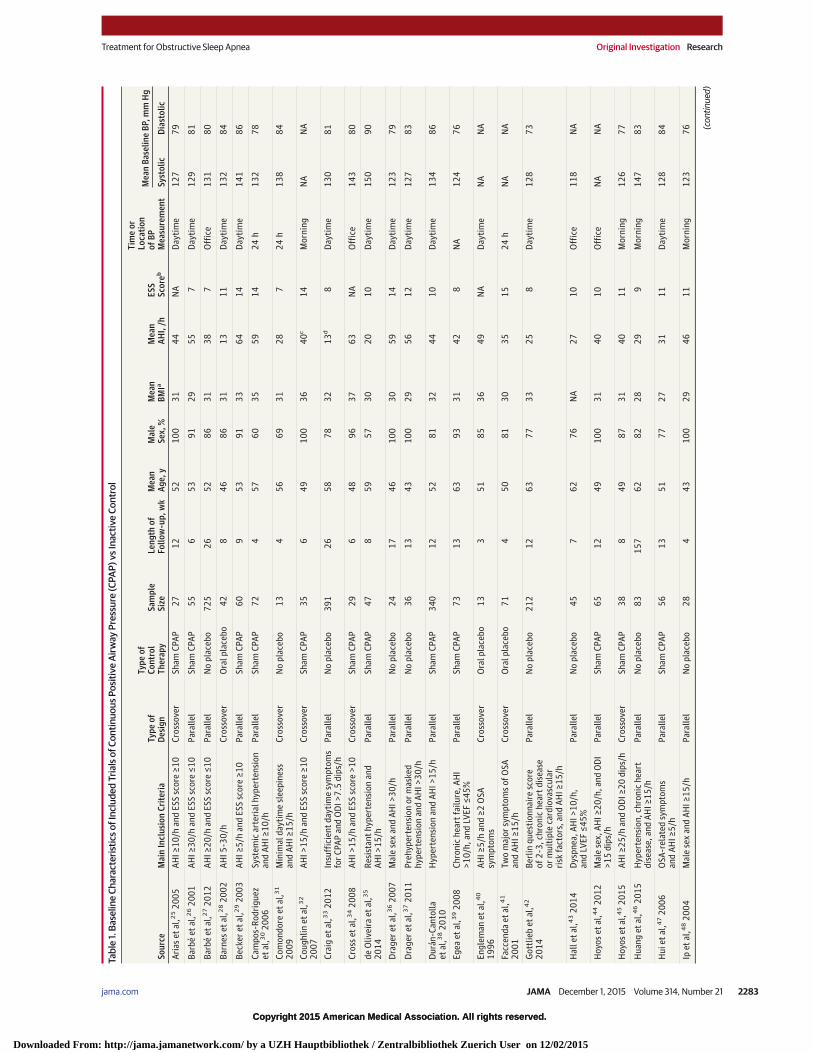
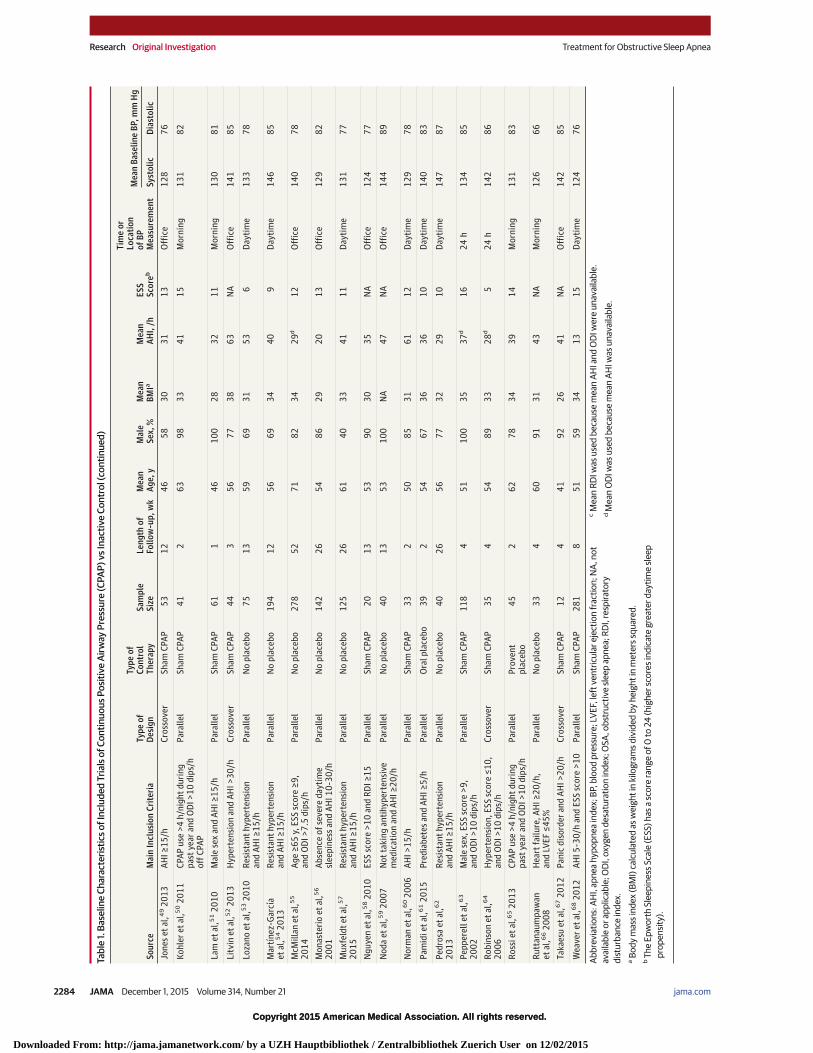
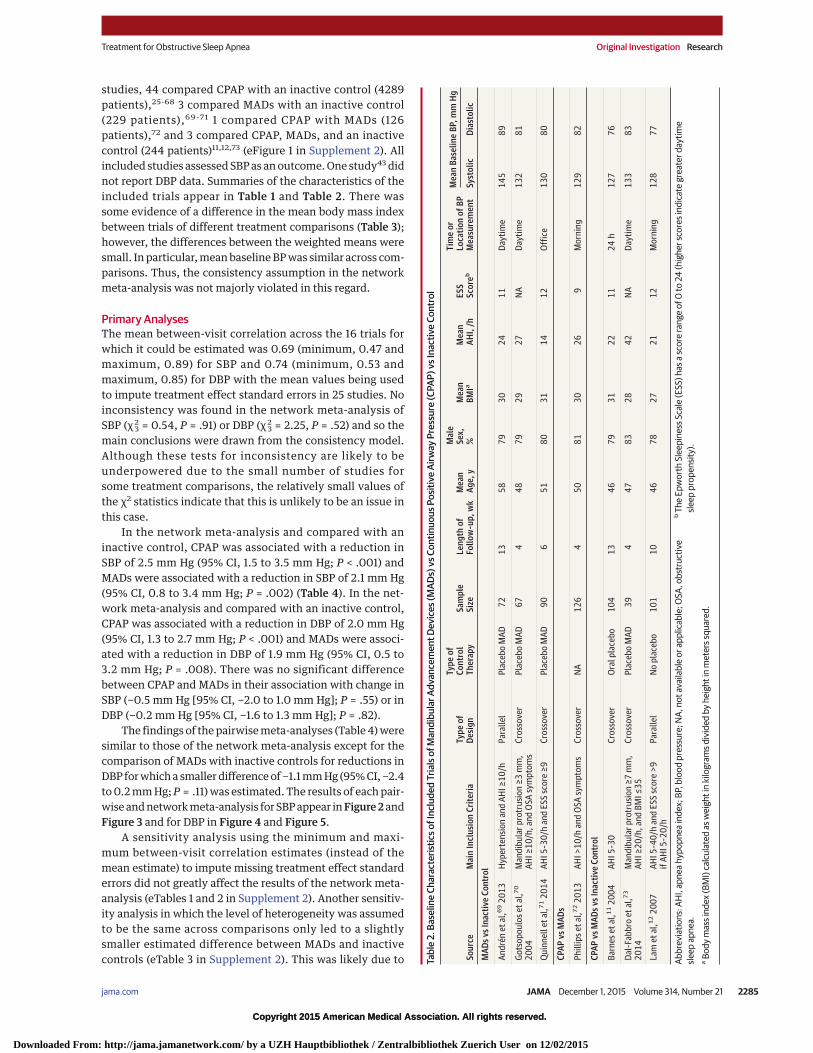
studies, 44 compared CPAP with an inactive control (4289patients),25-68 3 compared MADs with an inactive control(229 patients),69-71 1 compared CPAP with MADs (126patients),72 and 3 compared CPAP, MADs, and an inactivecontrol (244 patients)11,12,73 (eFigure 1 in Supplement 2). Allincluded studies assessed SBP as an outcome. One study43 didnot report DBP data. Summaries of the characteristics of theincluded trials appear in Table 1 and Table 2. There wassome evidence of a difference in the mean body mass indexbetween trials of different treatment comparisons (Table 3);however, the differences between the weighted means weresmall. In particular, mean baseline BP was similar across com-parisons. Thus, the consistency assumption in the networkmeta-analysis was not majorly violated in this regard.
Primary AnalysesThe mean between-visit correlation across the 16 trials forwhich it could be estimated was 0.69 (minimum, 0.47 andmaximum, 0.89) for SBP and 0.74 (minimum, 0.53 andmaximum, 0.85) for DBP with the mean values being usedto impute treatment effect standard errors in 25 studies. Noinconsistency was found in the network meta-analysis ofSBP (χ2
3 = 0.54, P = .91) or DBP (χ23 = 2.25, P = .52) and so the
main conclusions were drawn from the consistency model.Although these tests for inconsistency are likely to beunderpowered due to the small number of studies forsome treatment comparisons, the relatively small values ofthe χ2 statistics indicate that this is unlikely to be an issue inthis case.
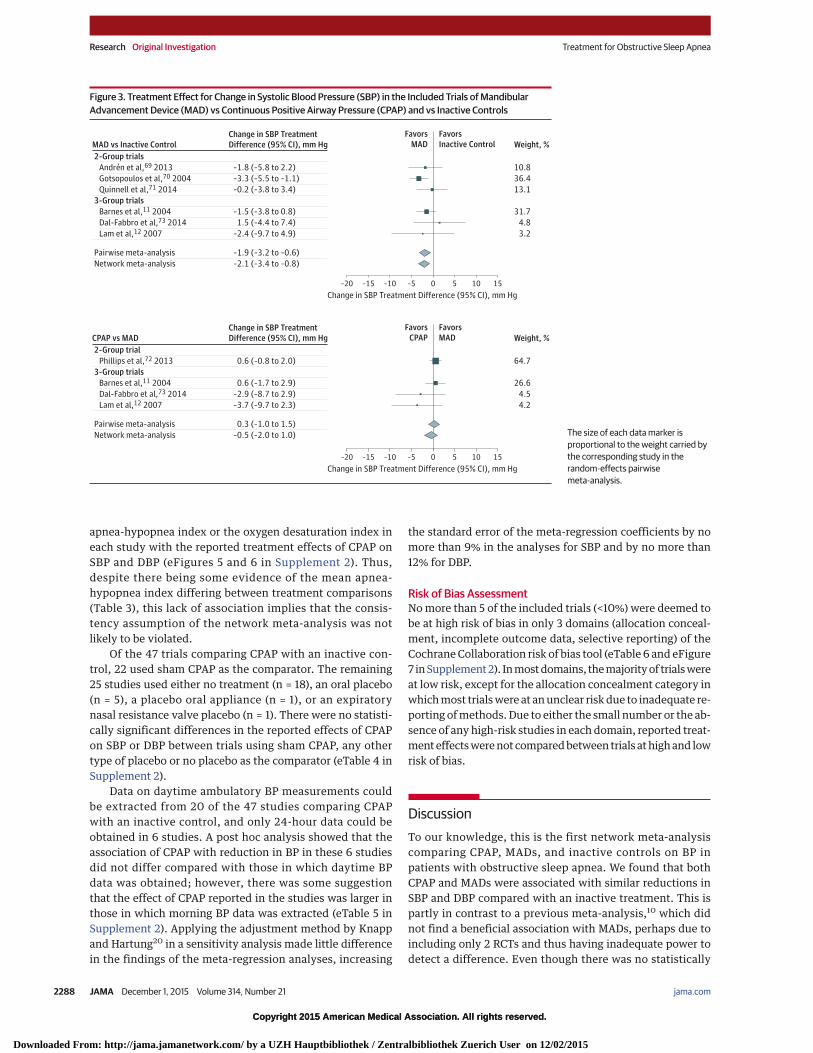
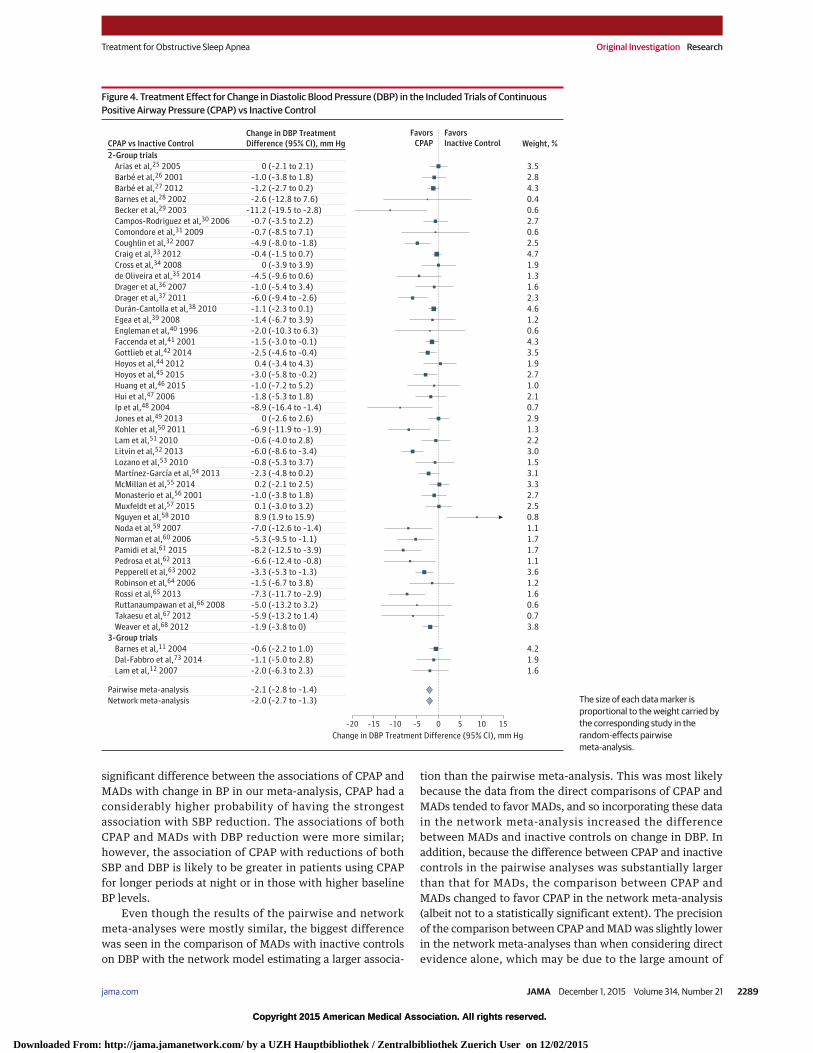
In the network meta-analysis and compared with aninactive control, CPAP was associated with a reduction inSBP of 2.5 mm Hg (95% CI, 1.5 to 3.5 mm Hg; P < .001) andMADs were associated with a reduction in SBP of 2.1 mm Hg(95% CI, 0.8 to 3.4 mm Hg; P = .002) (Table 4). In the net-work meta-analysis and compared with an inactive control,CPAP was associated with a reduction in DBP of 2.0 mm Hg(95% CI, 1.3 to 2.7 mm Hg; P < .001) and MADs were associ-ated with a reduction in DBP of 1.9 mm Hg (95% CI, 0.5 to3.2 mm Hg; P = .008). There was no significant differencebetween CPAP and MADs in their association with change inSBP (−0.5 mm Hg [95% CI, −2.0 to 1.0 mm Hg]; P = .55) or inDBP (−0.2 mm Hg [95% CI, −1.6 to 1.3 mm Hg]; P = .82).
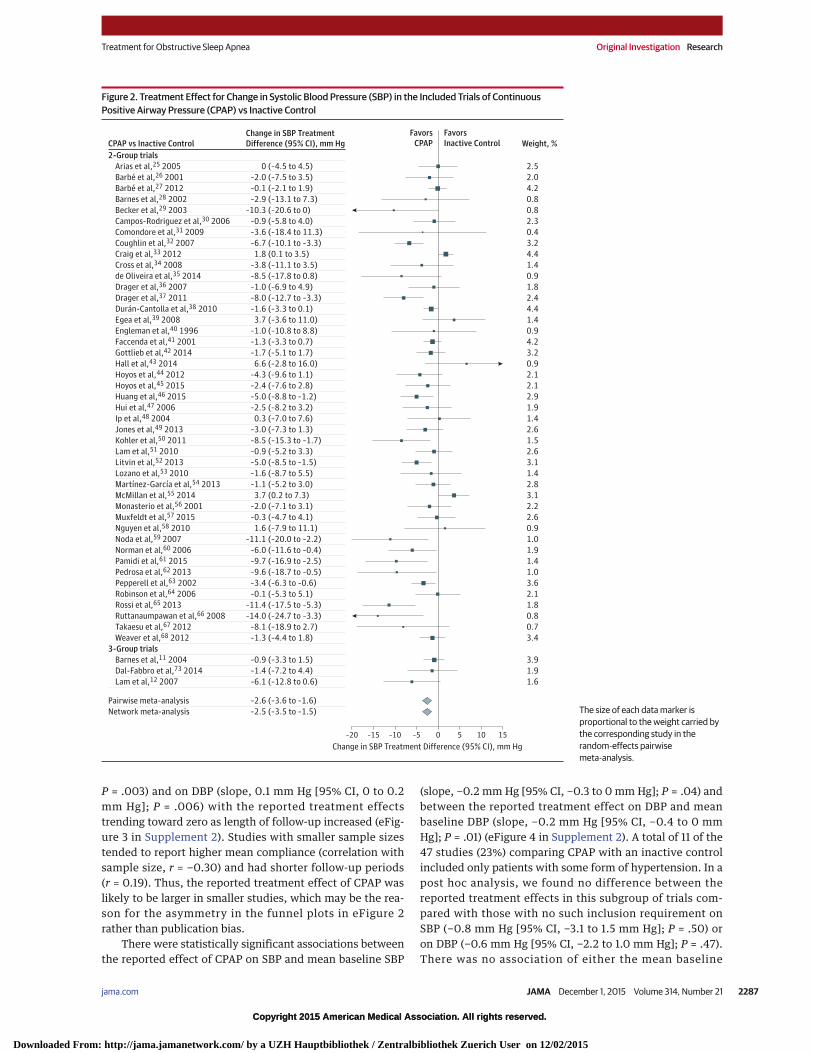
The findings of the pairwise meta-analyses (Table 4) weresimilar to those of the network meta-analysis except for thecomparison of MADs with inactive controls for reductions inDBP for which a smaller difference of −1.1 mm Hg (95% CI, −2.4to 0.2 mm Hg; P = .11) was estimated. The results of each pair-wise and network meta-analysis for SBP appear in Figure 2 andFigure 3 and for DBP in Figure 4 and Figure 5.
A sensitivity analysis using the minimum and maxi-mum between-visit correlation estimates (instead of themean estimate) to impute missing treatment effect standarderrors did not greatly affect the results of the network meta-analysis (eTables 1 and 2 in Supplement 2). Another sensitiv-ity analysis in which the level of heterogeneity was assumedto be the same across comparisons only led to a slightlysmaller estimated difference between MADs and inactivecontrols (eTable 3 in Supplement 2). This was likely due to Ta
ble
2.Ba
selin
eCh
arac
teris
ticso
fInc
lude
dTr
ials
ofM
andi
bula
rAdv
ance
men
tDev
ices
(MAD
s)vs
Cont
inuo
usPo
sitiv
eAi
rway
Pres
sure
(CPA
P)vs
Inac
tive
Cont
rol
Sour
ceM
ain
Incl
usio
nCr
iteria
Type
ofDe
sign
Type
ofCo
ntro
lTh
erap
ySa
mpl
eSi
zeLe
ngth
ofFo
llow
-up,
wk
Mea
nAg
e,y
Mal
eSe
x,%
Mea
nBM
IaM
ean
AHI,
/hES
SSc
oreb
Tim
eor
Loca
tion
ofBP
Mea
sure
men
t
Mea
nBa
selin
eBP
,mm
Hg
Syst
olic
Dias
tolic
MAD
svsI
nact
ive
Cont
rol
An
dré
net
al,6
92
01
3H
yper
ten
sio
nan
dA
HI
≥1
0/h
Par
alle
lP
lace
bo
MA
D7
21
35
87
93
02
41
1D
ayti
me
14
58
9
Go
tso
po
ulo
set
al,7
0
20
04
Man
dib
ula
rp
rotr
usi
on
≥3
mm
,A
HI
≥1
0/h
,an
dO
SA
sym
pto
ms
Cro
sso
ver
Pla
ceb
oM
AD
67
44
87
92
92
7N
AD
ayti
me
13
28
1
Qu
inn
elle
tal
,71
20
14
AH
I5
-30
/han
dE
SS
sco
re≥
9C
ross
ove
rP
lace
bo
MA
D9
06
51
80
31
14
12
Off
ice
13
08
0
CPAP
vsM
ADs
Ph
illi
ps
etal
,72
20
13
AH
I>
10
/han
dO
SA
sym
pto
ms
Cro
sso
ver
NA
12
64
50
81
30
26
9M
orn
ing
12
98
2
CPAP
vsM
ADsv
sIna
ctiv
eCo
ntro
l
Bar
nes
etal
,11
20
04
AH
I5
-30
Cro
sso
ver
Ora
lpla
ceb
o1
04
13
46
79
31
22
11
24
h1
27
76
Dal
-Fab
bro
etal
,73
20
14
Man
dib
ula
rp
rotr
usi
on
≥7
mm
,A
HI
≥2
0/h
,an
dB
MI
≤3
5C
ross
ove
rP
lace
bo
MA
D3
94
47
83
28
42
NA
Day
tim
e1
33
83
Lam
etal
,12
20
07
AH
I5
-40
/han
dE
SS
sco
re>
9if
AH
I5
-20
/hP
aral
lel
No
pla
ceb
o1
01
10
46
78
27
21
12
Mo
rnin
g1
28
77
Abbr
evia
tions
:AH
I,ap
nea
hypo
pnea
inde
x;BP
,blo
odpr
essu
re;N
A,no
tava
ilabl
eor
appl
icab
le;O
SA,o
bstr
uctiv
esle
epap
nea.
aBo
dym
assi
ndex
(BM
I)ca
lcul
ated
asw
eigh
tin
kilo
gram
sdiv
ided
byhe
ight
inm
eter
ssqu
ared
.
bTh
eEp
wor
thSl
eepi
ness
Scal
e(E
SS)h
asa
scor
era
nge
of0
to24
(hig
hers
core
sind
icat
egr
eate
rday
time
sleep
prop
ensit
y).
Treatment for Obstructive Sleep Apnea Original Investigation Research
jama.com (Reprinted) JAMA December 1, 2015 Volume 314, Number 21 2285
Copyright 2015 American Medical Association. All rights reserved.
Downloaded From: http://jama.jamanetwork.com/ by a UZH Hauptbibliothek / Zentralbibliothek Zuerich User on 12/02/2015
Copyright 2015 American Medical Association. All rights reserved.
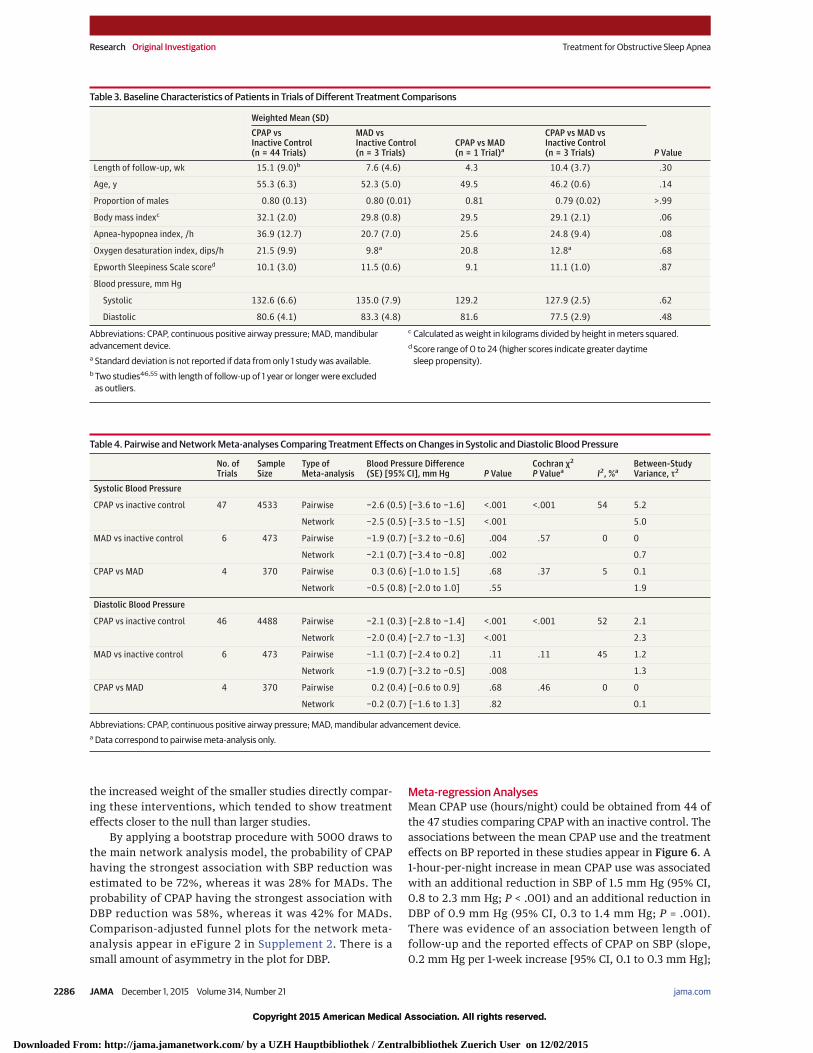
the increased weight of the smaller studies directly compar-ing these interventions, which tended to show treatmenteffects closer to the null than larger studies.
By applying a bootstrap procedure with 5000 draws tothe main network analysis model, the probability of CPAPhaving the strongest association with SBP reduction wasestimated to be 72%, whereas it was 28% for MADs. Theprobability of CPAP having the strongest association withDBP reduction was 58%, whereas it was 42% for MADs.Comparison-adjusted funnel plots for the network meta-analysis appear in eFigure 2 in Supplement 2. There is asmall amount of asymmetry in the plot for DBP.
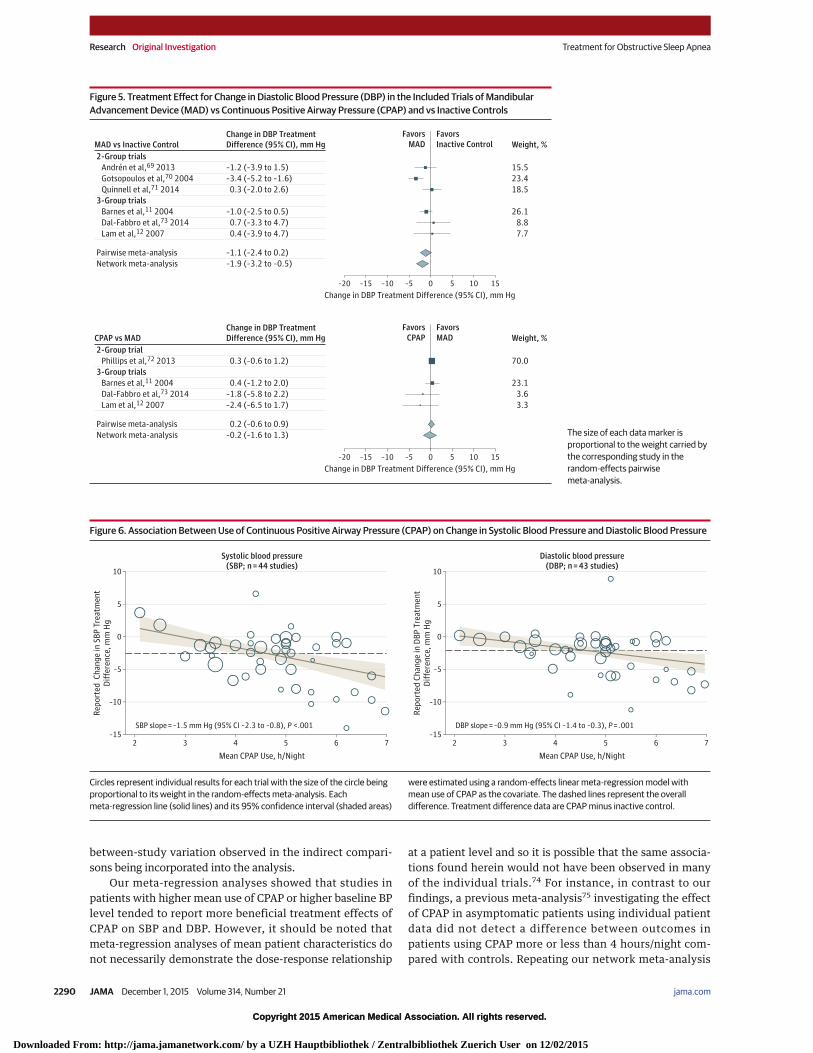
Meta-regression AnalysesMean CPAP use (hours/night) could be obtained from 44 ofthe 47 studies comparing CPAP with an inactive control. Theassociations between the mean CPAP use and the treatmenteffects on BP reported in these studies appear in Figure 6. A1-hour-per-night increase in mean CPAP use was associatedwith an additional reduction in SBP of 1.5 mm Hg (95% CI,0.8 to 2.3 mm Hg; P < .001) and an additional reduction inDBP of 0.9 mm Hg (95% CI, 0.3 to 1.4 mm Hg; P = .001).There was evidence of an association between length offollow-up and the reported effects of CPAP on SBP (slope,0.2 mm Hg per 1-week increase [95% CI, 0.1 to 0.3 mm Hg];
Table 3. Baseline Characteristics of Patients in Trials of Different Treatment Comparisons
Abbreviations: CPAP, continuous positive airway pressure; MAD, mandibularadvancement device.a Standard deviation is not reported if data from only 1 study was available.b Two studies46,55 with length of follow-up of 1 year or longer were excluded
as outliers.
c Calculated as weight in kilograms divided by height in meters squared.d Score range of 0 to 24 (higher scores indicate greater daytime
sleep propensity).
Table 4. Pairwise and Network Meta-analyses Comparing Treatment Effects on Changes in Systolic and Diastolic Blood Pressure
No. ofTrials
SampleSize
Type ofMeta-analysis
Blood Pressure Difference(SE) [95% CI], mm Hg P Value
Cochran χ2
P Valuea I2, %aBetween-StudyVariance, τ2
Systolic Blood Pressure
CPAP vs inactive control 47 4533 Pairwise −2.6 (0.5) [−3.6 to −1.6] <.001 <.001 54 5.2
Network −2.5 (0.5) [−3.5 to −1.5] <.001 5.0
MAD vs inactive control 6 473 Pairwise −1.9 (0.7) [−3.2 to −0.6] .004 .57 0 0
Network −2.1 (0.7) [−3.4 to −0.8] .002 0.7
CPAP vs MAD 4 370 Pairwise 0.3 (0.6) [−1.0 to 1.5] .68 .37 5 0.1
Network −0.5 (0.8) [−2.0 to 1.0] .55 1.9
Diastolic Blood Pressure
CPAP vs inactive control 46 4488 Pairwise −2.1 (0.3) [−2.8 to −1.4] <.001 <.001 52 2.1
Network −2.0 (0.4) [−2.7 to −1.3] <.001 2.3
MAD vs inactive control 6 473 Pairwise −1.1 (0.7) [−2.4 to 0.2] .11 .11 45 1.2
Network −1.9 (0.7) [−3.2 to −0.5] .008 1.3
CPAP vs MAD 4 370 Pairwise 0.2 (0.4) [−0.6 to 0.9] .68 .46 0 0
Network −0.2 (0.7) [−1.6 to 1.3] .82 0.1
Abbreviations: CPAP, continuous positive airway pressure; MAD, mandibular advancement device.a Data correspond to pairwise meta-analysis only.
Research Original Investigation Treatment for Obstructive Sleep Apnea
2286 JAMA December 1, 2015 Volume 314, Number 21 (Reprinted) jama.com
Copyright 2015 American Medical Association. All rights reserved.
Downloaded From: http://jama.jamanetwork.com/ by a UZH Hauptbibliothek / Zentralbibliothek Zuerich User on 12/02/2015
Copyright 2015 American Medical Association. All rights reserved.
P = .003) and on DBP (slope, 0.1 mm Hg [95% CI, 0 to 0.2mm Hg]; P = .006) with the reported treatment effectstrending toward zero as length of follow-up increased (eFig-ure 3 in Supplement 2). Studies with smaller sample sizestended to report higher mean compliance (correlation withsample size, r = −0.30) and had shorter follow-up periods(r = 0.19). Thus, the reported treatment effect of CPAP waslikely to be larger in smaller studies, which may be the rea-son for the asymmetry in the funnel plots in eFigure 2rather than publication bias.
There were statistically significant associations betweenthe reported effect of CPAP on SBP and mean baseline SBP
(slope, −0.2 mm Hg [95% CI, −0.3 to 0 mm Hg]; P = .04) andbetween the reported treatment effect on DBP and meanbaseline DBP (slope, −0.2 mm Hg [95% CI, −0.4 to 0 mmHg]; P = .01) (eFigure 4 in Supplement 2). A total of 11 of the47 studies (23%) comparing CPAP with an inactive controlincluded only patients with some form of hypertension. In apost hoc analysis, we found no difference between thereported treatment effects in this subgroup of trials com-pared with those with no such inclusion requirement onSBP (−0.8 mm Hg [95% CI, −3.1 to 1.5 mm Hg]; P = .50) oron DBP (−0.6 mm Hg [95% CI, −2.2 to 1.0 mm Hg]; P = .47).There was no association of either the mean baseline
Figure 2. Treatment Effect for Change in Systolic Blood Pressure (SBP) in the Included Trials of ContinuousPositive Airway Pressure (CPAP) vs Inactive Control
–20 –5 10–10 5 150
Change in SBP Treatment Difference (95% CI), mm Hg
–15
Weight, %Favors
CPAPFavorsInactive ControlCPAP vs Inactive Control
2-Group trials
Change in SBP TreatmentDifference (95% CI), mm Hg
2.5Arias et al,25 2005 0 (–4.5 to 4.5)
2.0Barbé et al,26 2001 –2.0 (–7.5 to 3.5)
4.2Barbé et al,27 2012 –0.1 (–2.1 to 1.9)
0.8Barnes et al,28 2002 –2.9 (–13.1 to 7.3)
0.8Becker et al,29 2003 –10.3 (–20.6 to 0)
2.3Campos-Rodriguez et al,30 2006 –0.9 (–5.8 to 4.0)
0.4Comondore et al,31 2009 –3.6 (–18.4 to 11.3)
3.2Coughlin et al,32 2007 –6.7 (–10.1 to –3.3)
4.4Craig et al,33 2012 1.8 (0.1 to 3.5)
1.4Cross et al,34 2008 –3.8 (–11.1 to 3.5)
0.9de Oliveira et al,35 2014 –8.5 (–17.8 to 0.8)
1.8Drager et al,36 2007 –1.0 (–6.9 to 4.9)
2.4Drager et al,37 2011 –8.0 (–12.7 to –3.3)
4.4Durán-Cantolla et al,38 2010 –1.6 (–3.3 to 0.1)
1.4Egea et al,39 2008 3.7 (–3.6 to 11.0)
0.9Engleman et al,40 1996 –1.0 (–10.8 to 8.8)
4.2Faccenda et al,41 2001 –1.3 (–3.3 to 0.7)
3.2Gottlieb et al,42 2014 –1.7 (–5.1 to 1.7)
0.9Hall et al,43 2014 6.6 (–2.8 to 16.0)
2.1Hoyos et al,44 2012 –4.3 (–9.6 to 1.1)
2.1Hoyos et al,45 2015 –2.4 (–7.6 to 2.8)
2.9Huang et al,46 2015 –5.0 (–8.8 to –1.2)
1.9Hui et al,47 2006 –2.5 (–8.2 to 3.2)
1.4Ip et al,48 2004 0.3 (–7.0 to 7.6)
2.6Jones et al,49 2013 –3.0 (–7.3 to 1.3)
1.5Kohler et al,50 2011 –8.5 (–15.3 to –1.7)
2.6Lam et al,51 2010 –0.9 (–5.2 to 3.3)
3.1Litvin et al,52 2013 –5.0 (–8.5 to –1.5)
1.4Lozano et al,53 2010 –1.6 (–8.7 to 5.5)
2.8Martínez-García et al,54 2013 –1.1 (–5.2 to 3.0)
3.1McMillan et al,55 2014 3.7 (0.2 to 7.3)
2.2Monasterio et al,56 2001 –2.0 (–7.1 to 3.1)
2.6Muxfeldt et al,57 2015 –0.3 (–4.7 to 4.1)
0.9Nguyen et al,58 2010 1.6 (–7.9 to 11.1)
1.0Noda et al,59 2007 –11.1 (–20.0 to –2.2)
1.9Norman et al,60 2006 –6.0 (–11.6 to –0.4)
1.4Pamidi et al,61 2015 –9.7 (–16.9 to –2.5)
1.0Pedrosa et al,62 2013 –9.6 (–18.7 to –0.5)
3.6Pepperell et al,63 2002 –3.4 (–6.3 to –0.6)
2.1Robinson et al,64 2006 –0.1 (–5.3 to 5.1)
1.8Rossi et al,65 2013 –11.4 (–17.5 to –5.3)
0.8Ruttanaumpawan et al,66 2008 –14.0 (–24.7 to –3.3)
0.7Takaesu et al,67 2012 –8.1 (–18.9 to 2.7)
3.4Weaver et al,68 2012 –1.3 (–4.4 to 1.8)
3.9Barnes et al,11 2004 –0.9 (–3.3 to 1.5)
1.9Dal-Fabbro et al,73 2014 –1.4 (–7.2 to 4.4)
1.6Lam et al,12 2007 –6.1 (–12.8 to 0.6)
3-Group trials
Pairwise meta-analysis –2.6 (–3.6 to –1.6)
Network meta-analysis –2.5 (–3.5 to –1.5) The size of each data marker isproportional to the weight carried bythe corresponding study in therandom-effects pairwisemeta-analysis.
Treatment for Obstructive Sleep Apnea Original Investigation Research
jama.com (Reprinted) JAMA December 1, 2015 Volume 314, Number 21 2287
Copyright 2015 American Medical Association. All rights reserved.
Downloaded From: http://jama.jamanetwork.com/ by a UZH Hauptbibliothek / Zentralbibliothek Zuerich User on 12/02/2015
Copyright 2015 American Medical Association. All rights reserved.
apnea-hypopnea index or the oxygen desaturation index ineach study with the reported treatment effects of CPAP onSBP and DBP (eFigures 5 and 6 in Supplement 2). Thus,despite there being some evidence of the mean apnea-hypopnea index differing between treatment comparisons(Table 3), this lack of association implies that the consis-tency assumption of the network meta-analysis was notlikely to be violated.
Of the 47 trials comparing CPAP with an inactive con-trol, 22 used sham CPAP as the comparator. The remaining25 studies used either no treatment (n = 18), an oral placebo(n = 5), a placebo oral appliance (n = 1), or an expiratorynasal resistance valve placebo (n = 1). There were no statisti-cally significant differences in the reported effects of CPAPon SBP or DBP between trials using sham CPAP, any othertype of placebo or no placebo as the comparator (eTable 4 inSupplement 2).
Data on daytime ambulatory BP measurements couldbe extracted from 20 of the 47 studies comparing CPAPwith an inactive control, and only 24-hour data could beobtained in 6 studies. A post hoc analysis showed that theassociation of CPAP with reduction in BP in these 6 studiesdid not differ compared with those in which daytime BPdata was obtained; however, there was some suggestionthat the effect of CPAP reported in the studies was larger inthose in which morning BP data was extracted (eTable 5 inSupplement 2). Applying the adjustment method by Knappand Hartung20 in a sensitivity analysis made little differencein the findings of the meta-regression analyses, increasing
the standard error of the meta-regression coefficients by nomore than 9% in the analyses for SBP and by no more than12% for DBP.
Risk of Bias AssessmentNo more than 5 of the included trials (<10%) were deemed tobe at high risk of bias in only 3 domains (allocation conceal-ment, incomplete outcome data, selective reporting) of theCochrane Collaboration risk of bias tool (eTable 6 and eFigure7 in Supplement 2). In most domains, the majority of trials wereat low risk, except for the allocation concealment category inwhich most trials were at an unclear risk due to inadequate re-porting of methods. Due to either the small number or the ab-sence of any high-risk studies in each domain, reported treat-ment effects were not compared between trials at high and lowrisk of bias.
DiscussionTo our knowledge, this is the first network meta-analysiscomparing CPAP, MADs, and inactive controls on BP inpatients with obstructive sleep apnea. We found that bothCPAP and MADs were associated with similar reductions inSBP and DBP compared with an inactive treatment. This ispartly in contrast to a previous meta-analysis,10 which didnot find a beneficial association with MADs, perhaps due toincluding only 2 RCTs and thus having inadequate power todetect a difference. Even though there was no statistically
Figure 3. Treatment Effect for Change in Systolic Blood Pressure (SBP) in the Included Trials of MandibularAdvancement Device (MAD) vs Continuous Positive Airway Pressure (CPAP) and vs Inactive Controls
–20 –5 10–10 5 150
Change in SBP Treatment Difference (95% CI), mm Hg
–15
Weight, %Favors
MADFavorsInactive ControlMAD vs Inactive Control
Change in SBP TreatmentDifference (95% CI), mm Hg
10.8Andrén et al,69 2013 –1.8 (–5.8 to 2.2)
36.4Gotsopoulos et al,70 2004 –3.3 (–5.5 to –1.1)
13.1Quinnell et al,71 2014 –0.2 (–3.8 to 3.4)
2-Group trials
31.7Barnes et al,11 2004 –1.5 (–3.8 to 0.8)
4.8Dal-Fabbro et al,73 2014 1.5 (–4.4 to 7.4)
3.2Lam et al,12 2007 –2.4 (–9.7 to 4.9)
3-Group trials
Pairwise meta-analysis –1.9 (–3.2 to –0.6)
Network meta-analysis –2.1 (–3.4 to –0.8)
–20 –5 10–10 5 150
Change in SBP Treatment Difference (95% CI), mm Hg
–15
Weight, %Favors
CPAPFavorsMADCPAP vs MAD
Change in SBP TreatmentDifference (95% CI), mm Hg
64.7Phillips et al,72 2013 0.6 (–0.8 to 2.0)
2-Group trial
26.6Barnes et al,11 2004 0.6 (–1.7 to 2.9)
4.5Dal-Fabbro et al,73 2014 –2.9 (–8.7 to 2.9)
4.2Lam et al,12 2007 –3.7 (–9.7 to 2.3)
3-Group trials
Pairwise meta-analysis 0.3 (–1.0 to 1.5)
Network meta-analysis –0.5 (–2.0 to 1.0) The size of each data marker isproportional to the weight carried bythe corresponding study in therandom-effects pairwisemeta-analysis.
Research Original Investigation Treatment for Obstructive Sleep Apnea
2288 JAMA December 1, 2015 Volume 314, Number 21 (Reprinted) jama.com
Copyright 2015 American Medical Association. All rights reserved.
Downloaded From: http://jama.jamanetwork.com/ by a UZH Hauptbibliothek / Zentralbibliothek Zuerich User on 12/02/2015
Copyright 2015 American Medical Association. All rights reserved.
significant difference between the associations of CPAP andMADs with change in BP in our meta-analysis, CPAP had aconsiderably higher probability of having the strongestassociation with SBP reduction. The associations of bothCPAP and MADs with DBP reduction were more similar;however, the association of CPAP with reductions of bothSBP and DBP is likely to be greater in patients using CPAPfor longer periods at night or in those with higher baselineBP levels.
Even though the results of the pairwise and networkmeta-analyses were mostly similar, the biggest differencewas seen in the comparison of MADs with inactive controlson DBP with the network model estimating a larger associa-
tion than the pairwise meta-analysis. This was most likelybecause the data from the direct comparisons of CPAP andMADs tended to favor MADs, and so incorporating these datain the network meta-analysis increased the differencebetween MADs and inactive controls on change in DBP. Inaddition, because the difference between CPAP and inactivecontrols in the pairwise analyses was substantially largerthan that for MADs, the comparison between CPAP andMADs changed to favor CPAP in the network meta-analysis(albeit not to a statistically significant extent). The precisionof the comparison between CPAP and MAD was slightly lowerin the network meta-analyses than when considering directevidence alone, which may be due to the large amount of
Figure 4. Treatment Effect for Change in Diastolic Blood Pressure (DBP) in the Included Trials of ContinuousPositive Airway Pressure (CPAP) vs Inactive Control
–20 –5 10–10 5 150
Change in DBP Treatment Difference (95% CI), mm Hg
–15
Weight, %Favors
CPAPFavorsInactive ControlCPAP vs Inactive Control
2-Group trials
Change in DBP TreatmentDifference (95% CI), mm Hg
3.5Arias et al,25 2005 0 (–2.1 to 2.1)
2.8Barbé et al,26 2001 –1.0 (–3.8 to 1.8)
4.3Barbé et al,27 2012 –1.2 (–2.7 to 0.2)
0.4Barnes et al,28 2002 –2.6 (–12.8 to 7.6)
0.6Becker et al,29 2003 –11.2 (–19.5 to –2.8)
2.7Campos-Rodriguez et al,30 2006 –0.7 (–3.5 to 2.2)
0.6Comondore et al,31 2009 –0.7 (–8.5 to 7.1)
2.5Coughlin et al,32 2007 –4.9 (–8.0 to –1.8)
4.7Craig et al,33 2012 –0.4 (–1.5 to 0.7)
1.9Cross et al,34 2008 0 (–3.9 to 3.9)
1.3de Oliveira et al,35 2014 –4.5 (–9.6 to 0.6)
1.6Drager et al,36 2007 –1.0 (–5.4 to 3.4)
2.3Drager et al,37 2011 –6.0 (–9.4 to –2.6)
4.6Durán-Cantolla et al,38 2010 –1.1 (–2.3 to 0.1)
1.2Egea et al,39 2008 –1.4 (–6.7 to 3.9)
0.6Engleman et al,40 1996 –2.0 (–10.3 to 6.3)
4.3Faccenda et al,41 2001 –1.5 (–3.0 to –0.1)
3.5Gottlieb et al,42 2014 –2.5 (–4.6 to –0.4)
1.9Hoyos et al,44 2012 0.4 (–3.4 to 4.3)
2.7Hoyos et al,45 2015 –3.0 (–5.8 to –0.2)
1.0Huang et al,46 2015 –1.0 (–7.2 to 5.2)
2.1Hui et al,47 2006 –1.8 (–5.3 to 1.8)
0.7Ip et al,48 2004 –8.9 (–16.4 to –1.4)
2.9Jones et al,49 2013 0 (–2.6 to 2.6)
1.3Kohler et al,50 2011 –6.9 (–11.9 to –1.9)
2.2Lam et al,51 2010 –0.6 (–4.0 to 2.8)
3.0Litvin et al,52 2013 –6.0 (–8.6 to –3.4)
1.5Lozano et al,53 2010 –0.8 (–5.3 to 3.7)
3.1Martínez-García et al,54 2013 –2.3 (–4.8 to 0.2)
3.3McMillan et al,55 2014 0.2 (–2.1 to 2.5)
2.7Monasterio et al,56 2001 –1.0 (–3.8 to 1.8)
2.5Muxfeldt et al,57 2015 0.1 (–3.0 to 3.2)
0.8Nguyen et al,58 2010 8.9 (1.9 to 15.9)
1.1Noda et al,59 2007 –7.0 (–12.6 to –1.4)
1.7Norman et al,60 2006 –5.3 (–9.5 to –1.1)
1.7Pamidi et al,61 2015 –8.2 (–12.5 to –3.9)
1.1Pedrosa et al,62 2013 –6.6 (–12.4 to –0.8)
3.6Pepperell et al,63 2002 –3.3 (–5.3 to –1.3)
1.2Robinson et al,64 2006 –1.5 (–6.7 to 3.8)
1.6Rossi et al,65 2013 –7.3 (–11.7 to –2.9)
0.6Ruttanaumpawan et al,66 2008 –5.0 (–13.2 to 3.2)
0.7Takaesu et al,67 2012 –5.9 (–13.2 to 1.4)
3.8Weaver et al,68 2012 –1.9 (–3.8 to 0)
4.2Barnes et al,11 2004 –0.6 (–2.2 to 1.0)
1.9Dal-Fabbro et al,73 2014 –1.1 (–5.0 to 2.8)
1.6Lam et al,12 2007 –2.0 (–6.3 to 2.3)
3-Group trials
Pairwise meta-analysis –2.1 (–2.8 to –1.4)
Network meta-analysis –2.0 (–2.7 to –1.3) The size of each data marker isproportional to the weight carried bythe corresponding study in therandom-effects pairwisemeta-analysis.
Treatment for Obstructive Sleep Apnea Original Investigation Research
jama.com (Reprinted) JAMA December 1, 2015 Volume 314, Number 21 2289
Copyright 2015 American Medical Association. All rights reserved.
Downloaded From: http://jama.jamanetwork.com/ by a UZH Hauptbibliothek / Zentralbibliothek Zuerich User on 12/02/2015
Copyright 2015 American Medical Association. All rights reserved.
between-study variation observed in the indirect compari-sons being incorporated into the analysis.
Our meta-regression analyses showed that studies inpatients with higher mean use of CPAP or higher baseline BPlevel tended to report more beneficial treatment effects ofCPAP on SBP and DBP. However, it should be noted thatmeta-regression analyses of mean patient characteristics donot necessarily demonstrate the dose-response relationship
at a patient level and so it is possible that the same associa-tions found herein would not have been observed in manyof the individual trials.74 For instance, in contrast to ourfindings, a previous meta-analysis75 investigating the effectof CPAP in asymptomatic patients using individual patientdata did not detect a difference between outcomes inpatients using CPAP more or less than 4 hours/night com-pared with controls. Repeating our network meta-analysis
Figure 6. Association Between Use of Continuous Positive Airway Pressure (CPAP) on Change in Systolic Blood Pressure and Diastolic Blood Pressure
10
5
0
–5
–10
32–15
654 7
Rep
ort
ed C
han
ge
in S
BP
Tre
atm
ent
Dif
fere
nce
, m
m H
g
Systolic blood pressure(SBP; n = 44 studies)
Mean CPAP Use, h/Night
SBP slope = –1.5 mm Hg (95% CI –2.3 to –0.8), P <.001
10
5
0
–5
–10
32–15
654 7
Rep
ort
ed C
han
ge
in D
BP
Tre
atm
ent
Dif
fere
nce
, m
m H
g
Diastolic blood pressure(DBP; n = 43 studies)
Mean CPAP Use, h/Night
DBP slope = –0.9 mm Hg (95% CI –1.4 to –0.3), P = .001
Circles represent individual results for each trial with the size of the circle beingproportional to its weight in the random-effects meta-analysis. Eachmeta-regression line (solid lines) and its 95% confidence interval (shaded areas)
were estimated using a random-effects linear meta-regression model withmean use of CPAP as the covariate. The dashed lines represent the overalldifference. Treatment difference data are CPAP minus inactive control.
Figure 5. Treatment Effect for Change in Diastolic Blood Pressure (DBP) in the Included Trials of MandibularAdvancement Device (MAD) vs Continuous Positive Airway Pressure (CPAP) and vs Inactive Controls
–20 –5 10–10 5 150
Change in DBP Treatment Difference (95% CI), mm Hg
–15
Weight, %Favors
MADFavorsInactive ControlMAD vs Inactive Control
Change in DBP TreatmentDifference (95% CI), mm Hg
15.5Andrén et al,69 2013 –1.2 (–3.9 to 1.5)
23.4Gotsopoulos et al,70 2004 –3.4 (–5.2 to –1.6)
18.5Quinnell et al,71 2014 0.3 (–2.0 to 2.6)
2-Group trials
26.1Barnes et al,11 2004 –1.0 (–2.5 to 0.5)
8.8Dal-Fabbro et al,73 2014 0.7 (–3.3 to 4.7)
7.7Lam et al,12 2007 0.4 (–3.9 to 4.7)
3-Group trials
Pairwise meta-analysis –1.1 (–2.4 to 0.2)
Network meta-analysis –1.9 (–3.2 to –0.5)
–20 –5 10–10 5 150
Change in DBP Treatment Difference (95% CI), mm Hg
–15
Weight, %Favors
CPAPFavorsMADCPAP vs MAD
Change in DBP TreatmentDifference (95% CI), mm Hg
70.0Phillips et al,72 2013 0.3 (–0.6 to 1.2)
2-Group trial
23.1Barnes et al,11 2004 0.4 (–1.2 to 2.0)
3.6Dal-Fabbro et al,73 2014 –1.8 (–5.8 to 2.2)
3.3Lam et al,12 2007 –2.4 (–6.5 to 1.7)
3-Group trials
Pairwise meta-analysis 0.2 (–0.6 to 0.9)
Network meta-analysis –0.2 (–1.6 to 1.3) The size of each data marker isproportional to the weight carried bythe corresponding study in therandom-effects pairwisemeta-analysis.
Research Original Investigation Treatment for Obstructive Sleep Apnea
2290 JAMA December 1, 2015 Volume 314, Number 21 (Reprinted) jama.com
Copyright 2015 American Medical Association. All rights reserved.
Downloaded From: http://jama.jamanetwork.com/ by a UZH Hauptbibliothek / Zentralbibliothek Zuerich User on 12/02/2015
Copyright 2015 American Medical Association. All rights reserved.
using individual patient data rather than aggregate datawould improve the assessment of the association of CPAPuse and other patient characteristics with each treatmentcomparison but would be challenging to conduct due to thelarge number of RCTs from which to acquire data. Alterna-tively, conducting an RCT in which patients are given vari-ous durations of CPAP therapy each night will provide anunbiased assessment of whether there is a dose-responserelationship with BP but also might prove challengingto conduct.
Compared with the most recent meta-analysis5 on thistopic with similar inclusion criteria, our study includes18 more RCTs of CPAP and includes at least an additional2700 patients. Therefore, we had considerably more powerto assess the association of trial-level characteristics, suchas mean CPAP use, with the reported treatment effects onSBP and DBP. We have also used data from 6 trials compar-ing MADs with an inactive control, which is considerablymore than the 2 trials used in a previous meta-analysis.10
Although only 4 RCTs directly compared CPAP with MADs,we have attempted to strengthen this and all other compari-sons by incorporating indirect evidence using a networkmeta-analysis. Furthermore, in contrast to separate pair-wise analyses, we have been able to rank each treatmentbased on the strength of its association with reductions inSBP and DBP.
A limitation of our meta-analysis is that we only investi-gated 2 active treatments (ie, CPAP and MADs) and excludedother treatments, such as weight loss interventions,76 whichare likely to have beneficial effects on BP because they havebeen shown to have favorable effects on decreasing theseverity of obstructive sleep apnea. However, few trials ofother interventions exist and so including them would haveincreased the sparseness of the network meta-analysis,which can lead to modeling problems, particularly withregard to estimating the between-trial variance of treat-
ments that were not directly compared. Another limitationwas that we were unable to extract daytime ambulatory BPdata from all studies and thus had to use the availablemorning, office, or 24-hour measurements. Although thismay have increased heterogeneity, it allowed all of the rela-tively few studies investigating MADs to be incorporatedinto the analyses. A subgroup analysis showed some evi-dence that studies from which we extracted morning BPreported slightly larger treatment effects than in other stud-ies. However, there was no difference with studies in whichwe extracted 24-hour ambulatory measurements and so theeffect of any nighttime BP variability was negligible. Futuremeta-analyses could analyze each BP measurement sepa-rately to better understand whether each treatment is asso-ciated with greater reductions in BP during the daytimeor nighttime.
Our results were robust to the assumed between-visitcorrelation, which was estimated from parallel trials. How-ever, for simplicity, we did not estimate the between-periodcorrelation from crossover trials (reporting treatment effectsfrom paired t tests) and then use that estimate when calcu-lating treatment effects in other crossover studies. Althoughthis could be deemed a limitation of our analyses, assuminga between-period correlation of zero is arguably reasonablewhen considering changes from baseline.77 In addition,because only a small proportion of crossover studies weretreated this way, we do not believe that our results are sen-sitive to this assumption.
ConclusionsAmong patients with obstructive sleep apnea, both CPAP andMADs were associated with reductions in BP. Network meta-analysis did not identify a statistically significant differencebetween the BP outcomes associated with these therapies.
ARTICLE INFORMATION
Author Contributions: Dr Bratton had full access toall of the data in the study and takes responsibilityfor the integrity of the data and the accuracy of thedata analysis.Study concept and design: Bratton, Kohler.Acquisition, analysis, or interpretation of data: Allauthors.Drafting of the manuscript: Bratton.Critical revision of the manuscript for importantintellectual content: All authors.Statistical analysis: Bratton.Obtained funding: Kohler.Administrative, technical, or material support: Gaisl,Kohler.Study supervision: Kohler.
Conflict of Interest Disclosures: The authors havecompleted and submitted the ICMJE Form forDisclosure of Potential Conflicts of Interest andnone were reported.
Funding/Support: This research was supported bygrant 32003B_143365/1 from the Swiss NationalScience Foundation and by funding from theUniversity of Zurich Clinical Research PriorityProgram Sleep and Health.
Role of Funder/Sponsor: The sponsors had no rolein the design and conduct of the study; collection,management, analysis, and interpretation of thedata; preparation, review, or approval of themanuscript; and decision to submit the manuscriptfor publication.
REFERENCES
1. Young T, Peppard PE, Gottlieb DJ. Epidemiologyof obstructive sleep apnea. Am J Respir Crit Care Med.2002;165(9):1217-1239.
2. Kohler M, Stradling JR. Mechanisms of vasculardamage in obstructive sleep apnea. Nat Rev Cardiol.2010;7(12):677-685.
3. Giles TL, Lasserson TJ, Smith B, et al. Continuouspositive airways pressure for obstructive sleepapnoea in adults. Cochrane Database Syst Rev.doi:10.1002/14651858.CD001106.pub3.
4. Bazzano LA, Khan Z, Reynolds K, He J. Effect ofnocturnal nasal continuous positive airway pressureon blood pressure in obstructive sleep apnea.Hypertension. 2007;50(2):417-423.
5. Fava C, Dorigoni S, Dalle Vedove F, et al. Effect ofCPAP on blood pressure in patients withOSA/hypopnea. Chest. 2014;145(4):762-771.
6. Haentjens P, Van Meerhaeghe A, Moscariello A,et al. The impact of continuous positive airwaypressure on blood pressure in patients withobstructive sleep apnea syndrome. Arch Intern Med.2007;167(8):757-764.
7. Montesi SB, Edwards BA, Malhotra A, Bakker JP.The effect of continuous positive airway pressuretreatment on blood pressure. J Clin Sleep Med.2012;8(5):587-596.
8. Schein AS, Kerkhoff AC, Coronel CC, et al.Continuous positive airway pressure reduces bloodpressure in patients with obstructive sleep apnea.J Hypertens. 2014;32(9):1762-1773.
9. Bennett LS, Davies RJ, Stradling JR.Oral appliances for the management of snoring andobstructive sleep apnoea. Thorax. 1998;53(suppl2):S58-S64.
10. Iftikhar IH, Hays ER, Iverson MA, et al. Effect oforal appliances on blood pressure in obstructivesleep apnea. J Clin Sleep Med. 2013;9(2):165-174.
Treatment for Obstructive Sleep Apnea Original Investigation Research
jama.com (Reprinted) JAMA December 1, 2015 Volume 314, Number 21 2291
Copyright 2015 American Medical Association. All rights reserved.
Downloaded From: http://jama.jamanetwork.com/ by a UZH Hauptbibliothek / Zentralbibliothek Zuerich User on 12/02/2015
Copyright 2015 American Medical Association. All rights reserved.
11. Barnes M, McEvoy RD, Banks S, et al. Efficacy ofpositive airway pressure and oral appliance in mildto moderate obstructive sleep apnea. Am J RespirCrit Care Med. 2004;170(6):656-664.
12. Lam B, Sam K, Mok WY, et al. Randomised studyof three non-surgical treatments in mild tomoderate obstructive sleep apnoea. Thorax. 2007;62(4):354-359.
26. Barbé F, Mayoralas LR, Duran J, et al.Treatment with continuous positive airwaypressure is not effective in patients with sleepapnea but no daytime sleepiness. Ann Intern Med.2001;134(11):1015-1023.
27. Barbé F, Durán-Cantolla J, Sánchez-de-la-TorreM, et al. Effect of continuous positive airwaypressure on the incidence of hypertension andcardiovascular events in nonsleepy patients withobstructive sleep apnea. JAMA. 2012;307(20):2161-2168.
28. Barnes M, Houston D, Worsnop CJ, et al.A randomized controlled trial of continuous positiveairway pressure in mild obstructive sleep apnea. AmJ Respir Crit Care Med. 2002;165(6):773-780.
29. Becker HF, Jerrentrup A, Ploch T, et al. Effect ofnasal continuous positive airway pressuretreatment on blood pressure in patients withobstructive sleep apnea. Circulation. 2003;107(1):68-73.
30. Campos-Rodriguez F, Grilo-Reina A,Perez-Ronchel J, et al. Effect of continuous positiveairway pressure on ambulatory BP in patients withsleep apnea and hypertension. Chest. 2006;129(6):1459-1467.
31. Comondore VR, Cheema R, Fox J, et al. Theimpact of CPAP on cardiovascular biomarkers inminimally symptomatic patients with obstructivesleep apnea. Lung. 2009;187(1):17-22.
32. Coughlin SR, Mawdsley L, Mugarza JA, et al.Cardiovascular and metabolic effects of CPAP inobese males with OSA. Eur Respir J. 2007;29(4):720-727.
33. Craig SE, Kohler M, Nicoll D, et al. Continuouspositive airway pressure improves sleepiness butnot calculated vascular risk in patients withminimally symptomatic obstructive sleep apnoea.Thorax. 2012;67(12):1090-1096.
34. Cross MD, Mills NL, Al-Abri M, et al. Continuouspositive airway pressure improves vascular functionin obstructive sleep apnoea/hypopnoea syndrome.Thorax. 2008;63(7):578-583.
35. de Oliveira AC, Martinez D, Massierer D, et al.The antihypertensive effect of positive airwaypressure on resistant hypertension of patients withobstructive sleep apnea. Am J Respir Crit Care Med.2014;190(3):345-347.
36. Drager LF, Bortolotto LA, Figueiredo AC, et al.Effects of continuous positive airway pressure onearly signs of atherosclerosis in obstructive sleepapnea. Am J Respir Crit Care Med. 2007;176(7):706-712.
37. Drager LF, Pedrosa RP, Diniz PM, et al. Theeffects of continuous positive airway pressure onprehypertension and masked hypertension in menwith severe obstructive sleep apnea. Hypertension.2011;57(3):549-555.
38. Durán-Cantolla J, Aizpuru F, Montserrat JM,et al. Continuous positive airway pressure astreatment for systemic hypertension in people withobstructive sleep apnoea. BMJ. 2010;341:c5991.
39. Egea CJ, Aizpuru F, Pinto JA, et al. Cardiacfunction after CPAP therapy in patients withchronic heart failure and sleep apnea. Sleep Med.2008;9(6):660-666.
40. Engleman HM, Gough K, Martin SE, et al.Ambulatory blood pressure on and off continuouspositive airway pressure therapy for the sleepapnea/hypopnea syndrome. Sleep. 1996;19(5):378-381.
41. Faccenda JF, Mackay TW, Boon NA, Douglas NJ.Randomized placebo-controlled trial of continuouspositive airway pressure on blood pressure in thesleep apnea-hypopnea syndrome. Am J Respir CritCare Med. 2001;163(2):344-348.
42. Gottlieb DJ, Punjabi NM, Mehra R, et al. CPAPversus oxygen in obstructive sleep apnea. N Engl JMed. 2014;370(24):2276-2285.
43. Hall AB, Ziadi MC, Leech JA, et al. Effects ofshort-term continuous positive airway pressure onmyocardial sympathetic nerve function andenergetics in patients with heart failure andobstructive sleep apnea. Circulation. 2014;130(11):892-901.
44. Hoyos CM, Killick R, Yee BJ, et al.Cardiometabolic changes after continuous positiveairway pressure for obstructive sleep apnoea. Thorax.2012;67(12):1081-1089.
45. Hoyos CM, Yee BJ, Wong KK, et al. Treatmentof sleep apnea with CPAP lowers central andperipheral blood pressure independent of thetime-of-day. Am J Hypertens. 2015;28(10):1222-1228.
46. Huang Z, Liu Z, Luo Q, et al. Long-term effectsof continuous positive airway pressure on bloodpressure and prognosis in hypertensive patientswith coronary heart disease and obstructive sleepapnea. Am J Hypertens. 2015;28(3):300-306.
47. Hui DS, To KW, Ko FW, et al. Nasal CPAPreduces systemic blood pressure in patients withobstructive sleep apnoea and mild sleepiness. Thorax.2006;61(12):1083-1090.
48. Ip MS, Tse HF, Lam B, et al. Endothelialfunction in obstructive sleep apnea and response totreatment. Am J Respir Crit Care Med. 2004;169(3):348-353.
49. Jones A, Vennelle M, Connell M, et al. Theeffect of continuous positive airway pressuretherapy on arterial stiffness and endothelialfunction in obstructive sleep apnea. Sleep Med.2013;14(12):1260-1265.
50. Kohler M, Stoewhas AC, Ayers L, et al. Effectsof continuous positive airway pressure therapywithdrawal in patients with obstructive sleepapnea. Am J Respir Crit Care Med. 2011;184(10):1192-1199.
51. Lam JC, Lam B, Yao TJ, et al. A randomisedcontrolled trial of nasal continuous positive airwaypressure on insulin sensitivity in obstructive sleepapnoea. Eur Respir J. 2010;35(1):138-145.
52. Litvin AY, Sukmarova ZN, Elfimova EM, et al.Effects of CPAP on “vascular” risk factors in patientswith obstructive sleep apnea and arterialhypertension. Vasc Health Risk Manag. 2013;9:229-235.
53. Lozano L, Tovar JL, Sampol G, et al. Continuouspositive airway pressure treatment in sleep apneapatients with resistant hypertension. J Hypertens.2010;28(10):2161-2168.
54. Martínez-García MA, Capote F,Campos-Rodríguez F, et al. Effect of CPAP on bloodpressure in patients with obstructive sleep apneaand resistant hypertension. JAMA. 2013;310(22):2407-2415.
55. McMillan A, Bratton DJ, Faria R, et al.Continuous positive airway pressure in older peoplewith obstructive sleep apnoea syndrome(PREDICT). Lancet Respir Med. 2014;2(10):804-812.
56. Monasterio C, Vidal S, Duran J, et al.Effectiveness of continuous positive airwaypressure in mild sleep apnea-hypopnea syndrome.Am J Respir Crit Care Med. 2001;164(6):939-943.
57. Muxfeldt ES, Margallo V, Costa LM, et al. Effectsof continuous positive airway pressure treatmenton clinic and ambulatory blood pressures inpatients with obstructive sleep apnea and resistanthypertension. Hypertension. 2015;65(4):736-742.
Copyright 2015 American Medical Association. All rights reserved.
59. Noda A, Nakata S, Koike Y, et al. Continuouspositive airway pressure improves daytimebaroreflex sensitivity and nitric oxide production inpatients with moderate to severe obstructive sleepapnea syndrome. Hypertens Res. 2007;30(8):669-676.
60. Norman D, Loredo JS, Nelesen RA, et al.Effects of continuous positive airway pressureversus supplemental oxygen on 24-hourambulatory blood pressure. Hypertension. 2006;47(5):840-845.
61. Pamidi S, Wroblewski K, Stepien M, et al.Eight hours of nightly continuous positive airwaypressure treatment of obstructive sleep apneaimproves glucose metabolism in patients withprediabetes. Am J Respir Crit Care Med. 2015;192(1):96-105.
62. Pedrosa RP, Drager LF, de Paula LK, et al.Effects of OSA treatment on BP in patients withresistant hypertension. Chest. 2013;144(5):1487-1494.
63. Pepperell JC, Ramdassingh-Dow S,Crosthwaite N, et al. Ambulatory blood pressureafter therapeutic and subtherapeutic nasalcontinuous positive airway pressure for obstructivesleep apnoea. Lancet. 2002;359(9302):204-210.
64. Robinson GV, Smith DM, Langford BA, et al.Continuous positive airway pressure does notreduce blood pressure in nonsleepy hypertensiveOSA patients. Eur Respir J. 2006;27(6):1229-1235.
65. Rossi VA, Winter B, Rahman NM, et al.The effects of Provent on moderate to severeobstructive sleep apnoea during continuouspositive airway pressure therapy withdrawal. Thorax.2013;68(9):854-859.
66. Ruttanaumpawan P, Gilman MP, Usui K, et al.Sustained effect of continuous positive airwaypressure on baroreflex sensitivity in congestiveheart failure patients with obstructive sleep apnea.J Hypertens. 2008;26(6):1163-1168.
67. Takaesu Y, Inoue Y, Komada Y, et al. Effects ofnasal continuous positive airway pressure on panicdisorder comorbid with obstructive sleep apneasyndrome. Sleep Med. 2012;13(2):156-160.
68. Weaver TE, Mancini C, Maislin G, et al.Continuous positive airway pressure treatment ofsleepy patients with milder obstructive sleepapnea. Am J Respir Crit Care Med. 2012;186(7):677-683.
69. Andrén A, Hedberg P, Walker-Engström ML,et al. Effects of treatment with oral appliance on24-h blood pressure in patients with obstructivesleep apnea and hypertension. Sleep Breath. 2013;17(2):705-712.
71. Quinnell TG, Bennett M, Jordan J, et al.A crossover randomised controlled trial of oral
mandibular advancement devices for obstructivesleep apnoea-hypopnoea (TOMADO). Thorax.2014;69(10):938-945.
72. Phillips CL, Grunstein RR, Darendeliler MA,et al. Health outcomes of continuous positiveairway pressure versus oral appliance treatment forobstructive sleep apnea. Am J Respir Crit Care Med.2013;187(8):879-887.
73. Dal-Fabbro C, Garbuio S, D’Almeida V, et al.Mandibular advancement device and CPAP uponcardiovascular parameters in OSA. Sleep Breath.2014;18(4):749-759.
74. Thompson SG, Higgins JP. How shouldmeta-regression analyses be undertaken andinterpreted? Stat Med. 2002;21(11):1559-1573.
75. Bratton DJ, Stradling JR, Barbé F, Kohler M.Effect of CPAP on blood pressure in patients withminimally symptomatic obstructive sleep apnoea.Thorax. 2014;69(12):1128-1135.
76. Chirinos JA, Gurubhagavatula I, Teff K, et al.CPAP, weight loss, or both for obstructive sleepapnea. N Engl J Med. 2014;370(24):2265-2275.
77. Elbourne DR, Altman DG, Higgins JP, et al.Meta-analyses involving cross-over trials. Int JEpidemiol. 2002;31(1):140-149.
Treatment for Obstructive Sleep Apnea Original Investigation Research
jama.com (Reprinted) JAMA December 1, 2015 Volume 314, Number 21 2293
Copyright 2015 American Medical Association. All rights reserved.
Downloaded From: http://jama.jamanetwork.com/ by a UZH Hauptbibliothek / Zentralbibliothek Zuerich User on 12/02/2015