51 FLARE SAFETY ZONE NO FLARE SAFETY ZONE PENN STATE STUDY QUANTITATIVELY DEMONSTRATES FLARES DRAMATICALLY INCREASE THE SAFETY ZONE Flares Cause 16% Reduction in Speed Flares Cause 85% Increased Lateral Separation • Earlier perception of emergency ahead • Increased braking distance • Dramatic expansion in depth of safety zone • Gets passing traffic farther from emergency scene Flares Cause 89% Right Lane Volume Reduction • Creates better visibility around emergency scene • Dramatic lateral expansion of safety zone • Safety response in passing traffic improves as more flares are deployed • Use of road flares with police cruiser light bar activated maximizes safety zone • Increasing the safety zone will save lives...maybe yours! For a copy of the complete study visit our website at www.orionsignals.com or call 1-800-637-7807 SAFETY BULLETIN ®
Transcript
51
FLARE SAFETY ZONE NO FLARE SAFETY ZONE
PENN STATE STUDY QUANTITATIVELY DEMONSTRATES FLARES DRAMATICALLY INCREASE THE SAFETY ZONE
Flares Cause 16% Reduction in Speed
Flares Cause 85% IncreasedLateral Separation• Earlier perception of
emergency ahead• Increased braking
distance• Dramatic expansion in
depth of safety zone
• Gets passing traffic farther from emergency scene
Flares Cause 89% Right LaneVolume Reduction
• Creates better visibility around emergency scene
• Dramatic lateral expansion of safety zone
• Safety response in passing traffic improves as more flares are deployed
• Use of road flares with police cruiser light bar activated maximizes safety zone
• Increasing the safety zone will save lives...maybe yours!
For a copy of the complete study visit our website at www.orionsignals.com or call 1-800-637-7807
SAFETY BULLETIN®
STUDY REGARDING EMERGENCY ROAD FLARE EFFECTIVENESS IN ENHANCING THE “SAFETY ZONE”
Prepared for Orion Safety Products FINAL REPORT
May 3, 2005
By M. de la Riva, P. M. Garvey, M. T. Pietrucha, R. Ghebrial and C. Ramaswamy
PENNSTATE
Pennsylvania Transportation Institute The Pennsylvania State University Transportation Research Building University Park, PA 16802-4710 (814) 865-1891 www.pti.psu.edu
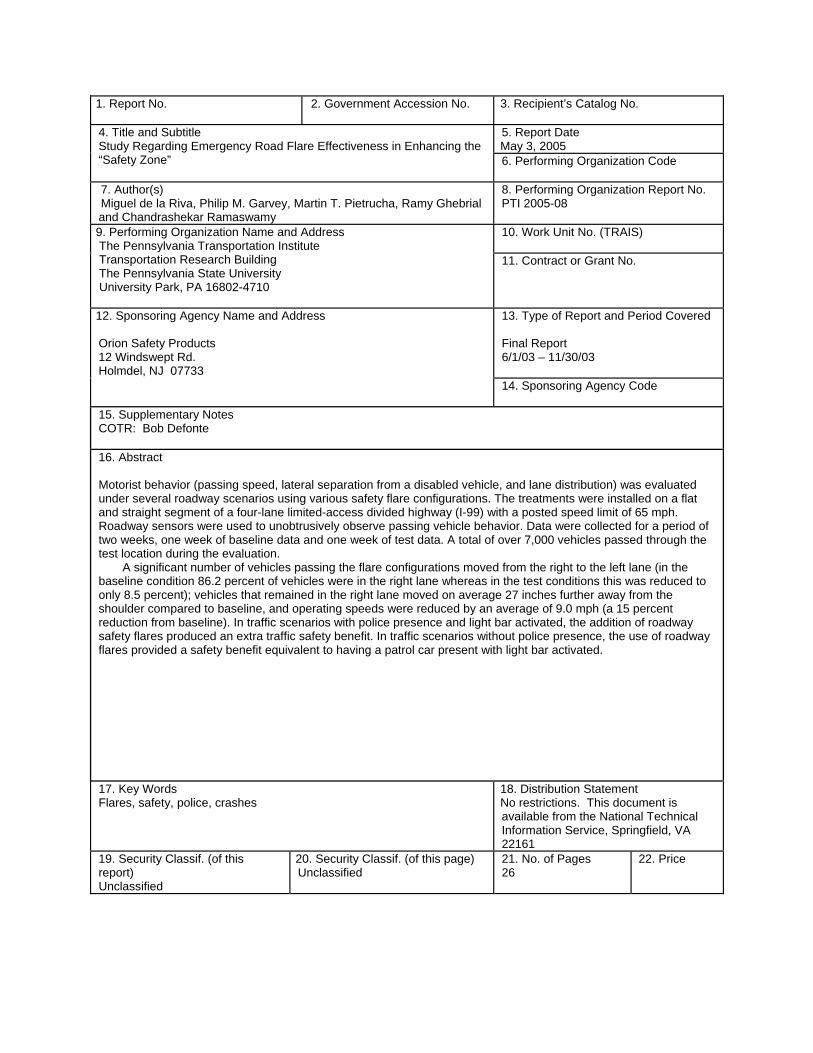
1. Report No.
2. Government Accession No. 3. Recipient’s Catalog No. 5. Report Date May 3, 2005
4. Title and Subtitle Study Regarding Emergency Road Flare Effectiveness in Enhancing the “Safety Zone” 6. Performing Organization Code
7. Author(s) Miguel de la Riva, Philip M. Garvey, Martin T. Pietrucha, Ramy Ghebrial and Chandrashekar Ramaswamy
8. Performing Organization Report No. PTI 2005-08 10. Work Unit No. (TRAIS)
9. Performing Organization Name and Address The Pennsylvania Transportation Institute Transportation Research Building The Pennsylvania State University University Park, PA 16802-4710
11. Contract or Grant No.
13. Type of Report and Period Covered Final Report 6/1/03 – 11/30/03
12. Sponsoring Agency Name and Address Orion Safety Products 12 Windswept Rd. Holmdel, NJ 07733 14. Sponsoring Agency Code
15. Supplementary Notes COTR: Bob Defonte 16. Abstract Motorist behavior (passing speed, lateral separation from a disabled vehicle, and lane distribution) was evaluated under several roadway scenarios using various safety flare configurations. The treatments were installed on a flat and straight segment of a four-lane limited-access divided highway (I-99) with a posted speed limit of 65 mph. Roadway sensors were used to unobtrusively observe passing vehicle behavior. Data were collected for a period of two weeks, one week of baseline data and one week of test data. A total of over 7,000 vehicles passed through the test location during the evaluation.
A significant number of vehicles passing the flare configurations moved from the right to the left lane (in the baseline condition 86.2 percent of vehicles were in the right lane whereas in the test conditions this was reduced to only 8.5 percent); vehicles that remained in the right lane moved on average 27 inches further away from the shoulder compared to baseline, and operating speeds were reduced by an average of 9.0 mph (a 15 percent reduction from baseline). In traffic scenarios with police presence and light bar activated, the addition of roadway safety flares produced an extra traffic safety benefit. In traffic scenarios without police presence, the use of roadway flares provided a safety benefit equivalent to having a patrol car present with light bar activated. 17. Key Words Flares, safety, police, crashes
18. Distribution Statement No restrictions. This document is available from the National Technical Information Service, Springfield, VA 22161
19. Security Classif. (of this report) Unclassified
20. Security Classif. (of this page) Unclassified
21. No. of Pages 26
22. Price
STUDY REGARDING EMERGENCY ROAD FLARE EFFECTIVENESS IN ENHANCING THE “SAFETY ZONE”
FINAL REPORT
Prepared for Orion Safety Products
By
Miguel de la Riva Philip M. Garvey
Martin T. Pietrucha Ramy Ghebrial
and Chandrashekar Ramaswamy
The Pennsylvania Transportation Institute The Pennsylvania State University Transportation Research Building University Park, PA 16802-4710 May 3, 2005
PTI 2005-08
TABLE OF CONTENTS
Page
I. INTRODUCTION.........................................................................................................1 A. Study Sponsor and Penn State ...........................................................................1 B. General Premise and Terminology.....................................................................1 C. Specific Objective ..............................................................................................2 D. Test Configuration .............................................................................................2
1. Baseline...................................................................................................2 2. Police Car Present, No Flares .................................................................2 3. Police Car Present With Flares ...............................................................2 4. Disabled Vehicle, No Police Car, With Flares .......................................3
E. Hypotheses .........................................................................................................3 II. DATA COLLECTION................................................................................................4
A. Scope and Overview ..........................................................................................4 B. Site Selection......................................................................................................4 C. Equipment ..........................................................................................................6 D. Duration and Time .............................................................................................9 E. Data Reduction .................................................................................................10 F. Passing Vehicle Classification and Lane of Travel ..........................................10
III. FINDINGS AND RESULTS ...................................................................................10
A. Traffic Volumes ...............................................................................................10 B. Sample Size ......................................................................................................10 C. Baseline Results ...............................................................................................11
1. Speed.....................................................................................................11 2. Lane Changing ......................................................................................12 3. Lateral Separation .................................................................................13
D. Police Car Present with Flares Deployed.........................................................14 1. Speed.....................................................................................................14
a. Comparison to Baseline ............................................................14 b. Comparison to Police Car Present, No Flares...........................15
2. Lane Changing ......................................................................................15 a. Comparison to Baseline ............................................................15 b. Comparison to Police Car Present, No Flares...........................15
3. Lateral Separation .................................................................................16 a. Comparison to Baseline ............................................................16 b. Comparison to Police Car Present, No Flares...........................16
E. Disabled Vehicle, No Police Car Present, With Flares Deployed....................17 1. Speed.....................................................................................................17
a. Comparison to Baseline ............................................................17 b. Comparison to Police Car Present, No Flares...........................17
2. Lane Changing ......................................................................................18 a. Comparison to Baseline ............................................................18
b. Comparison to Police Car Present, No Flares...........................18 3. Lateral Separation .................................................................................19
a. Comparison to Baseline ............................................................19 b. Comparison to Police Car Present, No Flares...........................19
F. Police Car With Flares Impact - on Passing Trucks .........................................20 1. Speed.....................................................................................................20
a. Comparison to Baseline ............................................................20 b. Comparison to Police Car Present, No Flares...........................20
2. Lane Changing ......................................................................................21 a. Comparison to Baseline ............................................................21 b. Comparison to Police Car Present, No Flares...........................21
G. Effect of Flare Burning Time on Passing Vehicle Speed ................................22 IV. CONCLUSIONS & SUMMARY RESULTS.........................................................23 Hypothesis #1 – Conclusion ..............................................................................................23 Hypothesis #2 – Conclusion ..............................................................................................23 Hypothesis #3 – Conclusion ..............................................................................................23 Hypothesis #4 – Conclusion ..............................................................................................24 Hypothesis #5 – Conclusion ..............................................................................................24
1
I. INTRODUCTION
A. Study Sponsor and Penn State
Orion Safety Products, the worldwide leader in manufacturing and distributing emergency
road flares for use by police, fire and other safety professionals, commissioned this study. As
the emergency flare “expert,” Orion sought to gather quantitative data to assist roadside
safety professionals and other first responders in determining how to enhance safety in
inherently dangerous situations. Penn State was selected as the independent third-party entity
to perform the project based upon its proven research expertise in highway signage, traffic
flow analysis and highway administration. In 2005, Penn State ranked first nationally in
Fulbright Scholarships, 11th in total research and development expenditures, and third in
industry-sponsored research. The Pennsylvania Transportation Institute (PTI) is an
interdisciplinary research unit at Penn State’s College of Engineering with focus on
transportation operations; transportation infrastructure; and vehicle systems and safety.
Founded in 1968, PTI has grown from a small research facility to one of the nation’s leading
university transportation centers with annual research expenditures of $12 million and active
projects valued at over $35 million. A major research and testing facility of the University is
the PTI Test Track Facility. The 5,042-foot-long, oval-shaped track provides the needed
place for a wide range of transportation-related research. This closed-loop test track was used
extensively to safely develop and test the field data collection equipment and protocols used
in the present study.
B. General Premise and Terminology
Every day, police and other first responders put themselves at risk along the U.S. roadways as
part of their job. Whether conducting a routine traffic stop, attending to an accident scene or
assisting a disabled motorist (collectively, an “emergency event”), police officers place
themselves in close proximity to a high volume of traffic traveling at high rates of speed. To
lessen the human and property risk involved in these emergency events, roadside safety
professionals typically employ emergency road flares and high-intensity light bars to (1)
lower the speed of passing traffic, (2) reduce the volume of traffic driving in the right lane
(the travel lane), and (3) increase the distance between the passing traffic and the emergency
event giving rise to the presence of police and other safety professionals (lateral separation).
A reduction in speed and traffic volume in the travel lane and an increase in lateral separation
2
create time and space for passing traffic to safely maneuver by the emergency event,
effectively creating a “safety zone” surrounding the emergency event.
C. Specific Objective
This study was designed to generate raw data from actual roadway conditions, which would
assist roadside safety professionals and first responders in determining how to enhance safety
during emergency events by quantifying passing motorist behaviors in reaction to signals
customarily deployed, specifically emergency road flares and police car presence with
activated light bar.
D. Test Configuration
Four primary roadway scenarios are discussed in this study:
1. “Baseline”: no disabled car, no police car present, no flares deployed.
2. “Police Car Present, No Flares”: disabled car parked on the right edge of the right
shoulder of the road, with a police car parked behind it with light bar activated, no flares
deployed.
3. “Police Car Present With Flares”: disabled car parked on the right edge of the right
shoulder of the road, with a police car parked behind it with light bar activated and flares
deployed. Flares used in this study were Orion non-waxed, 30-minute flares with wire
stand attached. Flare deployment was varied within the test protocol as follows:
a.) Three flares at 5 paces (nominally 15 feet) apart, placed upstream of the police car
from the roadway edgeline to the shoulder edgeline on a diagonal. The closest unit
to the police car was located on the roadway edgeline, the middle unit located in
the center of the shoulder, and the furthest unit located on the shoulder edgeline.
b.) Three flares at 10 paces (nominally 30 feet) apart, placed upstream of the police car
from the roadway edgeline to the shoulder edgeline on a diagonal. The closest unit
to the police car was located on the roadway edgeline, the middle unit located in
the center of the shoulder, and the furthest unit located on the shoulder edgeline.
c.) Six flares at 5 paces (nominally 15 feet) apart, placed upstream of the police car
from the roadway edgeline to the shoulder edgeline on a diagonal. The closest unit
to the police car was located on the roadway edgeline; the second, third, fourth, and
fifth units located 24, 48, 72, and 96 inches, respectively, from the edgeline; and
the furthest unit located on the shoulder edgeline.
3
d.) Six flares at 10 paces (nominally 30 feet) apart, placed upstream of the police car
from the roadway edgeline to the shoulder edgeline on a diagonal. The closest unit
to the police car was located on the roadway edgeline; the second, third, fourth, and
fifth units located 24, 48, 72, and 96 inches, respectively, from the edgeline; and
the furthest unit located on the shoulder edgeline.
4. “Disabled Vehicle, No Police Car, With Flares”: disabled car parked on the right edge
of the right shoulder of the road, with flares deployed. Flare deployment was varied
within the test protocol in the same manner as described in Section I.D.3 immediately
above.
E. Hypotheses
1. The combined effect of police presence with activated light bar and deployment of
emergency road flares will generate the greatest impact on the behavior of passing
motorists, creating a significantly larger safety zone than police presence with activated
light bar and no emergency road flares.
2. Deploying more flares will have a greater impact on the behavior of passing motorists
than configurations with fewer flares – use of more flares enlarges and enhances the
safety zone.
3. Deployment configurations with flares spaced more closely together (5 paces apart) will
have a greater impact on the behavior of passing motorists than flares spaced farther apart
(10 paces apart).
4. The combined effect of police presence with activated light bar and deployment of
emergency road flares will generate the greatest impact on the behavior of passing trucks,
creating a significantly larger safety zone than police presence with activated light bar
and no emergency road flares.
5. The deployment of emergency road flares, even in the absence of a police presence with
activated light bar, will have a dramatic safety impact on the behavior of passing
motorists by enlarging the safety zone around the emergency event.
4
II. DATA COLLECTION
A. Scope and Overview
1. The research employed naturalistic observation techniques. The behavior of passing
vehicles was unobtrusively observed through the use of roadway sensors. The sensors
counted the number and type of vehicles passing the study area and measured passing
vehicle speed, lane distribution and lateral separation from the roadway edge.
2. A flat and straight segment of a four-lane, limited-access divided highway with a posted
speed limit of 65 mph was selected for this study. Data collection was restricted to clear
weather and dry pavement conditions during nighttime hours.
3. The flares used in the testing were Orion non-waxed, 30-minute flares with wire stands.
This is the most popular flare size and type used by emergency responders in the United
States.
B. Site Selection
The impact of road geometry and the general road environment were controlled by careful
and methodical site selection. The following general criteria were considered for the
selection of the test site:
1. Traffic volumes large enough to obtain adequate sample sizes,
2. No traffic control devices that could limit the free flow of vehicles,
3. Exit and entrance ramps located no closer than one mile from the test site to
avoid accelerating and decelerating vehicles,
4. No artificial illumination of the highway segment,
5. Sufficiently flat grades through the test site to diminish an influence on speed,
6. A long enough tangent section to ensure that measurements were not influenced by
horizontal curvature, and
7. Use of the roadway by both trucks and cars.
5
Based on these criteria, a test site located on northbound I-99, approximately 1,500 feet north
of milepost 43 (between the Bellwood [Exit 41] and Tipton [Exit 45] interchanges) in Antis
Township, Blair County, Pennsylvania, was selected (Figure 1).
Figure 1. Test site location.
I-99 is classified as a principal arterial and is a divided, two-way, four-lane, concrete-paved,
limited-access highway with a posted speed limit of 65 mph. The I-99 section was selected
as being typical of the rural and suburban roadways on which many collisions with parked or
disabled motor vehicles occur. The 2002 average daily traffic volume (ADT) on this
northbound section of I-99 was 5,988 vehicles, of which 19 percent was trucks (PennDOT
District 9-0, [2003]). The road segment has two 12-foot-wide lanes in each direction, with
10-foot-wide shoulders of Portland cement concrete. An intermittent rumble strip pattern
with 6-foot-long corrugations every 60 feet is ground into the shoulder. A 30-foot depressed
grass median separates the vehicles traveling in opposite directions. The test site was located
on a straight and level segment of the highway (grades of no more than 2 percent).
Northbound motorists approaching the test site came out of a right-hand curve and had
approximately 3,500 feet of straight travel before passing the test site. Motorists approached
the site on a constant -1.69 percent downgrade.
6
C. Equipment
The passing vehicle data were collected by an automated data collection system developed by
the Pennsylvania Transportation Institute. The major components of the system included:
1. Automatic Traffic Recorders (ATRs) that stored accurate time-stamps (1/10,000 second)
each time a vehicular axle passed over the sensors.
2. A communication system used to download data from the ATRs to a computer.
3. Pneumatic tubes that transmitted an air pulse when vehicle presence was detected.
4. Two automatic computer programs that transformed the raw data into a useful format for
data analysis.
To determine vehicle counts and speed, two pairs of pneumatics tubes were laid 80 and 25
feet apart parallel to one another and across the travel and passing lanes, respectively (Figure
2). In addition, two parallel, diagonally placed pneumatic tubes laid at a 45° angle were used
to detect lateral placement within the travel lane. Lane straddling was automatically detected
by inspection of the time-stamp pattern obtained for vehicles in the travel lane. That is, if a
vehicle was detected by the speed sensors but not by the diagonal sensors, then the vehicle
was straddling.
7
Figure 2. Roadway sensor layout.
The Traxpro software available from JAMAR Technologies, Inc. was used to download the
raw data from the ATRs. TraxproPSU (a data export utility specifically developed for this
project) was run to export the raw data to an easy-to-read format; from there results the
measures of effectiveness were obtained using a set of programmed Microsoft® Excel
worksheets developed for this purpose (Figure 3).
Field trials conducted at the PTI Test Track Facility indicated that lateral placement
measurements were accurate to within ± ? ft. Pneumatic tubes are black, easily deformable,
and have a very low profile (the Mini and Half-Round [D] tubes used had an internal
diameter of 3/16 inch and ¼ inch, respectively). These characteristics, in combination with the
high traveling speed at the test site, made the pneumatic tubes basically imperceptible to
passing motorists.
6 ( 162 5%
6 ( 162 5&
%ORFNHU
8
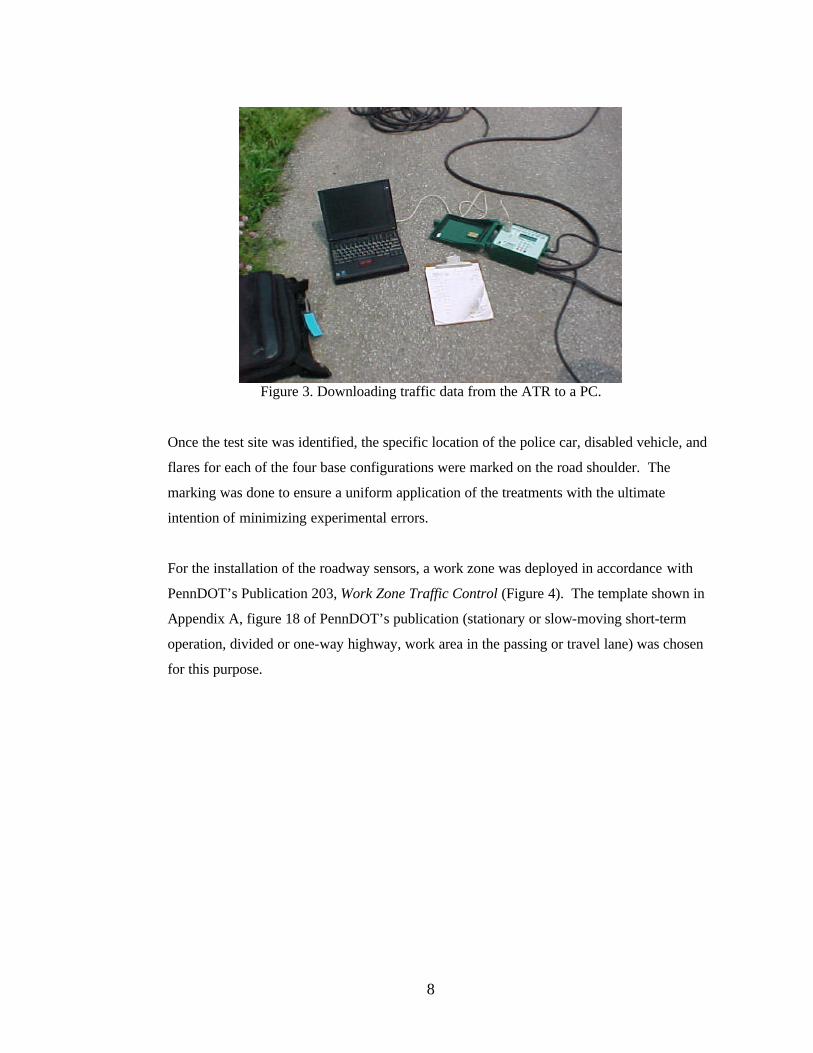
Figure 3. Downloading traffic data from the ATR to a PC.
Once the test site was identified, the specific location of the police car, disabled vehicle, and
flares for each of the four base configurations were marked on the road shoulder. The
marking was done to ensure a uniform application of the treatments with the ultimate
intention of minimizing experimental errors.
For the installation of the roadway sensors, a work zone was deployed in accordance with
PennDOT’s Publication 203, Work Zone Traffic Control (Figure 4). The template shown in
Appendix A, figure 18 of PennDOT’s publication (stationary or slow-moving short-term
operation, divided or one-way highway, work area in the passing or travel lane) was chosen
for this purpose.
9
Figure 4. Work zone deployment and installation of roadway sensors.
D. Duration and Time
1. Data were collected beginning at the start of flare activation and lasting about 30 minutes.
When the flares were extinguished, approximately two to four minutes was taken to
deploy a new test treatment and remove the previous one. Flare duration was monitored
and the roadway sensor data were time-linked to flare activation.
2. Each treatment was tested on consecutive weekdays from Monday through Thursday
during the evening, resulting in four replications per treatment. These days were chosen
because traveling conditions fluctuate less then than on Monday mornings, Fridays, and
weekends.
3. With the exception of Tuesday 10/21/03, weather conditions were clear when testing was
conducted; the roadway was dry and there was no snow or ice buildup along the shoulder
area. Testing commenced after full darkness, about 8 p.m., and concluded at
approximately 1 a.m. Data collection started on October 20 and ended on October 30.
Enforcement and accident scenarios were tested during the first week, and baseline data
were collected during the second week.
10
E. Data Reduction
To ensure uniform and comparable test conditions, all data collected passed through a
rigorous screening process. The test specifications and procedure dictated what data were to
be kept and what removed. Any non-ordinary event occurring on the test nights that was
believed to affect passing vehicle response to the treatments (e.g., pedestrian presence near
the test vehicle or emergency vehicles passing through the test site) was recorded in a time
log form designed for that specific purpose. Later, when the data were being processed, all
vehicles passing the test site during the time period in which the event occurred were
removed from the database.
F. Passing Vehicle Classification and Lane of Travel
To test the relative treatment effects on passenger cars and trucks, the data collected were
differentiated by type of vehicle using a straightforward binary classification system: cars
(i.e., any motorized vehicle with four wheels and only two axles), and trucks (i.e., any
motorized vehicle with three or more axles). Data were collected for vehicles in the travel
(right) and passing (left) lanes.
III. FINDINGS AND RESULTS
A. Traffic Volumes
On average, every night approximately 1,100 vehicles passed through the study area in a time
period of four to five hours, from approximately 8 p.m. to 1 a.m. Approximately 20-25
percent of the daily passing traffic consisted of trucks.
B. Sample Size
Vehicle sample sizes by treatment are presented in Table 1. The sample sizes are listed in
four groups, the total number of vehicles observed for spot-speed, lane changing, lateral
separation and lane straddling.
11
Table 1. Sample size (number of vehicles).
Measures of Effectiveness
Speed Lane Changing Lateral Separation [LS] and Lane Straddling [LSD]
Refer to Section I.D.1. above for a definition of “Baseline.”
1. Speed
The overall average speed (i.e., average speed for left and right lanes combined) was 69.2
mph. The highest and lowest speeds recorded (99.1 mph and 33.7 mph, respectively)
corresponded to cars traveling in the left and right lane. While the average speed of all
vehicles was 69.2 mph, over 85% of the vehicles were traveling in excess of 73 mph.
12
As expected, vehicles in the passing lane were moving faster (71.0 mph) than vehicles in
the traveling lane (68.9 mph). The 85th percentile speed was 76.8 mph in the left lane and
73.6 mph in the right lane. On average, cars were moving faster (69.6 mph) than trucks
(67.4 mph). When speed is categorized by lane and type of vehicle, cars in the passing
and traveling lane moved faster (71.3 and 69.4 mph, respectively) than trucks (69.1 and
67.3).
2. Lane Changing
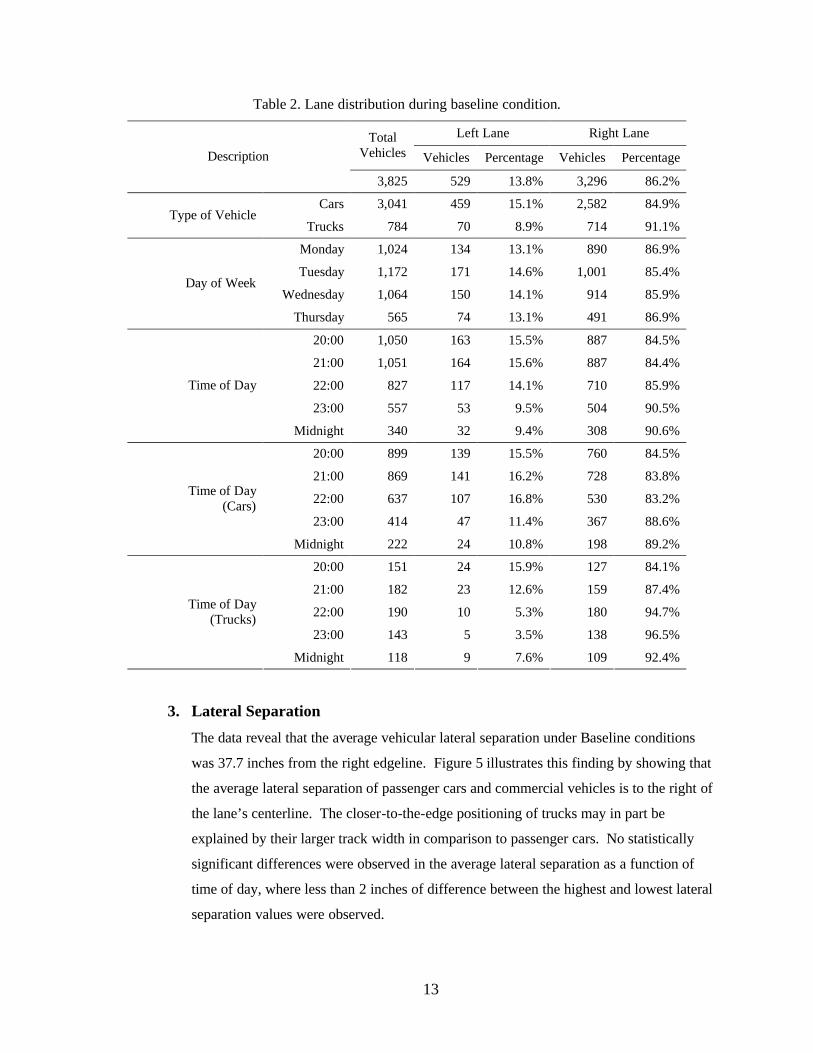
Table 2 shows that under the Baseline condition the vast majority of vehicles (3,296 of
3,825) traveled in the right lane (86.2 percent versus 13.8 percent in the left lane). When
the type of vehicle is taken into account, a higher proportion of trucks traveled in the
right lane compared to cars (91.1 and 84.9 percent, respectively). Moreover, when data
are grouped by day of week, a virtually steady daily lane distribution pattern is observed
from Monday through Thursday. As the night hours passed and traffic volumes
decreased, vehicles increasingly shifted to the right lane (84.5 percent at 8 p.m. versus
90.6 percent at midnight). In addition, if the same hourly data are tabulated by type of
vehicle, it can be seen that the above-mentioned hourly shift is somewhat more noticeable
for trucks (from 84.1 percent at 8 p.m., to 92.4 percent at midnight) than for cars (84.5 to
89.2 percent).
13
Table 2. Lane distribution during baseline condition.
Left Lane Right Lane Total Vehicles Vehicles Percentage Vehicles Percentage Description
3,825 529 13.8% 3,296 86.2%
Cars 3,041 459 15.1% 2,582 84.9% Type of Vehicle
Trucks 784 70 8.9% 714 91.1%
Monday 1,024 134 13.1% 890 86.9%
Tuesday 1,172 171 14.6% 1,001 85.4%
Wednesday 1,064 150 14.1% 914 85.9% Day of Week
Thursday 565 74 13.1% 491 86.9%
20:00 1,050 163 15.5% 887 84.5%
21:00 1,051 164 15.6% 887 84.4%
22:00 827 117 14.1% 710 85.9%
23:00 557 53 9.5% 504 90.5%
Time of Day
Midnight 340 32 9.4% 308 90.6%
20:00 899 139 15.5% 760 84.5%
21:00 869 141 16.2% 728 83.8%
22:00 637 107 16.8% 530 83.2%
23:00 414 47 11.4% 367 88.6%
Time of Day (Cars)
Midnight 222 24 10.8% 198 89.2%
20:00 151 24 15.9% 127 84.1%
21:00 182 23 12.6% 159 87.4%
22:00 190 10 5.3% 180 94.7%
23:00 143 5 3.5% 138 96.5%
Time of Day (Trucks)
Midnight 118 9 7.6% 109 92.4%
3. Lateral Separation
The data reveal that the average vehicular lateral separation under Baseline conditions
was 37.7 inches from the right edgeline. Figure 5 illustrates this finding by showing that
the average lateral separation of passenger cars and commercial vehicles is to the right of
the lane’s centerline. The closer-to-the-edge positioning of trucks may in part be
explained by their larger track width in comparison to passenger cars. No statistically
significant differences were observed in the average lateral separation as a function of
time of day, where less than 2 inches of difference between the highest and lowest lateral
separation values were observed.
14
Figure 5. Lateral separation from the right edgeline by vehicle type during baseline condition.
D. Police Car Present With Flares Deployed
Refer to Section I.D.3 above for a definition of “Police Car Present With Flares.”
1. Speed
a. Comparison to Baseline: The deployment of flares with a police car present with
activated light bar decreased the speed of passing vehicles by a minimum of 9.6 mph (to
59.6 mph) or a 13.9% reduction compared to the Baseline (see Table 3). The greatest
reduction in speed, 11.2 mph (to 58 mph) or a 16.2% reduction compared to the Baseline,
was recorded when six 30-minute flares where deployed at a spacing of 5 paces. When
considering that the speed of 85% of the vehicles tested at the Baseline was in excess of
73 mph, the Police Car Present With Flares scenario resulted in a speed reduction of more
than 15 mph, or a 20% improvement.
15
b. Comparison to Police Car Present, No Flares: The Police Car Present, No Flares
scenario resulted in a speed reduction of 8.1 mph or an 11.7% reduction compared to the
Baseline. The addition of six 30-minute flares to a Police Car Present, No Flares scenario
further reduced the speed of passing cars by an additional 3.1 mph or an additional 5.1%,
representing a 16% speed reduction from Baseline. The deployment of flares (3 or 6)
was more effective than Police Car Present, No Flares in reducing the speed of passing
vehicles (9.6 mph versus 8.1 mph) during an emergency event.
Table 3. Effect of flares and police car on travel speed.
Traffic Scenario Total Vehicles
Average (Mph)
Standard Deviation*
Difference in Average Speed from Baseline
(mph)
Baseline 3,825 69.2 5.6
Police Car Present, No Flares 293 61.1 6.3 -8.1
3 flares at 5 paces 448 59.4 6.8 -9.8
3 flares at 10 paces 470 59.6 6.0 -9.6
6 flares at 5 paces 558 58.0 6.3 -11.2
Polic
e C
ar P
rese
nt W
ith
Flar
es
6 flares at 10 paces 457 58.8 6.0 -10.4
*The scatter or spread of data to either side of the average result; the higher the standard deviation, the greater the spread and the less likely any given observation will be close to the average result.
2. Lane Changing
a. Comparison to Baseline: The deployment of flares with a police car present with
activated light bar caused a massive shift of vehicles into the left (passing) lane (Table 4).
While there were differing results depending upon the number and spacing of flares deployed,
at a minimum the number of vehicles traveling in the right (driving) lane was reduced by
79.6% compared to Baseline. The greatest reduction in right-lane volume, 81.9%, was
recorded when six 30-minute flares were deployed at 5 paces.
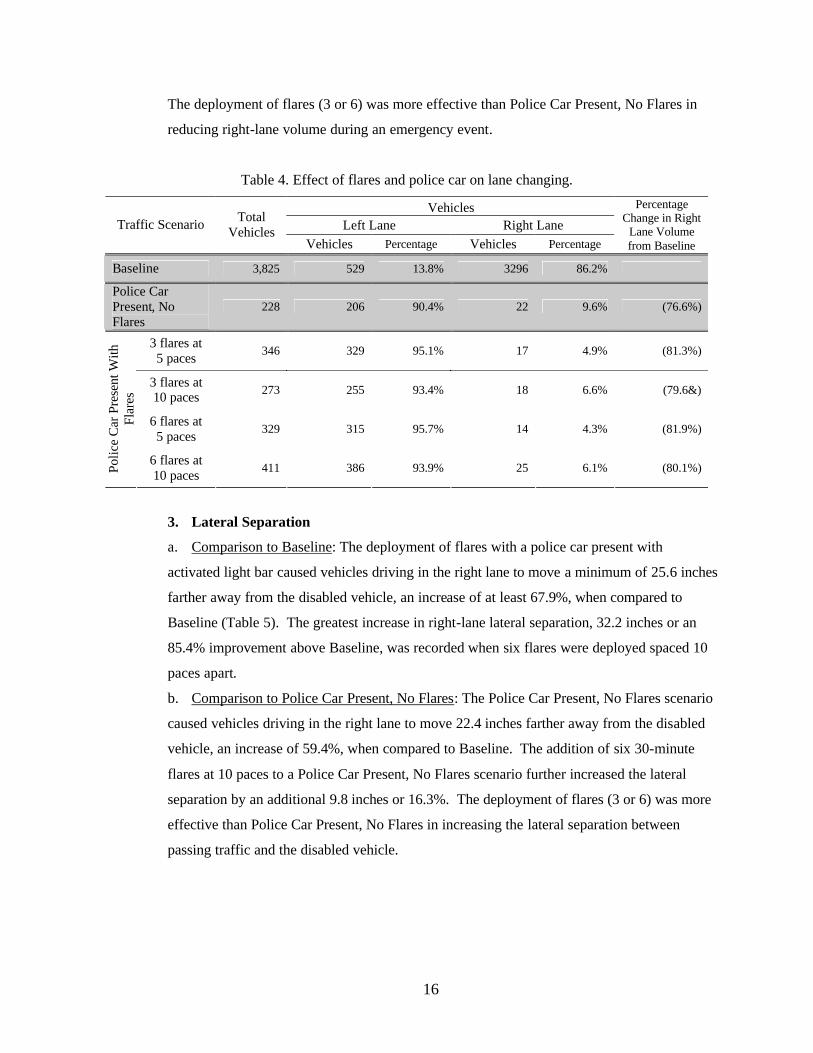
b. Comparison to Police Car Present, No Flares: The Police Car Present, No Flares scenario
reduced the number of vehicles driving in the right lane by 76.6% compared to Baseline. The
addition of six 30-minute flares to a Police Car Present, No Flares scenario further reduced
the number of vehicles driving in the right lane by an additional 5.3% (95.7% changed lanes).
16
The deployment of flares (3 or 6) was more effective than Police Car Present, No Flares in
reducing right-lane volume during an emergency event.
Table 4. Effect of flares and police car on lane changing.
Vehicles Left Lane Right Lane Traffic Scenario Total
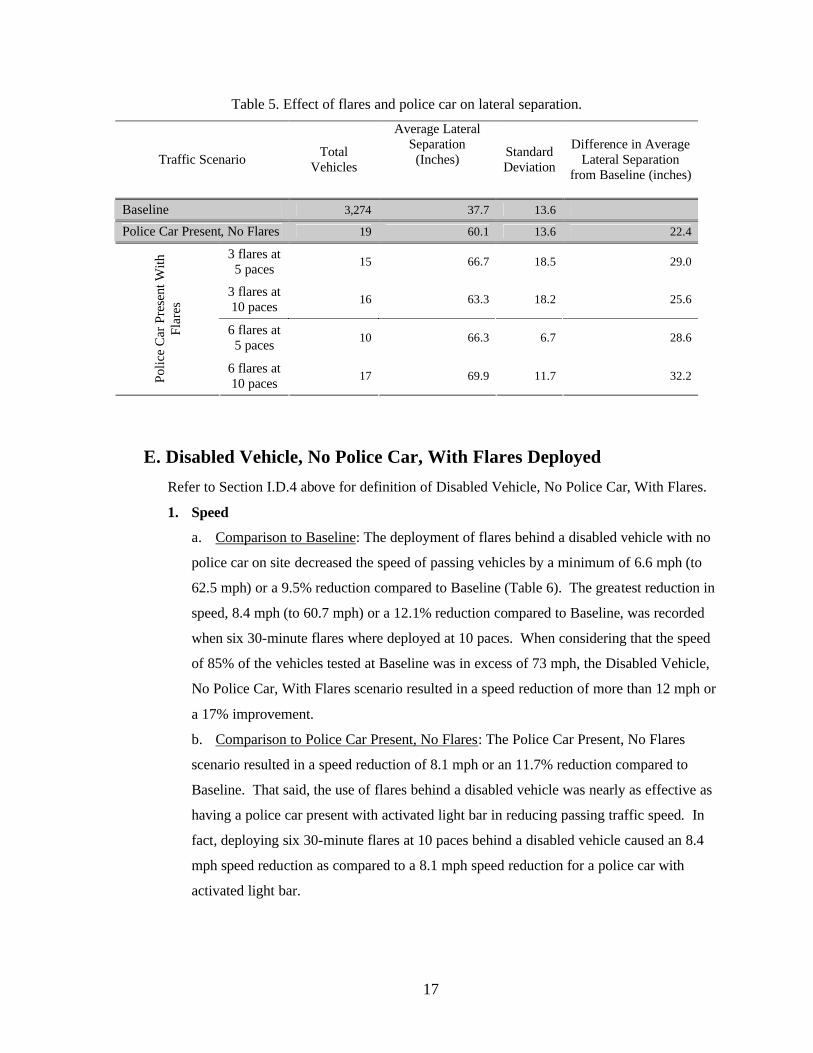
a. Comparison to Baseline: The deployment of flares behind a disabled vehicle with no
police car on site caused vehicles driving in the right lane to move a minimum of 25.0
inches further away from the disabled vehicle, an increase of 66.3% when compared to
Baseline (Table 8). While flare deployment again enhanced the safety zone relative to
lateral separation, the fact that nearly all vehicles moved to the left lane when either flares
or a police car with activated light bar was evident rendered the data statistically
insignificant.
b. Comparison to Police Car Present, No Flares: The Police Car Present, No Flares
scenario caused vehicles driving in the right lane to move 22.4 inches farther away from
the disabled vehicle, an increase of 59.4% when compared to Baseline. That said, the use
of flares behind a disabled vehicle was more effective than having a police car present
with activated light bar in increasing the lateral separation between passing traffic in the
right lane and the disabled vehicle.
20
Table 8. Effect of flares alone on lateral separation.
Traffic Scenario Total Vehicles
Average Lateral Separation (Inches)
Standard Deviation
Difference in Average Lateral Separation
from Baseline (inches)
Baseline 3,274 37.7 13.6
Police Car Present, No Flares 19 60.1 13.6 22.4
3 flares at 5 paces 4 74.5 6.7 36.8
3 flares at 10 paces 20 66.1 15.8 28.4
6 flares at 5 paces 25 64.1 15.3 26.4
Dis
able
d V
ehic
le, N
o Po
lice
Car
, With
Fla
res
6 flares at 10 paces 30 62.7 20.5 25.0
E. Police Car Present With Flares - Impact on Passing Trucks
Refer to Section I.D.3 above for definition of Police Car Present With Flares.
1. Speed a. Comparison to Baseline: The deployment of flares with a police car present with
activated light bar decreased the speed of passing trucks a minimum of 6.0 mph (to 61.4
mph) or a 9% reduction compared to Baseline (Table 9). The greatest reductions in speed,
7.2 mph (to 60.2 mph) or a 10.7% reduction compared to Baseline, were recorded when
six 30-minute flares where deployed at 5 paces. b. Comparison to Police Car Present, No Flares: The Police Car Present, No Flares
scenario resulted in a speed reduction for trucks of 4.7 mph or a 6.9% reduction
compared to Baseline. The addition of six 30-minute flares to a police car presence
reduced the speed of passing trucks by an additional 2.5 mph or 4.1%. The deployment
of flares (3 or 6) was more effective than Police Car Present, No Flares scenarios in
reducing the speed of passing trucks during an emergency event.
21
Table 9. Effect of flares and police car on passing truck speed.
Vehicle Type Traffic Scenario
Total Vehicles
Average Speed (mph)
Standard Deviation
Difference in Speed from
Baseline (mph)
Baseline 784 67.4 4.1 No Flares 60 62.8 5.0 -4.7
3 flares at 5 paces 86 61.4 6.6 -6.0
3 flares at 10 paces 103 61.3 4.2 -6.1
6 flares at 5 paces 109 60.2 5.2 -7.2
Trucks With Police Car
Present
6 flares at 10 paces 82 60.5 4.0 -6.9
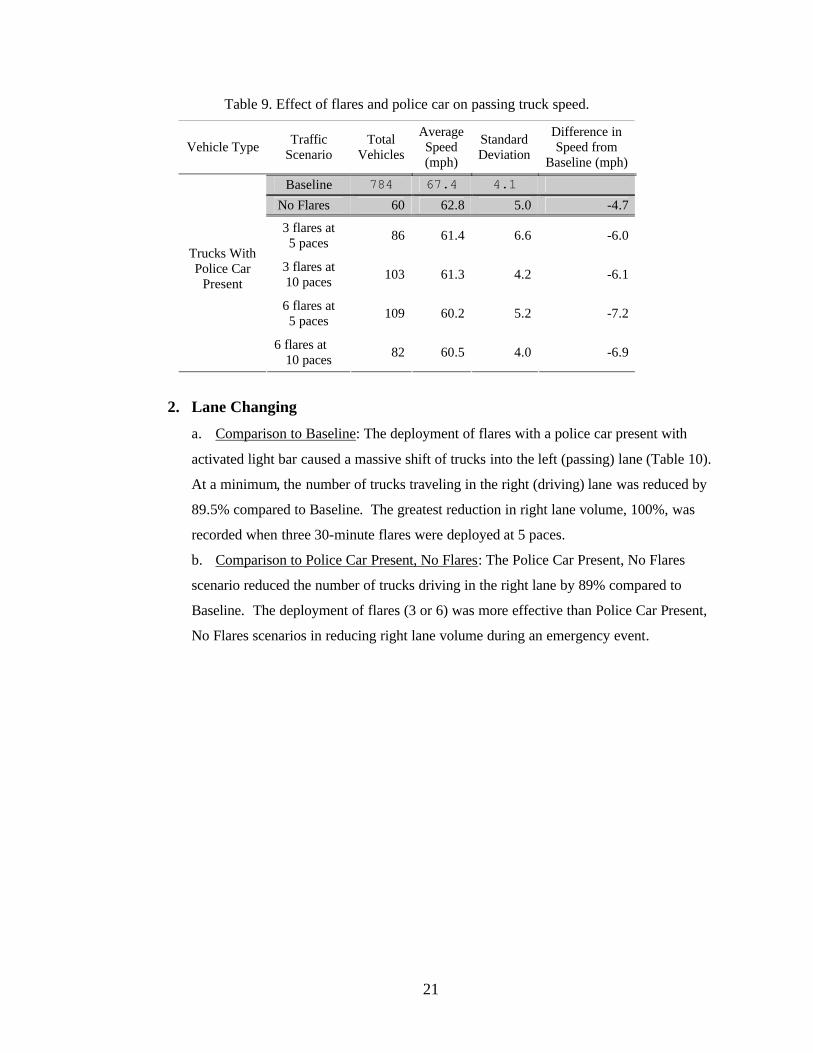
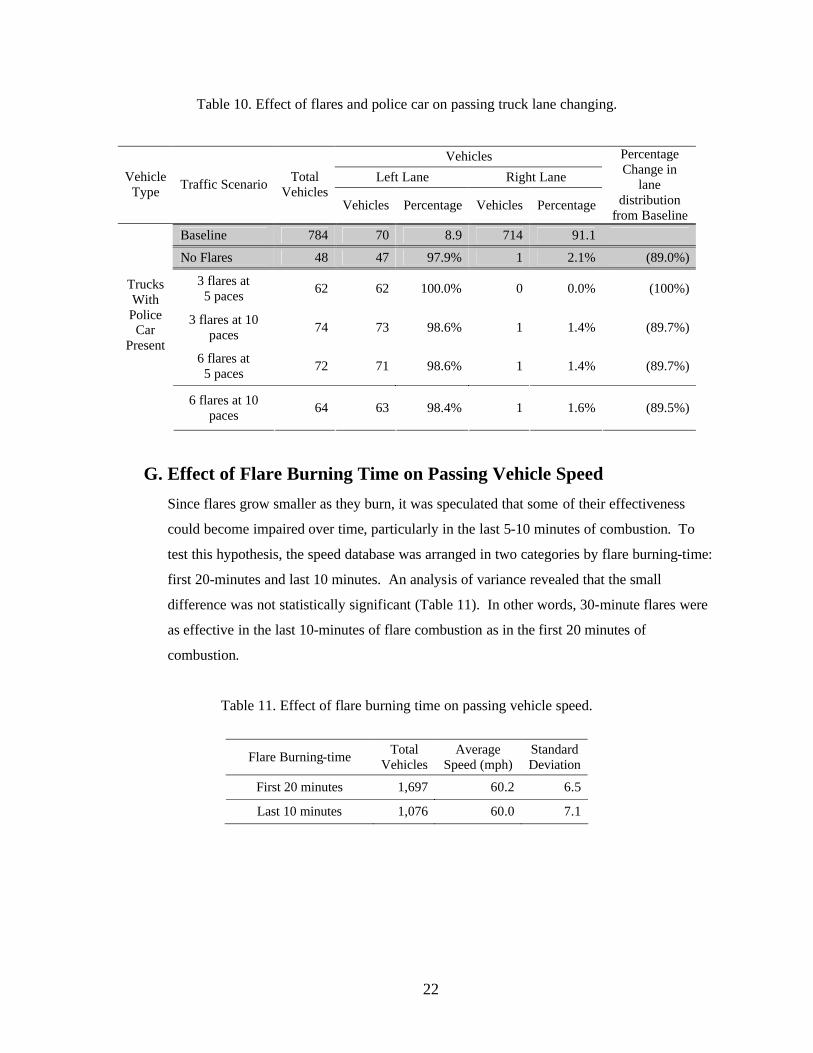
2. Lane Changing a. Comparison to Baseline: The deployment of flares with a police car present with
activated light bar caused a massive shift of trucks into the left (passing) lane (Table 10).
At a minimum, the number of trucks traveling in the right (driving) lane was reduced by
89.5% compared to Baseline. The greatest reduction in right lane volume, 100%, was
recorded when three 30-minute flares were deployed at 5 paces.
b. Comparison to Police Car Present, No Flares: The Police Car Present, No Flares
scenario reduced the number of trucks driving in the right lane by 89% compared to
Baseline. The deployment of flares (3 or 6) was more effective than Police Car Present,
No Flares scenarios in reducing right lane volume during an emergency event.
22
Table 10. Effect of flares and police car on passing truck lane changing.
Vehicles
Left Lane Right Lane Vehicle Type Traffic Scenario Total
Vehicles Vehicles Percentage Vehicles Percentage
Percentage Change in
lane distribution
from Baseline Baseline 784 70 8.9 714 91.1
No Flares 48 47 97.9% 1 2.1% (89.0%)
3 flares at 5 paces 62 62 100.0% 0 0.0% (100%)
3 flares at 10 paces 74 73 98.6% 1 1.4% (89.7%)
6 flares at 5 paces 72 71 98.6% 1 1.4% (89.7%)
Trucks With Police
Car Present
6 flares at 10 paces 64 63 98.4% 1 1.6% (89.5%)
G. Effect of Flare Burning Time on Passing Vehicle Speed
Since flares grow smaller as they burn, it was speculated that some of their effectiveness
could become impaired over time, particularly in the last 5-10 minutes of combustion. To
test this hypothesis, the speed database was arranged in two categories by flare burning-time:
first 20-minutes and last 10 minutes. An analysis of variance revealed that the small
difference was not statistically significant (Table 11). In other words, 30-minute flares were
as effective in the last 10-minutes of flare combustion as in the first 20 minutes of
combustion.
Table 11. Effect of flare burning time on passing vehicle speed.
Flare Burning-time Total Vehicles
Average Speed (mph)
Standard Deviation
First 20 minutes 1,697 60.2 6.5
Last 10 minutes 1,076 60.0 7.1
23
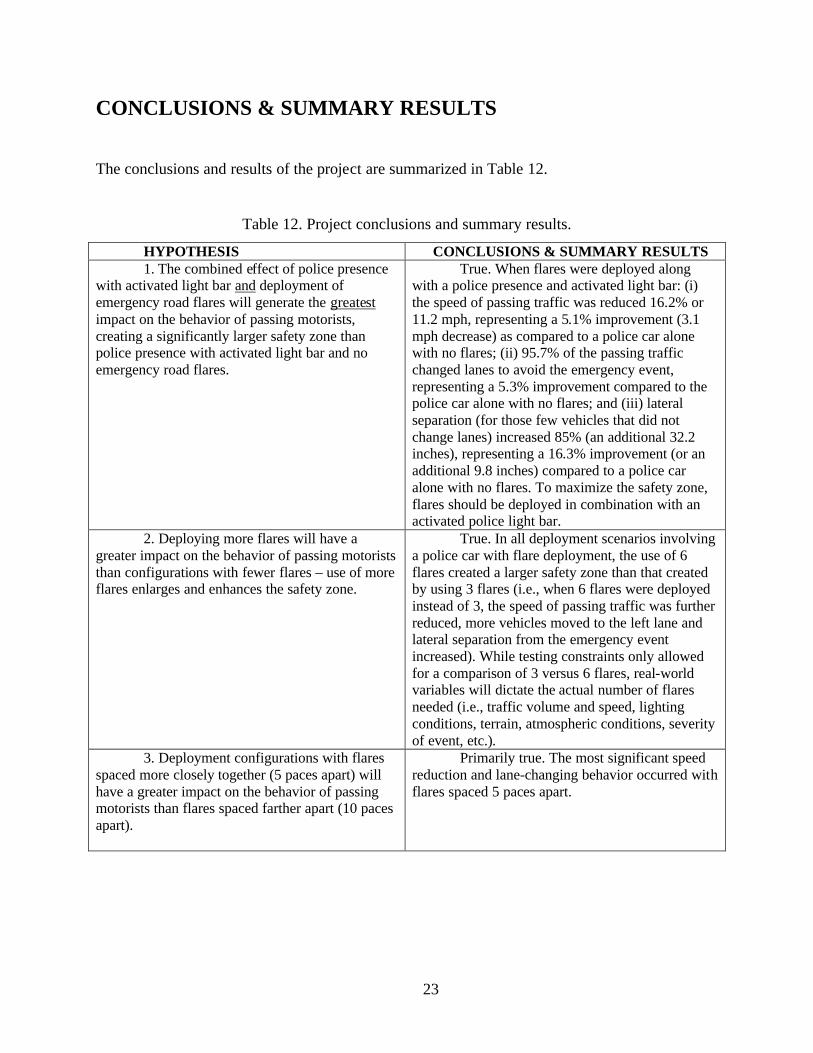
CONCLUSIONS & SUMMARY RESULTS
The conclusions and results of the project are summarized in Table 12.
Table 12. Project conclusions and summary results.
HYPOTHESIS CONCLUSIONS & SUMMARY RESULTS 1. The combined effect of police presence
with activated light bar and deployment of emergency road flares will generate the greatest impact on the behavior of passing motorists, creating a significantly larger safety zone than police presence with activated light bar and no emergency road flares.
True. When flares were deployed along with a police presence and activated light bar: (i) the speed of passing traffic was reduced 16.2% or 11.2 mph, representing a 5.1% improvement (3.1 mph decrease) as compared to a police car alone with no flares; (ii) 95.7% of the passing traffic changed lanes to avoid the emergency event, representing a 5.3% improvement compared to the police car alone with no flares; and (iii) lateral separation (for those few vehicles that did not change lanes) increased 85% (an additional 32.2 inches), representing a 16.3% improvement (or an additional 9.8 inches) compared to a police car alone with no flares. To maximize the safety zone, flares should be deployed in combination with an activated police light bar.
2. Deploying more flares will have a greater impact on the behavior of passing motorists than configurations with fewer flares – use of more flares enlarges and enhances the safety zone.
True. In all deployment scenarios involving a police car with flare deployment, the use of 6 flares created a larger safety zone than that created by using 3 flares (i.e., when 6 flares were deployed instead of 3, the speed of passing traffic was further reduced, more vehicles moved to the left lane and lateral separation from the emergency event increased). While testing constraints only allowed for a comparison of 3 versus 6 flares, real-world variables will dictate the actual number of flares needed (i.e., traffic volume and speed, lighting conditions, terrain, atmospheric conditions, severity of event, etc.).
3. Deployment configurations with flares spaced more closely together (5 paces apart) will have a greater impact on the behavior of passing motorists than flares spaced farther apart (10 paces apart).
Primarily true. The most significant speed reduction and lane-changing behavior occurred with flares spaced 5 paces apart.
24
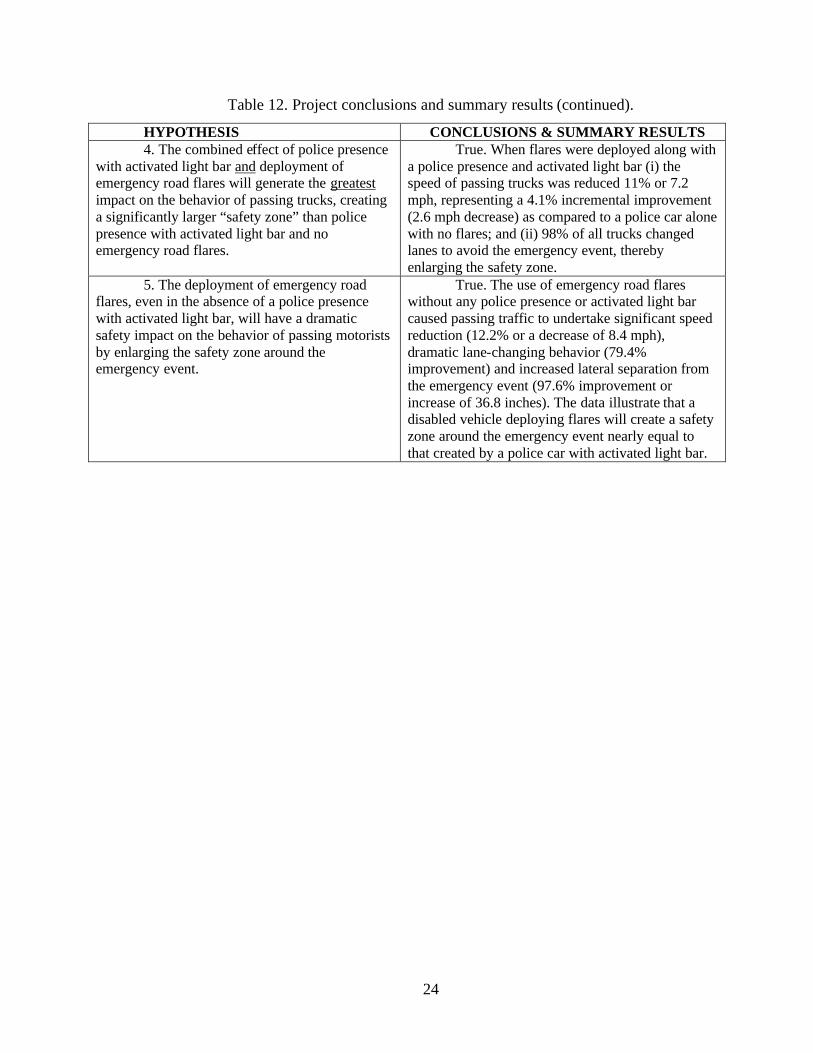
Table 12. Project conclusions and summary results (continued).
HYPOTHESIS CONCLUSIONS & SUMMARY RESULTS 4. The combined effect of police presence
with activated light bar and deployment of emergency road flares will generate the greatest impact on the behavior of passing trucks, creating a significantly larger “safety zone” than police presence with activated light bar and no emergency road flares.
True. When flares were deployed along with a police presence and activated light bar (i) the speed of passing trucks was reduced 11% or 7.2 mph, representing a 4.1% incremental improvement (2.6 mph decrease) as compared to a police car alone with no flares; and (ii) 98% of all trucks changed lanes to avoid the emergency event, thereby enlarging the safety zone.
5. The deployment of emergency road flares, even in the absence of a police presence with activated light bar, will have a dramatic safety impact on the behavior of passing motorists by enlarging the safety zone around the emergency event.
True. The use of emergency road flares without any police presence or activated light bar caused passing traffic to undertake significant speed reduction (12.2% or a decrease of 8.4 mph), dramatic lane-changing behavior (79.4% improvement) and increased lateral separation from the emergency event (97.6% improvement or increase of 36.8 inches). The data illustrate that a disabled vehicle deploying flares will create a safety zone around the emergency event nearly equal to that created by a police car with activated light bar.


![Final Results 2010 [Presentation slides] - Mitchells & Butlers › pdf › 2010 › results › final_results10_slides.… · Final Results 2010 [Presentation slides] Keywords: Final](https://static.documents.pub/doc/80x56/5f2878169df78139e52a7d4d/final-results-2010-presentation-slides-mitchells-butlers-a-pdf-a-2010.jpg)
