Astronomy & Astrophysics manuscript no. OBP c ESO 2018 September 27, 2018 Orion revisited III. The Orion Belt population K. Kubiak 1 , J. Alves 1 , H. Bouy 2 , L. M. Sarro 6 , J. Ascenso 4, 5 , A. Burkert 8, 9 , J. Forbrich 1 , J. Großschedl 1 , A. Hacar 1 , B. Hasenberger 1 , M. Lombardi 3 , S. Meingast 1 , R. Köhler 7, 1 , and P. S. Teixeira 1 1 Department of Astrophysics, University of Vienna, Türkenschanzstrasse 17, A-1180 Vienna e-mail: [email protected]2 Center for Astrobiology (INTA-CSIC), Camino Bajo del Castillo S/N, E-28692 Villanueva de la Cañada, Madrid 3 University of Milan, Department of Physics, via Celoria 16, 20133, Milan, Italy 4 CENTRA, Instituto Superior Tecnico, Universidade de Lisboa, Av. Rovisco Pais 1, 1049-001, Lisbon, Portugal 5 Universidade do Porto, Departamento de Engenharia Fisica da Faculdade de Engenharia, Rua Dr. Roberto Frias, s/n, 4200-465, Porto, Portugal 6 Dpto. de Inteligencia Artificial, ETSI Informatica, UNED, Juan del Rosal, 16, 28040, Madrid, Spain 7 Institut für Astro- und Teilchenphysik, Universität Innsbruck, Technikerstr. 25/8, 6020 Innsbruck, Austria 8 Universitäts-Sternwarte Ludwig-Maximilians-Universität (USM), Scheinerstr. 1, München, D-81679, Germany 9 Max-Planck-Institut für extraterrestrische Physik (MPE), Giessenbachstr.1, D-85748 Garching, Germany September 27, 2018 ABSTRACT Aims. This paper continues our study of the foreground population to the Orion molecular clouds. The goal is to characterize the foreground population north of NGC 1981 and to investigate the star formation history in the large Orion star-forming region. We focus on a region covering about 25 square degrees, centered on the Orionis supergiant (HD 37128, B0 Ia) and covering the Orion Belt asterism. Methods. We used a combination of optical (SDSS) and near-infrared (2MASS) data, informed by X-ray (XMM-Newton) and mid- infrared (WISE) data, to construct a suite of color-color and color-magnitude diagrams for all available sources. We then applied a new statistical multiband technique to isolate a previously unknown stellar population in this region. Results. We identify a rich and well-defined stellar population in the surveyed region that has about 2000 objects that are mostly M stars. We infer the age for this new population to be at least 5 Myr and likely ∼ 10 Myr and estimate a total of about 2 500 members, assuming a normal IMF. This new population, which we call the Orion Belt population, is essentially extinction-free, disk-free, and its spatial distribution is roughly centered near Ori, although substructure is clearly present. Conclusions. The Orion Belt population is likely the low-mass counterpart to the Ori OB Ib subgroup. Although our results do not rule out Blaauw’s sequential star formation scenario for Orion, we argue that the recently proposed blue streams scenario provides a better framework on which one can explain the Orion star formation region as a whole. We speculate that the Orion Belt population could represent the evolved counterpart of an Orion nebula-like cluster. Key words. Stars: formation - Stars: late-type - Stars: pre-main sequence - ISM: clouds 1. Introduction The Orion star formation complex is the closest massive star- forming region to the Sun and has generated about 10 4 low- and high-mass stars for at least the last ∼ 12 Myr (e.g., Blaauw (1964); Brown et al. (1994); Bally (2008); Muench et al. (2008); Briceno (2008)). The entire region, also known as the Orion OB I association, covers an area of approximately 10 ◦ × 20 ◦ on the sky and harbors a half dozen subgroups containing well-known OB stars and giant molecular clouds (see Fig. 1). The proxim- ity of the region (∼ 400 pc; Hirota et al. (2007); Menten et al. (2007); Sandstrom et al. (2007); Bally (2008)) makes it one of the most significant star formation laboratories in astronomy. In- deed, much has been learned in Orion about star formation, for example, clues to the evolution and destruction of clouds, the physics and dynamics of the interstellar medium (ISM), and the role that OB associations and high-mass stars play in the cycling of gas between various phases of the ISM. It is very remarkable, although understandable given its size, that for a region of such fundamental importance most attention has been devoted to the embedded and dusty stellar populations (age ≤3 Myr) emerg- ing from the molecular clouds complexes Orion A and Orion B (e.g., Lada et al. 1991; Allen & Davis 2008; Megeath et al. 2012; Gutermuth et al. 2009; Da Rio et al. 2010; Spezzi et al. 2015), whilst only a few studies have tackled the Orion star-forming region as a whole. The Orion OB I association (Blaauw 1964) is composed of several stellar subgroups of different ages, gas, and dust amount. Blaauw divided Orion’s association into four groups. Figure 1 presents a widefield image of the Orion Constellation su- perimposed with ellipses denoting the approximate boundaries of these four OB I subgroups. These groups appear to show a spatial-temporal relation that is suggestive of a sequence of star formation events, from dust free Ia subgroup to still dust em- bedded Id. This led Blaauw (1964) to propose a sequential star formation scenario, where a previous generation of stars is re- Article number, page 1 of 13 arXiv:1609.04948v1 [astro-ph.SR] 16 Sep 2016
K. Kubiak1, J. Alves1, H. Bouy2, L. M. Sarro6, J. Ascenso4, 5, A. Burkert8, 9, J. Forbrich1, J. Großschedl1, A. Hacar1,B. Hasenberger1, M. Lombardi3, S. Meingast1, R. Köhler7, 1, and P. S. Teixeira1
1 Department of Astrophysics, University of Vienna, Türkenschanzstrasse 17, A-1180 Viennae-mail: [email protected]
2 Center for Astrobiology (INTA-CSIC), Camino Bajo del Castillo S/N, E-28692 Villanueva de la Cañada, Madrid3 University of Milan, Department of Physics, via Celoria 16, 20133, Milan, Italy4 CENTRA, Instituto Superior Tecnico, Universidade de Lisboa, Av. Rovisco Pais 1, 1049-001, Lisbon, Portugal5 Universidade do Porto, Departamento de Engenharia Fisica da Faculdade de Engenharia, Rua Dr. Roberto Frias, s/n, 4200-465,
Porto, Portugal6 Dpto. de Inteligencia Artificial, ETSI Informatica, UNED, Juan del Rosal, 16, 28040, Madrid, Spain7 Institut für Astro- und Teilchenphysik, Universität Innsbruck, Technikerstr. 25/8, 6020 Innsbruck, Austria8 Universitäts-Sternwarte Ludwig-Maximilians-Universität (USM), Scheinerstr. 1, München, D-81679, Germany9 Max-Planck-Institut für extraterrestrische Physik (MPE), Giessenbachstr.1, D-85748 Garching, Germany
September 27, 2018
ABSTRACT
Aims. This paper continues our study of the foreground population to the Orion molecular clouds. The goal is to characterize theforeground population north of NGC 1981 and to investigate the star formation history in the large Orion star-forming region. Wefocus on a region covering about 25 square degrees, centered on the ε Orionis supergiant (HD 37128, B0 Ia) and covering the OrionBelt asterism.Methods. We used a combination of optical (SDSS) and near-infrared (2MASS) data, informed by X-ray (XMM-Newton) and mid-infrared (WISE) data, to construct a suite of color-color and color-magnitude diagrams for all available sources. We then applied anew statistical multiband technique to isolate a previously unknown stellar population in this region.Results. We identify a rich and well-defined stellar population in the surveyed region that has about 2 000 objects that are mostly Mstars. We infer the age for this new population to be at least 5 Myr and likely ∼ 10 Myr and estimate a total of about 2 500 members,assuming a normal IMF. This new population, which we call the Orion Belt population, is essentially extinction-free, disk-free, andits spatial distribution is roughly centered near ε Ori, although substructure is clearly present.Conclusions. The Orion Belt population is likely the low-mass counterpart to the Ori OB Ib subgroup. Although our results do notrule out Blaauw’s sequential star formation scenario for Orion, we argue that the recently proposed blue streams scenario provides abetter framework on which one can explain the Orion star formation region as a whole. We speculate that the Orion Belt populationcould represent the evolved counterpart of an Orion nebula-like cluster.
The Orion star formation complex is the closest massive star-forming region to the Sun and has generated about 104 low-and high-mass stars for at least the last ∼ 12 Myr (e.g., Blaauw(1964); Brown et al. (1994); Bally (2008); Muench et al. (2008);Briceno (2008)). The entire region, also known as the Orion OB Iassociation, covers an area of approximately 10◦ × 20◦ on thesky and harbors a half dozen subgroups containing well-knownOB stars and giant molecular clouds (see Fig. 1). The proxim-ity of the region (∼ 400 pc; Hirota et al. (2007); Menten et al.(2007); Sandstrom et al. (2007); Bally (2008)) makes it one ofthe most significant star formation laboratories in astronomy. In-deed, much has been learned in Orion about star formation, forexample, clues to the evolution and destruction of clouds, thephysics and dynamics of the interstellar medium (ISM), and therole that OB associations and high-mass stars play in the cyclingof gas between various phases of the ISM. It is very remarkable,
although understandable given its size, that for a region of suchfundamental importance most attention has been devoted to theembedded and dusty stellar populations (age ≤3 Myr) emerg-ing from the molecular clouds complexes Orion A and Orion B(e.g., Lada et al. 1991; Allen & Davis 2008; Megeath et al. 2012;Gutermuth et al. 2009; Da Rio et al. 2010; Spezzi et al. 2015),whilst only a few studies have tackled the Orion star-formingregion as a whole.
The Orion OB I association (Blaauw 1964) is composed ofseveral stellar subgroups of different ages, gas, and dust amount.Blaauw divided Orion’s association into four groups. Figure1 presents a widefield image of the Orion Constellation su-perimposed with ellipses denoting the approximate boundariesof these four OB I subgroups. These groups appear to show aspatial-temporal relation that is suggestive of a sequence of starformation events, from dust free Ia subgroup to still dust em-bedded Id. This led Blaauw (1964) to propose a sequential starformation scenario, where a previous generation of stars is re-
Article number, page 1 of 13
arX
iv:1
609.
0494
8v1
[as
tro-
ph.S
R]
16
Sep
2016
A&A proofs: manuscript no. OBP
sponsible for the formation of a new one via positive feedback;this idea was later quantified by Elmegreen & Lada (1977) andhas remained very popular in the literature.
Although there are differences in the estimated ages or ex-act sizes of the various groups, most of the published works inthe region agree that the Orion OB Ia group toward the northis the oldest with an age of ∼ 8-10 Myr (Bally 2008, with a dis-tance ∼ 350 pc) or even 12 Myr as originally proposed by Blaauw(1964). This group is also dust free. The OB Ib subgroup, con-taining the stars around the Orion Belt asterism, is located at adistance of ∼ 400 pc (Bally 2008). This subgroup has an esti-mated age of ∼ 3-6 Myr (Bally 2008) or ∼ 1.7 Myr (Brown et al.1994), although the lower estimate is inconsistent with the ageof the three supergiants (ζ Ori, ε Ori, and δ Ori) that form thenaked-eye Belt. According to their spectral types, these threestars must be at least 5 Myrs old. The 3-6 Myr old OBI c sub-group consists of stars around the Sword (about 4◦ below theBelt asterism). The older stars in the OB Ic are superimposed onthe much younger and still embedded subgroup OB Id, whichis associated with the Orion nebula and including the Trapeziumstars, M43, NGC 1977, and the OMC1, 2, and 3 regions in the in-tegral shaped filament along with the northern part of the OrionA molecular cloud (age < 2 Myr, d∼ 420pc, Bally (2008)). Al-though initially each subpopulation was assumed to be a distinctepisode in a large star formation event, it was early realized thatthe subgroups are partially superimposed along our line of sightand several authors have described the boundaries between sub-groups, their characteristics, and some discrepancies with the se-quential star formation scenario (e.g., Warren & Hesser 1978; deGeus et al. 1990; Brown et al. 1994; Gomez & Lada 1998). Un-fortunately, the three-dimensional arrangement of star-formingregions, in particular massive ones, is far from simple and is es-sentially unknown for any massive star-forming region given thecurrent distance accuracies.
Recently, Alves & Bouy (2012) and Bouy et al. (2014) pre-sented evidence for a young and massive foreground population(∼ 5 Myr) that is detached from the Orion A cloud but seen inprojection toward it. They argue that this foreground populationwas formed about 4 − 5 Myr ago in a different, but perhaps re-lated, event in the larger Orion star formation complex and notin the existing Orion A molecular cloud like, for example, theOrion nebula cluster. This foreground population includes in partBlaauw’s OB Ic population, but does not include the younger σ-Ori cluster, as suggested in Bally (2008). An intriguing result oftheir study was that the Orion A foreground population seemedto extend to the north, toward OB Ib, beyond the limits of theirsurvey. This was later confirmed in Meingast et al. (2016) in theirESO-VISTA near-infrared (NIR) imaging of the entire Orion Acloud, who found a southern boundary to the foreground popu-lation, but not an obvious boundary toward the north. This raisesthe question of how well Ori OB Ic and Ib are separated spatially,if at all, and how they fit in a sequential star formation scenario.
In a related study, Bouy & Alves (2015) revisited the Hip-parcos catalog and studied the spatial distribution in 3D of OBstars that are closer than 500 pc from the Sun. Their analysisreveals that massive OB stars form large-scale structures thatare well defined and elongated, which they refer to as “bluestreams”. The spatial coherence of these blue streams, and themonotonic age sequence over hundreds of parsecs, suggest thatthey are made of young stars. The two main blue streams arethe Sco-CMa stream, including the Sco-Cen association, and thesurprising Orion stream, originating in the Orion clouds and ex-tending to regions as close to Earth as ∼ 200 pc, but likely evencloser. In this scenario, the foreground population presented in
Fig. 1: Widefield image of the Orion OB I stellar associationsas described by A. Blaauw (1964) and revised in Bally (2008).North is up, and east is left. Background image: R. Bernal An-dreo, www.deepskycolors.com.
Alves & Bouy (2012) and Bouy et al. (2014) could be part ofthe Orion blue stream. Given this new scenario for the distribu-tion of young stars in the local neighborhood, and in particularthe realization that the Orion OB I association may be part of theOrion stream, there is a clear need to gather more informationabout the region on larger scales than collected previously andfor regions further away from the molecular clouds.
The main goal of this paper is to extend the work of Alves &Bouy (2012) and Bouy et al. (2014) to the north and, (i) furtherinvestigate the extent of the young foreground population pre-sented, (ii) investigate the relation between OB Ic and Ib popula-tions, and (iii) contribute to the reconstruction of the star for-mation history of the Orion complex. We focus our study onBlaauw’s subgroup OB Ib by studying almost 30 square degreesof sky centered on Orion’s Belt. Within the limitations of ourdata, we compare the recently proposed Orion blue stream sce-nario with that of Blaauw’s classical sequential star formation.
The overdensity of blue massive stars in the Orion Belt re-gion was first pointed out in Galileo’s Sidereus Nuncius in 1609as an example of how the telescope could resolve stars that arenot visible by the human eye. The stellar overdensity was also
recognized in 1931 by Swedish astronomer Per Collinder in hiscatalog of open clusters (Collinder 1930). He distinguished theOrion’s Belt asterism, comprised of the three famously alignedbright stars: Alnitak (ζ Ori, HD 37742J, O9.7 Ib+B0 III), Al-nilam (ε Ori, HD 37128, B0 Ia), and Mintaka (δ Ori, HD 36486,B0 III +O9 V) as Collinder 70 (Col 70). Still, and even thoughit is immediately recognizable to the naked eye, the Orion Beltstellar population is paradoxically poorly known. Caballero &Solano (2008) observed two circular areas of 45 arcmin radiuseach, centered on Alnilam and Mintaka and found 136 low-massstars displaying features of extreme youth, and a total of 289young stars in the surveyed area. They concluded that the tworegions could be analogs to the σ Ori cluster, but more massive,extended, and slightly older.
Since the seminal work of Blaauw, it has been suggestedthat the age, distance, and radial velocity of the stellar com-ponents of subgroup OB Ib may not be consistent with a sim-ple sequential star formation scenario (e.g., Hardie et al. (1964);Warren & Hesser (1978); Guetter (1981); Gieseking 1983). Inparticular, the eastern part of the subgroup, which includes Al-nitak, the Horsehead Nebula, the Flame Nebula (associated withNGC 2024 in the Orion B cloud), and the H II region IC 434,would be the farthest and youngest subgroup. The fourth bright-est star in Orion’s Belt is σ Ori (48 Ori, HD 37468, O 9.5 V),the brightest source in the well-studied σ Orionis Cluster (Wal-ter et al. 1997), which has been assigned to OB Ib based on itsspatial proximity. Still, two solid cases can be made against σOri belonging to OB Ib. These two cases, which are discussedlater in this paper, are, first, the age of the σ-Ori cluster (3 Myr;Caballero (2008)) is younger than most of the stars in the Beltregion and, second, the radial velocity of stars toward the clus-ter shows that the young σ-Ori cluster consists of two spatiallysuperimposed components that are kinematically separated by7 km/s in radial velocity (Jeffries et al. 2006). In the review ofBally (2008) the σ-Ori cluster appears as member of OB Ic, asin Figure 1.
This paper is organized as follows. The next section brieflydescribes the data used in this study. Section 3 and 4 presentour results, centering on the discovery of a large population ofyoung stars around ε Ori. In Section 5 we discuss our results andwe summarize them in Section 6.
2. Data
2.1. Survey field
We first retrieved and cross-matched all the sources fromthe Two Micron All-Sky Survey (Skrutskie et al. 2006) andSloan Digital Sky Survey DR12 (Ahn et al. 2014) catalogs lo-cated within a radius of 3 degrees centered around ε Ori at(l, b)=(205.21,−17.24)◦. The size and location of our field werechosen to achieve the best coverage of Ori Ib in both catalogs.The 2MASS catalog homogeneously covers the entire area ofinterest, while the SDSS DR12 catalog is missing a significantfraction in the southern half. Figure 2 shows the coverage of thedifferent surveys used in this study over a photograph of the re-gion. It includes, by design, most of the σ-Ori, and a signifi-cant fraction of the NGC 1980/NGC 1981 area surveyed in Bouyet al. (2014). All in all, about 21% of the ∼ 28 deg2 surveyed areais incomplete. A total of 200 497 2MASS and 909 619 SDSSsources were found in the corresponding area. Of these, 189 620sources appear in both surveys.
In an effort to compile the most complete data set in termsof spatial and wavelength coverage, we then collected comple-
mentary photometry from the ALLWISE catalog obtained withthe Wide-field Infrared Survey Explorer (Cutri et al. 2013), theHα emission-line KISO survey (Wiramihardja et al. 1994), andthe XMM-Newton serendipitous sources catalog (Watson et al.2009). We also investigated the dust distribution in this regionbased on the Planck 857 GHz Survey image (Planck Collabora-tion et al. 2014; Tauber et al. 2010).
Table 1: Catalogs and observations used in this study.
Fig. 2: Coverage of the study. The selected SDSS survey cov-erage is represented by the gray area. The 2MASS survey,an all-sky survey, is available for the entire region of study(red dotted circle). Background image: R. Bernal Andreo, www.deepskycolors.com.
2.2. Control field
Control fields provide an efficient and simple method to estimateexcess stellar population statistics and luminosity functions. Weselected the control field (CF) using the following criteria:
– Same size as the survey field,– Centered on the same Galactic latitude as the area of interest
described above (b=−17.24◦) to minimize any enhancementsin stellar surface density caused by the Milky Way structure,
– Located in a region with low extinction, as reported in Lom-bardi et al. (2011) extinction map, to obtain the best charac-terization of the background population (Figure 3),
The selected CF is located almost 30◦ away from the scientificfield toward lower galactic longitudes and centered on (l, b) =(187.0,−17.24)◦. Owing to the peculiar specific coverage of theSloan’s survey away from the Galactic cap, this is the closestsatisfactory field. Unfortunately, despite our best efforts, the con-trol field is not extinction free and suffers from about 1 magni-tude of visual extinction. Because we estimate the populationsize in the NIR, this is not critical because one magnitude ofvisual extinction is on the order of the extinction noise mea-surement in the NIR. Figure 3 shows the location of the scienceand control fields as blue and red circles, respectively, superim-posed on NICER extinction map by Lombardi et al. (2011). Thegreen strips correspond to the coverage of SDSS catalog, illus-trating the incomplete coverage of optical data. The CF contains167 105 2MASS sources and 376 846 SDSS sources, of whichonly 59 546 sources have photometry available from both sur-veys.
3. A new rich and large stellar group around ε Ori
3.1. Stellar surface density
The surface density of sources provides a simple first step tosearch for stellar groups. Figure 4 shows the kernel density es-timate (KDE) of the positions of sources in the 2MASS J bandwithin a magnitude cut of 15.3 mag (0.2 mag above the com-pleteness limit to avoid the different level of photometric noiselevel for different 2MASS strips) and was obtained using a Gaus-sian kernel with a bandwidth of 10′.
We investigated the KDE maps for all eight available bandswith bandwidths ranging from 0.01◦ to 1◦. The ugriz densitymaps showed low-density areas around the bright OB stars of theOrion Belt and we interpret these as artifacts related to the pres-ence of the bright stars, in particular the super-giants in Orion’sBelt asterism. The near-IR 2MASS survey covers a broader dy-namic range and is less affected by the presence of bright stars.Furthermore, the NIR is better suited to study the stellar spatialdistribution thanks to its lower sensitivity to extinction and bet-ter sensitivity to low-mass stars that dominate the initial massfunction (IMF).
A clear overdensity is seen around σOri in the JHKs surfacedensity maps, and ζ Ori (Alnitak) in the H and Ks maps. Thesetwo density enhancements are associated with the well-knownσ Orionis and NGC 2024 stellar clusters (e.g., Meyer et al.2008). Another density enhancement is clearly visible aroundε Ori (Alnilam) in the J and H maps. We measured the signifi-cance of overdensities by estimating a rms noise level from tenmeasurements around the main enhancement in Figure 4. Themain overdensity toward the center of this figure, the main ob-ject of study throughout this work, is defined by a threshold of7σ.
While the overdensity around σ Orionis and NGC 2024 re-gion are uniform and compact at the spatial scale probed byour analysis (10′), the density enhancement around ε Ori ismuch more extended and shows some internal structure. We alsonote the lack of any obvious density enhancement around δ Ori(Mintaka), in contrast with the result by Caballero & Solano2008, who investigated the population of young stars and browndwarfs in a comparatively smaller region around Mintaka andAlnilam. It is still possible, however, that a potential enhance-ment around δ Ori is less significant than our 5σ significancethreshold. Finally, the KDE maps also show a surface density
enhancement at almost all wavelengths in the northern part ofthe field, closer to the Galactic plane, which we tentatively in-terpret as the increasing stellar density produced by the Galacticstructure and do not discuss further here. Finally, the Orion Bmolecular clouds are clearly visible north of ζ and σ Ori and ap-pear as a region of lower density. Some of the properties of thisenhancement are presented in Table 2.
202203204205206207208Galactic longitude [deg]
20
19
18
17
16
15
Galac
tic la
titude
ε
δ
ζ
σ
J band
1400
1600
1800
2000
2200
2400
2600
2800
3000
pro
unit a
rea
Fig. 4: Surface densities calculated based on J-band 2MASS. As-terisks denote the positions of the three Orion Belt stars and σOrionis. Similar results are obtained for the H and K bands.
Table 2: Properties of the main overdensity in Figure 4
Number of stars 2345Total mass ∼ 1200 M�Surface density 800 stars/ ◦2
for d=380 pc 18 stars/pc2
for d=250 pc 41 stars/pc2
Volume density for d=380 pc 8 stars/pc3
for d=250 pc 17 stars/pc3
Position of peaks σ-Ori 14σA 205.5◦, -17.5◦ 11σB 204.5◦, -16.8◦ 10σC 204.5◦, -17.5◦ 9σD 205.2◦, -18.2◦ 8.5σ
To estimate the size of the population included in the densityenhancement around ε Ori, we estimate the number of sourcesfalling into a 1.7◦ × 2.2◦ ellipse (7σ threshold in overdensity inthe J-band KDE map) encompassing it (9 466 sources), and thenumber of sources included in an equal area located in the con-trol field (7 121 sources). The latter gives an estimate of the num-ber of foreground and background sources that one can expect tofind in that region of the galaxy. Subtraction of both values gives2 345 sources, which we use as an estimate for the size of the
Article number, page 4 of 13
K. Kubiak et al.: Orion revisited
population producing the density enhancement. Repeating thecount in 9 equal-area random positions within the CF leads to adispersion of ∼215 sources.
3.2. Color-magnitude and color-color diagrams of the survey
Figure 5 shows a (i, i−Ks) color-magnitude diagram for the sam-ple of sources in our survey (left panel) and CF (right panel).A rather dense sequence is clearly visible in the science fieldbut not in the CF, suggesting the existence of a nearby youngand rich population (indicated approximately by the green el-lipse). The dispersion in color along the sequence, which is lessthan 1 mag, is lower than the typical dispersion observed for veryyoung clusters (≤5 Myr, Mayne et al. 2008).
The sequence is also clearly visible in other optical andNIR color-magnitude diagrams for the science field, but is notpresent in the corresponding color-magnitude diagrams for thecontrol field; this confirms that the population separates wellphotometrically from the field population across a broad rangeof wavelengths. A closer qualitative examination of the photo-metric properties of stars in the survey field can be carried outby comparing various color-color diagrams.
3.3. Selection method
We took advantage of the clear separation of the sequence invarious color-magnitude diagrams and the apparent absence ofsignificant extinction to select the members of this new popula-tion. As in Bouy et al. (2014), we applied the novel maximum-likelihood approach described in detail in Sarro et al. (2014) toinfer the membership of all the sources in our sample. This mul-tidimensional probabilistic analysis offers the advantage of usingmultiple color-magnitude diagrams simultaneously and includesa statistically sound treatment of errors and censored data. Theu band was excluded from the analysis because the observationsare significantly shallower and extremely sensitive to interstellarextinction, excess emission related to accretion, and stellar ac-tivity. Table A.1 gives the list of all sources in our final catalogand includes the identification number, J2000 coordinates, grizSDSS, and JHKS 2MASS magnitudes, as well as the member-ship probability computed as described above.
The choice of a membership probability threshold is not triv-ial. Figure 6 shows the distribution of membership probabili-ties for all the sources. It presents the typical bimodal distribu-tion distribution comprised of a huge maximum around 0 and asmaller maximum around 1. Table 3 shows the number of mem-bers for various threshold values.
Table 3: Number of members at different membership probabil-ity thresholds.
In an effort to be conservative, we select as members all thesources above a membership probability of 99.73%, leading to asample of 783 highly probable objects.
Figure 7 illustrates the efficiency of the multidimensional se-lection method used to compute membership probabilities. This
0.60 0.65 0.70 0.75 0.80 0.85 0.90 0.95 1.00Probability value
101
102
103
104
Counts
0.0 0.2 0.4 0.6 0.8 1.0
101
103
105
Fig. 6: Distribution of membership probabilities obtained for allsources (inner plot) and for sources with probability greater than60%.
figure shows a mosaic of color-color-diagrams constructed us-ing the optical griz and near-infrared JHK colors of our inputcatalog. The high probability Orion Belt population (from here-after, OBP) candidate members are overplotted with blue dots,and clearly separate from the field sources in most diagrams.The comparison of this positions of candidates with the intrin-sic colors of luminosity V and III stars in the J - H versus H- Ks diagram from Straižys & Lazauskaite (2009), shows, asexpected, that the sample of OBP high probability members ismade mostly of M stars.
This list of highly probable members is far from completeand suffers from several limitations. For example, there is nodata close to the bright stars, contamination must still be present,and the different depths of the various optical and near-infrareddata and the nonuniform spatial coverage of the data (in particu-lar the SDSS data) biases the sample in some areas, and there areover specific luminosity ranges. This sample is nevertheless ex-tremely useful to characterize the general properties of this newgroup and, in particular, its distance and age.
4. Properties of the selected sample
4.1. Spatial distribution
Figure 8 shows the 2D KDE of the spatial distribution of the 783OBP candidate members computed using the same bandwidthas in Figure 4. The stellar density appears clearly lower in theclose vicinity of the Belt supergiants (δ, ε, ζ Orionis) as a re-sult of the incompleteness of the SDSS catalog near these brightstars, as illustrated by the yellow contours in Figure 8. A densityenhancement is also visible around σ Ori and suggests that ourselection includes a few σ Ori cluster members. As we see inSection 4.3, the σ Ori sequence is indeed very similar to that ofthe new population, but several pieces of evidence indicate thatthe two groups must be distinct. The corresponding contamina-tion is nevertheless relatively low and concentrated around σOriitself. With these limitations in mind, we note that the most prob-able members seem to be located in an 0.5◦ wide ring that isroughly centered on ε Ori. The density in this ring is clearly nothomogeneous, and a strong overdensity located south of ε Oriseems to dominate. The current data do not allow us to drawany further conclusions on the details of the spatial distributionof OBP members. More importantly, however, we retrieved aroughly similar structure to the J-band stellar density map (Fig-ure 4) in a completely independent manner. This gives us confi-
Article number, page 5 of 13
A&A proofs: manuscript no. OBP
dence in the main result of this paper and the presence of a richand fairly coeval stellar population toward the Orion Belt.
To our knowledge, this coeval group does not correspond toany association previously identified in the literature. It is in par-ticular more compact than what was defined as the Collinder 70cluster (Collinder 1930) and we propose that it is a distinct andnew population of young stars.
202203204205206207208Galactic longitude [deg]
20
19
18
17
16
15
Galac
tic la
titude
ε
δ
ζ
σ
0
15
30
45
60
75
90
105
120
pro
unit a
rea
Fig. 8: Surface density map of the 783 OBP candidate members.Yellow contours represent source density from SDSS catalog.The map is affected by completeness near the supergiants andσOrionis ( indicated in red).
4.2. Age and distance estimates
4.2.1. Disk and accretor frequencies as an age diagnostic
We use the WISE and KISO Hα surveys to study the disk andaccretor frequencies among the sample of 783 high probabilityOBP members. The presence of a protoplanetary disk, which isprobed by mid-infrared excesses in WISE, and intense accre-tion, which is probed by strong Hα emission, provide clues onthe age of a population. Protoplanetary disks that are responsi-ble for the 3–12 µm excess emission revealed by WISE typicallydisperse over timescales of 5∼10 Myr (Ribas et al. 2015). Accre-tion of the circumstellar material onto the star stops being strongenough to produce sufficiently intense Balmer lines after a sim-ilar or shorter timescale. We find that only two stars within oursample have a counterpart in the KISO catalog (KISO A-0904 21and KISO A-0903 163) and only 27 stars display mid-infraredexcess in one or more WISE bands.1 The KISO and WISE sur-veys sensitivities should encompass most of the luminosity rangeof our sample. These two small numbers suggest that the OBPmembers have cleared most of their protoplanetary disks and al-low us to place a lower limit on the age around ∼5 Myr.
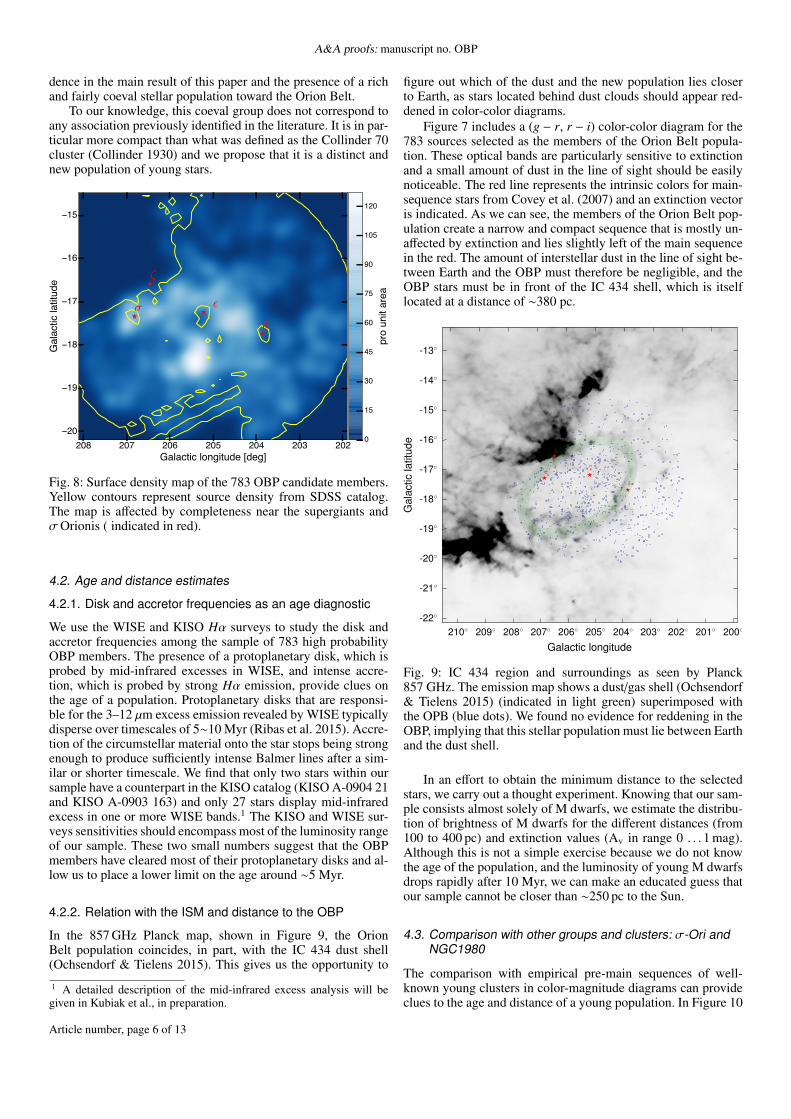
4.2.2. Relation with the ISM and distance to the OBP
In the 857 GHz Planck map, shown in Figure 9, the OrionBelt population coincides, in part, with the IC 434 dust shell(Ochsendorf & Tielens 2015). This gives us the opportunity to
1 A detailed description of the mid-infrared excess analysis will begiven in Kubiak et al., in preparation.
figure out which of the dust and the new population lies closerto Earth, as stars located behind dust clouds should appear red-dened in color-color diagrams.
Figure 7 includes a (g − r, r − i) color-color diagram for the783 sources selected as the members of the Orion Belt popula-tion. These optical bands are particularly sensitive to extinctionand a small amount of dust in the line of sight should be easilynoticeable. The red line represents the intrinsic colors for main-sequence stars from Covey et al. (2007) and an extinction vectoris indicated. As we can see, the members of the Orion Belt pop-ulation create a narrow and compact sequence that is mostly un-affected by extinction and lies slightly left of the main sequencein the red. The amount of interstellar dust in the line of sight be-tween Earth and the OBP must therefore be negligible, and theOBP stars must be in front of the IC 434 shell, which is itselflocated at a distance of ∼380 pc.
Fig. 9: IC 434 region and surroundings as seen by Planck857 GHz. The emission map shows a dust/gas shell (Ochsendorf& Tielens 2015) (indicated in light green) superimposed withthe OPB (blue dots). We found no evidence for reddening in theOBP, implying that this stellar population must lie between Earthand the dust shell.
In an effort to obtain the minimum distance to the selectedstars, we carry out a thought experiment. Knowing that our sam-ple consists almost solely of M dwarfs, we estimate the distribu-tion of brightness of M dwarfs for the different distances (from100 to 400 pc) and extinction values (Av in range 0 . . . 1 mag).Although this is not a simple exercise because we do not knowthe age of the population, and the luminosity of young M dwarfsdrops rapidly after 10 Myr, we can make an educated guess thatour sample cannot be closer than ∼250 pc to the Sun.
4.3. Comparison with other groups and clusters: σ-Ori andNGC1980
The comparison with empirical pre-main sequences of well-known young clusters in color-magnitude diagrams can provideclues to the age and distance of a young population. In Figure 10
Article number, page 6 of 13
K. Kubiak et al.: Orion revisited
we compare the sequence formed by the high probability OBPcandidate members with those of σ Orionis (3 Myr, 385 pc, andmembers list from Caballero 2007) and NGC1980 (5–10 Myr,400 pc, and members list from Bouy et al. 2014).
The figure shows that the OBP sequence is very similar tothose ofσOrionis and NGC1980. In fact, a cross-match betweenthe three lists shows that 19 sources selected as OBP memberswere identified as σ Orionis members by Caballero (2007), 52sources selected as OBP members were identified as NGC1980members in Bouy et al. (2014), and this illustrates the complexityof isolating stellar groups in the Orion OBI region.
The low disk and accretor frequencies among OBP memberssuggest that the OBP must be significantly older than the 3 Myrσ Orionis, where as many as 35% of T Tauri stars display mid-infrared excess related to the presence of a disk (Hernández et al.2007). For the two sequences to match, the OBP must thereforebe closer to the Sun than σ Orionis, in agreement with our con-clusion based on the extinction toward the OBP members.
Figure 10 also shows that the OBP sequence is similar to thatof NGC1980, but is slightly fainter by half a magnitude. If thisdifference is real, it could be the result of either a larger distanceor an older age. In Bouy et al. (2014) of this series, we estimatedan age of 5–10 Myr and distance of 380 pc for NGC1980. Sincethe comparison with σ Orionis and the analysis of the extinctiontoward the OBP sources consistently imply a distance closer than380 pc, we can rule out a significantly larger distance and con-clude that the OBP must be older than NGC1980.
For the mass determination, we assumed an age of 5-10 Myrfor the OPB since that was the best fit to the produced HRdiagram. At this point, we should recall the assumptions andcaveats in these estimates. The uncertainty in the determinationof the population distance, together with the uncertainty in theage (∼ 5–10 Myr), are the largest contributors to the final errorin the mass of each source; we assumed an uncertainty in thedetermination of the population distance of ∼380 pc, whilst webelieve it is an upper limit for distance determination in this case.Based on this distance, the least massive candidate membershave masses of 0.05 M�. By assuming a normal IMF (using both(Chabrier 2003) and (Kroupa 2001)) we estimate the total num-ber of members as ≈ 2 500. This value should not be consideredas the definitive size of the population, but an educated guessgiven the assumptions. Still, it is similar to the statistical estimateof source counts from the control field (2345±215), suggesting,although with strong caveats, that the population might have anormal IMF.
5. Discussion
We have found a population of about 2 500 M stars (with 789candidates with high probability) that are roughly coeval and ex-tinction free and are distributed across ∼ 3 square degrees towardthe Orion Belt asterism with an age of about 10 Myr. Photome-try alone poorly constrains the distance to this population or itsline-of-sight extent. This newly identified population can be asfar as ∼ 380 pc (but in front of the Orion B cloud) or as close as250 pc. In the closer case the OBP could be the low-mass coun-terpart to the well-known Orion supergiants at distances around250 pc.
The new population, the OBP, is likely the low-mass coun-terpart of Blaauw’s Ori OB Ib subgroup. Relevant to this discus-sion, Jeffries et al. (2006) performed radial velocity observationsof low-mass stars toward a relatively large field toward σOri andfound two spatially superimposed components that are kinemat-ically separated by 7 km/s in radial velocity and with different
mean ages. These authors suggest an age of about 10 Myr forthe older component (their “group 1”), which has a mean radialvelocity of 23.8 km/s. Jeffries et al. (2006) suggested that theolder “group 1” was made by stars from the OB Ia subgroup, butthe results in this paper suggest that this second component ismost likely comprised of the stars in the Orion Belt population,or the OB Ib subgroup. Figure 2 of their paper further supportsthis statement as one can see how the field closer to the OBP(the NW field) is mostly dominated by stars belonging to the23.8 km/s group. We cross-checked our list of targets againstthe sources in Jeffries et al. (2006) and although their study iscentered on σ Ori, we found that most of the matches with theOBP belong to the older group 1; albeit this finding also matchesgroup 2, which probably suggests that our selection method isnot accurate enough to clearly separate the two different popu-lations. Overall, our results reinforce the idea that overlappingpopulations at different evolutionary states and distances coex-ist along lines of sight toward the Orion clouds, as suggested inAlves & Bouy (2012) and Bouy et al. (2014).
5.1. Is the Orion sequential star formation scenario introuble?
Blaauw’s original idea of sequential star formation calls for a starformation event being directly responsible for the genesis of thenext event. In Orion, it was proposed that the spatial-temporalsequence of events proceeded as follows (e.g., Bally 2008):
Ia (∼ 12 Myr)→ Ib (∼ 10 Myr)→ Ic (∼ 5−7 Myr)→ Id (∼ 1−3 Myr).
In recent decades, evidence has been accumulating suggestingthat this attractive scenario suffers from several shortcomings.Brown et al. (1994) found that subgroup Ib is younger than Icand, to address the problem of an obvious break in the spatial-temporal sequence, these authors argued that the sequential starformation scenario is still plausible if the Ic population hadmoved from its putative birthplace closer to the Ia population;this move has yet to be quantified. Nevertheless, if the OBP isindeed the low-mass counterpart of Ib, then the results in this pa-per are in tension with Brown et al. (1994) as we find that the ageof the OBP is similar to the canonical age of Ib (around 10 Myr),apparently solving the break in the spatial-temporal sequence.
Another problem for the sequential star formation scenariois the superposition of populations with different ages, as theydo not easily fit a star formation sequence that covers about 100pc from west to east. Evidence for such overlapping stellar pop-ulations has been accumulating in the literature (e.g., Gomez &Lada 1998; Warren & Hesser 1977; Jeffries et al. 2006; Alves& Bouy 2012; Bouy et al. 2014). For example, what event trig-gered the formation of the 1-3 Myr old σ Ori cluster, seen alongthe same line of sight as the ∼ 10 Myr old OBP? Given that theId subgroup is still forming stars and that Ia is too removed/oldto be the trigger, one faces two options in a sequential star for-mation scenario: the trigger was either a) Ib or b) Ic, a subgroupcloser to σ Ori in age but not in projection. If a) then one needsto explain the roughly 7-8 Myr delay in the formation of σ Ori.If b) one needs to explain the apparent break in spatial sequence(Ic is about 20 pc away from σ Ori in projection, so probablyin reality more). Option a) seems unlikely as Ib would have totrigger the formation of Ic to the southeast 5-7 Myr ago and theσ Ori cluster 2-3 Myrs ago toward its background, as seen fromEarth. Regarding option b), a possible solution to the break ofthe spatial-temporal sequence is to evoke that σ Ori was formed
Article number, page 7 of 13
A&A proofs: manuscript no. OBP
elsewhere. This was recently suggested, in a different contextby (Ochsendorf & Tielens 2015). In the Ochsendorf-Tielens sce-nario σ Ori was formed to the south (in galactic coordinates, seetheir Figure 1) of the Ic population and moved north toward theGS206-17+13 shell. It is hard to imagine how the feedback fromIc to the south would trigger the formation of the σ Ori clusterand cause it to move north. In summary, neither option seemssatisfactory.
5.2. The Orion blue stream scenario
Recently, Bouy & Alves (2015) suggested a new scenario for theinterpretation of the distribution of OB stars in the local neigh-borhood. In a reanalysis of the Hipparcos catalog, these authorsfound that the distribution of OB stars followed large-scale struc-tures that are well-defined and elongated, which they refer toas blue streams. The roughly constant width of the streams, to-gether with a monotonic age sequence over hundreds of parsecs,suggests that they are the outcome of a large star formation event.They describe the existence of three streams in the local 500pc neighborhood, one of these is the Orion stream, originatingat the position of the Orion clouds and extending to regions asclose to Earth as ∼ 200 pc, but likely even closer. This scenarioimposes a well-defined age sequence as it assumes that youngstars stream away from their place of birth, currently the OrionA and B molecular clouds. The further a population is from itsbirth place, the older it should be. Given the current position ofthe Sun in the Galaxy, the Orion stream appears projected alongits length for an observer on Earth, which implies that stellarpopulations at different ages and distances should appear su-perposed. Because of the particular projection effect the Orionstream, this new scenario does not require a spatial sequence,unlike Blaauw’s sequential scenario for Orion.
The new blue streams scenario appears to accommodate wellthe available observational data of the Orion star-forming regionas a whole. As discussed above, there is plenty of evidence inthe literature for superposition of populations with different agesalong the direction to the Orion clouds. For example, the OBPfits well this new view of Orion as a stream projected alongits length; a roughly 10 Myr old population is seen in projec-tion toward a significantly younger σ Ori, and an even youngerNGC2024 cluster, still embedded in the Orion B cloud. TheOBP, we argue, is closer to Earth than σ Ori and the cloud inter-acting with it via the HII region. We also argue that there is someevidence that the OBP (Ib subgroup) is closer and older thanNGC1980/NGC1981 (Ic subgroup), which is closer and olderthan the σ Ori cluster. This age and distance relation is in goodagreement with the blue streams scenario presented in Bouy &Alves (2015). Finally, the Ia subgroup and the 25 Ori cluster(e.g., Briceno 2008; Downes et al. 2014, 2015), which are notaddressed in this work, would also be part of the Orion stream.If older than the OBP, they should correspond to the nearest com-ponents of the Orion stream. But this remains to be confirmed,as the OBP could be older, hence nearer, and could be the low-mass counterpart to the well-known Orion supergiants at about250 pc from Earth.
The streams scenario provides another advantage: it does notrequire that populations move substantially from each other, asproposed in Brown et al. (1994), to solve the apparent breakin the spatial-temporal sequence in Blaauw’s scenario. In thestreams scenario, the OB subgroups should have a space motiontoward the same general direction, so a prediction of the streamsscenario is that the proper motions between subgroups shouldbe relatively small. In the streams scenario, Blaauw’s OB sub-
groups could represent different components of the same streamwith different ages and distances; these are all formed at about400 pc by clouds long gone with the exception of subgroup Id,the ONC, embedded in Orion A cloud, and NGC2024 embeddedin the Orion B cloud.
5.3. Is the OBP the future of the ONC?
Can the OBP be the evolved counterpart of an ONC-like clusterthat was formed about 10 Myrs ago or is it an altogether differenttype of object? A striking property of the OBP population is thatit is distributed over a large area of the sky and its low stellardensity is very different from other well-known stellar clusters inOrion, such as the ONC, σ, λ, or ι Ori clusters. For example, theaverage stellar surface density in the Orion nebula cluster (∼ 200stars/pc2; Hillenbrand & Hartmann (1998)) is about an order ofmagnitude higher than that of the OBP. The volume density ofstars in the core of the ONC (2 − 3 × 10⁴ stars/pc3, Hillenbrand& Hartmann (1998)) is about three orders of magnitude higherthan that of the OBP.
Remarkably, both the ONC and the OBP have a similar num-ber of stars. Assuming that the OBP is not a gravitationallybound population, and that it is expanding freely since it got ridof its parental molecular cloud early in its formation, it wouldhave taken about 5 Myr for the OBP to expand from 2 pc to7 pc radius at about 1 km/s expansion velocity, or 10 Myr for0.5 km/s velocity. These rough estimates are not implausible ac-cording to models of an ONC-type cluster expanding after gasremoval (e.g., Kroupa et al. 2001), and so the possibility thatthe OBP might represent an evolved ONC cannot be discardedwith current data. High-resolution spectroscopic observations oraccurate proper-motions measurements are needed for a morequantitative answer to this question; such measurements and ob-servations do not exist at the moment.
6. Summary
In order to find the spatial extension of the foreground stellarpopulation to the Orion A cloud found in Alves & Bouy (2012)and Bouy et al. (2014), and to investigate the relation betweenBlaauw’s OB Ic and Ib subgroups, we analyzed a circular areawith a radius of 3◦ centered on ε Orionis (HD 37128, B0Ib),covering the Orion Belt region. The main results of this investi-gation are as follows:
– We found two large stellar overdensities in the Orion Beltregion: one centered on the well-known σ-Ori cluster, anda new, richer but more extended overdensity close to ε Ori.We compared the stellar density in the surveyed region witha control field and estimated an upper limit for the size of thenew overdensity of about 2 345±215 sources.
– Optical and near-IR color-magnitude diagrams reveal a well-defined sequence above the Galactic field, which is sugges-tive of a large young stellar population that is approximatelycoeval and not affected by interstellar extinction. We used anew statistical multiband technique to select objects associ-ated with the sequence detected in the color-magnitude di-agram, and compiled a catalog of 783 probable members.Essentially, all of these objects have the colors of M stars.The selected sources are close, in projection, to ε Ori, butdistributed in a roughly elliptical region (1◦ × 3◦) showingspatial substructure.
– This new population, that we call the Orion Belt population,is likely the low-mass counter part to the Ori OB Ib sub-
Article number, page 8 of 13
K. Kubiak et al.: Orion revisited
group. We found a negligible amount of bona fide young stel-lar objects in the Orion Belt population (less than 2 % for allavailable youth tracers (XMM-Newton, KISO, and WISE sur-veys). This allows us to infer the minimum age of the clusterto be ∼ 5 Myr. We estimate an age of about ∼ 10 Myr for theOBP.
– We do not find evidence for an interaction between the se-lected members and the clouds, which together with the over-all absence of extinction suggests that the new populationlies in the foreground of Orion B. We estimate the distanceto this newly identified population to be between ∼250 and∼380 pc.
– Although our results do not rule out Blaauw’s sequential starformation scenario for Orion, we argue that the current avail-able evidence is shifting against it. We find, instead, that theblue stream scenario proposed in Bouy & Alves (2015) pro-vides a better framework on which one can explain the Orionstar formation region as a whole.
– We speculate that the Orion Belt population could representthe evolved counterpart of a Orion nebula-like cluster. Atleast high-resolution spectroscopic data would be needed tomake a more solid statement about the origin of this newlyidentified population.
Finally, although we argue that the OBP fits the blue streamscenario best, we caution that independent work is needed toconfirm the existence of the blue streams. Nevertheless, givingthe tantalizing proximity and youth of the new stellar populationpresented in this work, there is a need for a dedicated spectraland dynamic characterization of the OBP. This population couldbecome a benchmark region for future searches of brown dwarfsand planetary mass objects and the low-mass end of the IMF,as well circumstellar disk evolution and planet formation. Thefinal ESA Gaia catalog, to be released around 2023, will includemuch if not all of the OBP candidates presented in this work,and will be able to shed much light on the origin of the OBP, theexistence and role of the Orion blue dtream, and star formationin Orion.
Appendix A: final catalog
Table A.1 provides the photometric data for the candidate mem-bers of the Orion Belt population; it contains the name of eachstar, right ascension and declination, girz and JHKs band magni-tudes from the SDSS and 2MASS catalogs with their associateduncertainties. This table is available in its entirety in a machine-readable form in the online journal. A portion is shown here forguidance regarding its form and content.Acknowledgements. J. Alves acknowledges travel support from the ESAC Fac-ulty council. H. Bouy is funded by the Ramón y Cajal fellowship program num-ber RYC-2009-04497. This research has made use of the VizieR catalog accesstool, CDS, Strasbourg, France. The original description of the VizieR servicewas published in Ochsenbein et al. (2000). This research has made use of "Al-adin Sky atlas" developed at CDS, Strasbourg Observatory, France Bonnarelet al. (2005) and Boch & Fernique (2014). This research has made use of Topcat(http://www.starlink.ac.uk/topcat/, Taylor 2005). This research madeuse of Astropy, a community-developed core Python package for Astronomy(Astropy Collaboration et al. 2013).
ReferencesAhn, C. P., Alexandroff, R., Allende Prieto, C., et al. 2014, ApJS, 211, 17Allen, L. E. & Davis, C. J. 2008, Low Mass Star Formation in the Lynds 1641
Molecular Cloud, ed. B. Reipurth, 621Alves, J. & Bouy, H. 2012, A&A, 547, A97
Astropy Collaboration, Robitaille, T. P., Tollerud, E. J., et al. 2013, A&A, 558,A33
Bally, J. 2008, Handbook of Star Forming Regions, Volume I: The Northern SkyASP Monograph Publications, Edited by Bo Reipurth, 4, 459
Blaauw, A. 1964, ARA&A, 2, 213Boch, T. & Fernique, P. 2014, Astronomical Data Analysis Software and Sys-
tems XXIII. Proceedings of a meeting held 29 September - 3 October 2013 atWaikoloa Beach Marriott, Hawaii, USA. Edited by N. Manset and P. ForshayASP conference series, 485, 277
Bonnarel, F., Fernique, P., Bienayme, O., et al. 2005, Astronomy and Astro-physics Supplement, 143, 33
Bouy, H. & Alves, J. 2015, A&A, 584, A26Bouy, H., Alves, J., Bertin, E., Sarro, L. M., & Barrado, D. 2014, A&A, 564,
A29Briceno, C. 2008, Handbook of Star Forming Regions, Volume I: The Northern
Sky, 4, 838Brown, A. G. A., de Geus, E. J., & de Zeeuw, P. T. 1994, A&A, 289, 101Caballero, J. A. 2007, Astronomische Nachrichten, 328, 917Caballero, J. A. 2008, MNRAS, 383, 750Caballero, J. A. & Solano, E. 2008, A&A, 485, 931Cardelli, J. A., Clayton, G. C., & Mathis, J. S. 1989, ApJ, 345, 245Chabrier, G. 2003, PASP, 115, 763Collinder, P. 1930, Annals of the Observatory of Lund, 2, B1Covey, K. R., Ivezic, Ž., Schlegel, D., et al. 2007, AJ, 134, 2398Cutri, R. M., Wright, E. L., Conrow, T., et al. 2013, VizieR Online Data Catalog,
2328, 0Da Rio, N., Robberto, M., Soderblom, D. R., et al. 2010, ApJ, 722, 1092de Geus, E. J., Lub, J., & van de Grift, E. 1990, A&AS, 85, 915Downes, J. J., Briceño, C., Mateu, C., et al. 2014, MNRAS, 444, 1793Downes, J. J., Román-Zúñiga, C., Ballesteros-Paredes, J., et al. 2015, MNRAS,
450, 3490Elmegreen, B. G. & Lada, C. J. 1977, ApJ, 214, 725Gieseking, F. 1983, A&A, 118, 102Gomez, M. & Lada, C. J. 1998, AJ, 115, 1524Guetter, H. H. 1981, AJ, 86, 1057Gutermuth, R. A., Megeath, S. T., Myers, P. C., et al. 2009, ApJS, 184, 18Hardie, R. H., Heiser, A. M., & Tolbert, C. R. 1964, ApJ, 140, 1472Hernández, J., Hartmann, L., Megeath, T., et al. 2007, ApJ, 662, 1067Hillenbrand, L. A. & Hartmann, L. W. 1998, ApJ, 492, 540Hirota, T., Bushimata, T., Choi, Y. K., et al. 2007, PASJ, 59, 897Jeffries, R. D., Maxted, P. F. L., Oliveira, J. M., & Naylor, T. 2006, MNRAS,
371, L6Kroupa, P. 2001, MNRAS, 322, 231Kroupa, P., Aarseth, S., & Hurley, J. 2001, MNRAS, 321, 699Lada, E. A., Depoy, D. L., Evans, II, N. J., & Gatley, I. 1991, ApJ, 371, 171Lombardi, M., Alves, J., & Lada, C. J. 2011, A&A, 535, A16Mayne, N. J., Naylor, T., Littlefair, S. P., Saunders, E. S., & Jeffries, R. D. 2008,
Monthly Notices of the Royal Astronomical Society, 375, 1220Megeath, S. T., Gutermuth, R., Muzerolle, J., et al. 2012, AJ, 144, 192Meingast, S., Alves, J., Mardones, D., et al. 2016, A&A, 587, A153Menten, K. M., Reid, M. J., Forbrich, J., & Brunthaler, A. 2007, A&A, 474, 515Meyer, M. R., Flaherty, K., Levine, J. L., et al. 2008, Star Formation in NGC
2023, NGC 2024, and Southern L1630, ed. B. Reipurth, 662Muench, A., Getman, K., Hillenbrand, L., & Preibisch, T. 2008, Handbook of
Star Forming Regions, Volume I: The Northern Sky, 4, 483Ochsenbein, F., Bauer, P., & Marcout, J. 2000, A&AS, 143, 23Ochsendorf, B. B. & Tielens, A. G. G. M. 2015, A&A, 576, A2Planck Collaboration, Ade, P. A. R., Aghanim, N., et al. 2014, A&A, 571, A1Ribas, Á., Bouy, H., & Merín, B. 2015, A&A, 576, A52Sandstrom, K. M., Peek, J. E. G., Bower, G. C., Bolatto, A. D., & Plambeck,
R. L. 2007, ApJ, 667, 1161Sarro, L. M., Bouy, H., Berihuete, A., et al. 2014, A&A, 563, A45Skrutskie, M. F., Cutri, R. M., Stiening, R., et al. 2006, AJ, 131, 1163Spezzi, L., Petr-Gotzens, M. G., Alcalá, J. M., et al. 2015, A&A, 581, A140Straižys, V. & Lazauskaite, R. 2009, Baltic Astronomy, 18, 19Tauber, J. A., Mandolesi, N., Puget, J.-L., et al. 2010, A&A, 520, A1Taylor, M. B. 2005, in Astronomical Society of the Pacific Conference Se-
ries, Vol. 347, Astronomical Data Analysis Software and Systems XIV, ed.P. Shopbell, M. Britton, & R. Ebert, 29
Walter, F. M., Wolk, S. J., Freyberg, M., & Schmitt, J. H. M. M. 1997,Mem. Soc. Astron. Italiana, 68, 1081
Warren, Jr., W. H. & Hesser, J. E. 1977, ApJS, 34, 115Warren, Jr., W. H. & Hesser, J. E. 1978, ApJS, 36, 497Watson, M. G., Schröder, A. C., Fyfe, D., et al. 2009, A&A, 493, 339Wiramihardja, S. D., Kogure, T., Yoshida, S., Ogura, K., & Nakano, M. 1994,
VizieR Online Data Catalog, 3177, 0
Article number, page 10 of 13
K. Kubiak et al.: Orion revisited
Fig. 3: Science (blue) and control (red) fields plotted over the NICER dust extinction map by Lombardi et al. (2011). Greenrepresents the coverage of SDSS catalog. We note the areas without data, in particular around the Orion Belt bright stars.
0 1 2 3 4 5i-K [mag]
14
15
16
17
18
19
i [mag
]
Science Field
100
101
0 1 2 3 4 5i-K [mag]
14
15
16
17
18
19
i [mag
]
Control Field
100
101
Fig. 5: (i, i−Ks) color-magnitude diagrams for all objects with 2MASS Ks and SDSS i-band photometry. Left: sources in a 3◦ radiusregion centered on the B0 Ib star, ε Orionis (the central star of Orion’s Belt). Right: sources in the CF. The green ellipse plotted ineach panel indicates the approximate position of the sequence in the science field.
Article number, page 11 of 13
A&A proofs: manuscript no. OBP
0.3
0.6
0.9
1.2
1.5
1.8
2.1
r-i
0.2
0.4
0.6
0.8
1.0
1.2
1.4
i-z
0.8
1.0
1.2
1.4
1.6
1.8
z-J
0.15
0.30
0.45
0.60
0.75
0.90
1.05
J-H
0.15
0.00
0.15
0.30
0.45
0.60
0.75
H-K
0.25 0.50 0.75 1.00 1.25 1.50 1.75
g-r0.0
0.2
0.4
0.6
0.8
1.0
1.2
1.4
J-K
0.3 0.6 0.9 1.2 1.5 1.8 2.1
r-i0.2 0.4 0.6 0.8 1.0 1.2 1.4
i-z0.8 1.0 1.2 1.4 1.6 1.8
z-J0.150.300.450.600.750.90 1.05
J-H0.15 0.00 0.15 0.30 0.45 0.60 0.75
H-K
Fig. 7: SDSS/2MASS color-color summarizing the photometric properties of the selected candidates (blue dots) compared to fieldsources (black dots). The color-color space of the selected sample coincides with that of unreddened M dwarfs. Also shown for eachcolor-color space are the reddening vector for AV=1 mag (black solid line) (Cardelli et al. 1989) and the main sequence (red dashedline) from Covey et al. (2007).
Article number, page 12 of 13
K. Kubiak et al.: Orion revisited
0.0 0.5 1.0 1.5 2.0 2.5 3.0r-i [mag]
12
14
16
18
20
22
24
r [m
ag]
Orion's Belt Populationσ Ori Cluster
0.0 0.5 1.0 1.5 2.0 2.5 3.0r-i [mag]
12
14
16
18
20
22
24
r [m
ag]
Orion's Belt PopulationNGC 1980
Fig. 10: The r vs. r − i color magnitude diagram for the OPB (blue circles) and σ Orionis (orange circles) or NGC 1980 members(violet circles).