ORPS trends 2004–2009: What’s important now? • Annual and Quarterly Trends by Frequency and Significance • Reporting Criteria • Patterns of Causal Attribution. • Facility, Activity, ISM and QA Code • Take-Aways to Consider
Transcript
ORPS trends 2004–2009: What’s important now?
• Annual and Quarterly Trends by Frequency and Significance
• Reporting Criteria• Patterns of Causal Attribution.• Facility, Activity, ISM and QA Code• Take-Aways to Consider
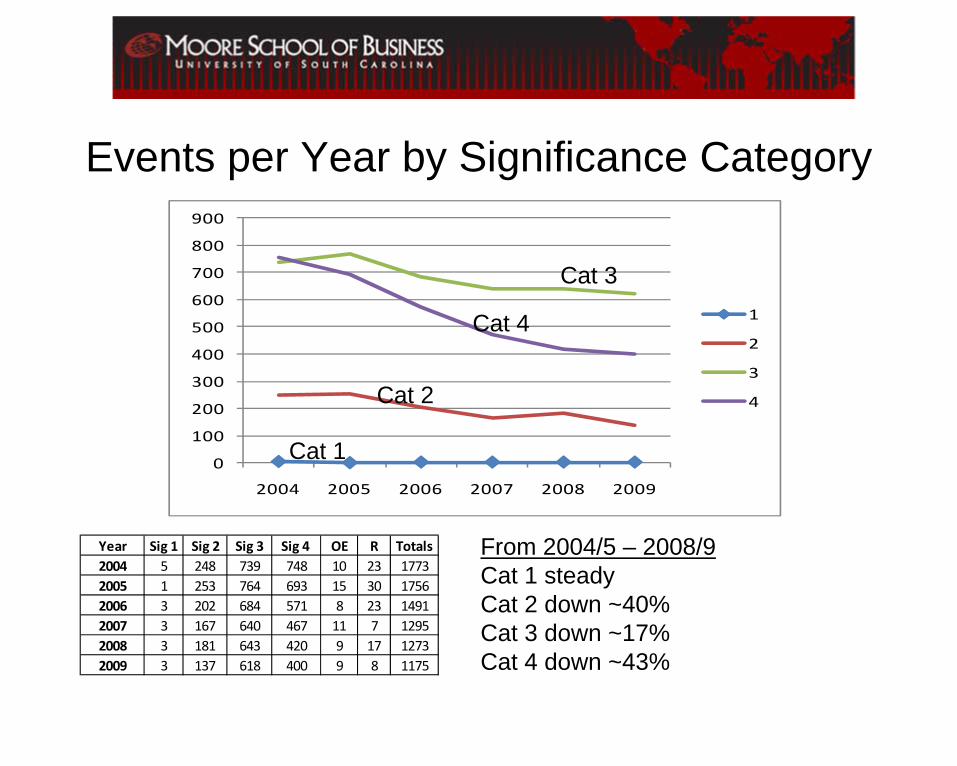
Events per Year by Significance Category
0
100
200
300
400
500
600
700
800
900
2004 2005 2006 2007 2008 2009
1
2
3
4
From 2004/5 – 2008/9Cat 1 steadyCat 2 down ~40%Cat 3 down ~17%Cat 4 down ~43%
Year Sig 1 Sig 2 Sig 3 Sig 4 OE R Totals2004 5 248 739 748 10 23 17732005 1 253 764 693 15 30 17562006 3 202 684 571 8 23 14912007 3 167 640 467 11 7 12952008 3 181 643 420 9 17 12732009 3 137 618 400 9 8 1175
Cat 1
Cat 2
Cat 4
Cat 3
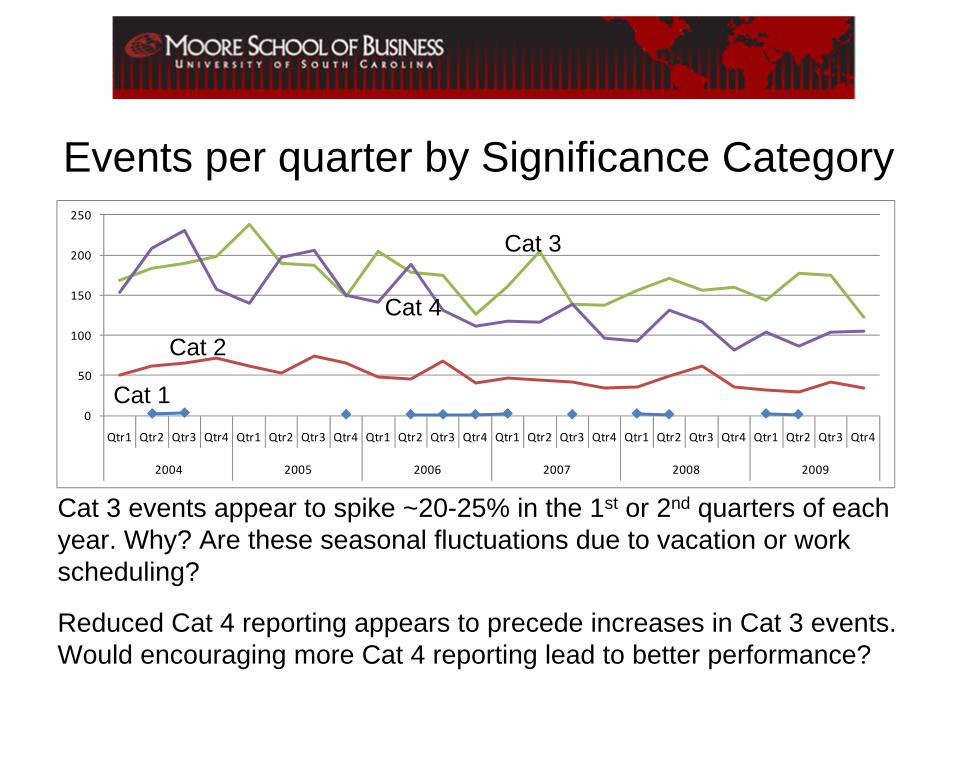
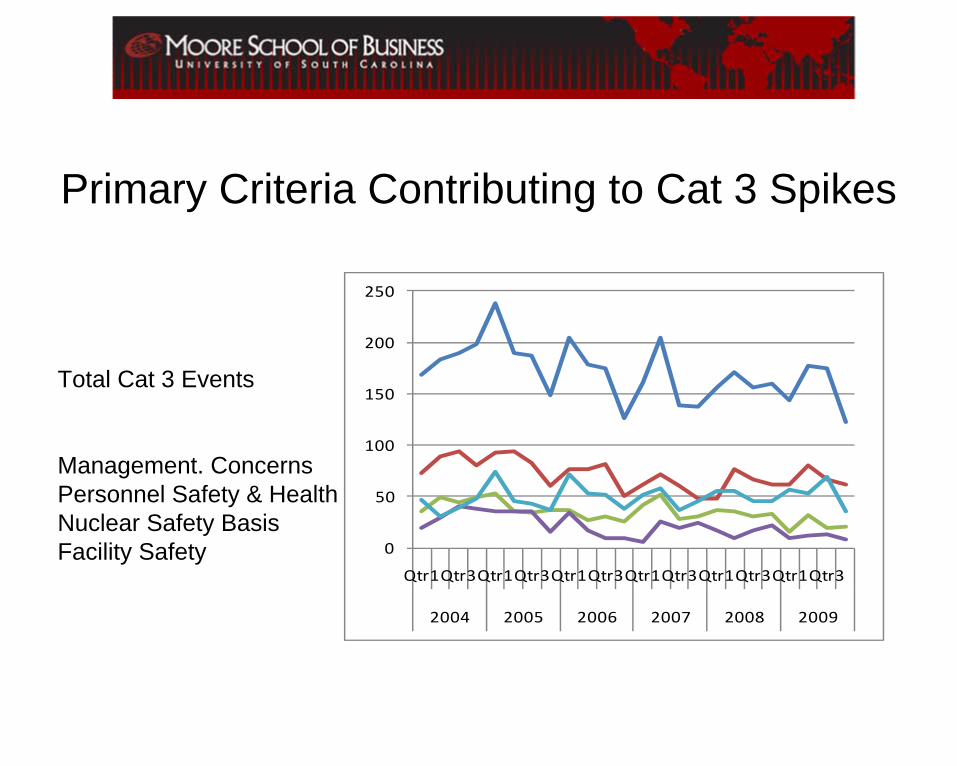
Events per quarter by Significance Category
Cat 3 events appear to spike ~20-25% in the 1st or 2nd quarters of each year. Why? Are these seasonal fluctuations due to vacation or work scheduling?
Reduced Cat 4 reporting appears to precede increases in Cat 3 events. Would encouraging more Cat 4 reporting lead to better performance?
Frequency and Significance: Take-Aways• Cat levels 3 and 4 may have seasonal spikes. Are they
related? Why? Are they simply artifacts of population with vacation and work scheduling? Should we adjust our management focus seasonally?
• Although overall trends are down, it appears that decreases Cat 4 event reporting, may be precursors to increases in Cat 3 events. The criteria for Cat 4 events are soft, making reporting somewhat optional. Would encouraging more Cat 4 reporting lead to improved performance?
• Now let’s look at Reporting Criteria (event types).
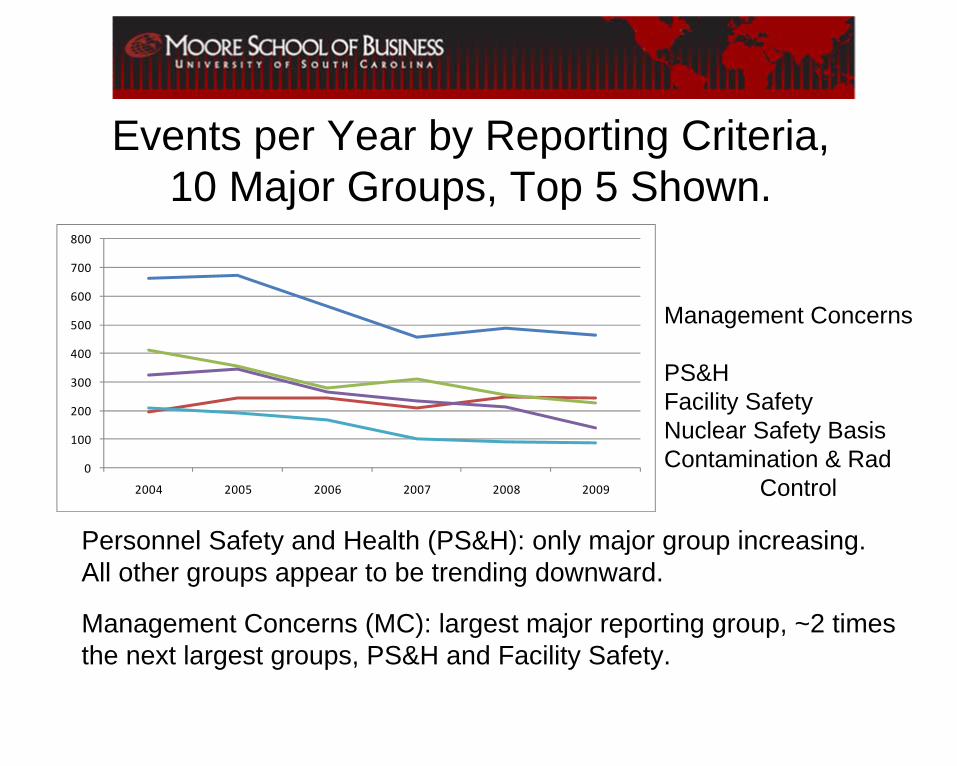
Events per Year by Reporting Criteria, 10 Major Groups, Top 5 Shown.
Personnel Safety and Health (PS&H): only major group increasing.All other groups appear to be trending downward.
Management Concerns (MC): largest major reporting group, ~2 times the next largest groups, PS&H and Facility Safety.
0
100
200
300
400
500
600
700
800
2004 2005 2006 2007 2008 2009
Management Concerns
PS&HFacility SafetyNuclear Safety BasisContamination & Rad
Control
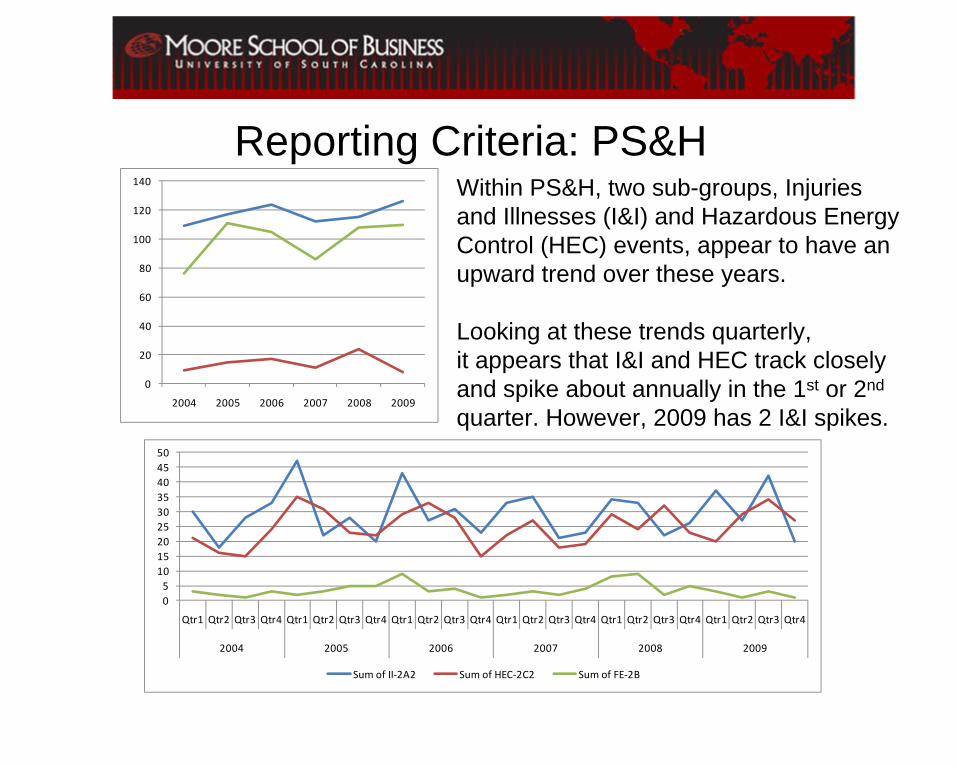
Reporting Criteria: PS&HWithin PS&H, two sub-groups, Injuries and Illnesses (I&I) and Hazardous Energy Control (HEC) events, appear to have an upward trend over these years.
Looking at these trends quarterly, it appears that I&I and HEC track closely and spike about annually in the 1st or 2nd
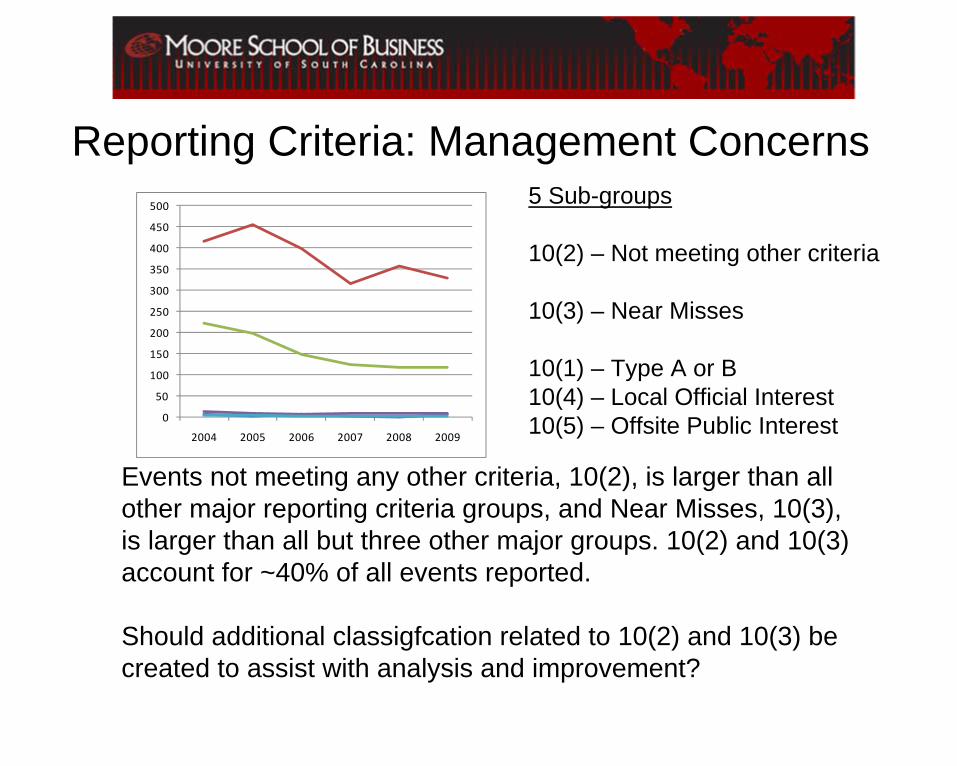
Events not meeting any other criteria, 10(2), is larger than all other major reporting criteria groups, and Near Misses, 10(3), is larger than all but three other major groups. 10(2) and 10(3) account for ~40% of all events reported.
Should additional classigfcation related to 10(2) and 10(3) be created to assist with analysis and improvement?
5 Sub-groups
10(2) – Not meeting other criteria
10(3) – Near Misses
10(1) – Type A or B10(4) – Local Official Interest10(5) – Offsite Public Interest0
50
100
150
200
250
300
350
400
450
500
2004 2005 2006 2007 2008 2009
Reporting Criteria: Take-Aways
• Why are I&I and HEC events trending upward? Why do they track together, and why do 50%- 100% spikes seem to occur in the 1st or 2nd
quarters of each year?• Management concerns is the largest reporting
group, by far, and most MC events don’t fit other reporting criteria. Do the criteria need to be amended to aid in analysis and improvement?
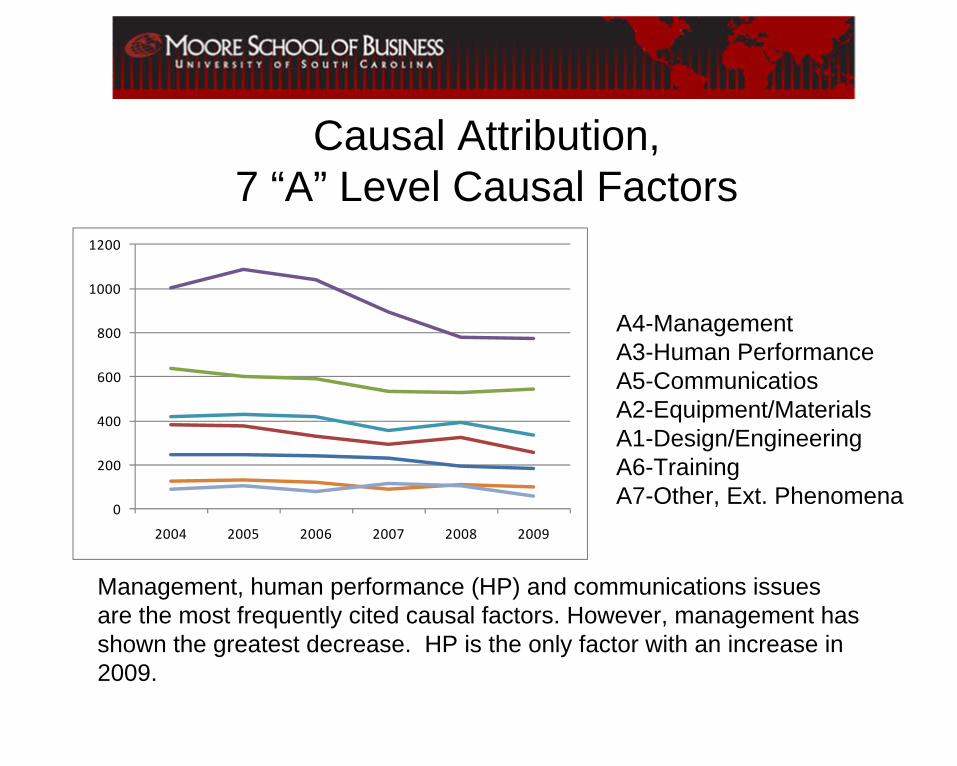
Management, human performance (HP) and communications issues are the most frequently cited causal factors. However, management has shown the greatest decrease. HP is the only factor with an increase in 2009.
0
200
400
600
800
1000
1200
2004 2005 2006 2007 2008 2009
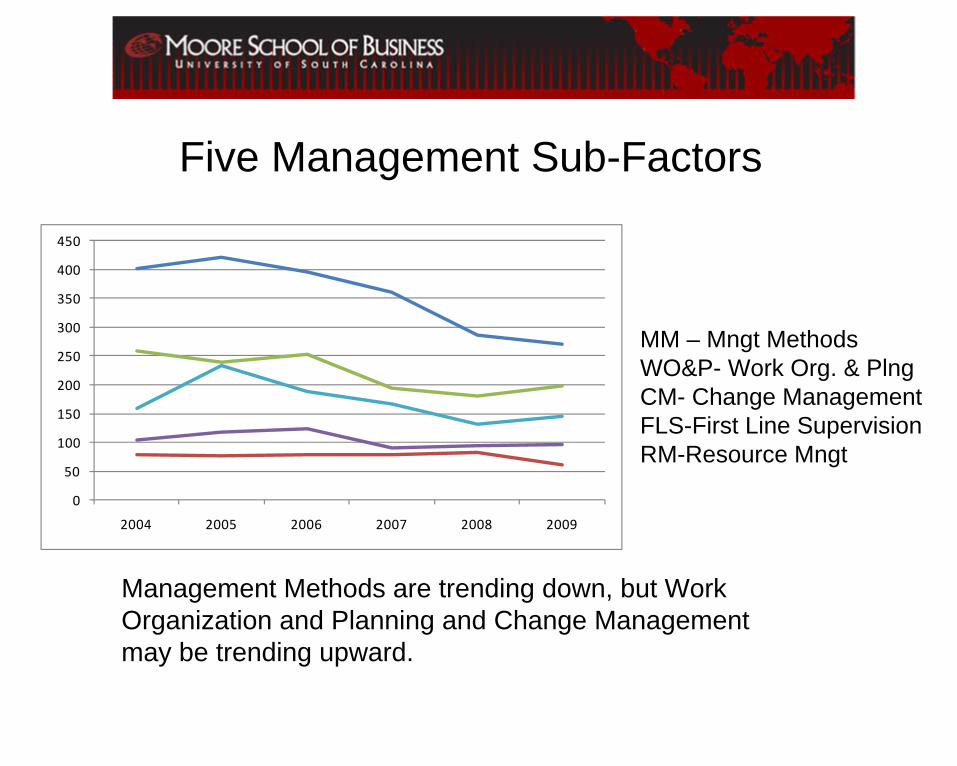
Five Management Sub-Factors
Management Methods are trending down, but Work Organization and Planning and Change Management may be trending upward.
MM – Mngt MethodsWO&P- Work Org. & PlngCM- Change ManagementFLS-First Line SupervisionRM-Resource Mngt
0
50
100
150
200
250
300
350
400
450
2004 2005 2006 2007 2008 2009
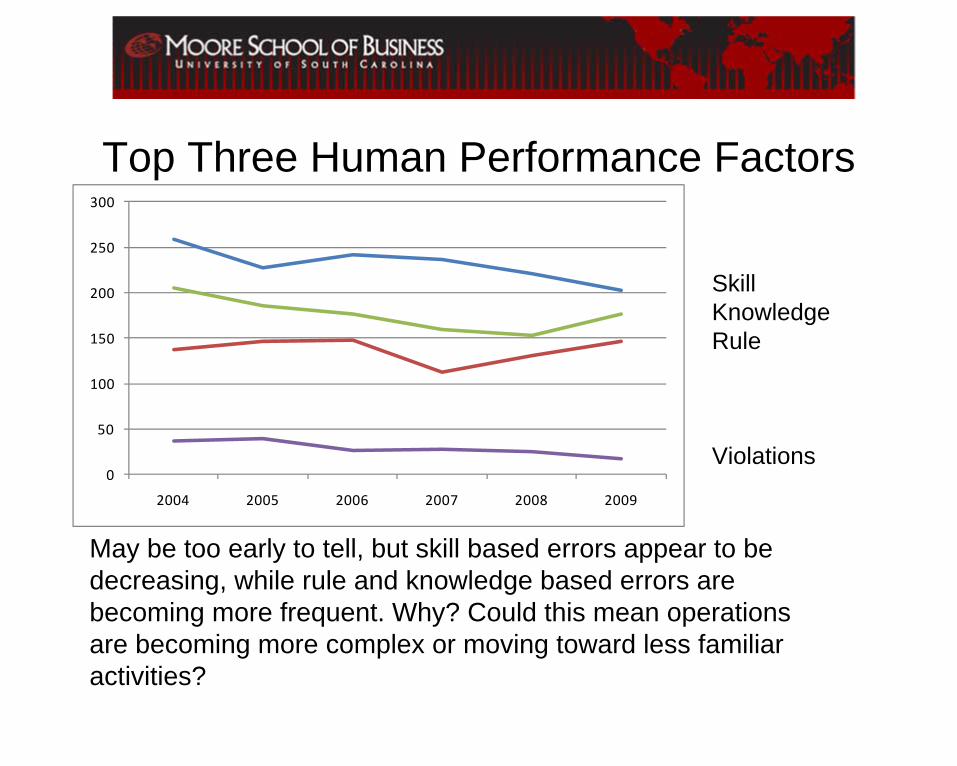
Top Three Human Performance Factors
May be too early to tell, but skill based errors appear to be decreasing, while rule and knowledge based errors are becoming more frequent. Why? Could this mean operations are becoming more complex or moving toward less familiar activities?
0
50
100
150
200
250
300
2004 2005 2006 2007 2008 2009
SkillKnowledgeRule
Violations
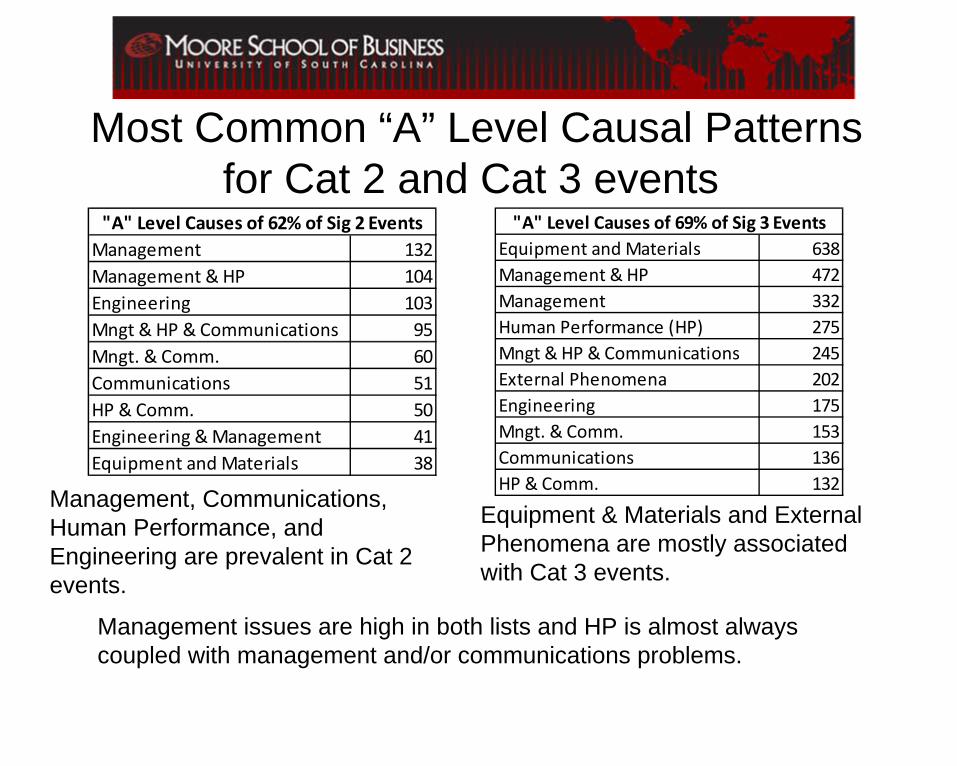
Most Common “A” Level Causal Patterns for Cat 2 and Cat 3 events
Management 132Management & HP 104Engineering 103Mngt & HP & Communications 95Mngt. & Comm. 60Communications 51HP & Comm. 50Engineering & Management 41Equipment and Materials 38
"A" Level Causes of 62% of Sig 2 EventsEquipment and Materials 638Management & HP 472Management 332Human Performance (HP) 275Mngt & HP & Communications 245External Phenomena 202Engineering 175Mngt. & Comm. 153Communications 136HP & Comm. 132
"A" Level Causes of 69% of Sig 3 Events
Equipment & Materials and External Phenomena are mostly associated with Cat 3 events.
Management, Communications, Human Performance, and Engineering are prevalent in Cat 2 events.
Management issues are high in both lists and HP is almost always coupled with management and/or communications problems.
Causal Attribution: Take-Aways• Management is still the dominant causal factor in events,
but overall management issues are trending down. Work Organization and Planning and Change Management increased in 2009. Why?
• HP is the 2nd most cited causal factor, and showed a slight in crease in 2009 driven by increases in knowledge and rule based errors. HP issues are almost always coupled with management and/or communications issues (antecedents?). Should we explore these couplings further? Should we focus more on antecedent improvement, as a means of improving HP?
• Now, annual trends by Facility, Activity, ISM and QA codes.
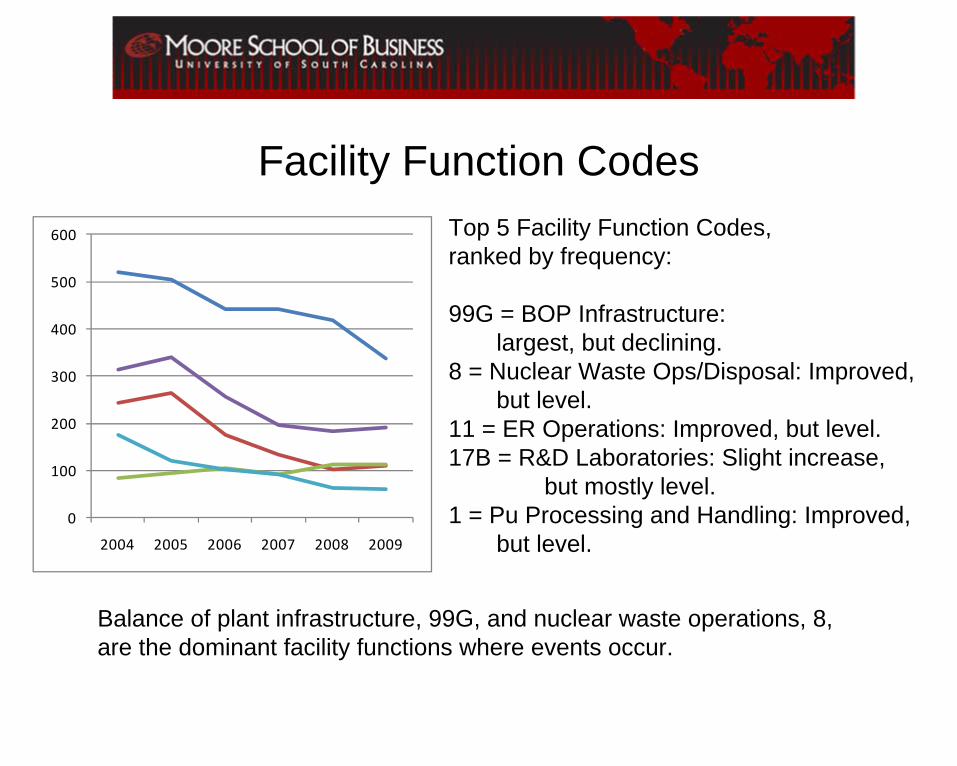
Facility Function CodesTop 5 Facility Function Codes, ranked by frequency:
11 = ER Operations: Improved, but level.17B = R&D Laboratories: Slight increase,
but mostly level.1 = Pu Processing and Handling: Improved,
but level.
Balance of plant infrastructure, 99G, and nuclear waste operations, 8, are the dominant facility functions where events occur.
0
100
200
300
400
500
600
2004 2005 2006 2007 2008 2009
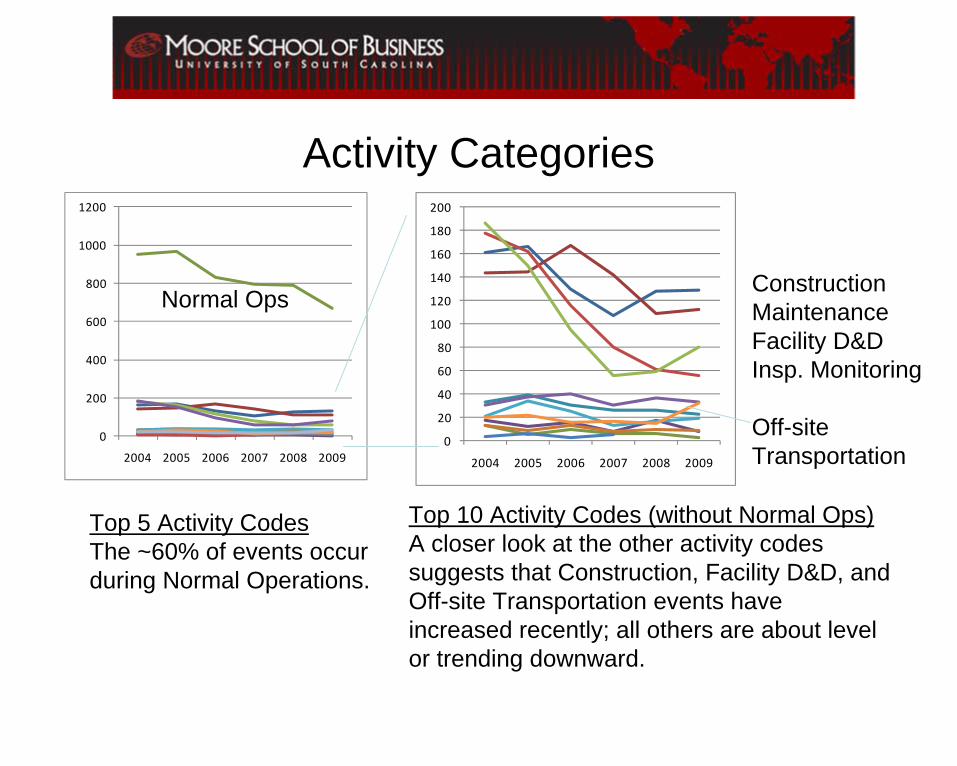
Activity Categories
Top 5 Activity CodesThe ~60% of events occur during Normal Operations.
Top 10 Activity Codes (without Normal Ops)A closer look at the other activity codes suggests that Construction, Facility D&D, and Off-site Transportation events have increased recently; all others are about level or trending downward.
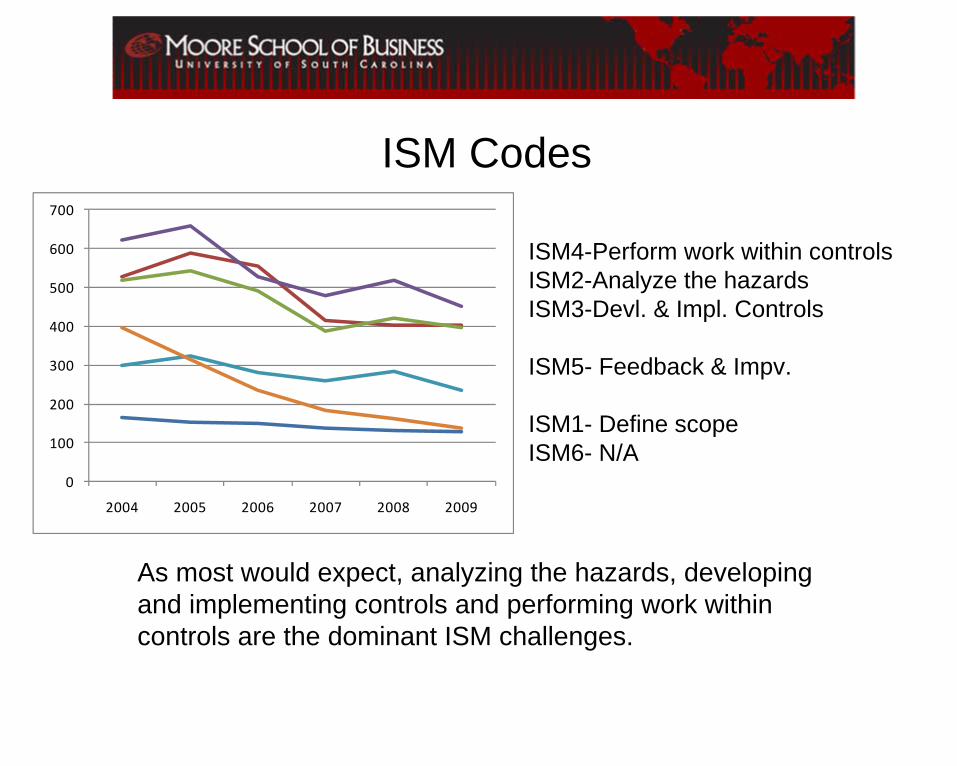
ISM4-Perform work within controlsISM2-Analyze the hazardsISM3-Devl. & Impl. Controls
ISM5- Feedback & Impv.
ISM1- Define scopeISM6- N/A
As most would expect, analyzing the hazards, developing and implementing controls and performing work within controls are the dominant ISM challenges.
0
100
200
300
400
500
600
700
2004 2005 2006 2007 2008 2009
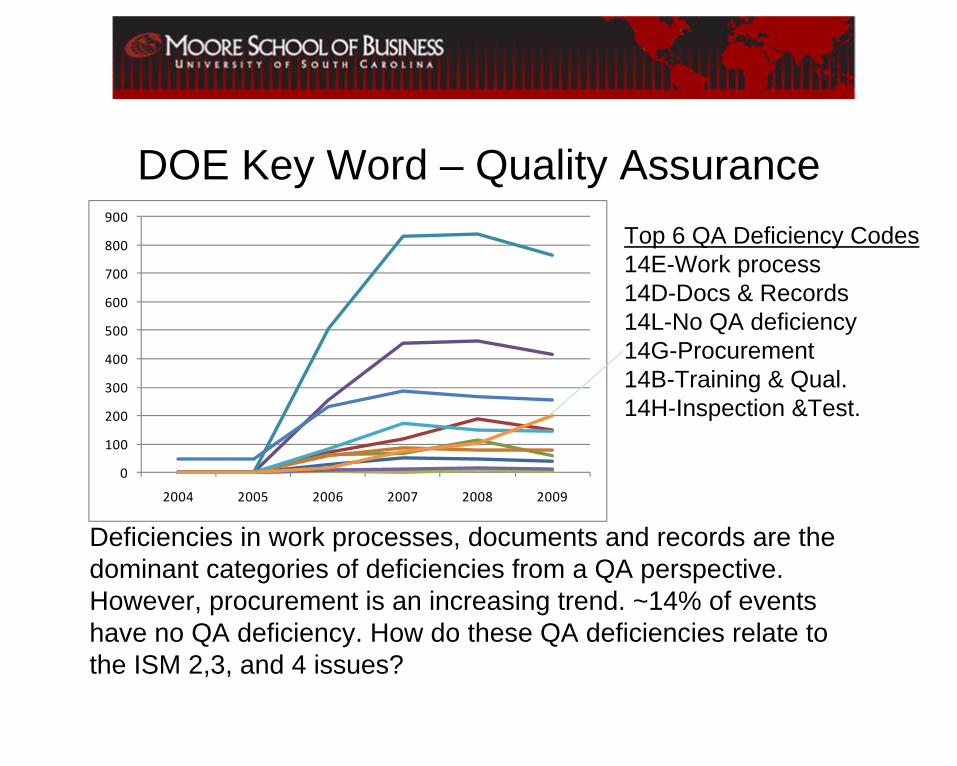
DOE Key Word – Quality AssuranceTop 6 QA Deficiency Codes14E-Work process 14D-Docs & Records14L-No QA deficiency14G-Procurement14B-Training & Qual.14H-Inspection &Test.
Deficiencies in work processes, documents and records are the dominant categories of deficiencies from a QA perspective. However, procurement is an increasing trend. ~14% of events have no QA deficiency. How do these QA deficiencies relate to the ISM 2,3, and 4 issues?
0
100
200
300
400
500
600
700
800
900
2004 2005 2006 2007 2008 2009
Facility, Activity, ISM and QA Take-Aways
• The highest percentages of events occur during normal operations in BOP infrastructure and nuclear waste operations/disposal facilities, but trends show improvement. However, events related to Construction, Facility D&D, and Off-site transportation activities appear to have increased recently.
• ISM2, 3, 4 issues and QA deficiencies in work processes, documents and records may be related and may warrant attention, as well as the upward trend in QA deficiencies with procurement.
• Recap.
Recap: So what’s important now? 5 Primary Take-Aways
1. Why do we have seasonal spikes, 20-25% overall , 50- 100% in I&I and HEC, in the 1st and 2nd quarters. Why are I&I and HEC events trending up?
2. How do decreases in Cat 4 event reporting relate to increases in Cat 3 events one quarter later? Should we be encouraging more Cat 4 reporting?
3. Can we improve ORPS analysis with better characterization of the ~40% of all events classified as “not meeting any other criteria” and “near misses?”
So what’s important now? 4. HP causal factors show a slight increase, driven by
increases in knowledge and rule based errors. Management and communications issues are the driving antecedents. Though overall management issues are trending downward, Management issues with Work Organization and Planning and Change Management are trending upward. QA deficiencies in work processes, documentation and records are major challenges. Should HPI focus more on antecedent improvement in these areas?
5. 45 % of all events occur in BOP-Infrastructure and Nuclear Waste Operations/Disposal facilities. Should these facilities receive more attention?