25
arson oc·-List Frame --~ - _, u_" ----- ---. Estima Duplic Orrin Mus· James w~
arson
oc·-List Frame
--~ - _, u_" --------.
EstimaDuplic
Orrin Mus·James w~
ESTIMA TING LIST FRAME DUPLICATION, by Orrin Musser, Survey Quality ResearchSection, Survey Research Branch and James W. Mergerson, Technology Research Section,Survey Technology Branch, Research Division, National Agricultural Statistics Service, U.S.Department of Agriculture, Washington, DC 20250-2000, January 1994, Report No. SRB-94-01.
ABSTRACT
Duplication in a survey organization's list sampling frame is potentially a very serious problem.Differences between the National Agricultural Statistics Service's multiple frame and area framedirect expansions may be due in part to duplication of list population elements. Maintaining alarge list without any duplication is not feasible since the necessary resolution and maintenanceefforts are prohibitive in terms of time and cost. However, it is essential that duplication bemeasured, monitored and minimized over time.
This paper presents a methodology for measuring the percent of duplication present within 1992list sampling frames in two States (North Carolina and Ohio). Based on four possible linkagevariables (Social Security number, Employer Identification number, telephone number andlinkage cross reference number) sample level records were compared to list sampling framerecords to determine linkage groups. Each linkage group was resolved to detennine the numberof duplicate records associated with each sampled record. These counts were used to determineestimates of the percent of duplication present in 1992 list sampling frames in the two States.The estimated percentages of duplication were very low. The estimates of the percent ofduplication among all records classified for the Agricultural Survey were less than 0.5 percentin both North Carolina and Ohio.
KEY WORDS
Record linkage; Data adjustment factor; Duplication check; Survey.
This paper was prepared for limited distribution to the research community outside theU.S. Department of Agriculture. The views expressed herein are not necessarily those ofNASS or USDA.
ACKNOWLEDGE:MENTS
The authors would like to thank the North Carolina and Ohio State Statistical offices for theirsupport of this project. A special thanks goes to Carol House for her review of the report, andto Jeanne McCarthy-Kersey and Rex Patterson of the List Frame Section for their assistance inreviewing and resolving linkage groups. Thanks to management (Ron Bosecker,George Hanuschak, Jim Davies, Roberta Pense, and Dale Atkinson) for their support of thisproject.
TABLE OF CONTENTS
SUMMARY iii
INTRODUCTION 1
BACKGROUND 1
Duplication Control at NASS 1
The NASS Duplication Check Process 2
Strategies for Estimation in the Presence of Duplication 3
The NASS Solution: A Dual Approach to Deal with Duplication in Stratified Designs . 4
METHODS AND RESULTS 5
CONCLUSIONS AND RECOMMENDATIONS 13
REFERENCES 17
APPENDIX A - Dl'PLICATION PROPORTION ESTIMATOR 18
APPENDIX B - DERIVATION OF OUR ESTIMATOR OF LIST DUPLICATION 19
APPENDIX C - UNBIASED ESTIMATION USING DATA ADJUSTMENT 20
11
SUMMARY
The focus of this project was evaluating duplication on the NASS List Sampling Frame, and thecurrent Agency process to deal with it. More specifically, the goals of this project included:
• Developing a methodology for the estimation of duplication, and applying it intwo States, North Carolina and Ohio.
• Assessing the effectiveness of current duplication handling, and its impact onsurvey indications.
• Assessing the impact of incorrect duplication handling on surveyindications.
• Better understanding the causes of duplication, and suggesting strategies to avoidduplication.
• Suggesting improvements in the current duplication checking procedures.
Each spring, after all major survey list samples have been drawn for the year, each StateStatistical Office (SSO) receives a listing of potential duplicate record groups, commonlyreferred to as the duplication check printout. SSO staff attempt to resolve these groups anddetermine correct survey action to adjust for duplication, when found.
Shortly after the 1992 June Agricultural Survey, a team of two persons went to each of the twoState Offices chosen for this study (North Carolina and Ohio). These teams performed athorough review of the State's duplication check decisions and actions using various availableresources. These resources included State office staff, notes from the State office copy of theduplication check printout, June Agricultural Survey data listings, the real-time mail andmaintenance system and telephone calls to the farm operator. Questionnaires were also checkedfor correct coding.
For each potential duplicate group, the following were recorded:
• Number of records linked to each sampled record. This provided data necessaryto obtain estimates of list duplication percentages.
• Correct survey codings for each sampled record. These were compared to theactual survey codings in the four quarters of the Agricultural Survey to assessthe effectiveness of the State's duplication resolution process over an entiresurvey cycle.
• Reasons for duplication and other comments to give some insights which couldimprove the current process of list frame maintenance and duplication resolution.
1ll
Estimates of the percentage of duplication among all records classified for the AgriculturalSurvey are 0.21 percent (with a standard error of 0.06 percent) in North Carolina and0.19 percent (with a standard error of 0.04 percent) in Ohio. These percentages are based onduplication found only through the duplication check record linkage program which performsrecord linkage by exact matching on Social Security number, Employer Identification number,telephone number, and link cross reference number. Since some of the records classified inthese States have no possibility of matching, some duplication may not be detected. Adjustedestimates of the percentage of duplication based on the proportion of conforming pairs of recordsamong all pairwise comparisons of records are presented However, the adjustment procedureassumes that records with and without the requisite matching data are equally likely to beduplicates.
A more thorough record linkage using additional variables would be helpful in improving ourestimates of the true percentage of duplication. The Survey Technology Branch is currentlyevaluating a DOS version of a record linkage system which shows much promise in providingefficient and thorough matching. The acquisition and implementation of such a product couldpotentially provide more efficiency in the duplication check process.
An extremely important aspect of duplication handling is the correct coding of the questionnaire.When the SSO list frame statistician determines that duplication exists, comments which providedetailed coding instructions are usually posted to the list frame. These comments are thenprinted and attached to the questionnaire at survey time, and must be entered correctly for theduplication adjustment process to work. These codings were checked in each of the quarterlysurveys to gauge how well the system works over the entire Agricultural Survey cycle. Theresults of this quality check indicated that there is room for improvement in this follow throughprocess. System changes are recommended to improve the process and catch errors duringsurvey edits.
To measure the effects of duplication on survey indications, we summarized data for severalimportant variables from the June Agricultural Survey under two scenarios. In the first "worstcase scenario," we assumed that none of the duplication found on the frame had been detected.If data were collected for only one of several sampled records in a linkage group, those datawere copied to the other records, and the data adjustment factors were set to one. If data werenot collected at all for a sampled record (due to duplication with a record in a higher stratumthat was not sampled) then we imputed stratum means for that record. In the second "best casescenario," we took the opposite approach and assumed that the duplication resolution and surveyaction had been performed "correctly," and compared survey indications to those obtained in theactual survey. In both cases, the effect on survey indications was small, due to the lowduplication rates.
IV
INTRODUCTION
The Agricultural Survey Program is a yearly cycle of surveys conducted by The NationalAgricultural Statistics Service (NASS) to provide inventory and production estimates for variousagricultural commodities. This program includes the Quarterly Agricultural Surveys whichprovide estimates for crop production, grain stocks, and hog inventories. The target populationfor these surveys is the U.S. population of farms, defined as all establishments that sold orwould normally have sold more than $1,000 of agricultural products during the year. Thesesurveys use a multiple frame sampling design with a list frame of farms and farm operators, anda supplemental area frame of all land in the U. S. The list frame provides very cost efficientsampling, and good coverage of medium and large farms. The area frame provides completecoverage of all farms and also a measure of the incompleteness of the list.
NASS devotes considerable resources in its SSO's to maintain the list frame. Because the listframe provides more efficient sampling than the area frame for most commodities, there is astrong Agency commitment to maintain current and accurate control data and to increase listcoverage. SSO's update the list frame on an ongoing basis, and attempt to find agricultural listsand other sources of farm operations for list building. This activity has the potential to addduplication to the list frame, which can be a serious problem for survey estimation.
Motivation for this project came from observations by some Agency statisticians that multipleframe survey indications for some commodities in some States have historically been higher thanthose obtained solely from the area frame samples. One possible explanation for the observedlevel differences is undetected duplication in the list frame. The purpose of this research studywas to develop methodology to estimate the percentage of duplication present on list samplingframes and to apply this methodology to estimating duplication in a couple of States.
BACKGROUND
Duplication Control at NASS
Duplication control has been an important part of NASS's list maintenance activities since thelate 1970's when the States' current list frames were built. There are three main methods ofduplication detection: list frame resolution, on-line searches, and the annual duplication checkprocess.
The fust method, list frame resolution, is a process in which every record on the list frame ismatched against every other record in an attempt to remove all duplication from the frame. Thismatching is performed by the Record Linkage Sub-System (RECLSS), developed by NASS inthe late 1970's. RECLSS resides on the centrally located mainframe computer system used byNASS on a contract basis. It is capable of performing very thorough record linkage using nameand address standardization and matching, but is not "user friendly" and requires experiencedusers to achieve good results. Because of the computer intensive nature of record linkage, the
1

cost of running the entire resolution process on the mainframe is high, in the $300-$600 rangefor a single State depending on the size of the list frame. Typically a full resolution requiresa large amount of manual review through on-line searches, and this adds significantly to the totalcost of list frame resolution. For these reasons, full resolution is not performed on an annualbasis, but is performed periodically, usually every three to five years. During the period1990-1992, the list frame sampling unit was changed from farm operation to farm operator("operator-dominant conversion") and full resolution was run for each State as part of thisconversion. North Carolina went through this process in 1990 and Ohio in 1991.
The second method of duplication control uses on-line searches of a State's list frame databaseto search for duplicates or to review potential duplicates found by the other methods. Listmaintenance is carried out in the State Statistical Offices (SSO's) using the Real Time Mail andMaintenance System (RTMMS), the database of all list records which also resides on themainframe. Selected staff in each SSG use this system to perform list maintenance activitiesincluding resolution of potential list duplication, using on-line searches. When adding a newfarm operator to the list, searches can be performed based on name, zip code, phone number,Social Security number, etc. to make sure that this operator is not already on the list. Thissystem is also used to resolve output from list frame resolution and the NASS duplication checkprocess, described in detail in the next section. This system was implemented in the late 1980's,and has been a very useful tool in prevention and reduction of duplication.
The third method of duplication control used by NASS is the "duplication check" process inwhich sampled records for each of the major surveys are matched against all other list framerecords which were classified for that survey. Matching is performed by a much simpler recordlinkage program (than RECLSS), in which two records match if any of the fields selected as"matching variables" are exact matches. This also resides on the central mainframe, but is muchless expensive to run. and is designed to produce a manageable volume of output which can beresolved prior to the survey. The duplication check process is the focus of this research projectand is described in detail in the next section.
The NASS Duplication Check Process
The NASS survey cycle begins with list classification, a process in which all records on eachState's list frame are classified into ordered design strata for each of the major surveys(Quarterly Agricultural Surveys, Cattle and Sheep Survey, Farm Cost and Returns Survey andAgricultural Labor Survey), based on control data on the frame. While a farm operator mayqualify for inclusion in several strata, he will be classified only for the highest numberedstratum, which is of highest priority in the NASS ordered stratification. List classification isfollowed by sample selection, in which stratified random samples are chosen for the majorsurveys.
Sample selection is followed by the duplication check process, in which records classified formajor surveys are matched against all active records on the list frame. The duplication checkprogram matches records based on four list frame variables: Social Security number (SSN).
2

Employer Identification number (EIN), telephone number and link cross reference number. Amatch occurs if anyone of these fields matches. Records with none of these matching variablesare rare, with 0.9 percent in Ohio, and 2.8 percent in North Carolina.
The output of the duplication check program consists of two listings of "linkage groups" (setsof records that "link" or match). The primary listing consists of all linkage groups whichcontain at least one sampled record. SSO staff check each of these, prior to the survey, todetermine if the records which matched are in fact duplicates. Often records which match onlyon telephone number actually represent separate operations. In these two States, less than onethird of the linkage groups contained actual duplicate records. When duplication is found,questionnaire coding adjusts for the duplication and "Record Status" codes are modified on thelist frame to correct the problem for the future. A secondary listing of linkage groups whichcontain at least one classified record, but no sampled records is also provided for the States toresolve during the year as time permits.
When duplication is found prior to or during the survey, the questionnaire is coded as followsfor individual operators:
1. The "reporting unit" (item 921) is set to the total number of times the operatoris found on the list. The acceptable range for duplication coding is 2-5.
2. The strata codes of the duplicate records are recorded in the "partner strata"fields (items 925-928), with a maximum of four duplicate record strata codesthat may be recorded.
While managed operations and large and/or complex operations are treated somewhat differently,questionnaire coding instructions are designed to achieve consistent results for these operations.
Strategies for Estimation in the Presence of Duplication
When each population element is represented by exactly one list unit, the probability that a givenelement is in the sample is just the probability that its associated list unit is selected. Listduplication occurs when some population elements are represented by, or "linked" to, more thanone unit on the list frame. When there is duplication the selection probabilities are not equal,and if we do not make adjustments, our estimators will have an upward bias. Lessler andKalsbeek (1992, p.75) quantify this bias for estimates of totals under simple random sampling.Suppose we divide the population into domains based on the number of times each populationelement is represented on the list frame, with domain k being all population elements whichappear k times. They show that if the population means of a variable are equal for thesedomains then the relative bias is equal to the ratio of the number of duplicate frame records tothe true population size.
There are several strategies that are commonly used for conducting surveys in the presence oflist duplication. One of these is to establish a "unique counting rule" which links each
3

population element to a single list frame unit. The population element is included in the sampleonly if the frame unit identified by the rule is selected. An example of this would be a rule thata population element is included in a sample only if the frame unit with the largest identificationnumber among the duplicate records is selected. If duplication is detected after data collection,then some data may be lost.
Another strategy is to use a weight or data adjustment factor to adjust the expansion factor ofrecords which have duplicates on the frame, and thus are more likely to be sampled. If apopulation element k appears on the sampling frame Mk times, then when sampled, the data aremultiplied by lIMk• Even if the same population element appears multiple times in the sample,each sampled unit reports. Cox (1993) describes this procedure as an adjustment of the weight"associated with sampled frame units to reflect the multiple selection opportunities for thedesired population unit." This adjustment, obtained by multiplying the sampling weight N/ntimes 11Mb results in an overall weight of N/(n*Mk). This new weight is not, in general, equalto the reciprocal of the probability of selection. Nonetheless, this procedure does result inunbiased estimation (see Appendix C).
A third strategy is to compute correct inclusion probabilities for each sampled populationelement, based on the number of duplicate records on the frame. Under the assumption that allduplicate records on the frame may be identified for each unique sampled record, this calculationis straightforward for a simple random sample. Use of the Horwitz-Thompson "pi estimator"provides unbiased estimation (Musser, 1993).
In stratified survey designs, the latter two techniques are difficult to apply because duplicaterecords may appear in different strata. In that case. applying these techniques across stratawould not maintain unbiased estimation within strata. A counting rule which specifies whichstratum is the "correct" one is needed.
The NASS Solution: A Dual Approach to Deal with Duplication in Stratified Designs
The NASS strategy for dealing with the problem of duplication across strata is to apply acombination of the first two techniques. A unique counting rule is used when duplication occursacross strata and the adjustment technique is applied for within-stratum duplication.
If members of a linkage group are not all in the same stratum, only those in the highest stratumwill account for the data for that operator or operation. Records from lower strata areconsidered out of scope for data collection. When duplication is discovered after data collection,data fields will be set to zero for sampled records in lower strata. If there are Mkh members oflinkage group k in the highest stratum h, each sampled record will have reported data"adjusted," i.e. multiplied by 1/Mkh. This quantity is referred to as the "data adjustmentfactor" (DAF). In practice, if more than one of the members of linkage group k in stratum haresampled, the data are usually collected once and copied for the other records. Thus, if there aretwo records in the highest stratum, and both are sampled. then data for each will be multipliedby 1/2, and in effect the data for that operation will receive the full sampling weight. If only
4
one of the two is sampled, the weight or expansion factor for that operation will be halved. Insome States, when there are two duplicate records sampled in the highest stratum, a shortcut isused to avoid entering the same data twice. The reporting unit code is used to set the DAF to1 for one sampled record and to 0 for the other. The Survey Processing System (SPS) is theseries of computer programs which edit survey data files and produce estimates and standarderrors for NASS surveys. It uses the reporting unit code and partner strata codes to computethe correct DAF.
METHODS AND RESULTS
Linkage group resolution and review activities were conducted after the June Agricultural Surveyin two States (North Carolina and Ohio) by two teams of two persons. Each team included aperson from the Research Division and a person from the List Frame Section. The primaryfocus of these activities was the list duplication check listing. The SSO duplication check actionswere reviewed and final duplication check linkage group resolution decisions were made.Various resources were utilized to resolve linkage groups. These resources included State Officestaff, notes from the State Office copy of the duplication check printout, June Survey datalistings, the real-time mail and maintenance system and telephone calls.
In Ohio, a total of 116 duplication check linkage groups (250 total records) were reviewed andresolved. In North Carolina a total of 100 duplication check linkage groups were reviewed andresolved. Information was recorded to provide the correct data adjustment factors to recomputeJune Survey indications of major agricultural items when duplication was detected among recordsincluded in that survey. Counts of the number of resolved records linked to sampled recordslisted in the duplication check output were also recorded. These counts were aggregated to thestratum level for the four major surveys for use in computing estimates of list frame duplication.
Estimates of the percent of duplication involved in sampling for the four major survey series inOhio and North Carolina were computed using sample unit measures of duplication. A samplingapproach is desirable, since a complete resolution of all possible pairwise comparisons is notfeasible. Such an approach would be too time consuming and expensive. Using list duplicationcheck listings which included only those linkage groups which contained at least one sampledrecord, a resolution process was performed. For each sampled record, a decision was made asto the number of other records (link count) considered to be duplicates of the sampled record.
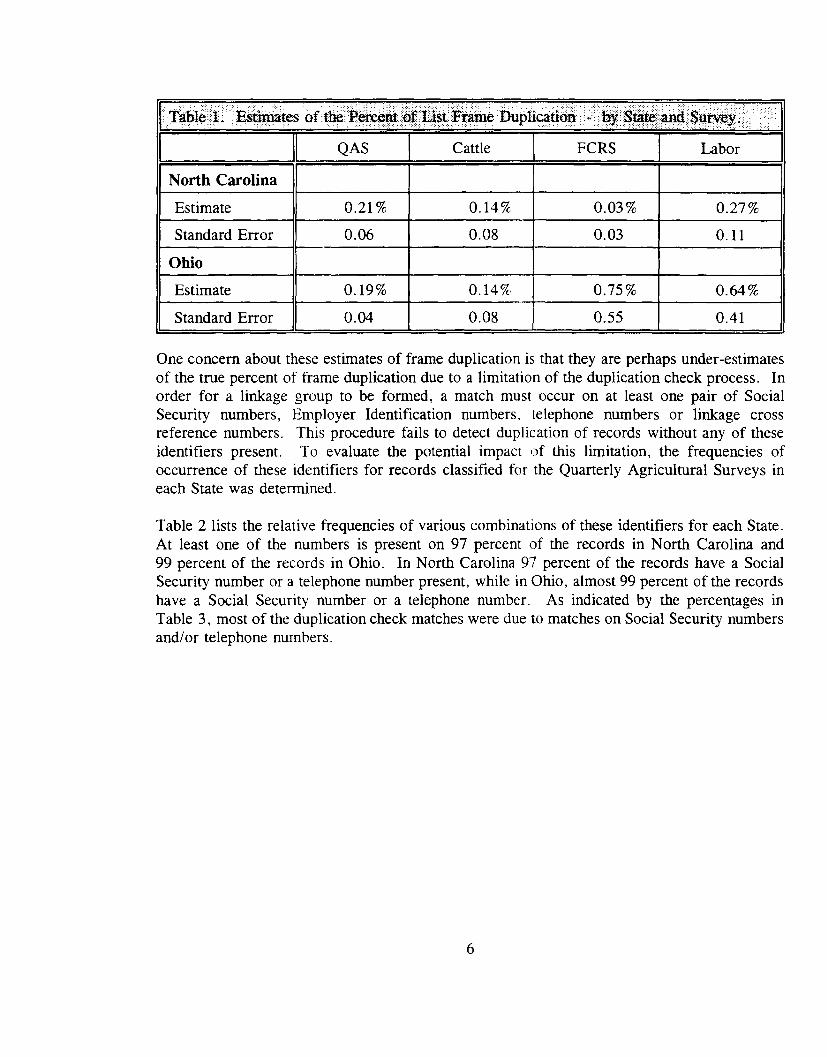
Overall estimates of the percent of duplication in each State's list frame relative to major surveyseries are shown in Table 1. Overall estimates of the percent of duplication in the NorthCarolina frame for the four survey series ranged from 0.03 to 0.27 percent. Overall estimatesof the percent of duplication in the Ohio frame relative to the four survey series ranged from0.14 to 0.75 percent.
5
. ...... ... ".' '," .. ... ' ..... " . . . ....... ..~..•..•.•~'..~~~••,~~..•*~~~•...•.. .... " ...... , ................ , ... , .
.' ...•....•...... . . ..... . ... ... .. ..... .... , .. ..... .. .....
.••·f~fjleHiI ~at~s of.tl1e·~_pf.lq~~'~Iam¢•]jupti~il3p
I ~ QAS I Cattle I FCRS I Labor INorth Carolina
Estimate 0.21 % O. 14% 0.03 % 0.27 %
Standard Error 0.06 0,08 0.03 O. 11
Ohio
Estimate O. 19% O. 14% 0.75 % 0.64%
Standard Error 0.04 0.08 0.55 0.41
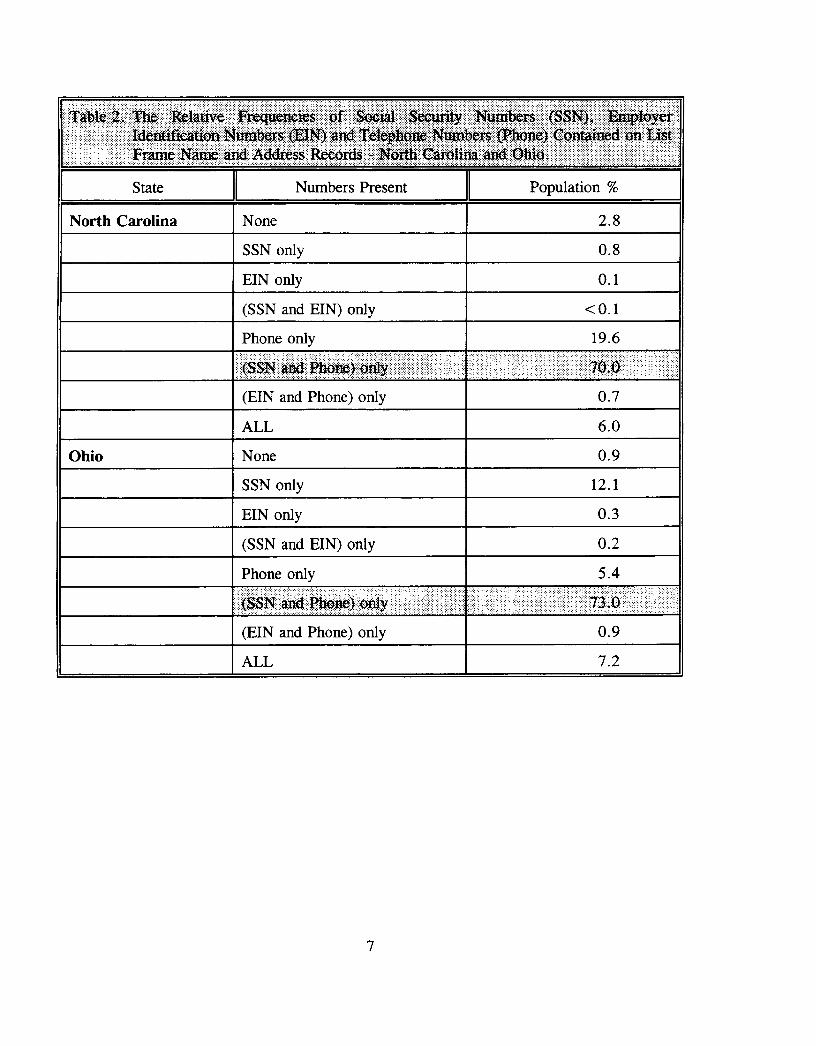
One concern about these estimates of frame duplication is that they are perhaps under-estimatesof the true percent of frame duplication due to a limitation of the duplication check process. Inorder for a linkage group to be formed, a match must occur on at least one pair of SocialSecurity numbers, Employer Identification numbers. telephone numbers or linkage crossreference numbers, This procedure fails to detect duplication of records without any of theseidentifiers present. To evaluate the potential impact of this limitation, the frequencies ofoccurrence of these identifiers for records classified for the Quarterly Agricultural Surveys ineach State was determined.
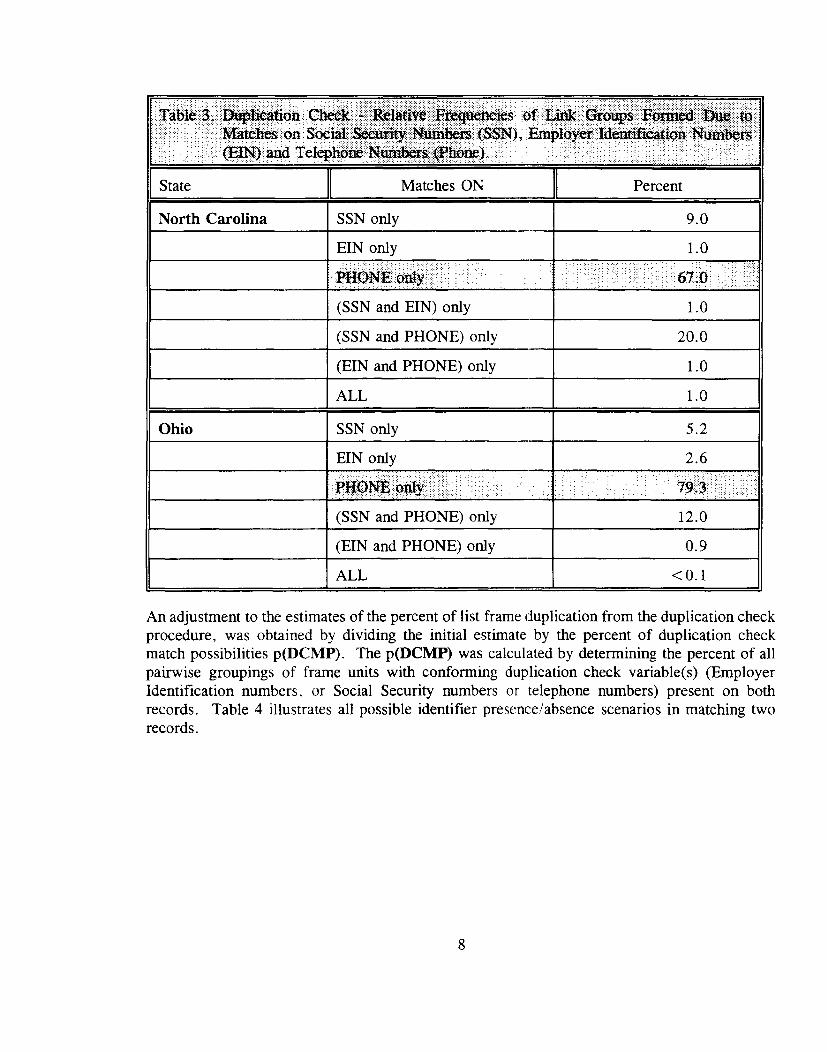
Table 2 lists the relative frequencies of various combinations of these identifiers for each State.At least one of the numbers is present on 97 percent of the records in North Carolina and99 percent of the records in Ohio. In North Carolina 97 percent of the records have a SocialSecurity number or a telephone number present, while in Ohio, almost 99 percent of the recordshave a Social Security number or a telephone number. As indicated by the percentages inTable 3, most of the duplication check matches were due to matches on Social Security numbersand/or telephone numbers.
6
· : : : : -: :.:. '.' ' .. :;.' .;.:- -:.:-:.; ...;.: :.; :.;.:-::.:- ..:-:-:.;. ..:- ..;. :.;.;.;. : .;.:-: .. :: :: -::,.;.;. .. ,:. : :-:.
:r!!.~ljJ$:::~8:,.:.::,[~J!~#:\:[~_i9~::·::!~:[:_I:.:·::·.[:1_[,III11~1:::<i~mJ:[.:.:_p!9.¥#.r:
I State ~ Numbers Present ~ Population % INorth Carolina None
Ohio
SSN only
EIN only
(SSN and EIN) only
Phone only.......... , ...... ... - ...... .. " , ... .. ... ....
:,~~~m,#It.[@q~~[:9.:[·[:·::::·::f·H:(EIN and Phone) only
ALLNone
SSN only
EIN only
(SSN and EIN) only
Phone only
(EIN and Phone) only
ALL
7
2808o 1
<01196
""nn ,.:.•,.•.[ :.':'.', II076009121030254
09
72
.·••W~b~·:.~.i••••II~ij~1~~~bn.··...9~~~••.•••~••••!I,~~~~l~!••••!~I~~··.·.6f.·...• ·!•••••~~R~~.:•••·' ••• I••·.I.I.I.~m·I••...........\•.••••.·.·ma~~~on.SQpiat~.i.ity••~fi~($$N) .Erhpl~y~t.ld~tift¢ad¢illY'!im1)¢t$•..•··/iegOOW1d 'tel~hOiieNum_sl:eMtter.· .
:.... >.'.<:.:>: ::':"":";'.:: :'~~::"';:' ';.::"'::::::::>::::::.::':.';;'::::;':::::::',,::::::::::: ..:::,;:.::-:".,:,'-;. '-.
I State II Matches ON ~ Percent INorth Carolina SSN only 9 0
EIN only 1 0.............•........•..•.. (.. :.: :.>.,-.;.;:.:.::.::'<:: ..'. -
PftPrfj!oWY.· ...(SSN and EIN) only
(SSN and PHONE) only
(EIN and PHONE) only
ALL
....•..•••• YU .. > .•...••••.: •..•••67;0 ••••.•••.Ji>.T
1 0
200
1 0
1 0
Ohio SSN only
EIN only',- ..... , .. "'.",',' ,",. ":",:', -
':':,,:::::-:::: ..':,':':::::::::: ::'::,:.'::"':::::::::::: ":":.,~IQ~J?p:~y:.· •...< •••.•(SSN and PHONE) only
(EIN and PHONE) only
ALL
... H· .
5 2
26.......
1~,;:).··•••·H·.·•.····•.••··•12 0
09<0 1
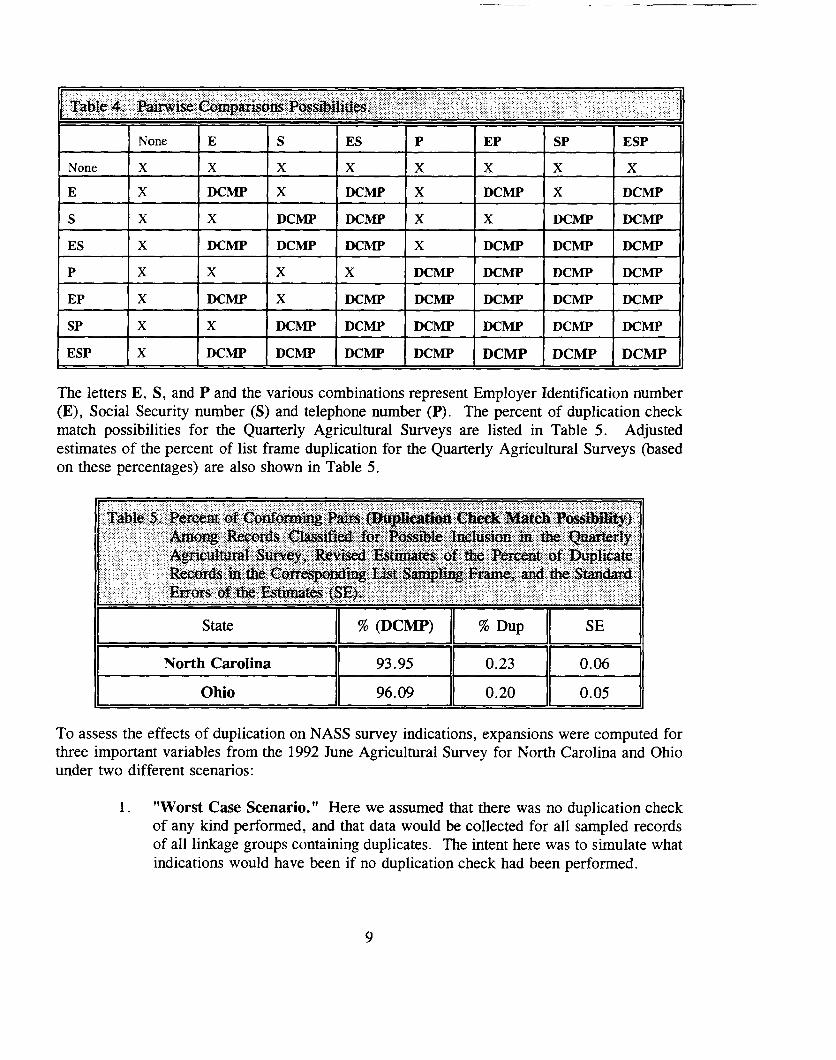
An adjustment to the estimates of the percent of list frame duplication from the duplication checkprocedure, was obtained by dividing the initial estimate by the percent of duplication checkmatch possibilities p(DCMP). The p(DCMP) was calculated by determining the percent of allpairwise groupings of frame units with conforming duplication check variable(s) (EmployerIdentification numbers, or Social Security numbers or telephone numbers) present on bothrecords. Table 4 illustrates all possible identifier presence/absence scenarios in matching tworecords.
8
............. ..... .... , ...
None E S ES P EP SP ESPNone X X X X X X X X
E X DCMP X DCMP X DCMP X DCMP
S X X DCMP DCMP X X DCMP DCMP
ES X DCMP DCMP DCMP X DCMP DCMP DCMP
P X X X X DCMP DCMP DCMP DCMP
EP X DCMP X DCMP DCMP DCMP DCMP DCMP
SP X X DCMP DCMP DCMP DCMP DCMP DCMP
ESP X DCMP DCMP DCMP DCMP DCMP DCMP DCMP
The letters E, S, and P and the various combinations represent Employer Identification number(E), Social Security number (S) and telephone number (P). The percent of duplication checkmatch possibilities for the Quarterly Agricultural Surveys are listed in Table 5. Adjustedestimates of the percent of list frame duplication for the Quarterly Agricultural Surveys (basedon these percentages) are also shown in Table 5.
North Carolina
Ohio
93 95
9609
023
020
To assess the effects of duplication on NASS survey indications, expansions were computed forthree important variables from the 1992 June Agricultural Survey for North Carolina and Ohiounder two different scenarios:
1. "Worst Case Scenario." Here we assumed that there was no duplication checkof any kind performed, and that data would be collected for all sampled recordsof all linkage groups containing duplicates. The intent here was to simulate whatindications would have been if no duplication check had been performed.
9
2. "Best Case Scenario." Here we assumed that all duplication was resolved"correctly" (i. e., as determined by our investigation), to simulate indicationsunder a "perfect" duplication check.
These two sets of expansions were compared to the actual survey expansions for each State. Theintent in the first case was to measure the impact of the current duplication handling process asit was performed in these two States. In the second case, the goal was to measure the effect oferrors in carrying out the process. A detailed discussion of methods and results for eachscenario follows.
To assess the impact of the duplication check process, we attempted to undo any actions takenas a result of the process, and assume that even at survey time, duplication would not bedetected. Indications from these data were then compared to actual June Agricultural Surveyindications to estimate the effect of the process. This "worst case scenario" assumed that datawould be collected for every sampled record in each linkage group. If data were actuallycollected for only one of several records in a linkage group, those data were moved to the otherrecords, and the DAF was set to "1" for each. If data were not collected at all for a sampledrecord (due to duplication with a record in a higher stratum that was not sampled) then weimputed stratum means for that record.
In Ohio, there were only 7 sampled duplicate records in the June Agricultural Survey, one ofwhich had 3 tracts giving a total of 9 data file records. One of these was correctly coded as aduplicate, but because this record was duplicated with a record in a lower stratum, data werecollected and the DAF was "1." The remaining 8 records were not coded as duplicates, datawere collected, and the DAF's were set to "1" for all. Thus in Ohio, in the June AgriculturalSurvey, data were collected for all of the duplicate records and no data adjustment was madefor duplication. Therefore the duplication check process had no effect on survey indications.
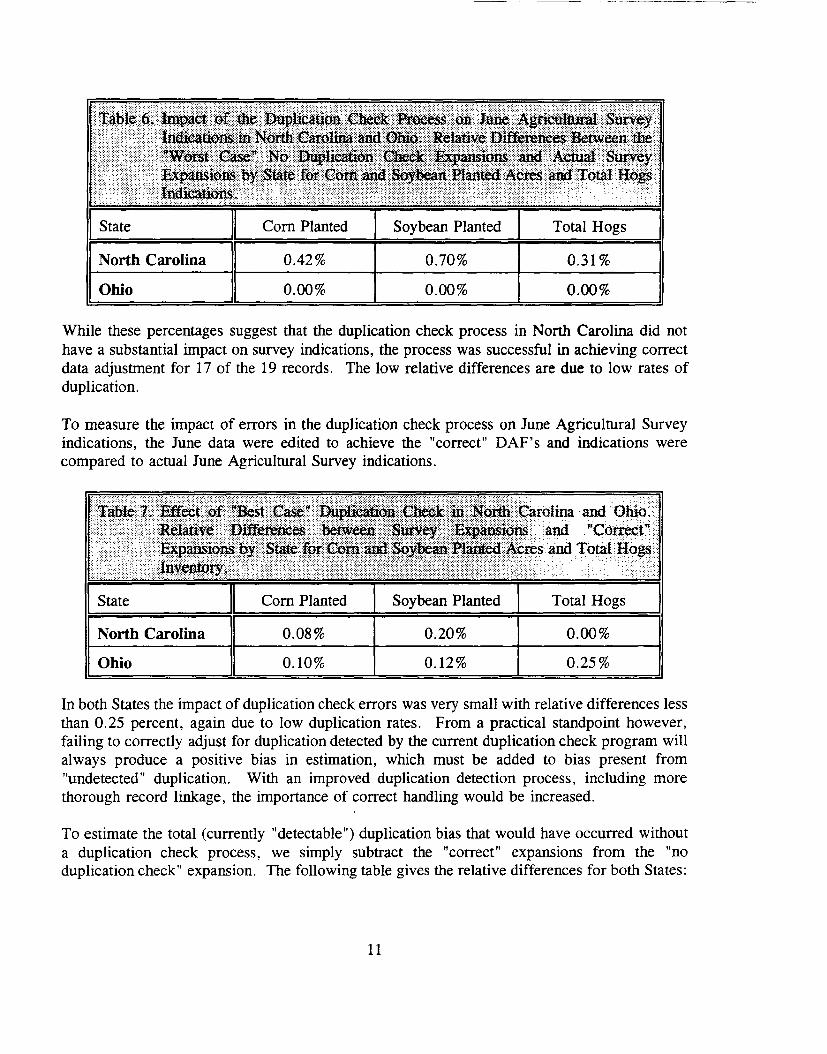
In North Carolina, there were 17 sampled duplicate records in the June Agricultural Survey, twoof which had 2 tracts, giving a total of 19 data file records. Of these, 16 records were codedcorrectly, and 8 of these codings caused a change in the DAF. The procedure above was usedto approximate the percentage change in survey indicat.ions in the absence of any duplicationchecking process. The results are summarized in Table 6.
10
State
North Carolina
Ohio
Corn Planted
042%
000%
Soybean Planted
070%
000%
Total Hogs
031 %
000%
While these percentages suggest that the duplication check process in North Carolina did nothave a substantial impact on survey indications, the process was successful in achieving correctdata adjustment for 17 of the 19 records. The low relative differences are due to low rates ofduplication.
To measure the impact of errors in the duplication check process on June Agricultural Surveyindications, the June data were edited to achieve the "correct" DAF's and indications werecompared to actual June Agricultural Survey indications.
State
North Carolina
Ohio
Corn Planted
008%
010%
Soybean Planted
020%
012%
Total Hogs
000%
025%
In both States the impact of duplication check errors was very small with relative differences lessthan 0.25 percent, again due to low duplication rates. From a practical standpoint however,failing to correctly adjust for duplication detected by the current duplication check program willalways produce a positive bias in estimation, which must be added to bias present from"undetected" duplication. With an improved duplication detection process, including morethorough record linkage, the importance of correct handling would be increased.
To estimate the total (currently "detectable") duplication bias that would have occurred withouta duplication check process, we simply subtract the "correct" expansions from the "noduplication check" expansion. The following table gives the relative differences for both States:
11

State
North Carolina
Ohio
Com Planted
050%
010%
Soybean Planted
090%
o 12%
Total Hogs
031 %
025%
Comparing this estimate of the total detectable bias to the bias removed by the duplication check(Table 7) shows that the duplication check process in North Carolina was successful in removinga substantial percentage (com acres: 85 percent; soybean acres: 77 percent; hogs: 100 percent)of the total bias that otherwise would have occurred.
Correct implementation of the NASS system of adjustment for duplication depends on severalkey phases of the system. The resolution of the potential duplicate linkage groups identified bythe duplication check program must be done correctly. Then comments and a record status of"78" to indicate special handling must be attached to the list frame which clearly define thecorrect questionnaire codings for the survey cycle. These comments must be attached to thequestionnaire, and retained through the survey cycle. After data collection these codes must beentered correctly on the questionnaire and data file. Questionnaire codings and DAF's werechecked for each quarter, and results are given in the tables below. For each survey quarter,row 1 gives the total number of sampled records that were members of duplicate linkage groups.Row 2 gives the number of these records with "correct" coding of the 921 and 925-928 items(as defined by the NASS Supervising and Editing Manual). Since States sometimes use shortcuts to manipulate these codes and still get the correct DAF, this row might be low withoutnecessarily implying error in the State's duplication handling. Row 3 gives the number ofrecords with the correct DAF. Row 4 gives the overall percentage of correct DAF's.
12

..
Counts:and ~~cenm$eS:·.fur=mhUt¢tJ~:Agfie.ulwral Suty¢y· ·_~imak~:.::.Table 9,COOgs tn·lWdttb·C.OUua ~lld.1& cmm,~med~·tl.YQ~~r; ... :.... . ....
", . ', .." .. ".... " , ..... " ...,........... ',.
I ~ June ~ Sept ~ Dec ~ March INumber of duplicated sample records 28 20 25 24
Number of records with correct coding of 921and 925-928 boxes (NASS S&E manual) 17 16 16 14
Number of records with correct DataAdjustment Factor (DAF) 23 18 18 17
Percent of records with correct DAF 82 90 72 71
The table show that there is room for improvement in the current NASS duplication checkprocess in order to correctly adjust survey data for duplication which is found by the duplicationcheck program.
CONCLUSIONS AND RECOMMENDATIONS
The North Carolina and Ohio State Statistical Offices appear to be doing a very good job incontrolling list frame duplication. The data from North Carolina and Ohio clearly suggest thatboth States have low rates of duplication on their list frames and that duplication is not causingserious inflation of survey indications in either State. Since our estimates of duplication arereally only estimates of that portion of the total list frame duplication which can be detected bythe current (limited) duplication check program, we believe that they are underestimates of thetrue frame duplication. To more accurately measure the amount of duplication that is"undetected" by the current program, future research should perform an independent, morethorough resolution of sampled records versus classified records with RECLSS, using name andaddress matching. Nonetheless, counts of list frame records in these States with the necessarydata for matching are high and "adjusted" estimates of duplication based on these counts did notproduce substantial changes in the estimates of percent duplication. Allowing for limitations inthis adjustment procedure, duplication percentages appear to be less than one half of one percentin both States.
Due to these low rates, the effects of errors in the duplication check process on indications forthe June Agricultural Survey were relatively small in both States. However, the table of codingperformance over the full Agricultural Survey cycle shows that there is room for improvementin the process and we believe that a built in quality check could bring this about.
13
All sampled records listed in the duplication check print are flagged in the SPS edit. Theproblem with this is, usually only about 20 to 30 percent of the records identified in the printare actually in true duplicate linkage groups. This will tend to discourage States from carefullychecking the coding of these records, in every survey and every quarter of the AgriculturalSurvey. We suggest an improvement whereby, prior to the June Survey, each SSO would haveto record its determination of duplication for each record in the duplication check print. Recordsfor which duplication could only be determined at survey time would be coded as "potential"duplicates. Only definite and potential duplicates would be flagged in the SPS edit. Thisflagging would be more helpful and less of a burden for the SSO's. It might even be possiblefor the edit to flag only those duplicates that appear to be coded incorrectly (by comparing theDAF to the correct duplication adjusted DAF).
An alternative plan under serious consideration at NASS is to drop the flagging of duplicaterecords (by SPS edit) altogether, while implementing improvements to the duplication checkprocess. One suggested improvement is to implement a thorough duplication removal processprior to classification. Another suggestion is to replace the SPS flagging which occurs duringthe survey with a pre-survey quality check, which could help performance especially in the"follow on" surveys.
Recording decisions for each record in the duplication check process would have other benefits.In addition to providing motivation for the States to make clear determinations and record themin a timely manner. it would provide an annual measure of list duplication for each State. Thiswould be very useful to monitor over time, and could be included in the "Red Book", an annualNASS publication on list coverage and quality. Comparison of these estimates to duplicationpercentage estimates obtained from a more thorough periodic full record linkage on the entirelist frame would provide an evaluation of how well the duplication check process is working inidentifying and controlling duplication.
A very important aspect of an efficient duplication control process is a good record linkageprogram. The NASS duplication check program (which matches only on telephone number,SSN, EIN, and linkage cross reference number) is used to provide a manageable set of potentialduplicates at a relatively low cost, which can be manually reviewed under pre-survey timeconstraints. This may be a reasonable strategy if combined with a periodic (every 3 or 4 years)full resolution with RECLSS or another good record link2ge program. However, improvementsin "off the shelf" record linkage software and declining cost of very powerful PC's may makeit possible to perform the annual duplication check with a much more powerful record linkagesoftware on Agency PC's. The Survey Technology Branch is currently evaluating a PC-LAN-based record linkage package which shows promise. If such software could be "fine tuned" toprovide accurate identification of duplicate records while minimizing "false matches", it mightactually produce smaller "potential duplicate" sets than the current program. This could resultin substantial improvement in the NASS duplication control process, and lowering of rentedmainframe computer costs.
14
One minor issue which came up in this research is how to handle duplication adjustment whenthere is nonresponse. Currently, the OAF is imputed, and no adjustment for duplication ismade. We believe that to maintain unbiased estimation under the current non-responseassumptions, the OAF should be adjusted for duplication. If the record has multiple chances ofselection, it must be reflected in a smaller weight, even with imputed data. This would requirespecial coding because the same questionnaire item is used to record duplication andnonresponse.
Another observation concerns the coding of multiple operations under the recently adopted NASS"operator dominant" ("op dom") list frame design. Under this design an operator with severalseparate operations is normally given one active ("parent") record which is coded with an"active" record status of 85. All of the other operations are linked to this active record but are"inactive" records with record status of 45 (not eligible for sampling). If the active record issampled (i.e. the operator is sampled) then all of his operations are sampled and questionnairesare generated for each of these. Under the old "operation dominant" design, each operation wassampled separately. Ouring our duplication resolution in North Carolina, we found that roughlyhalf of the duplication found was due to multiple operations of some operator being coded asactive records. Some of these were just records which had not been handled correctly under the"op dom" guidelines, and others had been given a special (State specific) coding to avoidrespondent burden inherent in the "op dom" system. We have two observations on thissituation.
1. There may be a need for clearer documentation and explanation at survey trainingschools on the correct handling of multiple operations. Because control data aresummed across the multiple operations, these operators not only have the burdenof multiple questionnaires, but are also sampled more often. In the extremecases, these should be treated as "special handling" records with an active recordstatus of 99 for each operation.
2. When multiple operations are detected during the duplication check process, thelist frame statistician normally takes action to change the list frame record statuson these records to the 85-45 scheme for the following year. The real intent ofthis is to correct the duplication for the next year's sample. But, if the 85 recordwas sampled for the current year, each of the identified multiple operations willreceive a questionnaire as a subtract of the 85 record. This is correct, but it isimportant that each of these questionnaires receives the same coding as the parentquestionnaire. Therefore, any comments concerning duplication and correctquestionnaire codings which are posted for the 85 record should also be postedto all of the identified multiple operations. There was a case where the parentrecord had a OAF of 0 but the data for the additional operation record receiveda OAF of 1.0. If incorrect coding of duplicates was flagged by the SPS edit, asmentioned above, errors like this would be caught.
15
In summary, we offer two recommendations for improvement in the duplication control processat NASS. The first is a thorough investigation of alternative PC based record linkage programsfor more accurate, efficient identification of potential duplicates. The second would requireStates to capture their decisions on duplication for each potential duplicate record, which wouldprovide yearly estimates of duplication for each State, and make it possible to build a duplicationadjustment check into the SPS edit to catch errors over the whole survey cycle.
16
REFERENCES
Cox, B. (1993), Weighting Class Adiustments for Nonresponse in Integrated Surveys:Framework for Hog Estimation, United States Department of Agriculture, National AgriculturalStatistics Service, Research Division, SRB Research Report Number SRB-93-03.
Lessler, J., and Kalsbeek, W. (1992), Nonsampling Error in Surveys, New York: John Wiley.
Musser, Orrin (1993), Unbiased Estimation in the Presence of Frame Duplication, StatisticalUnited States Department of Agriculture, National Statistics Service, Research Division, SRBResearch Report Number SRB-93-1O,pp. 60-63.
Samdal, C., Swensson, B., and Wretman, J. (1992), Model Assisted Survey Sampling,New York: Springer-Verlag.
17
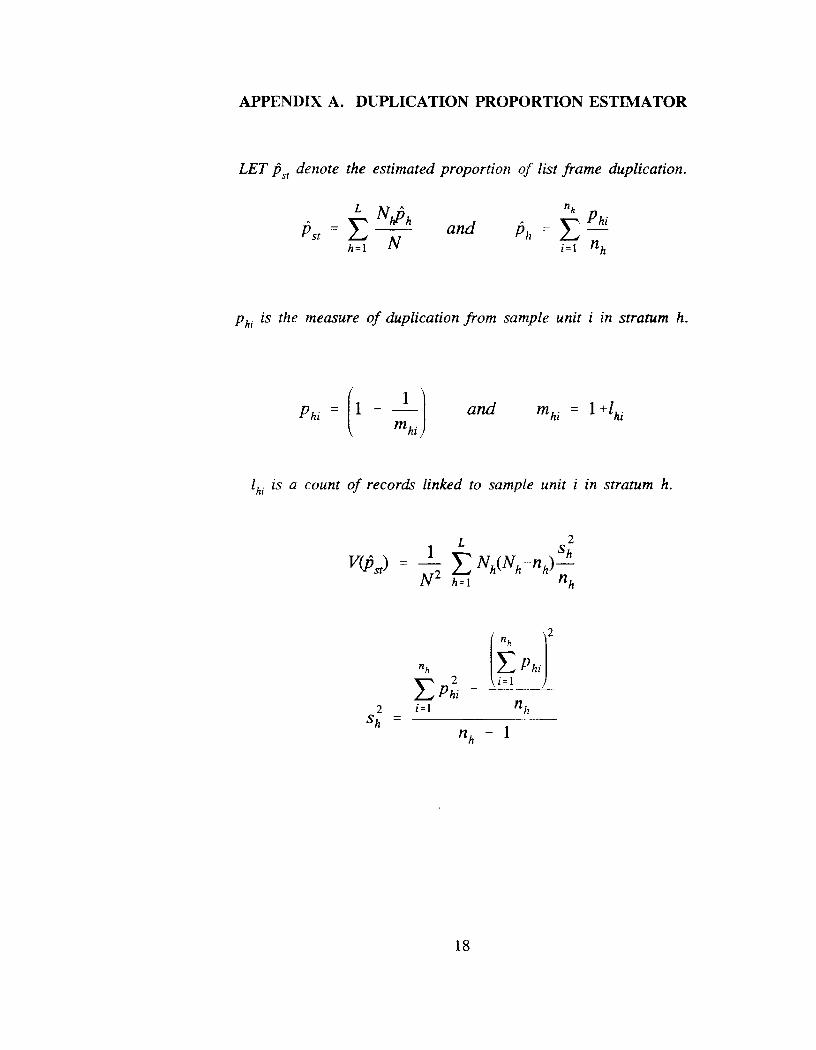
APPENDIX A. DUPLICATION PROPORTION ESTIMATOR
LET PSf denote the estimated proportion of list frame duplication.
= t N,ph
h=l Nand
Phi is the measure of duplication from sample unit i in stratum h.
and
lhi is a count of records linked to sample unit i in stratum h.
L 2
V(pst)1 L Nh(Nh
Sh= - m nh)-
N2 h=l nh
nh [~PhJLP~i - --- ..--
2 i=l nhSh =
nh- 1
18
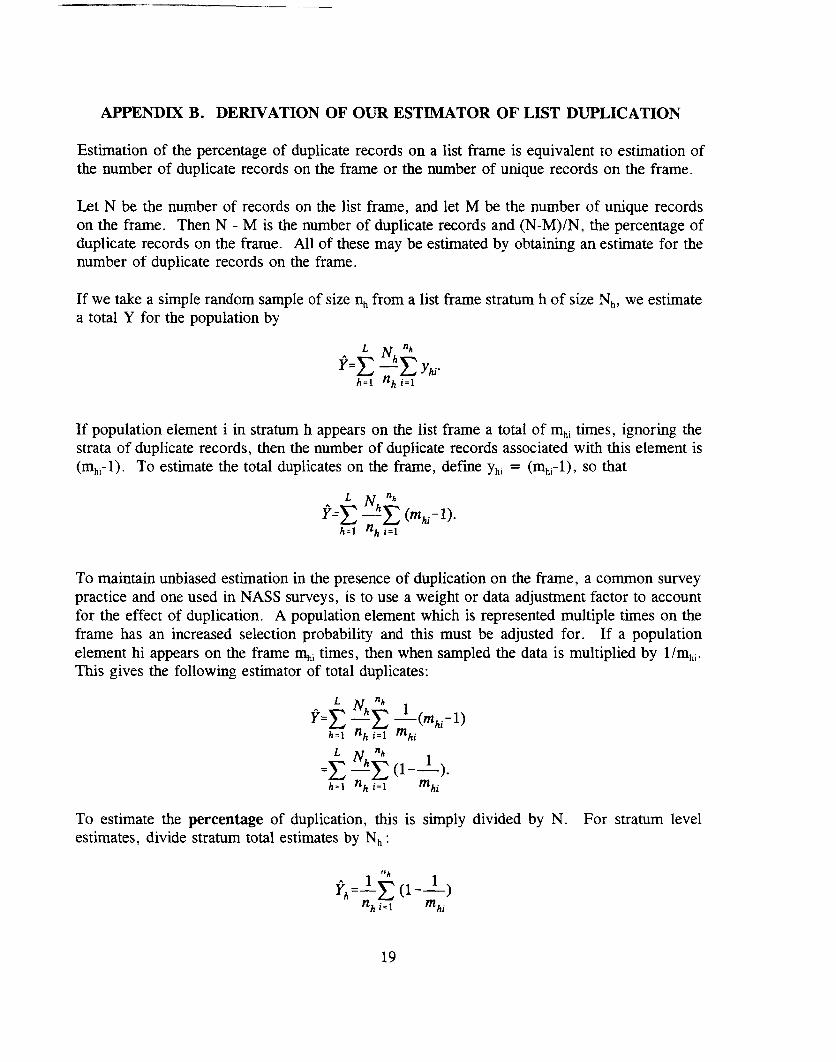
APPENDIX B. DERIVATION OF OUR ESTIMATOR OF LIST DUPLICATION
Estimation of the percentage of duplicate records on a list frame is equivalent to estimation ofthe number of duplicate records on the frame or the number of unique records on the frame.
Let N be the number of records on the list frame, and let M be the number of unique recordson the frame. Then N - M is the number of duplicate records and (N-M)/N, the percentage ofduplicate records on the frame. All of these may be estimated by obtaining an estimate for thenumber of duplicate records on the frame.
If we take a simple random sample of size ~ from a list frame stratum h of size Nh, we estimatea total Y for the population by
If population element i in stratum h appears on the list frame a total of mhi times, ignoring thestrata of duplicate records, then the number of duplicate records associated with this element is(mhi-l). To estimate the total duplicates on the frame, defme Yhi = (mhi-l), so that
To maintain unbiased estimation in the presence of duplication on the frame, a common surveypractice and one used in NASS surveys, is to use a weight or data adjustment factor to accountfor the effect of duplication. A population element which is represented multiple times on theframe has an increased selection probability and this must be adjusted for. If a populationelement hi appears on the frame ~i times, then when sampled the data is multiplied by lImh;.
This gives the following estimator of total duplicates:
To estimate the percentage of duplication, this is simply divided by N. For stratum levelestimates, divide stratum total estimates by Nh :
19
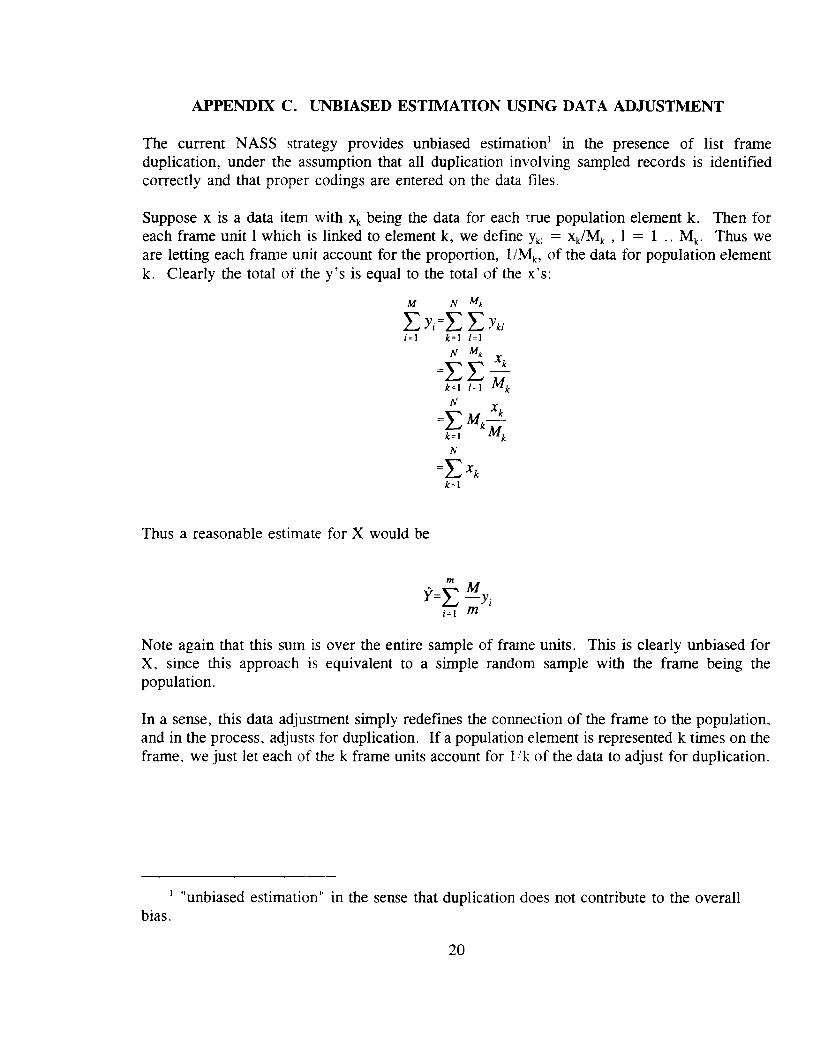
APPENDIX C. UNBIASED ESTIMATION USING DATA ADJUSTMENT
The current NASS strategy provides unbiased estimation1 in the presence of list frameduplication, under the assumption that all duplication involving sampled records is identifiedcorrectly and that proper codings are entered on the data files.
Suppose x is a data item with Xk being the data for each true population element k. Then foreach frame unit I which is linked to element k, we define Ykl = xk/Mk , I = 1 .. Mk. Thus weare letting each frame unit account for the proportion, 11Mb of the data for population elementk. Clearly the total of the y's is equal to the total of the x.'s:
Thus a reasonable estimate for X would be
• m MY=L -Y;;=1 m
Note again that this sum is over the entire sample of frame units. This is clearly unbiased forX, since this approach is equivalent to a simple random sample with the frame being thepopulation.
In a sense, this data adjustment simply redefines the connection of the frame to the population,and in the process, adjusts for duplication. If a population element is represented k times on theframe, we just let each of the k frame units account for 11k of the data to adjust for duplication.
1 "unbiased estimation" in the sense that duplication does not contribute to the overallbias.
20


