Abstract This paper presents OS-Guard(On-Site Guard), a novel on-site signaturebased framework for multimedia surveillance data management. One of the ma-jor concerns in widespread deployment of multimedia surveillance systems is theenormous amount of data collected from multiple media streams that need to becommunicated, observed and stored for crime alerts and forensic analysis. This ne-cessitates investigating efficient data management techniques to solve this problem.This work aims to tackle this problem, motivated by the following observation, moredata does not mean more information. OS-Guard is a novel framework that attemptsto collect informative data and filter out non-informative data on-site, thus taking astep towards solving the data management problem. In the framework, both audioand video cues are utilized by extracting features from the incoming data stream andthe resultant real valued feature data is binarized for efficient storage and processing.A feature selection process based on association rule mining selects discriminantfeatures. A short representative sample of the whole database is generated usinga novel reservoir sampling algorithm that is stored onsite and used with an supportvector machine to classify an important event. Initial experiments for a Bank ATMmonitoring scenario demonstrates promising results.
P. Kumar (B)Gokaraju Rangaraju Institute of Engineering College, Hyderabad, Indiae-mail: [email protected]
S. RoyInstitute for Infocomm Research, 1 Fusionopolis way #21-01,Connexis (South Tower), 138632, Singaporee-mail: [email protected]
A. MittalCollege of Engineering, Roorkee, Indiae-mail: [email protected]
364 Multimed Tools Appl (2012) 59:363–382
1 Introduction
In recent times multi-sensor surveillance systems have become an essential compo-nent of our public and private life. From high security defence buildings to private“smart home” needs, multimedia (multi-sensor) surveillance systems promise tobe those “extended senses”, replacing the need for human observers. Althoughfascinating, building practical multimedia surveillance systems involves solving sev-eral critical research challenges. Apart from intelligent real-time recognition, onegrowing problem has been the problem of efficiently managing the huge amount ofdata collected by virtue of such “uncontrolled senses”, particularly when the datais required for future (can amount to several months) crime alerts and forensicanalysis. In such circumstances it is highly imperative to have efficient multimediadata gathering techniques.
This paper highlights the problem of data management in surveillance systemsand proposes a framework to solve it. The proposal is motivated by the followingobservation, “more data does not mean more information”. Note that the humansvery effectively and amazingly use their natural faculties to record and processwhat is information and what is not. Therefore it is interesting to explore whetherthere can be an intelligent surveillance system based on multiple sensors that canaccurately distinguish between informative data and non-informative data. Clearlythis behooves a learning process, by which the system needs to be trained to makesuch distinction.
The idea of intelligent surveillance systems is not new though. Several researchershave attempted to design intelligent systems that performs intelligent recognitionof very specialized abnormal events, primarily in an on-line setting. It is clearlyimpossible to design a system that can recognize all kinds of abnormal events,because of the sheer variability of such events. An interesting observation that can bemade here is that in a day-to-day work setting one rarely encounters such specializedevents all the time. Hence they cannot be used as an efficient information gatheringtool.
The question that is raised at this point is; is it easier to learn non-informativedata than informative data. It seems (and this is our strong belief) that if datamanagement (in this case information gathering) is the goal, it may be easier to learnnon-informative (normal) data than learning informative (abnormal events) data.This is because the observer is hopefully not interested in non-informative (normal)data. Anything that the system does not know can be counted as informative dataand stored. This essentially indicates the following advantages: (1) false positive rateof such a system can be controlled and kept very low, (2) generally non-informativedata is available in plenty, thus making the learning process easier and possible, and(3) the data collected can be automatically annotated and indexed to facilitate bettersearch. Hence depending on how well the system can learn non-informative datato that extent the data management problem can be solved. Note that this line ofthought derives its inspiration from the way humans learn things.
Now the point may be raised that, just like it is difficult to learn informativedata, it can be equally difficult to learn the whole spectrum of non-informative data.For that matter generic surveillance systems are extremely difficult to build, if notimpossible and hence all existing systems are more or less specific to a domain. Butit can be observed that in some scenarios it may be easier and possible to learn
Multimed Tools Appl (2012) 59:363–382 365
non-informative data effectively, for example, in an ATM monitoring application.It is easier to learn the normal way in which an ATM transaction takes place withsome degree of confidence. If such normal (non-informative) events can be learnedeffectively with reasonable amount of success, the data management problem can besolved to a great extent.
From the above discussion, the essential observation is that, to recognize special-ized events it is necessary for the system to learn informative data, but when it comesto data management problems, a surveillance system would do better off learningnon-informative events, so as to keep the false positive rate low and at the same timefilter out non-informative data. This is the basic philosophy behind the proposal. Theproposed framework implements this idea by showing a possible synergy between thefields of multimedia and data mining in building efficient multimedia surveillancesystems for an off-line settings. Off-line setting refers to a situation where data iscollected so as to make it possible to do forensic analysis of such data and the goal isto collect as less data as possible without losing any informative data.
Contributions: This paper presents a novel framework for on-line surveillancedata management. In practically implementing the framework, it demonstrates apossible synergy between multimedia and data mining by showing (1) an effectiveuse of association rule mining in robustly selecting audio-visual features from multi-sensor data, and (2) a dynamic reservoir sampling algorithm that selects data samplesto construct a binary signature of a database. The constructed signature preservesclassification performance by learning a classifier from a small number of examples.
2 Overview of proposed framework
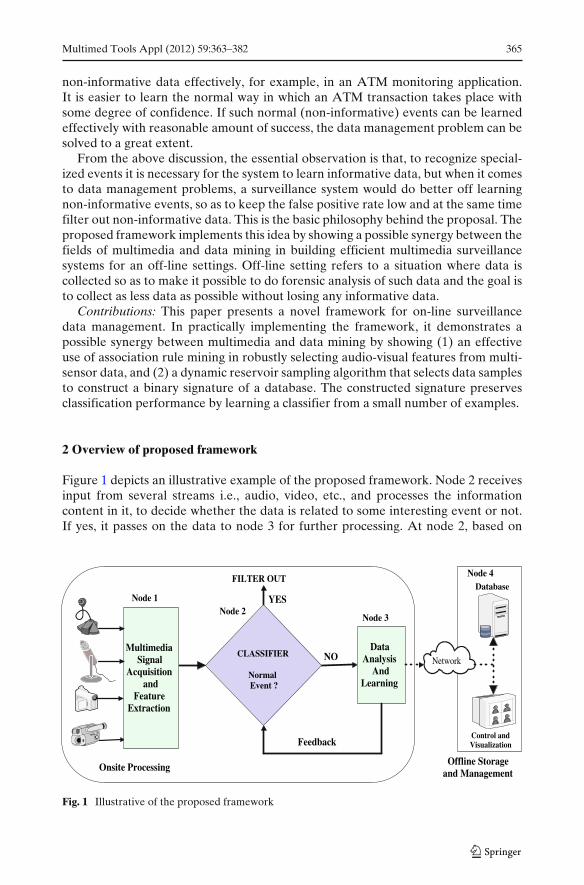
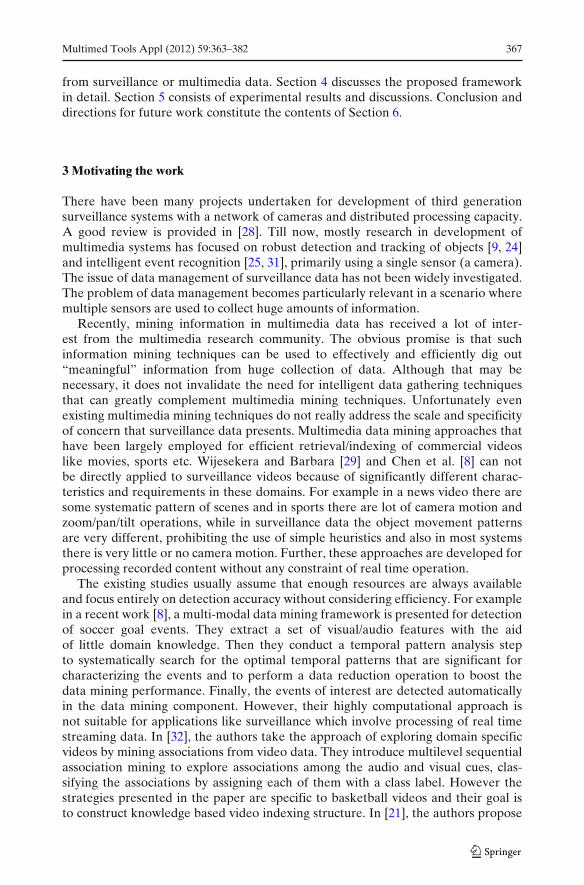
Figure 1 depicts an illustrative example of the proposed framework. Node 2 receivesinput from several streams i.e., audio, video, etc., and processes the informationcontent in it, to decide whether the data is related to some interesting event or not.If yes, it passes on the data to node 3 for further processing. At node 2, based on
Control andVisualization
NetworkCLASSIFIER
Normal Event ?
YES
NO
FILTER OUT
DataAnalysis
AndLearning
MultimediaSignal
Acquisitionand
FeatureExtraction
Node 1Node 2
Node 3
Feedback
Onsite Processing
DatabaseNode 4
Offline Storageand Management
Fig. 1 Illustrative of the proposed framework
366 Multimed Tools Appl (2012) 59:363–382
features extracted from the content, normal events are blocked and abnormal eventsare passed on. The underlying functional mechanism at node 2 can be a simplemotion detection routine (syntactically based) or some activity/pattern detectiontechniques (semantically based). Motion detection based techniques [14, 20] aresensitive to minor lighting changes. While semantic based techniques [4, 17, 19] thattry to recognize specific events (semantics) are very specialized and involve intensivecomputations. This makes them not very favorable for use in an on-line setting. Notethat the fundamental task performed at node 2 is a form of discrimination betweennormal and abnormal events, which can be essentially seen as a classification taskthat detects normal events with very high probability.
At node 3 the incoming stream is analyzed and understood and if required, somefeedback is given to node 2 to improve its discriminant function. The classificationtask requires the availability of a huge collection of example data at the point ofcapture that is unfortunately not possible to be made available in an on-line setting.To circumvent this problem, a small representative signature of the database ofevents is made available at node 3, which uses it to update the novelty classifier atnode 2.
To confirm the validity of the proposed framework, a specific implementation ispresented in the paper, that brings a possible synergy between multimedia and datamining that can be exploited to develop effective and efficient data managementsolutions for multimedia surveillance applications. The specific highlights of theimplementation are as follows:
– A novel and fast feature selection technique from multi-sensor (audio-visual)data is presented. The feature selection is based on association rule mining.
– The information stored at node 2 is a short signature in binary form (comparedto real valued data) that is generated after discretizing the actual real valuedfeatures obtained. This facilitates efficient storage and processing, consideringthe resource constraints at onsite nodes.
– A novel dynamic reservoir sampling algorithm that is robust to noise is pro-posed. The sampling algorithm generates a short representative signature ofthe database that is required at node 3. The dynamic nature of the samplingalgorithm allows it to be updatable in an on-line setting. An added advantage ofthe use of the sampling algorithm is that, the association rules generated duringfeature selection (based on frequency counts) can be seamlessly integrated intothe sampling process (which is also based on frequency counts), thus making thesampling adaptive to the feature selection process.
The performance of the proposed framework was verified on a Bank ATMsurveillance data set. Different individual activities and sounds going on in a BankATM environment were recorded with a fixed view camera and a microphone. Forthe purpose of learning, a few scenarios of possible abnormal activities were acted outto simulate possible abnormal behavior around an ATM. Note that the classificationproblem at hand is highly biased because of the lack of abnormal events examples.This can be seen as a one-class classification problem with many positive examplesand a few or no negative examples (outliers). An on-line SVM is incorporated foroutlier (novelty) detection [26] as our classifier for robust incremental discrimination.
The rest of the paper is organized as follows. Section 3 presents a short overviewof the related existing work in the area of useful event or information extraction
Multimed Tools Appl (2012) 59:363–382 367
from surveillance or multimedia data. Section 4 discusses the proposed frameworkin detail. Section 5 consists of experimental results and discussions. Conclusion anddirections for future work constitute the contents of Section 6.
3 Motivating the work
There have been many projects undertaken for development of third generationsurveillance systems with a network of cameras and distributed processing capacity.A good review is provided in [28]. Till now, mostly research in development ofmultimedia systems has focused on robust detection and tracking of objects [9, 24]and intelligent event recognition [25, 31], primarily using a single sensor (a camera).The issue of data management of surveillance data has not been widely investigated.The problem of data management becomes particularly relevant in a scenario wheremultiple sensors are used to collect huge amounts of information.
Recently, mining information in multimedia data has received a lot of inter-est from the multimedia research community. The obvious promise is that suchinformation mining techniques can be used to effectively and efficiently dig out“meaningful” information from huge collection of data. Although that may benecessary, it does not invalidate the need for intelligent data gathering techniquesthat can greatly complement multimedia mining techniques. Unfortunately evenexisting multimedia mining techniques do not really address the scale and specificityof concern that surveillance data presents. Multimedia data mining approaches thathave been largely employed for efficient retrieval/indexing of commercial videoslike movies, sports etc. Wijesekera and Barbara [29] and Chen et al. [8] can notbe directly applied to surveillance videos because of significantly different charac-teristics and requirements in these domains. For example in a news video there aresome systematic pattern of scenes and in sports there are lot of camera motion andzoom/pan/tilt operations, while in surveillance data the object movement patternsare very different, prohibiting the use of simple heuristics and also in most systemsthere is very little or no camera motion. Further, these approaches are developed forprocessing recorded content without any constraint of real time operation.
The existing studies usually assume that enough resources are always availableand focus entirely on detection accuracy without considering efficiency. For examplein a recent work [8], a multi-modal data mining framework is presented for detectionof soccer goal events. They extract a set of visual/audio features with the aidof little domain knowledge. Then they conduct a temporal pattern analysis stepto systematically search for the optimal temporal patterns that are significant forcharacterizing the events and to perform a data reduction operation to boost thedata mining performance. Finally, the events of interest are detected automaticallyin the data mining component. However, their highly computational approach isnot suitable for applications like surveillance which involve processing of real timestreaming data. In [32], the authors take the approach of exploring domain specificvideos by mining associations from video data. They introduce multilevel sequentialassociation mining to explore associations among the audio and visual cues, clas-sifying the associations by assigning each of them with a class label. However thestrategies presented in the paper are specific to basketball videos and their goal isto construct knowledge based video indexing structure. In [21], the authors propose
368 Multimed Tools Appl (2012) 59:363–382
a framework for real time video data mining to be applied to the raw video (trafficand surveillance videos etc) but their contribution is limited to developing a real timemethod for video segmentation i.e grouping incoming input frames to a set of basicunits (like shots in produced videos).
Some recent approaches [2, 16, 27] for event analysis, detection and retrievalin video surveillance have proposed similar idea with different techniques. Forexample, in [27], the authors propose an online approach for abnormality detection invideo without the use of object detection and tracking. They formulate the problemas a one-class classification, where multiple local novelty classifiers (detectors) areused to first learn normal actions based on motion information and then to detectabnormal instances. Each detector is associated to a small region of interest andis trained over labeled samples projected on an appropriate subspace. However,inference based on voting by local detectors result in large false alarms whichcan be avoided by having a global detection. In [16], the author present a webbased interface for event driven video surveillance in an effort to work towardsoptimization of event detection. The intuitive interface can be used by surveillanceoperators for further exploration of detected events and better understanding.However, appropriate mining and reasoning techniques that are required to supportthe framework for delivering useful event data information are not explored in thepaper. In another paper [2], the author propose a multi-SVM classifier based eventdetection from a large video dataset to detect predefined events. However theirapproach works offline and does not target the efficiency of recognition. Clearlythere is a literature gap in addressing the problem of efficient event recognition tosupport online management of surveillance data.
4 An implementation of the proposed framework
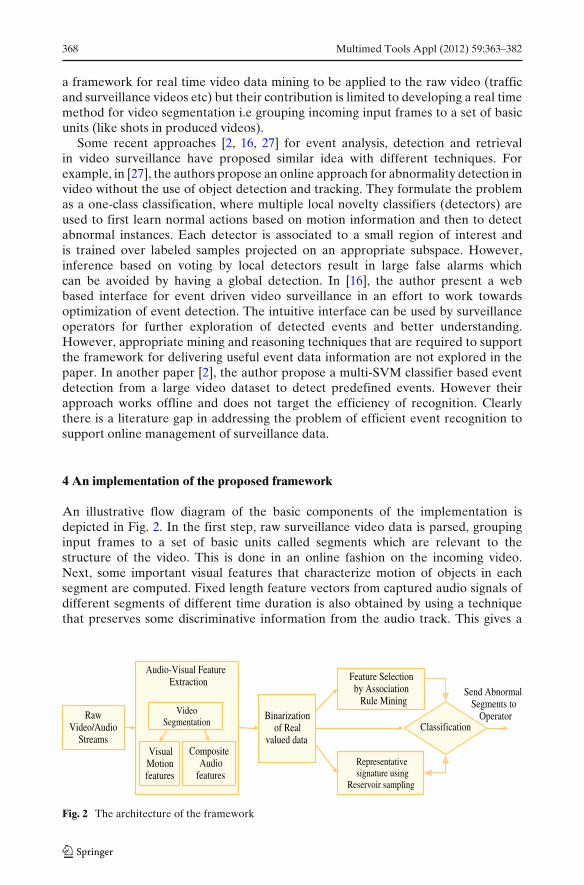
An illustrative flow diagram of the basic components of the implementation isdepicted in Fig. 2. In the first step, raw surveillance video data is parsed, groupinginput frames to a set of basic units called segments which are relevant to thestructure of the video. This is done in an online fashion on the incoming video.Next, some important visual features that characterize motion of objects in eachsegment are computed. Fixed length feature vectors from captured audio signals ofdifferent segments of different time duration is also obtained by using a techniquethat preserves some discriminative information from the audio track. This gives a
RawVideo/Audio
Streams
Audio-Visual FeatureExtraction
VisualMotionfeatures
CompositeAudio
features
VideoSegmentation
Send AbnormalSegments to
OperatorBinarizationof Real
valued data
Feature Selectionby Association
Rule Mining
Representativesignature using
Reservoir sampling
Classification
Fig. 2 The architecture of the framework
Multimed Tools Appl (2012) 59:363–382 369
large collection of real valued audio-visual features. Next, each real valued datacorresponding to a feature is mapped to a binary representation by an effectivediscretization method. This binary data is then analyzed using association rule miningto observe the association between the different features in effectively characterizingan event. This knowledge extraction stage allows the facility to perform featureselection, based on the knowledge of features that cooperate to contribute to anevent. Note that audio-video synchronization is already considered as a part of theknowledge extraction step. Next, a novel reservoir sampling method is used to finda representative sample of this binary data set. Finally, this sample can be usedas a representative signature on-site to classify incoming events as either normalor abnormal. The details of the different stages of the proposed framework aredescribed as follows.
4.1 Audio-visual feature extraction
The Audio-visual streams are segmented into smaller intervals of 2 s for analysis.Our observation is that this time is sufficient to record the start of an event likeopening of door, person entering into ATM cabin and so on. However, the streamsare monitored for a longer duration of time by appropriate buffering of 3 min so thatwhile analyzing if there is detection of an abnormal behavior in any of the segments,the whole buffer of the audio-video data is collected and stored. This is requiredfor proper interpretation of the information in context. Relevant features that cancharacterize and discriminate events depends largely on the application domain. ForBank ATM scenario, the following features, are proposed for use, based on theliterature.
4.1.1 Visual features
To characterize motion patterns of objects in each video segment, a rich set of visualfeatures is computed. It was noted that in ATM monitoring domain, modeling visualbehavior based on spatio-temporal intensity changes for each individual pixel ispreferable than segmenting objects and tracking their trajectory. This is because themotion in the cabin is constrained and the gesture and actions of the persons carriesmeaningful information requiring pixel level analysis. Furthermore, the later processis more cumbersome and relies critically upon the accuracy and consistency of objectsegmentation and tracking which are often ill-posed due to the presence of multipleobjects, occlusions etc.
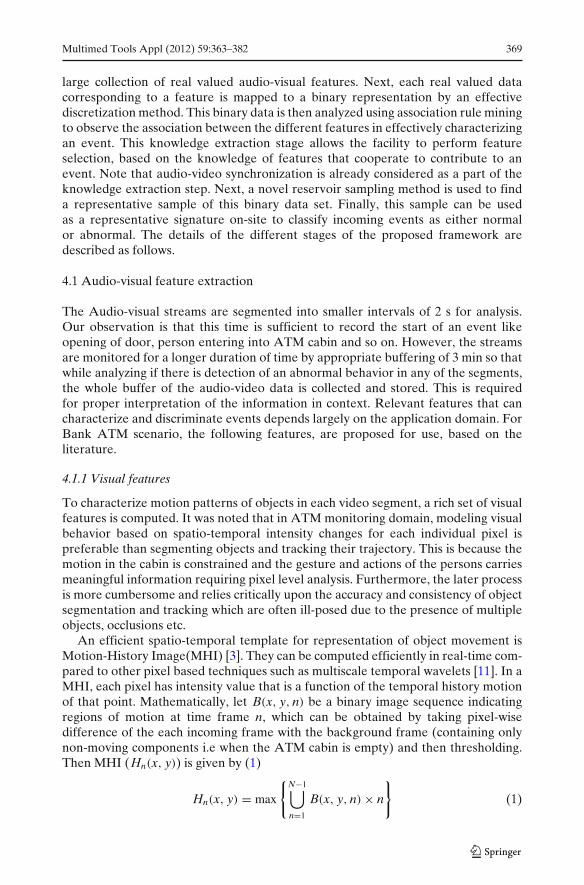
An efficient spatio-temporal template for representation of object movement isMotion-History Image(MHI) [3]. They can be computed efficiently in real-time com-pared to other pixel based techniques such as multiscale temporal wavelets [11]. In aMHI, each pixel has intensity value that is a function of the temporal history motionof that point. Mathematically, let B(x, y, n) be a binary image sequence indicatingregions of motion at time frame n, which can be obtained by taking pixel-wisedifference of the each incoming frame with the background frame (containing onlynon-moving components i.e when the ATM cabin is empty) and then thresholding.Then MHI (Hn(x, y)) is given by (1)
Hn(x, y) = max
{N−1⋃n=1
B(x, y, n) × n
}(1)
370 Multimed Tools Appl (2012) 59:363–382
where N is the total number of frames that capture the motion. The result is a scalarvalued image where more recently moving pixels are brighter. Thus the shape andintensity values in MHI represent spatio-temporal motion patterns of object in thescene in an efficient manner. For classification purpose, it is required to representMHI in terms of real-valued feature vectors. So seven Hu moments [15], whichare known to yield reasonable shape discrimination in a translational, rotationaland scale invariant manner, are used. MHI have been effectively used for poserecognition [3, 6] for small time interval constrained motion and therefore forATM situation, it can be used to discriminate normal motion patterns of personapproaching the ATM from any other erratic movement in the cabin. The angularmotion direction (AM) can also be obtained from the MHI [6] and is taken asanother feature. The direction of motion can provide further discrimination aboutwhether the person is approaching the ATM, leaving the ATM or moving in anyother arbitrary direction.
Additionally, Total Motion (TM) in a segment is calculated by Summing up thenumber of foreground pixels in all the video frames of the segment, which is of fixedduration (say 2 s). This feature is relevant in recognizing if there are more than one ortwo persons present simultaneously in the cabin which is a likely indication of somekind of abnormality like vandalism or robbery. In such case the TM will increaseabnormally as compared to the TM in normal one person transaction.
4.1.2 Audio feature extraction
For audio analysis, the track is divided into short overlapping sections of fixedduration corresponding to the duration of video segments. There are many audiofeatures, both in the time and frequency domain, reported in the research literature.For the implementation, a few of them are choosen for the purpose of sceneclassification in ATM scenario. First of all, energy features from multi-band spectralanalysis of the audio signal are used. For calculation, a parametric estimation ofthe power spectral density using Welch’s averaged modified periodogram methodof spectral estimation is done [18] to obtain Total Energy (TE). Since the energydistribution in different frequency bands varies quite significantly among differentaudio signals, the energies in different sub bands are also used as features, whichare referred to as Sub-Band Energy (SBE’s). Considering that the lower frequencybands posses more energy in most audio signals, the entire frequency band [0, F] isdivided into four subbands: [0, F/8], [F/8, F/4], [F/4, F/2] and [F/2, F], where F is halfof the sampling rate. TE values indicate the loudness of sound and can discriminatebetween events like banging of the machine, breaking screen or any other unusuallyloud event. The SBE values contain low to high frequency audio information and canhelp in discriminating respective audio content.
Additionally, Mel Frequency Cepstral Coefficients (MFCC) are computed, whichare the dominant feature set in speech, speaker and sound recognition communi-ties [12, 30]. They have also been used and shown to provide good accuracy foraudio surveillance and environmental sound recognition task [10, 13, 22]. The lowerMFCC components are indicative of the overall slope and shape of the frame’sMel-filtered spectrum while the higher order MFCC components represent the finerdetail. Only lower order components are retained as fine variations in the spectrumare typically too variable to be of significant use for most classification tasks. Also the
Multimed Tools Appl (2012) 59:363–382 371
first coefficient is dropped as it contains power values. Feature vectors are extractedin real time from the audio signal.
4.2 Feature representation
The feature representation obtained is quite big, and can be visualized as a m × narray of real values, where m is the number of records corresponding to segmentsand n gives the number of coefficients in each record. In an on-line setting, with lowcomputational resources, space constraints and additional on-line learning require-ments it is imperative that the example set from which learning is done is kept smallin size (for example, SVM learning gets slower with more examples). Note that sizeof the example set can be shortened either by reducing the number of supervisedexamples or by sacrificing a bit of discrimination by having a lower dimensionalrepresentation for a feature value instead of a real value. The experiment wasdone trying an intelligent combination of both. In this subsection, dimensionalityreduction is discussed. First, the real valued feature vectors are transformed intobinary vectors. This transformation is discrimination preserving as demonstratedlater in the experiment Section 5.3.
4.2.1 Binary representation
A binary representation for each feature vector is computed in the following way.First, for a coefficient (attribute), the histogram is computed from the values in allthe examples. Next, each bin is labeled by a k-bit binary number, in such a way thattwo labels are well separated from each other. The labels can be chosen based ona codebook, thus adding to the robustness of the system. Lastly, each coefficientis assigned with its corresponding k-bit binary label. Although many different waysof binarizing is possible, it was noted that this representation is robust and is alsofast to compute. Binarization along similar lines for categorical data classificationis recommended by Chang et al. [7]. Note that there is a performance tradeoff inthe number of bins and value of k to be considered. With more number of bins,discrimination would increase but then the size of the example data set would alsoincrease and robustness would decrease. Our experiences on this is reported inSection 5.4.
4.2.2 Feature selection based on association mining
The previous step converts a m × n real valued array to a m × n × k binary represen-tation. Note that in this set there are features from multiple modalities, some of whichmay not be useful in the classification task and can in fact be noise. Hence featureselection is important. Given a set of features and events associated with them wewould like to find the association between the features that indicate the possibility ofan events. Association rule mining [1] was used to the find the interesting associationsthat indicate a normal event. ARM typically aims at discovering associations betweenitems or attributes in a transactional (binary valued) database. In the presentsituation, the association rules can be mined at different levels of abstraction, byvarying the size of the binary data. During evaluation these rules can be examinedindependently at each level. Sometimes, it may be difficult to find strong associationsat lower or finer levels of abstraction due to the sparsity of data in multidimensional
372 Multimed Tools Appl (2012) 59:363–382
space, although a finer level of abstraction should provide better discrimination.This is the famous robustness-discrimination tradeoff problem as noted before. Toget around this problem, the minimum support in finding itemsets is reduced, thusfiltering out noisy lower dimensional itemset associations. Another alternative thatcan be used is to use some cross validation technique to find the right layer ofabstraction to represent the binary data. Thus, association rule mining gives someknowledge of the attributes that are related to each other and responsible for firingan event. Thus the attributes that do not play any significant role as identified by themining algorithm are dropped.
4.3 Efficient reservoir sampling algorithm
Association rule mining gives a set of rules and hence associations that significantlycontribute to the decision making. Although the data set is further reduced to binarydata and some attributes are also removed, the amount of data is still too large tobe included as part of the on-site information that can assist in making a decision. Inthis section, the idea of sampling a representative set of examples from the originaldataset that preserves discrimination in a dynamic way is explored. This furtherreduces the size of the example set available for on-line learning.
The proposed sampling algorithm is based on a very simple intuitive principle,that is: a sample should have a similar frequency histogram as the whole data set.Note that the sampling performed here is on binary data like transaction data (withtwo states), which allows a simple way to perform frequency related analysis. Thefollowing example explains the basic methodology of the algorithm in choosing agood sample. Consider a data set with two attributes, A1 and A2, where the wholedata set has 1,000,000 records. Out of these 60% records have A1 = 1 (i.e., 40% ofA1 = 0) and 50% records have A2 = 1. Let us say there are two samples, S1 and S2 ofsize 1,000 records each. In S1 61% records have A1 = 1 and 48% records have A2 =1, whereas in the sample S2 40% records have A1 = 1 and 65% records have A2 = 1.The sample S1 is most probably a better sample than S2, as the frequency of eachoccurrence of each attributes matches the whole data set. The proposed algorithm isbased on this principle. It calculates the distance between the frequency histogramsof the whole and the sample data sets and selects those records in the sample thatminimize this distance. The distance function chosen can be any one of the followingnorms L1, L2, and L∞. L2 norm (Euclidean distance metric) is chosen in this workas the distance metric, which is given as (2):
Dist(S0, S) =∑
A∈I1(S)
( f (A; S0) − f (A; S))2 (2)
where A is a binary attribute and I1(S) is the set of attributes, S is the whole dataset, S0 is the sample to be selected, f (·) is the frequency and Dist(·) is the L2 normdistance function.
To generate a sample of size n, the first n records are put in the sample S0. Thesen records are sorted according to the distance they induce into the sample; the bestrecord is one, the inclusion of which gives the minimum distance among all records.Each subsequent record after the first n records is evaluated as follows. Firstly thelatest transaction temporarily replaces the lowest ranking record. If the distance ofthe resultant sample with the new record is less than the distance of the sample
Multimed Tools Appl (2012) 59:363–382 373
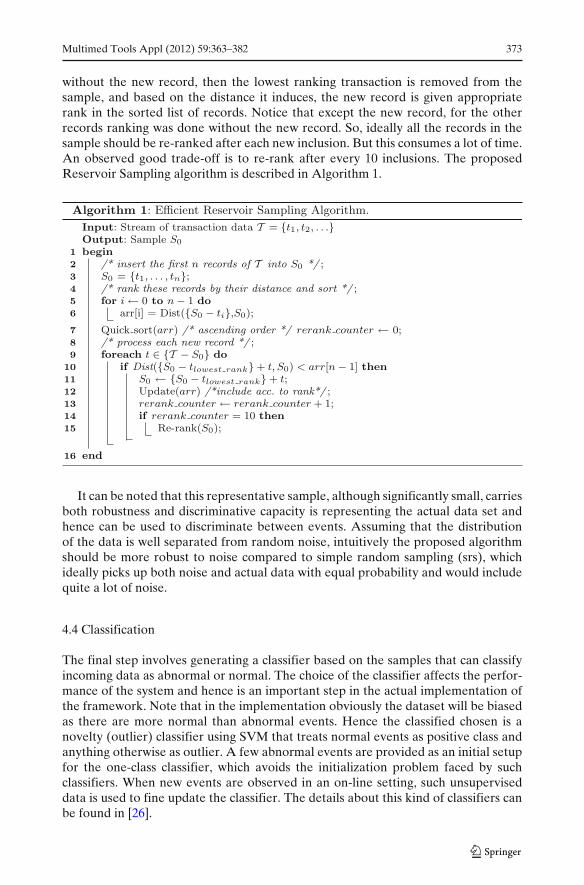
without the new record, then the lowest ranking transaction is removed from thesample, and based on the distance it induces, the new record is given appropriaterank in the sorted list of records. Notice that except the new record, for the otherrecords ranking was done without the new record. So, ideally all the records in thesample should be re-ranked after each new inclusion. But this consumes a lot of time.An observed good trade-off is to re-rank after every 10 inclusions. The proposedReservoir Sampling algorithm is described in Algorithm 1.
It can be noted that this representative sample, although significantly small, carriesboth robustness and discriminative capacity is representing the actual data set andhence can be used to discriminate between events. Assuming that the distributionof the data is well separated from random noise, intuitively the proposed algorithmshould be more robust to noise compared to simple random sampling (srs), whichideally picks up both noise and actual data with equal probability and would includequite a lot of noise.
4.4 Classification
The final step involves generating a classifier based on the samples that can classifyincoming data as abnormal or normal. The choice of the classifier affects the perfor-mance of the system and hence is an important step in the actual implementation ofthe framework. Note that in the implementation obviously the dataset will be biasedas there are more normal than abnormal events. Hence the classified chosen is anovelty (outlier) classifier using SVM that treats normal events as positive class andanything otherwise as outlier. A few abnormal events are provided as an initial setupfor the one-class classifier, which avoids the initialization problem faced by suchclassifiers. When new events are observed in an on-line setting, such unsuperviseddata is used to fine update the classifier. The details about this kind of classifiers canbe found in [26].
374 Multimed Tools Appl (2012) 59:363–382
5 Experimental results
In this section, performance of the prototype implementation of the proposedframework is analyzed. A representative example of a scenario which suffers fromdata management problem is a Bank ATM surveillance application. Hence an ATMsurveillance data set was used to verify the proposal. This section discusses theimplementation details and experimental observations of the following componentsof the proposed framework: (1) Feature representation of audio-visual data (2)binarization of features (3) feature selection based on association rule mining (4)performance of the reservoir sampling algorithm in producing an effective sample, interms of preserving the classification accuracy of the original data set.
5.1 Data set and parameters
In order to test the proposed framework, different activities performed in a BankATM situation were captured using a CCD camera and one microphone. The datagathering process was repeated in three sessions and resulting in three audio-videosequences. Apart from usual people coming to withdraw money from ATM, we hadfew actors to simulate the different kinds of usual and abnormal events that canhappen around an ATM.
The video frames were processed at resolution of 320 × 240, at 20 frames persecond, amounting to 20.74GB of data (approximately 3 h of recording). From thisdata, a total of about 5,400 segments of 2 s duration were obtained and the trainingwas done on 3,000 segment records and the rest was used for testing purpose. Atotal of 9 visual features (TM, AM and 7 Hu Moment features) as discussed before,were extracted for every segment. For audio features, an audio signal was sampledat 11 KHz and the samples were subdivided into clips (of duration 1 s). A total of17 generic audio features were extracted (5 energy features and 12 MFCC features)for every clip. Thus the total size of feature set for each segment is 26 (9 visual and17 audio) real values. For this data set the class labels are already known. Henceeach feature vector (representing an event) is manually assigned an appropriate classlabel, -1 for normal and 1 for abnormal events.
5.2 Events and feature analysis
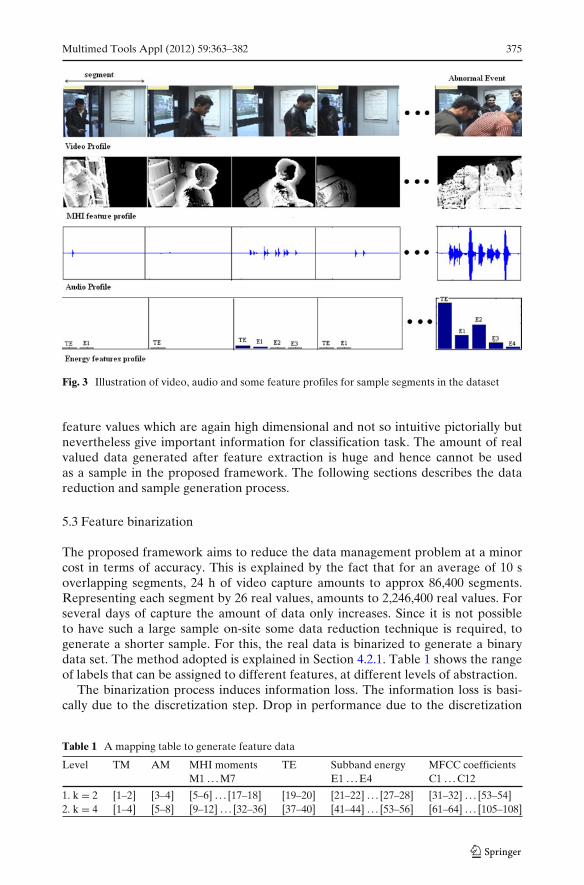
Figure 3 illustrates the profiles of the video, audio and some of the correspondingfeatures for some normal and abnormal segments in the dataset. The first fourcolumns shows the profile for normal segments representing person entering throughthe cabin door, approaching towards the ATM machine, carrying out transactionsand exiting. The last column shows the profile for an abnormal segment representinga vandalizing event. The MHI generated for these segments are shown in the secondrow. Although the high dimensional Hu moment values corresponding to the MHI’scould not be plotted but it can be seen that the MHI for the abnormal segmentis clearly distinct from the MHI’s of the normal segment. Further the total motionfeature value, which is equal to the number of foreground pixels, can be seen to bemuch larger for the abnormal segment in comparison to other segments with singleperson in the ATM. The audio and energy profile also shows significant increasein the amplitude and thus total energy and sub-band energy feature values. MFCC
Multimed Tools Appl (2012) 59:363–382 375
Fig. 3 Illustration of video, audio and some feature profiles for sample segments in the dataset
feature values which are again high dimensional and not so intuitive pictorially butnevertheless give important information for classification task. The amount of realvalued data generated after feature extraction is huge and hence cannot be usedas a sample in the proposed framework. The following sections describes the datareduction and sample generation process.
5.3 Feature binarization
The proposed framework aims to reduce the data management problem at a minorcost in terms of accuracy. This is explained by the fact that for an average of 10 soverlapping segments, 24 h of video capture amounts to approx 86,400 segments.Representing each segment by 26 real values, amounts to 2,246,400 real values. Forseveral days of capture the amount of data only increases. Since it is not possibleto have such a large sample on-site some data reduction technique is required, togenerate a shorter sample. For this, the real data is binarized to generate a binarydata set. The method adopted is explained in Section 4.2.1. Table 1 shows the rangeof labels that can be assigned to different features, at different levels of abstraction.
The binarization process induces information loss. The information loss is basi-cally due to the discretization step. Drop in performance due to the discretization
Table 1 A mapping table to generate feature data
Level TM AM MHI moments TE Subband energy MFCC coefficientsM1 . . . M7 E1 . . . E4 C1 . . . C12
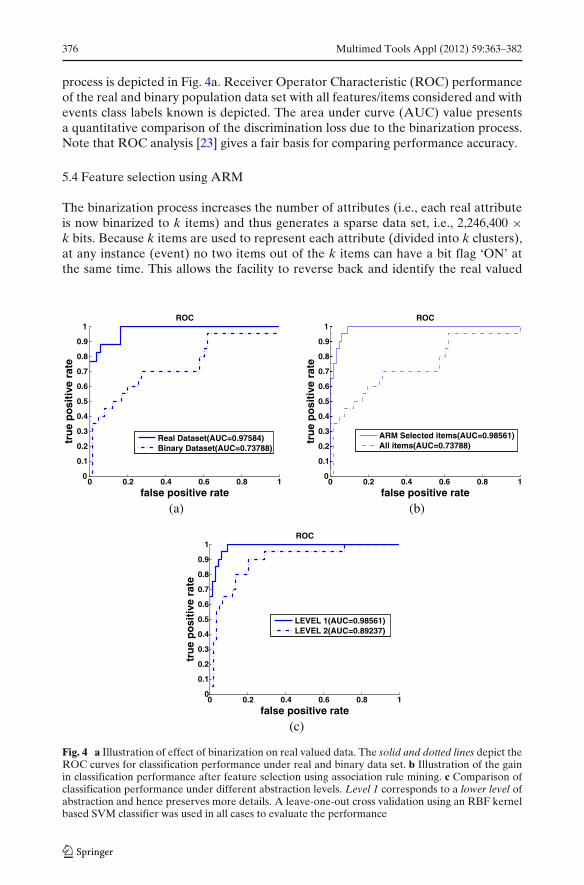
process is depicted in Fig. 4a. Receiver Operator Characteristic (ROC) performanceof the real and binary population data set with all features/items considered and withevents class labels known is depicted. The area under curve (AUC) value presentsa quantitative comparison of the discrimination loss due to the binarization process.Note that ROC analysis [23] gives a fair basis for comparing performance accuracy.
5.4 Feature selection using ARM
The binarization process increases the number of attributes (i.e., each real attributeis now binarized to k items) and thus generates a sparse data set, i.e., 2,246,400 ×k bits. Because k items are used to represent each attribute (divided into k clusters),at any instance (event) no two items out of the k items can have a bit flag ‘ON’ atthe same time. This allows the facility to reverse back and identify the real valued
0 0.2 0.4 0.6 0.8 10
0.1
0.2
0.3
0.4
0.5
0.6
0.7
0.8
0.9
1
false positive rate
tru
e p
osi
tive
rat
e
ROC
Real Dataset(AUC=0.97584)Binary Dataset(AUC=0.73788)
(a)
0 0.2 0.4 0.6 0.8 10
0.1
0.2
0.3
0.4
0.5
0.6
0.7
0.8
0.9
1
false positive rate
tru
e p
osi
tive
rat
eROC
ARM Selected items(AUC=0.98561)All items(AUC=0.73788)
(b)
0 0.2 0.4 0.6 0.8 10
0.1
0.2
0.3
0.4
0.5
0.6
0.7
0.8
0.9
1
false positive rate
tru
e p
osi
tive
rat
e
ROC
LEVEL 1(AUC=0.98561)LEVEL 2(AUC=0.89237)
(c)
Fig. 4 a Illustration of effect of binarization on real valued data. The solid and dotted lines depict theROC curves for classification performance under real and binary data set. b Illustration of the gainin classification performance after feature selection using association rule mining. c Comparison ofclassification performance under different abstraction levels. Level 1 corresponds to a lower level ofabstraction and hence preserves more details. A leave-one-out cross validation using an RBF kernelbased SVM classifier was used in all cases to evaluate the performance
Multimed Tools Appl (2012) 59:363–382 377
feature attribute which contributed towards flagging ‘ON’ a bit in a group of k items.This is important, because when the association between the items is obtained usingARM, the knowledge of the association between the actual features is also known.
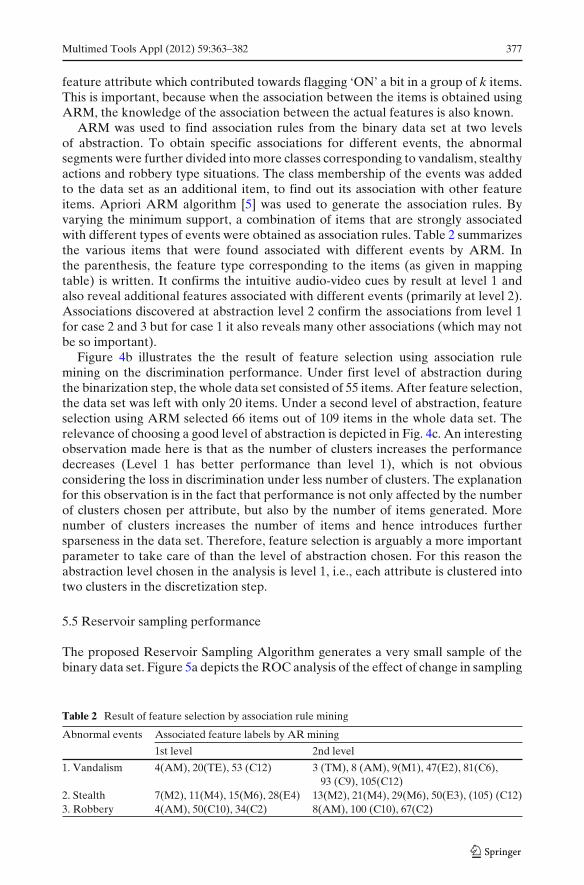
ARM was used to find association rules from the binary data set at two levelsof abstraction. To obtain specific associations for different events, the abnormalsegments were further divided into more classes corresponding to vandalism, stealthyactions and robbery type situations. The class membership of the events was addedto the data set as an additional item, to find out its association with other featureitems. Apriori ARM algorithm [5] was used to generate the association rules. Byvarying the minimum support, a combination of items that are strongly associatedwith different types of events were obtained as association rules. Table 2 summarizesthe various items that were found associated with different events by ARM. Inthe parenthesis, the feature type corresponding to the items (as given in mappingtable) is written. It confirms the intuitive audio-video cues by result at level 1 andalso reveal additional features associated with different events (primarily at level 2).Associations discovered at abstraction level 2 confirm the associations from level 1for case 2 and 3 but for case 1 it also reveals many other associations (which may notbe so important).
Figure 4b illustrates the the result of feature selection using association rulemining on the discrimination performance. Under first level of abstraction duringthe binarization step, the whole data set consisted of 55 items. After feature selection,the data set was left with only 20 items. Under a second level of abstraction, featureselection using ARM selected 66 items out of 109 items in the whole data set. Therelevance of choosing a good level of abstraction is depicted in Fig. 4c. An interestingobservation made here is that as the number of clusters increases the performancedecreases (Level 1 has better performance than level 1), which is not obviousconsidering the loss in discrimination under less number of clusters. The explanationfor this observation is in the fact that performance is not only affected by the numberof clusters chosen per attribute, but also by the number of items generated. Morenumber of clusters increases the number of items and hence introduces furthersparseness in the data set. Therefore, feature selection is arguably a more importantparameter to take care of than the level of abstraction chosen. For this reason theabstraction level chosen in the analysis is level 1, i.e., each attribute is clustered intotwo clusters in the discretization step.
5.5 Reservoir sampling performance
The proposed Reservoir Sampling Algorithm generates a very small sample of thebinary data set. Figure 5a depicts the ROC analysis of the effect of change in sampling
Table 2 Result of feature selection by association rule mining
Abnormal events Associated feature labels by AR mining
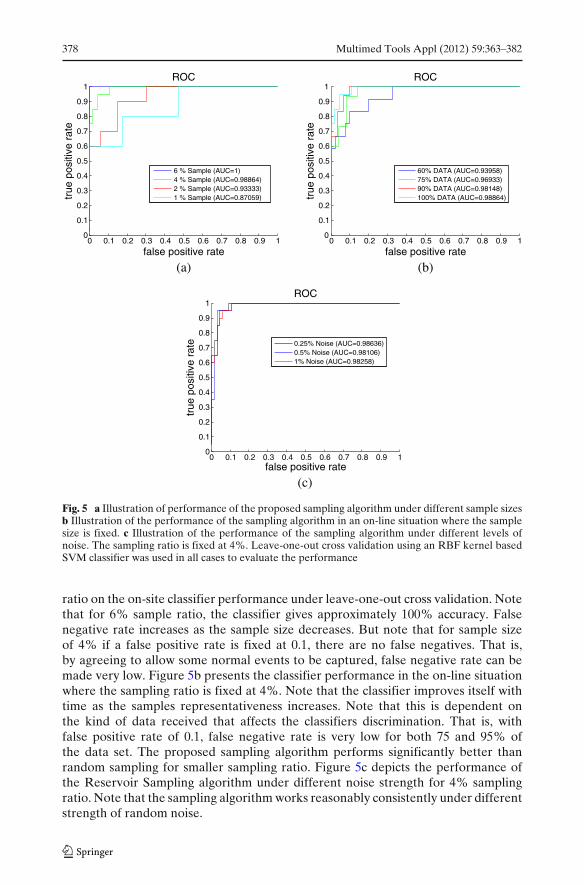
Fig. 5 a Illustration of performance of the proposed sampling algorithm under different sample sizesb Illustration of the performance of the sampling algorithm in an on-line situation where the samplesize is fixed. c Illustration of the performance of the sampling algorithm under different levels ofnoise. The sampling ratio is fixed at 4%. Leave-one-out cross validation using an RBF kernel basedSVM classifier was used in all cases to evaluate the performance
ratio on the on-site classifier performance under leave-one-out cross validation. Notethat for 6% sample ratio, the classifier gives approximately 100% accuracy. Falsenegative rate increases as the sample size decreases. But note that for sample sizeof 4% if a false positive rate is fixed at 0.1, there are no false negatives. That is,by agreeing to allow some normal events to be captured, false negative rate can bemade very low. Figure 5b presents the classifier performance in the on-line situationwhere the sampling ratio is fixed at 4%. Note that the classifier improves itself withtime as the samples representativeness increases. Note that this is dependent onthe kind of data received that affects the classifiers discrimination. That is, withfalse positive rate of 0.1, false negative rate is very low for both 75 and 95% ofthe data set. The proposed sampling algorithm performs significantly better thanrandom sampling for smaller sampling ratio. Figure 5c depicts the performance ofthe Reservoir Sampling algorithm under different noise strength for 4% samplingratio. Note that the sampling algorithm works reasonably consistently under differentstrength of random noise.
Multimed Tools Appl (2012) 59:363–382 379
5.6 Classification
An SVM classifier (libSVM [7]) with RBF kernel was used for analyzing the perfor-mance of the implemented system. The data had an unequal proportion of normaland abnormal events to learn from. Weighting factors in SVM implementation wasused to take care of this. . A leave-one-out cross validation was performed on thedatabase. The choice of the two parameters C = 0.5 and σ = 0.125 of the SVMclassifier used for training was based on a grid search for the best parameter. ROCanalysis was used to evaluate the performance of the classifier, because it gives a fairevaluation of the performance. For a good system the ROC curve should have highvalues of AUC (Area under the curve). It is interesting to note that the proposedsystem preserves the performance of the population even for very low values ofsampling ratio and also under noise. Particularly the performance of the system onthe whole dataset is very close to the performance on the sample data set.
6 Conclusions and future work
This paper discussed a novel framework for onsite extraction of interesting content tosolve the online audio-visual surveillance data management problem. The efficiencyof the approach was based on the use of (1) a short representative sample of thewhole dataset to be used onsite for classification purpose and (2) transformingthe real valued feature dataset to binary space for minimizing storage constraints.For these purposes, an efficient reservoir sampling algorithm and a binarizationscheme is presented. The robustness of the approach was ensured by (1) select-ing highly discriminative audio-visual features based on ARM approach and (2)Dynamic updating of sample to learn new events in online setting. Applied to anATM surveillance data set, interesting results were observed that demonstrate theefficiency and effectiveness of above framework. The association rules obtained givesthe possible association between audio-visual features in characterizing events andfacilitate feature selection that improved the classification performance significantly.The proposed sampling algorithm performed well at as low sampling ratio as 4-6%and at reasonable strength of random noise. As explained in the paper, apart fromintelligent recognition, efficient recognition is also a major concern in surveillance.There can be several related problems on this point itself, starting with this workof using a signature of the database in performing recognition. The future workwill explore the use of saliency information and attention to improve the detectionperformance of the system and compressing data further to accommodate morerecords in the sample. Also some hybrid techniques like in [32] can be investigatedto preserve the temporal order of audio-video semantic cues in representing featurerecords for association mining.
References
1. Agrawal R, Imielinski T, Swami A (1993) Mining association rules between sets of items in largedatabases. In: ACM SIGMOD international conference on management of data, pp 207–216
2. Ali W, Alimi AM (2010) Incremental learning approach for events detection from large videodataset. Seventh IEEE international conference on advanced video and signal based surveil-lance, pp 555–560
380 Multimed Tools Appl (2012) 59:363–382
3. Bobick AF, Davis JW (2001) The recognition of human movement using temporal templates.IEEE Trans Pattern Anal Mach Intell 23(3):257–267
4. Boiman O, Irani M (2005) Detecting irregularities in images and in video. In: Proceedings IEEEinternational conference on computer vision, pp 1985–1988
5. Borgelt C (2010) Apriori-association rule induction. http://www.borgelt.net/apriori.html. Ac-cessed 23 December 2010
6. Bradski G, Davis J (2002) Motion segmentation and pose recognition with motion historygradient. International Journal of Machine Vision and Applications 13(2):174–184
7. Chang C-C, Lin C-J (2001) LIBSVM: a library for support vector machines. Software availableat http://www.csie.ntu.edu.tw/∼cjlin/libsvm. Accessed 23 December 2010
8. Chen M, Chen S-C, Shyu M-L, Wickramaratna K (2006) Semantic event detection via multi-modal data mining. IEEE Signal Process Mag 23:38–46
9. Collins RT, Lipton AJ, Kanade T, Fujiyoshi H, Duggins D, Sin YT, Tolliver D, Enomoto N,Hasegawa O, Burt P, Wixson L (2000) VSAM: a system for video surveillance and monitoring.PA, Technical Report CMU-RI-TR-00-12, Carnegie Mellon Univ., Pittsburgh
10. Cowling M, Sitte R (2003) Comparison of techniques for environmental sound recognition.Pattern Recogn Lett 24(15):2895–2907
11. Fayolle J, Ducottet C, Schon JP (1998) Application of multiscale characterization of edges tomotion determination. IEEE Trans Signal Process 46(4):1174–1179
12. Ganchev T, Fakotakis N, Kokkinakis G (2005) Comparative evaluation of various mfcc imple-mentations on the speaker verification task. In: 10th international conference on speech andcomputer (SPECOM 2005), vol 1, pp 191–194
13. Gonzalez R (2007) Enhancing video surveillance with audio events. 9th Biennial conference ofthe Australian pattern recognition society on digital image computing techniques and applica-tions, pp 61–66
14. Haritaoglu I, Harwood D, Davis LS (2000) W4: real-time surveillance of people and theiractivities. IEEE Trans Pattern Anal Mach Intell 22:809–830
15. Hu M-K (1962) Visual pattern recognition by moment invariants. IEEE Trans Inf Theory8(2):179–187
16. Kieran D, Yan WQ (2010) A framework for an event driven video surveillance system. SeventhIEEE international conference on advanced video and signal based surveillance, pp 97–102
17. Leo M, Spagnolo P, D’Orazio T, Distante A (2004) Human activity recognition in archaeologicalsites by hidden Markov models. PCM 2:1019–1026
18. Marple S (1987) Digital spectral analysis, 2 edn. Prentice-Hall19. Mittal A, Cheong LF (2003) Framework for synthesizing semantic-level indexes. Multimed Tools
Appl 20(2):135–15820. Niu W, Jiao L, Han D, Wang Y (2003) Real-time multi-person tracking in video surveillance. In:
Proceedings of the Pacific Rim multimedia conference vol 2, pp 1144–114821. Oh J, Bandi B (2002) Multimedia data mining framework for raw video sequence. In: Proceed-
ings of internatonal workshop multimedia data management, pp 1–1022. Radhakrishnan R, Divakaran A, Smaragdis A (2005) Audio analysis for surveillance applica-
tions. IEEE workshop on applications of signal processing to audio and acoustics, pp 158– 16123. Spackman KA (1989) Signal detection theory: valuable tools for evaluating inductive learning.
In: Proceedings of the sixth international workshop on machine learning, pp 160–16324. Stauffer C, Grimson W (1999) Adaptive background mixture models for real-time tracking. In:
Proceedings IEEE conf. computer vision and pattern recognition, vol 2, pp 246–25225. Stringa E, Regazzoni C (2000) Real time video shot detection for surveillance applications. IEEE
Trans Image Process 9:69–7926. Tax DMJ, Laskov P (2003) Online svm learning: from classification and data description and
back. In: Proceedings neural networks and signal processing, pp 499–50827. Tziakos I, Cavallaro A, Xu LQ (2010) Local abnormality detection in video using subspace learn-
ing. In: Seventh IEEE international conference on advanced video and signal based surveillance,pp 519–525
28. Valera M, Velastin SA (2005) Intelligent distributed surveillance systems: a review. In: IEEproceedings image and signal processing, vol 152, pp 192–204
29. Wijesekera D, Barbara D (2000) Mining cinematic knowledge. In: Proceedings of internationalworkshop on multimedia data mining, pp 98–103
30. Xiong Z, Radhakrishnan R, Divakaran A, Huang TS (2003) Comparing mfcc and mpeg-7 audiofeatures for feature extraction, maximum likelihood hmm and entropic prior hmm for sportsaudio classification, pp 397–400
31. Zhang D, Gatica-Perez D, Bengio S, McCowan I (2005) Semi-supervised adapted hmms forunusual event detection. In: Proceedings of IEEE conference on computer vision and patternrecognition, vol 1, pp 611–618
32. Zhu X, Wu X, Elmagarmid AK, Feng Z, Wu L (2005) Video data mining: semantic indexing andevent detection from the association perspective. IEEE Trans Knowl Data Eng 17(5):665–677
Praveen Kumar is currently Professor in Dept. of Computer Science, GRIET, Hyderabad, India.Prior to that, he worked as post-doctoral research associate in University of Missouri-Columbia,USA from 2008–2010. He completed his PhD and B.Tech in Computer Science Engineering fromIndian Institute of Technology Roorkee, in the year 2008 and 2005 respectively. His researchinterests are in the areas of computer vision, multi-sensor data fusion, high performance computing,machine learning and information retrieval. In particular, he has extensively researched and acquiredexpertise in state-of-the art computer vision techniques for video surveillance and parallel processingusing novel multicore architecture like Cell, GPUs etc. He has nine international journal papers andmore than 20 conference papers in these areas.
Sujoy Roy is a project manager at the Institute for Infocomm Research (I2R). Before joining I2Rhe completed his PhD in Computer Science from the National University of Singapore in 2006 andMS (Research) in Computer Science and Engineering from the Indian Institute of Technology, NewDelhi in 2001. His research interests are in the field of computer vision, multimedia understanding,management, search and security. He is a member of IEEE and ACM.
382 Multimed Tools Appl (2012) 59:363–382
Ankush Mittal is currently Dean (Research) and a Professor in the Department of ComputerScience and Engg., College of Engineering Roorkee, India. He has served as Associate Professorat IIT Roorkee and has been a faculty member at National University of Singapore. He is arecipient of young scientist awards from the National Academy of Sciences, India (2006), and fromIndian Science Congress Association (2007). He was conferred the IBM Faculty award 2008 and anoutstanding teacher award 2008 by IIT Roorkee for his excellence in teaching. He has contributedmore than 200 research papers in journals and conferences of high repute. His research interests areimage processing, e-learning and bioinformatics.