402
i
i
i
Osborne Gaebler says :
“What gets measured gets done
If you don’t measure results, you can’t tell succes s from failure
If you can’t see success, you can’t reward it
If you can’t reward success, you are probably rewar ding failure
If you can’t see success, you can’t learn from it
If you can’t recognize failure, you can’t correct i t
If you can demonstrate results, you can win public support”
ii
It is important to note that Integrated Development Plans are the Five-year (05)
Development Plans of municipalities that are adopted at the beginning of Five-
year Council terms. This 2017 / 18 – 2021 / 22 IDP was adopted by the Council
of the Nelson Mandela Bay Municipality at its sitting on 28 June 2017. The IDP
is reviewed annually. Certain aspects of the document will remain the same for
the duration of the 5-year period within which the IDP is in effect, with some
changes being made to aspects of it on a yearly basis.
iii
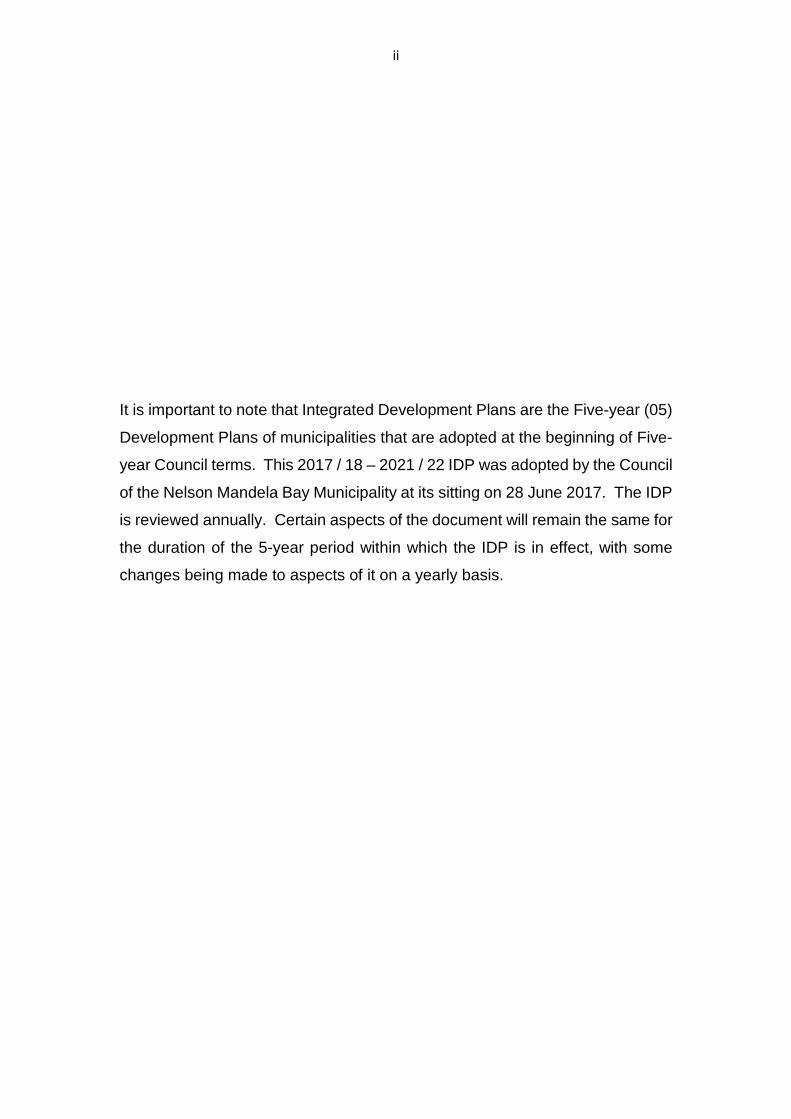
NELSON MANDELA BAY MUNICIPALITY (2016 DEMARCATION)
iv
TABLE OF CONTENTS
FOREWORD BY THE EXECUTIVE MAYOR ................... .........................................................1 FOREWORD BY THE CITY MANAGER ...................... .............................................................4 CHAPTER 1: INTRODUCTION ........................... ......................................................................6 1.1 CONTEXT AND OVERVIEW ..............................................................................................6 1.2 ABOUT NELSON MANDELA BAY ................................................................................. 10 1.3 VISION, MISSION AND BRAND PROMISE....................................................................... 10 1.4 POLITICAL STRUCTURE ............................................................................................... 15 1.5 ADMINISTRATION ....................................................................................................... 20 1.6 LEGISLATIVE AND POLICY MANDATES AND ALIGNMENT WITH LONG-TERM VISION ......... 22 1.7 BATHO PELE PRINCIPLES ........................................................................................... 32 1.8 IMPLEMENTING THE LONG-TERM DEVELOPMENT PLAN ................................................ 33 CHAPTER 2: SITUATIONAL ANALYSIS.................... ........................................................... 36 CHAPTER 3: METHODOLOGY ............................ ................................................................. 63 CHAPTER 4: SPATIAL STRATEGY ....................... ............................................................... 68 CHAPTER 5: DELIVERY APPROACH ...................... ............................................................ 93 5.1 CORPORATE SERVICES .............................................................................................. 93 5.2 CHIEF OPERATING OFFICER ....................................................................................... 95 5.3 INFRASTRUCTURE, ENGINEERING, ELECTRICITY AND ENERGY ...................................... 96 5.4 HUMAN SETTLEMENTS ............................................................................................. 101 5.5 PUBLIC HEALTH ....................................................................................................... 105 5.6 ECONOMIC DEVELOPMENT, TOURISM AND AGRICULTURE (EDTA) ............................. 106 5.7 SPORTS, RECREATION, ARTS AND CULTURE ............................................................. 110 5.8 SAFETY AND SECURITY ............................................................................................ 112 CHAPTER 6: DELIVERY PLAN .......................... ................................................................. 115 CHAPTER 7: BUDGET ................................. ........................................................................ 221 CHAPTER 8: OVERSIGHT, REPORTING, MONITORING AND EVA LUATION ................ 288 8.1 EXECUTIVE MAYOR .................................................................................................. 288 8.2 CITY MANAGER ....................................................................................................... 289 8.3 MUNICIPAL PUBLIC ACCOUNTS COMMITTEE .............................................................. 290 8.4 RULES AND ETHICS COMMITTEE ............................................................................... 291 8.5 OFFICE OF THE AUDITOR-GENERAL .......................................................................... 291 8.6 AUDIT COMMITTEE ................................................................................................... 292 8.7 INTERNAL AUDIT AND RISK ASSURANCE ................................................................... 292 8.8 PERFORMANCE, MONITORING AND EVALUATION ....................................................... 293 8.9 SUPPLY CHAIN MANAGEMENT .................................................................................. 298 8.10 WARD COMMITTEES ................................................................................................. 299 8.11 SPECIAL SECTORS AND MAINSTREAMING ................................................................. 299 ANNEXURE “A” – Documented changes in the IDP
ANNEXURE “B” – Public Participation Report
ANNEXURE “C” – Ward Priorities
v
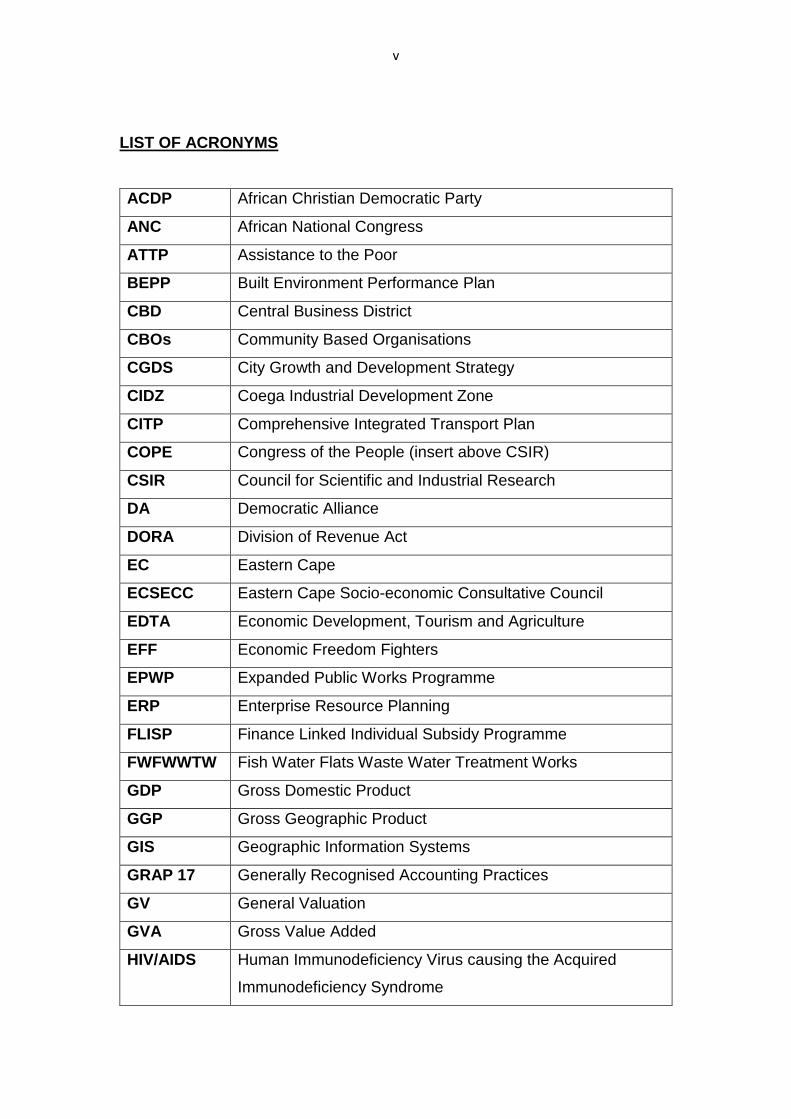
LIST OF ACRONYMS
ACDP African Christian Democratic Party
ANC African National Congress
ATTP Assistance to the Poor
BEPP Built Environment Performance Plan
CBD Central Business District
CBOs Community Based Organisations
CGDS City Growth and Development Strategy
CIDZ Coega Industrial Development Zone
CITP Comprehensive Integrated Transport Plan
COPE Congress of the People (insert above CSIR)
CSIR Council for Scientific and Industrial Research
DA Democratic Alliance
DORA Division of Revenue Act
EC Eastern Cape
ECSECC Eastern Cape Socio-economic Consultative Council
EDTA Economic Development, Tourism and Agriculture
EFF Economic Freedom Fighters
EPWP Expanded Public Works Programme
ERP Enterprise Resource Planning
FLISP Finance Linked Individual Subsidy Programme
FWFWWTW Fish Water Flats Waste Water Treatment Works
GDP Gross Domestic Product
GGP Gross Geographic Product
GIS Geographic Information Systems
GRAP 17 Generally Recognised Accounting Practices
GV General Valuation
GVA Gross Value Added
HIV/AIDS Human Immunodeficiency Virus causing the Acquired
Immunodeficiency Syndrome
vi
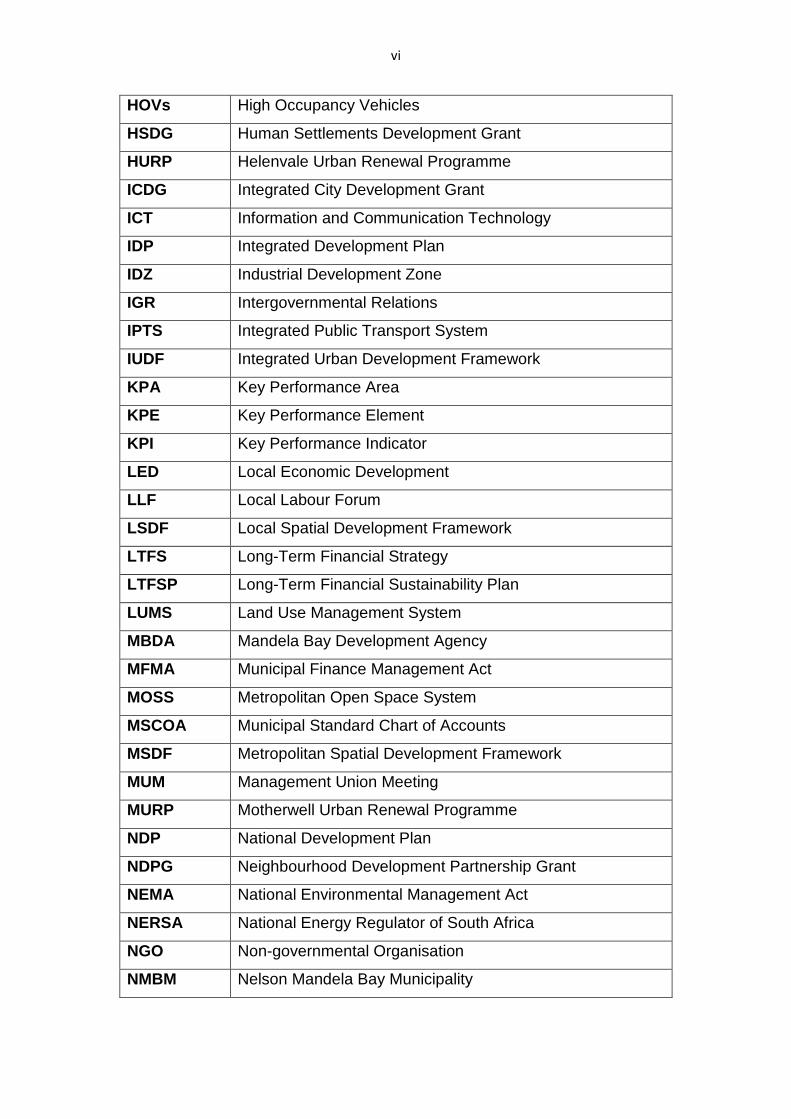
HOVs High Occupancy Vehicles
HSDG Human Settlements Development Grant
HURP Helenvale Urban Renewal Programme
ICDG Integrated City Development Grant
ICT Information and Communication Technology
IDP Integrated Development Plan
IDZ Industrial Development Zone
IGR Intergovernmental Relations
IPTS Integrated Public Transport System
IUDF Integrated Urban Development Framework
KPA Key Performance Area
KPE Key Performance Element
KPI Key Performance Indicator
LED Local Economic Development
LLF Local Labour Forum
LSDF Local Spatial Development Framework
LTFS Long-Term Financial Strategy
LTFSP Long-Term Financial Sustainability Plan
LUMS Land Use Management System
MBDA Mandela Bay Development Agency
MFMA Municipal Finance Management Act
MOSS Metropolitan Open Space System
MSCOA Municipal Standard Chart of Accounts
MSDF Metropolitan Spatial Development Framework
MUM Management Union Meeting
MURP Motherwell Urban Renewal Programme
NDP National Development Plan
NDPG Neighbourhood Development Partnership Grant
NEMA National Environmental Management Act
NERSA National Energy Regulator of South Africa
NGO Non-governmental Organisation
NMBM Nelson Mandela Bay Municipality
vii
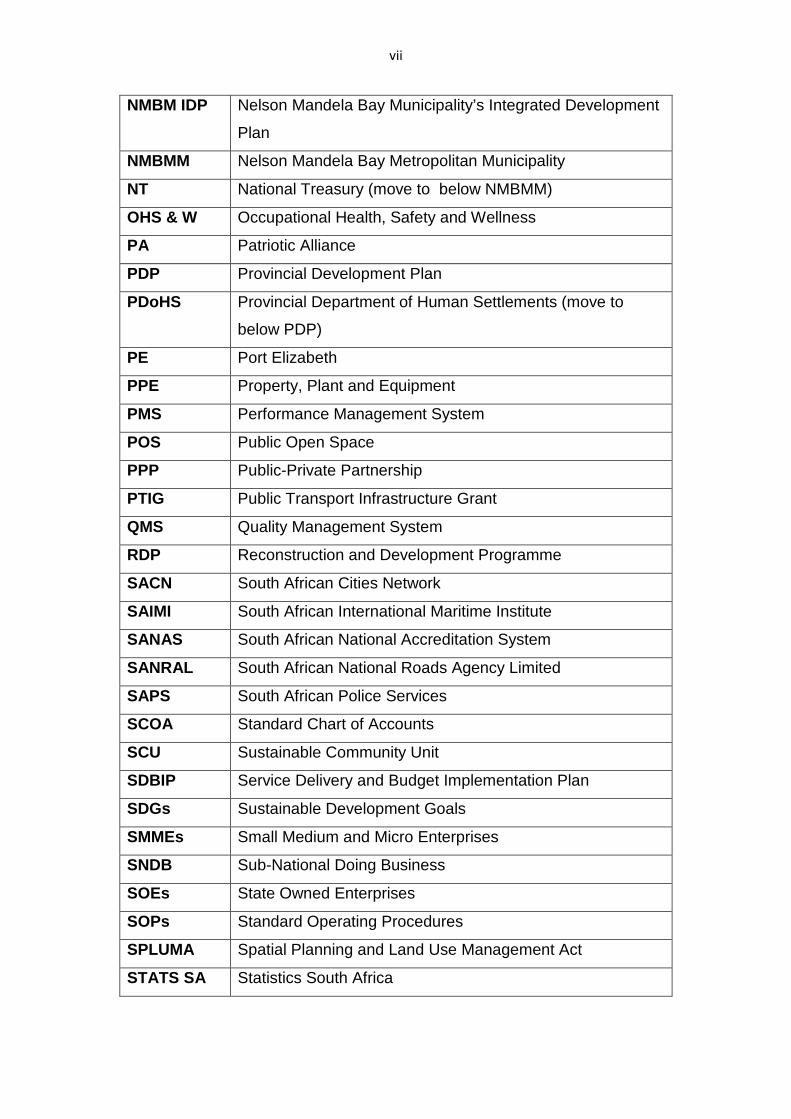
NMBM IDP Nelson Mandela Bay Municipality’s Integrated Development
Plan
NMBMM Nelson Mandela Bay Metropolitan Municipality
NT National Treasury (move to below NMBMM)
OHS & W Occupational Health, Safety and Wellness
PA Patriotic Alliance
PDP Provincial Development Plan
PDoHS Provincial Department of Human Settlements (move to
below PDP)
PE Port Elizabeth
PPE Property, Plant and Equipment
PMS Performance Management System
POS Public Open Space
PPP Public-Private Partnership
PTIG Public Transport Infrastructure Grant
QMS Quality Management System
RDP Reconstruction and Development Programme
SACN South African Cities Network
SAIMI South African International Maritime Institute
SANAS South African National Accreditation System
SANRAL South African National Roads Agency Limited
SAPS South African Police Services
SCOA Standard Chart of Accounts
SCU Sustainable Community Unit
SDBIP Service Delivery and Budget Implementation Plan
SDGs Sustainable Development Goals
SMMEs Small Medium and Micro Enterprises
SNDB Sub-National Doing Business
SOEs State Owned Enterprises
SOPs Standard Operating Procedures
SPLUMA Spatial Planning and Land Use Management Act
STATS SA Statistics South Africa
viii
SWOT Strengths, Weaknesses, Opportunities and Threats
TOD Transit Oriented Development
UDM United Democratic Movement
UFEC United Front Eastern Cape
UNS Urban Network Strategy
USDG Urban Settlements Development Grant
WWTW Waste Water Treatment Works
1
FOREWORD BY THE EXECUTIVE MAYOR
The August 2016 Local Government elections delivered an exciting change of
administration to Nelson Mandela Bay. This historic about-turn and rejection of
the maladministration of the previous administration heralded in the new DA-
led coalition government in Nelson Mandela Bay.
The participating coalition partners and their respective parties had all
campaigned in one way or another on the offer of change and a commitment to
stopping corruption, growing our economy in order to create jobs, and
improving service delivery. These are the seminal issues that influenced the
electorate to vote against the status quo and to vote for change.
It was also perhaps predestined that in a city named after our iconic first
democratically elected President, Nelson Mandela, we would have to govern in
a coalition of different parties in a spirit of cooperation, reconciliation and united
interest to deal with the issues of all the citizens of the City and their respective
needs.
This change of administration brought not only much excitement, anticipation
and expectation; it brought a fresh approach to governance. Almost
immediately after our elections, we embarked on the most comprehensive
interaction with citizens ever across all sixty wards and all stakeholder
communities in an endeavour to craft a credible IDP, based on the actual needs
of all the communities in our City.
We also informed these communities unambiguously about what the objectives
of this new administration are.
We have built our new administration on six pillars, which will form the
foundation of what kind of city this new administration wishes to create in our
term of office.

2
The first and probably most important pillar is to create an Opportunity City.
This is intended to create, facilitate and stimulate an economic environment that
is growing and able to provide job opportunities to especially our youth, who
are faced with 49% unemployment. As long as this situation prevails, we will
not be able to turn the current socio-economic conditions around. The
opportunity to find a job brings dignity and independence and breaks the cycle
of dependency in poor communities. This is our objective.
The next pillar, which is also directly linked to the one above, is creating a
Caring City. Our vision of a caring city is one that treats everyone with fairness
and that freedom and opportunity for all becomes a lived reality in our City.
Creating a Safe City is the next pillar of our strategy. This does not focus on
crime and the combating thereof only, even though the role of the Metro Police
Service is central to achieving this, in collaboration with the SAPS. A Safe City
is one that ensures that streets are illuminated, that roads are trafficable, so
that commuters are not dropped off kilometres from where they live, that
everyone has access to safe drinking water and safe electricity, and that women
and children do not feel more vulnerable than other sections of society.
We also aim to create an Inclusive City, which deals finally with the spatial
reality of the apartheid legacy, where we will do everything in our power to
transform “townships” into suburbs and make provision for social housing within
the confines of the inner-city and on vacant pieces of land in order to integrate
communities who have for generations been separated by political design and
kept apart from areas of economic opportunity.
Then, with regard to effective, efficient and economic government, we aim to
be an example of good governance by becoming an exemplary and Well Run
City. In this regard, we know where the bar is set in South Africa and, as the
leading party in this coalition, we will use the examples of best practice that we
have access to through the DA’s good governance department. We are
fortunate that we do not have to reinvent the wheel in this regard; we will select
3
policies and practices that have yielded renowned results and apply these to
our unique circumstances and needs.
In conclusion, we also intend to ensure that we are a Forward Thinking City that
makes provision for multi-generational planning in order to avoid duplication or
negligence, which results in wasted expenditure. We also believe that a forward
thinking city is a Smart City and that every latest and practical application of the
electronic and information age should be incorporated into our systems and
daily operations in order to minimise bureaucratic bottlenecks and restrictive
administrative red tape.
We are determined to become a destination of choice for investment in
commerce by exploiting our niche economic and competitive advantage, such
as having two world-class ocean ports. Tourism is also one of our singularly
unique advantages in that we are rapidly becoming a sports tourism destination
of choice, based on our magnificent climate and world-class beaches situated
in a beautiful and safe bay that is home to some of our rarest ocean birds,
mammals and fish.
Nelson Mandela Bay is open for business and we are committed to improving
our image in the world’s network of economic and tourism supply and demand.
We recognise, too, the more and more important role major cities are playing
in driving regional economies and we plan to be the main catalyst in our regional
economic growth.
COUNCILLOR ATHOL TROLLIP
EXECUTIVE MAYOR
4
FOREWORD BY THE CITY MANAGER
The IDP is a five-year strategic living document that is reviewed on an annual
basis. Following the 2016 Local Government elections, the newly constituted
Council approved the 2017/18 IDP and Budget schedule. This IDP was duly
subjected to public participation process, as prescribed by the Municipal
Systems Act. There was an extensive public participation process, which also
prioritised consultation with key sectors that are significant role players in the
economy of Nelson Mandela Bay, namely SMMEs and the manufacturing,
automotive, construction, Green Economy, Ocean Economy, tourism,
agriculture, transport and services sectors. This platform was also used to
share the new vision of the NMBM – “an iconic, friendly ocean City driven by
innovation, service excellence and economic development – a destination of
choice”.
This vision is centred on six key pillars: The Well-Run City; The Opportunity
City; the Caring City; The Inclusive City; The Safe City; and The Forward
Thinking City. This IDP is the stepping stone towards achieving the vision of
the City, based on these six pillars. The issues and needs raised by the
communities from the six clusters in Nelson Mandela Bay, and the
representatives of children, youth, elderly and differently abled persons; as well
as key role-players in the Metro’s economy, are all aligned to the six pillars.
These stakeholders emphasised, amongst other things, the provision and
improvement of basic services; focus on early childhood development; the
visibility of the Metro Police; job creation; the empowerment of SMMEs and the
revitalisation of business hives; urgent engagement with Transnet to expedite
the relocation of the manganese ore facilities and fuel storage tanks in order to
develop the Harbour; strengthening collaboration within and amongst sectors;
and revamping dilapidated signage across the Metro.
5
The expectations of our stakeholders require a change of mind-set in how we
conduct our business as the City administration – it cannot be business as
usual. This IDP is the beginning of a new journey that we are committed to
embrace. It responds to the issues raised by our stakeholders.
The only gap that we must close is the lack of active participation by sector
government departments in the IDP process. The significance of their
participation cannot be overemphasised, as they play a key role in the
development of our municipal space; therefore, collaboration with them is
important. We should therefore strive for the IDP not only to be seen as, but to
become a central planning tool for the three spheres of government.
Many thanks to our stakeholders who participated during the review process of
the IDP. Their inputs have enriched our five-year road map.
JOHANN METTLER
CITY MANAGER
6
CHAPTER 1: INTRODUCTION
1.1 Context and overview
Municipalities are constitutionally mandated to prepare a five-year Integrated
Development Plan (IDP), which serves as a strategic action and service
delivery oriented resource and, as such, supersedes all other plans that inform
the developmental agenda in local government. Accordingly, the Nelson
Mandela Bay Municipality’s IDP outlook is guided by its developmental goals,
including the programmes of the provincial and national government.
The Nelson Mandela Bay Municipality’s IDP is a strategic planning instrument
that requires the participation and input of all Metro residents. As such, it
informs and guides all relevant planning, management, budgeting and decision-
making processes within the institution.
It has the potential to transform local communities in direct response to the
needs of our diverse communities and adapt to their changing demands and
expectations. And for this reason, communities are participating more
dynamically in decisions and resource allocation, especially around the
municipal budget and strategic planning initiatives. This is given expression
through active involvement, giving residents more say in the provision of
services and by enhancing customer satisfaction as the primary determinant of
our success in the provision of services.
The following role-players and stakeholders were consulted during the IDP and
Budget development and review processes of the Municipality:
• Communities of Nelson Mandela Bay
• Organised stakeholder groupings, e.g. Chambers of Commerce; NGOs;
civic groupings; unions; and ratepayers’ associations
• Institutions of Higher Learning and government sector departments
7
• Surrounding municipalities
• Special sectors (youth, women, elderly people and people with
disabilities)
• Economic sectors
• Creative arts and heritage Organisations
• Municipal Councillors and officials; and
• Ward Committees
The current administration, under the hand of a multi-party coalition, is facing
the complex challenge of transforming the institution in order to eradicate the
legacy of apartheid and the dysfunctional state of affairs inherited from previous
administrations. It has engaged in a full evaluation of the functioning of every
aspect affecting the lives of communities in Nelson Mandela Bay. It spells,
succinctly, our vision and mission, which are given life and practical expression
through the six foundational pillars on which the Municipality’s developmental
priorities are hinged.
Our Constitution requires us as local government to be developmental – a
responsibility to structure and manage the administrative, budgeting and
planning processes that will give expression and priority to the basic needs of
communities and to promote their social and economic development. Hence
our IDP sets out a vision for the future of local government in Nelson Mandela
Bay, in line with legislation and the Constitution.
Our vision points to democratic local government in which the needs of all, but
especially the poor and vulnerable communities, are met with efficiency and
effectiveness. This will ensure that we are accountable and viable, and capable
of delivering sustainable services that meet the diverse needs of our
communities.
Our IDP, the strategic planning document against which this Council’s
performance is judged, is committed to its developmental vision and the
creation of a vibrant local sphere that spells a clean break from the past. It is
8
an implicit acknowledgement of our electoral mandate, but also to ensure that
this mandate is constantly challenged and refreshed through oversight and
scrutiny by communities that will ultimately effect meaningful change. In a
nutshell, it is aimed and geared at restructuring and transforming municipal
governance to meet the demands, first and foremost of our communities, as
well as the demands of living in a globalised world.
Together with our communities, we have identified where we are and where we
want to be in the future. And to do this, we realize that we need to understand
the complexity of the challenges confronting our Metro and the significant
trends that influence the direction in which the future unfolds. All of this is
needed to be taken into account when establishing the strategic plan for the
future of our Metro. In doing so, we improved accountability and transparency
with residents in order to achieve the vision and commitment of the city on its
journey into the future. Developing accountability is a key aspect of our strategy
as we engage with our residents through honest and frank dialogue to gauge
expectations and measure performance around the needs of residents.
All of our efforts can succeed only if there is sufficient capacity within municipal
leadership to drive the process for change. Political leadership is crucial in
driving transformation and achieving the desired results in performance, as well
as the need to ensure appropriate staffing levels and build the capacity of
municipal employees.
This IDP is a bold and confident attempt to achieve the fundamental
reorganization and necessary change of municipal governance in Nelson
Mandela Bay, as directed by our communities and as required by legislation
and the Constitution. It has the innate potential to create a local government
environment that combines the best from within communities with best practice
from around the world that will stimulate socio-economic growth and play a key
role in attaining our developmental priorities as outlined.
9
It is evident that we need new perspectives all the time to live up to the
expectations of communities. We need to think and dream big – harnessing our
collective dreams, knowledge, creativity and motivation in order to find new
ways to develop strategic city strategies for delivering prosperous and socially
harmonious environments for all our citizens and ensuring the evolvement of
Nelson Mandela Bay.
The enormous complexity of our Metro today means that the demands on
infrastructure and services are extremely challenging. Not only are the basic
needs of transport, housing, water and energy under strain, but new demands
are emerging in other areas. And for this reason, the IDP gives a holistic view
that seeks to measure the impacts on and of development in our city. It
envisages improving services to residents through rapid response and
innovative solutions that allow for more effective collaboration, resulting in
better communication and better services for our communities.
As the 21st century unfolds, and we move ever faster towards global economic
integration, our role as a city is to drive growth, prosperity and social wellbeing.
Nelson Mandela Bay must become a Well Run City; an Opportunity City; a Safe
City; an Inclusive City; a Caring City; and a Forward Thinking City – which
simply means a modern city, somewhere to grow, to develop and to enjoy. But
also a place to work, to educate, to socialize and to relax. At the same time,
social disunity, crime and poverty cannot be ignored. These factors motivate
the ongoing aspiration of a city that improves people’s lives and meet their
needs in all areas of life.
Change is real and the demands of the future are pressing on us all. We need
to lead with the vision and the dreams that will empower and inspire all our
people living in Nelson Mandela Bay. Our rapidly changing communities are
creating a need for strategic development that offers constant innovation and a
renewal of processes and people’s attitudes. And this is exactly what this IDP
encapsulates.
10
1.2 About Nelson Mandela Bay
A mecca for both local and international beach sporting activities and outdoor
fun, Nelson Mandela Bay offers a bounty of rich pickings in many aspects. It
combines the best of all worlds – the economic opportunities and benefits of a
large city and the genuine, warm hospitality for which its residents are rightly
famous.
The city’s entry point showcases its monumental developmental aspirations
and capabilities, with the most modern deep-water port in the Southern
Hemisphere, the Port of Ngqura.
Nelson Mandela Bay is the hub of the automotive industry on the African
continent, with many major international vehicle and component manufacturers
based in the city. It is a preferred region for the manufacturing of
pharmaceuticals, flour, meat, frozen veggies, soft drinks, chocolates, cheese,
yoghurt, ice-cream, paper and leather products.
A paradise for nature lovers, nowhere else in South Africa does a city offer the
Big 7 wildlife, malaria-free game reserves and such warm, friendly people.
Furthermore, it carries the rich legacy of an area that saw the first meetings of
the Khoisan, British, Dutch, German and Xhosa people.
The landing place of the 1820 Settlers, it boasts some of the finest Victorian
and Edwardian architecture in South Africa.
1.3 Vision, Mission and Brand Promise
MISSION
To create Freedom, Fairness and Opportunity for all in NMBM; stop
corruption; create jobs; and improve service delive ry
11
VISION
An iconic, friendly, ocean city driven by innovatio n, service excellence
and economic development – a destination of choice
BRAND PROMISE
One City One Future
The IDP is required to:
• link, integrate and coordinate plans and take into account proposals for
the development of the Municipality and the achievement of transversal
governance;
• align the resources and capacity of the Municipality with the
implementation of the Plan;
• form the policy framework and general basis of annual budgets;
• be developmentally oriented;
• comply with the provisions of Chapter 5 of the Municipal Systems Act;
• be compatible with national and provincial and provincial development
plan requirements, which are binding on the Municipality in terms of
legislation.
The NMBM’s IDP is anchored on six pillars; the foundations on which the
Municipality’s developmental priorities are hinged.
‘THE WELL RUN CITY’
This pillar pertains to all initiatives that cater for meeting the standard
operational expectations of the Municipality, including initiatives that address
human resources, systems, accountable governance and the financial viability
of the institution.
12
Objectives :
Nelson Mandela Bay strives to:
• Transform the institutional systems, processes and organizational
structure to one of high performance in order to effectively deliver
basic services.
• Ensure that the Municipality is staffed throughout with a
motivated, committed and capable workforce.
• Ensure financial prudence and transparent governance and work
towards eradicating corruption.
‘THE OPPORTUNITY CITY’
The Opportunity City delivers on well-planned initiatives to enable and cultivate
job creation and economic opportunity, develop competitive advantage, and
ensure access to skills.
Objectives :
Nelson Mandela Bay strives to:
• Grow and diversify the local economy through the attraction of
new investment, skills development and facilitation of an enabling
environment for small business growth and job creation.
• Facilitate and promote infrastructure led growth, development
and tourism.
‘THE SAFE CITY’
This pillar speaks to all initiatives that address safety and security. It also
includes those that create environmental safety, as well as safety for residents
and tourists.
13
Objectives :
Nelson Mandela Bay strives to:
• Deliver well-resourced and capacitated policing and emergency
services in order to ensure the safety of communities and visitors
• Provide infrastructure that improves the safety of communities
and visitors
• Improve the safety and security of Nelson Mandela Bay through
community, industry and civic organisation partnerships
‘THE INCLUSIVE CITY’
This pillar relates to initiatives to promote equality and social cohesion and that
enable informal means of mobility between communities.
Objectives :
Nelson Mandela Bay strives to:
• Ensure institutional accessibility, effective communication
channels for participatory and responsive governance
• Deliver spatial and built environment developments that promote
integrated neighbourhoods, inclusive communities and a well-
connected Nelson Mandela Bay.
• Deliver on transformation objectives, promote redress and foster
social cohesion.
‘THE CARING CITY’
In a Caring City, equality is strived for through ensuring that all residents have
access to delivery that promotes their well-being.
14
Objectives :
Nelson Mandela Bay strives to:
• Provide for the social needs of communities and empowerment of
vulnerable people through provision of access to social services,
social development programmes and indigent support.
• Promote the health and well-being of all communities through the
spatially equitable provision of social infrastructure.
• Provide effective general environmental and public health
services.
• Provide dignified housing and sanitation and accelerate access to
improved services to indigent households in order to create safe
and decent living conditions for all residents.
‘THE FORWARD THINKING CITY’
The Forward Thinking City is concerned with institutional innovation, support
for research and development, and plans for future sustainability.
Objectives :
Nelson Mandela Bay strives to:
• Ensure multi-generational planning that promotes sustainable
economic growth through research and development, innovation
and the optimal use and development of technology.
• Develop an environmentally sustainable city through proactive
planning, and conservation of resources and the natural and built
environments.
15
1.4 Political structure
The Nelson Mandela Bay Municipality is governed by a coalition government,
comprising the following political parties: the Democratic Alliance (DA), United
Democratic Movement (UDM), the Congress of the People (COPE), and the
African Christian Democratic Party (ACDP).
The political structure of the Nelson Mandela Bay Municipality comprises the
Council, the Executive Mayoral Committee, the Portfolio Committees and the
Municipal Public Accounts Committee (MPAC), as described below.
1.4.1 Council
The role of a council in local government is that of lawmaker and, as such, it
focuses on legislation, participation and oversight. In addition, municipal
councils facilitate political discussions and debate in order to assist in decision-
making.
The Council of the Nelson Mandela Bay Municipality is headed by the Speaker
and comprises 120 Councillors, elected through a mixed-member proportional
representation system. Altogether 60 of those Councillors were elected through
a voting process in the 60 wards that make up Nelson Mandela Bay. The
remaining 60 Councillors were selected from party lists, on the basis that the
total number of party representatives must be proportional to the number of
votes received.
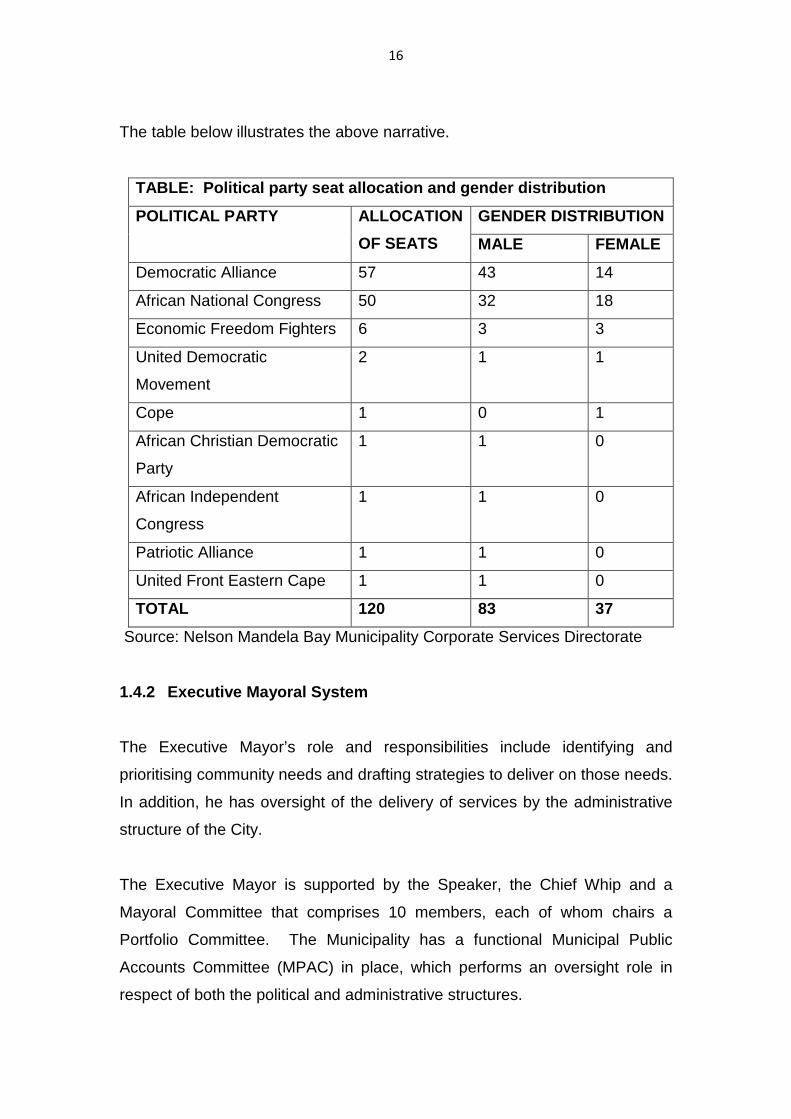
Of the 120 Councillors serving in Nelson Mandela Bay, 37 are females and 83
are males. The Democratic Alliance has the largest number of seats (57),
followed by the African National Congress (ANC) (50 seats); the Economic
Freedom Fighters (EFF) (6 seats); the United Democratic Movement (2 seats);
and the Congress of the People, the Patriotic Alliance (PA), the United Front
Eastern Cape (UFEC), African Christian Democratic Party (ACDP) and the
African Independent Congress (AIC) (1 seat each).
16
The table below illustrates the above narrative.
Source: Nelson Mandela Bay Municipality Corporate Services Directorate
1.4.2 Executive Mayoral System
The Executive Mayor’s role and responsibilities include identifying and
prioritising community needs and drafting strategies to deliver on those needs.
In addition, he has oversight of the delivery of services by the administrative
structure of the City.
The Executive Mayor is supported by the Speaker, the Chief Whip and a
Mayoral Committee that comprises 10 members, each of whom chairs a
Portfolio Committee. The Municipality has a functional Municipal Public
Accounts Committee (MPAC) in place, which performs an oversight role in
respect of both the political and administrative structures.
TABLE: Political party seat allocation and gender distribution
POLITICAL PARTY ALLOCATION
OF SEATS
GENDER DISTRIBUTION
MALE FEMALE
Democratic Alliance 57 43 14
African National Congress 50 32 18
Economic Freedom Fighters 6 3 3
United Democratic
Movement
2 1 1
Cope 1 0 1
African Christian Democratic
Party
1 1 0
African Independent
Congress
1 1 0
Patriotic Alliance 1 1 0
United Front Eastern Cape 1 1 0
TOTAL 120 83 37
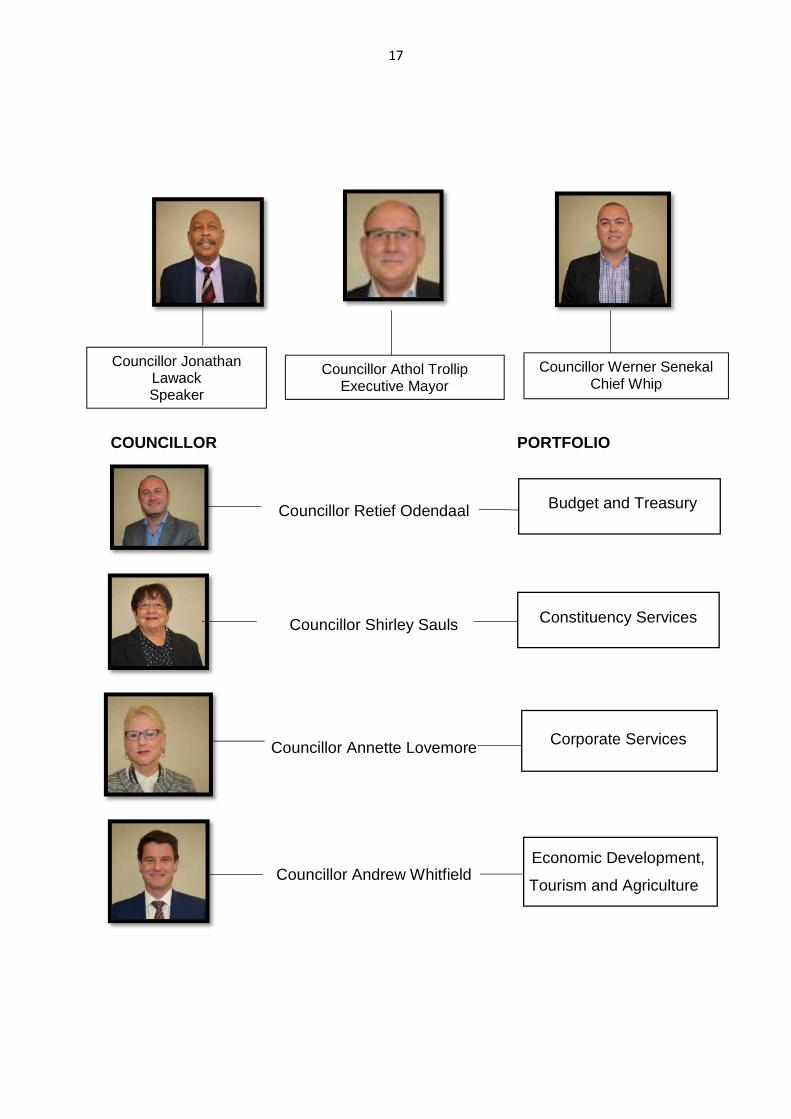
17
COUNCILLOR PORTFOLIO
Councillor Retief Odendaal Budget and Treasury
Councillor Shirley Sauls Constituency Services
Councillor Annette Lovemore Corporate Services
Councillor Andrew Whitfield Economic Development,
Tourism and Agriculture
Councillor Athol Trollip Executive Mayor
Councillor Jonathan Lawack Speaker
Councillor Werner Senekal Chief Whip
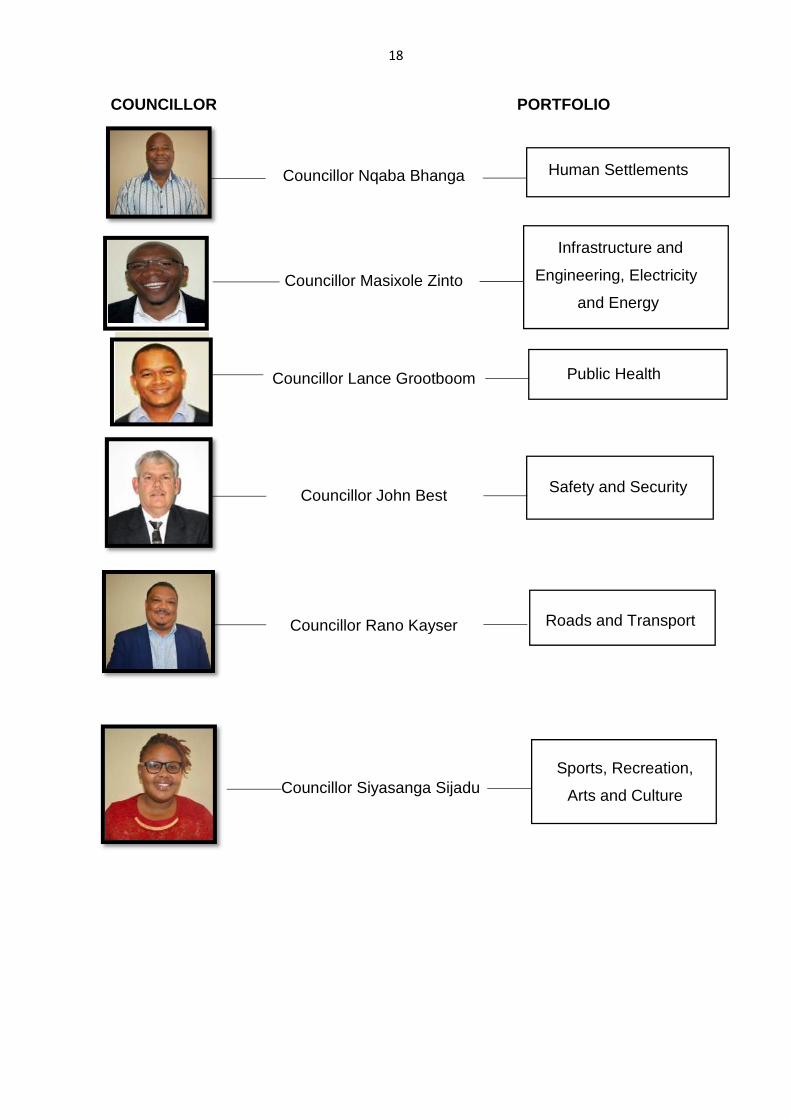
18
COUNCILLOR PORTFOLIO
Councillor Nqaba Bhanga Human Settlements
Councillor Masixole Zinto
Infrastructure and
Engineering, Electricity
and Energy
Councillor Lance Grootboom Public Health
Councillor John Best Safety and Security
Councillor Rano Kayser Roads and Transport
Councillor Siyasanga Sijadu Sports, Recreation,
Arts and Culture
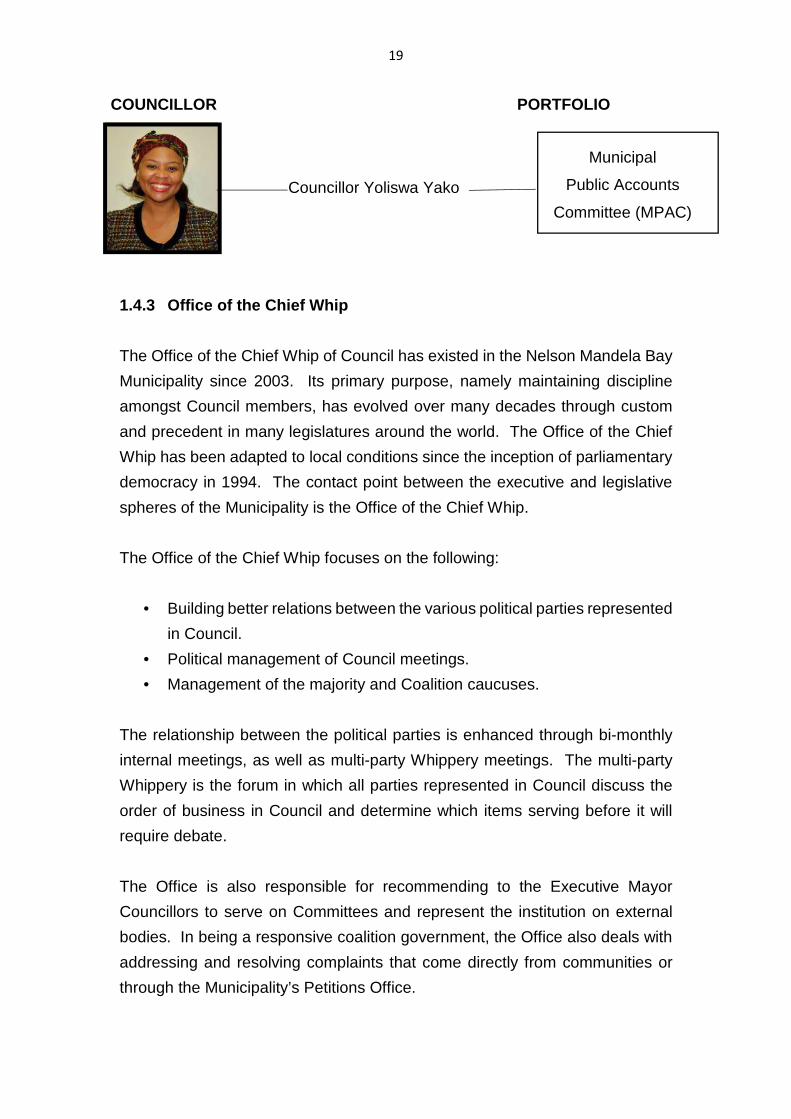
19
COUNCILLOR PORTFOLIO
Councillor Yoliswa Yako
Municipal
Public Accounts
Committee (MPAC)
1.4.3 Office of the Chief Whip
The Office of the Chief Whip of Council has existed in the Nelson Mandela Bay
Municipality since 2003. Its primary purpose, namely maintaining discipline
amongst Council members, has evolved over many decades through custom
and precedent in many legislatures around the world. The Office of the Chief
Whip has been adapted to local conditions since the inception of parliamentary
democracy in 1994. The contact point between the executive and legislative
spheres of the Municipality is the Office of the Chief Whip.
The Office of the Chief Whip focuses on the following:
• Building better relations between the various political parties represented
in Council.
• Political management of Council meetings.
• Management of the majority and Coalition caucuses.
The relationship between the political parties is enhanced through bi-monthly
internal meetings, as well as multi-party Whippery meetings. The multi-party
Whippery is the forum in which all parties represented in Council discuss the
order of business in Council and determine which items serving before it will
require debate.
The Office is also responsible for recommending to the Executive Mayor
Councillors to serve on Committees and represent the institution on external
bodies. In being a responsive coalition government, the Office also deals with
addressing and resolving complaints that come directly from communities or
through the Municipality’s Petitions Office.
20
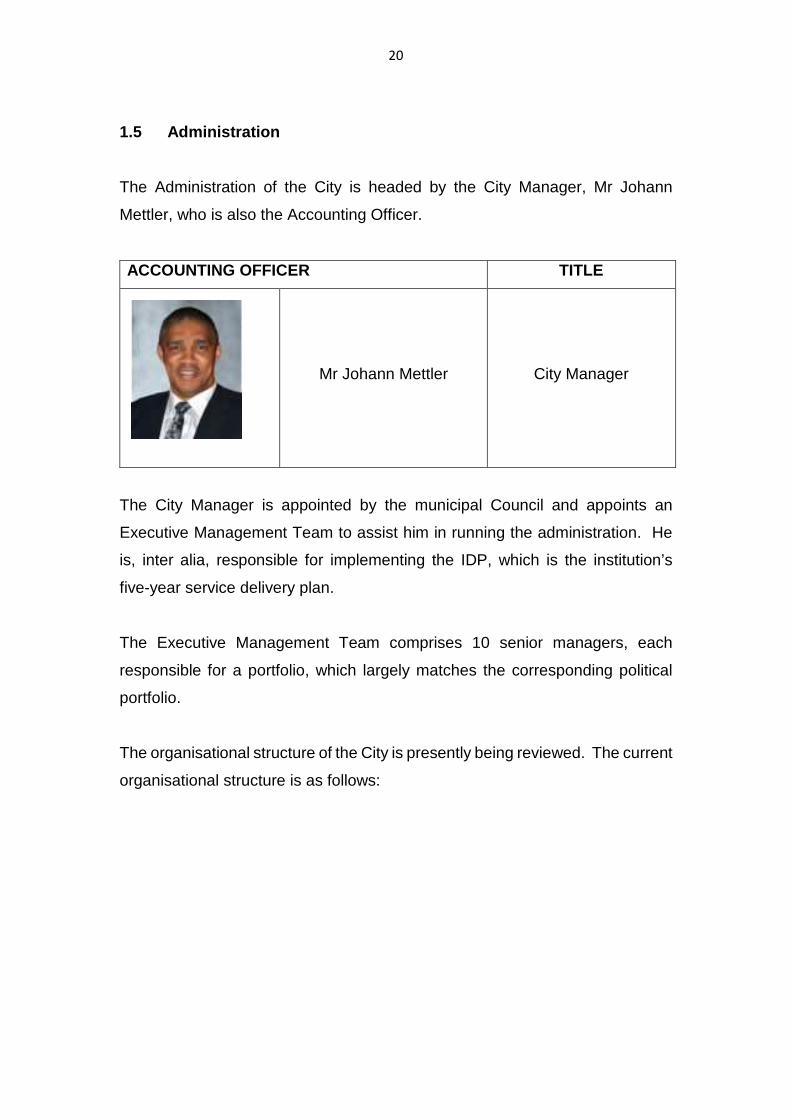
1.5 Administration
The Administration of the City is headed by the City Manager, Mr Johann
Mettler, who is also the Accounting Officer.
ACCOUNTING OFFICER TITLE
Mr Johann Mettler City Manager
The City Manager is appointed by the municipal Council and appoints an
Executive Management Team to assist him in running the administration. He
is, inter alia, responsible for implementing the IDP, which is the institution’s
five-year service delivery plan.
The Executive Management Team comprises 10 senior managers, each
responsible for a portfolio, which largely matches the corresponding political
portfolio.
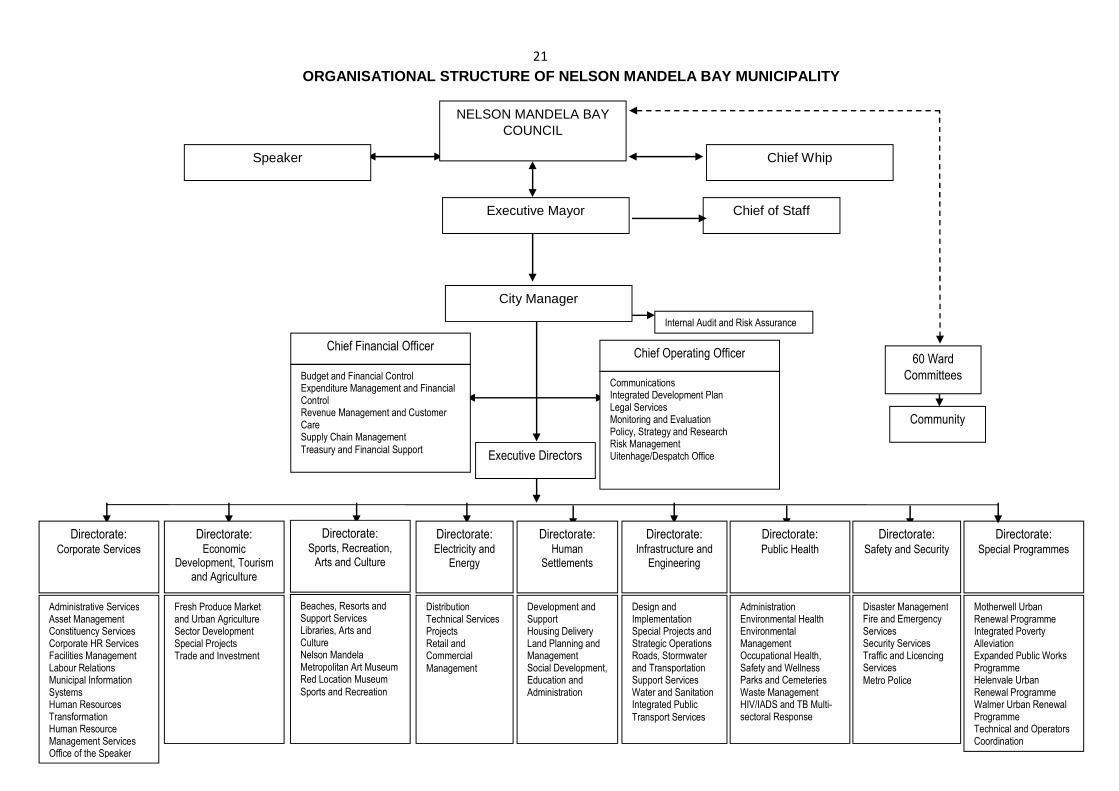
The organisational structure of the City is presently being reviewed. The current
organisational structure is as follows:
21
Executive Mayor
Chief Operating Officer
City Manager
Chief Financial Officer 60 Ward
Committees
Community
Chief of Staff
Executive Directors
Budget and Financial Control Expenditure Management and Financial Control Revenue Management and Customer Care Supply Chain Management
Treasury and Financial Support
Communications Integrated Development Plan Legal Services Monitoring and Evaluation Policy, Strategy and Research Risk Management Uitenhage/Despatch Office
Administrative Services Asset Management Constituency Services Corporate HR Services Facilities Management Labour Relations Municipal Information Systems Human Resources Transformation Human Resource Management Services Office of the Speaker
Directorate: Corporate Services
Fresh Produce Market and Urban Agriculture Sector Development Special Projects Trade and Investment
Directorate: Economic
Development, Tourism
and Agriculture
Distribution Technical Services Projects Retail and Commercial
Management
Directorate: Electricity and
Energy
Development and Support Housing Delivery Land Planning and Management Social Development, Education and Administration
Directorate: Human
Settlements
Design and Implementation Special Projects and Strategic Operations Roads, Stormwater and Transportation Support Services Water and Sanitation Integrated Public
Transport Services
Directorate: Infrastructure and
Engineering
Administration Environmental Health Environmental Management Occupational Health, Safety and Wellness Parks and Cemeteries Waste Management HIV/IADS and TB Multi- sectoral Response
Directorate: Public Health
Disaster Management Fire and Emergency Services Security Services Traffic and Licencing Services
Metro Police
Directorate: Safety and Security
Motherwell Urban Renewal Programme Integrated Poverty Alleviation Expanded Public Works Programme Helenvale Urban Renewal Programme Walmer Urban Renewal Programme Technical and Operators Coordination
Directorate: Special Programmes
Speaker Chief Whip
Internal Audit and Risk Assurance
Beaches, Resorts and Support Services Libraries, Arts and Culture Nelson Mandela Metropolitan Art Museum Red Location Museum
Sports and Recreation
Directorate: Sports, Recreation,
Arts and Culture
ORGANISATIONAL STRUCTURE OF NELSON MANDELA BAY MUNI CIPALITY
NELSON MANDELA BAY COUNCIL
22
1.6 LEGISLATIVE AND POLICY MANDATES AND ALIGNMENT WITH LONG
TERM VISION
The legislative and policy mandates that influence the activities of local government
are numerous, encompassing international, national, provincial and regional
influences. It is important that there is a direct linkage between the activities at a local
government level and the broader strategic policy and legislative environment in order
that a common vision for the development of South Africans and Nelson Mandela Bay
residents can be achieved.
This section demonstrates the direct linkage between Nelson Mandela Bay’s six pillars
of action and the following legislative and policy directives, whilst acknowledging that
there are numerous other mandates that are adhered to:
• Sustainable Development Goals (SDGs)
• National Development Plan (NDP) 2030
• Integrated Urban Development Framework 2016
• Eastern Cape Vision 2030 – Provincial Development Plan (PDP)
• Medium-Term Strategic Framework Outcomes
• Batho Pele Principles
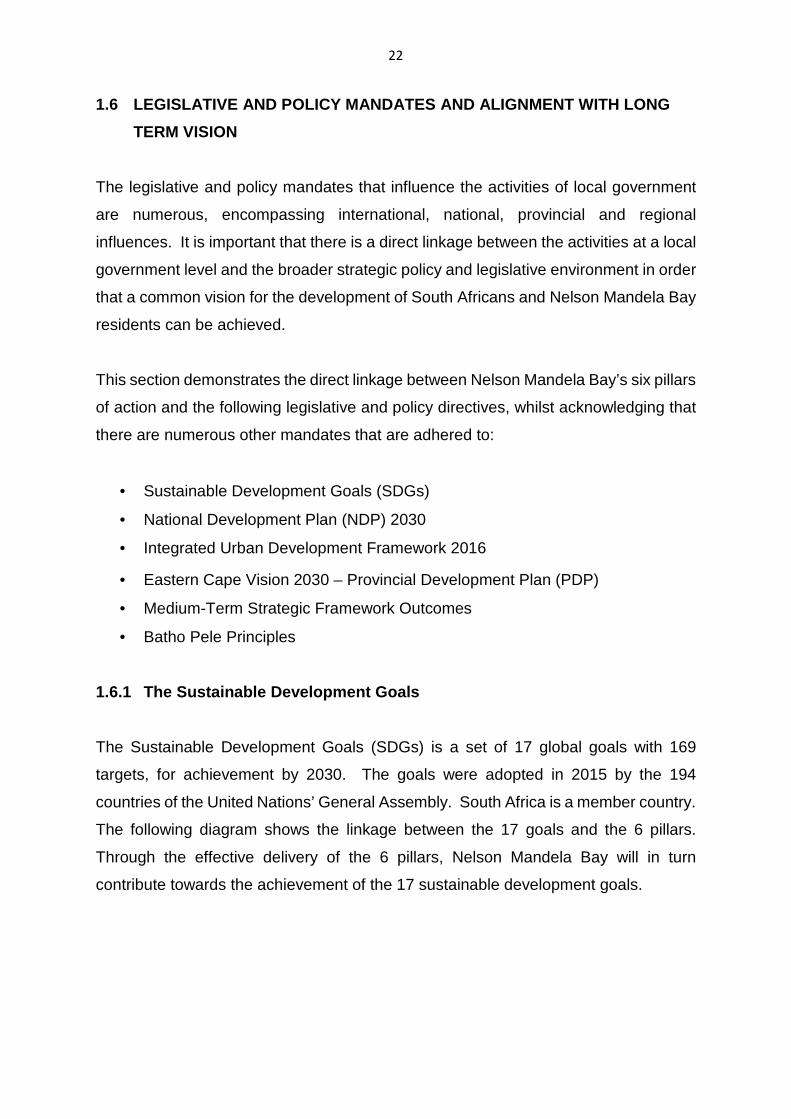
1.6.1 The Sustainable Development Goals
The Sustainable Development Goals (SDGs) is a set of 17 global goals with 169
targets, for achievement by 2030. The goals were adopted in 2015 by the 194
countries of the United Nations’ General Assembly. South Africa is a member country.
The following diagram shows the linkage between the 17 goals and the 6 pillars.
Through the effective delivery of the 6 pillars, Nelson Mandela Bay will in turn
contribute towards the achievement of the 17 sustainable development goals.
23
Linkage between Sustainable Development Goals and t he 6 Pillars
No Poverty
Zero Hunger
Good Health and Well-being
Quality Education
Gender Equality
Clean Water and Sanitation
Affordable and Clean Energy
Decent Work and Economic
Growth
Industry, Innovation and Infrastructure
Reduced Inequalities
Sustainable Cities and
Communities
Partnerships for the Goals
Peace, Justice and Strong Institutions
Life On Land
Life Below Water
Climate Action
Responsible Consumption
and Production
Well Run City
Opportunity City
Safe City
Inclusive City
Caring City
Forward Thinking City
Pillar 1:
Pillar 2:
Pillar 3:
Pillar 4:
Pillar 5:
Pillar 6:
24
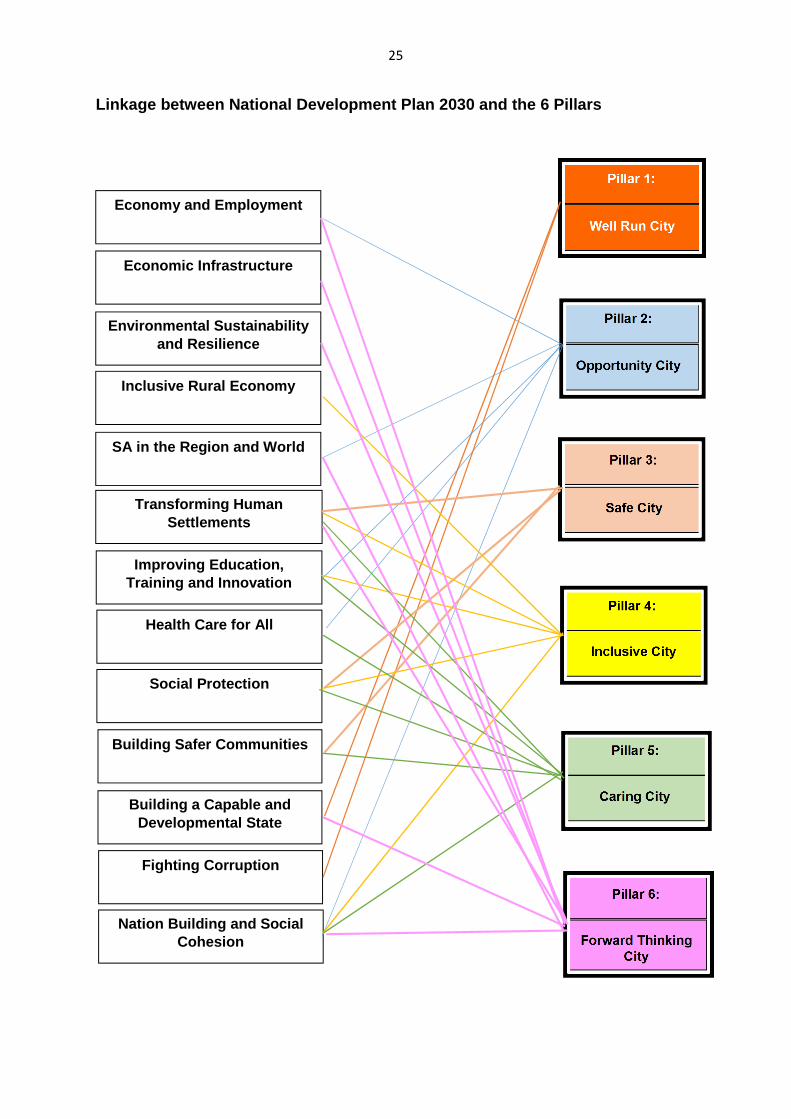
1.6.2 National Development Plan 2030
The National Development Plan (NDP) of South Africa was produced by the National
Planning Commission in 2011. It aims through its implementation to eliminate poverty
and reduce inequality by 2030. The Plan focuses on a number of thematic areas,
which together will transform South African society in combination with capable
institutions, a growing economy, increased capacity and leadership, and partnerships.
The thematic areas all have identified objectives and a number of actions that will give
rise to the transformation of the status quo. The following diagram shows the linkage
between the major thematic areas of the National Development Plan and the six Pillars
of Nelson Mandela Bay. By demonstrating these linkages, the actions of Nelson
Mandela Bay in achieving the objectives of the National Development Plan can be
easily identified.
25
Linkage between National Development Plan 2030 and the 6 Pillars
Well Run City
Opportunity City
Safe City
Inclusive City
Caring City
Forward Thinking City
Pillar 1:
Pillar 2:
Pillar 3:
Pillar 4:
Pillar 5:
Pillar 6:
Economy and Employment
Economic Infrastructure
Environmental Sustainability and Resilience
Inclusive Rural Economy
SA in the Region and World
Transforming Human Settlements
Improving Education, Training and Innovation
Health Care for All
Social Protection
Building Safer Communities
Building a Capable and Developmental State
Fighting Corruption
Nation Building and Social Cohesion
26
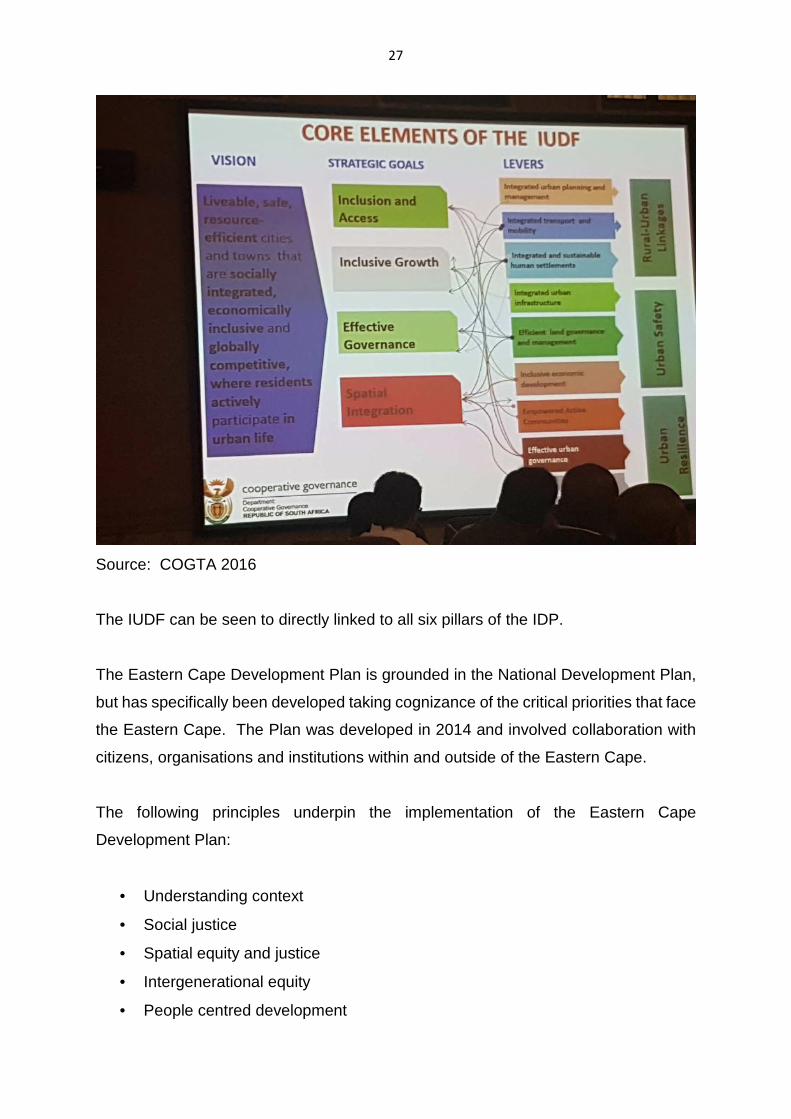
1.6.3 Integrated Urban Development Framework (IUDF)
The IUDF responds directly to the vision outlined in the National Development Plan
and is a policy framework to guide future growth and management of urban areas. It
is designed to effect spatial transformation through reorganising the urban system in
order that cities can become more inclusive, resilient and liveable.
Four overall strategic goals are pursued in the IUDF namely:
Spatial Integration – new spatial forms
Inclusion and access- access to social and economic opportunities
Growth – inclusive sustainable economic growth and development
Governance- enhanced state capacity and citizens for collaboration around spatial
and social integration.
The above inform priorities of 9 policy levers identified as follows:
1. Integrated urban planning and management
2. Integrated transport and mobility
3. Integrated sustainable human settlements
4. Integrated Urban Infrastructure
5. Efficient land governance and management
6. Inclusive economic development
7. Empowered active communities and
8. Efficient Urban governance.
9. Sustainable finances
27
Source: COGTA 2016
The IUDF can be seen to directly linked to all six pillars of the IDP.
The Eastern Cape Development Plan is grounded in the National Development Plan,
but has specifically been developed taking cognizance of the critical priorities that face
the Eastern Cape. The Plan was developed in 2014 and involved collaboration with
citizens, organisations and institutions within and outside of the Eastern Cape.
The following principles underpin the implementation of the Eastern Cape
Development Plan:
• Understanding context
• Social justice
• Spatial equity and justice
• Intergenerational equity
• People centred development
28
• Keeping the public good public
• Distributed agency and shared agenda setting
• Integrated coordination and efficiencies
• Resourcing the PDP
Arising from the above, five related goals have been developed for the Eastern Cape.
Each goal has a vision, key objectives and strategic actions. The goals are
interrelated. The Plan has a specific focus on rural development, due to the specific
absence of spatial equity in the Eastern Cape.
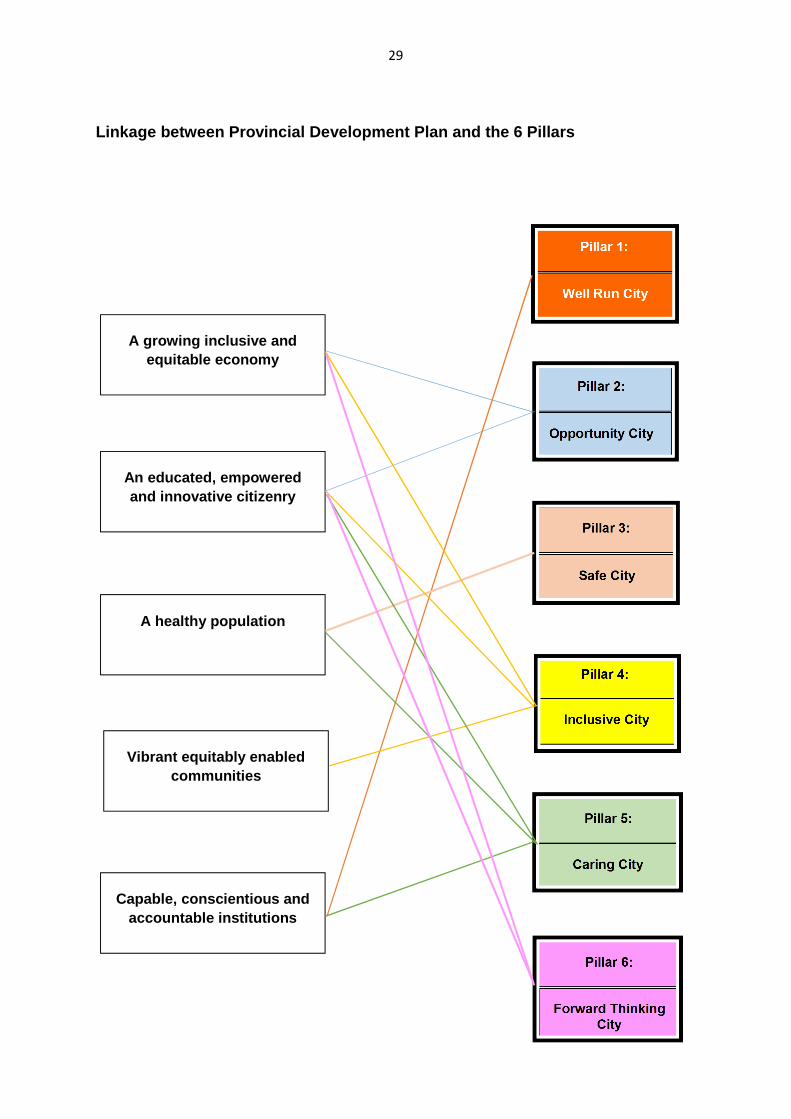
The following diagram shows the linkages between the five goals and the 6 pillars.
The linkages are important to identify the role of Nelson Mandela Bay in achieving the
Provincial Development Plan, as Nelson Mandela Bay is the largest City with the
strongest regional influence in the Eastern Cape.
29
Linkage between Provincial Development Plan and the 6 Pillars
Well Run City
Opportunity City
Safe City
Inclusive City
Caring City
Forward Thinking City
Pillar 1:
Pillar 2:
Pillar 3:
Pillar 4:
Pillar 5:
Pillar 6:
A growing inclusive and equitable economy
An educated, empowered and innovative citizenry
A healthy population
Vibrant equitably enabled communities
Capable, conscientious and accountable institutions
30
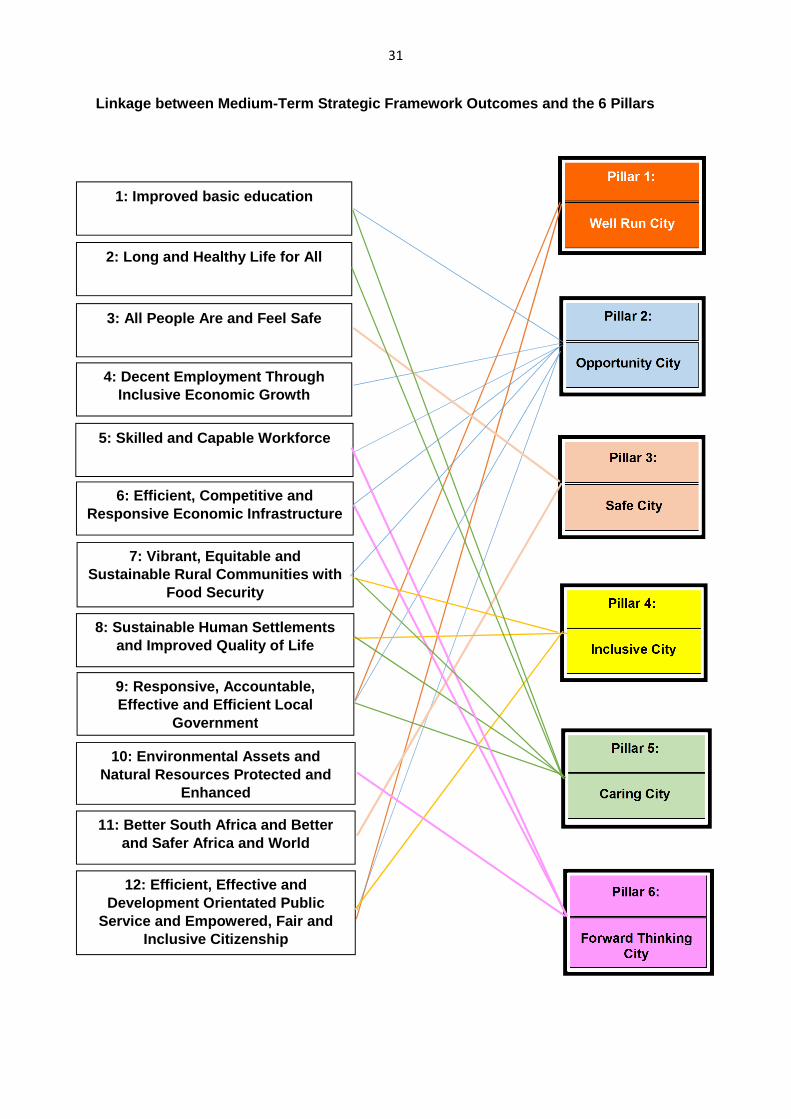
1.6.4 Medium-Term Strategic Framework Outcomes
The Medium-Term Strategic Framework is an expression of Government’s
Programme of Action. In terms of the Programme of Action, ten strategic priority areas
have been identified. In order to achieve the strategic priorities, twelve Key Outcomes
with accompanying Outputs and Activities have been identified. This has led to the
conclusion of ministerial performance agreements related to the strategic priority
areas. As a result of this, various structures are in place to coordinate the
implementation of the outcomes, review progress and decide on interventions when
needed.
The following diagram shows the linkage between the 6 pillars and the twelve
outcomes for 2014 to 2019:
31
Linkage between Medium-Term Strategic Framework Out comes and the 6 Pillars
Well Run City
Opportunity City
Safe City
Inclusive City
Caring City
Forward Thinking City
Pillar 1:
Pillar 2:
Pillar 3:
Pillar 4:
Pillar 5:
Pillar 6:
1: Improved basic education
2: Long and Healthy Life for All
3: All People Are and Feel Safe
4: Decent Employment Through Inclusive Economic Growth
5: Skilled and Capable Workforce
6: Efficient, Competitive and Responsive Economic Infrastructure
7: Vibrant, Equitable and Sustainable Rural Communities with
Food Security
8: Sustainable Human Settlements and Improved Quality of Life
9: Responsive, Accountable, Effective and Efficient Local
Government
10: Environmental Assets and Natural Resources Protected and
Enhanced
11: Better South Africa and Better and Safer Africa and World
12: Efficient, Effective and Development Orientated Public
Service and Empowered, Fair and Inclusive Citizenship
32
1.7 Batho Pele Principles
The White Paper on Transforming Public Service Delivery was produced in 1998. In
that document, the Batho Pele (or People First) initiative was outlined. It aimed to
make municipal officials who operate in the service delivery environment more service
orientated, strive for excellence, and commit to continuous improvement for the benefit
of all citizens. It also aimed to hold officials accountable for the level of services that
they deliver.
The legislative framework identifies the need to determine service standards, define
outputs and targets, and benchmark against 18 performance standards internationally.
Monitoring and evaluation mechanisms were also introduced to continuously measure
progress.
The following eight principles were identified:
• Consultation – Citizens should be consulted on the level and quality of the
public services they receive and, wherever possible, should be given a choice
about the services that are offered.
• Service standards and targets – Citizens should be told what level and quality
of public services they will receive so that they know what to expect.
• Access – All citizens should have equal access to the services to which they
are entitled.
• Courtesy – Citizens should be treated with courtesy and consideration.
• Information – Citizens should be given full, accurate information about the
public services they are entitled to receive.
• Openness and transparency – Citizens should be told how municipalities are
run, how much they cost, and who is in charge.
• Best value – Public services should be provided economically and efficiently in
order to give citizens the best possible value for money.
33
• Dealing with complaints – If the promised standards of service are not
delivered, citizens should be offered an apology, a full explanation and a
speedy and effective remedy, and when complaints are made, citizens should
receive a sympathetic and positive response.
In pursuing the pillars of a Well Run City, an Inclusive City and a Caring City, the
Nelson Mandela Bay Municipality will strive to implement the above principles.
In line with Section 29 of the MSA and 21 (1) (b) MFMA, the IDP and Budget Time
Schedule was adopted by Council in its seating on 28 August 2017. It is available on
the NMBM Website at: www.nelsonmandelabay.gov.za.
1.8 IMPLEMENTING THE LONG-TERM DEVELOPMENT PLAN
The Metro’s political and administrative leadership, communities and economic sector
groups consulted throughout the development of this long term plan have high
ambitions for a bright future for Nelson Mandela Bay. This Municipality is determined
to achieve those ambitions throughout Port Elizabeth, Uitenhage and Despatch. It is
generally accepted that progress cannot proceed across all fronts simultaneously and
at equal pace – the essence of strategy is the optimal prioritisation and making of
choices regarding which elements of an envisioned future are most practically pursued
in each phase of its realisation. In this way, each set of milestones can be achieved
through advance from the solid foundation of delivery preceding it. The purpose of this
section of the plan is to set out broad phasing for the implementation of strategy.
This long-term development plan adopts a fifteen-year perspective. It therefore covers
the period of three Integrated Development Plans:
34
(a) IDP 1, passed in June 2017, covering the 2017/18 to 2021/22 financial years;
(b) IDP 2, to be passed in June 2022, covering the 2022/23 to 2026/27 financial
years; and
(c) IDP 3, to be passed in June 2027, covering the 2027/28 to 2031/32 financial
years.
Each new IDP builds systematically on the achievements of its predecessors, through
essential progress in each of the following development focus areas:
• Governance and organization-led development
• Infrastructure-led development
• Opportunity-led development
• Infrastructure-led development
• Development for resilience
• Development through lifestyle offering
• Development through conservation of our natural, built and cultural assets
• Safety-enabled development
• People-oriented development
• Technology-led development
1.8.1 Development for Resilience
Building a successful Nelson Mandela Bay means that we have to make sustainable
choices about how we develop. Nelson Mandela Bay will grow. Our choice is therefore
not whether we grow, but how well we grow. Making Nelson Mandela Bay better
should always come before making it bigger, but we will get bigger. This plan sets its
sights on building consensus around change by painting a picture of the city’s future.
In order to ensure balanced prioritization of “people, planet and profit”, the costs and
benefits of every development undertaken need to be carefully assessed to ensure
that for every decision the implications are well understood and planned for.
35
The concepts of resilience and sustainability from a planning perspective enable us to
broaden our vision in consideration of economic, environmental and social implications
together, rather than using a single perspective. It encourages decision making that is
long-range, democratic, participatory and respectful of all stakeholders and aspects of
what a sustainable future Metro should embody. Such a focus aligns with the Metro
pillar of a Forward Thinking Metro - which requires that planning be geared to meet
the needs of today without compromising the ability of future generations to meet their
needs.
36
CHAPTER 2: SITUATIONAL ANALYSIS
This chapter describes the development context of the Nelson Mandela Bay
Municipality and identifies the City’s strengths, opportunities, weaknesses and threats
within this context and the ability of the City to perform in terms of the six pillars that
have been identified by the leadership, namely:
• The Well Run City
• The Opportunity City
• The Safe City
• The Inclusive City
• The Caring City
• The Forward Thinking City
2.1 Location
The Nelson Mandela Bay Municipality is the larger of two metropolitan municipalities
located in the Eastern Cape Province. It covers an area of 1959,02 km².
Statistics South Africa (STATS SA) describes Nelson Mandela Bay as follows:
“ Nelson Mandela Bay Municipality is located on the south-eastern coast of Africa in
the Eastern Cape. It is one of eight Category A municipalities in South Africa. In 2001,
the Nelson Mandela Bay Metropolitan Municipality was formed as an administrative
area covering Port Elizabeth, the neighbouring towns of Uitenhage and Despatch, and
the surrounding agricultural areas. Nelson Mandela Bay is a major seaport and
automotive manufacturing centre.
The Coega Industrial Development Zone (IDZ) is situated within the Nelson Mandela
Bay Metropolitan Municipality. The initiative is a multi-billion dollar industrial
development complex customised for heavy, medium and light industries. It is adjacent
to a deepwater port, the Port of Ngqura, and covers 110 km² of land. The city’s unique
37
advantage of possessing two ports, namely Port Elizabeth Harbour and Ngqura,
creates an opportunity for the city to establish a strong and vibrant maritime sector”.
2.2 Population and human development
The current population of Nelson Mandela Bay is 1 271 776 (STATS SA), with a growth
rate of 1.36%, which is lower than that of other metropolitan areas, such as Ekurhuleni
(2.47%) and Tshwane (3.1%). Nelson Mandela Bay is characterized by a youthful
population, with the age group of 5 to 14 years dominating.
The total number of households is 365 973, of which 21 668 are estimated to be
informal households (STATS SA).
Nelson Mandela Bay has the lowest proportion of informal households among South
African Metropolitan Municipalities, having significantly reduced the numbers since
2001 (SACN, 2016). In addition, the average number of people per household
declined from 4,25 in 1996 to 3,55 in 2011.
The life expectancy among Nelson Mandela Bay residents is 59,3 years and 53,7
years for females and males respectively. This is the same as for Buffalo City. By
comparison, Cape Town has a life expectancy of 70,1 and 64,2 years, while
Mangaung has a life expectancy of 52,7 and 49,6 years for females and males
respectively (SACN, 2016).
Regarding education, in 2011, 19,7% of Nelson Mandela Bay’s population had
attained matric, whilst 6,8% had a higher education (SACN, 2016).
In analysing non-school going residents, 3% had no schooling, 13% had Grade 7 or
less (Primary School level), while 75% had a school education of Grade 12 or less
(Secondary School level) (STATS SA, 2011).
38
2.3 Poverty and the economy
Between 2001 and 2011, the total number of people living below the poverty line
decreased from 46% to 29% (SACN, 2016).
The Nelson Mandela Bay Municipality assists the poorest of the poor among its
residents with an indigent subsidy (Assistance to the Poor Scheme), which covers the
costs of free basic services. The number of indigent households subsidized, grew
from 71 551 in 2013 to 115 934 during 2017. Altogether 31% of formal households in
Nelson Mandela Bay are dependent on the municipal indigent subsidy.
Over the period 2001 to 2011, the Nelson Mandela Bay’s economy and average
household income grew slower than those of other South African metropolitan
municipalities.
Nelson Mandela Bay is the driver of the Eastern Cape economy, contributing 41,81%
of the provincial Gross Geographic Product (GGP) (Global Insight, 2013). The
unemployment rate dropped from 46,4% in 2001 to 36,6% in 2011. The Eastern Cape
Province’s average unemployment rate was 37,4% in 2011 (SACN, 2016).
The largest economic sectors in Nelson Mandela Bay Metro are manufacturing,
finance, community services and transport. Community services, trade and
manufacturing sectors are the sectors that create the most employment in the Metro.
Two single sectors, “Manufacturing and Community”, and “Social and Personal
Services”, make up more than half (58,1%) of the Metro’s GVA (Gross Value Added),
with “Financial and Related Services”, (Transport and Trade) contributing a further
37%. The automotive sector accounts for more than 50% of the Metro’s manufacturing
sector (ECSECC, 2012).
A Doing Business in South Africa Survey (SNDB) was undertaken in 2015 among all
South African Metropolitan Municipalities. The survey measured the performance of
cities in relation to the cost of doing business over five indicator areas impacting on
the ease of conducting business in South Africa.
39
The indicator areas focused on regulations relevant to the life cycle of a small to
medium sized domestic business and were built on standardized case scenarios. This
allowed an equal and fair comparison of all cities in the study. The indicators
assessed, were:
• Dealing with construction permits
• Starting a business
• Registering property
• Getting electricity
• Enforcing contracts
Within these indicators, the length of time, financial cost and number of procedures
were evaluated. Of the five indicators, three namely, dealing with construction permits,
registering property and getting electricity, were within the direct control of
municipalities.
The aim was to improve the indicators over time prior to the next survey, which will
take place in 2018. The following is the result recorded in respect of Nelson Mandela
Bay in relation to the afore-stated three municipal indicators:
• Dealing with construction permits – Nelson Mandela Bay is the overall
second best performer in the country after Cape Town in this area. Analysis
has shown that it is the cost of building plans that needs to be re-evaluated to
bring the City in line with other local authorities.
• Registering property – In terms of this indicator, the Nelson Mandela Bay
Municipality performed above average and was rated fifth best in the country.
The Municipality will need to address the time taken to issue rates clearance
certificates in order to perform better. The aspect of Deeds Office clearance
also affected this indicator.
• Getting electricity – In this indicator, the Nelson Mandela Bay Municipality
performed the worst of all South African Metropolitan Municipalities in terms of
time and cost. The Municipality requires five procedures to be completed
(which is average), but these procedures take 333 days to complete, which is
40
106% longer than the average of other cities. Cost is also a factor that could
be improved.
The City has developed an Action Plan that is being monitored for improvement across
these critical indicators. All Metro Action Plans are being monitored at national level
by National Treasury.
2.4 Safety
In a 2016 South African Cities Report titled “State of Urban Safety in South Africa”, the
importance of urban safety in cities is highlighted. Cities are “places not only of
opportunity, but also of inequality and high levels of violence and crime”. The Report’s
findings confirm that crime and violence in South Africa are heavily concentrated in
urban areas.
Although crime statistics have their limitations, the following statistics for Nelson
Mandela Bay are relevant from the aforementioned Report:
• The murder rate in Nelson Mandela Bay decreased from approximately 60
murders per 100 000 to 48 murders per 100 000 between 2005 and 2015.
During this period, Buffalo City and Nelson Mandela Bay recorded the highest
murder rate of all South African Metropolitan Municipalities; however, these
cities also experienced the greatest decrease over the 10-year period.
• The statistics for assault with intent to inflict grievous bodily harm decreased
from 650 to 420 per 100 000 over the 10-year period from 2005 to 2015;
mirroring a similar decline in the statistics of most other Metropolitan
Municipalities and the national average.
• From 2005 to 2015, robberies at residential premises in Nelson Mandela Bay
increased from approximately 10 to 50 per 100 000. This is consistent with the
trend for robberies at non-residential premises as well as the national and metro
trends.
41
• With regard to residential burglaries, Nelson Mandela Bay went from the
highest score in 2005 (with 915 per 100 000), to the fifth highest of the eight
South African Metropolitan Municipalities in 2015, at just over 600.
• All South African Cities recorded increases in total crime rates between 2005
and 2015; in 2015, Nelson Mandela Bay recorded the fourth highest overall
crime rate of the eight Metros.
2.5 Overview of basic services
Nelson Mandela Bay is noted for having achieved a high level of access to basic
services in comparison to other Metros.
(a) Water
All formal households have access to water through an erf connection. Altogether
100% of households located in informal settlements within the urban edge receive
water through communal standpipes within a 200 m radius of every erf and through
water tanks. Communities occupying private land illegally are not guaranteed water
access.
(b) Sanitation
All formal households are connected to waterborne sanitation. Informal areas are
serviced by the bucket sanitation system. Altogether 16 317 buckets are still in
circulation to informal settlements as a means of sanitation (this represents a marked
decrease from the 23 479 buckets in circulation in 2012).
A revised strategy to achieve the total elimination of the bucket system is being
implemented. This will see the replacement of the bucket system by communal
ablution block facilities.
42
(c) Solid Waste Management (Refuse Removal)
Altogether 100% of formal and informal households receive a domestic waste
collection service (excluding informal areas on privately owned erven and erven not
earmarked for human settlements development).
(d) Electricity
Altogether 100% of households in formally demarcated residential areas have access
to electricity. Solar panels were installed in some informal settlements for electricity
generation; however, some informal settlements remain unconnected to an electricity
supply, and the plan is to provide a 20 amp supply to these settlements to ensure
basic electricity provision to all households.
(e) Housing
The following is the housing situation in Nelson Mandela Bay –
• A high level of households live in formal housing (85%).
• A high level of households live in owned formal housing (57%).
• 12% of households live in informal housing conditions (in informal settlements and
back-yards shacks).
• New family formation to 2020 is estimated to be very low (7% between 2011 and
2020 (0.6% p.a.)).
This housing situation is a-typical of most Metros in South Africa, which are generally
characterised by lower income home ownership, higher levels of informal housing
conditions, and higher new family formation (Shisaka, 2017).
43
2.6 THE SIX PILLARS – DELIVERY APPROACH
The City has undertaken an introspective analysis in order to guide the preparation of
this IDP. Key considerations include the best possible use of available resources
(budget, human resources, infrastructure, skills and assets); how capacity,
infrastructure and skills could be built to address gaps, including using strategic
partnerships; and current and new activities that could potentially serve to develop a
competitive advantage for the Metro.
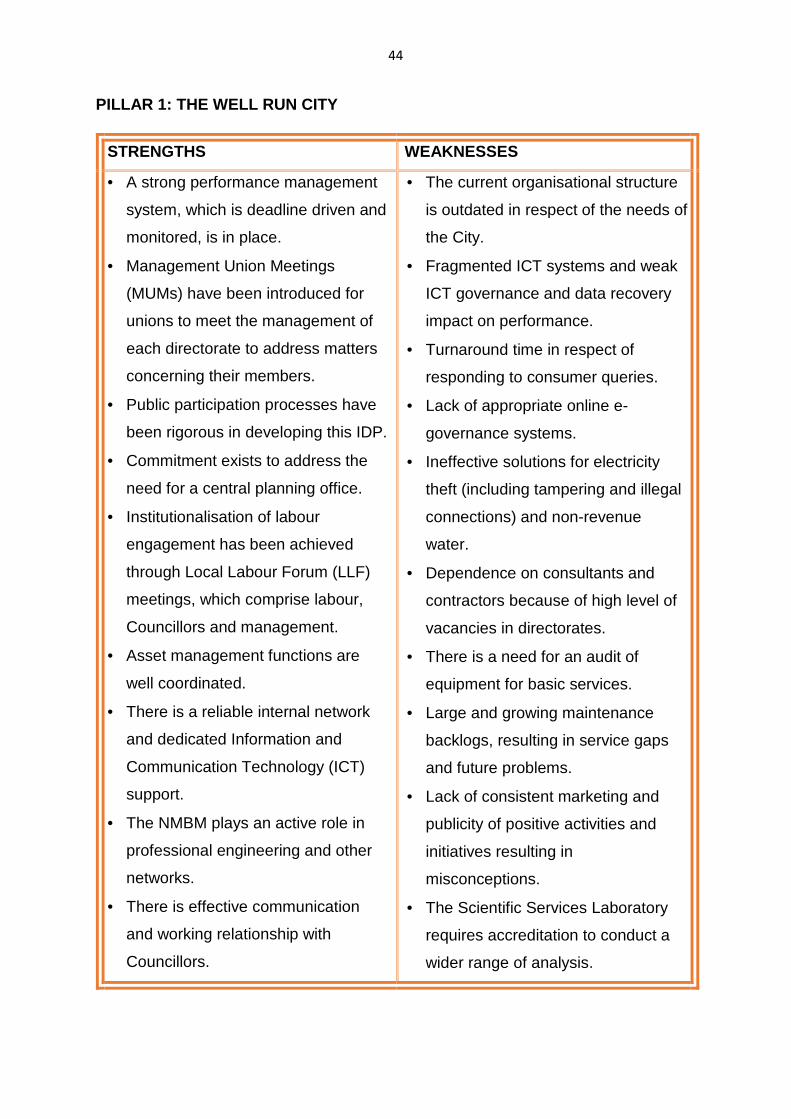
The following represents an institutional analysis of the six pillars identified.
44
PILLAR 1: THE WELL RUN CITY
STRENGTHS WEAKNESSES
• A strong performance management
system, which is deadline driven and
monitored, is in place.
• Management Union Meetings
(MUMs) have been introduced for
unions to meet the management of
each directorate to address matters
concerning their members.
• Public participation processes have
been rigorous in developing this IDP.
• Commitment exists to address the
need for a central planning office.
• Institutionalisation of labour
engagement has been achieved
through Local Labour Forum (LLF)
meetings, which comprise labour,
Councillors and management.
• Asset management functions are
well coordinated.
• There is a reliable internal network
and dedicated Information and
Communication Technology (ICT)
support.
• The NMBM plays an active role in
professional engineering and other
networks.
• There is effective communication
and working relationship with
Councillors.
• The current organisational structure
is outdated in respect of the needs of
the City.
• Fragmented ICT systems and weak
ICT governance and data recovery
impact on performance.
• Turnaround time in respect of
responding to consumer queries.
• Lack of appropriate online e-
governance systems.
• Ineffective solutions for electricity
theft (including tampering and illegal
connections) and non-revenue
water.
• Dependence on consultants and
contractors because of high level of
vacancies in directorates.
• There is a need for an audit of
equipment for basic services.
• Large and growing maintenance
backlogs, resulting in service gaps
and future problems.
• Lack of consistent marketing and
publicity of positive activities and
initiatives resulting in
misconceptions.
• The Scientific Services Laboratory
requires accreditation to conduct a
wider range of analysis.
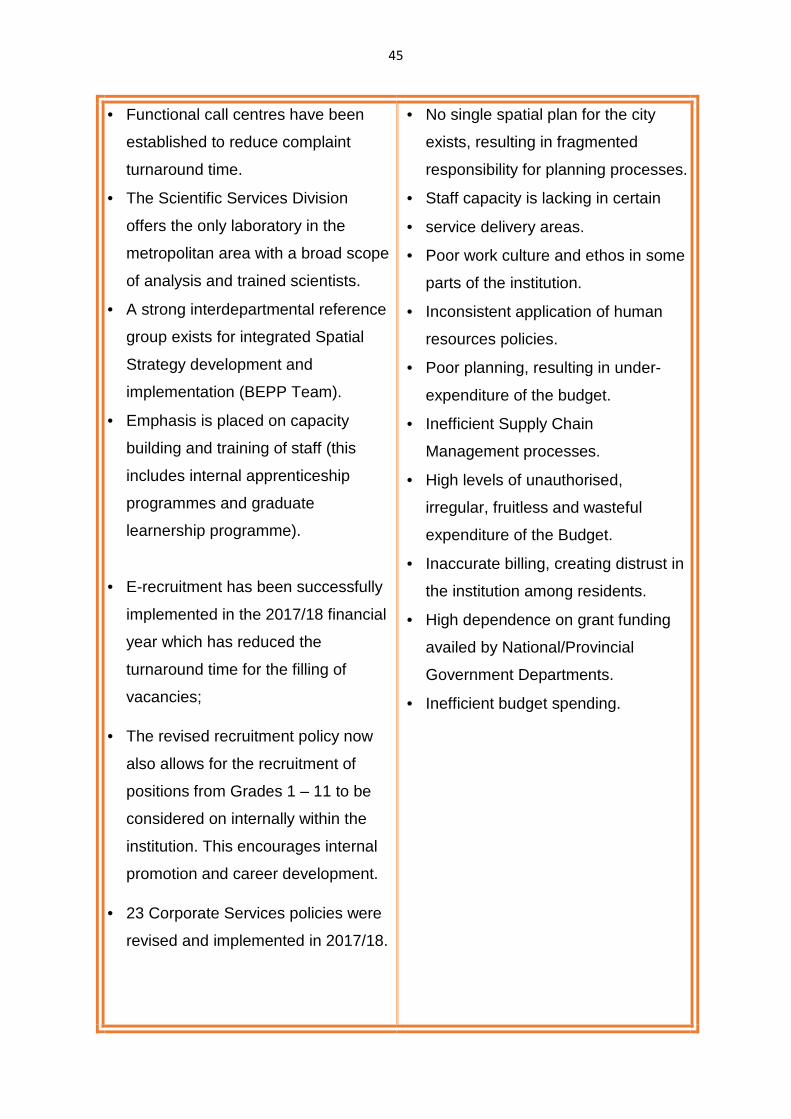
45
• Functional call centres have been
established to reduce complaint
turnaround time.
• The Scientific Services Division
offers the only laboratory in the
metropolitan area with a broad scope
of analysis and trained scientists.
• A strong interdepartmental reference
group exists for integrated Spatial
Strategy development and
implementation (BEPP Team).
• Emphasis is placed on capacity
building and training of staff (this
includes internal apprenticeship
programmes and graduate
learnership programme).
• E-recruitment has been successfully
implemented in the 2017/18 financial
year which has reduced the
turnaround time for the filling of
vacancies;
• The revised recruitment policy now
also allows for the recruitment of
positions from Grades 1 – 11 to be
considered on internally within the
institution. This encourages internal
promotion and career development.
• 23 Corporate Services policies were
revised and implemented in 2017/18.
• No single spatial plan for the city
exists, resulting in fragmented
responsibility for planning processes.
• Staff capacity is lacking in certain
• service delivery areas.
• Poor work culture and ethos in some
parts of the institution.
• Inconsistent application of human
resources policies.
• Poor planning, resulting in under-
expenditure of the budget.
• Inefficient Supply Chain
Management processes.
• High levels of unauthorised,
irregular, fruitless and wasteful
expenditure of the Budget.
• Inaccurate billing, creating distrust in
the institution among residents.
• High dependence on grant funding
availed by National/Provincial
Government Departments.
• Inefficient budget spending.
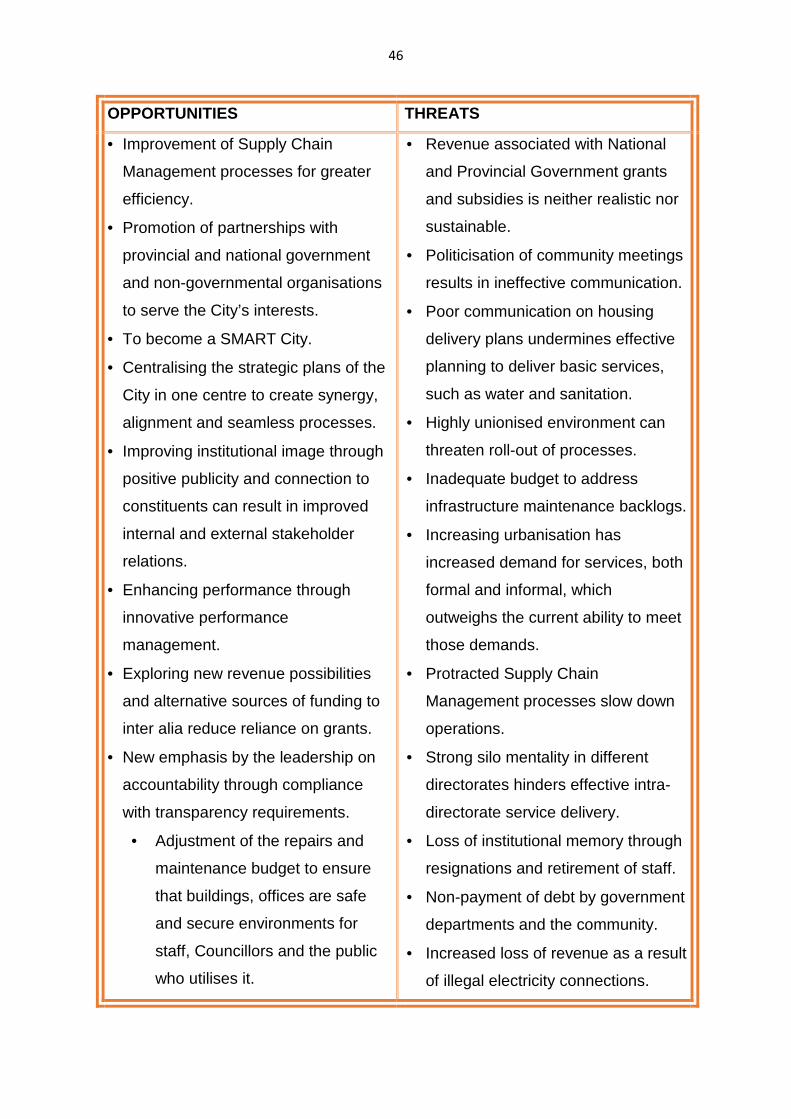
46
OPPORTUNITIES THREATS
• Improvement of Supply Chain
Management processes for greater
efficiency.
• Promotion of partnerships with
provincial and national government
and non-governmental organisations
to serve the City’s interests.
• To become a SMART City.
• Centralising the strategic plans of the
City in one centre to create synergy,
alignment and seamless processes.
• Improving institutional image through
positive publicity and connection to
constituents can result in improved
internal and external stakeholder
relations.
• Enhancing performance through
innovative performance
management.
• Exploring new revenue possibilities
and alternative sources of funding to
inter alia reduce reliance on grants.
• New emphasis by the leadership on
accountability through compliance
with transparency requirements.
• Adjustment of the repairs and
maintenance budget to ensure
that buildings, offices are safe
and secure environments for
staff, Councillors and the public
who utilises it.
• Revenue associated with National
and Provincial Government grants
and subsidies is neither realistic nor
sustainable.
• Politicisation of community meetings
results in ineffective communication.
• Poor communication on housing
delivery plans undermines effective
planning to deliver basic services,
such as water and sanitation.
• Highly unionised environment can
threaten roll-out of processes.
• Inadequate budget to address
infrastructure maintenance backlogs.
• Increasing urbanisation has
increased demand for services, both
formal and informal, which
outweighs the current ability to meet
those demands.
• Protracted Supply Chain
Management processes slow down
operations.
• Strong silo mentality in different
directorates hinders effective intra-
directorate service delivery.
• Loss of institutional memory through
resignations and retirement of staff.
• Non-payment of debt by government
departments and the community.
• Increased loss of revenue as a result
of illegal electricity connections.
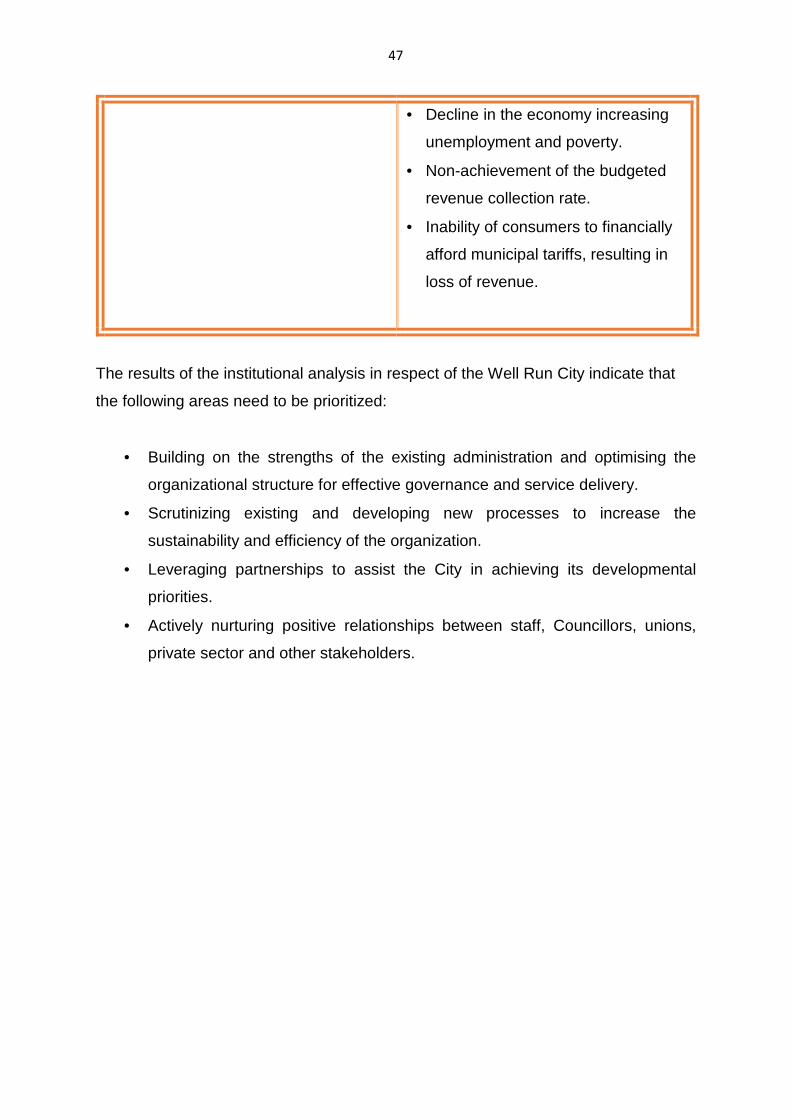
47
• Decline in the economy increasing
unemployment and poverty.
• Non-achievement of the budgeted
revenue collection rate.
• Inability of consumers to financially
afford municipal tariffs, resulting in
loss of revenue.
The results of the institutional analysis in respect of the Well Run City indicate that
the following areas need to be prioritized:
• Building on the strengths of the existing administration and optimising the
organizational structure for effective governance and service delivery.
• Scrutinizing existing and developing new processes to increase the
sustainability and efficiency of the organization.
• Leveraging partnerships to assist the City in achieving its developmental
priorities.
• Actively nurturing positive relationships between staff, Councillors, unions,
private sector and other stakeholders.
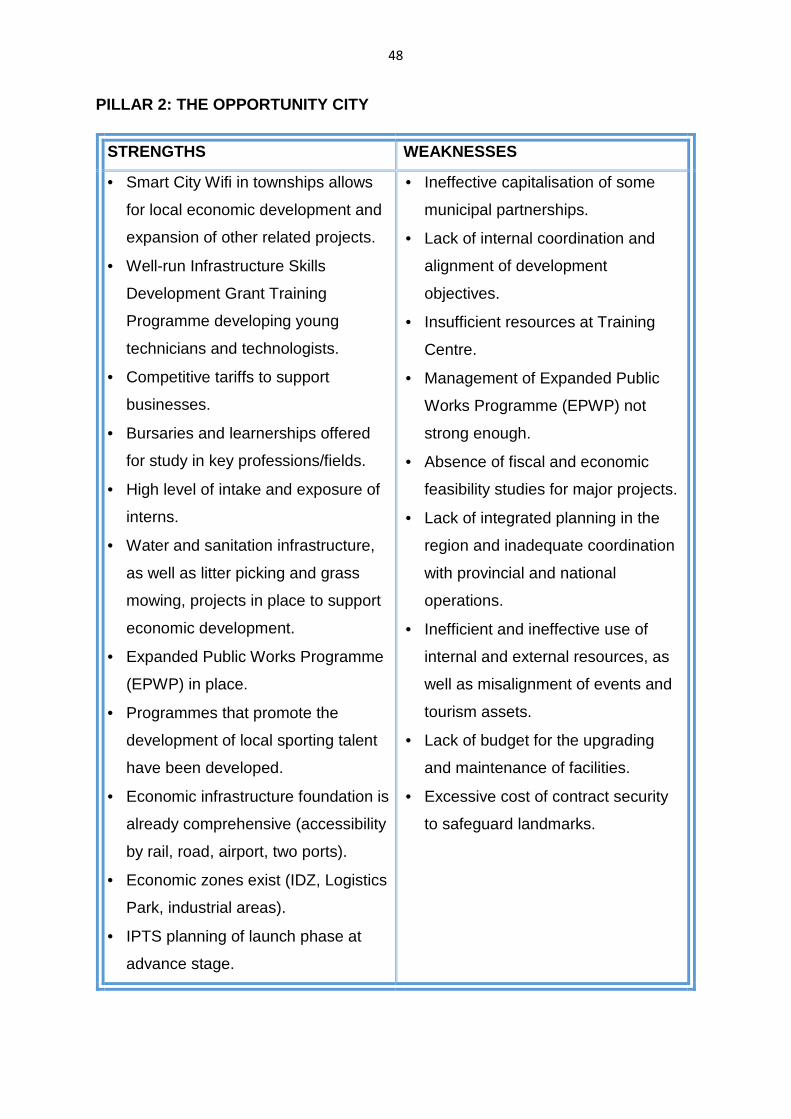
48
PILLAR 2: THE OPPORTUNITY CITY
STRENGTHS WEAKNESSES
• Smart City Wifi in townships allows
for local economic development and
expansion of other related projects.
• Well-run Infrastructure Skills
Development Grant Training
Programme developing young
technicians and technologists.
• Competitive tariffs to support
businesses.
• Bursaries and learnerships offered
for study in key professions/fields.
• High level of intake and exposure of
interns.
• Water and sanitation infrastructure,
as well as litter picking and grass
mowing, projects in place to support
economic development.
• Expanded Public Works Programme
(EPWP) in place.
• Programmes that promote the
development of local sporting talent
have been developed.
• Economic infrastructure foundation is
already comprehensive (accessibility
by rail, road, airport, two ports).
• Economic zones exist (IDZ, Logistics
Park, industrial areas).
• IPTS planning of launch phase at
advance stage.
• Ineffective capitalisation of some
municipal partnerships.
• Lack of internal coordination and
alignment of development
objectives.
• Insufficient resources at Training
Centre.
• Management of Expanded Public
Works Programme (EPWP) not
strong enough.
• Absence of fiscal and economic
feasibility studies for major projects.
• Lack of integrated planning in the
region and inadequate coordination
with provincial and national
operations.
• Inefficient and ineffective use of
internal and external resources, as
well as misalignment of events and
tourism assets.
• Lack of budget for the upgrading
and maintenance of facilities.
• Excessive cost of contract security
to safeguard landmarks.
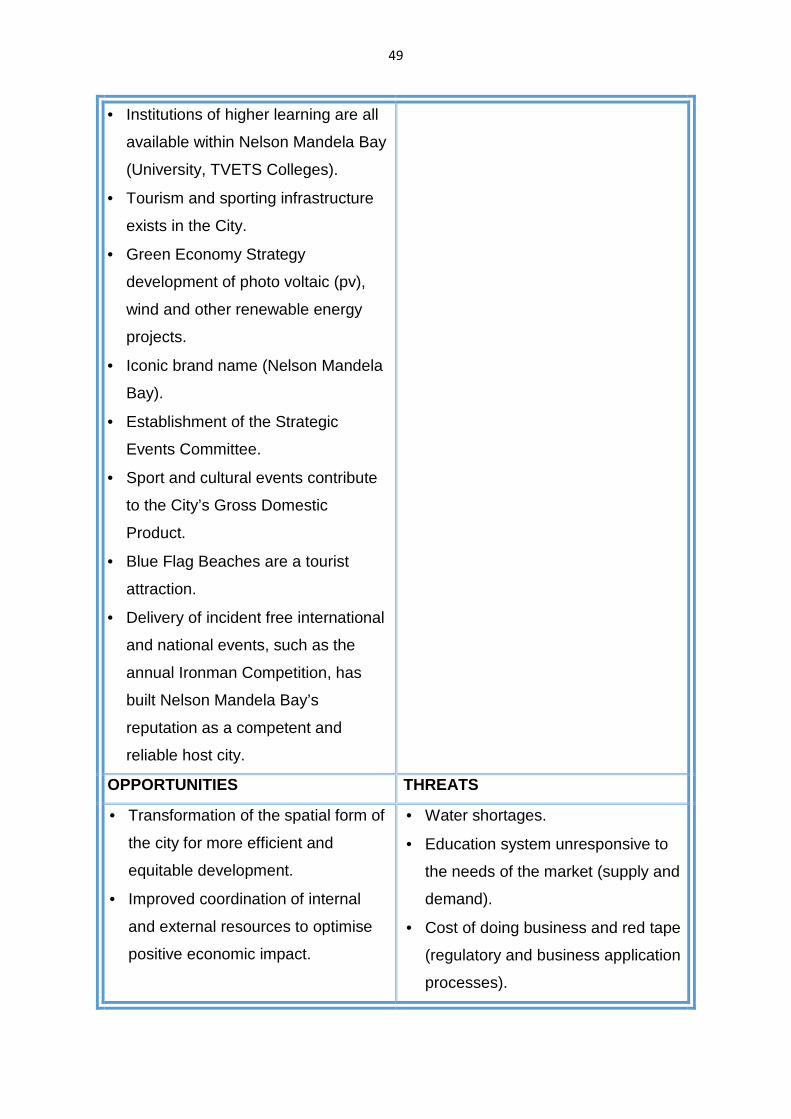
49
• Institutions of higher learning are all
available within Nelson Mandela Bay
(University, TVETS Colleges).
• Tourism and sporting infrastructure
exists in the City.
• Green Economy Strategy
development of photo voltaic (pv),
wind and other renewable energy
projects.
• Iconic brand name (Nelson Mandela
Bay).
• Establishment of the Strategic
Events Committee.
• Sport and cultural events contribute
to the City’s Gross Domestic
Product.
• Blue Flag Beaches are a tourist
attraction.
• Delivery of incident free international
and national events, such as the
annual Ironman Competition, has
built Nelson Mandela Bay’s
reputation as a competent and
reliable host city.
OPPORTUNITIES THREATS
• Transformation of the spatial form of
the city for more efficient and
equitable development.
• Improved coordination of internal
and external resources to optimise
positive economic impact.
• Water shortages.
• Education system unresponsive to
the needs of the market (supply and
demand).
• Cost of doing business and red tape
(regulatory and business application
processes).
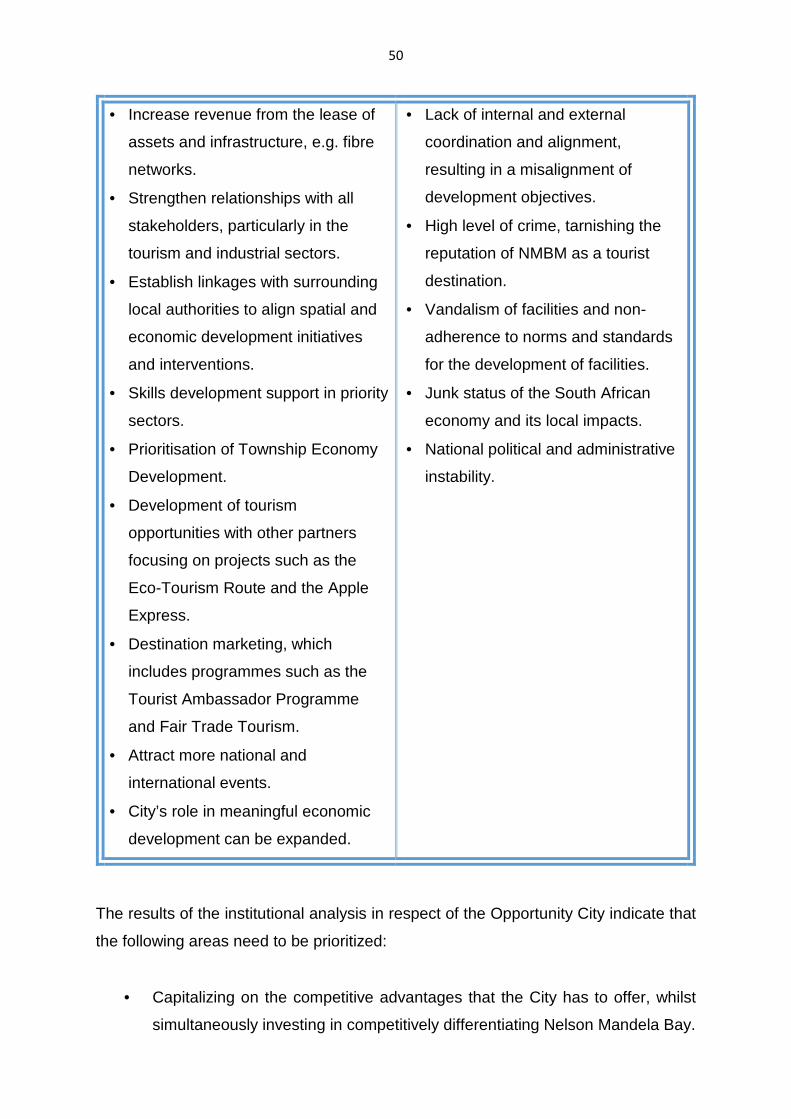
50
• Increase revenue from the lease of
assets and infrastructure, e.g. fibre
networks.
• Strengthen relationships with all
stakeholders, particularly in the
tourism and industrial sectors.
• Establish linkages with surrounding
local authorities to align spatial and
economic development initiatives
and interventions.
• Skills development support in priority
sectors.
• Prioritisation of Township Economy
Development.
• Development of tourism
opportunities with other partners
focusing on projects such as the
Eco-Tourism Route and the Apple
Express.
• Destination marketing, which
includes programmes such as the
Tourist Ambassador Programme
and Fair Trade Tourism.
• Attract more national and
international events.
• City’s role in meaningful economic
development can be expanded.
• Lack of internal and external
coordination and alignment,
resulting in a misalignment of
development objectives.
• High level of crime, tarnishing the
reputation of NMBM as a tourist
destination.
• Vandalism of facilities and non-
adherence to norms and standards
for the development of facilities.
• Junk status of the South African
economy and its local impacts.
• National political and administrative
instability.
The results of the institutional analysis in respect of the Opportunity City indicate that
the following areas need to be prioritized:
• Capitalizing on the competitive advantages that the City has to offer, whilst
simultaneously investing in competitively differentiating Nelson Mandela Bay.
51
• Optimizing the use of partners and other stakeholders to increase opportunity
for all residents.
• Building and strengthening existing initiatives to train and develop local youth,
the unemployed and the talented.
• Clarifying and improving the role of the City in job creation, poverty alleviation
and local and regional economic development.
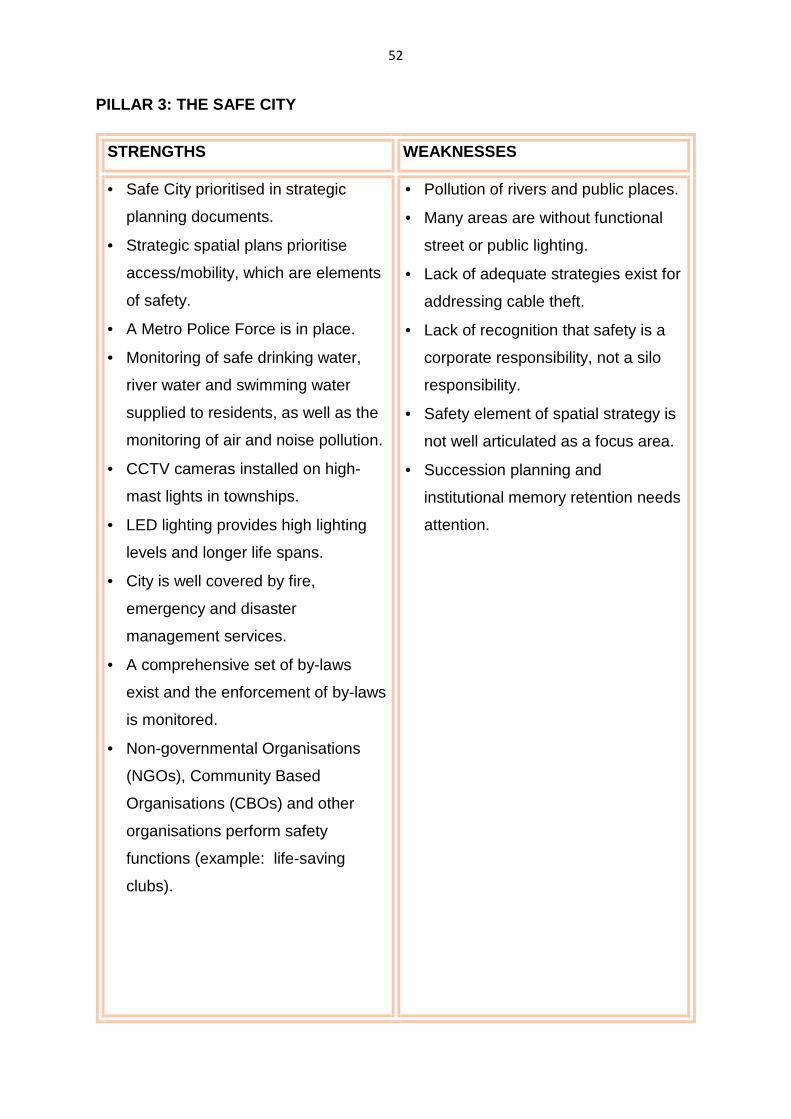
52
PILLAR 3: THE SAFE CITY
STRENGTHS WEAKNESSES
• Safe City prioritised in strategic
planning documents.
• Strategic spatial plans prioritise
access/mobility, which are elements
of safety.
• A Metro Police Force is in place.
• Monitoring of safe drinking water,
river water and swimming water
supplied to residents, as well as the
monitoring of air and noise pollution.
• CCTV cameras installed on high-
mast lights in townships.
• LED lighting provides high lighting
levels and longer life spans.
• City is well covered by fire,
emergency and disaster
management services.
• A comprehensive set of by-laws
exist and the enforcement of by-laws
is monitored.
• Non-governmental Organisations
(NGOs), Community Based
Organisations (CBOs) and other
organisations perform safety
functions (example: life-saving
clubs).
• Pollution of rivers and public places.
• Many areas are without functional
street or public lighting.
• Lack of adequate strategies exist for
addressing cable theft.
• Lack of recognition that safety is a
corporate responsibility, not a silo
responsibility.
• Safety element of spatial strategy is
not well articulated as a focus area.
• Succession planning and
institutional memory retention needs
attention.
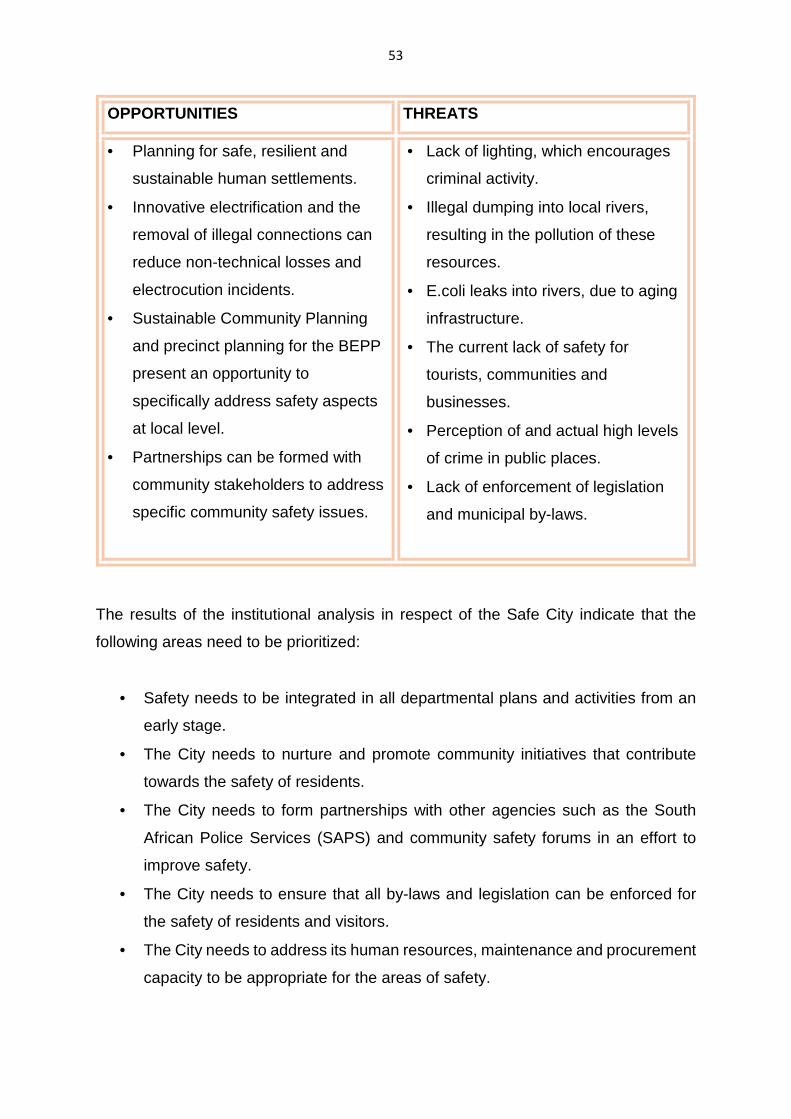
53
OPPORTUNITIES THREATS
• Planning for safe, resilient and
sustainable human settlements.
• Innovative electrification and the
removal of illegal connections can
reduce non-technical losses and
electrocution incidents.
• Sustainable Community Planning
and precinct planning for the BEPP
present an opportunity to
specifically address safety aspects
at local level.
• Partnerships can be formed with
community stakeholders to address
specific community safety issues.
• Lack of lighting, which encourages
criminal activity.
• Illegal dumping into local rivers,
resulting in the pollution of these
resources.
• E.coli leaks into rivers, due to aging
infrastructure.
• The current lack of safety for
tourists, communities and
businesses.
• Perception of and actual high levels
of crime in public places.
• Lack of enforcement of legislation
and municipal by-laws.
The results of the institutional analysis in respect of the Safe City indicate that the
following areas need to be prioritized:
• Safety needs to be integrated in all departmental plans and activities from an
early stage.
• The City needs to nurture and promote community initiatives that contribute
towards the safety of residents.
• The City needs to form partnerships with other agencies such as the South
African Police Services (SAPS) and community safety forums in an effort to
improve safety.
• The City needs to ensure that all by-laws and legislation can be enforced for
the safety of residents and visitors.
• The City needs to address its human resources, maintenance and procurement
capacity to be appropriate for the areas of safety.
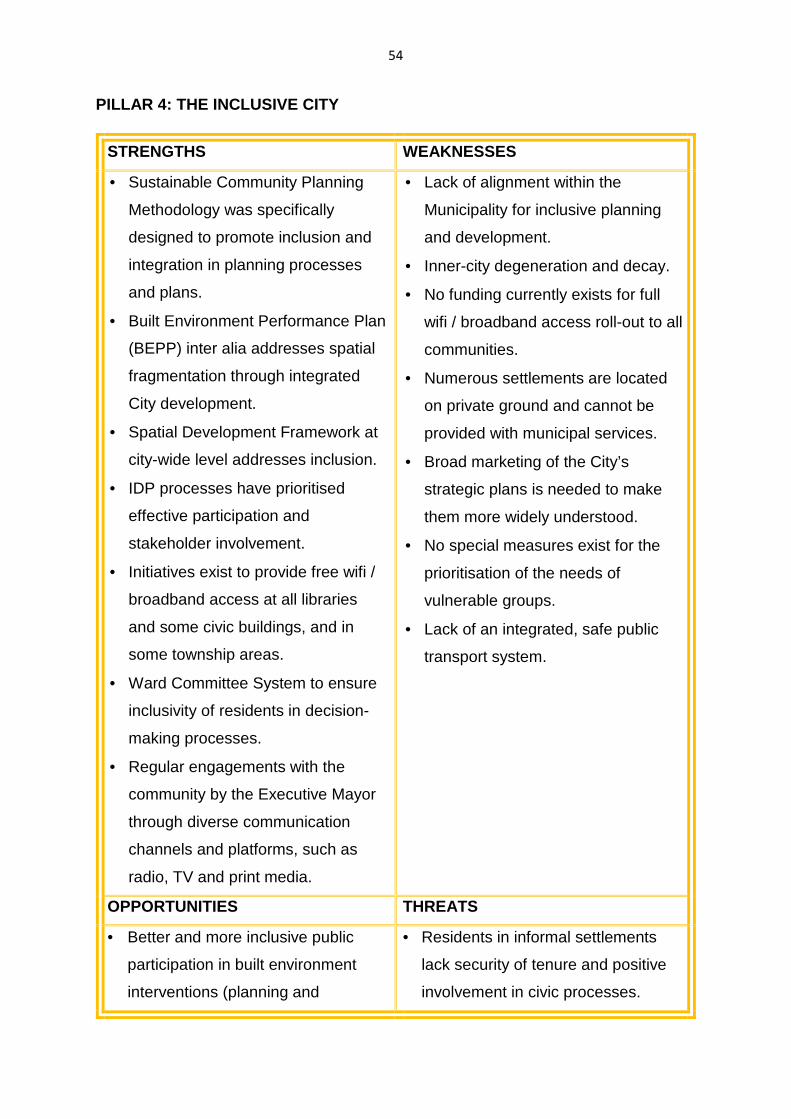
54
PILLAR 4: THE INCLUSIVE CITY
STRENGTHS WEAKNESSES
• Sustainable Community Planning
Methodology was specifically
designed to promote inclusion and
integration in planning processes
and plans.
• Built Environment Performance Plan
(BEPP) inter alia addresses spatial
fragmentation through integrated
City development.
• Spatial Development Framework at
city-wide level addresses inclusion.
• IDP processes have prioritised
effective participation and
stakeholder involvement.
• Initiatives exist to provide free wifi /
broadband access at all libraries
and some civic buildings, and in
some township areas.
• Ward Committee System to ensure
inclusivity of residents in decision-
making processes.
• Regular engagements with the
community by the Executive Mayor
through diverse communication
channels and platforms, such as
radio, TV and print media.
• Lack of alignment within the
Municipality for inclusive planning
and development.
• Inner-city degeneration and decay.
• No funding currently exists for full
wifi / broadband access roll-out to all
communities.
• Numerous settlements are located
on private ground and cannot be
provided with municipal services.
• Broad marketing of the City’s
strategic plans is needed to make
them more widely understood.
• No special measures exist for the
prioritisation of the needs of
vulnerable groups.
• Lack of an integrated, safe public
transport system.
OPPORTUNITIES THREATS
• Better and more inclusive public
participation in built environment
interventions (planning and
• Residents in informal settlements
lack security of tenure and positive
involvement in civic processes.
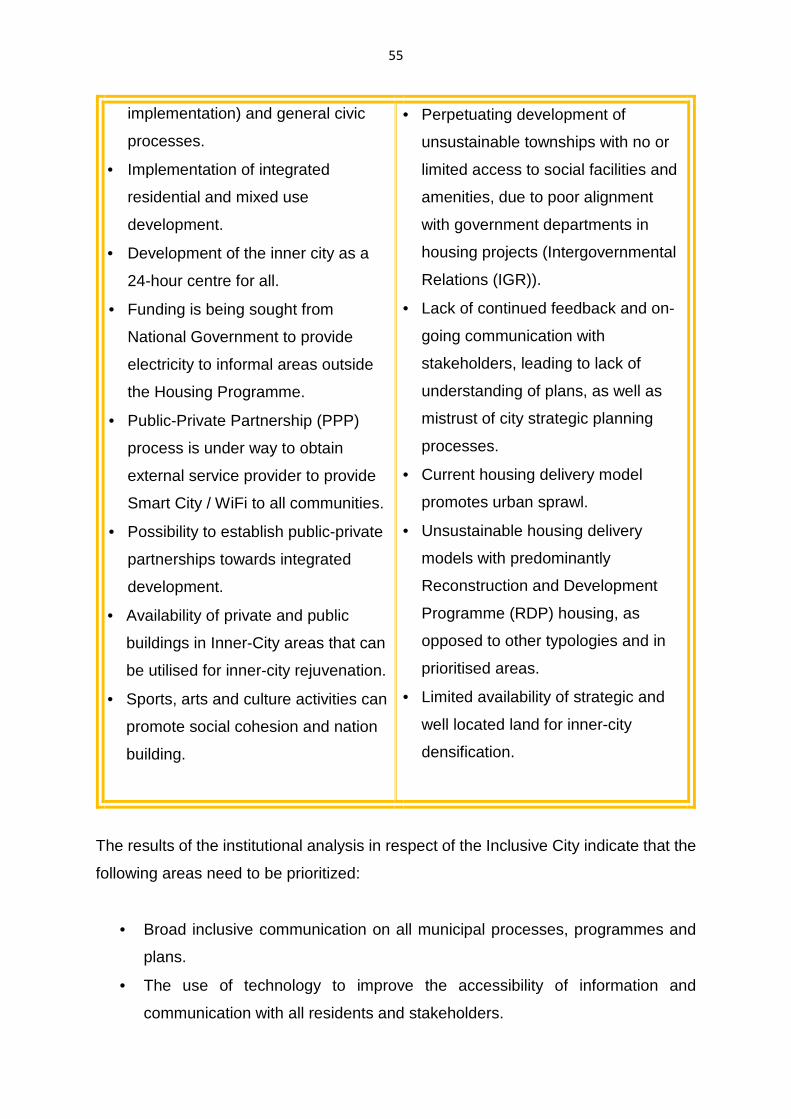
55
implementation) and general civic
processes.
• Implementation of integrated
residential and mixed use
development.
• Development of the inner city as a
24-hour centre for all.
• Funding is being sought from
National Government to provide
electricity to informal areas outside
the Housing Programme.
• Public-Private Partnership (PPP)
process is under way to obtain
external service provider to provide
Smart City / WiFi to all communities.
• Possibility to establish public-private
partnerships towards integrated
development.
• Availability of private and public
buildings in Inner-City areas that can
be utilised for inner-city rejuvenation.
• Sports, arts and culture activities can
promote social cohesion and nation
building.
• Perpetuating development of
unsustainable townships with no or
limited access to social facilities and
amenities, due to poor alignment
with government departments in
housing projects (Intergovernmental
Relations (IGR)).
• Lack of continued feedback and on-
going communication with
stakeholders, leading to lack of
understanding of plans, as well as
mistrust of city strategic planning
processes.
• Current housing delivery model
promotes urban sprawl.
• Unsustainable housing delivery
models with predominantly
Reconstruction and Development
Programme (RDP) housing, as
opposed to other typologies and in
prioritised areas.
• Limited availability of strategic and
well located land for inner-city
densification.
The results of the institutional analysis in respect of the Inclusive City indicate that the
following areas need to be prioritized:
• Broad inclusive communication on all municipal processes, programmes and
plans.
• The use of technology to improve the accessibility of information and
communication with all residents and stakeholders.
56
• Developing intergovernmental relations and other partnerships for the delivery
of the full range of developmental needs and priorities of communities.
• Institutional organization around all planning and development initiatives for the
development of integrated and sustainable communities.
• The inclusion of marginalized and vulnerable groups in civic plans, processes
and products.
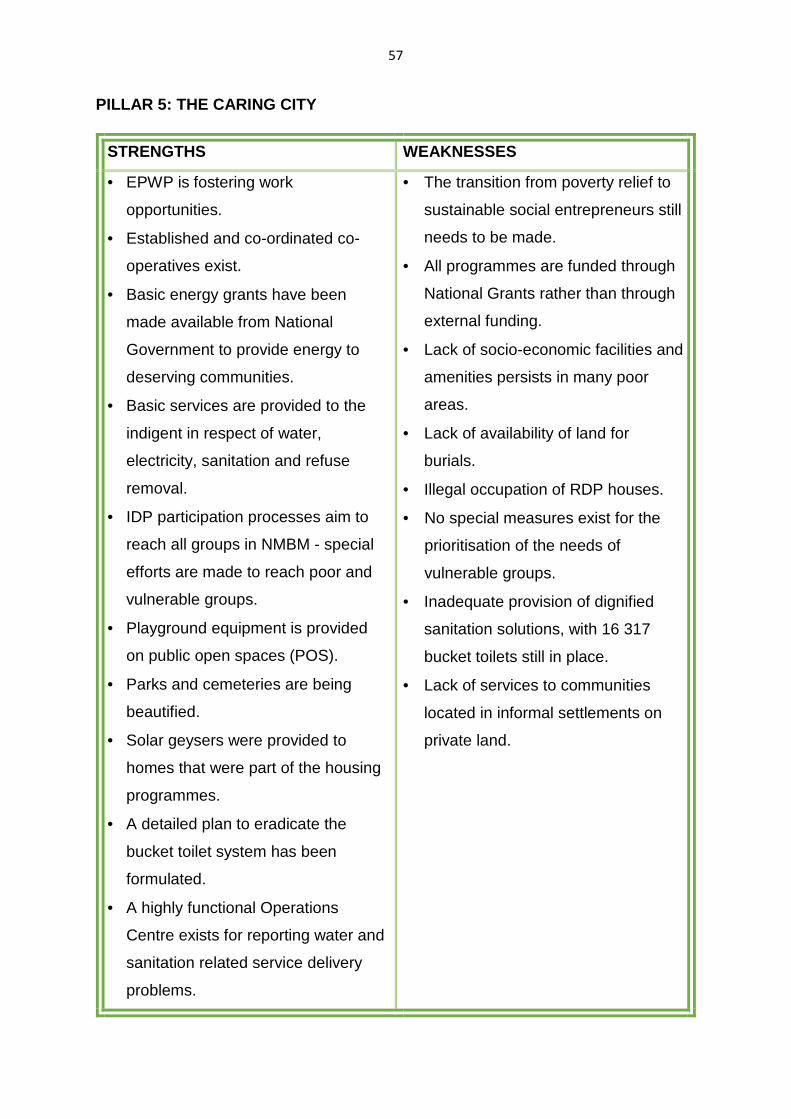
57
PILLAR 5: THE CARING CITY
STRENGTHS WEAKNESSES
• EPWP is fostering work
opportunities.
• Established and co-ordinated co-
operatives exist.
• Basic energy grants have been
made available from National
Government to provide energy to
deserving communities.
• Basic services are provided to the
indigent in respect of water,
electricity, sanitation and refuse
removal.
• IDP participation processes aim to
reach all groups in NMBM - special
efforts are made to reach poor and
vulnerable groups.
• Playground equipment is provided
on public open spaces (POS).
• Parks and cemeteries are being
beautified.
• Solar geysers were provided to
homes that were part of the housing
programmes.
• A detailed plan to eradicate the
bucket toilet system has been
formulated.
• A highly functional Operations
Centre exists for reporting water and
sanitation related service delivery
problems.
• The transition from poverty relief to
sustainable social entrepreneurs still
needs to be made.
• All programmes are funded through
National Grants rather than through
external funding.
• Lack of socio-economic facilities and
amenities persists in many poor
areas.
• Lack of availability of land for
burials.
• Illegal occupation of RDP houses.
• No special measures exist for the
prioritisation of the needs of
vulnerable groups.
• Inadequate provision of dignified
sanitation solutions, with 16 317
bucket toilets still in place.
• Lack of services to communities
located in informal settlements on
private land.
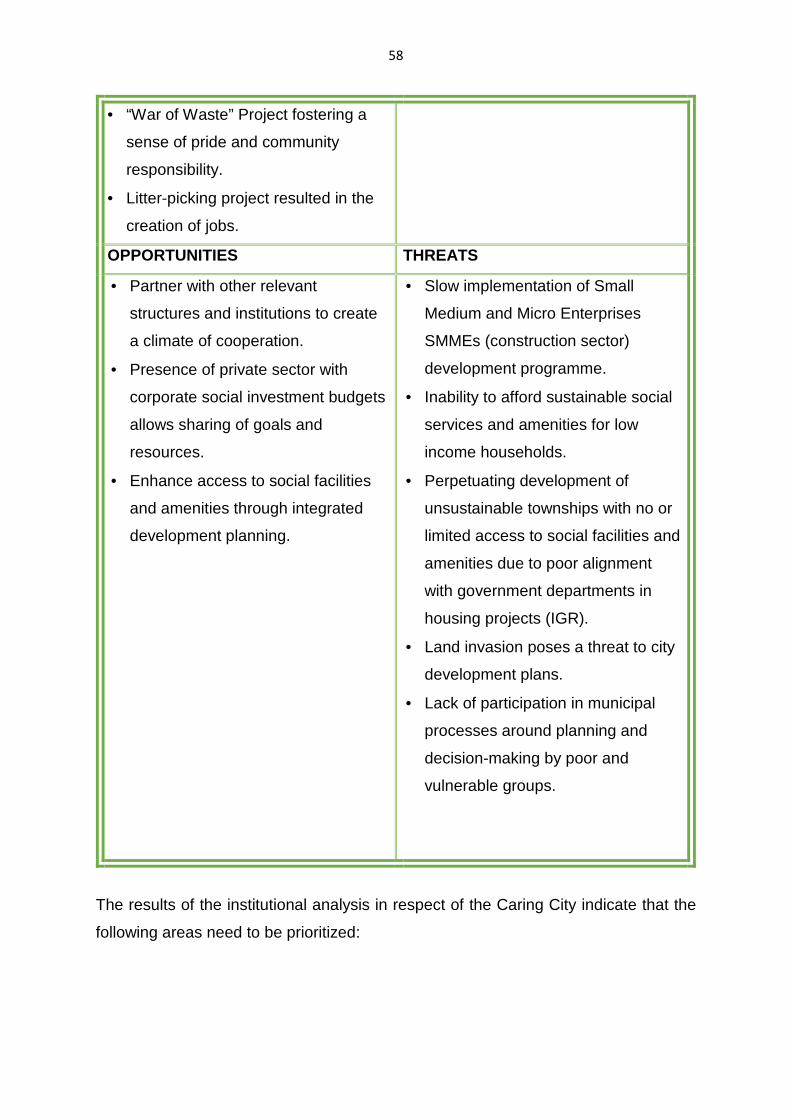
58
• “War of Waste” Project fostering a
sense of pride and community
responsibility.
• Litter-picking project resulted in the
creation of jobs.
OPPORTUNITIES THREATS
• Partner with other relevant
structures and institutions to create
a climate of cooperation.
• Presence of private sector with
corporate social investment budgets
allows sharing of goals and
resources.
• Enhance access to social facilities
and amenities through integrated
development planning.
• Slow implementation of Small
Medium and Micro Enterprises
SMMEs (construction sector)
development programme.
• Inability to afford sustainable social
services and amenities for low
income households.
• Perpetuating development of
unsustainable townships with no or
limited access to social facilities and
amenities due to poor alignment
with government departments in
housing projects (IGR).
• Land invasion poses a threat to city
development plans.
• Lack of participation in municipal
processes around planning and
decision-making by poor and
vulnerable groups.
The results of the institutional analysis in respect of the Caring City indicate that the
following areas need to be prioritized:
59
• Creating an environment that promotes and ensures participation and the well-
being of vulnerable and marginalized groups in municipal processes around
planning and decision-making.
• Ensuring the provision of adequate services and amenities to all communities.
• Creating partnerships and seeking funding sources for improved social
amenities.
• Ensuring that city planning processes promote spatial justice and equitable
access (physically, socially and economically).
• Reviewing municipal operations to ensure efficient responses to community
complaints, applications and queries.
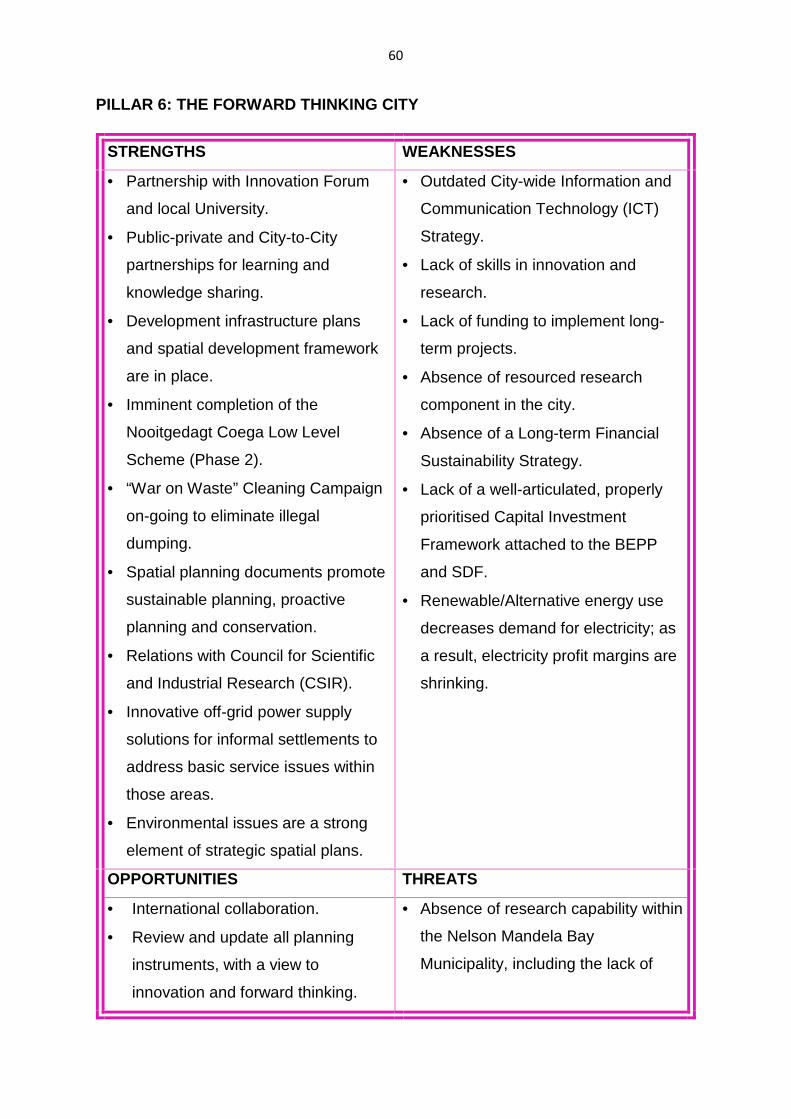
60
PILLAR 6: THE FORWARD THINKING CITY
STRENGTHS WEAKNESSES
• Partnership with Innovation Forum
and local University.
• Public-private and City-to-City
partnerships for learning and
knowledge sharing.
• Development infrastructure plans
and spatial development framework
are in place.
• Imminent completion of the
Nooitgedagt Coega Low Level
Scheme (Phase 2).
• “War on Waste” Cleaning Campaign
on-going to eliminate illegal
dumping.
• Spatial planning documents promote
sustainable planning, proactive
planning and conservation.
• Relations with Council for Scientific
and Industrial Research (CSIR).
• Innovative off-grid power supply
solutions for informal settlements to
address basic service issues within
those areas.
• Environmental issues are a strong
element of strategic spatial plans.
• Outdated City-wide Information and
Communication Technology (ICT)
Strategy.
• Lack of skills in innovation and
research.
• Lack of funding to implement long-
term projects.
• Absence of resourced research
component in the city.
• Absence of a Long-term Financial
Sustainability Strategy.
• Lack of a well-articulated, properly
prioritised Capital Investment
Framework attached to the BEPP
and SDF.
• Renewable/Alternative energy use
decreases demand for electricity; as
a result, electricity profit margins are
shrinking.
OPPORTUNITIES THREATS
• International collaboration.
• Review and update all planning
instruments, with a view to
innovation and forward thinking.
• Absence of research capability within
the Nelson Mandela Bay
Municipality, including the lack of
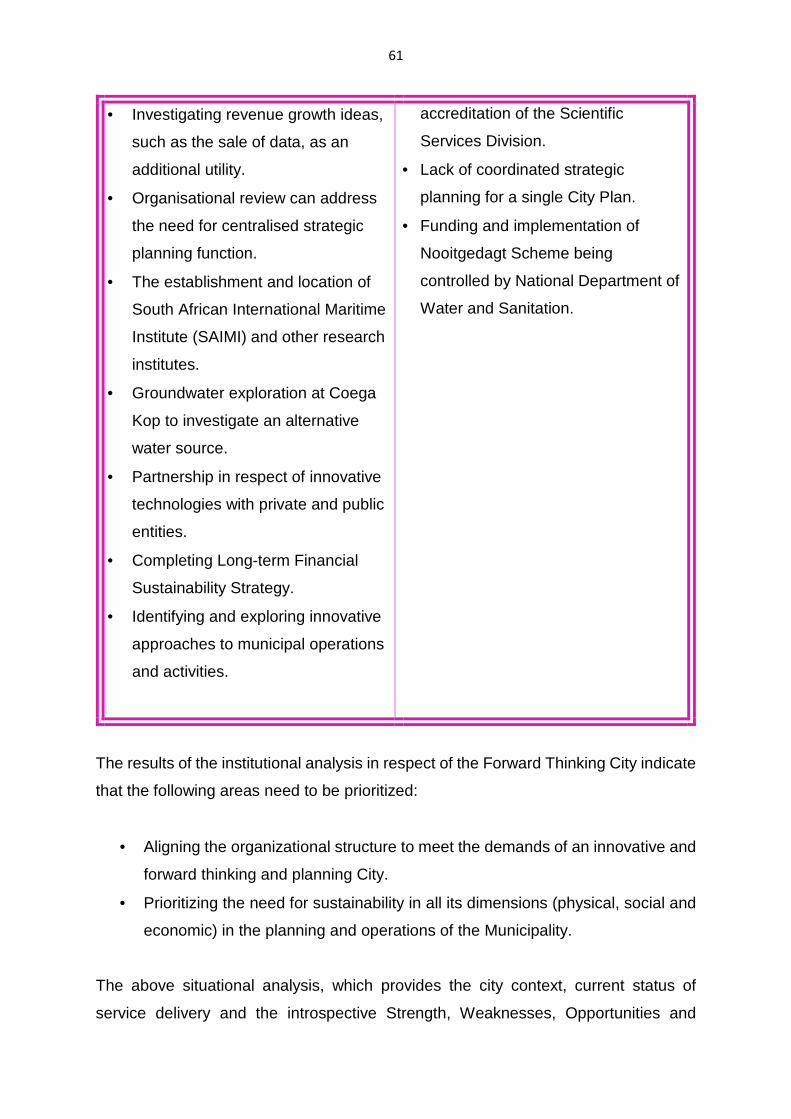
61
• Investigating revenue growth ideas,
such as the sale of data, as an
additional utility.
• Organisational review can address
the need for centralised strategic
planning function.
• The establishment and location of
South African International Maritime
Institute (SAIMI) and other research
institutes.
• Groundwater exploration at Coega
Kop to investigate an alternative
water source.
• Partnership in respect of innovative
technologies with private and public
entities.
• Completing Long-term Financial
Sustainability Strategy.
• Identifying and exploring innovative
approaches to municipal operations
and activities.
accreditation of the Scientific
Services Division.
• Lack of coordinated strategic
planning for a single City Plan.
• Funding and implementation of
Nooitgedagt Scheme being
controlled by National Department of
Water and Sanitation.
The results of the institutional analysis in respect of the Forward Thinking City indicate
that the following areas need to be prioritized:
• Aligning the organizational structure to meet the demands of an innovative and
forward thinking and planning City.
• Prioritizing the need for sustainability in all its dimensions (physical, social and
economic) in the planning and operations of the Municipality.
The above situational analysis, which provides the city context, current status of
service delivery and the introspective Strength, Weaknesses, Opportunities and
62
Threats (SWOT) analysis for each of the six pillars will, when combined with the results
of the comprehensive public participation undertaken, provide the foundation for the
activities to be conducted, as expressed in this IDP.
63
CHAPTER 3: METHODOLOGY
The Municipality’s leadership set in motion a strategy to prepare an Integrated
Development Plan that would change the face of Nelson Mandela Bay. With a strong
commitment to improving service delivery, stopping corruption and growing the
economy to create jobs, it was incumbent on the government to completely reform the
administration and its systems.
Chapter Seven (7) of the Constitution of the Republic of South Africa, Act 108 of 1996,
Chapter Four (4) and Five (5) of Local Government Municipal Systems Act, 32 of 2000
and, Chapter Four (4) of the Municipal Finance Management Act Number 56 of 2003
compels municipalities to engage communities in public participation. This should not
only be done as a compliance exercise but also as a serious engagement with
communities in order for all programmes that a municipality is implementing within the
five (5) year cycle of its Integrated Development Planning (IDP) to be informed by the
priorities of its citizens.
The 2018/19 IDP / Budget public participation programme was approved by the
Strategic Planning Steering Committee that was established by the Executive Mayor
to oversee the whole planning and implementation processes. The residents took the
current administration into their confidence through comprehensive feedback and
guidance at over 20 public meetings across the Metro. The Executive Mayor and his
Executive were given a clear direction, underpinned by a political vision for change
and progress.
For the first time in the Metro’s history, a method of recording and rating ward priorities
was implemented at the first round of IDP and Budget public participation meetings,
which took place during 18 to 24 August 2017. After reviewing the other major
statutory documents, residents were asked to review the Council-noted list of ward
priorities for their ward and assign a value of importance to each priority (with High,
Medium and Delivered when possible).
The Municipality comprehensively consulted with the community and the economic
sectors of the Metro to get inputs on how to best tackle the challenges faced in growing
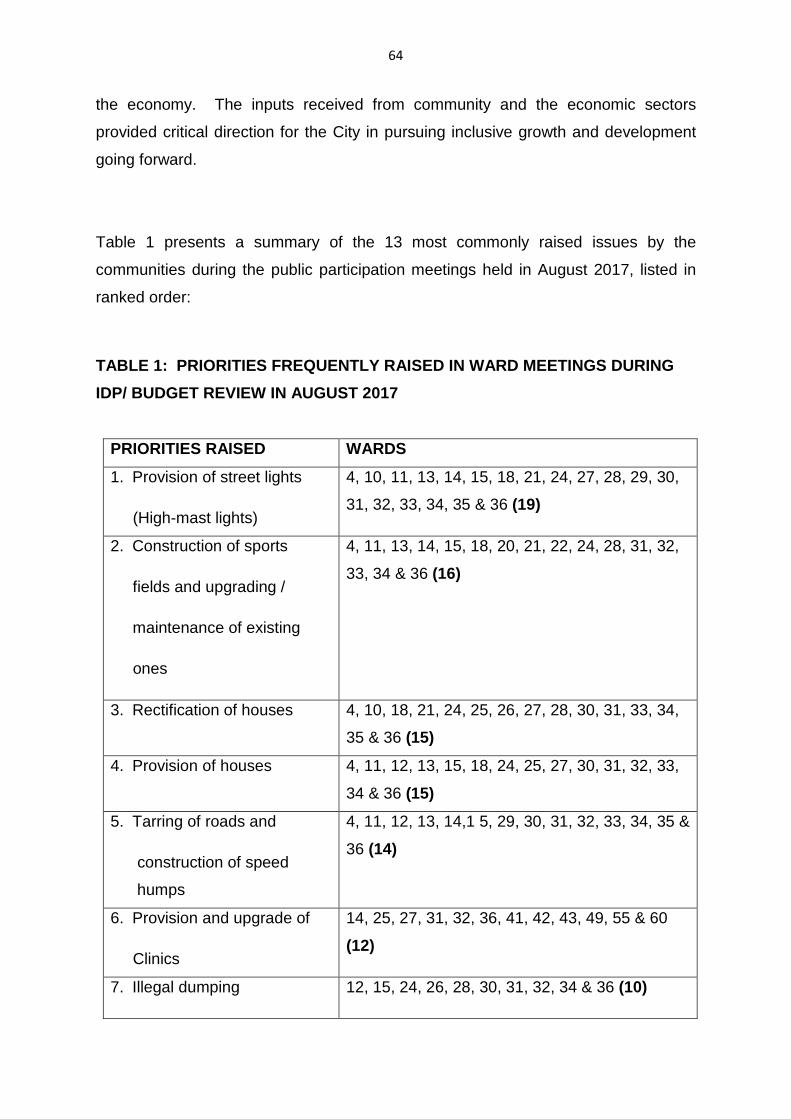
64
the economy. The inputs received from community and the economic sectors
provided critical direction for the City in pursuing inclusive growth and development
going forward.
Table 1 presents a summary of the 13 most commonly raised issues by the
communities during the public participation meetings held in August 2017, listed in
ranked order:
TABLE 1: PRIORITIES FREQUENTLY RAISED IN WARD MEET INGS DURING
IDP/ BUDGET REVIEW IN AUGUST 2017
PRIORITIES RAISED WARDS
1. Provision of street lights
(High-mast lights)
4, 10, 11, 13, 14, 15, 18, 21, 24, 27, 28, 29, 30,
31, 32, 33, 34, 35 & 36 (19)
2. Construction of sports
fields and upgrading /
maintenance of existing
ones
4, 11, 13, 14, 15, 18, 20, 21, 22, 24, 28, 31, 32,
33, 34 & 36 (16)
3. Rectification of houses 4, 10, 18, 21, 24, 25, 26, 27, 28, 30, 31, 33, 34,
35 & 36 (15)
4. Provision of houses 4, 11, 12, 13, 15, 18, 24, 25, 27, 30, 31, 32, 33,
34 & 36 (15)
5. Tarring of roads and
construction of speed
humps
4, 11, 12, 13, 14,1 5, 29, 30, 31, 32, 33, 34, 35 &
36 (14)
6. Provision and upgrade of
Clinics
14, 25, 27, 31, 32, 36, 41, 42, 43, 49, 55 & 60
(12)
7. Illegal dumping 12, 15, 24, 26, 28, 30, 31, 32, 34 & 36 (10)
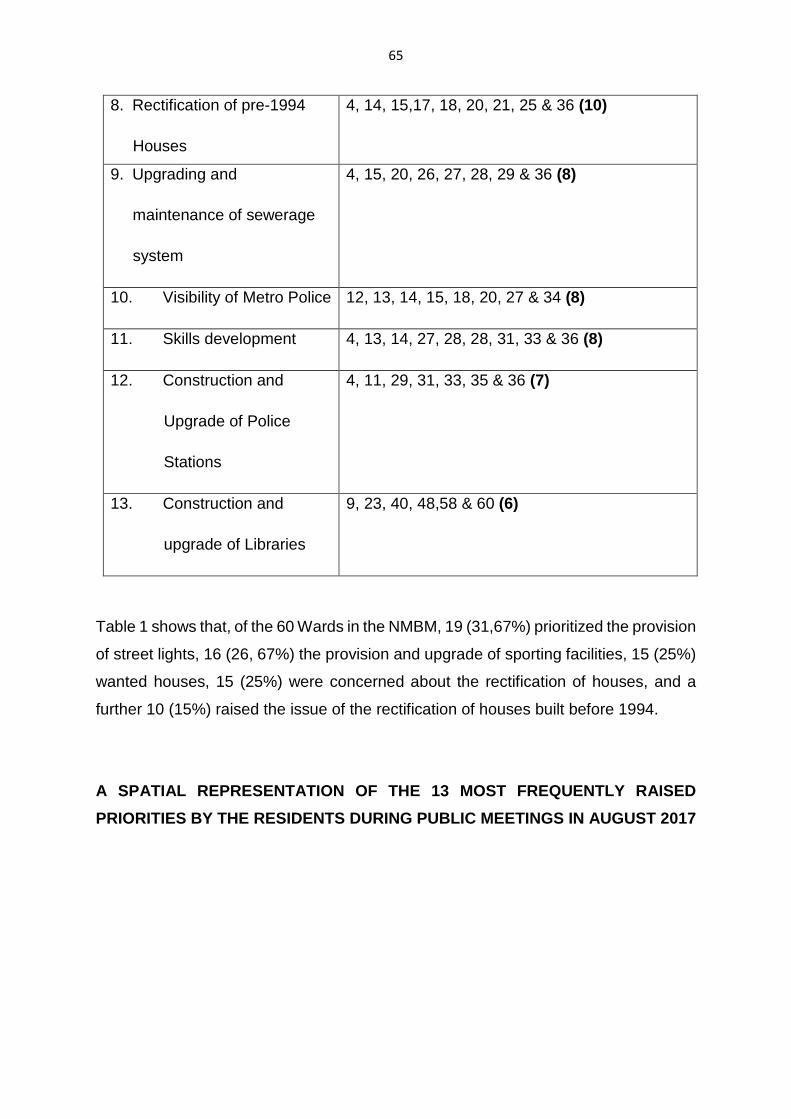
65
8. Rectification of pre-1994
Houses
4, 14, 15,17, 18, 20, 21, 25 & 36 (10)
9. Upgrading and
maintenance of sewerage
system
4, 15, 20, 26, 27, 28, 29 & 36 (8)
10. Visibility of Metro Police 12, 13, 14, 15, 18, 20, 27 & 34 (8)
11. Skills development 4, 13, 14, 27, 28, 28, 31, 33 & 36 (8)
12. Construction and
Upgrade of Police
Stations
4, 11, 29, 31, 33, 35 & 36 (7)
13. Construction and
upgrade of Libraries
9, 23, 40, 48,58 & 60 (6)
Table 1 shows that, of the 60 Wards in the NMBM, 19 (31,67%) prioritized the provision
of street lights, 16 (26, 67%) the provision and upgrade of sporting facilities, 15 (25%)
wanted houses, 15 (25%) were concerned about the rectification of houses, and a
further 10 (15%) raised the issue of the rectification of houses built before 1994.
A SPATIAL REPRESENTATION OF THE 13 MOST FREQUENTLY RAISED
PRIORITIES BY THE RESIDENTS DURING PUBLIC MEETINGS IN AUGUST 2017
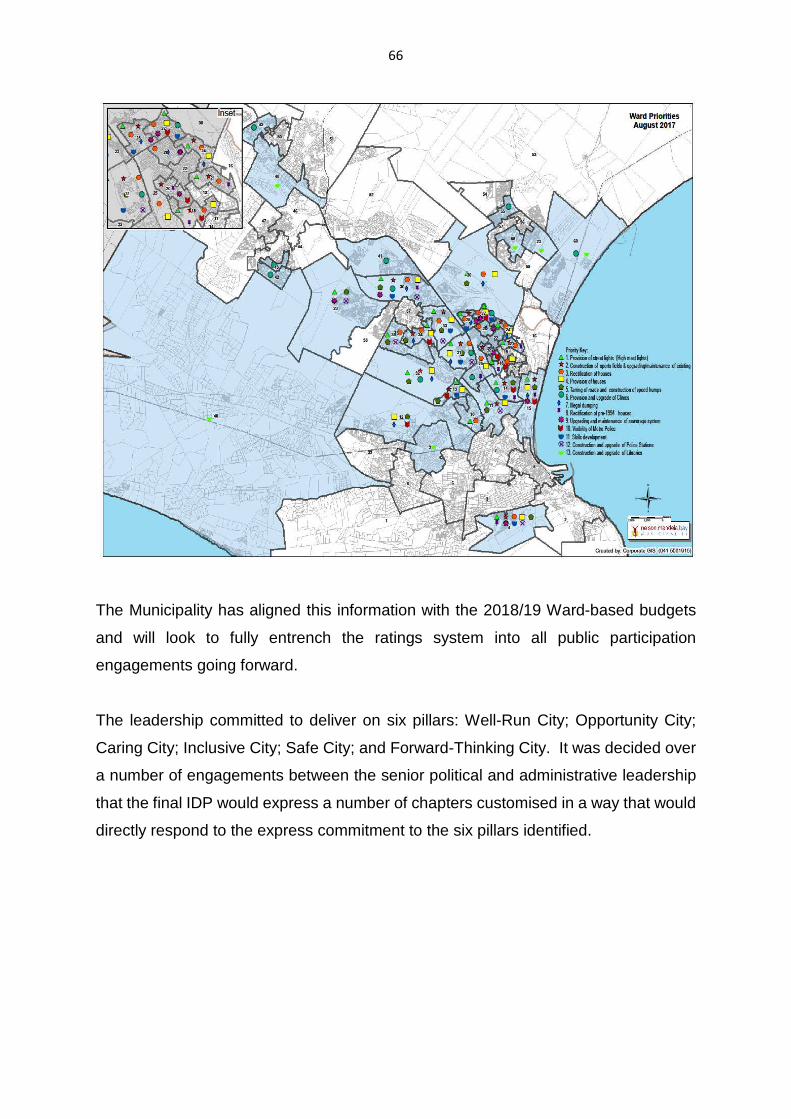
66
The Municipality has aligned this information with the 2018/19 Ward-based budgets
and will look to fully entrench the ratings system into all public participation
engagements going forward.
The leadership committed to deliver on six pillars: Well-Run City; Opportunity City;
Caring City; Inclusive City; Safe City; and Forward-Thinking City. It was decided over
a number of engagements between the senior political and administrative leadership
that the final IDP would express a number of chapters customised in a way that would
directly respond to the express commitment to the six pillars identified.

67
The IDP therefore reflects on the status quo of the institution in respect of the six
pillars, as determined through a SWOT analysis. Based on the ambitions of the
current leadership, both political and administrative, as well as the feedback from the
intensive public participation sessions, an appropriate delivery plan has been
formulated that responds directly to the six pillars and the strategic objectives
identified.
68
CHAPTER 4
SPATIAL STRATEGY
4.1 INTRODUCTION
The spatial strategy of the Municipality is embedded in three interrelated strategic
documents; these are:
• The Metropolitan Spatial Development Framework (MSDF).
• The Sustainable Community Planning Methodology.
• The Built Environment Performance Plan (BEPP).
This Chapter outlines the key features of these three strategic documents, which
together form the spatial strategy of the City. The documents exist as separate
documents, and the MSDF and BEPP are required to be legally compliant.
The Metropolitan Spatial Development Framework (MSDF) is the primary spatial plan
of the City and represents the spatial manifestation of the IDP. All matters of a spatial
nature concerning the Municipality are encapsulated in the MSDF. It includes the
aforementioned Sustainable Community Planning Methodology and the Built
Environment Performance Plan.
The initial MSDF was approved by Council in 2009; a second version was approved
in December 2015. A Draft MSDF exists, and this Chapter includes the revised Spatial
Development Framework Strategy. The Spatial Planning and Land Use Management
Act 2013 (SPLUMA) sets the legal framework for the SDFs of South African
municipalities. A new and legally compliant SDF will be adopted within the 2018/19
financial year following the adoption of the new post-election IDP. The core principles
of the SDF have remained intact over multi-year periods and political cycles.
69
The Sustainable Community Planning Methodology is an international award-winning
planning methodology developed and implemented in the Nelson Mandela Bay
Municipality (NMBM), to enhance the levels of sustainability and integration of
development within the City and to reduce the effects of entrenched segregation. It
promotes the analysis and planning of the City in what is termed Sustainable
Community Units (SCUs), which apply to both new and existing areas and aim to
ensure that any development is examined through the lenses of housing, work,
services, transport and character / identity, in order that the need for travel is reduced
and that essential services in the above categories are available within walking
distance of all households within an SCU.
The Built Environment Performance Plan (BEPP) is an annual requirement of the
Division of Revenue Act, which aims to bring about practical spatial restructuring of
the country’s Metropolitan Cities through defining and actively implementing an Urban
Network Strategy (UNS) that defines CBDs and hubs connected by Integration Zones,
where access is prioritised Transit Oriented Development (TOD) as well as catalytic
projects and high density mixed-use developments are promoted. The BEPP also
focuses on the implementation of Growth Nodes and the eradication of Informal
Settlements. The BEPP is required to release various grant funding from National
Treasury and can be seen to represent the capital urban investment strategy of the
city, especially of the conditional grants. The NMBM 2018/19 - 2021/22 Built
Environment Performance Plan is available on the municipal website:
www.nelsonmandelabay.gov.za.
4.2 NMBM METROPOLITAN SPATIAL DEVELOPMENT FRAMEWORK
The Metropolitan Spatial Development Framework (MSDF) and the associated, more
detailed, Local Spatial Development Frameworks (LSDFs) seek to guide overall
spatial form and identify current and future desirable land uses within the Municipality
at a broad level in order to give physical effect to the vision, goals and objectives of
the IDP.
The MSDF identifies major transport routes, future transport links, environmentally
important areas and key potentials and constraints. The MSDF also aims to sequence
70
future development areas in a manner that makes the best use of infrastructure
services and limits the leap-frogging of development and the unnecessary expansion
of infrastructure networks.
The legal importance of the MSDF is contained, inter alia, in the Spatial Planning and
Land Use Management Act 2013 (SPLUMA), Chapter 4, which states that:
“a Municipal Planning Tribunal or any other authority required or mandated to make a
land development decision in terms of this Act or any other law relating to land
development, may not make a decision which is inconsistent with a municipal spatial
development framework, unless if site specific circumstances justify a departure from
such provisions.”
4.2.1 Rationale for Spatial Planning
The MSDF must give effect to the development principles contained in the Spatial
Planning and Land Use Management Act, 2013 (SPLUMA). These are:
• Spatial justice.
• Spatial sustainability.
• Efficiency.
• Spatial resilience.
• Good administration.
4.2.2 SDF processes
The following processes of the SDF support sustainable development within the
Nelson Mandela Bay Municipality:
• Analysis of spatial opportunities, constraints, patterns and trends.
• Identification of the need for spatial restructuring and land reform.
• Provision of spatial solutions to developmental issues.
• Identification of national spatial development principles and their spatial
application in the NMBM.
71
• Understanding of and allowance for the spatial implications of social, economic
and environmental sustainability.
• Production of a document to guide decision-making on developable and non-
developable areas, including the sequencing of development.
• Creation of a framework for public and private investment decisions to facilitate
investor confidence.
4.2.3 Priority Areas
The MSDF provides strategic guidance in respect of areas on which the Municipality
should focus the allocation of its resources. In order to assist in prioritising projects
and allocating resources, the following elements of the MSDF are isolated as
geographic entities that give guidance as to where the priority capital investment areas
lie. These areas are:
• Core economic areas
• Infill priority areas
• Strategic development areas
• Service upgrading priority areas
The MSDF is also supported by a number of sectoral plans and topic-specific planning
documents, which include the following:
• Strategic Environmental Assessment.
• Urban edge/Rural management and urban densification policies.
• Demographic Study update.
• Land Use Management System (LUMS).
• Human Settlements Implementation Plan.
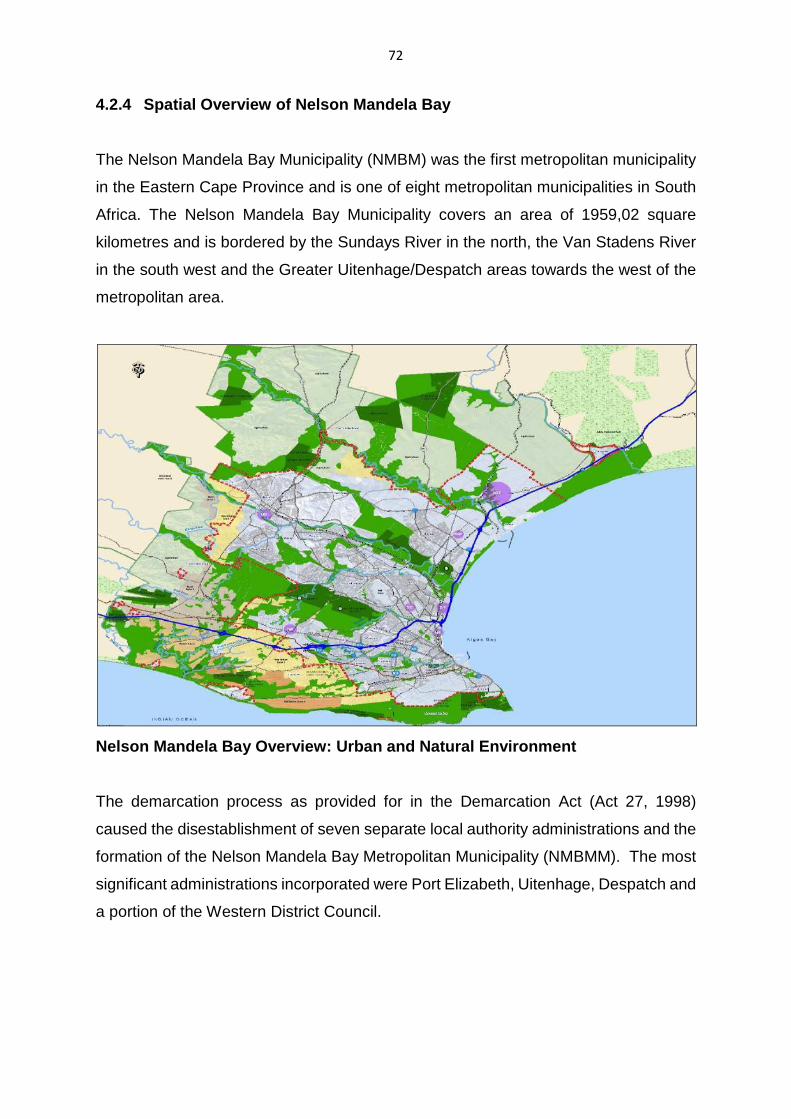
72
4.2.4 Spatial Overview of Nelson Mandela Bay
The Nelson Mandela Bay Municipality (NMBM) was the first metropolitan municipality
in the Eastern Cape Province and is one of eight metropolitan municipalities in South
Africa. The Nelson Mandela Bay Municipality covers an area of 1959,02 square
kilometres and is bordered by the Sundays River in the north, the Van Stadens River
in the south west and the Greater Uitenhage/Despatch areas towards the west of the
metropolitan area.
Nelson Mandela Bay Overview: Urban and Natural Envi ronment
The demarcation process as provided for in the Demarcation Act (Act 27, 1998)
caused the disestablishment of seven separate local authority administrations and the
formation of the Nelson Mandela Bay Metropolitan Municipality (NMBMM). The most
significant administrations incorporated were Port Elizabeth, Uitenhage, Despatch and
a portion of the Western District Council.
73
4.2.5 Proposed Metropolitan Structure
Structuring the Plan
The spatial structuring of the Plan is based on the following factors:
• Available land and its features.
• Envisaged population growth.
• Economic development.
• Principles guiding integration, efficiency and sustainability.
The following considerations have been used to determine the basic structure of the
Plan:
• Land earmarked for new development, including low income housing, has been
selected on the basis that vacant land within and close to the existing built-up
areas must be utilised first, while further outlying areas are considered for
development only once more centrally located land has been taken up. This
will encourage more efficient use of existing infrastructure before network
extensions are required. It will also discourage the leap-frogging of
development, which is expensive from a bulk services provision perspective.
• Land uses are to be arranged in a manner that promotes the development and
use of an efficient public transport system. Densification and a mix of land uses
along major transport corridors can achieve this objective.
• Access to green recreational zones from residential areas has been given
special attention. Natural, sensitive areas have been identified for protection
and additional green spaces have been set aside for recreational use, as well
as other uses that are of an ecological nature.
• Certain land uses, such as large industrial areas, are kept away from residential
areas, due to the heavy traffic, air pollution and noise generated by industrial
operations.
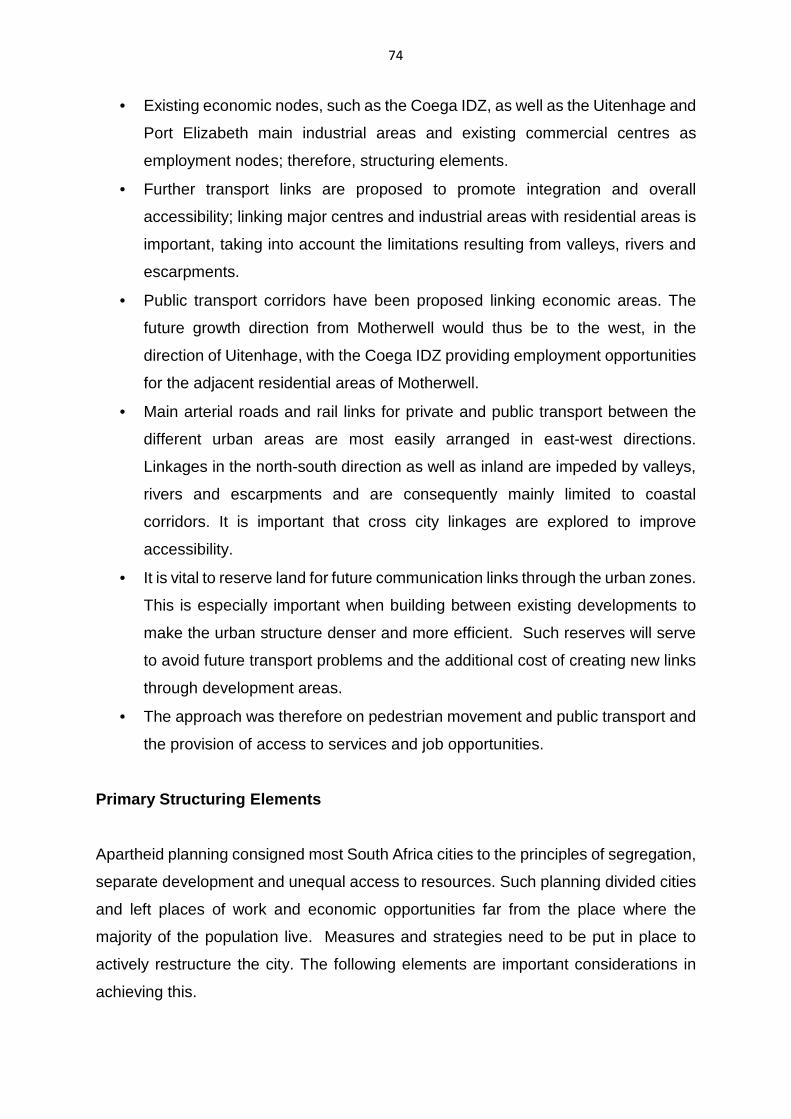
74
• Existing economic nodes, such as the Coega IDZ, as well as the Uitenhage and
Port Elizabeth main industrial areas and existing commercial centres as
employment nodes; therefore, structuring elements.
• Further transport links are proposed to promote integration and overall
accessibility; linking major centres and industrial areas with residential areas is
important, taking into account the limitations resulting from valleys, rivers and
escarpments.
• Public transport corridors have been proposed linking economic areas. The
future growth direction from Motherwell would thus be to the west, in the
direction of Uitenhage, with the Coega IDZ providing employment opportunities
for the adjacent residential areas of Motherwell.
• Main arterial roads and rail links for private and public transport between the
different urban areas are most easily arranged in east-west directions.
Linkages in the north-south direction as well as inland are impeded by valleys,
rivers and escarpments and are consequently mainly limited to coastal
corridors. It is important that cross city linkages are explored to improve
accessibility.
• It is vital to reserve land for future communication links through the urban zones.
This is especially important when building between existing developments to
make the urban structure denser and more efficient. Such reserves will serve
to avoid future transport problems and the additional cost of creating new links
through development areas.
• The approach was therefore on pedestrian movement and public transport and
the provision of access to services and job opportunities.
Primary Structuring Elements
Apartheid planning consigned most South Africa cities to the principles of segregation,
separate development and unequal access to resources. Such planning divided cities
and left places of work and economic opportunities far from the place where the
majority of the population live. Measures and strategies need to be put in place to
actively restructure the city. The following elements are important considerations in
achieving this.
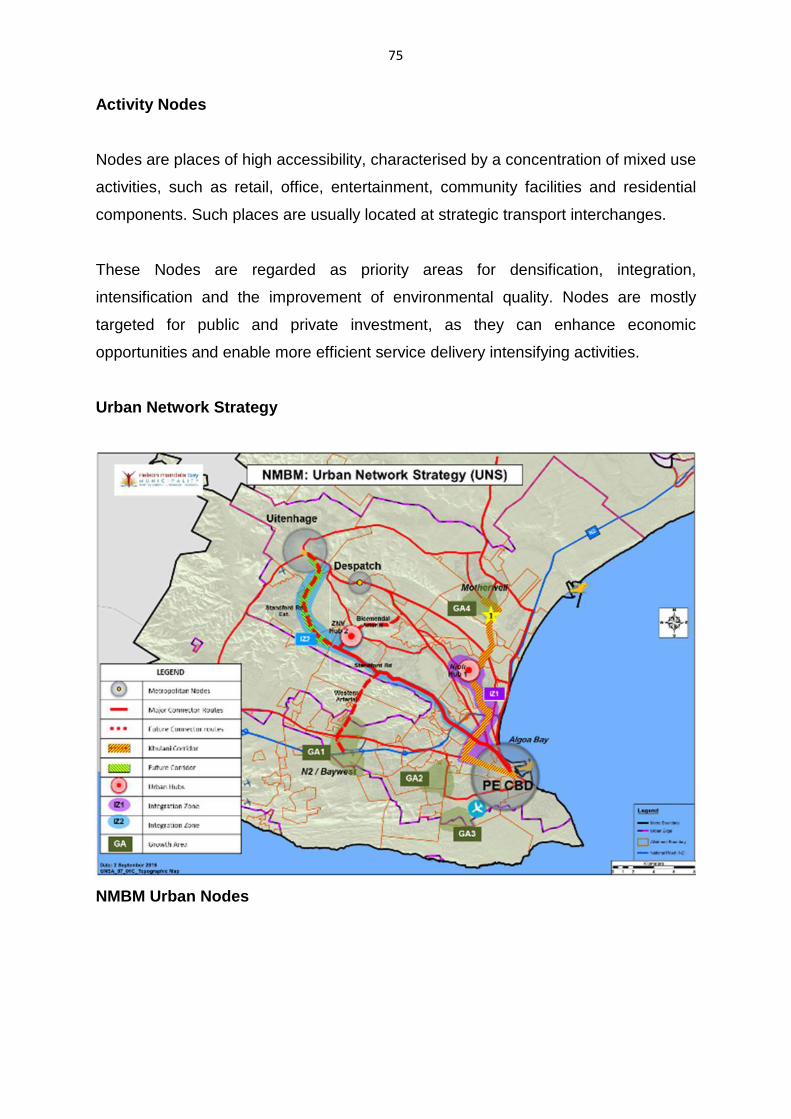
75
Activity Nodes
Nodes are places of high accessibility, characterised by a concentration of mixed use
activities, such as retail, office, entertainment, community facilities and residential
components. Such places are usually located at strategic transport interchanges.
These Nodes are regarded as priority areas for densification, integration,
intensification and the improvement of environmental quality. Nodes are mostly
targeted for public and private investment, as they can enhance economic
opportunities and enable more efficient service delivery intensifying activities.
Urban Network Strategy
NMBM Urban Nodes
76
Urban Corridors / Activity Spines
Urban corridors are a combination of structuring elements that reinforce a hierarchy of
nodes. They have varying development intensities and widths. Mixed used activities
should be created and promoted within such corridors/spines to also include different
modes of transport. This minimises travelling costs and the costs of transport
infrastructure by increasing accessibility to employment opportunities, especially for
previously disadvantaged communities.
The city structure needs to be developed in a manner that uses infrastructure more
efficiently and minimises the need to extend infrastructure networks unnecessarily.
Transportation infrastructure is the most expensive infrastructure in urban
development and extensions to road and rail networks therefore need to be kept to a
minimum.
Residential and commercial densities along transportation routes need to be increased
at strategic locations (i.e. near development nodes) in order to transform major routes
into activity or development corridors and create an environment conducive for
sustainable human settlements.
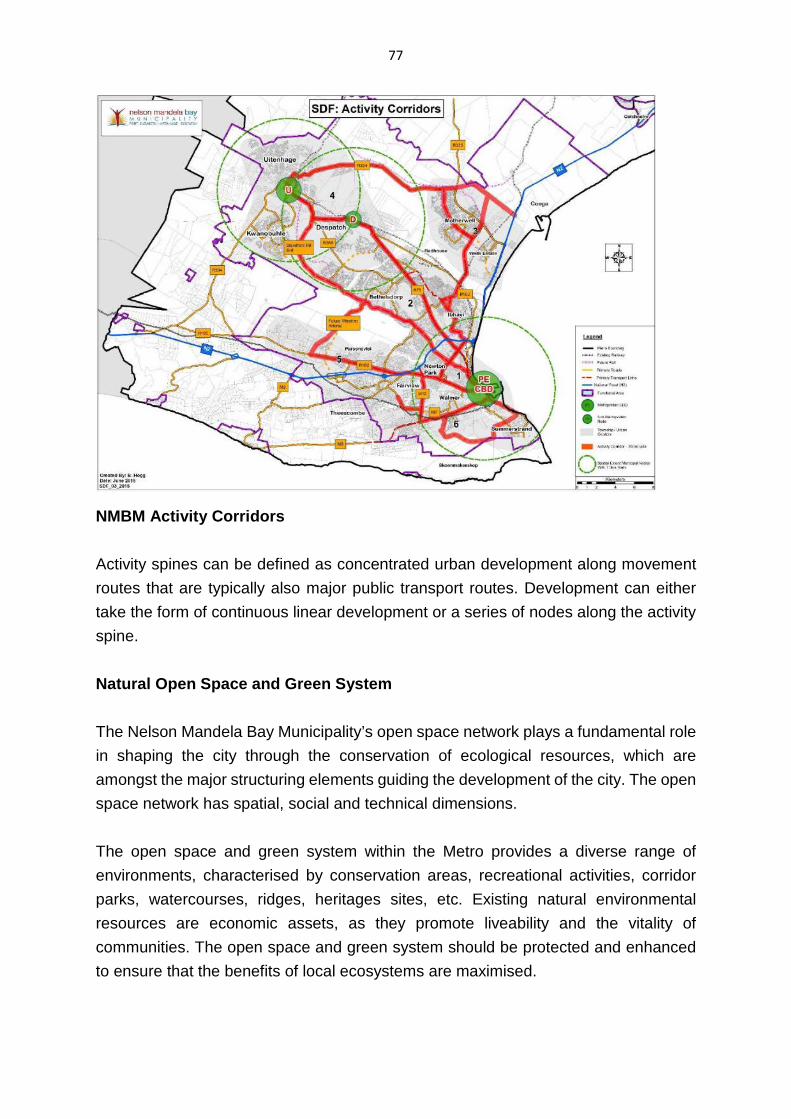
77
NMBM Activity Corridors
Activity spines can be defined as concentrated urban development along movement
routes that are typically also major public transport routes. Development can either
take the form of continuous linear development or a series of nodes along the activity
spine.
Natural Open Space and Green System
The Nelson Mandela Bay Municipality’s open space network plays a fundamental role
in shaping the city through the conservation of ecological resources, which are
amongst the major structuring elements guiding the development of the city. The open
space network has spatial, social and technical dimensions.
The open space and green system within the Metro provides a diverse range of
environments, characterised by conservation areas, recreational activities, corridor
parks, watercourses, ridges, heritages sites, etc. Existing natural environmental
resources are economic assets, as they promote liveability and the vitality of
communities. The open space and green system should be protected and enhanced
to ensure that the benefits of local ecosystems are maximised.
78
Consolidation and Densification
A consolidation and densification approach promotes more compact urban
development and maximises the efficiency of areas that are well serviced and centrally
located.
This approach contributes to the restructuring of the urban environment and
discourages urban sprawl by promoting development that is adjacent to existing urban
areas. Furthermore, it promotes the more efficient use of the existing infrastructure,
especially at urban centres and along urban corridors.
Growth Management / Urban Edge
Most urban areas in South Africa are characterised by urban sprawl; citizens spend a
lot of time and money travelling long distances to work, shops, schools and social
facilities. Local authorities are also required to invest large amounts in providing and
maintaining excessive infrastructure. A tool of the spatial development framework for
growth management is the demarcation of an urban growth boundary or urban edge.
The “urban edge” is a conceptual boundary that delineates the urban area in order to
contain physical development and sprawl and re-direct growth towards a more
integrated, compact and efficient urban form, guided by detailed plans.
The delineation of an urban edge achieves a more efficient and sustainable
municipality through the –
• Containment of urban sprawl.
• Intensification of development.
• Integration of urban areas.
• Protection of valuable agricultural, natural and cultural resources.
• Optimum use of existing resources in established urban areas, such as bulk
service infrastructure, roads and public facilities.
• Reduced need for commuting, as well as reduced commuting distances.
79
4.3 SUSTAINABLE COMMUNITY PLANNING AND METHODOLOGY
The existing pattern of development in Nelson Mandela Bay is the result of historical
segregation-based planning. The structuring not only separates different racial
groupings in geographical terms, but has also resulted in huge disparities in standards
of living, as well as access to infrastructural services, employment, and cultural and
recreational facilities. As these imbalances serve as constraints for redevelopment,
they should be addressed and rectified.
The NMBM developed and introduced this planning methodology to assist the city in
dealing with the creation of a more sustainable city. The methodology is an integral
part of the MSDF, LSDF and precinct planning that is undertaken.
Sustainable Community Units (SCUs) have been introduced to achieve a more
balanced structure in Nelson Mandela Bay, in order to reduce discrepancies in terms
of service provision and standards; promote integration in socio-economic and
functional terms; and provide for economic activities and employment opportunities.
The urban area of Nelson Mandela Bay has been divided into a number of planning
units or entities, known as Sustainable Community Units. These are defined by the
distance that an average person can comfortably walk in half an hour, i.e. a 2 km
radius.
The planning methodology aims to provide the requirements for a minimum standard
of planning and living within those areas; in other words, amenities, facilities and job
opportunities must be within walking distance of all residents. All SCUs in Nelson
Mandela Bay are to be linked by a public transport network, which will ensure that all
areas are accessible to all communities by means of public transport, which is also
required in terms of the Integrated Transport Plan.
Basic municipal facilities and services should be provided within walking distance of
residential areas; higher order facilities can be located further away.
80
Distance to Facilities
The SCU planning methodology concept identifies the need to make higher levels of
sustainability and integration in Nelson Mandela Bay its primary focus. The basis for
sustainable community planning lies in the development principles adopted at national,
provincial and local government levels, as supported by legislation and government
policies.
The Municipality’s Sustainable Community Planning methodology covers both existing
and future areas of development. A fundamental principle of this plan is to have work
opportunities closer to places of residence in order to reduce the need to travel. This
is to be achieved through the planning of new areas to accommodate more than just
housing developments, but also through a paradigm shift, in location of new
settlements closer to rather than further away from places of employment and social
and public amenities. Peri-urban areas, in which settlements exist, are also planned
according to the Sustainable Community Planning methodology, with a view to
providing local job opportunities.
The development goals and principles of particular importance for spatial planning in
SCUs are:
(a) Poverty alleviation and the satisfaction of basic needs.
(b) Focus on special needs groups (HIV and AIDS affected/infected persons,
children, the elderly, and persons with disabilities).
(c) Gender equality and equity.
(d) The environment (physical, socio-economic).
(e) Participation and democratic processes.
(f) Local economic development.
(g) Accessibility (public transport and pedestrian focus).
(h) Mixed-use development.
(i) Corridor development.
(j) Safety and security.
(k) Variation and flexibility.
(l) Appropriate densification.
(m) Reducing urban sprawl.
81
To achieve both sustainability and integration, the following functional elements need
attention in relation to the above principles:
(a) Housing
(b) Work
(c) Services
(d) Transport
(e) Community
(f) Character and identity
Focusing on these six elements, minimum standards are pursued to achieve an
acceptable planning quality, which will result in an improved quality of life for residents
in these areas (for more detail on the planning methodology outlined above, refer to
the Sustainable Community Planning Guide, dated June 2007; also available on the
municipal website: (www.nelsonmandelabay.gov.za).
4.4 THE BUILT ENVIRONMENT PERFORMANCE PLAN (BEPP)
The development of a Built Environment Performance Plan (BEPP) is a requirement
of the Division of Revenue Act (DoRA) in respect of the various infrastructure grants
related to the built environment of metropolitan municipalities. It is submitted to
National Treasury in order to, inter alia, access the following conditional grants:
• Integrated City Development Grant (ICDG)
• Urban Settlements Development Grant (USDG)
• Human Settlements Development Grant (HSDG)
• Public Transport Infrastructure Grant (PTIG)
• Neighbourhood Partnership Development Grant (NDPG)
• Integrated National Electrification Grant (INEP)
The BEPP aims to demonstrate the use of these grants for the purpose of spatial
restructuring through targeting capital expenditure in areas that will maximise the
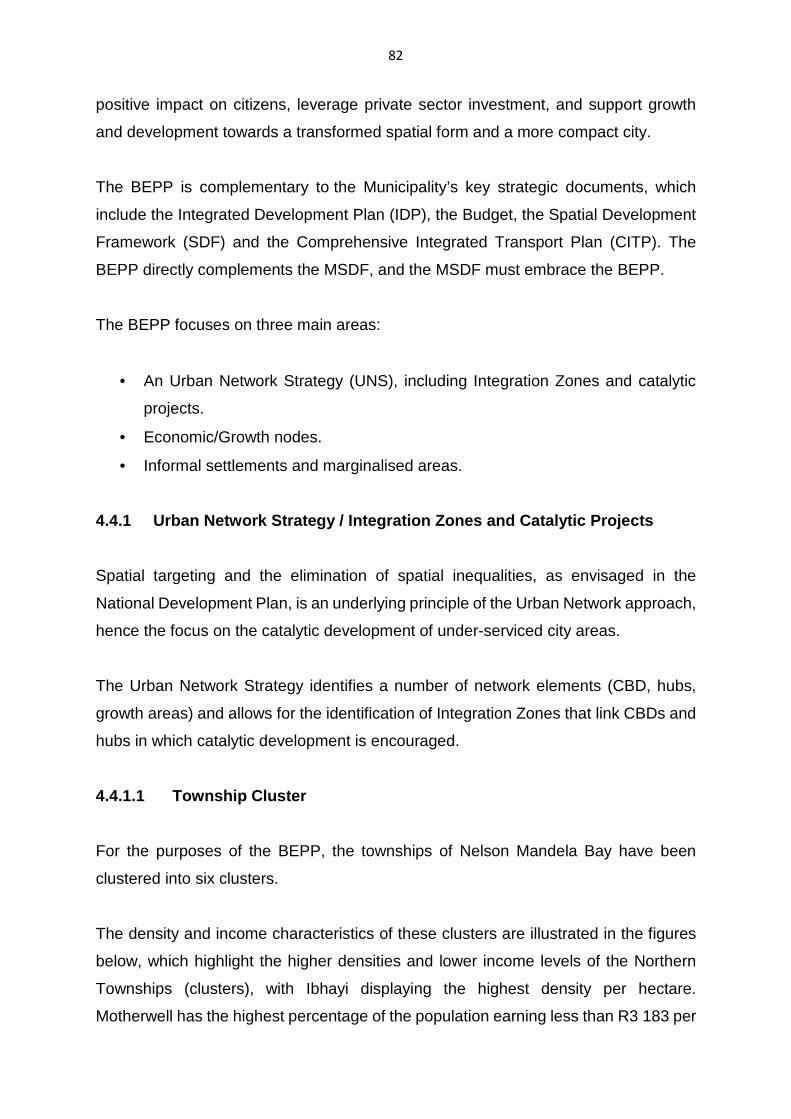
82
positive impact on citizens, leverage private sector investment, and support growth
and development towards a transformed spatial form and a more compact city.
The BEPP is complementary to the Municipality’s key strategic documents, which
include the Integrated Development Plan (IDP), the Budget, the Spatial Development
Framework (SDF) and the Comprehensive Integrated Transport Plan (CITP). The
BEPP directly complements the MSDF, and the MSDF must embrace the BEPP.
The BEPP focuses on three main areas:
• An Urban Network Strategy (UNS), including Integration Zones and catalytic
projects.
• Economic/Growth nodes.
• Informal settlements and marginalised areas.
4.4.1 Urban Network Strategy / Integration Zones an d Catalytic Projects
Spatial targeting and the elimination of spatial inequalities, as envisaged in the
National Development Plan, is an underlying principle of the Urban Network approach,
hence the focus on the catalytic development of under-serviced city areas.
The Urban Network Strategy identifies a number of network elements (CBD, hubs,
growth areas) and allows for the identification of Integration Zones that link CBDs and
hubs in which catalytic development is encouraged.
4.4.1.1 Township Cluster
For the purposes of the BEPP, the townships of Nelson Mandela Bay have been
clustered into six clusters.
The density and income characteristics of these clusters are illustrated in the figures
below, which highlight the higher densities and lower income levels of the Northern
Townships (clusters), with Ibhayi displaying the highest density per hectare.
Motherwell has the highest percentage of the population earning less than R3 183 per
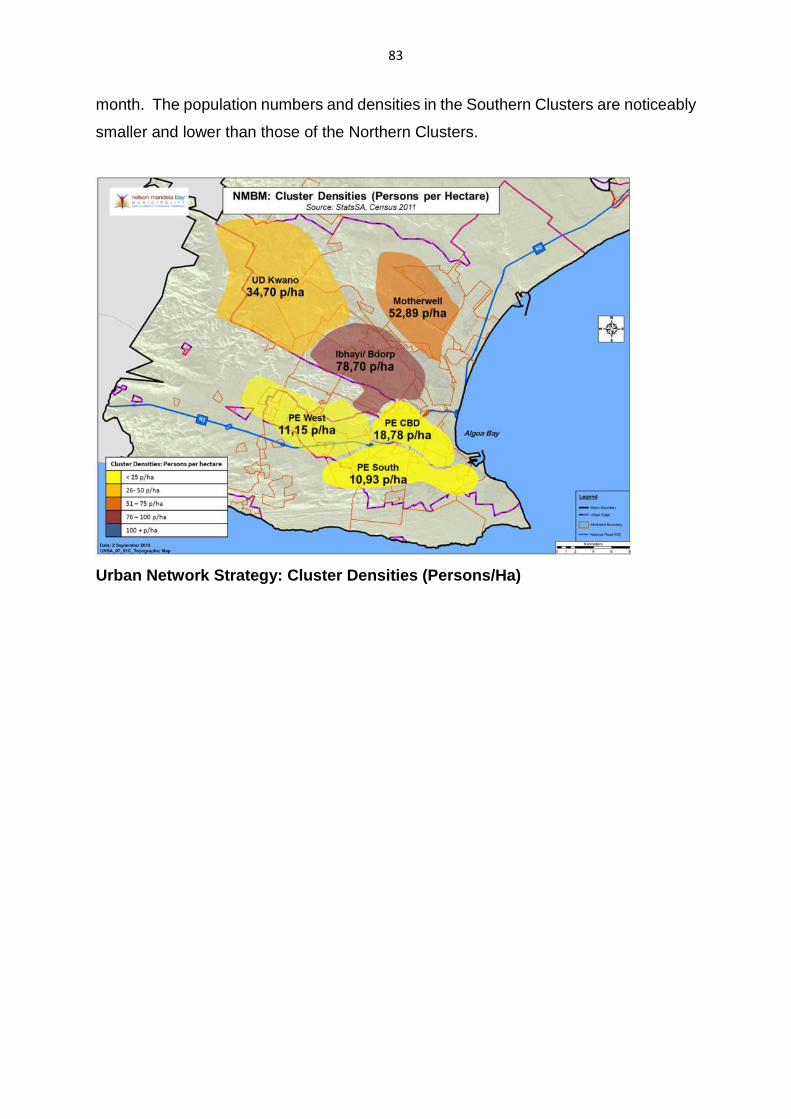
83
month. The population numbers and densities in the Southern Clusters are noticeably
smaller and lower than those of the Northern Clusters.
Urban Network Strategy: Cluster Densities (Persons/ Ha)
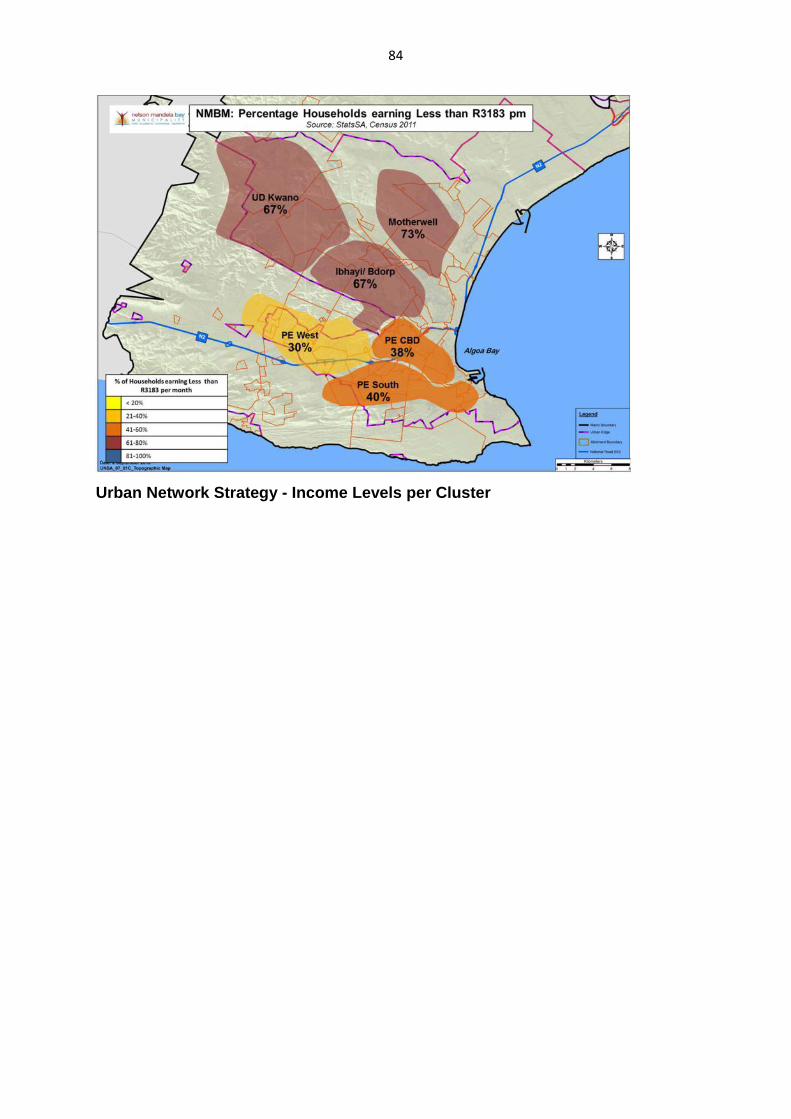
84
Urban Network Strategy - Income Levels per Cluster
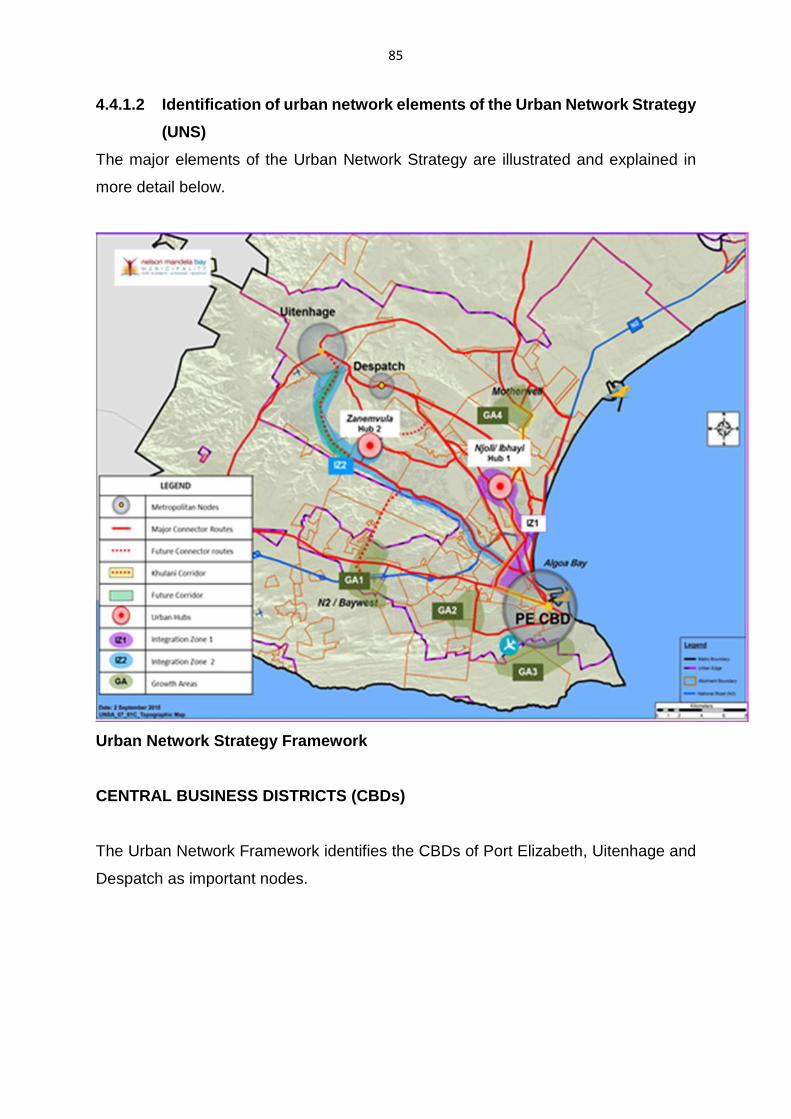
85
4.4.1.2 Identification of urban network elements of the Urban Network Strategy
(UNS)
The major elements of the Urban Network Strategy are illustrated and explained in
more detail below.
Urban Network Strategy Framework
CENTRAL BUSINESS DISTRICTS (CBDs)
The Urban Network Framework identifies the CBDs of Port Elizabeth, Uitenhage and
Despatch as important nodes.
86
PRIMARY NETWORK / TRANSPORT LINKS
MAJOR ARTERIES
The primary transport network includes three of the five major transport arteries, being
Harrower / Stanford Road, Provincial Route R75 and the Khulani Corridor.
Other primary arteries are Old Cape Road (R101), Provincial Route R10, Heugh /
Buffelsfontein Road, the William Moffatt Expressway, and the N2.
ROAD NETWORK
Public transport serves the metropolitan area along the following existing and planned
routes:
• North-South linkage between the PE CBD and Motherwell via Ibhayi; along the
Khulani Corridor.
• North-West linkage between the PE CBD and Bloemendal / Bethelsdorp, along
Stanford Road.
• South-West linkage between the PE CBD and the Western Suburbs, via Old
Cape Road.
RAIL NETWORK
There is an existing passenger rail link between the PE CBD and Uitenhage.
There is an existing passenger rail link between the PE CBD and Motherwell /
Markman.
A passenger rail link between Port Elizabeth CBD and Motherwell via a proposed new
Motherwell Rail Corridor parallel to Tyhinira Street (Motherwell) is planned. There is
a long-term possible linkage between Coega and Uitenhage.
87
A narrow-gauge rail line exists between Humerail (Port Elizabeth) and Loerie.
OTHER ACTIVITY CORRIDORS
The Nelson Mandela Bay Urban Network further identifies other existing mixed use
activity corridors that are important. These are:
• Walmer Boulevard, Heugh Road and Buffelsfontein Road
• Walmer Main Road
• William Moffatt Expressway
• Cape Road
URBAN HUBS
PRIMARY URBAN HUBS
The Primary Hubs are:
• Port Elizabeth / Uitenhage / Despatch CBD
• Njoli / Ibhayi Hub
• Zanemvula (Chatty Jachtvlakte) Hub.
4.4.1.3 Integration Zones
Two integration zones are identified, linking the CBD and Primary Hubs. The
Integration Zones traverse the poorest parts of the city, where catalytic development
intervention is prioritised.
These Integration Zones are described below:
Integration Zone 1 Khulani / Njoli:
This Integration Zone includes the Khulani Corridor, as well as the Motherwell Node.
It links the Inner City area and the Njoli Hub and incorporates a portion of the Khulani
Corridor between Stanford Road and Njoli Square.
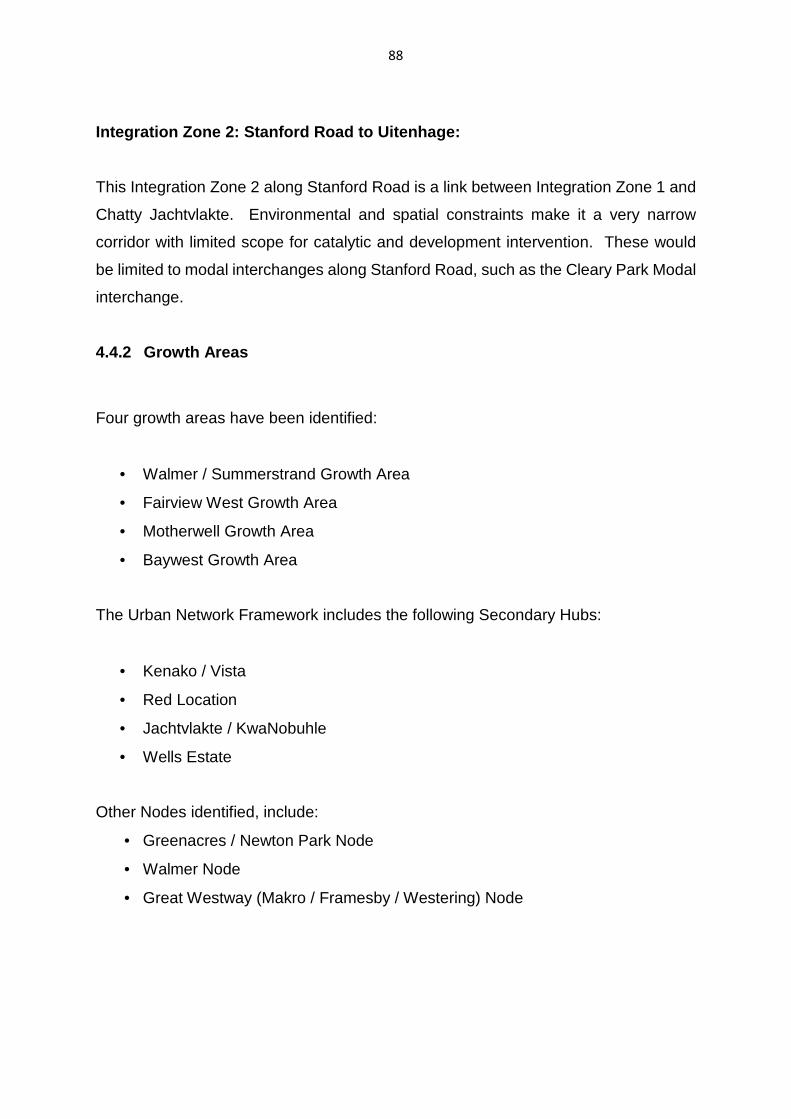
88
Integration Zone 2: Stanford Road to Uitenhage:
This Integration Zone 2 along Stanford Road is a link between Integration Zone 1 and
Chatty Jachtvlakte. Environmental and spatial constraints make it a very narrow
corridor with limited scope for catalytic and development intervention. These would
be limited to modal interchanges along Stanford Road, such as the Cleary Park Modal
interchange.
4.4.2 Growth Areas
Four growth areas have been identified:
• Walmer / Summerstrand Growth Area
• Fairview West Growth Area
• Motherwell Growth Area
• Baywest Growth Area
The Urban Network Framework includes the following Secondary Hubs:
• Kenako / Vista
• Red Location
• Jachtvlakte / KwaNobuhle
• Wells Estate
Other Nodes identified, include:
• Greenacres / Newton Park Node
• Walmer Node
• Great Westway (Makro / Framesby / Westering) Node
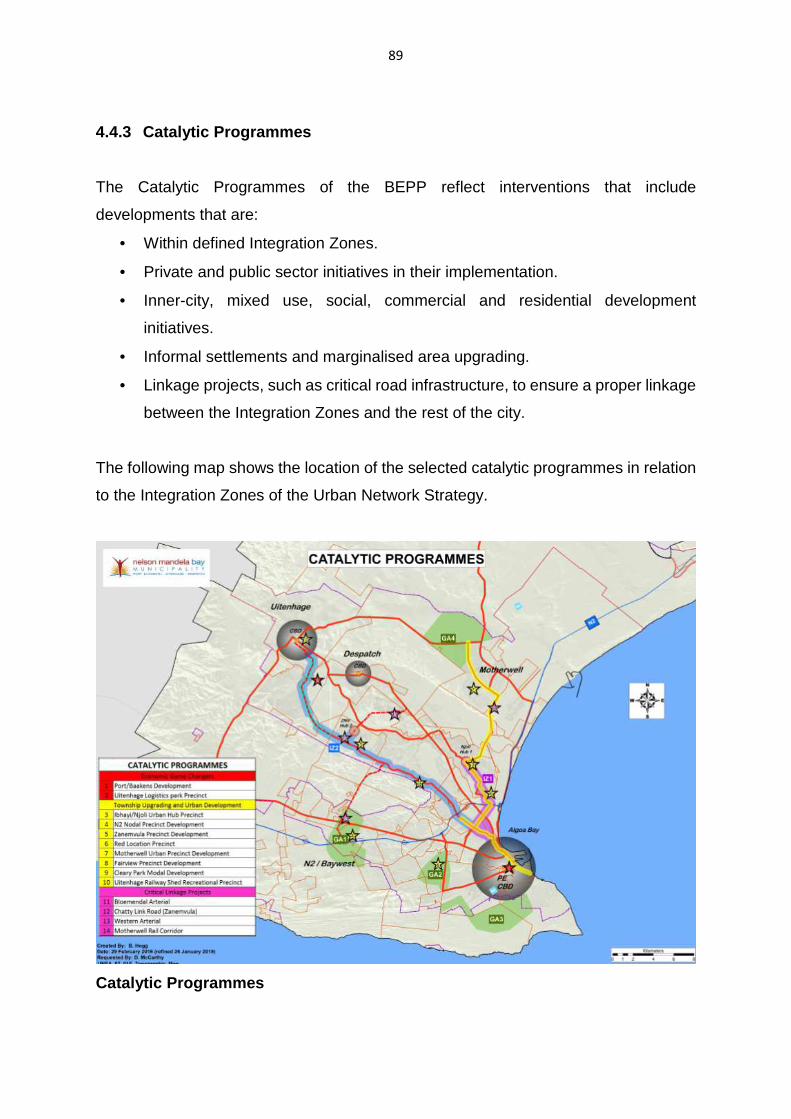
89
4.4.3 Catalytic Programmes
The Catalytic Programmes of the BEPP reflect interventions that include
developments that are:
• Within defined Integration Zones.
• Private and public sector initiatives in their implementation.
• Inner-city, mixed use, social, commercial and residential development
initiatives.
• Informal settlements and marginalised area upgrading.
• Linkage projects, such as critical road infrastructure, to ensure a proper linkage
between the Integration Zones and the rest of the city.
The following map shows the location of the selected catalytic programmes in relation
to the Integration Zones of the Urban Network Strategy.
Catalytic Programmes
90
It is the intention to move the catalytic projects as quickly as possible from the planning
to the implementation phases.
The NMBM is characterised by slow economic growth; therefore, it can be concluded
that positive change will be slow. In view of this, the City does not have the opportunity
for many economic and “game-changing” projects. It is important therefore to focus
efforts on a limited number of strategic projects that will have maximum impact. In
addition, because of the extreme poverty of the city, poor areas need to be targeted
for investment and development. The City is spatially divided, due to its geography
and historic patterns of development. Linkage projects to increase access must
therefore also be prioritised.
4.5 INFORMAL SETTLEMENTS AND MARGINALISED AREAS
4.5.1 Management and Upgrading of Informal Settleme nts
The Municipality has a dedicated programme for the elimination of informal
settlements, as contained in the Informal Settlements Upgrading Plan (NMBM: Human
Settlements Directorate, 2008). The Plan was developed in 2008 and included 81
informal settlements. Although 51 informal settlements now remain and are contained
in a matrix of in situ upgrading / destination areas, programmed over time, prioritised
and implemented according to the availability of funding.
In terms of municipal policy, the relocation of informal settlements happens as a last
resort. Where an informal settlement can be formalised in situ, this is done. Of the
105 originally identified informal settlements, 34 informal settlements were upgraded
in situ. In some instances, due to density, not everyone in the informal settlements
can be accommodated in situ. In these cases, the remaining residents are relocated
to locations situated as close-by as possible. Informal settlements in stressed areas,
such as under power lines, on tip-sites, in floodplains or other such areas, are
relocated to new areas. To accommodate these communities, 9 Greenfield sites have
been prepared and serviced. In order to accommodate the total need for new
development, 16 Greenfield sites have been programmed for completion in terms of
the approved Human Settlements Plan.
91
The Informal Settlements Upgrading Plan is part of the NMBM Human Settlements
Plan. The main focus of the Plan is the full technical and social investigation of all
the informal settlements within the Metro, as well as the categorisation of each
settlement in term of needs and vulnerability.
The prioritisation of projects is based on technical readiness, including town planning
layout approvals, general plan layout approvals, environmental approvals, completed
geotechnical investigations, and the availability of bulk infrastructure. Greenfield
projects are also prioritised as destination projects for relocation purposes.
4.5.2 Strategy for better located housing developme nt for all and specifically
the poor in relation to densification
Well located, pro-poor urban development strategies are well entrenched in the
Sustainable Community Planning Methodology of the NMBM. The methodology
focuses on actions and approaches to achieve higher levels of functional, social and
economic integration, simultaneously promoting and improving social, economic and
environmental sustainability.
The density of existing areas should be increased through infill development on vacant
land not required for other purposes. Corridor development along public transport and
other major transport routes will also increase densities in existing areas. Transit
Oriented Development (TOD) is a priority of the City.
To effectively increase density and thereby reduce urban sprawl, future densities
should average at least 30 to 40 units per hectare (gross) in new areas. Current
densities average 20 units per hectare.
It is predicted that more than 80% of the future residential demand in the Metro will be
for low-income housing. In view of the need for densification, it is this sector that will,
of necessity, be most affected.
92
The current practice of creating erven of 200 – 300 m² for low-income housing is
unsustainable from an economic and land utilisation point of view. Increased densities
will decrease land and servicing infrastructure costs and also enhance the viability of
public transport systems.
The proposals in the context of the Nelson Mandela Bay area are as follows:
• Strengthening the existing major bus routes and commuter routes in the Metro
by the addition of high-density development alongside (Transit Oriented
Development (TOD)).
• Intensifying development around existing public open spaces, where
appropriate. Intensification refers to the subdivision of the existing
appropriately located and designed Brownfield erven.
• Greenfield development of certain strategic sites which, although located on the
periphery of the City, could nevertheless be easily integrated into either the rail
or road transport system. Environmental considerations rather than cadastral
boundaries inform the perimeters of such external Greenfield sites.
4.6 CONCLUSION
The abovementioned documents together comprise the Spatial Strategy of the NMBM,
which has at its core the aim of sustainability and achieving a more equitable spatial
structure for the population of the Metro. The strategies mentioned above do not exist
in isolation of each other, but together enhance the prospects of achieving spatial
justice over time. Greater integration and alignment of the strategic spatial plans will
be achieved in this IDP focus period.
93
CHAPTER 5: DELIVERY APPROACH
5.1 Corporate Services
The Corporate Services Directorate is the primary custodian of all human resources
policies and procedures within the institution.
The Directorate is responsible for the following:
• The implementation of an integrated Microsoft ICT platform and ensuring
proper ICT governance within the Municipality.
• The implementation of cost-saving measures in telecommunications.
• The creation of a Wi-Fi enabled environment, centralising all ICT systems in the
NMBM, the upgrading of computer software and implementing approved ICT
governance plans, contributes to the enhancement of optimum performance
and service delivery.
• The establishment of a legally compliant organisational structure as well as
driving a performance driven culture by rolling out performance management
to all levels within the institution.
• The performance management process includes the cascading of the
Directorate’s performance plan down to Director level and beyond, as well as
quarterly performance evaluations being conducted within the Directorate.
• The development, implementation and monitoring of the staff establishment.
• The implementation of E-recruitment for all positions in TASK Grade 14 and
above as well as focussing on the internal promotion of staff by advertising
positions from Grades 1 – 11 only on internal circulars.
• The development, implementation and monitoring of the staff establishment.
• The development and implementation of human resources strategies and plans
for the Municipality.
• The provision of adequate and cost-effective office accommodation and
facilities with connectivity for staff and Councillors.
• The development and implementation of an integrated lease management
strategy and plan for internal leases.
94
• Proactive and sound Labour relations and labour engagement.
• The NMBM has a fully functional Local Labour Forum (LLF) in place and
quarterly meetings as well as Special LLF meetings are convened as and when
required; this is also a reflection of the improved relationship between the
employer and the labour unions.
• Labour relations and labour engagement.
• Through its Constituency Services Sub-directorate, it facilitates and co-
ordinates programmes and projects (in collaboration with Directorates and
strategic partners) that aim to mainstream Children, People with Disabilities,
Elderly, Women, Youth and Gender Equality development.
• Establishment and operationalization of Ward Committees.
• The Speaker’s office as well as Constituency Services provide a dual role
between the administration and the political offices
• Proper management of movable assets ensures that operational and
replacement costs are significantly reduced.
• The provision of corporate administration services (i.e. landlines and cellular
phones, secretariat and printing services and a centralised records
management system).
• Migration from paper agendas to paperless agenda for all Council
committees.
• Provision of communication initiatives and services to ensure that the public is
well informed of municipal programmes, services and events.
• Roll-out of work study services to improve efficiencies and to achieve value for
money.
• Continually reviewing policies relevant to Corporate Services as well as the
development of Standard Operating Procedures (SOPs) relevant for the
implementation of the said policies.
• Skills development programmes are provided to unemployed job seekers as
well as to officials employed by the NMBM as part of providing both internal and
external skills development.
• Scarce Skills and Critical Skills are considered when recruitment processes are
being conducted.
95
5.2 Chief Operating Officer
The Office is responsible for ensuring a more responsive, accountable, transparent
and compliant institution, with the focus on enhancing service delivery. In this regard,
it manages the integrated planning processes of the Municipality and ensures that the
focus remains on customers and that they are continuously engaged in planning,
implementation and monitoring and review processes.
The Office of the Chief Operating Officer ensures good corporate governance through
its sub-directorates, namely: Integrated Development Planning; External Relations,
Legal Services; Monitoring and Evaluation; Policy, Strategy and Research; Risk
Management; and Strategic Planning Coordination/Integrated City Development.
The following functions are performed within the Office of the Chief Operating Officer:
Strategic
• Manage the development, implementation and review of the Municipality’s
vision, long-term strategy and the Integrated Development Plan (IDP).
• Ensure that all institutional strategies are aligned to the IDP and long-term
strategy.
• Manage the development, implementation and review of corporate strategies
and policies.
• Develop and manage the implementation of institutional customer care
initiatives.
• Manage the development, implementation and review of the Municipality’s
Built Environment Performance Plan (BEPP).
• Provide for the prioritisation and coordination of planning, budgeting and
implementation efforts in line with strategic planning.
• Provide for the coordination of sectoral activities within the Metro.
• Monitor, evaluate and report to internal municipal structures, other spheres of
government and the public on the implementation of the Integrated
Development Plan, other strategies and the Budget.
96
• Manage the development and implementation of external relations between
the Municipality, stakeholders, other spheres of government and international
partners to achieve alignment with the Council’s priorities, as expressed in its
IDP.
• Identify potential and/or existing control weaknesses and assess the
adequacy of the control governance processes in the institution and
recommend remedial actions.
• Manage the development and implementation of the Corporate Risk
Management Strategy.
Operational
• Manage the development and implementation of the institutional Performance
Management System and directorate operational plans (Service Delivery and
Budget Implementation Plans).
• Co-ordinate institution-wide projects and programmes.
• Undertake institution-wide research to support the development and
implementation of institutional strategies.
• Ensure the design and implementation of operational improvement initiatives.
• Coordinate and report on the Urban Settlements Development Grant and the
Integrated City Development Grant.
• Develop and monitor the Council Resolutions Monitoring Matrix.
• Ensure that the Municipality complies with all applicable legal and regulatory
requirements.
• Provide institution-wide legal support to the Executive and Council, to ensure
informed decision-making.
5.3 Infrastructure, Engineering, Electricity and En ergy
5.3.1 Water and Sanitation
The responsible delivery of water and sanitation services to residents of Nelson
Mandela Bay is a key mandate of the institution, provided by way of managing the
97
supply of water, distribution of water, wastewater collection and treatment of
wastewater, which include the following:
• the storage of water in 10 dams,
• treatment of water at 8 water treatment works, including springs,
• bulk supply of treated water via 650 km of large diameter pipelines to the Metro
boundaries into distribution reservoirs,
• water distribution reticulation to all customers via 4 800 km water pipelines,
• collection of wastewater via 3 600 km pipework and pump stations,
• treatment of sewage at 8 wastewater treatment plants for both domestic and
industrial use,
• monitoring trade effluent discharges; and
• the relevant electrical and mechanical maintenance of plant/equipment.
The infrastructure described in general above is required to fulfill the key institutional
mandate to provide services to citizens and businesses located within the NMBM. In
order to achieve this, the infrastructure must be maintained, rehabilitated and
expanded, to keep up with the developmental needs of the NMBM. In doing so,
appropriate technologies are constantly researched and integrated into water and
sanitation delivery plans.
The provision of water and sanitation services, connectivity to services, the discharge
of sewage into sewers, as well as water conservation measures, are governed by
legislation.
Within the mandate of delivering water and sanitation services, three main areas need
special mention:
• The ongoing Water/Drought Disaster:
In January 2018, the average level of dams that supply water to the NMBM had
dropped by 25% (from 54% in January 2017). The NMBM was declared a
drought disaster area on 22 May 2017. No significant rain fell during the last 12
months, and none is predicted for the next six months. It is therefore critical that
the water consumption that is on average at 285 Ml/d be reduced to 250 Ml/d.
98
In order to reduce the water usage and ensure that the current available water
is stretched to the next rainy season the following is being carried out:
o Awareness to reduce water usage.
o Maximum use of the water from the Nooitgedagt Scheme.
o Drilling of boreholes to supplement available water.
o Reducing water pressure to limit water losses and water use.
o Desalination and / or water reuse installation.
• Water Losses:
Reducing water losses remains key in the provision of an effective and efficient
service. Losses contribute negatively to the drought situation and also affect
the income of the NMBM. In this regard, the NMBM has developed a Business
Plan that governs efforts to reduce water losses. In reducing losses, key
interventions include:
o Reticulation Leaks repairs
o ATTP leak repairs
o Pressure management
o Reservoir rehabilitation
o Meter replacement
o Pipe replacement
o Zoning and night flow analysis
• Bucket Eradication:
The NMBM has reduced the number of buckets being serviced in the NMBM
from 16 317 in June 2016 to 8 562 in November 2017. The Bucket Eradication
Programme, as approved by Council on 1 December 2016, is being
implemented and is scheduled to be completed by June 2018. Operationally
there might be some carry-over projects, especially in communities that are
located on private land.
5.3.2 Electricity and Energy
The electricity industry in South Africa has historically provided adequate financing to
municipalities, allowing them to fund their electricity operations and capital needs,
generally subsidising a large portion of their budgets.
99
In 2010, when the Eskom base tariff increased, a dramatic loss occurred in the net
profit derived through the sale of electricity. Since then, the profit on electricity has
been insufficient to cross-subsidise capital budgets for a growing city. Fortunately, the
City has a foundation of a good electricity network that is able to deliver quality
services.
What is important is the methodology applied to use the historically good networks,
staffing capacity and the additional opportunities that arise through our geographic
position, climate and new business opportunities in the alternative energy carriers and
renewable energy. It is intended to use this historic First World network as a basis to
become a destination of choice for the green economy. The emerging gas economy
that will arise in the Coega Industrial Development Zone of Nelson Mandela Bay is
also a potential future energy priority.
The NMBM's drive to develop a “Smart City” / fifth utility by introducing City-wide broad
band / internet services, both commercial and free, will allow the institution a potential
increased financial stream.
A number of public-private partnerships, collaboration with local universities, close
liaison with National Treasury and new service delivery methods will ensure that the
City remains a leader in the field of energy and stays abreast of best practices.
5.3.3 Fleet Management
Fleet Management is an enabling internal division that provides vehicles and/or plant
to all directorates across the Municipality. The Municipality intends to take a more
active role in the Electric Vehicle Infrastructure Alliance, with the view of greening a
section of the Municipality’s fleet by the year 2020.
The Nelson Mandela Bay Municipality’s Fleet Management Services is recognised as
a benchmark for good practice. The Sub-Directorate is visited annually by a number
of municipalities and Government Departments in order to study how the function is
performed in Nelson Mandela Bay.
100
5.3.4 Roads and Transport
Nelson Mandela Bay is traversed by 4 397 km of roads (3 126 km municipal,
1 018 km provincial and 253 km managed by the South African National Roads Agency
Limited (SANRAL). A robust, high functioning road network, as well as a well-
capacitated, maintained and comprehensive stormwater network, which the
Municipality is mandated to provide, is vital in ensuring optimal mobility for residents.
The Municipality is also mandated and committed to provide Metro commuters with a
safe, accessible, reliable and affordable public transport / commuter system.
In the above regard, the Municipality is committed to maintaining existing roads,
stormwater and transport infrastructure, as well as developing new infrastructure that
will add value to the Metro and its residents.
The institution continuously identifies and evaluates road safety risks, and addresses
these through the installation of traffic calming measures (traffic circles, speed humps
and traffic lights). To ensure safety on our roads and to protect residents’ vehicles,
the Municipality has prioritised the fixing of potholes, in addition to improving the
visibility of directional signs and improving public awareness of high accident zones.
The institution continues to develop and advance capacity for an effective IPTS,
including the roll-out of IPTS specific stations and shelters on route networks, and the
procurement of buses for IPTS operations.
5.3.5 Scientific Services
The Municipality must ensure that the residents of Nelson Mandela Bay are provided
with potable water and live in a clean and uncontaminated environment. Towards this
end, the Scientific Services Laboratory provides analytical services to NMBM
directorates and external industrial customers. The accurate and efficient analysis of
the samples by the Scientific Services Laboratory is a pre-requisite for the effective
monitoring of the required parameters by the NMBM Public Health Directorate, as well
as other NMBM directorates, enabling them to ensure a safe environment for local
communities.
101
The following criteria are monitored:
• Quality of potable water supply against the national specification;
• Quality of sewage effluent against the national specification;
• Quality of industrial effluent discharged into the municipal sewerage
system and water-courses;
• Compliance with public health standards (e.g. public food preparation);
• Quality of recreational water at recreation venues, for example beaches
and rivers.
The monitoring of the above in terms of compliance with national legislation and
NMBM By-laws supports the institution’s mandate to protect the environment and the
health of residents; also through ensuring compliance by local businesses and
manufacturers with environmental and NMBM licensing provisions. In addition, it
protects the NMBM against possible liability for non-compliance with required
standards.
The Scientific Services Division has regular interaction with the South African
National Accreditation System’s (SANAS) Management, other local authorities and
government departments with regard to the analytical methods and approaches
being adopted.
5.4 Human Settlements
Housing is a fundamental need and basic human right of the residents of Nelson
Mandela Bay.
The Constitution of South Africa Act 108 of 1996 and the Bill of Rights contained
therein, affirm the democratic values of human dignity, equality and freedom for all
citizens. This informs the work of the Municipality in human settlements provision,
while it must also give effect to the following associated rights:
102
• Equality
• Human dignity
• Freedom and security
• Privacy
• Freedom of movement and residence
• Property
• Environment
• Healthcare, food, water and security
• Access to information
• Administrative justice
The City’s mandate in respect of human settlements is derived from the National
Housing Act 107 of 1997, which provides for “the establishment and maintenance of
habitable, stable and sustainable public and private residential environments, to
ensure viable households and communities in areas allowing convenient access to
economic opportunities, and to health, educational and social amenities in which all
citizens and permanent residents of the Republic will, on a progressive basis have
access to permanent residential structures with secure tenure, ensuring internal and
external privacy, and providing adequate protection against the elements, potable
water, adequate sanitary facilities and domestic energy supply”.
The delivery of housing in Nelson Mandela Bay provides an opportunity to transform
the face, shape and form of the City and its settlements, reduce the effects of
entrenched segregation and inequality, and provide rights to those citizens for whom
these rights are not yet a reality.
The Municipality has failed to adequately respond to this opportunity, due to a variety
of challenges:
103
• A housing market in which poor households cannot participate.
• An on-going housing affordability problem across various sub-markets,
particularly the gap market.
• Weak spatial planning and governance capabilities.
• The high cost of well-located land for development, driving human settlements
to the peripheral areas.
• The inability to adequately respond to the diverse needs of low-middle income
households.
• The absence of a range of typologies and tenure types to support the needs of
poor households.
• The limited success of social housing to provide rental accommodation at scale.
• The escalating cost of development for government, resulting in a reduced
number of housing units delivered (National Department of Human Settlements
Strategic Plan, 2015-2020).
Notwithstanding the legislative and policy obligations that influence the activities of the
institution in providing human settlements, in order to be effective and deliver projects
and programmes that are sustainable and integrated, the following aspects need to be
addressed:
• Access to adequate accommodation that is suitable, relevant, appropriately
located, affordable and fiscally sustainable.
• Access to basic services such as water, sanitation, refuses removal and
electricity.
• Security of tenure, irrespective of ownership or rental, formal or informal
structures.
• Access to social services and economic opportunities within a reasonable
distance.
In addressing the above aspects, a multi-disciplinary and collaborative approach with
all relevant internal and external sectors is required. Alignment and integration
between municipal directorates and other government departments is critical to the
success and sustainability of human settlements interventions.
104
It needs to be recognised that the Provincial Department of Human Settlements is
responsible for the allocation of funding for housing development in the Nelson
Mandela Bay area. This influences what can be achieved by the Municipality.
The key stakeholder group of the Municipality in providing human settlements is the
most vulnerable, poverty-stricken and desperate citizens of society. Therefore, a
priority area is to ensure the delivery of services to informal settlements and backyard
shacks.
The reality that faces the Municipality in providing adequate housing is that not every
citizen in need of a formal home, in a sustainable and integrated human settlement,
will receive one in the short or even medium term. To mitigate this, the approach
adopted to dealing with informal settlements is to focus on upgrading, de-densification
and in situ development.
In addition, not every citizen is in need of a subsidised house. There are those who
can benefit from other national housing or private initiatives, such as social housing
and the Finance Linked Individual Subsidy Program (FLISP). The role of the
Municipality is therefore to match citizens in need of homes to the appropriate
available housing instruments, in collaboration with other role-players.
The NMBM Human Settlements Directorate is staffed not only with technical staff, but
also project management and community development staff. These staff members
are crucial to the success of delivery and are the bridge between the Municipality and
local communities.
An important aspect in the provision of human settlements is the resolution of
community conflicts, disputes and civil disturbances. The relocation of communities
from emergency areas or after land invasions, or any highly emotive situations,
requires particular facilitation, consensus building, conflict resolution and problem-
solving skills. As the Human Settlements Directorate of the Municipality deals with the
most vulnerable citizens, it is critically important to ensure the appropriateness of its
approach to all aspects of human settlements delivery.

105
In addition to the above, the Human Settlements Directorate inter alia performs the
following functions:
• Land survey
• Building control
• Land use management and spatial planning
• Development and support for human settlements delivery
• Property and planning administration
• Housing consumer education
5.5 Public Health
The purpose of the Public Health Directorate is to improve the health and quality of life
of people and the environment through key strategic interventions, such as the
prevention and treatment of pollution and diseases, and natural environment
protection.
The Public Health Directorate is committed, through a process of community
involvement, to rendering competitive services through developmental programmes
to improve the quality of life of people within the Municipality by creating and
maintaining a healthy and attractive environment.
Of extreme importance to the implementation of this mission are the legislative
prescripts that provide the strategic placement and functioning of the Public Health
Directorate to deliver efficient services to the people of this Municipality.
The Public Health Directorate’s functions inter alia include the following:
• Employee wellness.
• Implementation of the Occupational Health and Safety Act.
• Support of the Municipal Pound.
106
• Planning and management of the Metropolitan Open Space System
(MOSS) and parks.
• Waste management.
• Planning and management of cemeteries.
• Pollution monitoring and control.
• Mainstreaming of HIV/AIDS in municipal projects and programmes.
5.6 Economic Development, Tourism and Agriculture ( EDTA)
The Nelson Mandela Bay Municipality is emerging as a city of rising opportunity.
Nelson Mandela Bay is located along the Eastern Cape coastline and will therefore
promote and invest in the Oceans Economy. Linked to this exciting opportunity is the
opportunity to capitalise on the growth in the tourism sector in order that Nelson
Mandela Bay can become a destination of choice for domestic and international
visitors.
Nelson Mandela Bay is a major role-player in the economy of the Eastern Cape
Province and its role in the economy thus goes beyond its own municipal boundaries.
Like many other urban areas of South Africa, Nelson Mandela Bay is challenged by
extreme socio-economic disparity and poverty among large sections of the population.
Against this backdrop, the NMBM is, like other South African local governments, faced
with the challenge of ensuring that the lives of people in local communities are
substantially improved; and this objective can only be achieved through inclusive
economic growth and development.
This means that the Municipality must achieve the goals of economic growth,
alleviation of poverty, as well as the general improvement of the quality of life of the
people of Nelson Mandela Bay; and it is therefore important that Local Economic
Development (LED) is implemented in such a way that it can achieve inclusive growth
in order to redress the socio-economic imbalances in the Nelson Mandela Bay region.
107
In this regard it is important that the Municipality facilitates the growth and
diversification of the local economy through the attraction of new investments, skills
development and the facilitation of an enabling environment for small business growth
and job creation. In order to achieve this objective, the Municipality is committed to
employment opportunities through the Expanded Public Works Programme (EPWP),
strategic partnerships that enable empowerment through economic development and
targeted industry support and cluster development. Furthermore, the Municipality has
a responsibility to support the development of small businesses and emerging
enterprises through incubation, training and development.
Support for the agricultural sector is also important so as to stimulate the local value
chain of suppliers and the agro-processing industry. Creating an enabling
environment to do business in Nelson Mandela Bay is a major focus area: by working
together with other departments, cutting red tape and improving administrative
efficiencies, Nelson Mandela Bay can become a globally competitive city.
The successful implementation of the Local Economic Development Strategy remains
crucial to addressing the challenges of poverty and unemployment in Nelson Mandela
Bay. The potential of LED to empower local citizens has gained popularity in many
countries and cities. It is therefore vital that the City adopts and implements an
appropriate LED approach that will grow the economy and also reduce poverty and
unemployment.
After having conducted a thorough assessment of the state of the economy in the
region and the challenges faced, several key lessons have been learnt. These include,
but are not limited to, the approach in implementing LED projects, infrastructure
development, and trade and investment facilitation and promotion. Further to the
assessment done, the Municipality has comprehensively consulted with economic
sectors to get inputs on how to best tackle the challenges faced in growing the
economy.
The inputs from the economic sector sessions have provided critical direction for the
growth and development of the Metro’s economy. The plan is to ensure that LED helps
108
communities to realise lively, resilient and sustainable local economies in order to
improve the quality of life for all.
Key to the creation of an “inclusive economy” is the focus on previously neglected
areas such as the Uitenhage/Despatch area and various townships across the region.
The City has placed strong emphasis on these areas, and various programmes and
projects in this five-year plan are aimed at ensuring that economic development in
these areas is given a priority.
The Municipality, in partnership with other stakeholders, will establish SMME Support
Centres in various communities in order to ensure ease of access to SMME support
services. The City therefore aims to implement projects and strategies to strengthen
the city's economic inclusivity, protect vulnerable areas, and improve services and
facilities for residents, businesses and visitors.
The next five years will cover two broad strategic approaches to local economic
development, namely: a pro-market approach, based on business development, and
a pro-poor approach, focusing on poverty reduction. The NMBM realises that both
approaches are equally valid; each needs to be pursued to meet the needs of a wide
range of stakeholders; and it is important to note that local development cuts across
both strategic approaches of LED.
Nelson Mandela Bay holds great promise for accelerated growth, job creation, and
poverty reduction over the next five years. In the full understanding that other external
factors impact on the development and growth of local economies, the Municipality,
through this five-year Plan, is determined to use its resources, and partner with other
stakeholders, to develop the local economy, further reduce unemployment and tackle
poverty. The Municipality will ensure the implementation of this Plan through various
monitoring and evaluation processes.
The ultimate goal is to create an environment that inspires the confidence of business
and communities and attracts job creating investments and initiatives, which will help
to reduce unemployment and provide people access to life-changing opportunities.

109
110
5.7 Sports, Recreation, Arts and Culture
The Municipality is committed to entrenching and further developing its reputation as
a preferred sports destination and a competent host for local, national and international
sporting events. Towards that end, it is vital that it upgrades, renews and augments
existing sport facilities. A crucial area is the proper management of existing facilities,
and, towards that end, the Municipality is establishing Facility Management
Committees at its sport facilities.
As a water sports mecca and tourism city, the Municipality has prioritised the
maintenance of recreational water quality standards at its three Blue Flag Beaches
(three local beaches – Humewood, King’s Beach and Hobie – snatched the coveted
Blue Flag status). The Blue Flag serves as an assurance to holiday-makers and
tourists that the relevant beach is world class and offers safe, well managed facilities.
The Municipality has also partnered with local swimming associations in presenting
swimming lessons to local school-children, to prevent drowning at municipal beaches.
As part of its operations, the Municipality regularly hosts a number of key tourist and
marketing events, such as the annual Splash Festival or National Pride Day
celebrations, and is committed to ensuring compliance with relevant legislation.
Parallel to its commitment to entrench and grow the Municipality’s reputation as a
competent host city for key provincial, national and international sporting and tourism
events, the Municipality has prioritised the development and promotion of local sports
talent and sports teams. Additionally, it is committed to develop the local arts, culture
and creative industries sector, given its potential as a tool for social cohesion and
nation building.
In order to promote its Destination City goal, the Municipality is committed to the
maintenance and upgrading of major commercial sports infrastructure, the
development of sport and recreation precincts, and the upgrading of leisure,
recreational and beach facilities, as well as arts and cultural centres.
111
Annually, the city hosts or supports a number of flagship events, national and
international sports events, as well as arts and culture festivals, which serve to boost
the local economy and promote the city’s reputation as an important events
destination, such as the following:
• Standard Bank Ironman African Championship
• Ironman 70.3 World Championships in 2018
• Mandela Festival
• Summer Season Festival
• Exterra Triathlon
• Ebubeleni Festival
• EP Athletics
• Northern Arts Festival
• Splash Festival
• Heritage Week
These events are often realised through partnerships with local institutions in the
private sector, sector stakeholders and NGOs. Examples are the aquatic, swimming
and sports programmes that the Municipality hosts at local schools. As is evidenced
by the number of arts and cultural events annually hosted or supported by the
Municipality, the institution has prioritised the development of the local Arts, Culture
and Creative Industries Sector, recognising its enormous potential for realising
economic growth and development. A valuable new addition in the array of tourism
attractions has been the NMBM Heritage Route, which has been prioritised for further
development.
Its expanse of golden beaches is the prime tourist attraction of the City, which
necessitates focus on the beach safety of holidaymakers and visitors. In this regard,
the Municipality is committed to establishing and maintaining effective and well-
supported partnerships with local lifesaving organisations.
112
The City has a rich and diverse heritage and the Municipality has prioritised the
commemoration and celebration of this heritage through programmes that promote
redress and foster social cohesion.
The Municipality believes that instilling a culture of reading among residents and
students is a vital prerequisite to transforming them into readers - essential to
unlocking the doors to education and learning in the NMBM and promoting an informed
public.
Municipal libraries play a vital role in our information-driven society and are extensively
used by residents; both for academic research and recreational reading purposes. The
upgrading and restoration of library facilities is an ongoing institutional commitment.
The Municipality is also mandated to promote the health and well-being of residents,
and in this regard new sport and recreation facilities are being provided, while existing
sport facilities are upgraded or rehabilitated.
The Municipality recognises that it is important to ensure the sustainable provision of
water to its sports facilities and embraces research as the vital underpinning of the
sustainable provision of services.
5.8 Safety and Security
The safety and security of local communities, residents, visitors, tourists and holiday-
makers is a key focus area of the Municipality. To make the city safer, the institution
provides a broad spectrum of services.
The emergency services that are provided to ensure the safety of all communities and
visitors include disaster management, fire and emergency and security services, as
well as traffic and licensing services.
Collaboration between all internal and external stakeholders, particularly law
enforcement agencies, is maintained to identify potential threats and reduce or
eliminate risks.
113
The functions of a Municipal Police Service are provided for in terms of legislation and
include the execution of traffic policing, the policing of municipal by-laws and
regulations, as well as the prevention of crime.
A central communication centre provides for the effective and efficient coordination of
disaster management services throughout the Municipality. Planning and training in
disaster management operations are conducted on an on-going basis. The
development of an integrated disaster management strategy and plan will address
public awareness and the establishment of partnerships and satellite offices, as well
as ensure that disaster risk assessment objectives are met.
The Municipality’s Fire and Emergency Services provides immediate and effective
response to incidents. The implementation of an integrated Fire Safety Strategy will
address aspects such as preventing the outbreak or spread of fires, fighting or
extinguishing fires, the protection of life or property against fires and threatening
danger, and the rescue of life or property from fire or other dangers.
Security Services provides for and coordinates all security related requirements in the
Municipality. This includes the supervision of all municipal sites guarded by contract
security services, armed escorts, security surveys and recommendations to
directorates to prevent loss or potential loss, close protection services for senior
officials, as well as integrated firearm management. All cases related to Council
losses, theft, damage and/or misuse of assets are investigated, and outcomes are
reported.
Traffic and Licensing Services promotes road safety through integrated and
coordinated law enforcement initiatives. The services provided, include licencing,
training of staff, municipal court services and the execution of traffic warrants.
114
Two key Disaster Management related reports are available on the municipal website:
• Disaster Risk Assessment Report
http://www.nelsonmandelabay.gov.za/datarepository/documents/qqGwV_DM
%20Plan.pdf
• Disaster Management Plan
http://www.nelsonmandelabay.gov.za/Assets/leve_2_disaster_management_p
lan_2010.pdf
115
CHAPTER 6: DELIVERY PLAN
The Municipality’s Delivery Plan is informed by a new, delivery-focused political vision
that has already brought change to Nelson Mandela Bay.
In order to ensure absolute alignment between the Budget, IDP and Strategic
Objectives, the directorates have prepared comprehensive situational analyses, while
the Mayoral Committee conducted extensive stakeholder engagements with residents
and economic clusters.
Expressed in the form of six pillars and nineteen strategic objectives, this Chapter
depicts the practical implementation of this political vision, realised and measured
through a number of strategic outcome-, output- and impact-based key performance
indicators.
The City Manager, as the Metro’s Accounting Officer, will oversee the performance
management process of translating this IDP into an activity-based Service Delivery
and Budget Implementation Plan (SDBIP), for which he is responsible.
The successful translation of the political vision into administrative action will result in
a Nelson Mandela Bay that is an iconic, friendly, ocean city driven by innovation,
service excellence and economic development – a destination of choice.
THE WELL RUN CITY
This pillar pertains to all initiatives that cater for meeting the standard operational
expectations of the Municipality, including initiatives that address the Human
Resources component, systems, accountable governance and the financial viability of
116
the institution. In The Well Run City, monitoring and evaluation informs decision
making and provides information for accountability and performance improvement.
A culture of excellence among staff and institutional systems and processes is strived
for. In the Well Run Nelson Mandela Bay, all basic services are delivered to
expectation and the City sets the benchmark for transparent governance and financial
viability, and the eradication of corruption.
Objectives:
• Transforming the institutional systems, processes and organisational structure
to one of high performance in order to effectively deliver basic services to a
well-run city.
• Changing the way we think about and approach our work and ensuring that the
Municipality is staffed with the right people for the right jobs with the right
attitudes.
• Ensuring financial prudence and transparent governance and working towards
eradicating corruption.
Key directorates that play a role in realising these strategic objectives:
Corporate Services –
Corporate Services is the primary custodian of all human resources policies and
procedures within the institution. This Directorate will be responsible for the
implementation of an integrated ICT platform, which will include a Wi-Fi enabled
environment, and for driving a performance driven culture. More importantly, the
Directorate will ensure the provision of communication initiatives and services to
ensure that the public is well informed of municipal programmes, services and events.
This all speaks to creating a well-run administration.
117
Chief Operating Officer –
The Office of the Chief Operating Officer will ensure that all institutional strategies are
aligned to the IDP and long-term strategy, provide for the coordination of sectoral
activities within the Metro, identify potential and/or existing control weaknesses,
assess the adequacy of the control governance processes in the institution, and
recommend remedial actions. This will create an accountable and transparent
institution, which can place its focus on enhanced service delivery.
Water, Sanitation, Electricity and Energy, Fleet Management -
A key part in delivering a Well Run City is having an efficient water and sanitation
system, mandated by the Department of Water and Sanitation. The City will monitor
trade effluent discharges, and ensure that water distribution and reticulation and
wastewater conveyance are conducted at reservoirs and pump stations; this will be
constantly improved by integrating new and innovative technologies into water delivery
plans to ensure optimal and sustainable water delivery.
THE OPPORTUNITY CITY
The Opportunity City delivers on well-planned initiatives to enable and cultivate job
creation and economic opportunity, develop competitive advantage, and ensure
access to skills. The Opportunity City is competitively differentiated as a destination
city for business, tourism and investment. Strategic partnerships with the private and
non-profit sectors thrive. Opportunity City initiatives secure the development of a
diversity of sectors, which range from marine manufacturing, urban agriculture and
agri-processing, to the cultural and creative industries. Infrastructure led growth is
properly planned and invested in and effective service provision for roads, public
transport and mobility ensures universal access to the Opportunity City.
The Opportunity City ensures efficiency in municipal process so that development is
not hamstrung or hindered in any way. Planning processes, land use applications,
118
connection to utilities, issuing of rates clearance certificates and conducting
environmental impact studies need to be modernised, streamlined and fast-tracked.
Entrepreneurship is encouraged in an Opportunity City; the informal economy should
be supported and serviced in order to facilitate economic growth. Informal traders
should feel safe to conduct business in clean and well-defined public spaces where
by-laws are enforced and adhered to.
Nelson Mandela Bay, the Opportunity City, is a proudly iconic and global city that does
the legacy of Nelson Mandela proud.
Objectives:
• Growing and diversifying the local economy through the attraction of new
investment, skills development and facilitation of an enabling environment for
small business growth and job creation.
• Facilitating and promoting infrastructure led growth, development and tourism.
• Executing existing and designing and implementing new projects that
competitively differentiate Nelson Mandela Bay as a destination city for
business, tourism and investment – including through strategic partnerships.
• Developing an effective integrated public transport system that promotes
access to opportunity through mobility.
Key directorates that play a role in realising these strategic objectives:
Economic Development, Tourism and Agriculture –
The City under this Directorate plans to ensure that Local Economic Development
helps communities to realise a lively, resilient and sustainable local economy in order
to improve the quality of life for all. This will be achieved by growing and diversifying
the local economy through the attraction of new investment, skills development and
the facilitation of an enabling environment for small business growth and job creation.
Government processes involved in investment and development will be made more
efficient, and the informal economy will be supported.
119
THE SAFE CITY
This pillar speaks to all initiatives that address safety and security. It also includes
those that create environmental safety, as well as safety for residents and tourists.
This pillar must also be aligned with the disaster management plans of the Metro.
In the Safe City, all communities, residents and visitors of Nelson Mandela Bay enjoy
the basic freedom of not only being safe, but of feeling safe. The Safe City’s Metro
Police are trusted, accessible, well-trained and suitably equipped, and protect the
communities they serve with pride. Fire and Emergency Services in the Safe City are
properly prepared to ensure that any disaster, natural or otherwise, is capably
addressed. In the Safe City, the need for the delivery of well-maintained street lights
to all communities is a top priority. In the Safe City, the Municipality partners with
communities to eradicate illegal connections - and with civil organisations to ensure
that residents and visitors enjoy access to adequately life-guarded public beaches and
pools.
Residents that fall victim to drug and substance abuse should be supported, and
awareness needs to be created around this societal challenge. Drug and substance
abuse leads to and is the cause of many related criminal activities that are addressed
in a Safe City.
In the Safe Nelson Mandela Bay, bylaws are fairly enforced and measures are set in
place to ensure that cattle are kept off roads at night. Safe working conditions are
ensured for all municipal employees.
120
Objectives:
• Delivering well-resourced and capacitated policing and emergency services in
order to ensure the safety of all communities and visitors.
• Providing infrastructure that improves the safety of communities and visitors.
• Improving the safety and security of Nelson Mandela Bay through community,
industry and civic organisation partnerships.
Key directorates that play a role in realising these strategic objectives:
Safety and Security –
In an effort to ensure the safety of all communities and visitors, this Directorate aims
to deliver well-resourced capacitated policing and emergency services, as well as
sound infrastructure. This shall be further enhanced through community, industry and
civil organisation partnerships. The fight against drug and substance abuse will be
prioritised and victims will be supported.
THE INCLUSIVE CITY
This pillar relates to initiatives that promote equality and social cohesion and that
enable informal means of mobility between communities. The objectives under this
pillar strive for the integrated access to and delivery of a single community city
(pedestrian bridges, social cohesion promoting events, etc.). Deliverables are
concerned with the promotion of redress, transformation and employment equity.
Projects such as those providing communal grazing land could also be considered
inclusive (from a cultural perspective).
Delivery to an Inclusive City means delivery that speaks to the maturity of our society
as a collective community, and celebrated in all its diversity: One City One Future.
The Inclusive Nelson Mandela Bay is a well-connected city. It delivers integrated
121
access to a single-community city. It has properly planned infrastructure and a built
environment that enables informal means of mobility between communities, including
pedestrian bridges and connective “corridor” routes.
In the Inclusive City, responsive governance is delivered through effective public
participation and the provision of communication channels that deliver the accessibility
of the Municipality to all residents. The Inclusive City is served by properly functioning
Ward Committees.
The Inclusive City proactively promotes redress and delivery on transformation
objectives. Productive relationships are cultivated with organised labour, ensuring that
all decisions are inclusively informed. Participatory governance is also reinforced in
the Inclusive City, through developmental municipal management systems and
processes, through which all employees are empowered to contribute to the
successful delivery of the IDP.
Many of our residents still live in underserviced parts of the City with no access to even
basic services – or access to rudimentary services only. In an Inclusive City, this
legacy of Apartheid is redressed and the previous government’s maladministration is
turned around on a systematic basis. Informal settlements need to be upgraded to
improve the delivery of basic services and therefore the quality of life of residents living
in those areas.
United in its diversity, the Inclusive City actively ensures that the cultural, traditional,
ancestral and struggle heritage of our communities is respected and appropriately
commemorated. In the Inclusive Nelson Mandela Bay, projects that pay homage to
our heritage, including the renaming of streets, are properly consulted and budgeted
for.
122
Objectives:
• Ensuring responsive governance through consistent public participation,
effectively functioning and supported Ward Committees, and the creation of an
environment in and systems through which participatory and responsive
governance can thrive.
• Spatial and built environment developments that promote integrated
neighbourhoods, inclusive communities and a well-connected Nelson Mandela
Bay.
• Delivering on transformation objectives, promoting redress and fostering social
cohesion.
Key directorates that play a role in realising these strategic objectives:
Human Settlements –
Integrated development is a key priority in creating an Inclusive City. Nelson Mandela
Bay still suffers from Apartheid-era spatial planning, and many communities are
therefore separated and secluded from the larger City. Innovative spatial development
and housing solutions will be utilised to address this challenge.
Roads and Transport –
An Inclusive City is well connected and offers adequate infrastructure and public
transport to residents. The continued development of the IPTS plays an important role
in improving connectivity and ensuring that people from different communities can
travel easily throughout the City. Well-maintained road networks create a more
inclusive and connected Nelson Mandela Bay.
123
THE CARING CITY
In the Caring City, equality is strived for through ensuring that all residents have access
to delivery that promotes their well-being. Access to affordable housing and the
provision of dignified housing is properly planned for to ensure maximum possible
delivery within the funding available. Dignified sanitation and waste management are
a reality for all households.
In the Caring Nelson Mandela Bay, indigent communities are adequately supported
and food security programmes and community gardens are fully operational. Social
services and social development programmes are prioritised. In ensuring the well-
being of residents, the Caring City delivers libraries and sports and recreational
facilities that are accessible to all communities. Through effective cleansing
programmes, greening initiatives and the provision of well-maintained public parks,
every resident is able to feel proud of the community he or she lives in.
In the Caring City, occupational health and wellness for all municipal employees is
ensured.
Through the delivery of Public Health services, cemeteries are well managed and
planned, and the proper management of the environment is practised.
Objectives:
• Providing for the social needs of communities and the empowerment of
vulnerable people through the provision of access to social services, social
development programmes and indigent support.
• Promoting the health and well-being of all communities through the spatially
equitable provision of social infrastructure.
• Providing effective general environmental and public health services.
124
• Providing dignified housing and sanitation and accelerating access to improved
services to indigent households in order to create safe and decent living
conditions for all residents.
Key directorates that play a role in realising these strategic objectives:
Human Settlements –
The City aims to upgrade informal settlements by providing housing opportunities to
qualifying residents. Appropriately located, affordable and fiscally sustainable housing
opportunities will be prioritised by the City. A back-yarder programme will also be
initiated, in terms of which basic services will be extended to not only formal houses,
but also to residents residing in backyard structures.
Sport, Recreation, Arts and Culture –
Although sport and recreation speaks to Nelson Mandela Bay’s attractiveness as a
preferred sport destination, this Directorate plays an important role in creating a Caring
City that offers quality facilities and events for residents to get involved in positive
recreational activities. Social services in the form of well-maintained public sport and
cultural facilities are crucial in creating a Caring City that looks after the well-being of
its residents.
Public Health –
Public health is an important aspect of a Caring City that leads to the improved quality
of life of residents. Community involvement is critical in delivering competitive primary
health care facilities and taking care of the environment.
125
THE FORWARD THINKING CITY
The Forward Thinking City is concerned with institutional innovation, support for
research and development, and plans for future sustainability. The Forward Thinking
City ensures multi-generational planning that promotes sustainable economic growth
through the optimal use and development of technology.
The Forward Thinking City strives for its environmental sustainability through proactive
planning, and the conservation of resources and the natural and built environment.
Objectives:
• Ensuring multi-generational planning that promotes sustainable economic
growth through research and development, innovation, and the optimal use and
development of technology.
• Developing an environmentally sustainable city through proactive planning and
the conservation of resources and the natural and built environment.
Key directorates that play a role in realising these strategic objectives:
Chief Operating Officer –
The Office of the Chief Operating Officer is tasked with the management and
implementation of long-term strategy in order to create an administration that focuses
on long-term development and success.
Economic Development, Tourism and Agriculture –
A longer-term view of economic development in Nelson Mandela Bay involves
facilitating the growth of industries that are labour absorptive and will change the
growth trajectory of the City substantially. The oceans economy, tourism and the close
126
proximity of the Coega Industrial Development Zone position Nelson Mandela Bay for
accelerated future economic growth.
The table below reflects the Key Performance Areas of this IDP as part of the
Performance Management System of the Municipality. It is usual to include only what
are recognised as strategic indicators at the level of the Integrated Development Plan.
Other indicators would be cascaded down to the Service Delivery and Budget
Implementation Plan (SDBIP) and Performance Agreements of Officials.
For the purposes of this IDP, however, some indicators have been included at this
level based on their strategic significance. These are:
Doing business in South Africa indicators: These have arisen as a result of the national
report that measures the competitiveness of cities in South Africa from time to time.
This indicator is important from a strategic perspective, as the Nelson Mandela Bay
Municipality is striving to be competitive.
Statistical indicators: These indicators are included to monitor strategic trends over
time. Once a trend has been established, performance indicators will be devised for
inclusion in subsequent IDPs.
It should be noted that in terms of the aforementioned indicators, the 2017/18 financial
year will be utilised to establish and verify reporting systems and determine accurate
baseline information to inform targets to be set for the outer years.
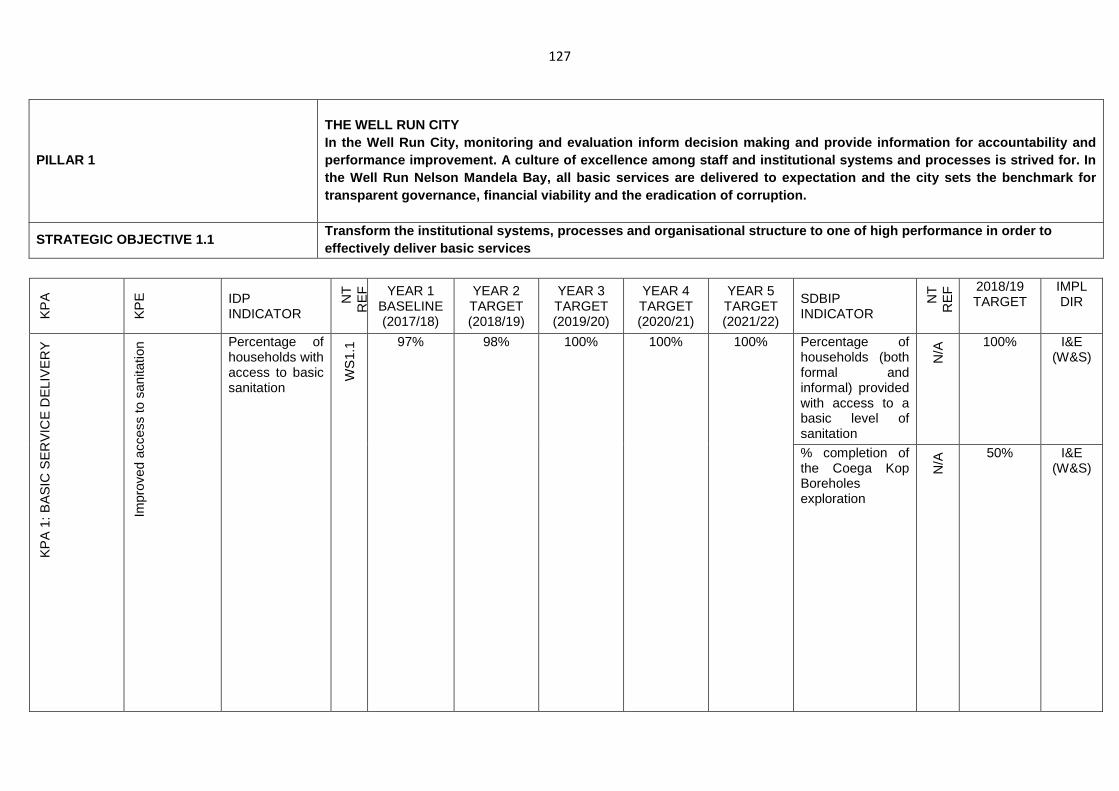
127
KP
A
KP
E
IDP INDICATOR
NT
R
EF
YEAR 1 BASELINE (2017/18)
YEAR 2 TARGET (2018/19)
YEAR 3 TARGET (2019/20)
YEAR 4 TARGET (2020/21)
YEAR 5 TARGET (2021/22)
SDBIP INDICATOR
NT
R
EF
2018/19 TARGET
IMPL DIR
KP
A 1
: BA
SIC
SE
RV
ICE
DE
LIV
ER
Y
Impr
oved
acc
ess
to s
anita
tion
Percentage of households with access to basic sanitation
WS
1.1 97% 98% 100% 100% 100% Percentage of
households (both formal and informal) provided with access to a basic level of sanitation
N/A
100% I&E (W&S)
% completion of the Coega Kop Boreholes exploration
N/A
50% I&E (W&S)
PILLAR 1
THE WELL RUN CITY In the Well Run City, monitoring and evaluation inf orm decision making and provide information for acc ountability and performance improvement. A culture of excellence am ong staff and institutional systems and processes i s strived for. In the Well Run Nelson Mandela Bay, all basic services are delivered to expectation and the city sets the benchmark for transparent governance, financial viability and the eradication of corruption.
STRATEGIC OBJECTIVE 1.1 Transform the institutional systems, processes and organisational structure to one of high performance in order to effectively deliver basic services
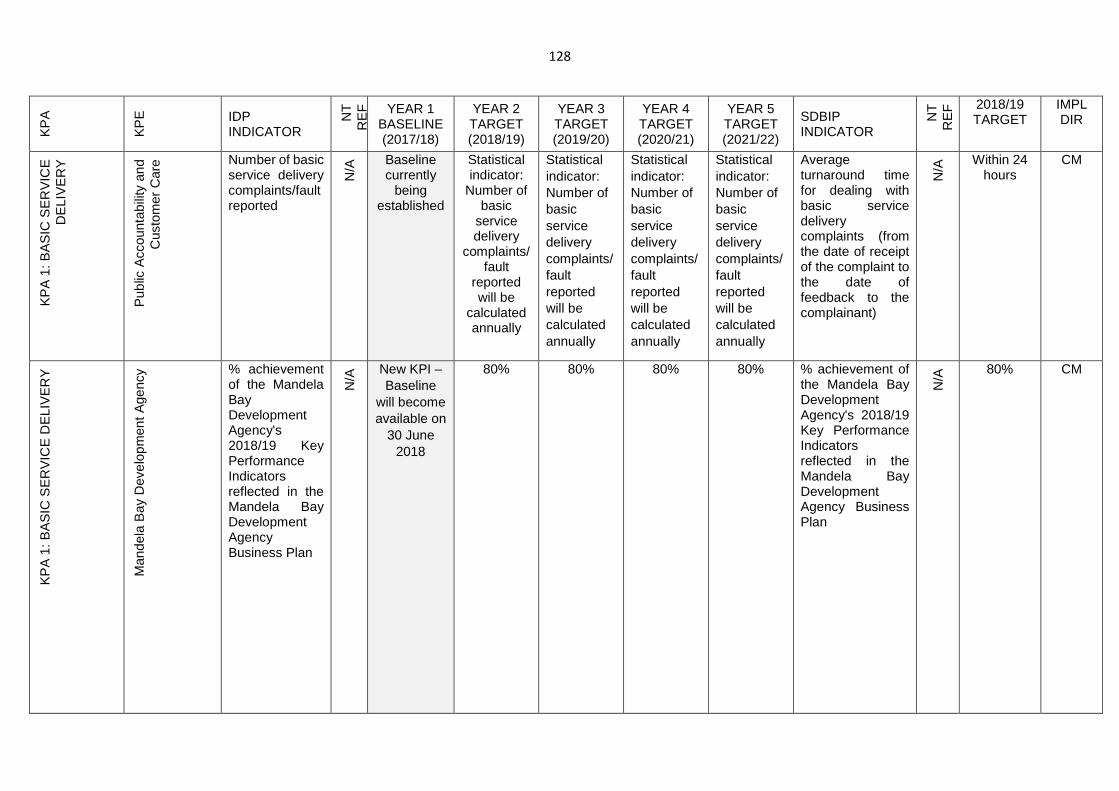
128
KP
A
KP
E
IDP INDICATOR
NT
R
EF
YEAR 1 BASELINE (2017/18)
YEAR 2 TARGET (2018/19)
YEAR 3 TARGET (2019/20)
YEAR 4 TARGET (2020/21)
YEAR 5 TARGET (2021/22)
SDBIP INDICATOR
NT
R
EF
2018/19 TARGET
IMPL DIR
KP
A 1
: BA
SIC
SE
RV
ICE
D
ELI
VE
RY
Pub
lic A
ccou
ntab
ility
and
C
usto
mer
Car
e Number of basic service delivery complaints/fault reported
N/A
Baseline currently
being established
Statistical indicator:
Number of basic
service delivery
complaints/fault
reported will be
calculated annually
Statistical indicator: Number of basic service delivery complaints/fault reported will be calculated annually
Statistical indicator: Number of basic service delivery complaints/fault reported will be calculated annually
Statistical indicator: Number of basic service delivery complaints/fault reported will be calculated annually
Average turnaround time for dealing with basic service delivery complaints (from the date of receipt of the complaint to the date of feedback to the complainant)
N/A
Within 24 hours
CM
KP
A 1
: BA
SIC
SE
RV
ICE
DE
LIV
ER
Y
Man
dela
Bay
Dev
elop
men
t Age
ncy
% achievement of the Mandela Bay Development Agency's 2018/19 Key Performance Indicators reflected in the Mandela Bay Development Agency Business Plan
N/A
New KPI – Baseline
will become available on
30 June 2018
80% 80% 80% 80% % achievement of the Mandela Bay Development Agency's 2018/19 Key Performance Indicators reflected in the Mandela Bay Development Agency Business Plan
N/A
80% CM
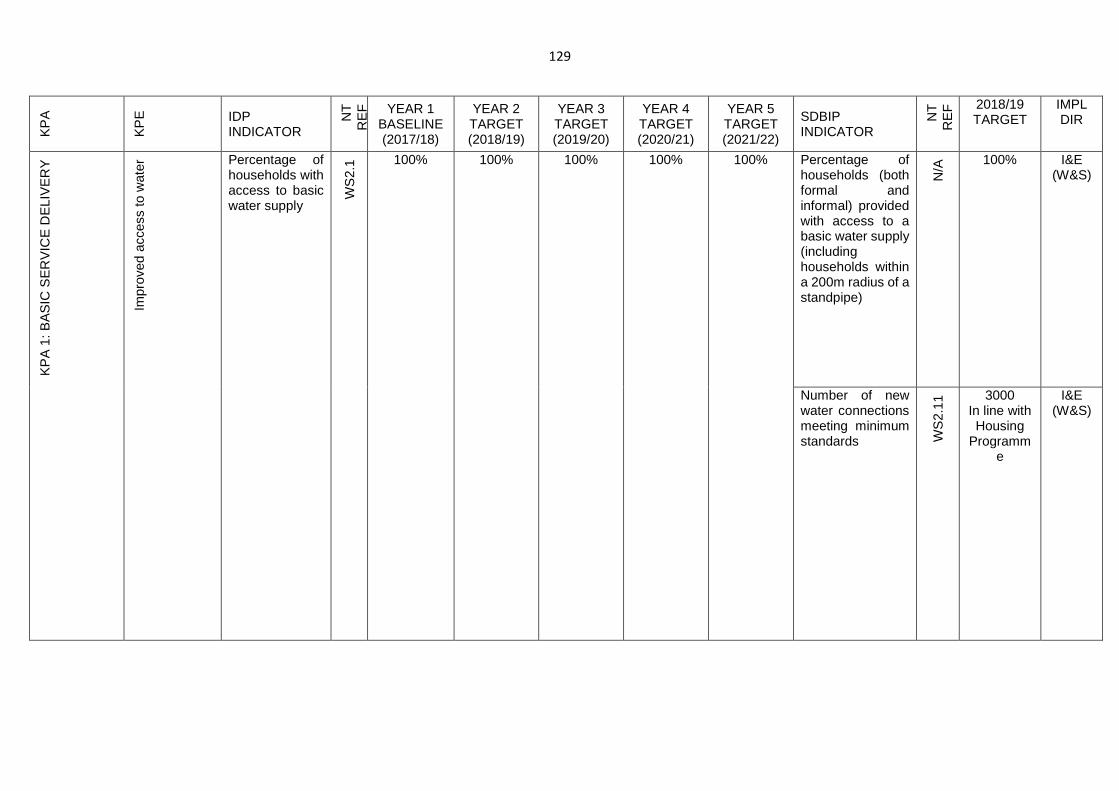
129
KP
A
KP
E
IDP INDICATOR
NT
R
EF
YEAR 1 BASELINE (2017/18)
YEAR 2 TARGET (2018/19)
YEAR 3 TARGET (2019/20)
YEAR 4 TARGET (2020/21)
YEAR 5 TARGET (2021/22)
SDBIP INDICATOR
NT
R
EF
2018/19 TARGET
IMPL DIR
KP
A 1
: BA
SIC
SE
RV
ICE
DE
LIV
ER
Y
Impr
oved
acc
ess
to w
ater
Percentage of households with access to basic water supply
WS
2.1 100% 100% 100% 100% 100% Percentage of
households (both formal and informal) provided with access to a basic water supply (including households within a 200m radius of a standpipe)
N/A
100% I&E (W&S)
Number of new water connections meeting minimum standards W
S2.
11 3000
In line with Housing
Programme
I&E (W&S)
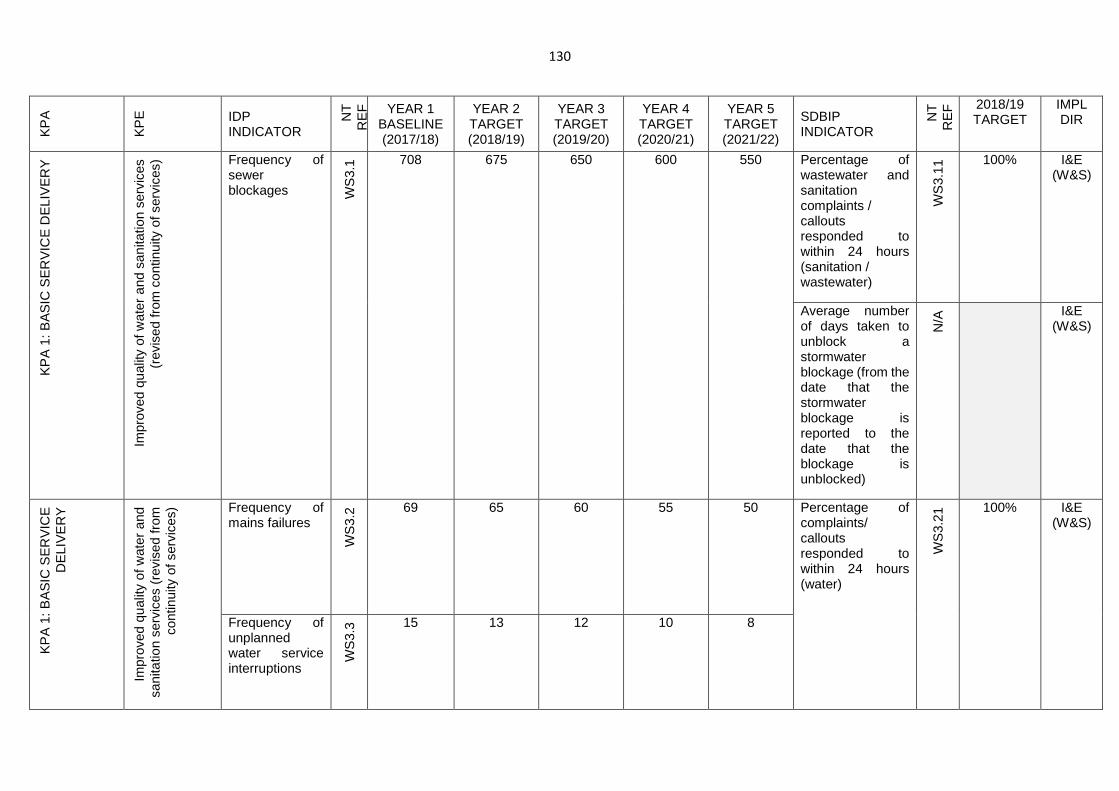
130
KP
A
KP
E
IDP INDICATOR
NT
R
EF
YEAR 1 BASELINE (2017/18)
YEAR 2 TARGET (2018/19)
YEAR 3 TARGET (2019/20)
YEAR 4 TARGET (2020/21)
YEAR 5 TARGET (2021/22)
SDBIP INDICATOR
NT
R
EF
2018/19 TARGET
IMPL DIR
KP
A 1
: BA
SIC
SE
RV
ICE
DE
LIV
ER
Y
Impr
oved
qua
lity
of w
ater
and
san
itatio
n se
rvic
es
(rev
ised
from
con
tinui
ty o
f ser
vice
s) Frequency of
sewer blockages W
S3.
1 708 675 650 600 550 Percentage of wastewater and sanitation complaints / callouts responded to within 24 hours (sanitation / wastewater)
WS
3.11
100% I&E (W&S)
Average number of days taken to unblock a stormwater blockage (from the date that the stormwater blockage is reported to the date that the blockage is unblocked)
N/A
I&E (W&S)
KP
A 1
: BA
SIC
SE
RV
ICE
D
ELI
VE
RY
Impr
oved
qua
lity
of w
ater
and
sa
nita
tion
serv
ices
(re
vise
d fr
om
cont
inui
ty o
f ser
vice
s) Frequency of
mains failures
WS
3.2 69 65 60 55 50 Percentage of
complaints/ callouts responded to within 24 hours (water)
WS
3.21
100% I&E (W&S)
Frequency of unplanned water service interruptions
WS
3.3 15 13 12 10 8
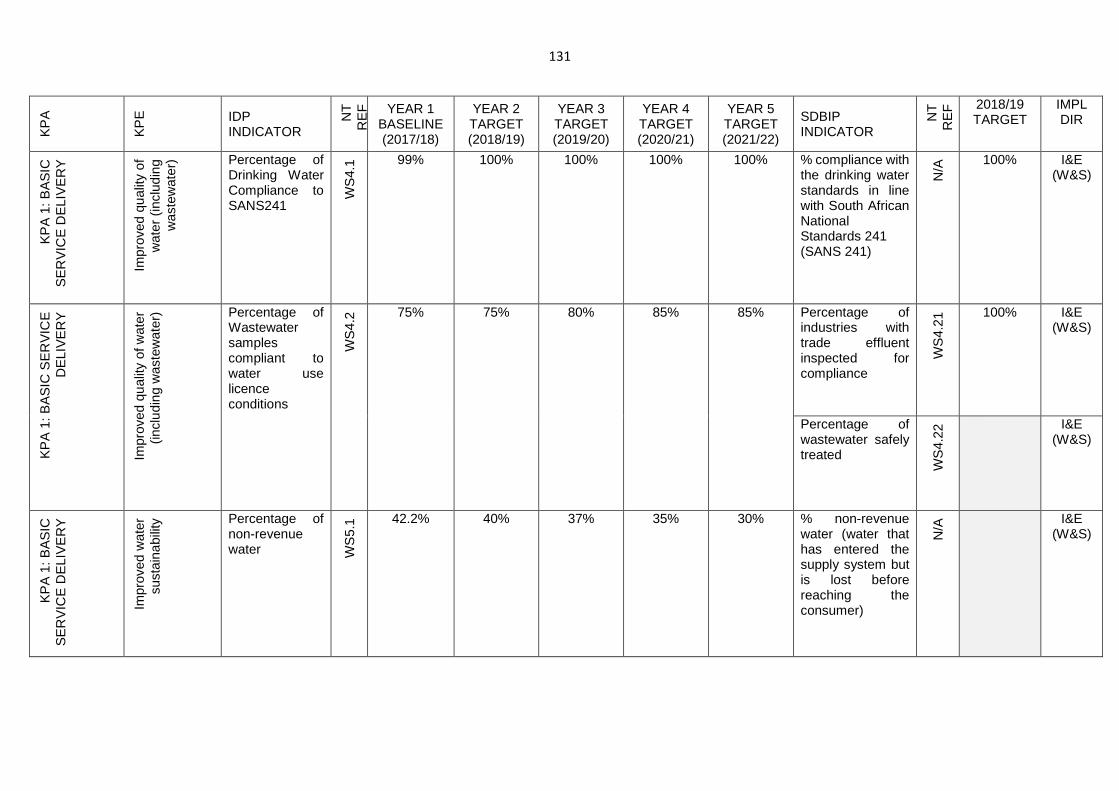
131
KP
A
KP
E
IDP INDICATOR
NT
R
EF
YEAR 1 BASELINE (2017/18)
YEAR 2 TARGET (2018/19)
YEAR 3 TARGET (2019/20)
YEAR 4 TARGET (2020/21)
YEAR 5 TARGET (2021/22)
SDBIP INDICATOR
NT
R
EF
2018/19 TARGET
IMPL DIR
KP
A 1
: BA
SIC
S
ER
VIC
E D
ELI
VE
RY
Impr
oved
qua
lity
of
wat
er (
incl
udin
g w
aste
wat
er) Percentage of
Drinking Water Compliance to SANS241
WS
4.1 99% 100% 100% 100% 100% % compliance with
the drinking water standards in line with South African National Standards 241 (SANS 241)
N/A
100% I&E (W&S)
KP
A 1
: BA
SIC
SE
RV
ICE
D
ELI
VE
RY
Impr
oved
qua
lity
of w
ater
(in
clud
ing
was
tew
ater
)
Percentage of Wastewater samples compliant to water use licence conditions
WS
4.2 75% 75% 80% 85% 85% Percentage of
industries with trade effluent inspected for compliance
WS
4.21
100% I&E (W&S)
Percentage of wastewater safely treated
WS
4.22
I&E (W&S)
KP
A 1
: BA
SIC
S
ER
VIC
E D
ELI
VE
RY
Impr
oved
wat
er
sust
aina
bilit
y
Percentage of non-revenue water W
S5.
1 42.2% 40% 37% 35% 30% % non-revenue water (water that has entered the supply system but is lost before reaching the consumer)
N/A
I&E (W&S)
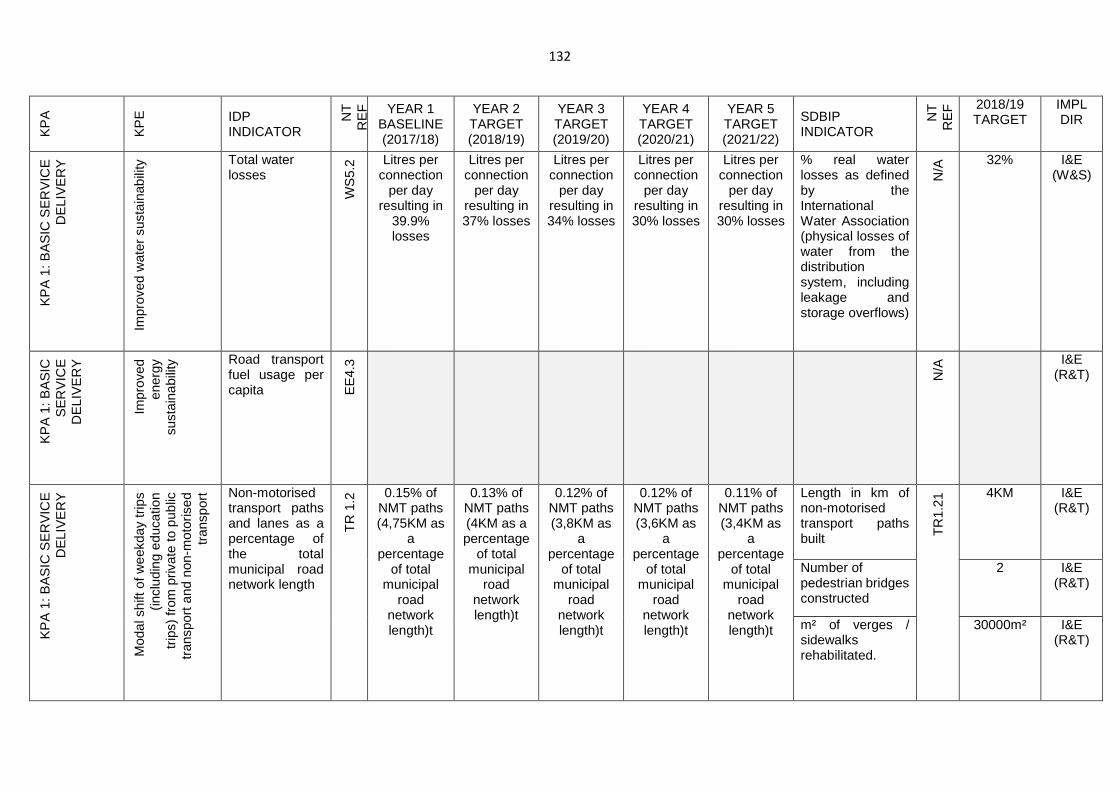
132
KP
A
KP
E
IDP INDICATOR
NT
R
EF
YEAR 1 BASELINE (2017/18)
YEAR 2 TARGET (2018/19)
YEAR 3 TARGET (2019/20)
YEAR 4 TARGET (2020/21)
YEAR 5 TARGET (2021/22)
SDBIP INDICATOR
NT
R
EF
2018/19 TARGET
IMPL DIR
KP
A 1
: BA
SIC
SE
RV
ICE
D
ELI
VE
RY
Impr
oved
wat
er s
usta
inab
ility
Total water losses
WS
5.2 Litres per
connection per day
resulting in 39.9% losses
Litres per connection
per day resulting in 37% losses
Litres per connection
per day resulting in 34% losses
Litres per connection
per day resulting in 30% losses
Litres per connection
per day resulting in 30% losses
% real water losses as defined by the International Water Association (physical losses of water from the distribution system, including leakage and storage overflows)
N/A
32% I&E (W&S)
KP
A 1
: BA
SIC
S
ER
VIC
E
DE
LIV
ER
Y
Impr
oved
en
ergy
su
stai
nabi
lity Road transport
fuel usage per capita E
E4.
3
N/A
I&E (R&T)
KP
A 1
: BA
SIC
SE
RV
ICE
D
ELI
VE
RY
Mod
al s
hift
of w
eekd
ay tr
ips
(incl
udin
g ed
ucat
ion
trip
s) fr
om p
rivat
e to
pub
lic
tran
spor
t and
non
-mot
oris
ed
tran
spor
t Non-motorised transport paths and lanes as a percentage of the total municipal road network length
TR
1.2
0.15% of NMT paths (4,75KM as
a percentage
of total municipal
road network length)t
0.13% of NMT paths (4KM as a percentage
of total municipal
road network length)t
0.12% of NMT paths (3,8KM as
a percentage
of total municipal
road network length)t
0.12% of NMT paths (3,6KM as
a percentage
of total municipal
road network length)t
0.11% of NMT paths (3,4KM as
a percentage
of total municipal
road network length)t
Length in km of non-motorised transport paths built T
R1.
21 4KM I&E
(R&T)
Number of pedestrian bridges constructed
2 I&E (R&T)
m² of verges / sidewalks rehabilitated.
30000m² I&E (R&T)
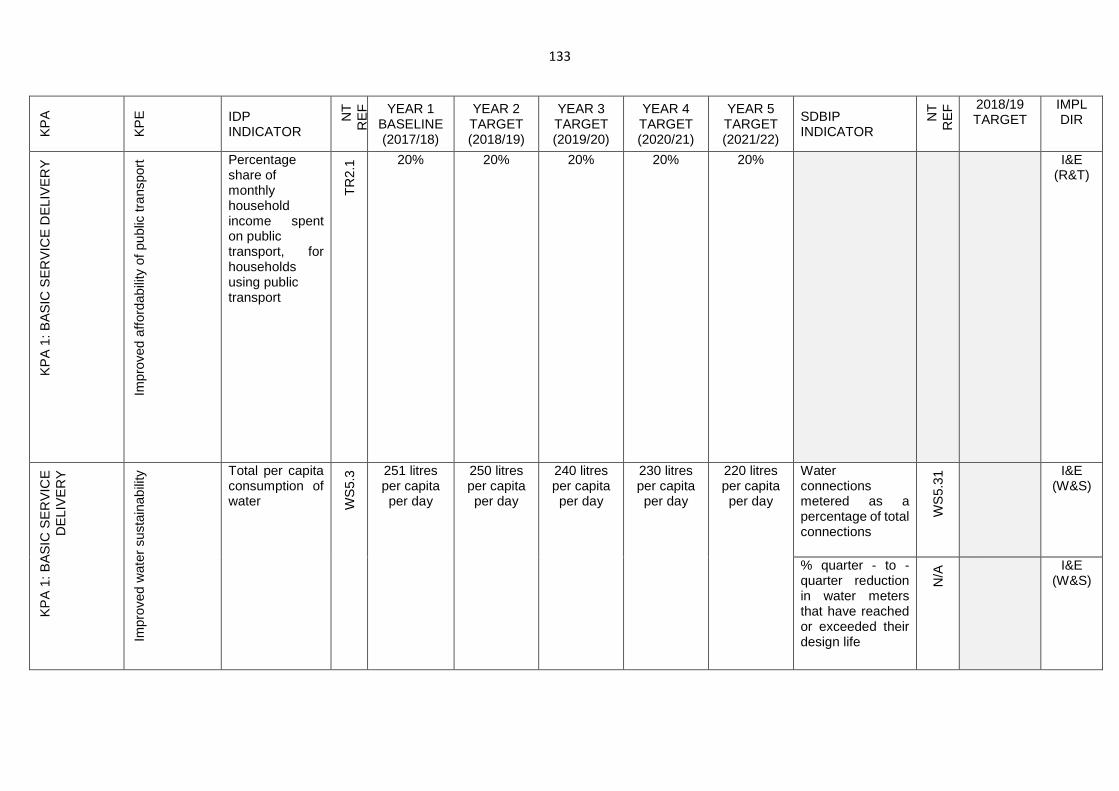
133
KP
A
KP
E
IDP INDICATOR
NT
R
EF
YEAR 1 BASELINE (2017/18)
YEAR 2 TARGET (2018/19)
YEAR 3 TARGET (2019/20)
YEAR 4 TARGET (2020/21)
YEAR 5 TARGET (2021/22)
SDBIP INDICATOR
NT
R
EF
2018/19 TARGET
IMPL DIR
KP
A 1
: BA
SIC
SE
RV
ICE
DE
LIV
ER
Y
Impr
oved
affo
rdab
ility
of p
ublic
tran
spor
t Percentage share of monthly household income spent on public transport, for households using public transport
TR
2.1 20% 20% 20% 20% 20% I&E
(R&T)
KP
A 1
: BA
SIC
SE
RV
ICE
D
ELI
VE
RY
Impr
oved
wat
er s
usta
inab
ility
Total per capita consumption of water W
S5.
3 251 litres per capita per day
250 litres per capita per day
240 litres per capita per day
230 litres per capita per day
220 litres per capita per day
Water connections metered as a percentage of total connections
WS
5.31
I&E (W&S)
% quarter - to - quarter reduction in water meters that have reached or exceeded their design life
N/A
I&E (W&S)
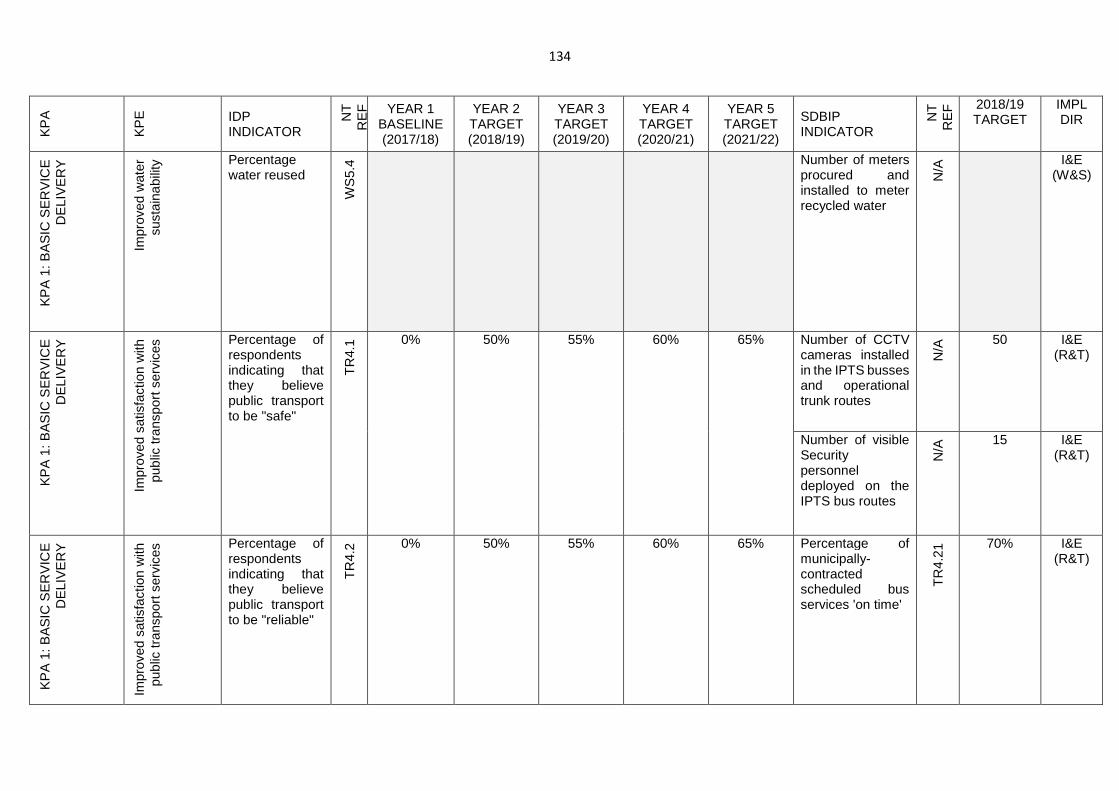
134
KP
A
KP
E
IDP INDICATOR
NT
R
EF
YEAR 1 BASELINE (2017/18)
YEAR 2 TARGET (2018/19)
YEAR 3 TARGET (2019/20)
YEAR 4 TARGET (2020/21)
YEAR 5 TARGET (2021/22)
SDBIP INDICATOR
NT
R
EF
2018/19 TARGET
IMPL DIR
KP
A 1
: BA
SIC
SE
RV
ICE
D
ELI
VE
RY
Impr
oved
wat
er
sust
aina
bilit
y
Percentage water reused
WS
5.4
Number of meters procured and installed to meter recycled water
N/A
I&E (W&S)
KP
A 1
: BA
SIC
SE
RV
ICE
D
ELI
VE
RY
Impr
oved
sat
isfa
ctio
n w
ith
publ
ic tr
ansp
ort s
ervi
ces
Percentage of respondents indicating that they believe public transport to be "safe"
TR
4.1 0% 50% 55% 60% 65% Number of CCTV
cameras installed in the IPTS busses and operational trunk routes
N/A
50 I&E (R&T)
Number of visible Security personnel deployed on the IPTS bus routes
N/A
15 I&E (R&T)
KP
A 1
: BA
SIC
SE
RV
ICE
D
ELI
VE
RY
Impr
oved
sat
isfa
ctio
n w
ith
publ
ic tr
ansp
ort s
ervi
ces Percentage of
respondents indicating that they believe public transport to be "reliable"
TR
4.2 0% 50% 55% 60% 65% Percentage of
municipally-contracted scheduled bus services 'on time'
TR
4.21
70% I&E (R&T)
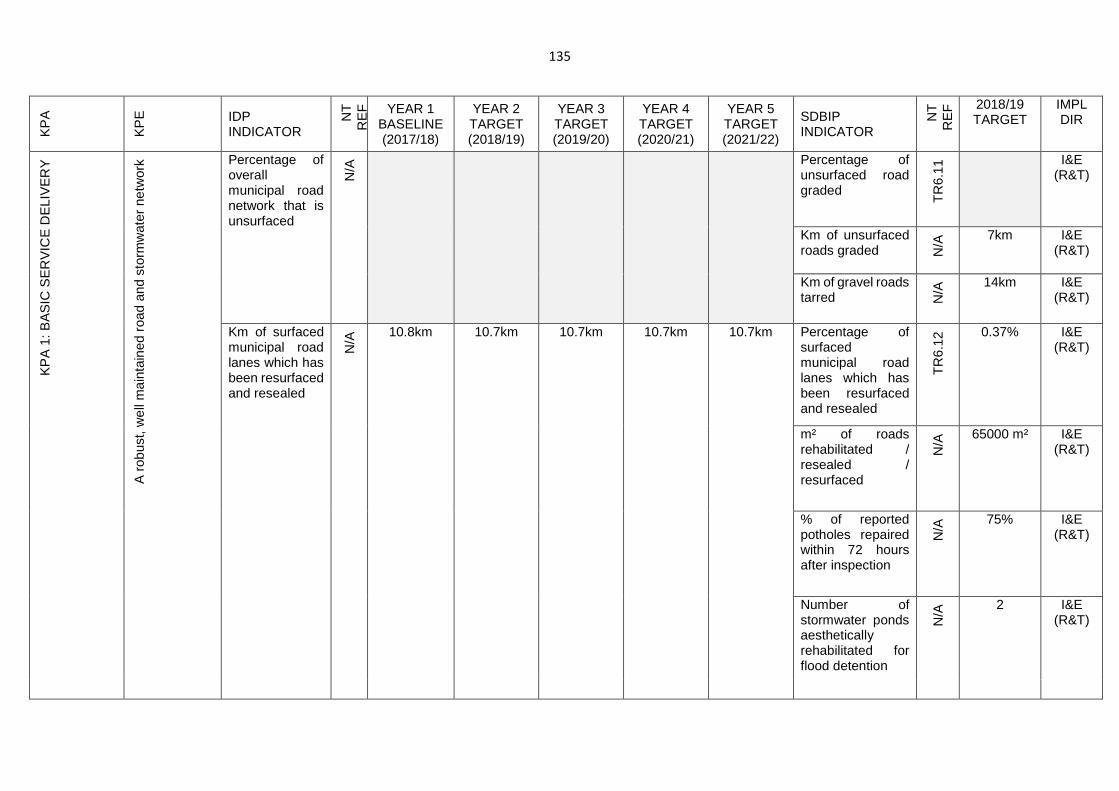
135
KP
A
KP
E
IDP INDICATOR
NT
R
EF
YEAR 1 BASELINE (2017/18)
YEAR 2 TARGET (2018/19)
YEAR 3 TARGET (2019/20)
YEAR 4 TARGET (2020/21)
YEAR 5 TARGET (2021/22)
SDBIP INDICATOR
NT
R
EF
2018/19 TARGET
IMPL DIR
KP
A 1
: BA
SIC
SE
RV
ICE
DE
LIV
ER
Y
A r
obus
t, w
ell m
aint
aine
d ro
ad a
nd s
torm
wat
er n
etw
ork
Percentage of overall municipal road network that is unsurfaced
N/A
Percentage of unsurfaced road graded
TR
6.11
I&E (R&T)
Km of unsurfaced roads graded N
/A 7km I&E
(R&T)
Km of gravel roads tarred N
/A 14km I&E
(R&T)
Km of surfaced municipal road lanes which has been resurfaced and resealed
N/A
10.8km 10.7km 10.7km 10.7km 10.7km Percentage of surfaced municipal road lanes which has been resurfaced and resealed
TR
6.12
0.37% I&E (R&T)
m² of roads rehabilitated / resealed / resurfaced
N/A
65000 m² I&E (R&T)
% of reported potholes repaired within 72 hours after inspection
N/A
75% I&E (R&T)
Number of stormwater ponds aesthetically rehabilitated for flood detention
N/A
2 I&E (R&T)
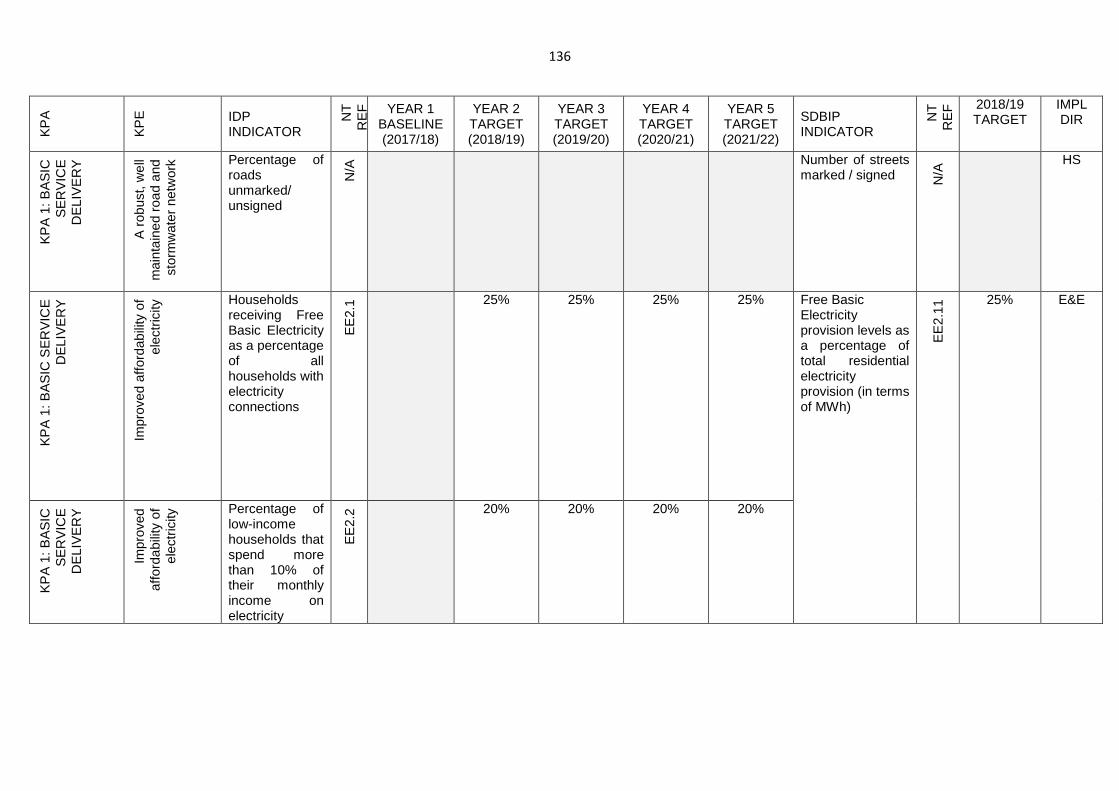
136
KP
A
KP
E
IDP INDICATOR
NT
R
EF
YEAR 1 BASELINE (2017/18)
YEAR 2 TARGET (2018/19)
YEAR 3 TARGET (2019/20)
YEAR 4 TARGET (2020/21)
YEAR 5 TARGET (2021/22)
SDBIP INDICATOR
NT
R
EF
2018/19 TARGET
IMPL DIR
KP
A 1
: BA
SIC
S
ER
VIC
E
DE
LIV
ER
Y
A r
obus
t, w
ell
mai
ntai
ned
road
and
st
orm
wat
er n
etw
ork
Percentage of roads unmarked/ unsigned
N/A
Number of streets marked / signed N
/A
HS
KP
A 1
: BA
SIC
SE
RV
ICE
D
ELI
VE
RY
Impr
oved
affo
rdab
ility
of
elec
tric
ity Households
receiving Free Basic Electricity as a percentage of all households with electricity connections
EE
2.1 25% 25% 25% 25% Free Basic
Electricity provision levels as a percentage of total residential electricity provision (in terms of MWh)
EE
2.11
25% E&E
KP
A 1
: BA
SIC
S
ER
VIC
E
DE
LIV
ER
Y
Impr
oved
af
ford
abili
ty o
f el
ectr
icity
Percentage of low-income households that spend more than 10% of their monthly income on electricity
EE
2.2 20% 20% 20% 20%
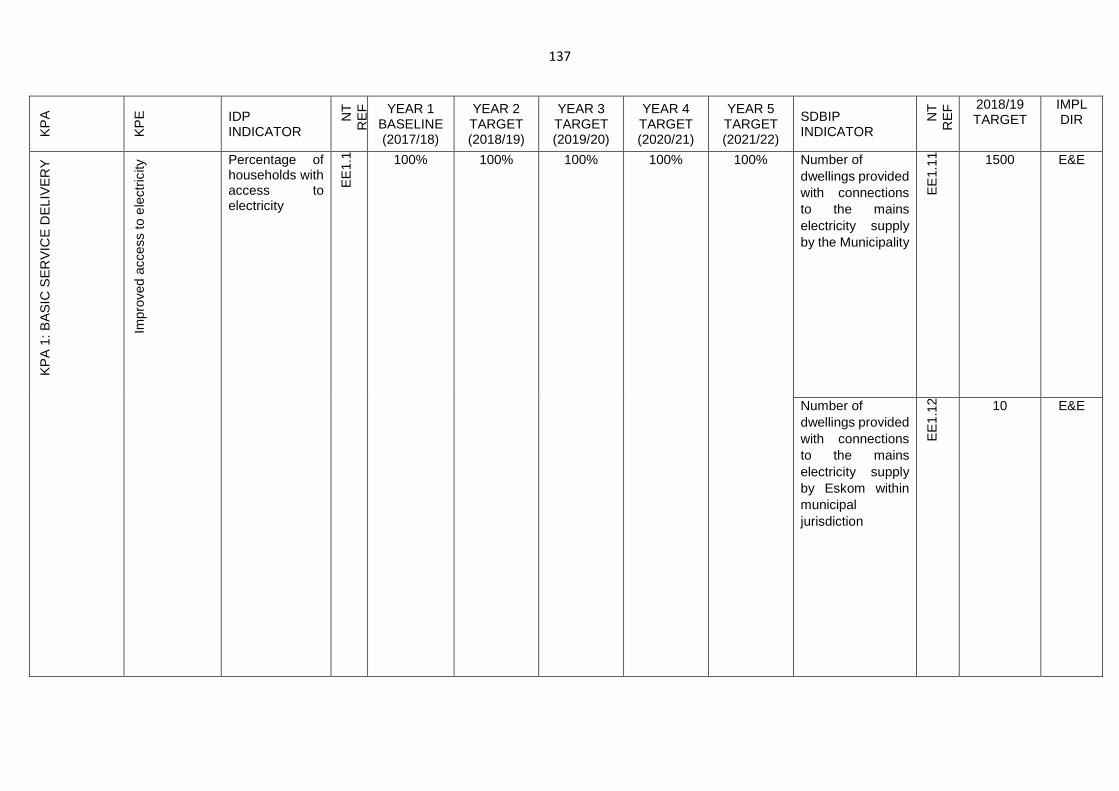
137
KP
A
KP
E
IDP INDICATOR
NT
R
EF
YEAR 1 BASELINE (2017/18)
YEAR 2 TARGET (2018/19)
YEAR 3 TARGET (2019/20)
YEAR 4 TARGET (2020/21)
YEAR 5 TARGET (2021/22)
SDBIP INDICATOR
NT
R
EF
2018/19 TARGET
IMPL DIR
KP
A 1
: BA
SIC
SE
RV
ICE
DE
LIV
ER
Y
Impr
oved
acc
ess
to e
lect
ricity
Percentage of households with access to electricity
EE
1.1 100% 100% 100% 100% 100% Number of
dwellings provided with connections to the mains electricity supply by the Municipality
EE
1.11
1500 E&E
Number of dwellings provided with connections to the mains electricity supply by Eskom within municipal jurisdiction
EE
1.12
10 E&E
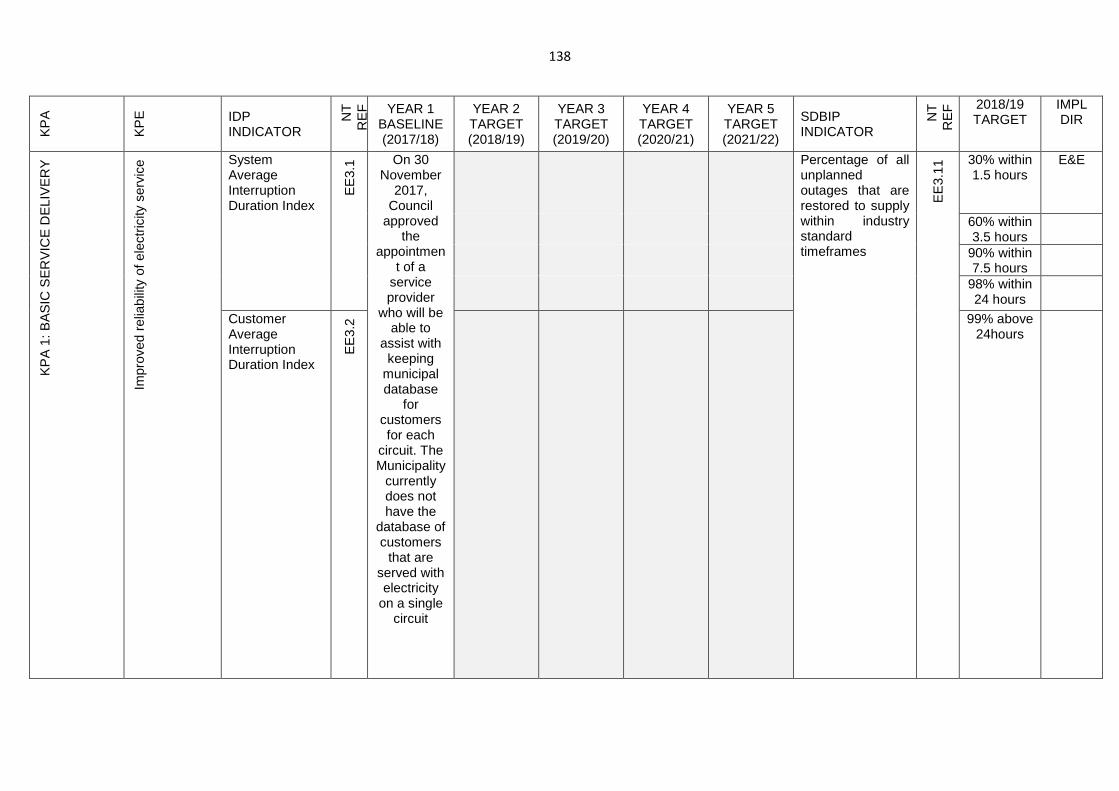
138
KP
A
KP
E
IDP INDICATOR
NT
R
EF
YEAR 1 BASELINE (2017/18)
YEAR 2 TARGET (2018/19)
YEAR 3 TARGET (2019/20)
YEAR 4 TARGET (2020/21)
YEAR 5 TARGET (2021/22)
SDBIP INDICATOR
NT
R
EF
2018/19 TARGET
IMPL DIR
KP
A 1
: BA
SIC
SE
RV
ICE
DE
LIV
ER
Y
Impr
oved
rel
iabi
lity
of e
lect
ricity
ser
vice
System Average Interruption Duration Index
EE
3.1 On 30
November 2017,
Council approved
the appointmen
t of a service provider
who will be able to
assist with keeping
municipal database
for customers for each
circuit. The Municipality
currently does not have the
database of customers
that are served with electricity
on a single circuit
Percentage of all unplanned outages that are restored to supply within industry standard timeframes
EE
3.11
30% within 1.5 hours
E&E
60% within 3.5 hours
90% within 7.5 hours
98% within 24 hours
Customer Average Interruption Duration Index
EE
3.2 99% above
24hours
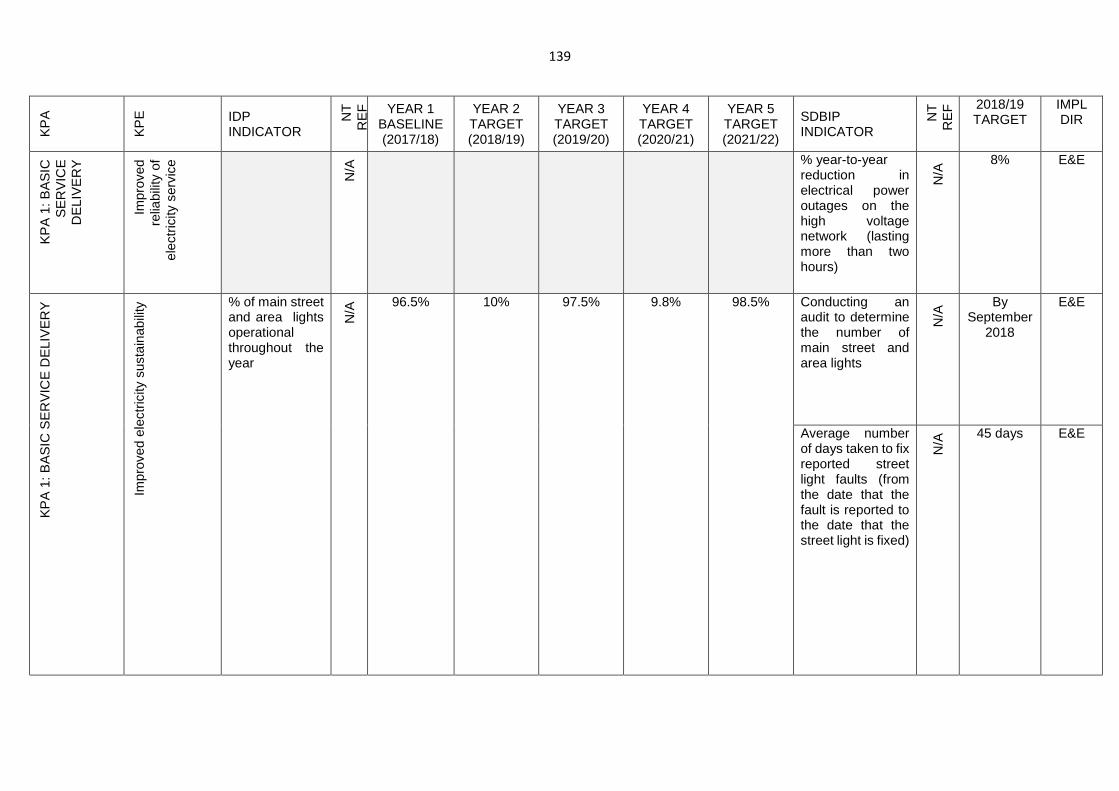
139
KP
A
KP
E
IDP INDICATOR
NT
R
EF
YEAR 1 BASELINE (2017/18)
YEAR 2 TARGET (2018/19)
YEAR 3 TARGET (2019/20)
YEAR 4 TARGET (2020/21)
YEAR 5 TARGET (2021/22)
SDBIP INDICATOR
NT
R
EF
2018/19 TARGET
IMPL DIR
KP
A 1
: BA
SIC
S
ER
VIC
E
DE
LIV
ER
Y
Impr
oved
re
liabi
lity
of
elec
tric
ity s
ervi
ce
N/A
% year-to-year reduction in electrical power outages on the high voltage network (lasting more than two hours)
N/A
8% E&E
KP
A 1
: BA
SIC
SE
RV
ICE
DE
LIV
ER
Y
Impr
oved
ele
ctric
ity s
usta
inab
ility
% of main street and area lights operational throughout the year
N/A
96.5% 10% 97.5% 9.8% 98.5% Conducting an audit to determine the number of main street and area lights
N/A
By September
2018
E&E
Average number of days taken to fix reported street light faults (from the date that the fault is reported to the date that the street light is fixed)
N/A
45 days E&E
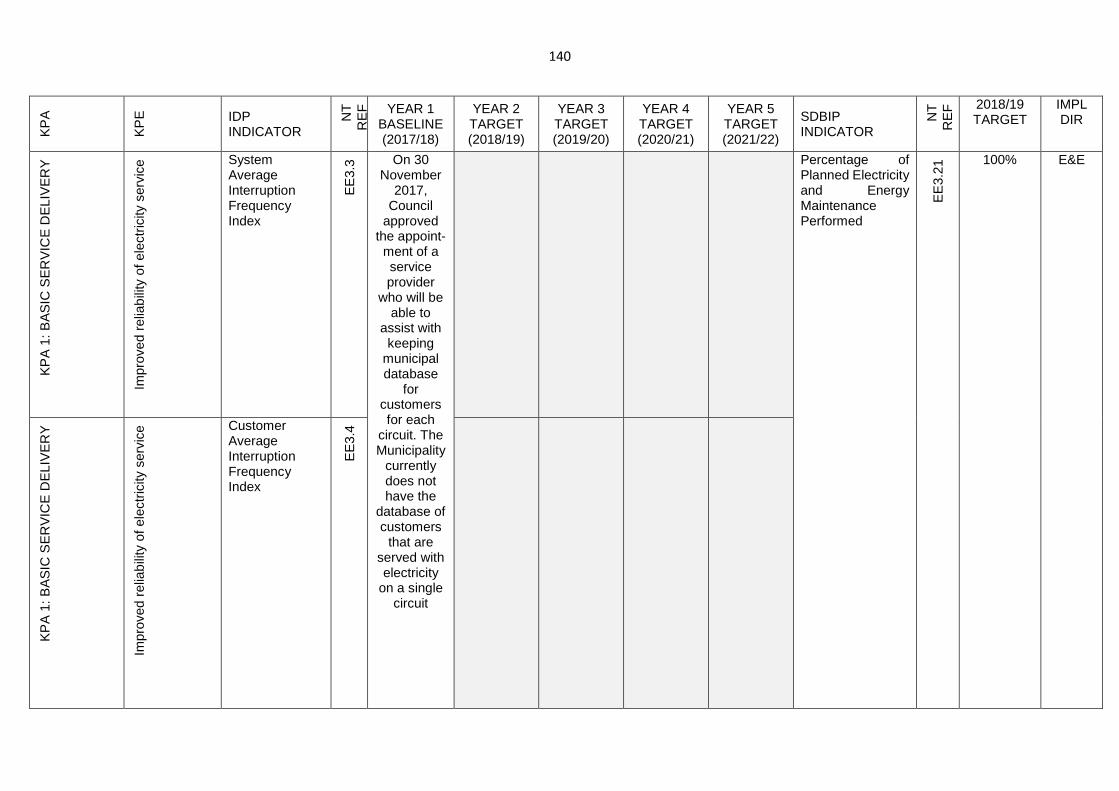
140
KP
A
KP
E
IDP INDICATOR
NT
R
EF
YEAR 1 BASELINE (2017/18)
YEAR 2 TARGET (2018/19)
YEAR 3 TARGET (2019/20)
YEAR 4 TARGET (2020/21)
YEAR 5 TARGET (2021/22)
SDBIP INDICATOR
NT
R
EF
2018/19 TARGET
IMPL DIR
KP
A 1
: BA
SIC
SE
RV
ICE
DE
LIV
ER
Y
Impr
oved
rel
iabi
lity
of e
lect
ricity
ser
vice
System Average Interruption Frequency Index
EE
3.3 On 30
November 2017,
Council approved
the appoint-ment of a service provider
who will be able to
assist with keeping
municipal database
for customers for each
circuit. The Municipality
currently does not have the
database of customers
that are served with electricity
on a single circuit
Percentage of Planned Electricity and Energy Maintenance Performed
EE
3.21
100% E&E
KP
A 1
: BA
SIC
SE
RV
ICE
DE
LIV
ER
Y
Impr
oved
rel
iabi
lity
of e
lect
ricity
ser
vice
Customer Average Interruption Frequency Index
EE
3.4
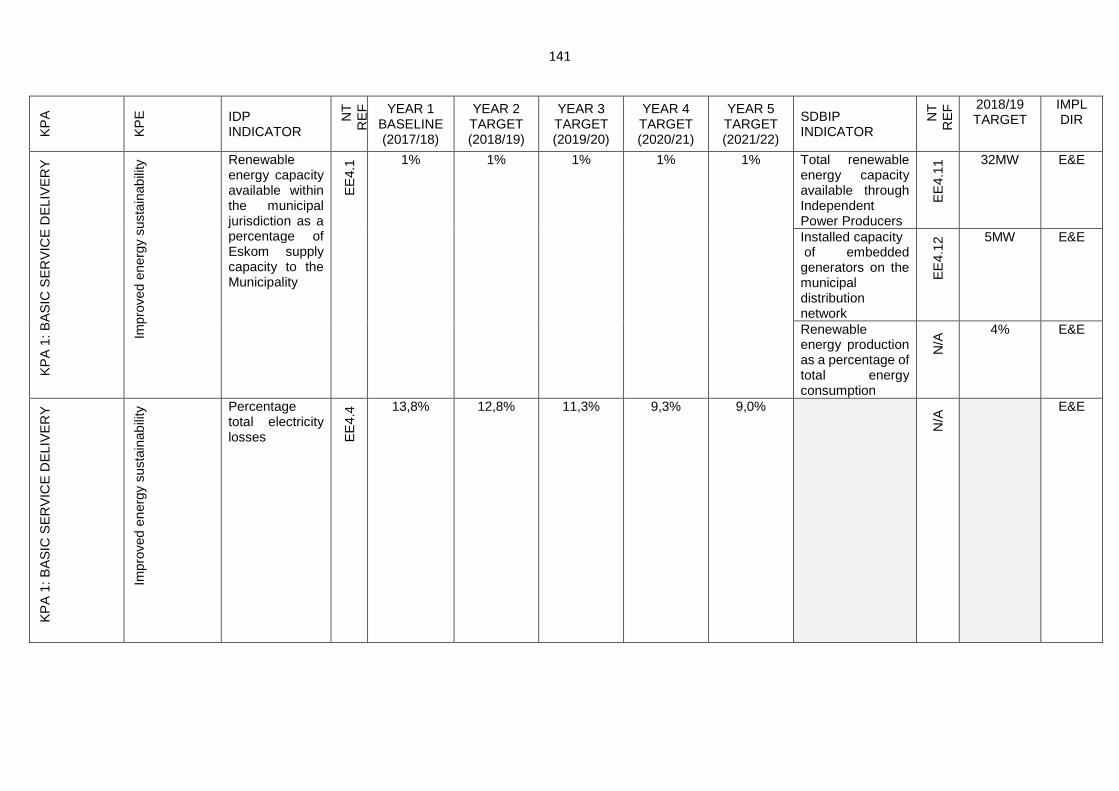
141
KP
A
KP
E
IDP INDICATOR
NT
R
EF
YEAR 1 BASELINE (2017/18)
YEAR 2 TARGET (2018/19)
YEAR 3 TARGET (2019/20)
YEAR 4 TARGET (2020/21)
YEAR 5 TARGET (2021/22)
SDBIP INDICATOR
NT
R
EF
2018/19 TARGET
IMPL DIR
KP
A 1
: BA
SIC
SE
RV
ICE
DE
LIV
ER
Y
Impr
oved
ene
rgy
sust
aina
bilit
y Renewable energy capacity available within the municipal jurisdiction as a percentage of Eskom supply capacity to the Municipality
EE
4.1 1% 1% 1% 1% 1% Total renewable
energy capacity available through Independent Power Producers
EE
4.11
32MW E&E
Installed capacity of embedded generators on the municipal distribution network
EE
4.12
5MW E&E
Renewable energy production as a percentage of total energy consumption
N/A
4% E&E
KP
A 1
: BA
SIC
SE
RV
ICE
DE
LIV
ER
Y
Impr
oved
ene
rgy
sust
aina
bilit
y Percentage total electricity losses E
E4.
4 13,8% 12,8% 11,3% 9,3% 9,0%
N/A
E&E
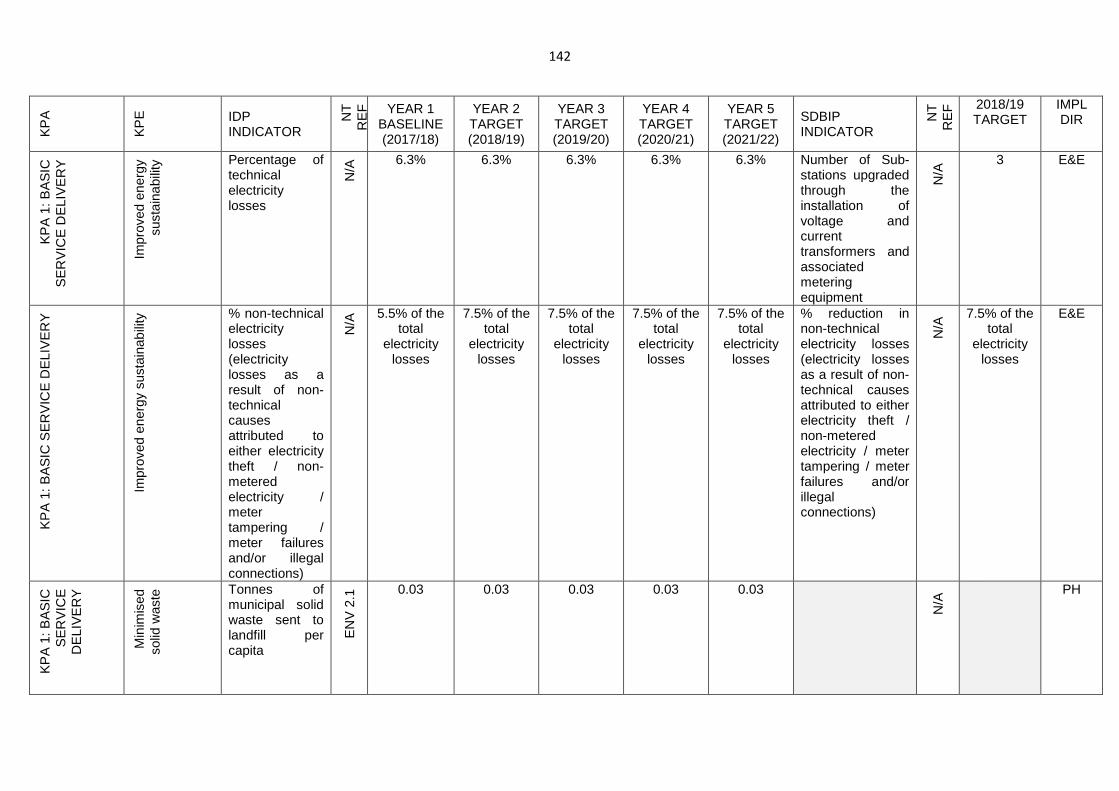
142
KP
A
KP
E
IDP INDICATOR
NT
R
EF
YEAR 1 BASELINE (2017/18)
YEAR 2 TARGET (2018/19)
YEAR 3 TARGET (2019/20)
YEAR 4 TARGET (2020/21)
YEAR 5 TARGET (2021/22)
SDBIP INDICATOR
NT
R
EF
2018/19 TARGET
IMPL DIR
KP
A 1
: BA
SIC
S
ER
VIC
E D
ELI
VE
RY
Impr
oved
ene
rgy
sust
aina
bilit
y Percentage of technical electricity losses
N/A
6.3% 6.3% 6.3% 6.3% 6.3% Number of Sub-stations upgraded through the installation of voltage and current transformers and associated metering equipment
N/A
3 E&E
KP
A 1
: BA
SIC
SE
RV
ICE
DE
LIV
ER
Y
Impr
oved
ene
rgy
sust
aina
bilit
y % non-technical electricity losses (electricity losses as a result of non-technical causes attributed to either electricity theft / non-metered electricity / meter tampering / meter failures and/or illegal connections)
N/A
5.5% of the total
electricity losses
7.5% of the total
electricity losses
7.5% of the total
electricity losses
7.5% of the total
electricity losses
7.5% of the total
electricity losses
% reduction in non-technical electricity losses (electricity losses as a result of non-technical causes attributed to either electricity theft / non-metered electricity / meter tampering / meter failures and/or illegal connections)
N/A
7.5% of the total
electricity losses
E&E
KP
A 1
: BA
SIC
S
ER
VIC
E
DE
LIV
ER
Y
Min
imis
ed
solid
was
te Tonnes of
municipal solid waste sent to landfill per capita
EN
V 2
.1 0.03 0.03 0.03 0.03 0.03
N/A
PH
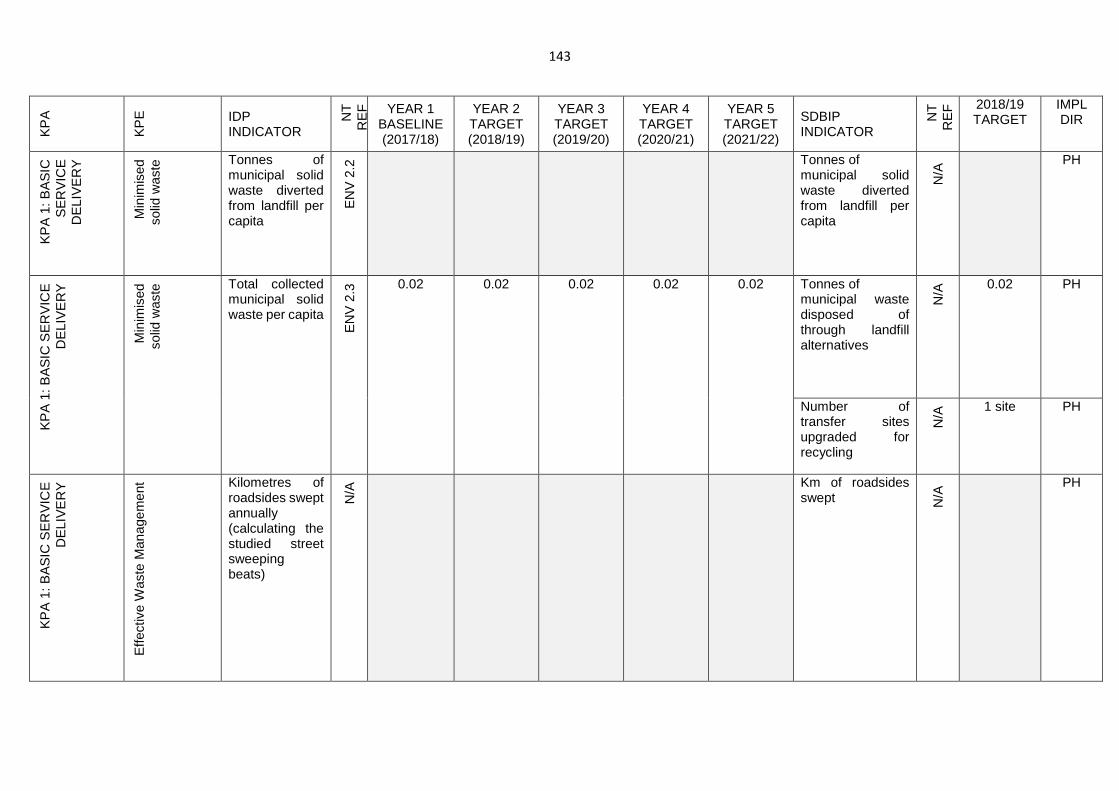
143
KP
A
KP
E
IDP INDICATOR
NT
R
EF
YEAR 1 BASELINE (2017/18)
YEAR 2 TARGET (2018/19)
YEAR 3 TARGET (2019/20)
YEAR 4 TARGET (2020/21)
YEAR 5 TARGET (2021/22)
SDBIP INDICATOR
NT
R
EF
2018/19 TARGET
IMPL DIR
KP
A 1
: BA
SIC
S
ER
VIC
E
DE
LIV
ER
Y
Min
imis
ed
solid
was
te Tonnes of
municipal solid waste diverted from landfill per capita
EN
V 2
.2 Tonnes of
municipal solid waste diverted from landfill per capita
N/A
PH
KP
A 1
: BA
SIC
SE
RV
ICE
D
ELI
VE
RY
Min
imis
ed
solid
was
te Total collected
municipal solid waste per capita
EN
V 2
.3 0.02 0.02 0.02 0.02 0.02 Tonnes of
municipal waste disposed of through landfill alternatives
N/A
0.02 PH
Number of transfer sites upgraded for recycling
N/A
1 site PH
KP
A 1
: BA
SIC
SE
RV
ICE
D
ELI
VE
RY
Effe
ctiv
e W
aste
Man
agem
ent Kilometres of
roadsides swept annually (calculating the studied street sweeping beats)
N/A
Km of roadsides swept N
/A
PH
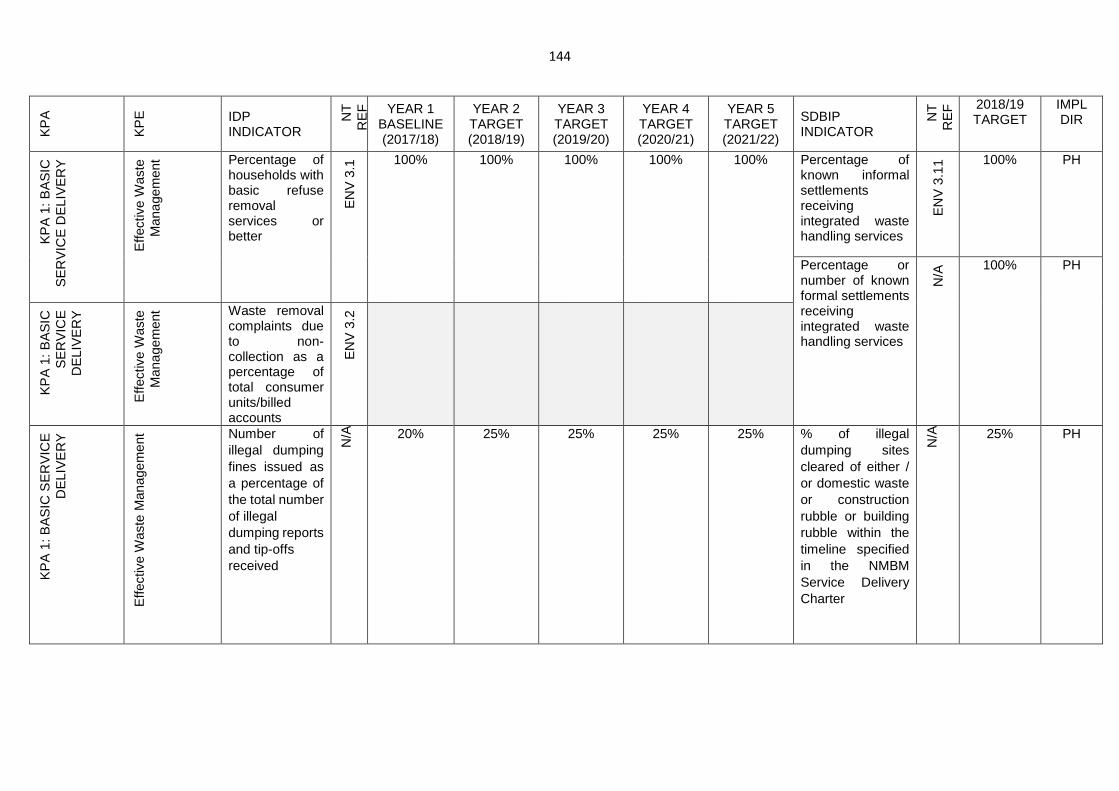
144
KP
A
KP
E
IDP INDICATOR
NT
R
EF
YEAR 1 BASELINE (2017/18)
YEAR 2 TARGET (2018/19)
YEAR 3 TARGET (2019/20)
YEAR 4 TARGET (2020/21)
YEAR 5 TARGET (2021/22)
SDBIP INDICATOR
NT
R
EF
2018/19 TARGET
IMPL DIR
KP
A 1
: BA
SIC
S
ER
VIC
E D
ELI
VE
RY
Effe
ctiv
e W
aste
M
anag
emen
t Percentage of households with basic refuse removal services or better
EN
V 3
.1 100% 100% 100% 100% 100% Percentage of
known informal settlements receiving integrated waste handling services
EN
V 3
.11
100% PH
Percentage or number of known formal settlements receiving integrated waste handling services
N/A
100% PH
KP
A 1
: BA
SIC
S
ER
VIC
E
DE
LIV
ER
Y
Effe
ctiv
e W
aste
M
anag
emen
t Waste removal complaints due to non-collection as a percentage of total consumer units/billed accounts
EN
V 3
.2
KP
A 1
: BA
SIC
SE
RV
ICE
D
ELI
VE
RY
Effe
ctiv
e W
aste
Man
agem
ent Number of
illegal dumping fines issued as a percentage of the total number of illegal dumping reports and tip-offs received
N/A 20% 25% 25% 25% 25% % of illegal
dumping sites cleared of either / or domestic waste or construction rubble or building rubble within the timeline specified in the NMBM Service Delivery Charter
N/A 25% PH
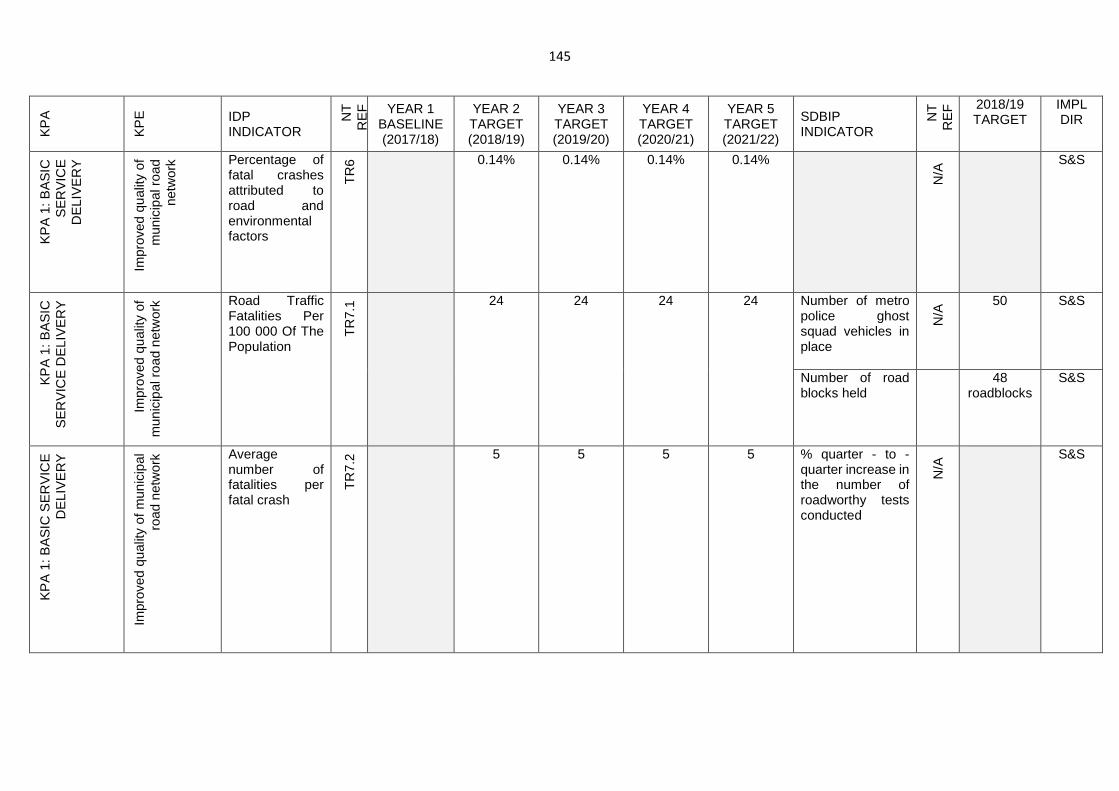
145
KP
A
KP
E
IDP INDICATOR
NT
R
EF
YEAR 1 BASELINE (2017/18)
YEAR 2 TARGET (2018/19)
YEAR 3 TARGET (2019/20)
YEAR 4 TARGET (2020/21)
YEAR 5 TARGET (2021/22)
SDBIP INDICATOR
NT
R
EF
2018/19 TARGET
IMPL DIR
KP
A 1
: BA
SIC
S
ER
VIC
E
DE
LIV
ER
Y
Impr
oved
qua
lity
of
mun
icip
al r
oad
netw
ork Percentage of
fatal crashes attributed to road and environmental factors
TR
6 0.14% 0.14% 0.14% 0.14%
N/A
S&S
KP
A 1
: BA
SIC
S
ER
VIC
E D
ELI
VE
RY
Impr
oved
qua
lity
of
mun
icip
al r
oad
netw
ork Road Traffic
Fatalities Per 100 000 Of The Population
TR
7.1 24 24 24 24 Number of metro
police ghost squad vehicles in place
N/A
50 S&S
Number of road blocks held
48 roadblocks
S&S
KP
A 1
: BA
SIC
SE
RV
ICE
D
ELI
VE
RY
Impr
oved
qua
lity
of m
unic
ipal
ro
ad n
etw
ork Average
number of fatalities per fatal crash
TR
7.2 5 5 5 5 % quarter - to -
quarter increase in the number of roadworthy tests conducted
N/A
S&S
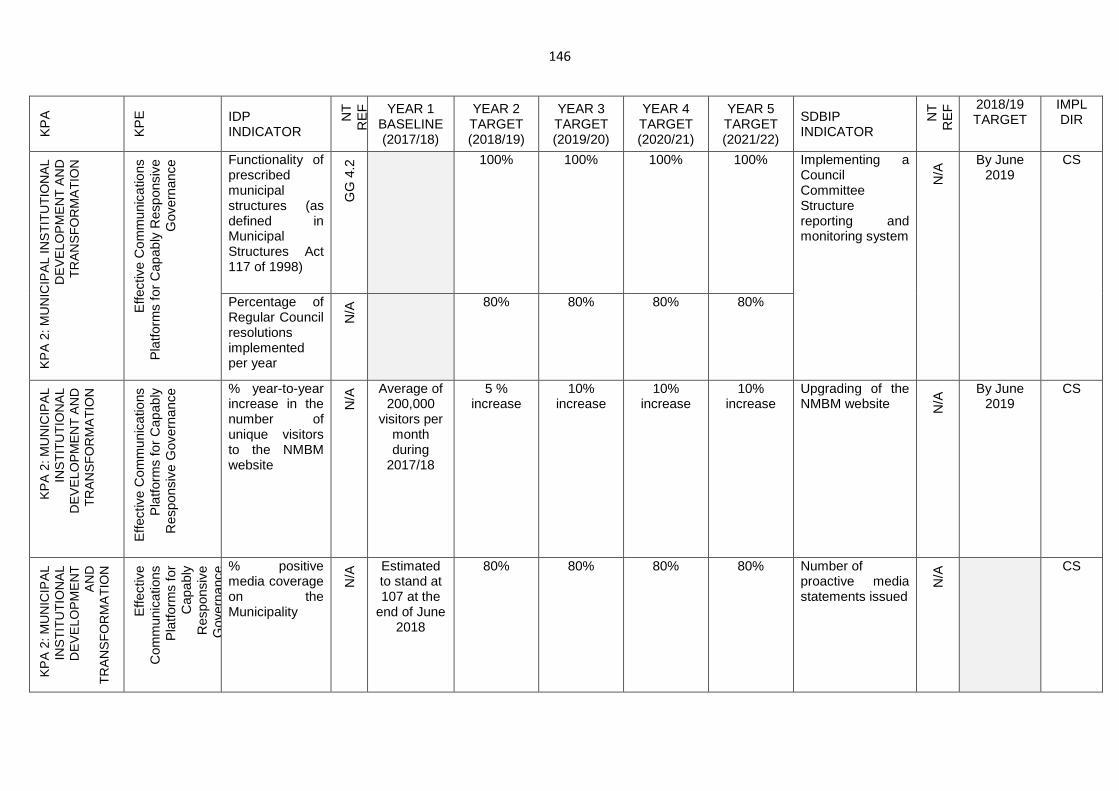
146
KP
A
KP
E
IDP INDICATOR
NT
R
EF
YEAR 1 BASELINE (2017/18)
YEAR 2 TARGET (2018/19)
YEAR 3 TARGET (2019/20)
YEAR 4 TARGET (2020/21)
YEAR 5 TARGET (2021/22)
SDBIP INDICATOR
NT
R
EF
2018/19 TARGET
IMPL DIR
KP
A 2
: MU
NIC
IPA
L IN
ST
ITU
TIO
NA
L D
EV
ELO
PM
EN
T A
ND
T
RA
NS
FO
RM
AT
ION
Effe
ctiv
e C
omm
unic
atio
ns
Pla
tform
s fo
r C
apab
ly R
espo
nsiv
e G
over
nanc
e Functionality of prescribed municipal structures (as defined in Municipal Structures Act 117 of 1998)
GG
4.2
100% 100% 100% 100% Implementing a Council Committee Structure reporting and monitoring system
N/A
By June 2019
CS
Percentage of Regular Council resolutions implemented per year
N/A
80% 80% 80% 80%
KP
A 2
: MU
NIC
IPA
L IN
ST
ITU
TIO
NA
L D
EV
ELO
PM
EN
T A
ND
T
RA
NS
FO
RM
AT
ION
Effe
ctiv
e C
omm
unic
atio
ns
Pla
tform
s fo
r C
apab
ly
Res
pons
ive
Gov
erna
nce % year-to-year
increase in the number of unique visitors to the NMBM website
N/A
Average of 200,000
visitors per month during
2017/18
5 % increase
10% increase
10% increase
10% increase
Upgrading of the NMBM website N
/A By June
2019 CS
KP
A 2
: MU
NIC
IPA
L IN
ST
ITU
TIO
NA
L D
EV
ELO
PM
EN
T
AN
D
TR
AN
SF
OR
MA
TIO
N
Effe
ctiv
e C
omm
unic
atio
ns
Pla
tform
s fo
r C
apab
ly
Res
pons
ive
Gov
erna
nce % positive
media coverage on the Municipality
N/A
Estimated to stand at 107 at the
end of June 2018
80% 80% 80% 80% Number of proactive media statements issued
N/A
CS
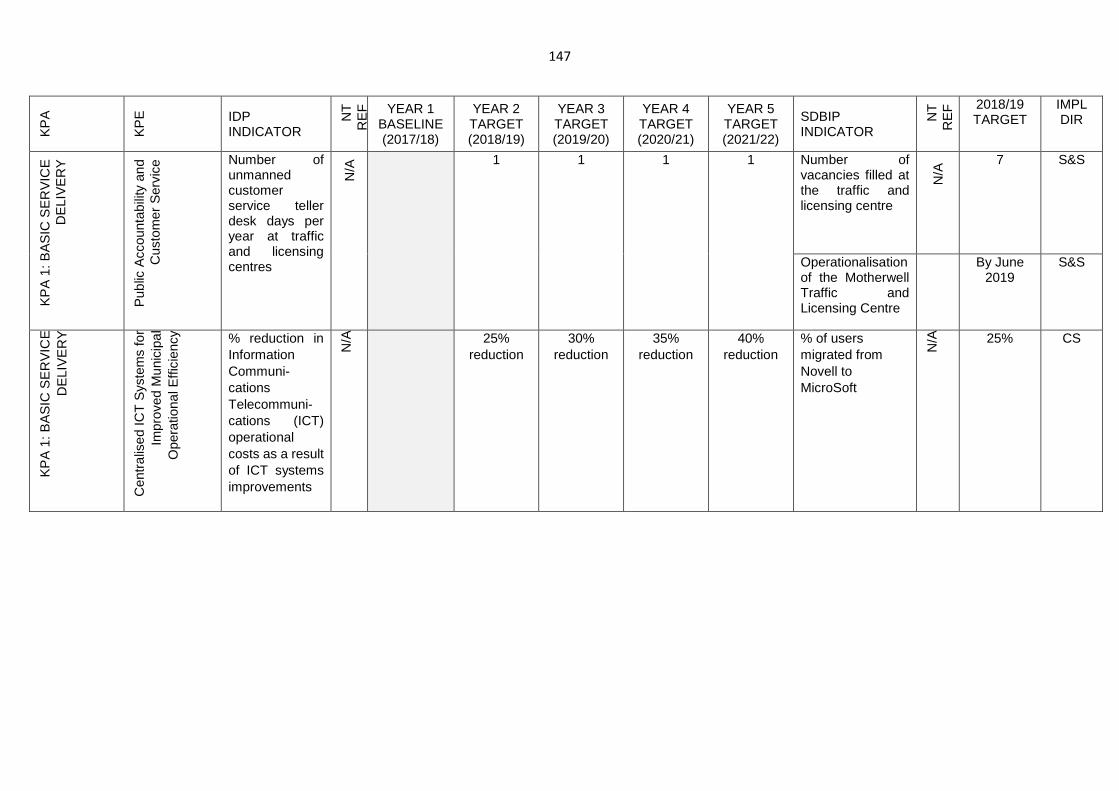
147
KP
A
KP
E
IDP INDICATOR
NT
R
EF
YEAR 1 BASELINE (2017/18)
YEAR 2 TARGET (2018/19)
YEAR 3 TARGET (2019/20)
YEAR 4 TARGET (2020/21)
YEAR 5 TARGET (2021/22)
SDBIP INDICATOR
NT
R
EF
2018/19 TARGET
IMPL DIR
KP
A 1
: BA
SIC
SE
RV
ICE
D
ELI
VE
RY
Pub
lic A
ccou
ntab
ility
and
C
usto
mer
Ser
vice
Number of unmanned customer service teller desk days per year at traffic and licensing centres
N/A
1 1 1 1 Number of vacancies filled at the traffic and licensing centre
N/A
7 S&S
Operationalisation of the Motherwell Traffic and Licensing Centre
By June 2019
S&S
KP
A 1
: BA
SIC
SE
RV
ICE
D
ELI
VE
RY
Cen
tral
ised
ICT
Sys
tem
s fo
r Im
prov
ed M
unic
ipal
O
pera
tiona
l Effi
cien
cy
% reduction in Information Communi-cations Telecommuni-cations (ICT) operational costs as a result of ICT systems improvements
N/A
25%
reduction 30%
reduction 35%
reduction 40%
reduction % of users migrated from Novell to MicroSoft
N/A
25% CS
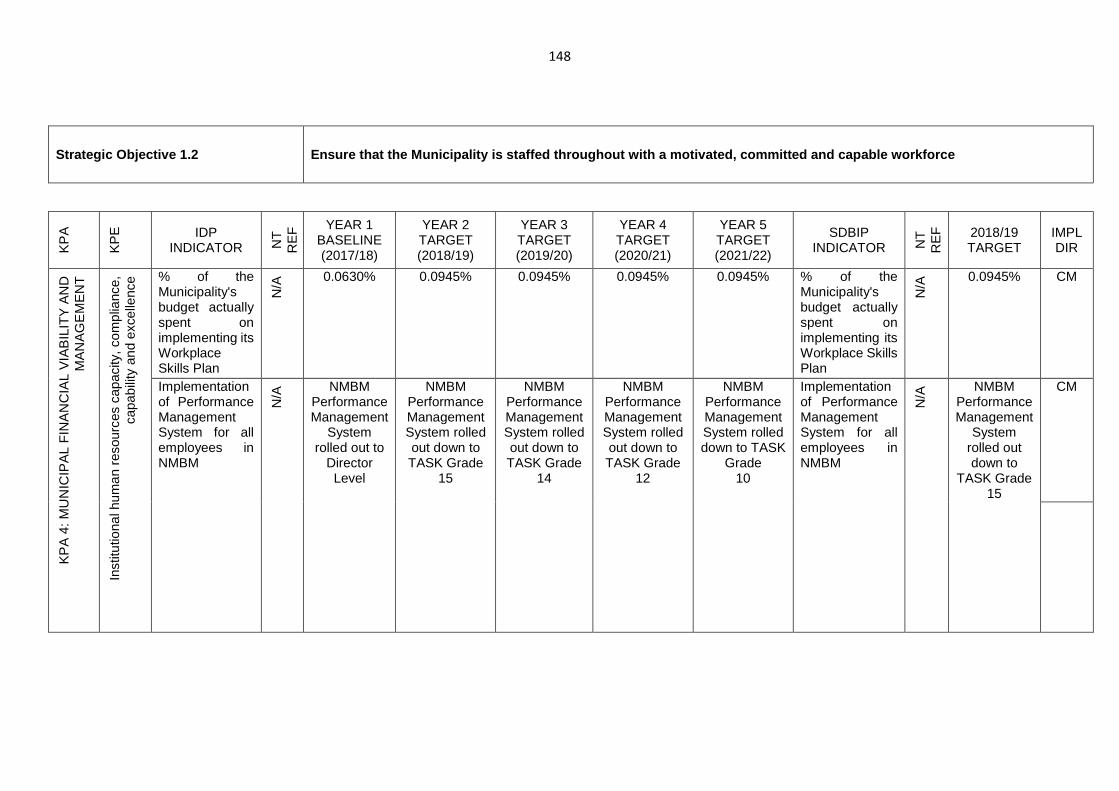
148
Strategic Objective 1.2 Ensure that the Municipality is staffed throughout with a motivated, committed and capable workforce
KP
A
KP
E
IDP INDICATOR N
T
RE
F YEAR 1
BASELINE (2017/18)
YEAR 2 TARGET (2018/19)
YEAR 3 TARGET (2019/20)
YEAR 4 TARGET (2020/21)
YEAR 5 TARGET (2021/22)
SDBIP INDICATOR N
T
RE
F
2018/19 TARGET
IMPL DIR
KP
A 4
: MU
NIC
IPA
L F
INA
NC
IAL
VIA
BIL
ITY
AN
D
MA
NA
GE
ME
NT
Inst
itutio
nal h
uman
res
ourc
es c
apac
ity, c
ompl
ianc
e,
capa
bilit
y an
d ex
celle
nce % of the
Municipality's budget actually spent on implementing its Workplace Skills Plan
N/A
0.0630% 0.0945% 0.0945% 0.0945% 0.0945% % of the Municipality's budget actually spent on implementing its Workplace Skills Plan
N/A
0.0945% CM
Implementation of Performance Management System for all employees in NMBM
N/A
NMBM Performance Management
System rolled out to
Director Level
NMBM Performance Management System rolled out down to TASK Grade
15
NMBM Performance Management System rolled out down to TASK Grade
14
NMBM Performance Management System rolled out down to TASK Grade
12
NMBM Performance Management System rolled down to TASK
Grade 10
Implementation of Performance Management System for all employees in NMBM
N/A
NMBM Performance Management
System rolled out down to
TASK Grade 15
CM
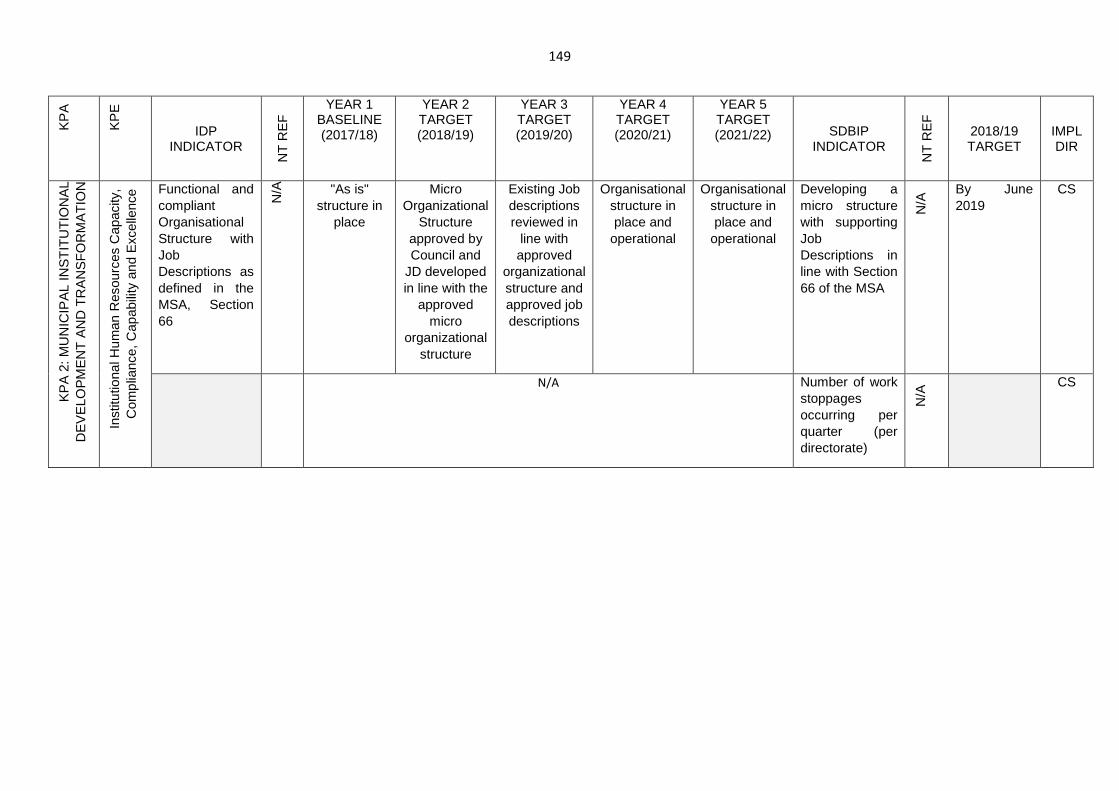
149
KP
A
KP
E
IDP INDICATOR
NT
RE
F YEAR 1
BASELINE (2017/18)
YEAR 2 TARGET (2018/19)
YEAR 3 TARGET (2019/20)
YEAR 4 TARGET (2020/21)
YEAR 5 TARGET (2021/22) SDBIP
INDICATOR
NT
RE
F
2018/19 TARGET
IMPL DIR
KP
A 2
: MU
NIC
IPA
L IN
ST
ITU
TIO
NA
L D
EV
ELO
PM
EN
T A
ND
TR
AN
SF
OR
MA
TIO
N
Inst
itutio
nal H
uman
Res
ourc
es C
apac
ity,
Com
plia
nce,
Cap
abili
ty a
nd E
xcel
lenc
e Functional and compliant Organisational Structure with Job Descriptions as defined in the MSA, Section 66
N/A
"As is" structure in
place
Micro Organizational
Structure approved by Council and
JD developed in line with the
approved micro
organizational structure
Existing Job descriptions reviewed in
line with approved
organizational structure and approved job descriptions
Organisational structure in place and
operational
Organisational structure in place and
operational
Developing a micro structure with supporting Job Descriptions in line with Section 66 of the MSA
N/A
By June 2019
CS
N/A Number of work stoppages occurring per quarter (per directorate)
N/A
CS
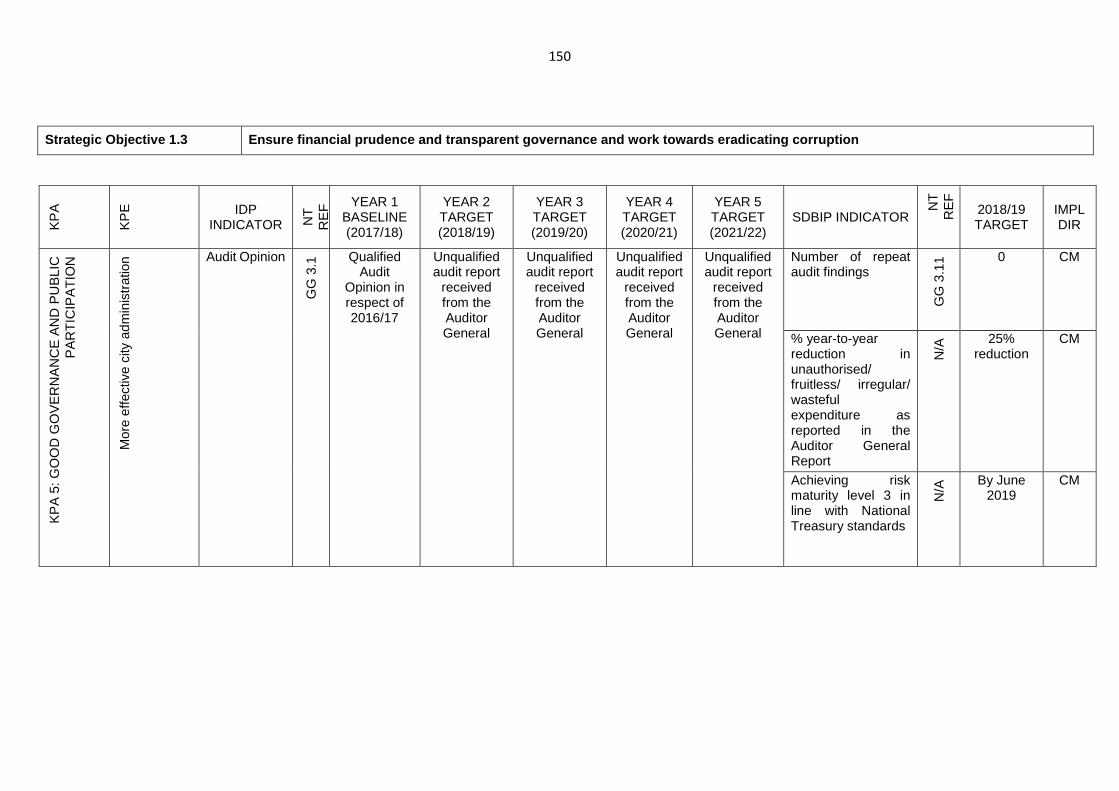
150
KP
A
KP
E
IDP INDICATOR N
T
RE
F YEAR 1
BASELINE (2017/18)
YEAR 2 TARGET (2018/19)
YEAR 3 TARGET (2019/20)
YEAR 4 TARGET (2020/21)
YEAR 5 TARGET (2021/22)
SDBIP INDICATOR
NT
R
EF
2018/19 TARGET
IMPL DIR
KP
A 5
: GO
OD
GO
VE
RN
AN
CE
AN
D P
UB
LIC
P
AR
TIC
IPA
TIO
N
Mor
e ef
fect
ive
city
adm
inis
trat
ion Audit Opinion
GG
3.1
Qualified Audit
Opinion in respect of 2016/17
Unqualified audit report
received from the Auditor General
Unqualified audit report
received from the Auditor General
Unqualified audit report
received from the Auditor General
Unqualified audit report
received from the Auditor General
Number of repeat audit findings
GG
3.1
1 0 CM
% year-to-year reduction in unauthorised/ fruitless/ irregular/ wasteful expenditure as reported in the Auditor General Report
N/A
25% reduction
CM
Achieving risk maturity level 3 in line with National Treasury standards
N/A
By June 2019
CM
Strategic Objective 1.3 Ensure financial prudence and transparent governanc e and work towards eradicating corruption
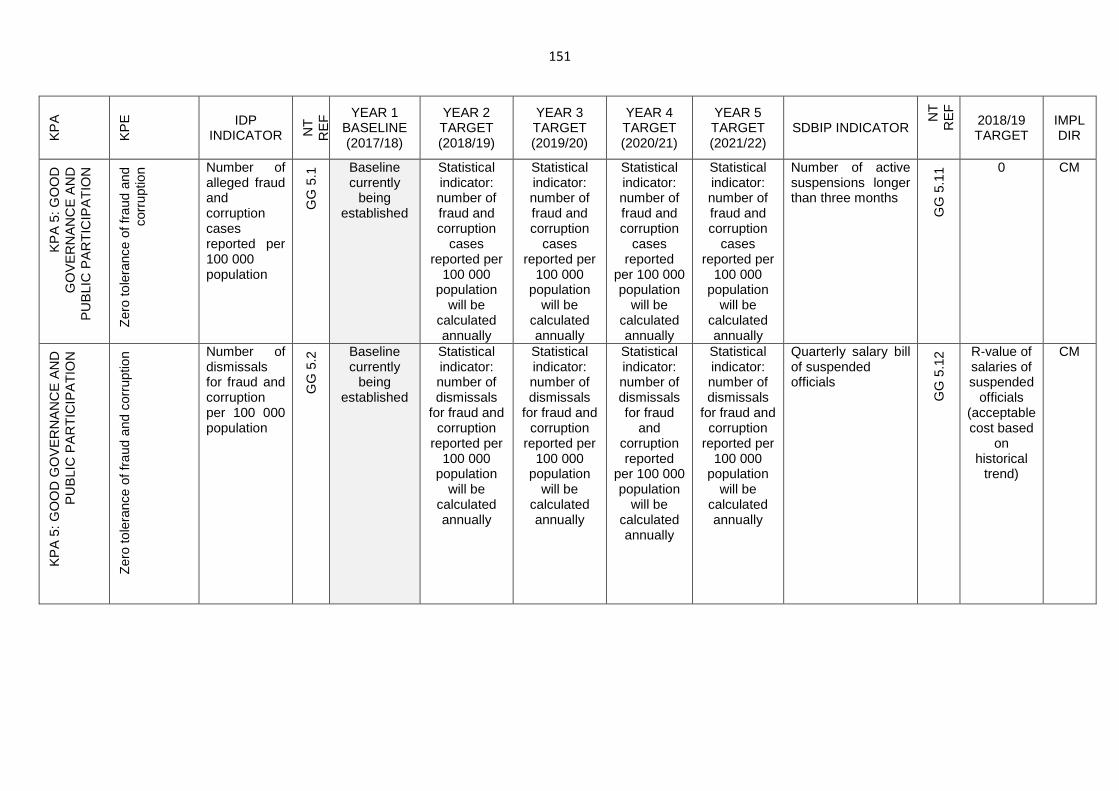
151
KP
A
KP
E
IDP INDICATOR N
T
RE
F YEAR 1
BASELINE (2017/18)
YEAR 2 TARGET (2018/19)
YEAR 3 TARGET (2019/20)
YEAR 4 TARGET (2020/21)
YEAR 5 TARGET (2021/22)
SDBIP INDICATOR
NT
R
EF
2018/19 TARGET
IMPL DIR
KP
A 5
: GO
OD
G
OV
ER
NA
NC
E A
ND
P
UB
LIC
PA
RT
ICIP
AT
ION
Zer
o to
lera
nce
of fr
aud
and
corr
uptio
n Number of alleged fraud and corruption cases reported per 100 000 population
GG
5.1
Baseline currently
being established
Statistical indicator: number of fraud and corruption
cases reported per
100 000 population
will be calculated annually
Statistical indicator: number of fraud and corruption
cases reported per
100 000 population
will be calculated annually
Statistical indicator: number of fraud and corruption
cases reported
per 100 000 population
will be calculated annually
Statistical indicator: number of fraud and corruption
cases reported per
100 000 population
will be calculated annually
Number of active suspensions longer than three months
GG
5.1
1 0 CM
KP
A 5
: GO
OD
GO
VE
RN
AN
CE
AN
D
PU
BLI
C P
AR
TIC
IPA
TIO
N
Zer
o to
lera
nce
of fr
aud
and
corr
uptio
n Number of dismissals for fraud and corruption per 100 000 population
GG
5.2
Baseline currently
being established
Statistical indicator: number of dismissals
for fraud and corruption
reported per 100 000
population will be
calculated annually
Statistical indicator: number of dismissals
for fraud and corruption
reported per 100 000
population will be
calculated annually
Statistical indicator: number of dismissals for fraud
and corruption reported
per 100 000 population
will be calculated annually
Statistical indicator: number of dismissals
for fraud and corruption
reported per 100 000
population will be
calculated annually
Quarterly salary bill of suspended officials
GG
5.1
2 R-value of salaries of suspended
officials (acceptable cost based
on historical
trend)
CM

152
KP
A
KP
E
IDP INDICATOR N
T
RE
F YEAR 1
BASELINE (2017/18)
YEAR 2 TARGET (2018/19)
YEAR 3 TARGET (2019/20)
YEAR 4 TARGET (2020/21)
YEAR 5 TARGET (2021/22)
SDBIP INDICATOR
NT
R
EF
2018/19 TARGET
IMPL DIR
KP
A 5
: GO
OD
GO
VE
RN
AN
CE
A
ND
PU
BLI
C P
AR
TIC
IPA
TIO
N
Zer
o to
lera
nce
of fr
aud
and
corr
uptio
n Number of convictions for bribery and/or corruption by city officials per 100 000 population
GG
5.3
Baseline currently
being established
Statistical indicator: number of convictions for bribery
and/or corruption by city officials per 100 000 population
will be calculated annually
Statistical indicator: number of convictions for bribery
and/or corruption by city officials per 100 000 population
will be calculated annually
Statistical indicator: number of convictions for bribery
and/or corruption
by city officials per
100 000 population
will be calculated annually
Statistical indicator: number of convictions for bribery
and/or corruption by city officials per 100 000 population
will be calculated annually
% of cases processed which have been reported through the ethics hotline and been identified for investigation
N/A
100% CM
KP
A 4
: MU
NIC
IPA
L F
INA
NC
IAL
VIA
BIL
ITY
A
ND
MA
NA
GE
ME
NT
Res
ourc
e E
ffici
ency
Growth rate in the annual rand amount spent on external rental fleet
N/A
2016/17 External
Non-Passenger
Vehicle Hire Vatable:
R24,176,404 External
Passenger Vehicle Hire
(No Vat): R174,524 Equipment
and Machinery:
R16,035,695
Zero growth rate
Zero growth rate
Zero growth rate
Zero growth rate
Number of fleet purchased N
/A 55
CM
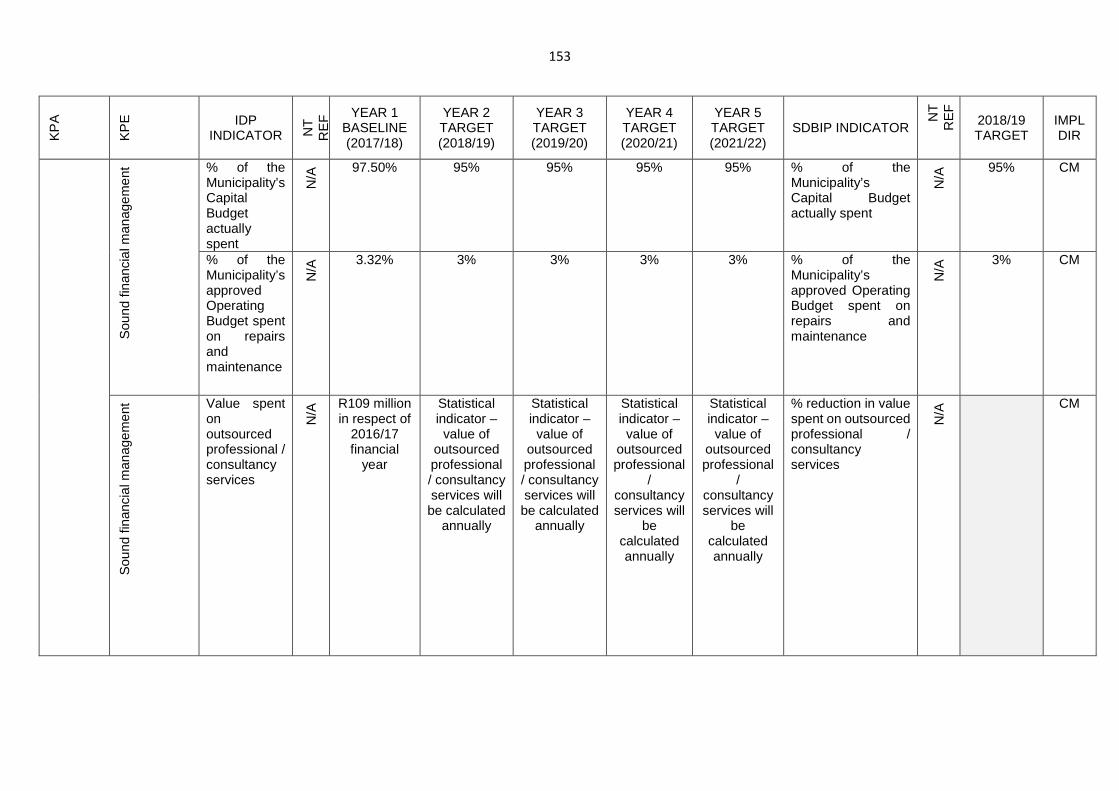
153
KP
A
KP
E
IDP INDICATOR N
T
RE
F YEAR 1
BASELINE (2017/18)
YEAR 2 TARGET (2018/19)
YEAR 3 TARGET (2019/20)
YEAR 4 TARGET (2020/21)
YEAR 5 TARGET (2021/22)
SDBIP INDICATOR
NT
R
EF
2018/19 TARGET
IMPL DIR
Sou
nd fi
nanc
ial m
anag
emen
t % of the Municipality’s Capital Budget actually spent
N/A
97.50% 95% 95% 95% 95% % of the Municipality’s Capital Budget actually spent
N/A
95% CM
% of the Municipality’s approved Operating Budget spent on repairs and maintenance
N/A
3.32% 3% 3% 3% 3% % of the Municipality’s approved Operating Budget spent on repairs and maintenance
N/A
3% CM
Sou
nd fi
nanc
ial m
anag
emen
t Value spent on outsourced professional / consultancy services
N/A
R109 million in respect of
2016/17 financial
year
Statistical indicator – value of
outsourced professional / consultancy services will be calculated
annually
Statistical indicator – value of
outsourced professional / consultancy services will be calculated
annually
Statistical indicator – value of
outsourced professional
/ consultancy services will
be calculated annually
Statistical indicator – value of
outsourced professional
/ consultancy services will
be calculated annually
% reduction in value spent on outsourced professional / consultancy services
N/A
CM
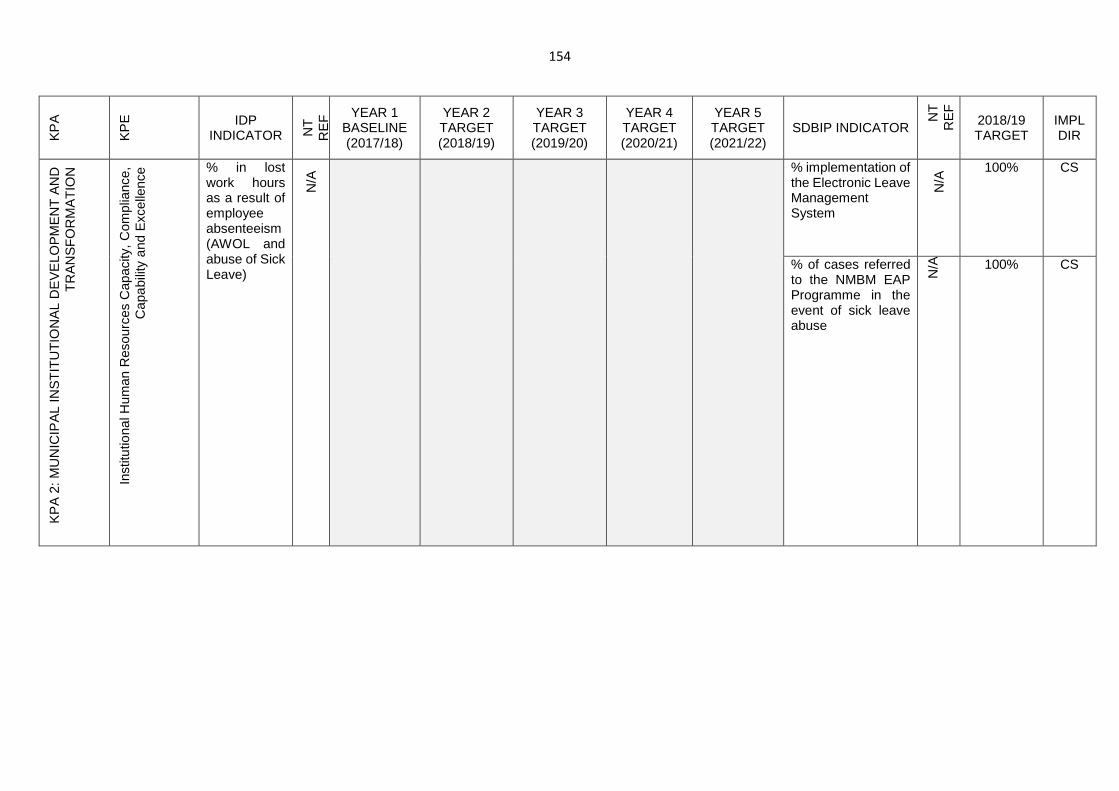
154
KP
A
KP
E
IDP INDICATOR N
T
RE
F YEAR 1
BASELINE (2017/18)
YEAR 2 TARGET (2018/19)
YEAR 3 TARGET (2019/20)
YEAR 4 TARGET (2020/21)
YEAR 5 TARGET (2021/22)
SDBIP INDICATOR
NT
R
EF
2018/19 TARGET
IMPL DIR
KP
A 2
: MU
NIC
IPA
L IN
ST
ITU
TIO
NA
L D
EV
ELO
PM
EN
T A
ND
T
RA
NS
FO
RM
AT
ION
Inst
itutio
nal H
uman
Res
ourc
es C
apac
ity, C
ompl
ianc
e,
Cap
abili
ty a
nd E
xcel
lenc
e % in lost work hours as a result of employee absenteeism (AWOL and abuse of Sick Leave)
N/A
% implementation of the Electronic Leave Management System
N/A
100% CS
% of cases referred to the NMBM EAP Programme in the event of sick leave abuse
N/A
100% CS
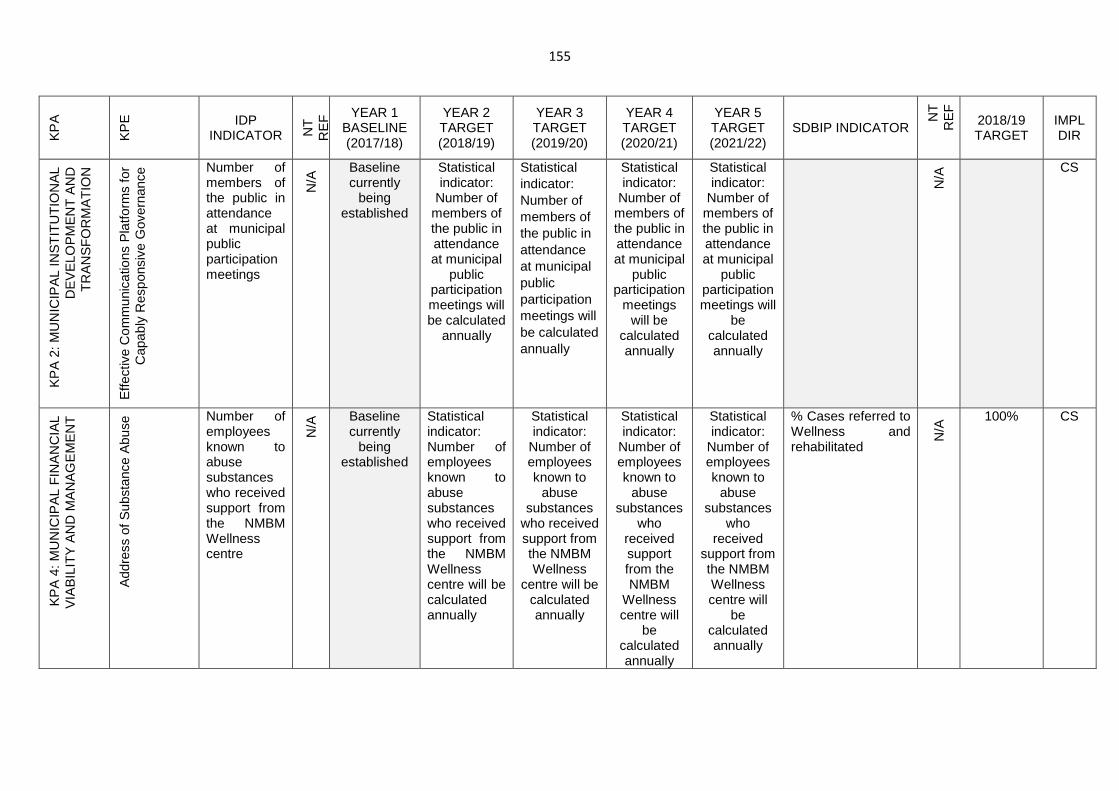
155
KP
A
KP
E
IDP INDICATOR N
T
RE
F YEAR 1
BASELINE (2017/18)
YEAR 2 TARGET (2018/19)
YEAR 3 TARGET (2019/20)
YEAR 4 TARGET (2020/21)
YEAR 5 TARGET (2021/22)
SDBIP INDICATOR
NT
R
EF
2018/19 TARGET
IMPL DIR
KP
A 2
: MU
NIC
IPA
L IN
ST
ITU
TIO
NA
L D
EV
ELO
PM
EN
T A
ND
T
RA
NS
FO
RM
AT
ION
Effe
ctiv
e C
omm
unic
atio
ns P
latfo
rms
for
Cap
ably
Res
pons
ive
Gov
erna
nce Number of
members of the public in attendance at municipal public participation meetings
N/A
Baseline currently
being established
Statistical indicator:
Number of members of the public in attendance at municipal
public participation meetings will be calculated
annually
Statistical indicator: Number of members of the public in attendance at municipal public participation meetings will be calculated annually
Statistical indicator:
Number of members of the public in attendance at municipal
public participation
meetings will be
calculated annually
Statistical indicator:
Number of members of the public in attendance at municipal
public participation meetings will
be calculated annually
N/A
CS
KP
A 4
: MU
NIC
IPA
L F
INA
NC
IAL
VIA
BIL
ITY
AN
D M
AN
AG
EM
EN
T
Add
ress
of S
ubst
ance
Abu
se Number of
employees known to abuse substances who received support from the NMBM Wellness centre
N/A
Baseline currently
being established
Statistical indicator: Number of employees known to abuse substances who received support from the NMBM Wellness centre will be calculated annually
Statistical indicator:
Number of employees known to
abuse substances
who received support from the NMBM Wellness
centre will be calculated annually
Statistical indicator:
Number of employees known to
abuse substances
who received support from the NMBM
Wellness centre will
be calculated annually
Statistical indicator:
Number of employees known to
abuse substances
who received
support from the NMBM Wellness centre will
be calculated annually
% Cases referred to Wellness and rehabilitated
N/A
100% CS
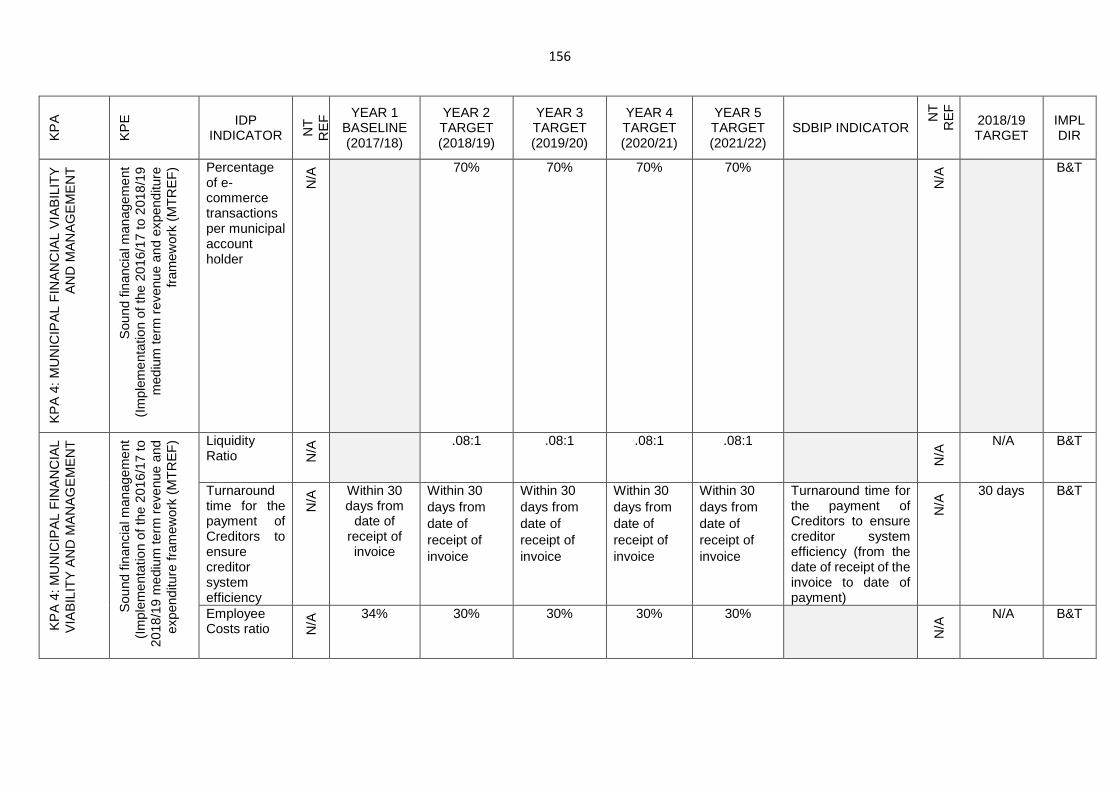
156
KP
A
KP
E
IDP INDICATOR N
T
RE
F YEAR 1
BASELINE (2017/18)
YEAR 2 TARGET (2018/19)
YEAR 3 TARGET (2019/20)
YEAR 4 TARGET (2020/21)
YEAR 5 TARGET (2021/22)
SDBIP INDICATOR
NT
R
EF
2018/19 TARGET
IMPL DIR
KP
A 4
: MU
NIC
IPA
L F
INA
NC
IAL
VIA
BIL
ITY
A
ND
MA
NA
GE
ME
NT
Sou
nd fi
nanc
ial m
anag
emen
t (I
mpl
emen
tatio
n of
the
2016
/17
to 2
018/
19
med
ium
term
rev
enue
and
exp
endi
ture
fr
amew
ork
(MT
RE
F) Percentage
of e-commerce transactions per municipal account holder
N/A
70% 70% 70% 70%
N/A
B&T
KP
A 4
: MU
NIC
IPA
L F
INA
NC
IAL
VIA
BIL
ITY
AN
D M
AN
AG
EM
EN
T
Sou
nd fi
nanc
ial m
anag
emen
t (I
mpl
emen
tatio
n of
the
2016
/17
to
2018
/19
med
ium
term
rev
enue
and
ex
pend
iture
fram
ewor
k (M
TR
EF
) Liquidity Ratio N
/A .08:1 .08:1 .08:1 .08:1
N/A
N/A B&T
Turnaround time for the payment of Creditors to ensure creditor system efficiency
N/A
Within 30 days from
date of receipt of invoice
Within 30 days from date of receipt of invoice
Within 30 days from date of receipt of invoice
Within 30 days from date of receipt of invoice
Within 30 days from date of receipt of invoice
Turnaround time for the payment of Creditors to ensure creditor system efficiency (from the date of receipt of the invoice to date of payment)
N/A
30 days B&T
Employee Costs ratio N
/A 34% 30% 30% 30% 30%
N/A
N/A B&T
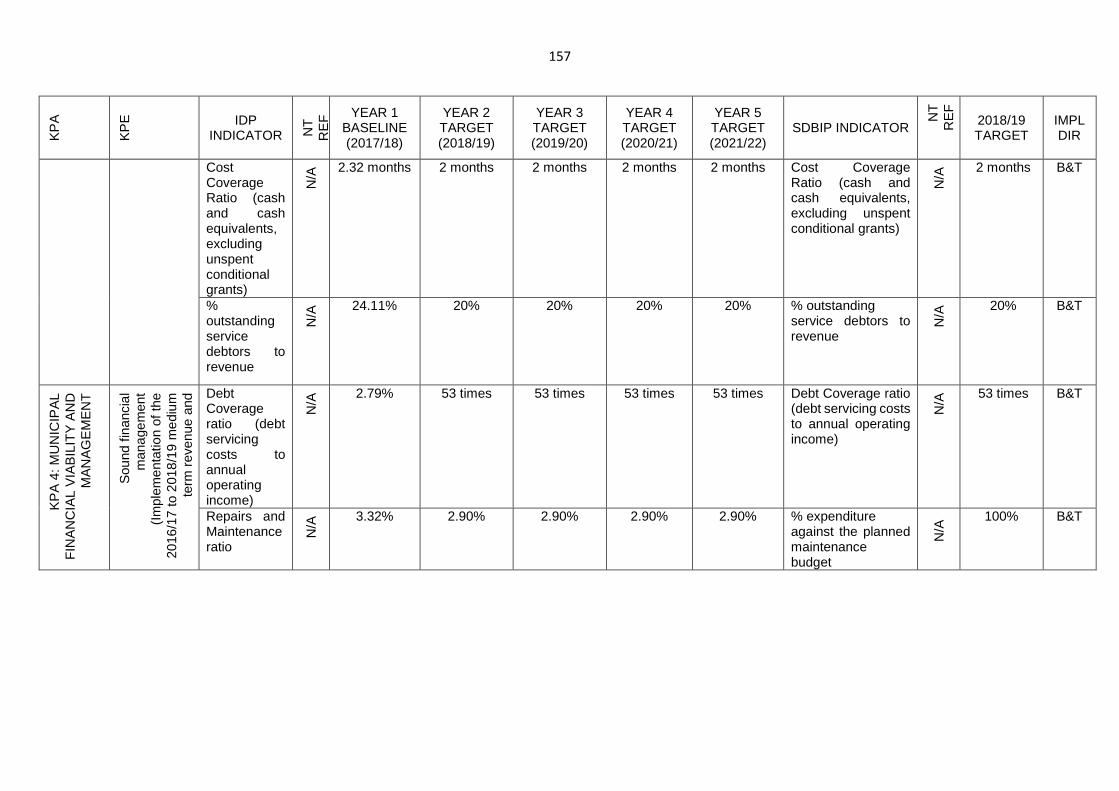
157
KP
A
KP
E
IDP INDICATOR N
T
RE
F YEAR 1
BASELINE (2017/18)
YEAR 2 TARGET (2018/19)
YEAR 3 TARGET (2019/20)
YEAR 4 TARGET (2020/21)
YEAR 5 TARGET (2021/22)
SDBIP INDICATOR
NT
R
EF
2018/19 TARGET
IMPL DIR
Cost Coverage Ratio (cash and cash equivalents, excluding unspent conditional grants)
N/A
2.32 months 2 months 2 months 2 months 2 months Cost Coverage Ratio (cash and cash equivalents, excluding unspent conditional grants)
N/A
2 months B&T
% outstanding service debtors to revenue
N/A
24.11% 20% 20% 20% 20% % outstanding service debtors to revenue
N/A
20% B&T
KP
A 4
: MU
NIC
IPA
L F
INA
NC
IAL
VIA
BIL
ITY
AN
D
MA
NA
GE
ME
NT
Sou
nd fi
nanc
ial
man
agem
ent
(Im
plem
enta
tion
of th
e 20
16/1
7 to
201
8/19
med
ium
te
rm r
even
ue a
nd
expe
nditu
re fr
amew
ork Debt
Coverage ratio (debt servicing costs to annual operating income)
N/A
2.79% 53 times 53 times 53 times 53 times Debt Coverage ratio (debt servicing costs to annual operating income)
N/A
53 times B&T
Repairs and Maintenance ratio
N/A
3.32% 2.90% 2.90% 2.90% 2.90% % expenditure against the planned maintenance budget
N/A
100% B&T
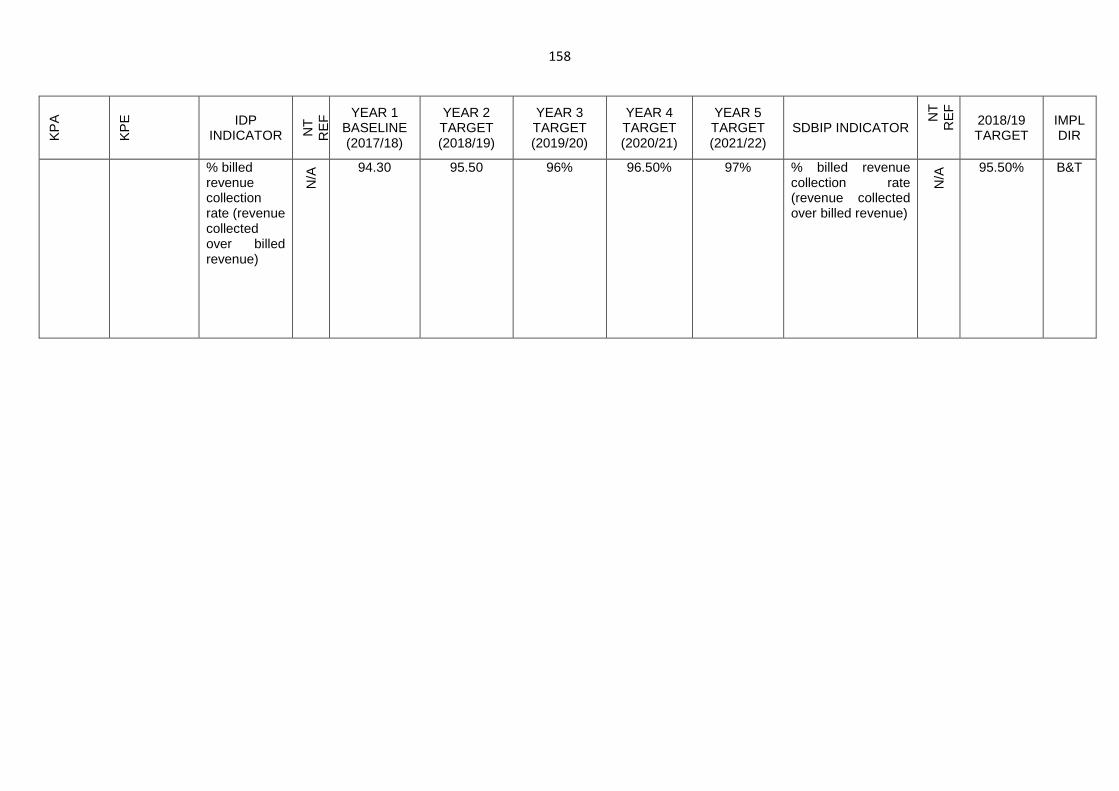
158
KP
A
KP
E
IDP INDICATOR N
T
RE
F YEAR 1
BASELINE (2017/18)
YEAR 2 TARGET (2018/19)
YEAR 3 TARGET (2019/20)
YEAR 4 TARGET (2020/21)
YEAR 5 TARGET (2021/22)
SDBIP INDICATOR
NT
R
EF
2018/19 TARGET
IMPL DIR
% billed revenue collection rate (revenue collected over billed revenue)
N/A
94.30 95.50 96% 96.50% 97% % billed revenue collection rate (revenue collected over billed revenue)
N/A
95.50% B&T
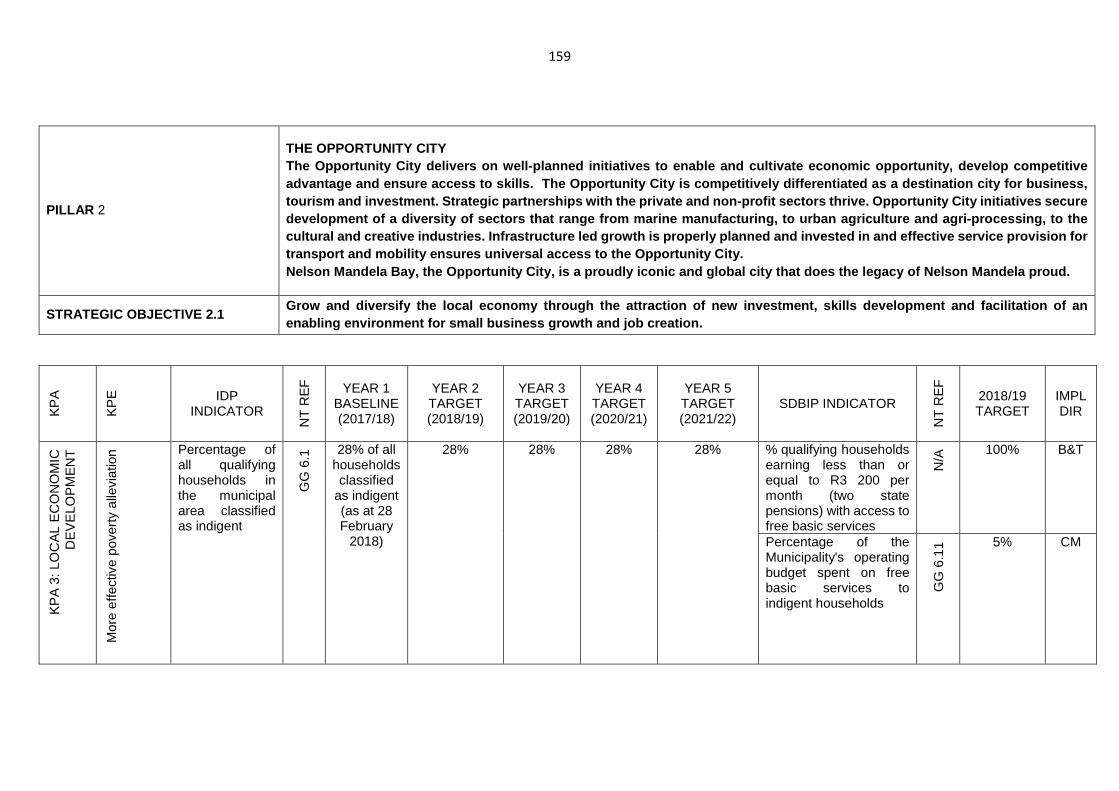
159
PILLAR 2
THE OPPORTUNITY CITY The Opportunity City delivers on well-planned initi atives to enable and cultivate economic opportunity , develop competitive advantage and ensure access to skills. The Opportu nity City is competitively differentiated as a dest ination city for business, tourism and investment. Strategic partnerships with the private and non-profit sectors thrive. Opportu nity City initiatives secure development of a diversity of sectors that range fr om marine manufacturing, to urban agriculture and a gri-processing, to the cultural and creative industries. Infrastructure le d growth is properly planned and invested in and ef fective service provision for transport and mobility ensures universal access to the Opportunity City. Nelson Mandela Bay, the Opportunity City, is a prou dly iconic and global city that does the legacy of Nelson Mandela proud.
STRATEGIC OBJECTIVE 2.1 Grow and diversify the local economy through the at traction of new investment, skills development and facilitation of an enabling environment for small business growth and job creation.
KP
A
KP
E
IDP INDICATOR
NT
RE
F
YEAR 1 BASELINE (2017/18)
YEAR 2 TARGET (2018/19)
YEAR 3 TARGET (2019/20)
YEAR 4 TARGET (2020/21)
YEAR 5 TARGET (2021/22)
SDBIP INDICATOR
NT
RE
F
2018/19 TARGET
IMPL DIR
KP
A 3
: LO
CA
L E
CO
NO
MIC
D
EV
ELO
PM
EN
T
Mor
e ef
fect
ive
pove
rty
alle
viat
ion Percentage of
all qualifying households in the municipal area classified as indigent
GG
6.1
28% of all households classified
as indigent (as at 28 February
2018)
28% 28% 28% 28% % qualifying households earning less than or equal to R3 200 per month (two state pensions) with access to free basic services
N/A
100% B&T
Percentage of the Municipality's operating budget spent on free basic services to indigent households
GG
6.1
1 5% CM
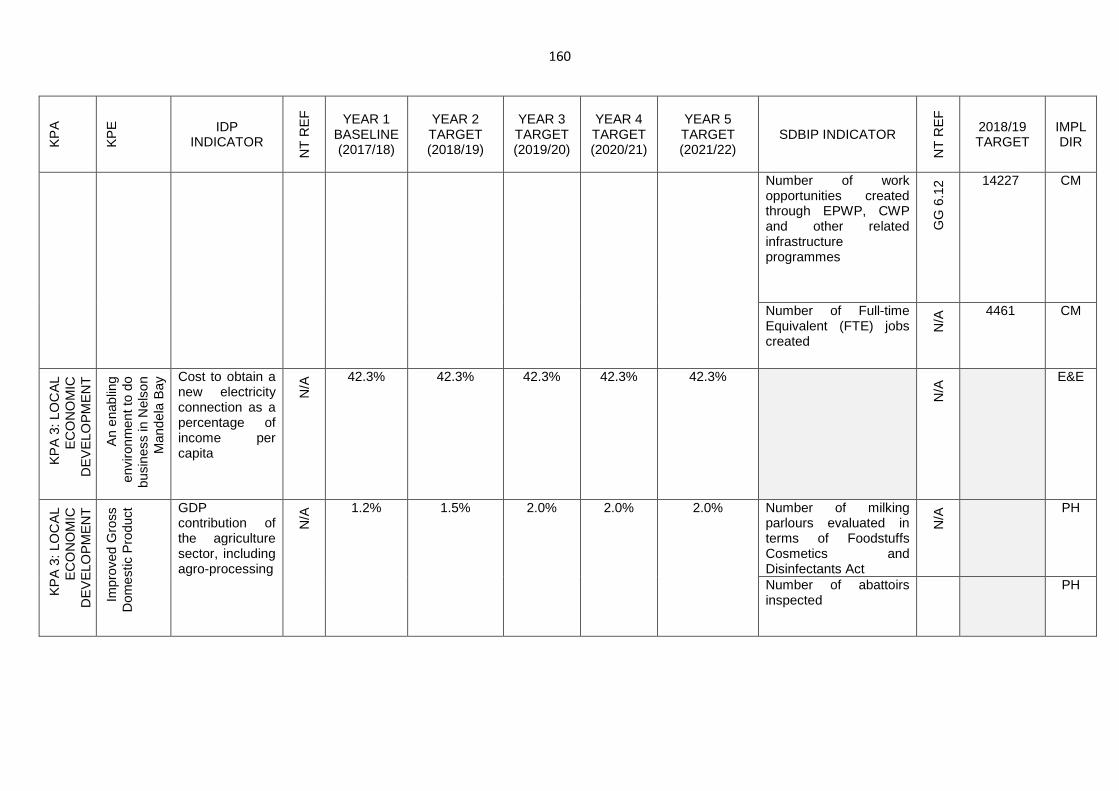
160
KP
A
KP
E
IDP INDICATOR
NT
RE
F
YEAR 1 BASELINE (2017/18)
YEAR 2 TARGET (2018/19)
YEAR 3 TARGET (2019/20)
YEAR 4 TARGET (2020/21)
YEAR 5 TARGET (2021/22)
SDBIP INDICATOR
NT
RE
F
2018/19 TARGET
IMPL DIR
Number of work opportunities created through EPWP, CWP and other related infrastructure programmes
GG
6.1
2 14227 CM
Number of Full-time Equivalent (FTE) jobs created
N/A
4461 CM
KP
A 3
: LO
CA
L E
CO
NO
MIC
D
EV
ELO
PM
EN
T
An
enab
ling
envi
ronm
ent t
o do
bu
sine
ss in
Nel
son
Man
dela
Bay
Cost to obtain a new electricity connection as a percentage of income per capita
N/A
42.3% 42.3% 42.3% 42.3% 42.3%
N/A
E&E
KP
A 3
: LO
CA
L E
CO
NO
MIC
D
EV
ELO
PM
EN
T
Impr
oved
Gro
ss
Dom
estic
Pro
duct
GDP contribution of the agriculture sector, including agro-processing
N/A
1.2% 1.5% 2.0% 2.0% 2.0% Number of milking parlours evaluated in terms of Foodstuffs Cosmetics and Disinfectants Act
N/A
PH
Number of abattoirs inspected
PH
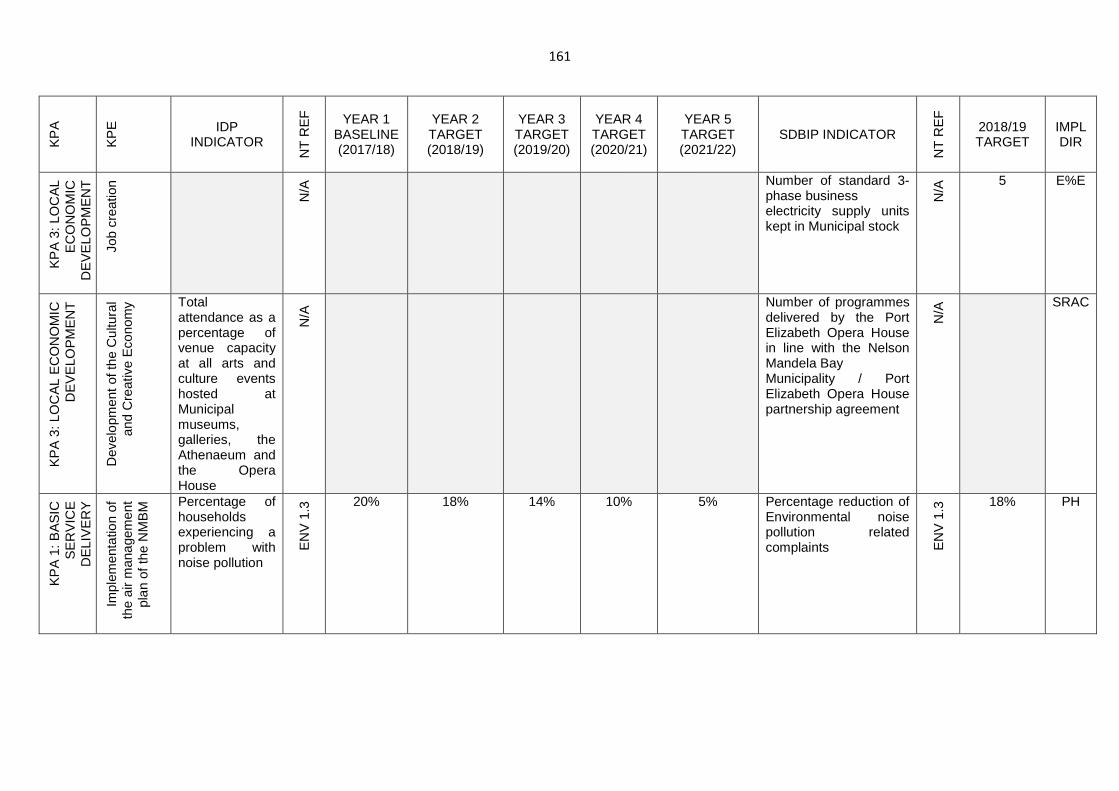
161
KP
A
KP
E
IDP INDICATOR
NT
RE
F
YEAR 1 BASELINE (2017/18)
YEAR 2 TARGET (2018/19)
YEAR 3 TARGET (2019/20)
YEAR 4 TARGET (2020/21)
YEAR 5 TARGET (2021/22)
SDBIP INDICATOR
NT
RE
F
2018/19 TARGET
IMPL DIR
KP
A 3
: LO
CA
L E
CO
NO
MIC
D
EV
ELO
PM
EN
T
Job
crea
tion
N/A
Number of standard 3-phase business electricity supply units kept in Municipal stock
N/A
5 E%E
KP
A 3
: LO
CA
L E
CO
NO
MIC
D
EV
ELO
PM
EN
T
Dev
elop
men
t of t
he C
ultu
ral
and
Cre
ativ
e E
cono
my Total
attendance as a percentage of venue capacity at all arts and culture events hosted at Municipal museums, galleries, the Athenaeum and the Opera House
N/A
Number of programmes delivered by the Port Elizabeth Opera House in line with the Nelson Mandela Bay Municipality / Port Elizabeth Opera House partnership agreement
N/A
SRAC
KP
A 1
: BA
SIC
S
ER
VIC
E
DE
LIV
ER
Y
Impl
emen
tatio
n of
th
e ai
r m
anag
emen
t pl
an o
f the
NM
BM
Percentage of households experiencing a problem with noise pollution
EN
V 1
.3 20% 18% 14% 10% 5% Percentage reduction of
Environmental noise pollution related complaints E
NV
1.3
18% PH
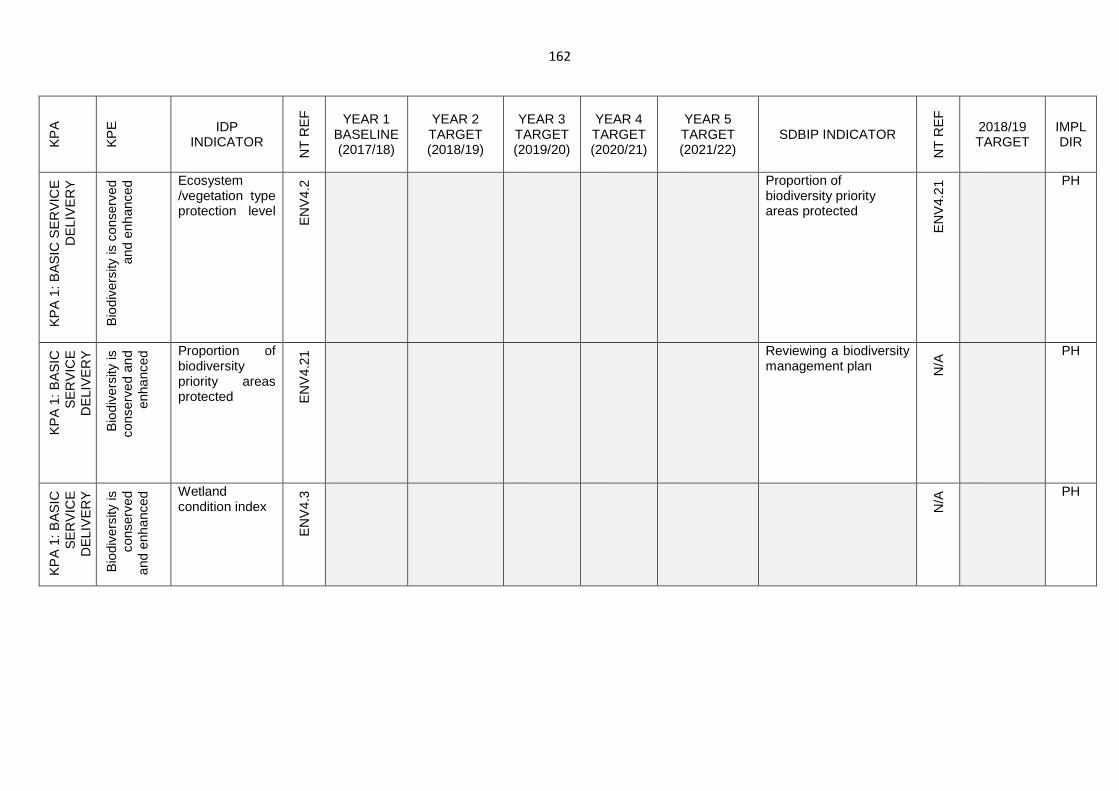
162
KP
A
KP
E
IDP INDICATOR
NT
RE
F
YEAR 1 BASELINE (2017/18)
YEAR 2 TARGET (2018/19)
YEAR 3 TARGET (2019/20)
YEAR 4 TARGET (2020/21)
YEAR 5 TARGET (2021/22)
SDBIP INDICATOR
NT
RE
F
2018/19 TARGET
IMPL DIR
KP
A 1
: BA
SIC
SE
RV
ICE
D
ELI
VE
RY
Bio
dive
rsity
is c
onse
rved
an
d en
hanc
ed Ecosystem
/vegetation type protection level
EN
V4.
2
Proportion of biodiversity priority areas protected
EN
V4.
21
PH
KP
A 1
: BA
SIC
S
ER
VIC
E
DE
LIV
ER
Y
Bio
dive
rsity
is
cons
erve
d an
d en
hanc
ed Proportion of
biodiversity priority areas protected E
NV
4.21
Reviewing a biodiversity management plan N
/A
PH
KP
A 1
: BA
SIC
S
ER
VIC
E
DE
LIV
ER
Y
Bio
dive
rsity
is
cons
erve
d an
d en
hanc
ed Wetland
condition index
EN
V4.
3
N/A
PH
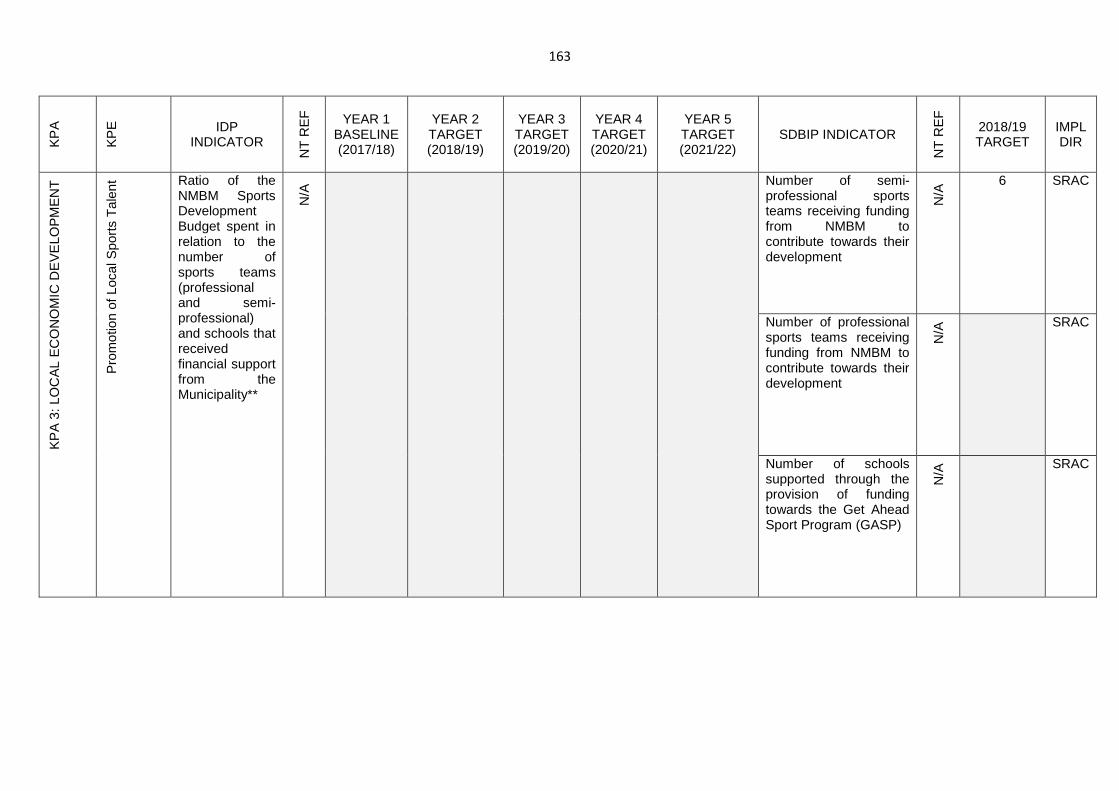
163
KP
A
KP
E
IDP INDICATOR
NT
RE
F
YEAR 1 BASELINE (2017/18)
YEAR 2 TARGET (2018/19)
YEAR 3 TARGET (2019/20)
YEAR 4 TARGET (2020/21)
YEAR 5 TARGET (2021/22)
SDBIP INDICATOR
NT
RE
F
2018/19 TARGET
IMPL DIR
KP
A 3
: LO
CA
L E
CO
NO
MIC
DE
VE
LOP
ME
NT
Pro
mot
ion
of L
ocal
Spo
rts
Tal
ent Ratio of the
NMBM Sports Development Budget spent in relation to the number of sports teams (professional and semi-professional) and schools that received financial support from the Municipality**
N/A
Number of semi-professional sports teams receiving funding from NMBM to contribute towards their development
N/A
6 SRAC
Number of professional sports teams receiving funding from NMBM to contribute towards their development
N/A
SRAC
Number of schools supported through the provision of funding towards the Get Ahead Sport Program (GASP)
N/A
SRAC
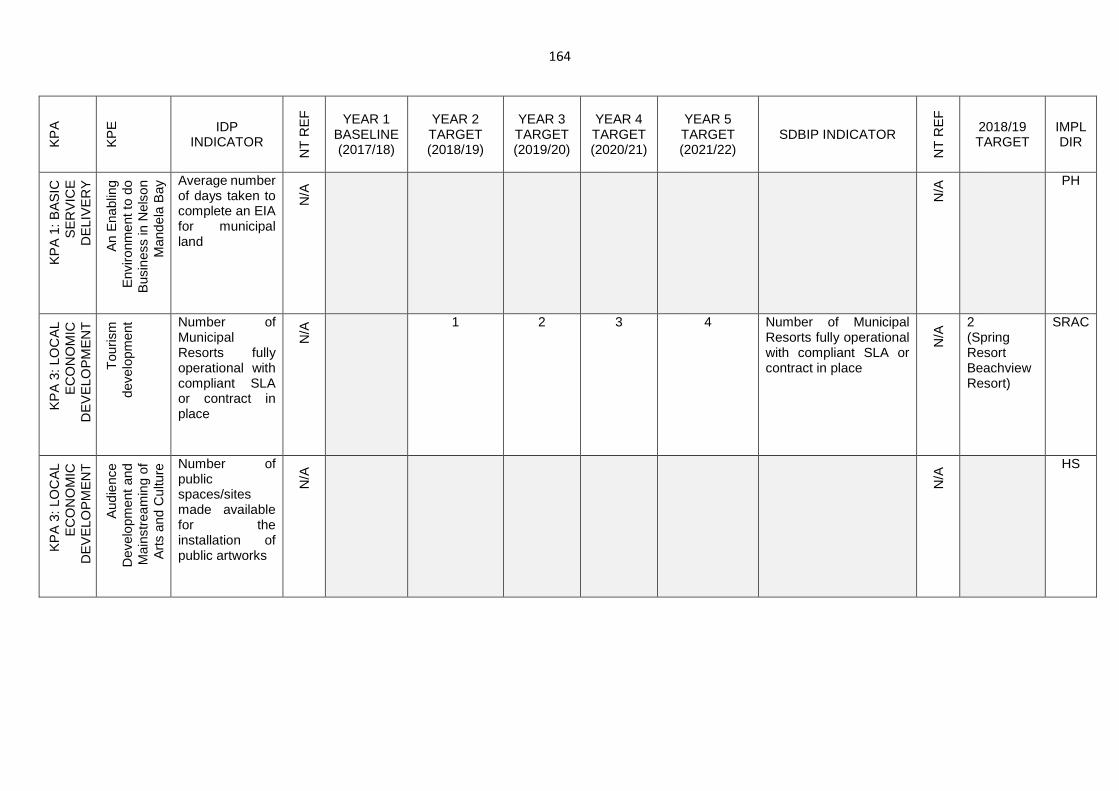
164
KP
A
KP
E
IDP INDICATOR
NT
RE
F
YEAR 1 BASELINE (2017/18)
YEAR 2 TARGET (2018/19)
YEAR 3 TARGET (2019/20)
YEAR 4 TARGET (2020/21)
YEAR 5 TARGET (2021/22)
SDBIP INDICATOR
NT
RE
F
2018/19 TARGET
IMPL DIR
KP
A 1
: BA
SIC
S
ER
VIC
E
DE
LIV
ER
Y
An
Ena
blin
g E
nviro
nmen
t to
do
Bus
ines
s in
Nel
son
Man
dela
Bay
Average number of days taken to complete an EIA for municipal land
N/A
N/A
PH
KP
A 3
: LO
CA
L E
CO
NO
MIC
D
EV
ELO
PM
EN
T
Tou
rism
de
velo
pmen
t Number of Municipal Resorts fully operational with compliant SLA or contract in place
N/A
1 2 3 4 Number of Municipal Resorts fully operational with compliant SLA or contract in place
N/A
2 (Spring Resort Beachview Resort)
SRAC
KP
A 3
: LO
CA
L E
CO
NO
MIC
D
EV
ELO
PM
EN
T
Aud
ienc
e D
evel
opm
ent a
nd
Mai
nstr
eam
ing
of
Art
s an
d C
ultu
re Number of
public spaces/sites made available for the installation of public artworks
N/A
N/A
HS
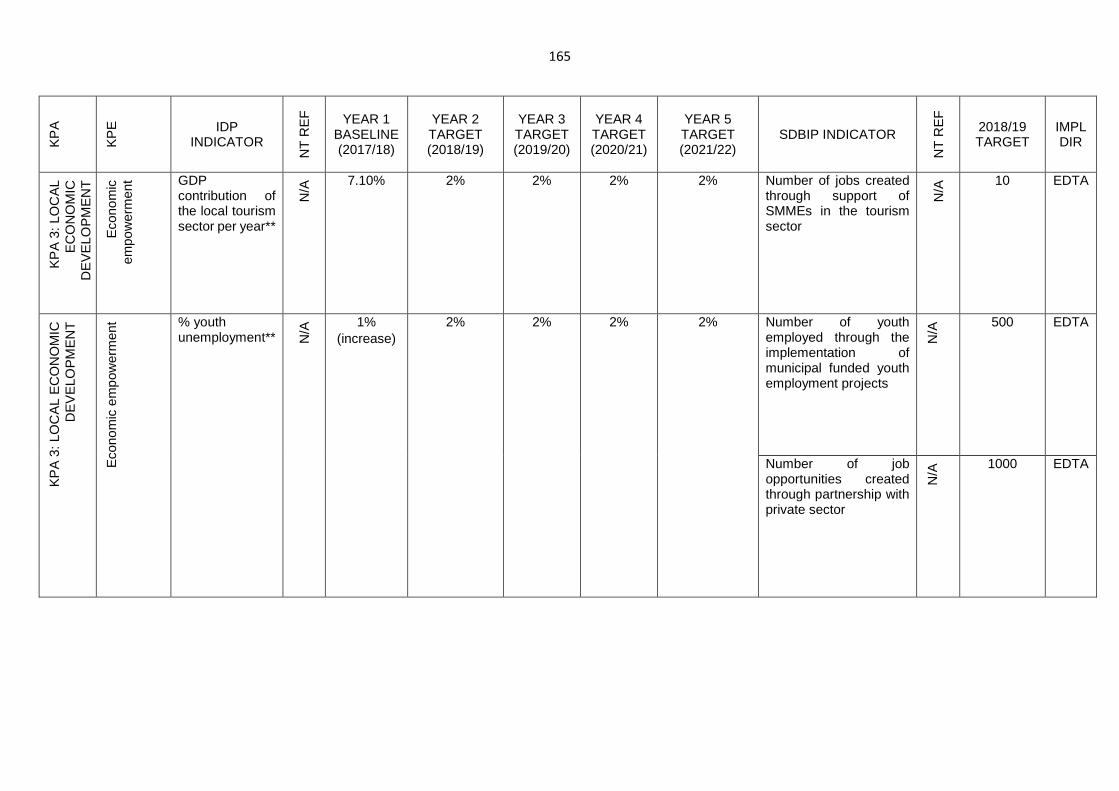
165
KP
A
KP
E
IDP INDICATOR
NT
RE
F
YEAR 1 BASELINE (2017/18)
YEAR 2 TARGET (2018/19)
YEAR 3 TARGET (2019/20)
YEAR 4 TARGET (2020/21)
YEAR 5 TARGET (2021/22)
SDBIP INDICATOR
NT
RE
F
2018/19 TARGET
IMPL DIR
KP
A 3
: LO
CA
L E
CO
NO
MIC
D
EV
ELO
PM
EN
T
Eco
nom
ic
empo
wer
men
t GDP contribution of the local tourism sector per year**
N/A
7.10% 2% 2% 2% 2% Number of jobs created through support of SMMEs in the tourism sector
N/A
10 EDTA
KP
A 3
: LO
CA
L E
CO
NO
MIC
D
EV
ELO
PM
EN
T
Eco
nom
ic e
mpo
wer
men
t % youth unemployment** N
/A 1%
(increase)
2%
2%
2%
2%
Number of youth employed through the implementation of municipal funded youth employment projects
N/A
500 EDTA
Number of job opportunities created through partnership with private sector
N/A
1000 EDTA
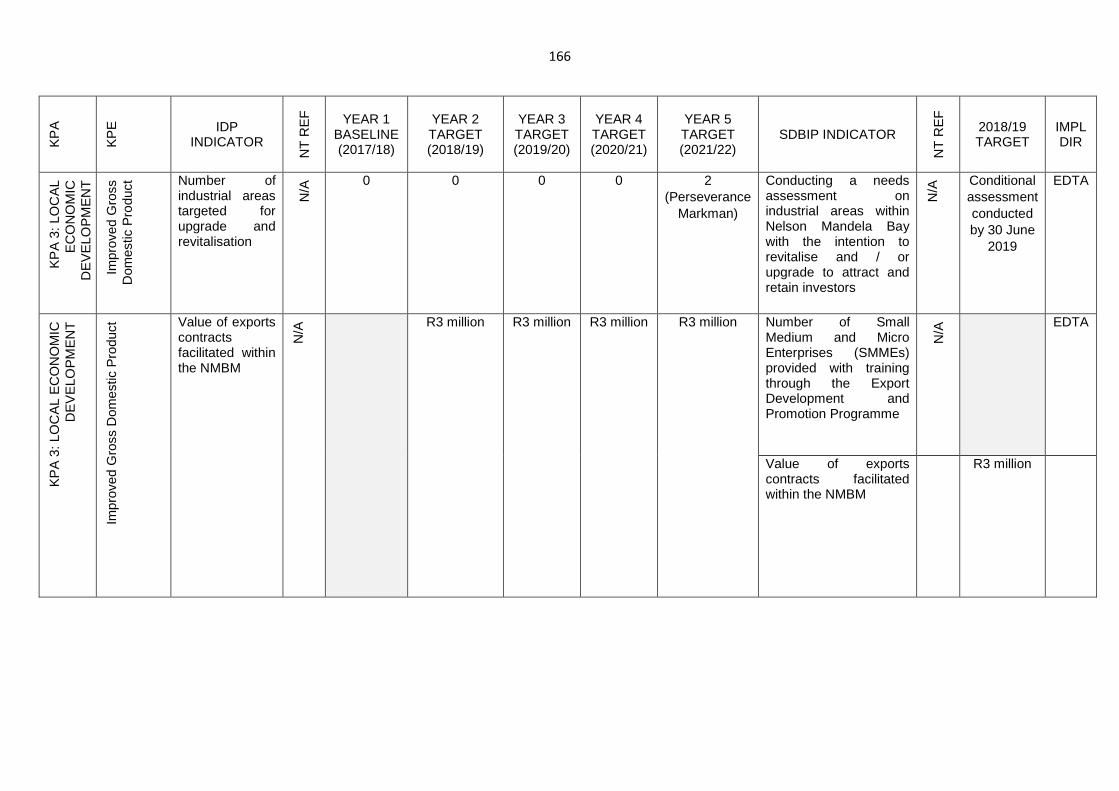
166
KP
A
KP
E
IDP INDICATOR
NT
RE
F
YEAR 1 BASELINE (2017/18)
YEAR 2 TARGET (2018/19)
YEAR 3 TARGET (2019/20)
YEAR 4 TARGET (2020/21)
YEAR 5 TARGET (2021/22)
SDBIP INDICATOR
NT
RE
F
2018/19 TARGET
IMPL DIR
KP
A 3
: LO
CA
L E
CO
NO
MIC
D
EV
ELO
PM
EN
T
Impr
oved
Gro
ss
Dom
estic
Pro
duct
Number of industrial areas targeted for upgrade and revitalisation
N/A
0 0 0 0 2 (Perseverance
Markman)
Conducting a needs assessment on industrial areas within Nelson Mandela Bay with the intention to revitalise and / or upgrade to attract and retain investors
N/A
Conditional assessment conducted by 30 June
2019
EDTA
KP
A 3
: LO
CA
L E
CO
NO
MIC
D
EV
ELO
PM
EN
T
Impr
oved
Gro
ss D
omes
tic P
rodu
ct Value of exports
contracts facilitated within the NMBM
N/A
R3 million R3 million R3 million R3 million Number of Small Medium and Micro Enterprises (SMMEs) provided with training through the Export Development and Promotion Programme
N/A
EDTA
Value of exports contracts facilitated within the NMBM
R3 million
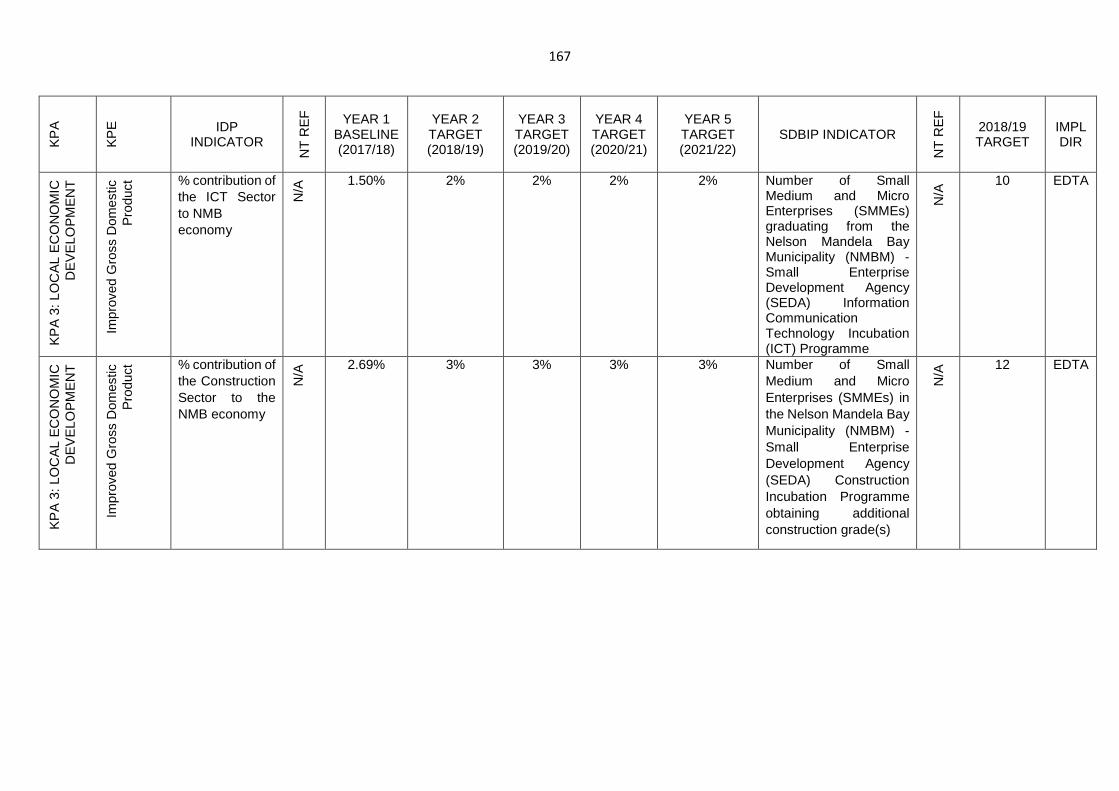
167
KP
A
KP
E
IDP INDICATOR
NT
RE
F
YEAR 1 BASELINE (2017/18)
YEAR 2 TARGET (2018/19)
YEAR 3 TARGET (2019/20)
YEAR 4 TARGET (2020/21)
YEAR 5 TARGET (2021/22)
SDBIP INDICATOR
NT
RE
F
2018/19 TARGET
IMPL DIR
KP
A 3
: LO
CA
L E
CO
NO
MIC
D
EV
ELO
PM
EN
T
Impr
oved
Gro
ss D
omes
tic
Pro
duct
% contribution of the ICT Sector to NMB economy
N/A
1.50% 2% 2% 2% 2% Number of Small Medium and Micro Enterprises (SMMEs) graduating from the Nelson Mandela Bay Municipality (NMBM) - Small Enterprise Development Agency (SEDA) Information Communication Technology Incubation (ICT) Programme
N/A
10 EDTA
KP
A 3
: LO
CA
L E
CO
NO
MIC
D
EV
ELO
PM
EN
T
Impr
oved
Gro
ss D
omes
tic
Pro
duct
% contribution of the Construction Sector to the NMB economy
N/A
2.69% 3% 3% 3% 3% Number of Small Medium and Micro Enterprises (SMMEs) in the Nelson Mandela Bay Municipality (NMBM) - Small Enterprise Development Agency (SEDA) Construction Incubation Programme obtaining additional construction grade(s)
N/A
12 EDTA
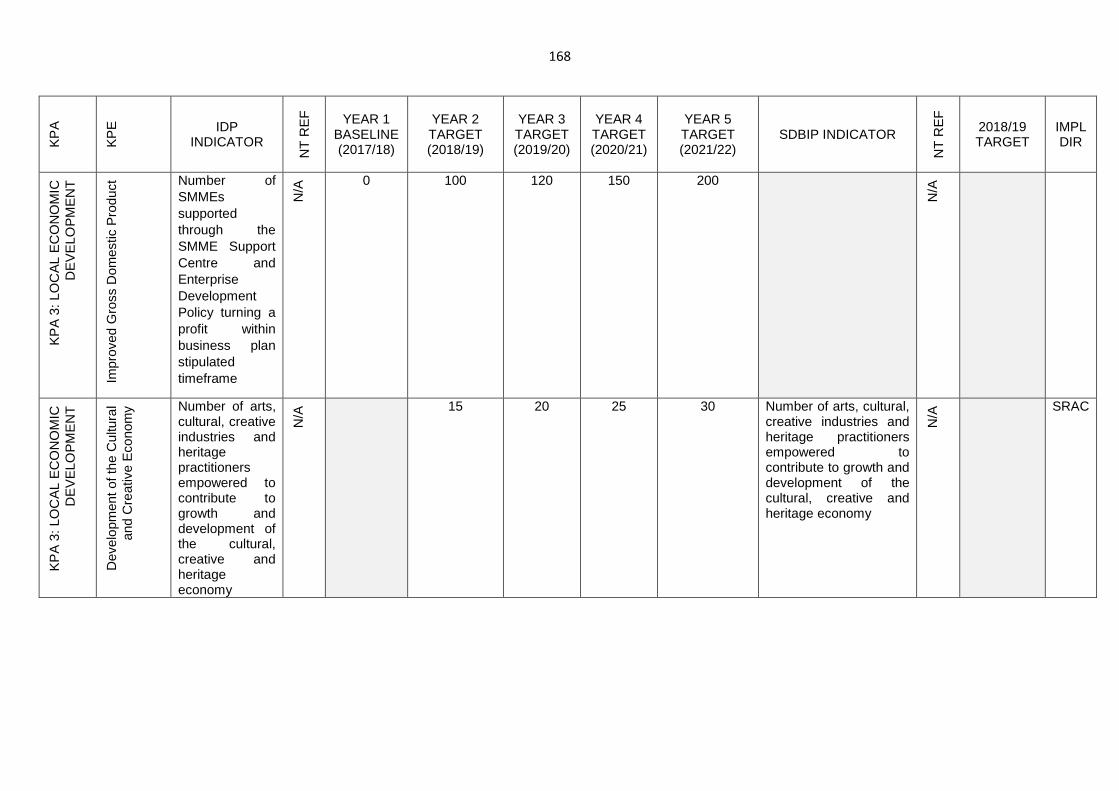
168
KP
A
KP
E
IDP INDICATOR
NT
RE
F
YEAR 1 BASELINE (2017/18)
YEAR 2 TARGET (2018/19)
YEAR 3 TARGET (2019/20)
YEAR 4 TARGET (2020/21)
YEAR 5 TARGET (2021/22)
SDBIP INDICATOR
NT
RE
F
2018/19 TARGET
IMPL DIR
KP
A 3
: LO
CA
L E
CO
NO
MIC
D
EV
ELO
PM
EN
T
Impr
oved
Gro
ss D
omes
tic P
rodu
ct Number of
SMMEs supported through the SMME Support Centre and Enterprise Development Policy turning a profit within business plan stipulated timeframe
N/A
0 100 120 150 200
N/A
KP
A 3
: LO
CA
L E
CO
NO
MIC
D
EV
ELO
PM
EN
T
Dev
elop
men
t of t
he C
ultu
ral
and
Cre
ativ
e E
cono
my Number of arts,
cultural, creative industries and heritage practitioners empowered to contribute to growth and development of the cultural, creative and heritage economy
N/A
15 20 25 30 Number of arts, cultural, creative industries and heritage practitioners empowered to contribute to growth and development of the cultural, creative and heritage economy
N/A
SRAC
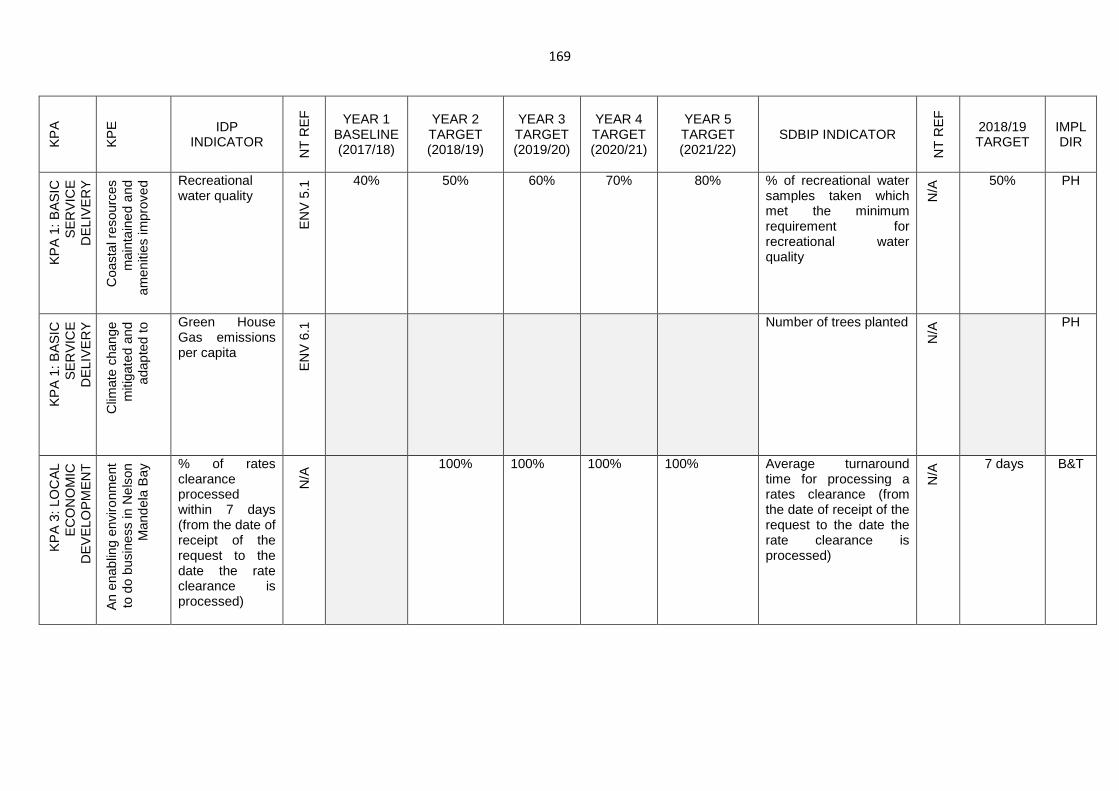
169
KP
A
KP
E
IDP INDICATOR
NT
RE
F
YEAR 1 BASELINE (2017/18)
YEAR 2 TARGET (2018/19)
YEAR 3 TARGET (2019/20)
YEAR 4 TARGET (2020/21)
YEAR 5 TARGET (2021/22)
SDBIP INDICATOR
NT
RE
F
2018/19 TARGET
IMPL DIR
KP
A 1
: BA
SIC
S
ER
VIC
E
DE
LIV
ER
Y
Coa
stal
res
ourc
es
mai
ntai
ned
and
amen
ities
impr
oved
Recreational water quality E
NV
5.1
40% 50% 60% 70% 80% % of recreational water samples taken which met the minimum requirement for recreational water quality
N/A
50% PH
KP
A 1
: BA
SIC
S
ER
VIC
E
DE
LIV
ER
Y
Clim
ate
chan
ge
miti
gate
d an
d ad
apte
d to
Green House Gas emissions per capita
EN
V 6
.1
Number of trees planted
N/A
PH
KP
A 3
: LO
CA
L E
CO
NO
MIC
D
EV
ELO
PM
EN
T
An
enab
ling
envi
ronm
ent
to d
o bu
sine
ss in
Nel
son
Man
dela
Bay
% of rates clearance processed within 7 days (from the date of receipt of the request to the date the rate clearance is processed)
N/A
100% 100% 100% 100% Average turnaround time for processing a rates clearance (from the date of receipt of the request to the date the rate clearance is processed)
N/A
7 days B&T
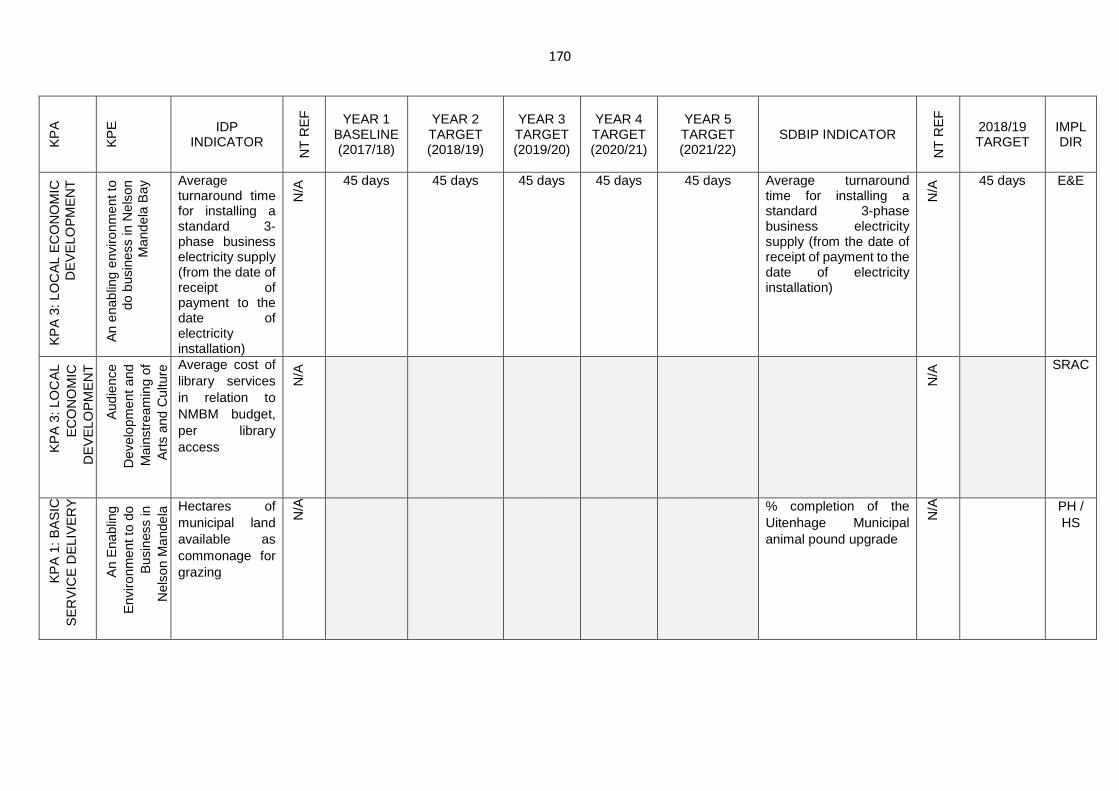
170
KP
A
KP
E
IDP INDICATOR
NT
RE
F
YEAR 1 BASELINE (2017/18)
YEAR 2 TARGET (2018/19)
YEAR 3 TARGET (2019/20)
YEAR 4 TARGET (2020/21)
YEAR 5 TARGET (2021/22)
SDBIP INDICATOR
NT
RE
F
2018/19 TARGET
IMPL DIR
KP
A 3
: LO
CA
L E
CO
NO
MIC
D
EV
ELO
PM
EN
T
An
enab
ling
envi
ronm
ent t
o do
bus
ines
s in
Nel
son
Man
dela
Bay
Average turnaround time for installing a standard 3-phase business electricity supply (from the date of receipt of payment to the date of electricity installation)
N/A
45 days 45 days 45 days 45 days 45 days Average turnaround time for installing a standard 3-phase business electricity supply (from the date of receipt of payment to the date of electricity installation)
N/A
45 days E&E
KP
A 3
: LO
CA
L E
CO
NO
MIC
D
EV
ELO
PM
EN
T
Aud
ienc
e D
evel
opm
ent a
nd
Mai
nstr
eam
ing
of
Art
s an
d C
ultu
re Average cost of
library services in relation to NMBM budget, per library access
N/A
N/A
SRAC
KP
A 1
: BA
SIC
S
ER
VIC
E D
ELI
VE
RY
An
Ena
blin
g E
nviro
nmen
t to
do
Bus
ines
s in
N
elso
n M
ande
la Hectares of
municipal land available as commonage for grazing
N/A
% completion of the Uitenhage Municipal animal pound upgrade
N/A
PH / HS
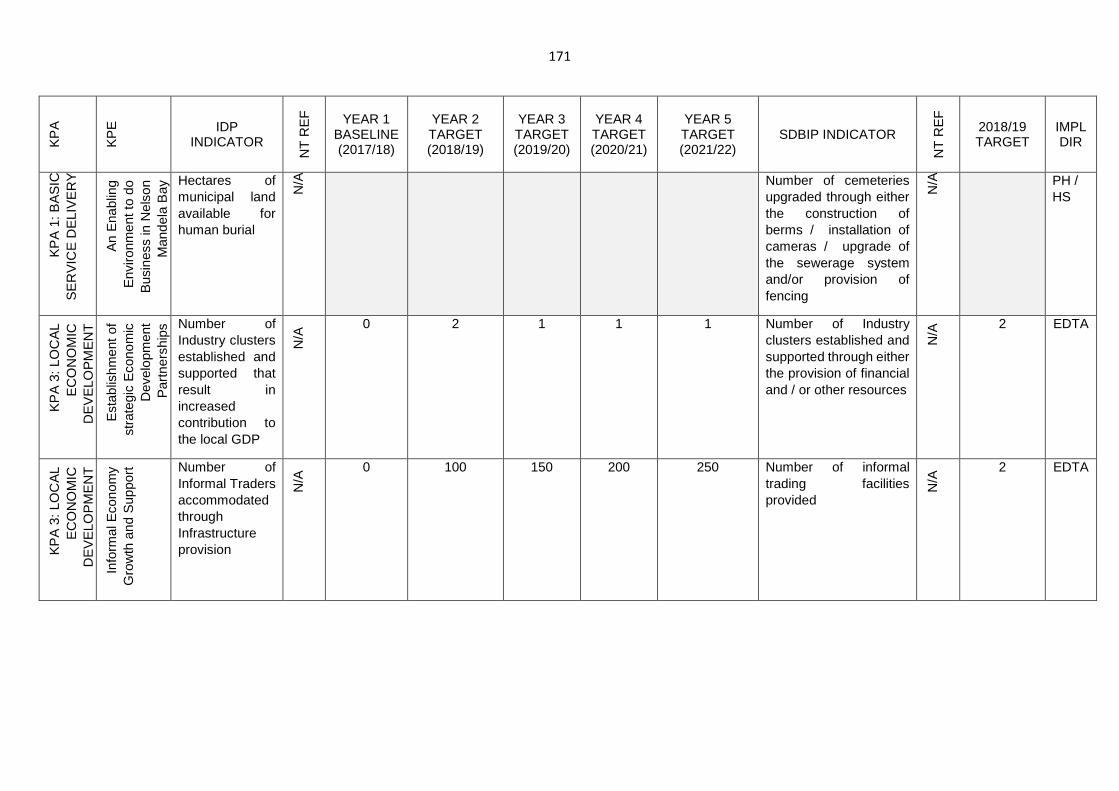
171
KP
A
KP
E
IDP INDICATOR
NT
RE
F
YEAR 1 BASELINE (2017/18)
YEAR 2 TARGET (2018/19)
YEAR 3 TARGET (2019/20)
YEAR 4 TARGET (2020/21)
YEAR 5 TARGET (2021/22)
SDBIP INDICATOR
NT
RE
F
2018/19 TARGET
IMPL DIR
KP
A 1
: BA
SIC
S
ER
VIC
E D
ELI
VE
RY
An
Ena
blin
g E
nviro
nmen
t to
do
Bus
ines
s in
Nel
son
Man
dela
Bay
Hectares of municipal land available for human burial
N/A
Number of cemeteries upgraded through either the construction of berms / installation of cameras / upgrade of the sewerage system and/or provision of fencing
N/A
PH / HS
KP
A 3
: LO
CA
L E
CO
NO
MIC
D
EV
ELO
PM
EN
T
Est
ablis
hmen
t of
stra
tegi
c E
cono
mic
D
evel
opm
ent
Par
tner
ship
s Number of Industry clusters established and supported that result in increased contribution to the local GDP
N/A
0 2 1 1 1 Number of Industry clusters established and supported through either the provision of financial and / or other resources
N/A
2 EDTA
KP
A 3
: LO
CA
L E
CO
NO
MIC
D
EV
ELO
PM
EN
T
Info
rmal
Eco
nom
y G
row
th a
nd S
uppo
rt Number of
Informal Traders accommodated through Infrastructure provision
N/A
0 100 150 200 250 Number of informal trading facilities provided
N/A
2 EDTA
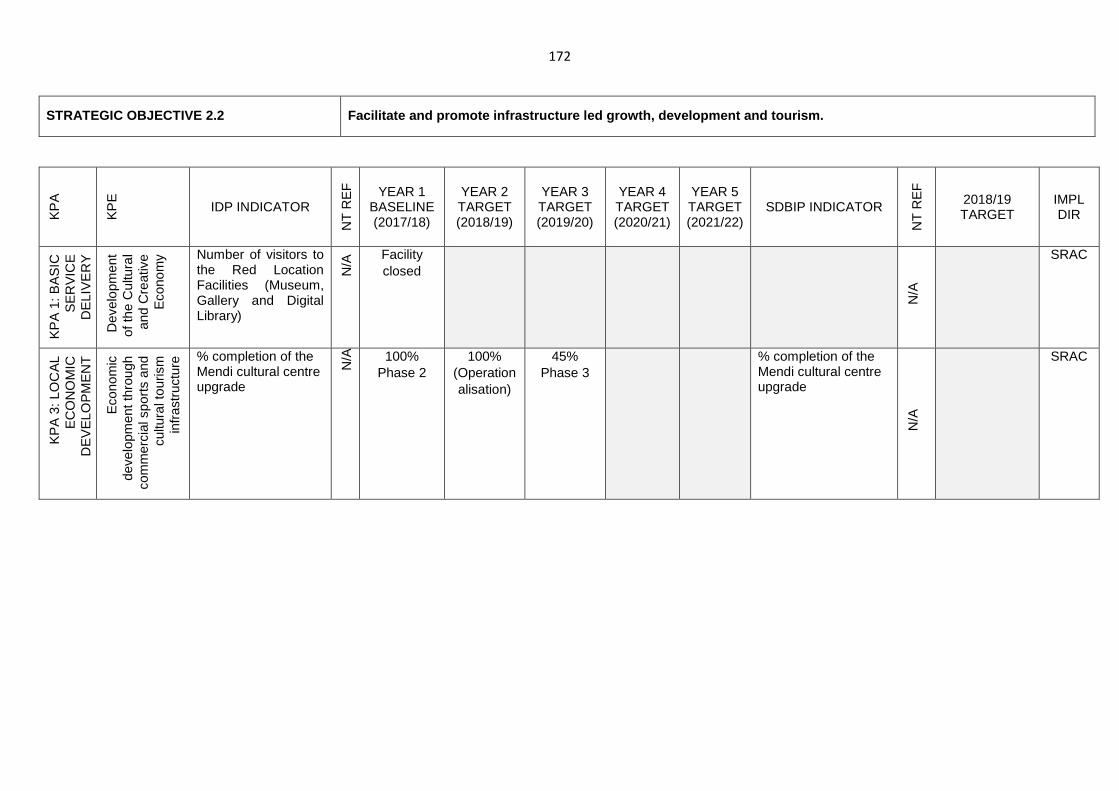
172
STRATEGIC OBJECTIVE 2.2 Facilitate and promote infrastructure led growth, d evelopment and tourism.
KP
A
KP
E
IDP INDICATOR
NT
RE
F
YEAR 1 BASELINE (2017/18)
YEAR 2 TARGET (2018/19)
YEAR 3 TARGET (2019/20)
YEAR 4 TARGET (2020/21)
YEAR 5 TARGET (2021/22)
SDBIP INDICATOR
NT
RE
F
2018/19 TARGET
IMPL DIR
KP
A 1
: BA
SIC
S
ER
VIC
E
DE
LIV
ER
Y
Dev
elop
men
t of
the
Cul
tura
l an
d C
reat
ive
Eco
nom
y Number of visitors to the Red Location Facilities (Museum, Gallery and Digital Library)
N/A
Facility closed
N/A
SRAC
KP
A 3
: LO
CA
L E
CO
NO
MIC
D
EV
ELO
PM
EN
T
Eco
nom
ic
deve
lopm
ent t
hrou
gh
com
mer
cial
spo
rts
and
cultu
ral t
ouris
m
infr
astr
uctu
re % completion of the
Mendi cultural centre upgrade
N/A
100%
Phase 2 100%
(Operationalisation)
45% Phase 3
% completion of the Mendi cultural centre upgrade
N/A
SRAC
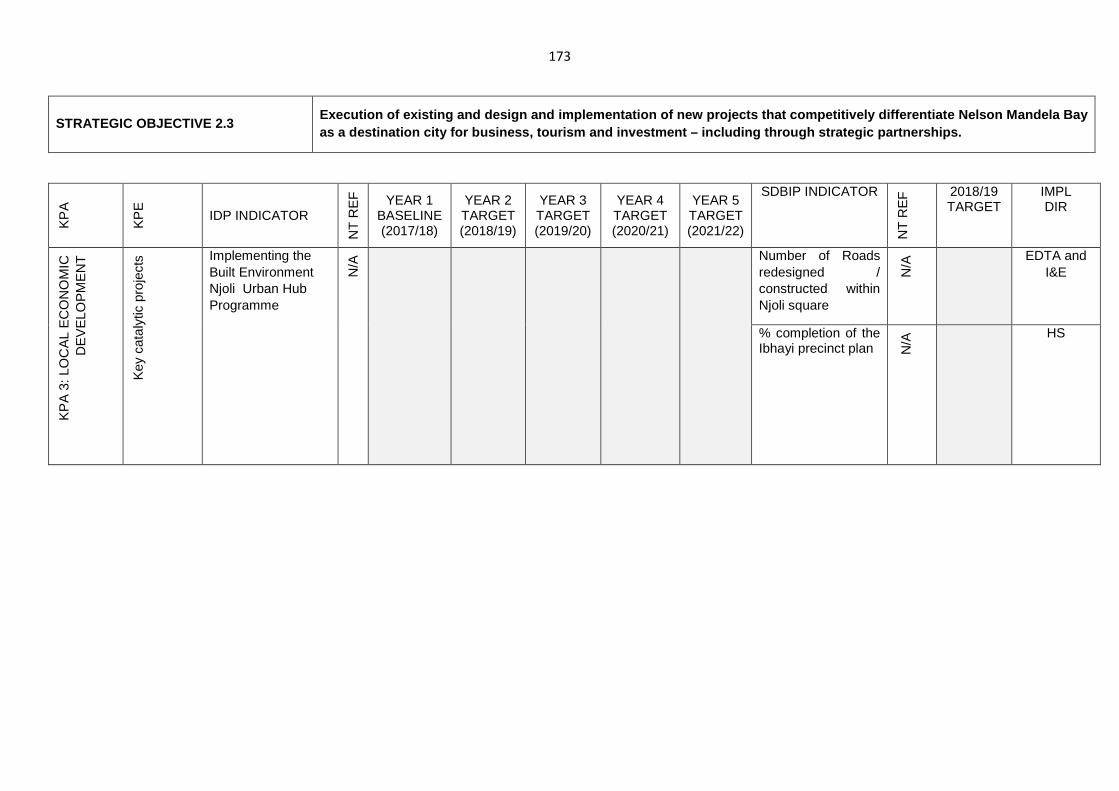
173
STRATEGIC OBJECTIVE 2.3 Execution of existing and design and implementation of new projects that competitively differentiate N elson Mandela Bay as a destination city for business, tourism and inv estment – including through strategic partnerships.
KP
A
KP
E
IDP INDICATOR
NT
RE
F
YEAR 1 BASELINE (2017/18)
YEAR 2 TARGET (2018/19)
YEAR 3 TARGET (2019/20)
YEAR 4 TARGET (2020/21)
YEAR 5 TARGET (2021/22)
SDBIP INDICATOR
NT
RE
F 2018/19
TARGET IMPL DIR
KP
A 3
: LO
CA
L E
CO
NO
MIC
D
EV
ELO
PM
EN
T
Key
cat
alyt
ic p
roje
cts Implementing the
Built Environment Njoli Urban Hub Programme
N/A
Number of Roads redesigned / constructed within Njoli square
N/A
EDTA and I&E
% completion of the Ibhayi precinct plan N
/A
HS
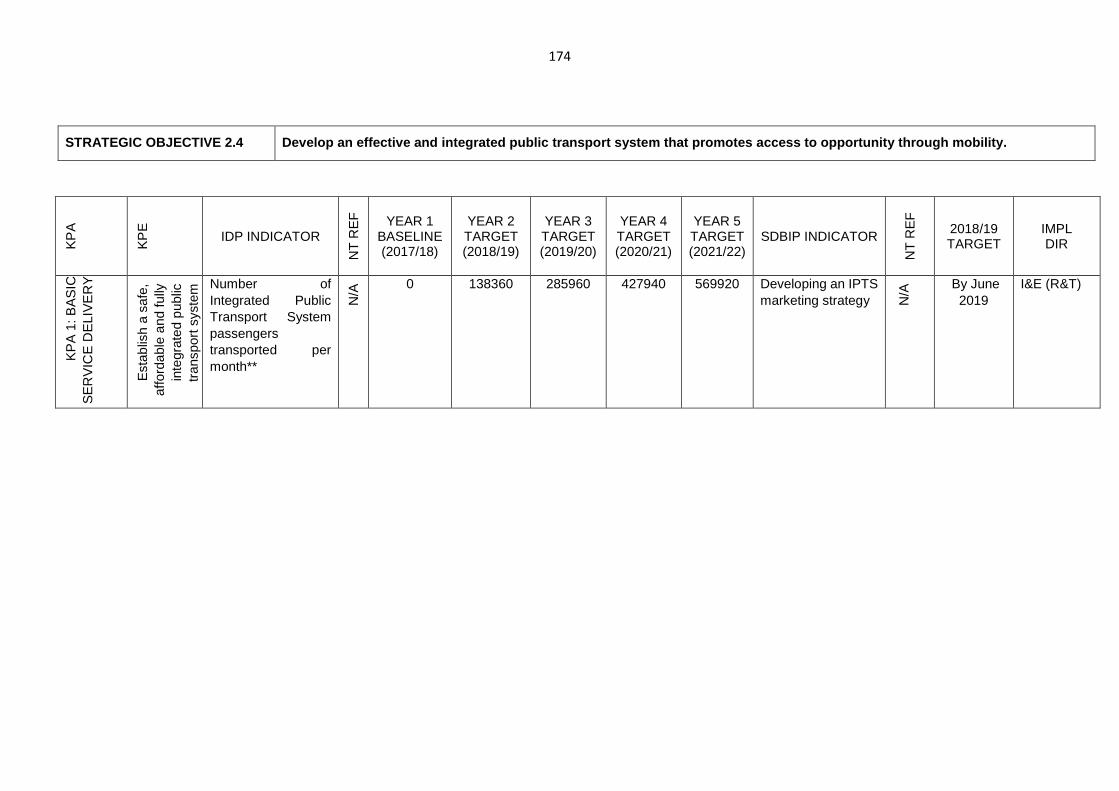
174
STRATEGIC OBJECTIVE 2.4 Develop an effective and integrated public transpor t system that promotes access to opportunity throug h mobility.
KP
A
KP
E
IDP INDICATOR
NT
RE
F
YEAR 1 BASELINE (2017/18)
YEAR 2 TARGET (2018/19)
YEAR 3 TARGET (2019/20)
YEAR 4 TARGET (2020/21)
YEAR 5 TARGET (2021/22)
SDBIP INDICATOR
NT
RE
F
2018/19 TARGET
IMPL DIR
KP
A 1
: BA
SIC
S
ER
VIC
E D
ELI
VE
RY
Est
ablis
h a
safe
, af
ford
able
and
fully
in
tegr
ated
pub
lic
tran
spor
t sys
tem
Number of Integrated Public Transport System passengers transported per month**
N/A
0 138360 285960 427940 569920 Developing an IPTS marketing strategy N
/A By June
2019 I&E (R&T)
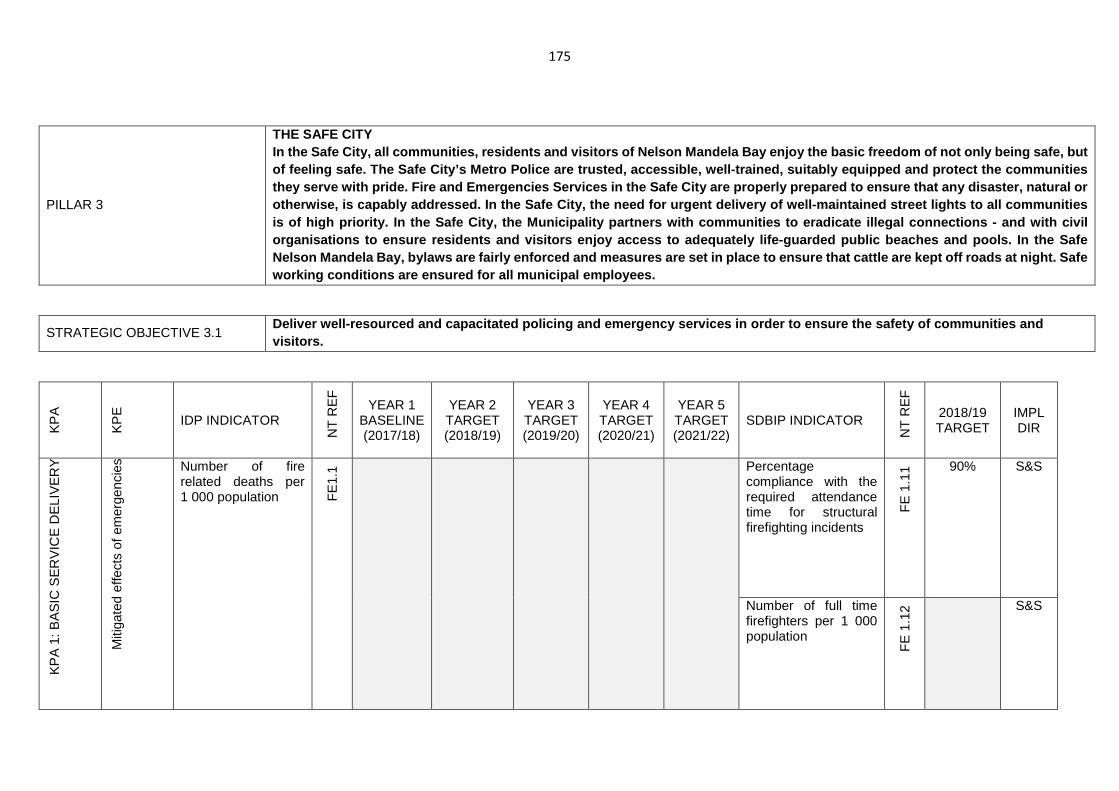
175
PILLAR 3
THE SAFE CITY In the Safe City, all communities, residents and vi sitors of Nelson Mandela Bay enjoy the basic freedo m of not only being safe, but of feeling safe. The Safe City’s Metro Police are t rusted, accessible, well-trained, suitably equipped and protect the communities they serve with pride. Fire and Emergencies Service s in the Safe City are properly prepared to ensure that any disaster, natural or otherwise, is capably addressed. In the Safe City, the need for urgent delivery of well-maintained str eet lights to all communities is of high priority. In the Safe City, the Municipa lity partners with communities to eradicate illegal connections - and with civil organisations to ensure residents and visitors enjo y access to adequately life-guarded public beaches and pools. In the Safe Nelson Mandela Bay, bylaws are fairly enforced and measures are set in place to ensure that cattle are kept off roads at night. Safe working conditions are ensured for all municipal em ployees.
STRATEGIC OBJECTIVE 3.1 Deliver well-resourced and capacitated policing and emergency services in order to ensure the safety o f communities and visitors.
KP
A
KP
E
IDP INDICATOR
NT
RE
F
YEAR 1 BASELINE (2017/18)
YEAR 2 TARGET (2018/19)
YEAR 3 TARGET (2019/20)
YEAR 4 TARGET (2020/21)
YEAR 5 TARGET (2021/22)
SDBIP INDICATOR
NT
RE
F
2018/19 TARGET
IMPL DIR
KP
A 1
: BA
SIC
SE
RV
ICE
DE
LIV
ER
Y
Miti
gate
d ef
fect
s of
em
erge
ncie
s
Number of fire related deaths per 1 000 population F
E1.
1 Percentage compliance with the required attendance time for structural firefighting incidents
FE
1.1
1 90% S&S
Number of full time firefighters per 1 000 population
FE
1.1
2 S&S
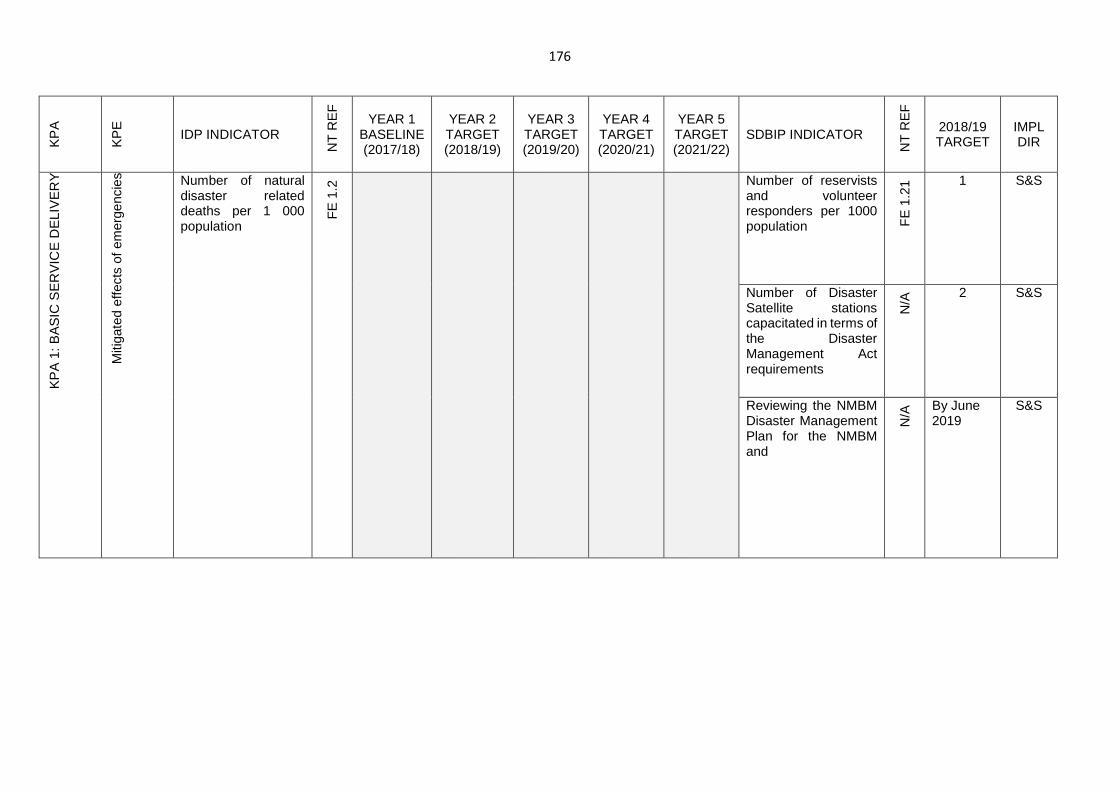
176
KP
A
KP
E
IDP INDICATOR
NT
RE
F
YEAR 1 BASELINE (2017/18)
YEAR 2 TARGET (2018/19)
YEAR 3 TARGET (2019/20)
YEAR 4 TARGET (2020/21)
YEAR 5 TARGET (2021/22)
SDBIP INDICATOR
NT
RE
F
2018/19 TARGET
IMPL DIR
KP
A 1
: BA
SIC
SE
RV
ICE
DE
LIV
ER
Y
Miti
gate
d ef
fect
s of
em
erge
ncie
s
Number of natural disaster related deaths per 1 000 population
FE
1.2
Number of reservists and volunteer responders per 1000 population F
E 1
.21 1 S&S
Number of Disaster Satellite stations capacitated in terms of the Disaster Management Act requirements
N/A
2 S&S
Reviewing the NMBM Disaster Management Plan for the NMBM and
N/A
By June 2019
S&S
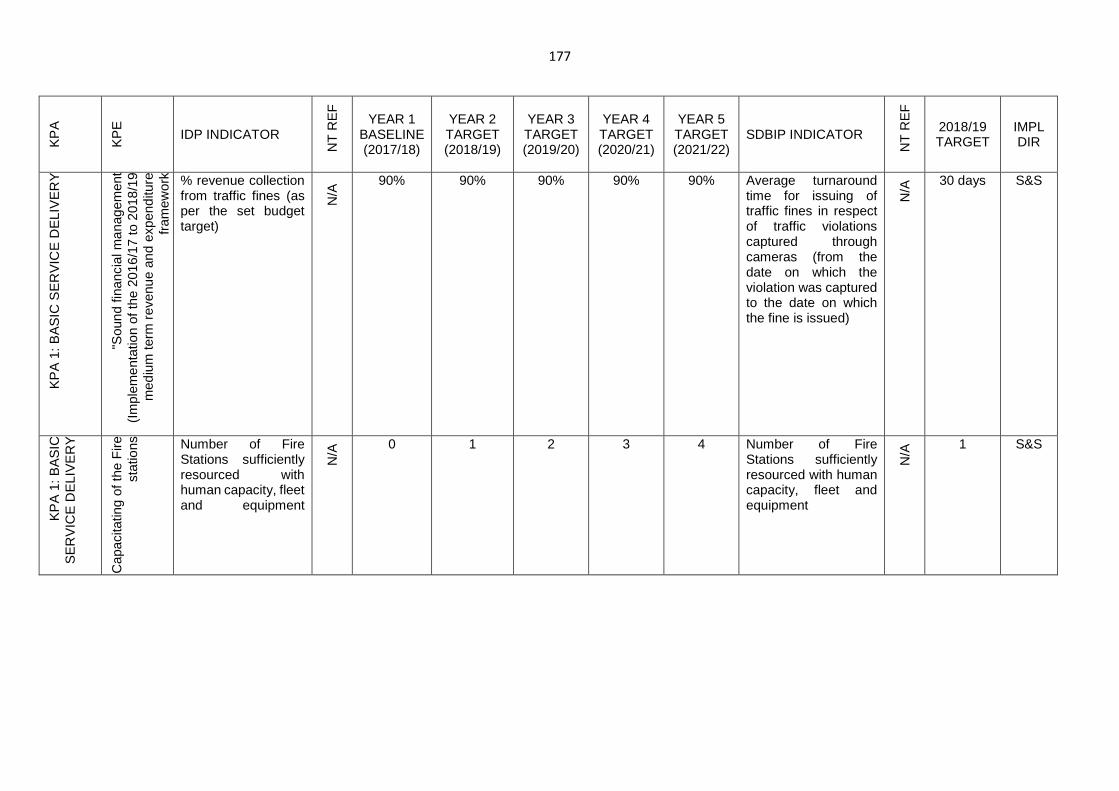
177
KP
A
KP
E
IDP INDICATOR
NT
RE
F
YEAR 1 BASELINE (2017/18)
YEAR 2 TARGET (2018/19)
YEAR 3 TARGET (2019/20)
YEAR 4 TARGET (2020/21)
YEAR 5 TARGET (2021/22)
SDBIP INDICATOR
NT
RE
F
2018/19 TARGET
IMPL DIR
KP
A 1
: BA
SIC
SE
RV
ICE
DE
LIV
ER
Y
"Sou
nd fi
nanc
ial m
anag
emen
t (I
mpl
emen
tatio
n of
the
2016
/17
to 2
018/
19
med
ium
term
rev
enue
and
exp
endi
ture
fr
amew
ork " % revenue collection
from traffic fines (as per the set budget target)
N/A
90% 90% 90% 90% 90% Average turnaround time for issuing of traffic fines in respect of traffic violations captured through cameras (from the date on which the violation was captured to the date on which the fine is issued)
N/A
30 days S&S
KP
A 1
: BA
SIC
S
ER
VIC
E D
ELI
VE
RY
Cap
acita
ting
of th
e F
ire
stat
ions
Number of Fire Stations sufficiently resourced with human capacity, fleet and equipment
N/A
0 1 2 3 4 Number of Fire Stations sufficiently resourced with human capacity, fleet and equipment
N/A
1 S&S
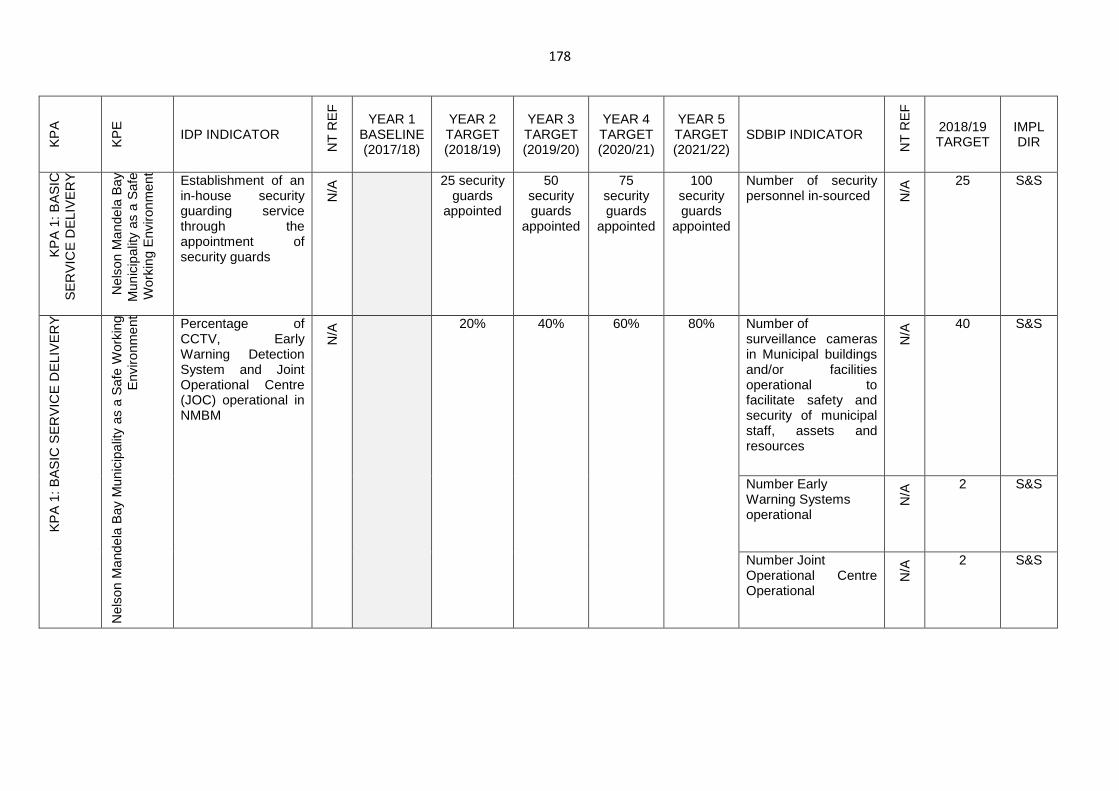
178
KP
A
KP
E
IDP INDICATOR
NT
RE
F
YEAR 1 BASELINE (2017/18)
YEAR 2 TARGET (2018/19)
YEAR 3 TARGET (2019/20)
YEAR 4 TARGET (2020/21)
YEAR 5 TARGET (2021/22)
SDBIP INDICATOR
NT
RE
F
2018/19 TARGET
IMPL DIR
KP
A 1
: BA
SIC
S
ER
VIC
E D
ELI
VE
RY
Nel
son
Man
dela
Bay
M
unic
ipal
ity a
s a
Saf
e W
orki
ng E
nviro
nmen
t
Establishment of an in-house security guarding service through the appointment of security guards
N/A
25 security guards
appointed
50 security guards
appointed
75 security guards
appointed
100 security guards
appointed
Number of security personnel in-sourced N
/A 25 S&S
KP
A 1
: BA
SIC
SE
RV
ICE
DE
LIV
ER
Y
Nel
son
Man
dela
Bay
Mun
icip
ality
as
a S
afe
Wor
king
E
nviro
nmen
t
Percentage of CCTV, Early Warning Detection System and Joint Operational Centre (JOC) operational in NMBM
N/A
20% 40% 60% 80% Number of surveillance cameras in Municipal buildings and/or facilities operational to facilitate safety and security of municipal staff, assets and resources
N/A
40 S&S
Number Early Warning Systems operational
N/A
2 S&S
Number Joint Operational Centre Operational
N/A
2 S&S
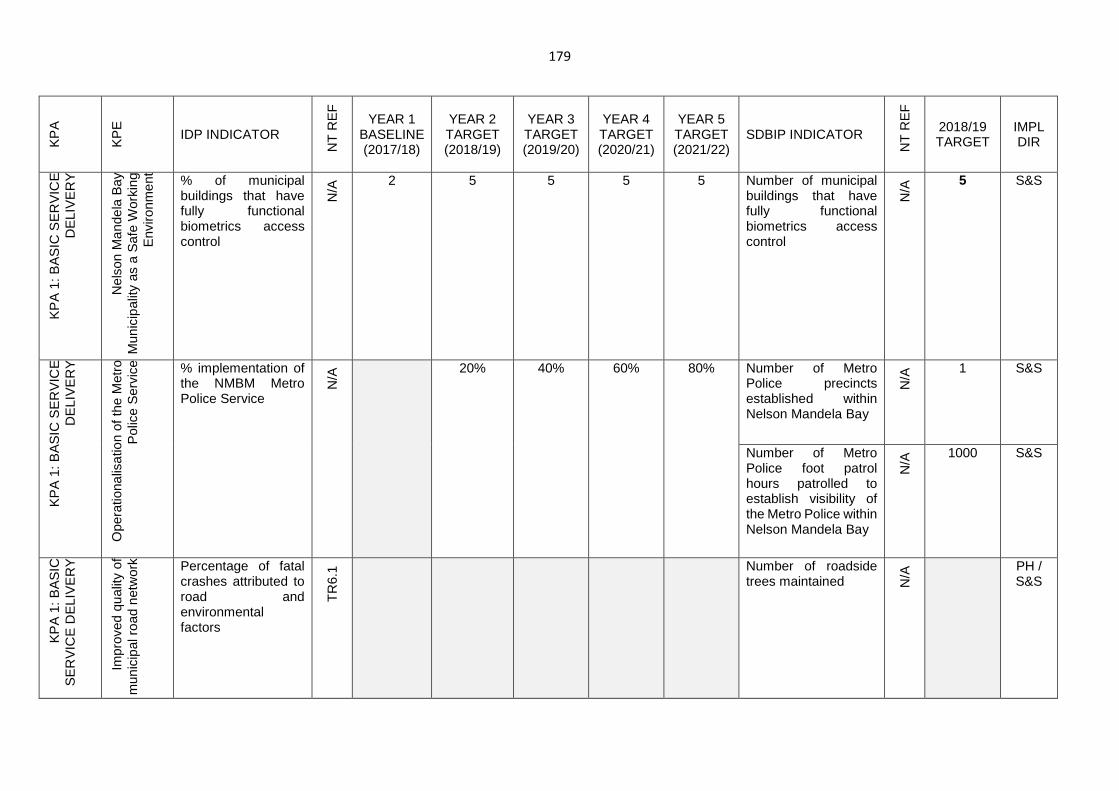
179
KP
A
KP
E
IDP INDICATOR
NT
RE
F
YEAR 1 BASELINE (2017/18)
YEAR 2 TARGET (2018/19)
YEAR 3 TARGET (2019/20)
YEAR 4 TARGET (2020/21)
YEAR 5 TARGET (2021/22)
SDBIP INDICATOR
NT
RE
F
2018/19 TARGET
IMPL DIR
KP
A 1
: BA
SIC
SE
RV
ICE
D
ELI
VE
RY
Nel
son
Man
dela
Bay
M
unic
ipal
ity a
s a
Saf
e W
orki
ng
Env
ironm
ent
% of municipal buildings that have fully functional biometrics access control
N/A
2 5 5 5 5 Number of municipal buildings that have fully functional biometrics access control
N/A
5 S&S
KP
A 1
: BA
SIC
SE
RV
ICE
D
ELI
VE
RY
Ope
ratio
nalis
atio
n of
the
Met
ro
Pol
ice
Ser
vice % implementation of
the NMBM Metro Police Service
N/A
20% 40% 60% 80% Number of Metro Police precincts established within Nelson Mandela Bay
N/A
1 S&S
Number of Metro Police foot patrol hours patrolled to establish visibility of the Metro Police within Nelson Mandela Bay
N/A
1000 S&S
KP
A 1
: BA
SIC
S
ER
VIC
E D
ELI
VE
RY
Impr
oved
qua
lity
of
mun
icip
al r
oad
netw
ork Percentage of fatal
crashes attributed to road and environmental factors
TR
6.1
Number of roadside trees maintained N
/A
PH / S&S
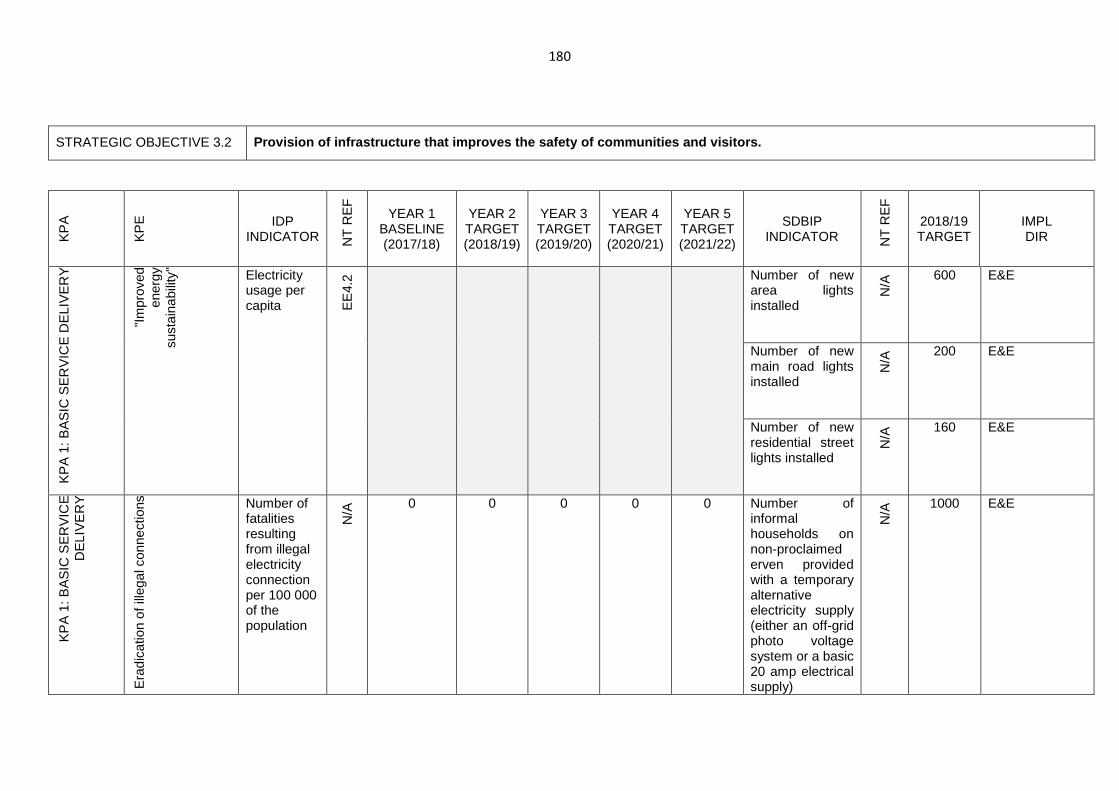
180
STRATEGIC OBJECTIVE 3.2 Provision of infrastructure that improves the safet y of communities and visitors.
KP
A
KP
E
IDP INDICATOR N
T R
EF
YEAR 1 BASELINE (2017/18)
YEAR 2 TARGET (2018/19)
YEAR 3 TARGET (2019/20)
YEAR 4 TARGET (2020/21)
YEAR 5 TARGET (2021/22)
SDBIP INDICATOR N
T R
EF
2018/19 TARGET
IMPL DIR
KP
A 1
: BA
SIC
SE
RV
ICE
DE
LIV
ER
Y
"Im
prov
eden
ergy
sust
aina
bilit
y" Electricity usage per capita E
E4.
2
Number of new area lights installed
N/A
600 E&E
Number of new main road lights installed
N/A
200 E&E
Number of new residential street lights installed
N/A
160 E&E
KP
A 1
: BA
SIC
SE
RV
ICE
D
ELI
VE
RY
Era
dica
tion
of il
lega
l con
nect
ions Number of
fatalities resulting from illegal electricity connection per 100 000 of the population
N/A
0 0 0 0 0 Number of informal households on non-proclaimed erven provided with a temporary alternative electricity supply (either an off-grid photo voltage system or a basic 20 amp electrical supply)
N/A
1000 E&E
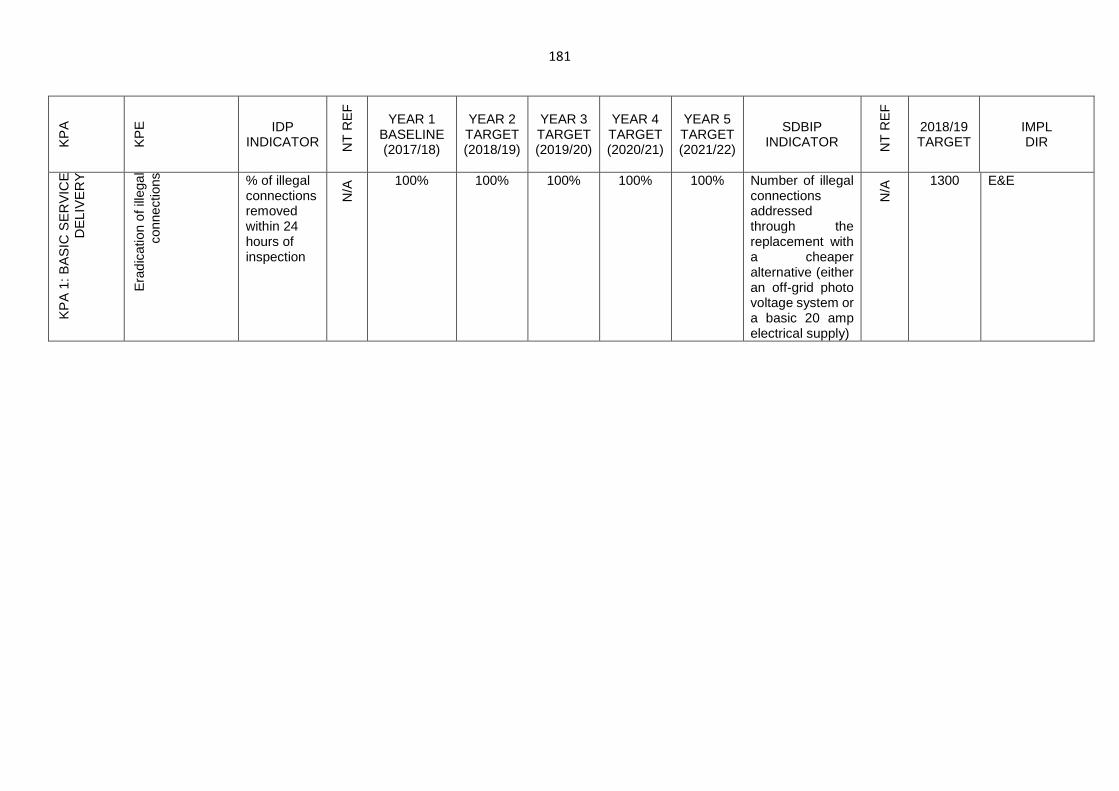
181
KP
A
KP
E
IDP INDICATOR N
T R
EF
YEAR 1 BASELINE (2017/18)
YEAR 2 TARGET (2018/19)
YEAR 3 TARGET (2019/20)
YEAR 4 TARGET (2020/21)
YEAR 5 TARGET (2021/22)
SDBIP INDICATOR N
T R
EF
2018/19 TARGET
IMPL DIR
KP
A 1
: BA
SIC
SE
RV
ICE
D
ELI
VE
RY
Era
dica
tion
of il
lega
l co
nnec
tions
% of illegal connections removed within 24 hours of inspection
N/A
100% 100% 100% 100% 100% Number of illegal connections addressed through the replacement with a cheaper alternative (either an off-grid photo voltage system or a basic 20 amp electrical supply)
N/A
1300 E&E
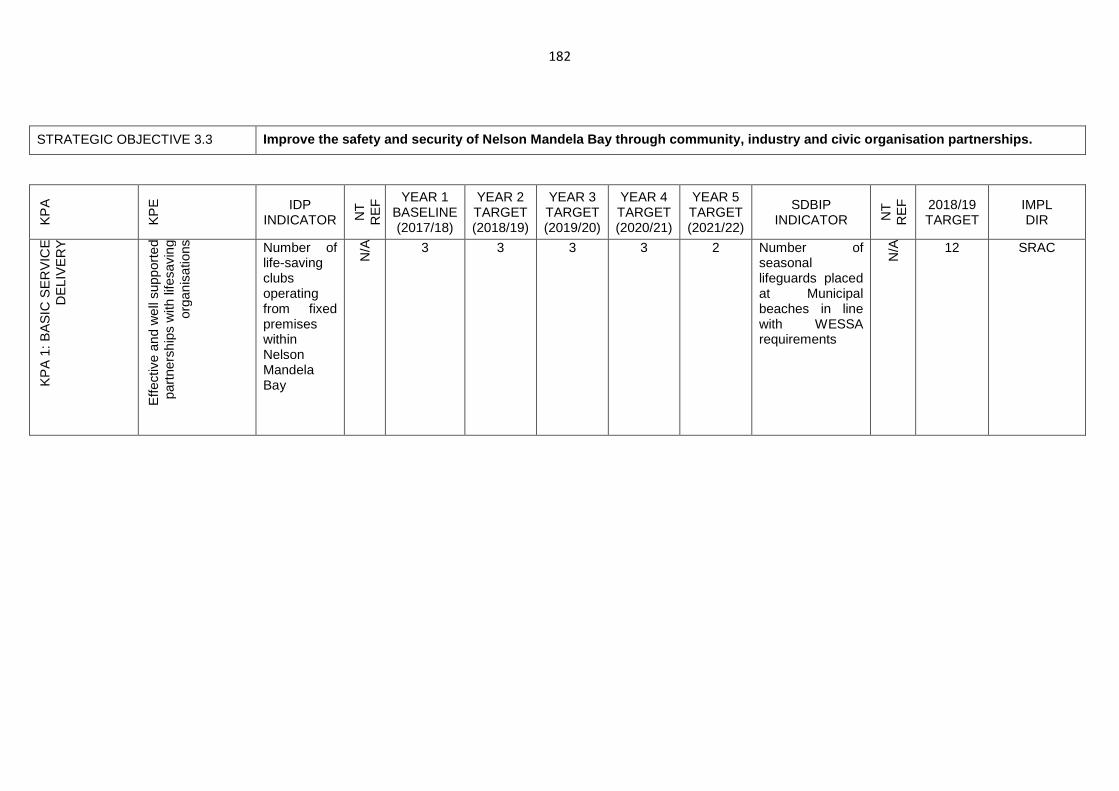
182
STRATEGIC OBJECTIVE 3.3 Improve the safety and security of Nelson Mandela B ay through community, industry and civic organisati on partnerships.
KP
A
KP
E
IDP INDICATOR N
T
RE
F YEAR 1
BASELINE (2017/18)
YEAR 2 TARGET (2018/19)
YEAR 3 TARGET (2019/20)
YEAR 4 TARGET (2020/21)
YEAR 5 TARGET (2021/22)
SDBIP INDICATOR N
T
RE
F
2018/19 TARGET
IMPL DIR
KP
A 1
: BA
SIC
SE
RV
ICE
D
ELI
VE
RY
Effe
ctiv
e an
d w
ell s
uppo
rted
pa
rtne
rshi
ps w
ith li
fesa
ving
or
gani
satio
ns Number of life-saving clubs operating from fixed premises within Nelson Mandela Bay
N/A 3 3 3 3 2 Number of
seasonal lifeguards placed at Municipal beaches in line with WESSA requirements
N/A 12 SRAC
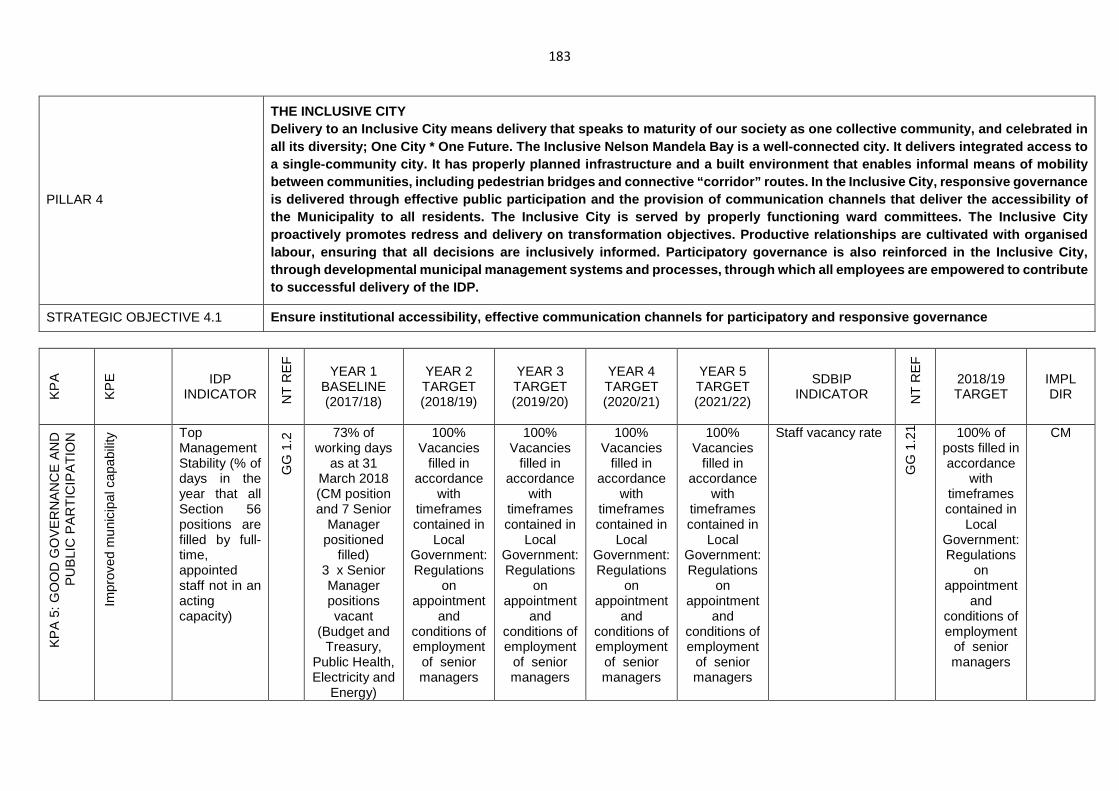
183
PILLAR 4
THE INCLUSIVE CITY Delivery to an Inclusive City means delivery that s peaks to maturity of our society as one collective community, and celebrated in all its diversity; One City * One Future. The Inclu sive Nelson Mandela Bay is a well-connected city. I t delivers integrated access to a single-community city. It has properly planned in frastructure and a built environment that enables i nformal means of mobility between communities, including pedestrian bridges a nd connective “corridor” routes. In the Inclusive C ity, responsive governance is delivered through effective public participation and the provision of communication channels that d eliver the accessibility of the Municipality to all residents. The Inclusive Ci ty is served by properly functioning ward committee s. The Inclusive City proactively promotes redress and delivery on transf ormation objectives. Productive relationships are c ultivated with organised labour, ensuring that all decisions are inclusively informed. Participatory governance is also reinfor ced in the Inclusive City, through developmental municipal management systems and processes, through which all employees are empo wered to contribute to successful delivery of the IDP.
STRATEGIC OBJECTIVE 4.1 Ensure institutional accessibility, effective commu nication channels for participatory and responsive governance
KP
A
KP
E
IDP INDICATOR N
T R
EF
YEAR 1 BASELINE (2017/18)
YEAR 2 TARGET (2018/19)
YEAR 3 TARGET (2019/20)
YEAR 4 TARGET (2020/21)
YEAR 5 TARGET (2021/22)
SDBIP INDICATOR N
T R
EF
2018/19 TARGET
IMPL DIR
KP
A 5
: GO
OD
GO
VE
RN
AN
CE
AN
D
PU
BLI
C P
AR
TIC
IPA
TIO
N
Impr
oved
mun
icip
al c
apab
ility
Top Management Stability (% of days in the year that all Section 56 positions are filled by full-time, appointed staff not in an acting capacity)
GG
1.2
73% of working days
as at 31 March 2018 (CM position and 7 Senior
Manager positioned
filled) 3 x Senior Manager positions vacant
(Budget and Treasury,
Public Health, Electricity and
Energy)
100% Vacancies
filled in accordance
with timeframes contained in
Local Government: Regulations
on appointment
and conditions of employment
of senior managers
100% Vacancies
filled in accordance
with timeframes contained in
Local Government: Regulations
on appointment
and conditions of employment
of senior managers
100% Vacancies
filled in accordance
with timeframes contained in
Local Government: Regulations
on appointment
and conditions of employment
of senior managers
100% Vacancies
filled in accordance
with timeframes contained in
Local Government: Regulations
on appointment
and conditions of employment
of senior managers
Staff vacancy rate
GG
1.2
1
100% of posts filled in accordance
with timeframes contained in
Local Government: Regulations
on appointment
and conditions of employment
of senior managers
CM
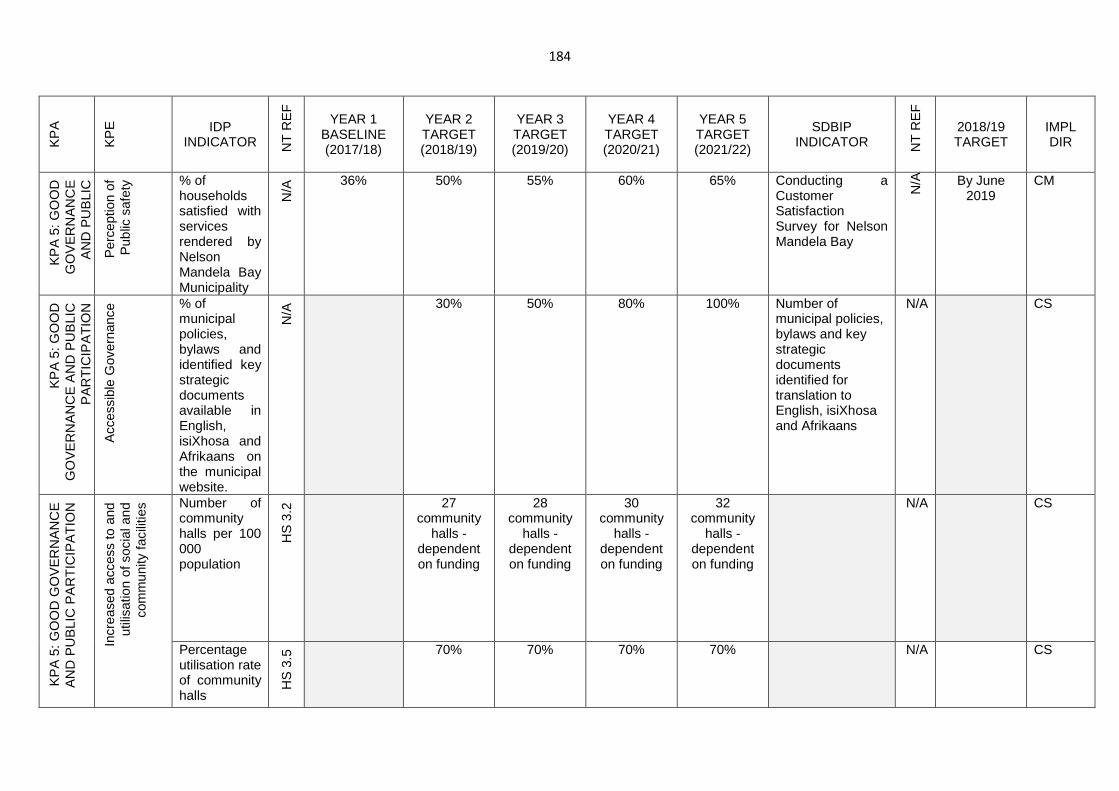
184
KP
A
KP
E
IDP INDICATOR N
T R
EF
YEAR 1 BASELINE (2017/18)
YEAR 2 TARGET (2018/19)
YEAR 3 TARGET (2019/20)
YEAR 4 TARGET (2020/21)
YEAR 5 TARGET (2021/22)
SDBIP INDICATOR N
T R
EF
2018/19 TARGET
IMPL DIR
KP
A 5
: GO
OD
G
OV
ER
NA
NC
E
AN
D P
UB
LIC
P
AR
TIC
IPA
TIO
N
Per
cept
ion
of
Pub
lic s
afet
y % of households satisfied with services rendered by Nelson Mandela Bay Municipality
N/A
36% 50% 55% 60% 65% Conducting a Customer Satisfaction Survey for Nelson Mandela Bay
N/A By June
2019 CM
KP
A 5
: GO
OD
G
OV
ER
NA
NC
E A
ND
PU
BLI
C
PA
RT
ICIP
AT
ION
Acc
essi
ble
Gov
erna
nce % of
municipal policies, bylaws and identified key strategic documents available in English, isiXhosa and Afrikaans on the municipal website.
N/A
30% 50% 80% 100% Number of municipal policies, bylaws and key strategic documents identified for translation to English, isiXhosa and Afrikaans
N/A CS
KP
A 5
: GO
OD
GO
VE
RN
AN
CE
A
ND
PU
BLI
C P
AR
TIC
IPA
TIO
N
Incr
ease
d ac
cess
to a
nd
utili
satio
n of
soc
ial a
nd
com
mun
ity fa
cilit
ies Number of
community halls per 100 000 population
HS
3.2
27 community
halls - dependent on funding
28 community
halls - dependent on funding
30 community
halls - dependent on funding
32 community
halls - dependent on funding
N/A CS
Percentage utilisation rate of community halls
HS
3.5
70% 70% 70% 70% N/A
CS
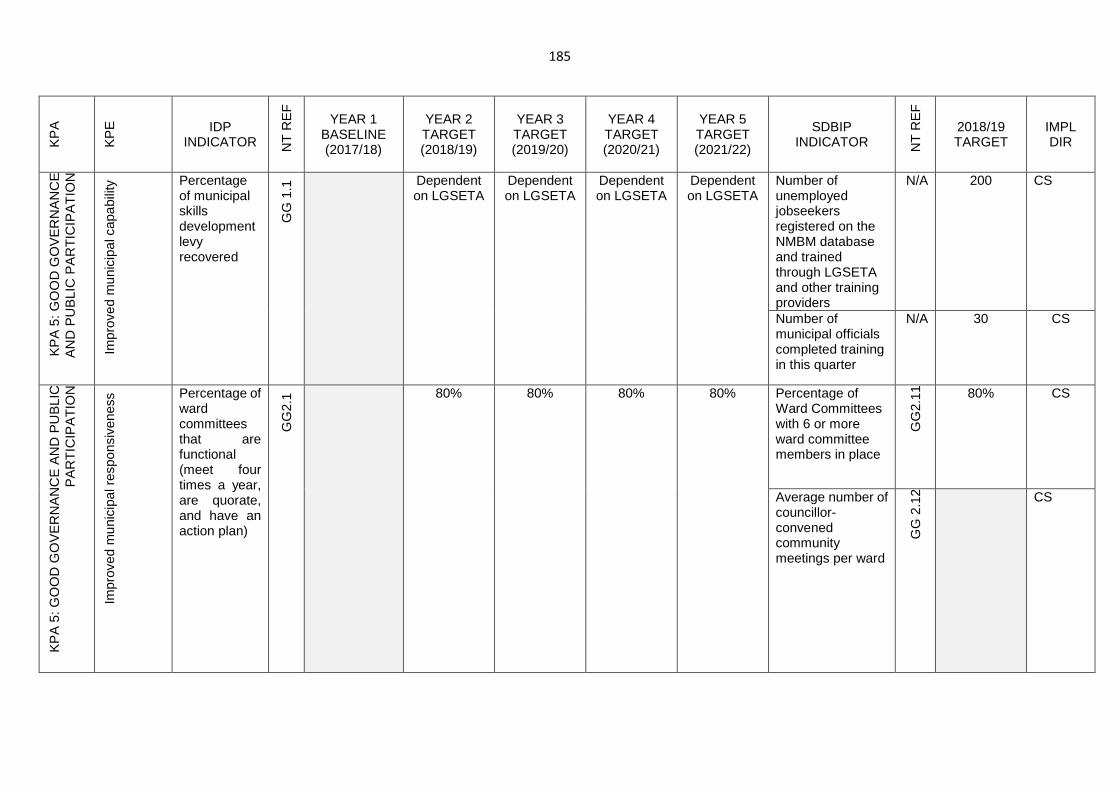
185
KP
A
KP
E
IDP INDICATOR N
T R
EF
YEAR 1 BASELINE (2017/18)
YEAR 2 TARGET (2018/19)
YEAR 3 TARGET (2019/20)
YEAR 4 TARGET (2020/21)
YEAR 5 TARGET (2021/22)
SDBIP INDICATOR N
T R
EF
2018/19 TARGET
IMPL DIR
KP
A 5
: GO
OD
GO
VE
RN
AN
CE
A
ND
PU
BLI
C P
AR
TIC
IPA
TIO
N
Impr
oved
mun
icip
al c
apab
ility
Percentage of municipal skills development levy recovered
GG
1.1
Dependent on LGSETA
Dependent on LGSETA
Dependent on LGSETA
Dependent on LGSETA
Number of unemployed jobseekers registered on the NMBM database and trained through LGSETA and other training providers
N/A 200 CS
Number of municipal officials completed training in this quarter
N/A 30 CS
KP
A 5
: GO
OD
GO
VE
RN
AN
CE
AN
D P
UB
LIC
P
AR
TIC
IPA
TIO
N
Impr
oved
mun
icip
al r
espo
nsiv
enes
s Percentage of ward committees that are functional (meet four times a year, are quorate, and have an action plan)
GG
2.1 80% 80% 80% 80% Percentage of
Ward Committees with 6 or more ward committee members in place
GG
2.11
80% CS
Average number of councillor-convened community meetings per ward
GG
2.1
2 CS
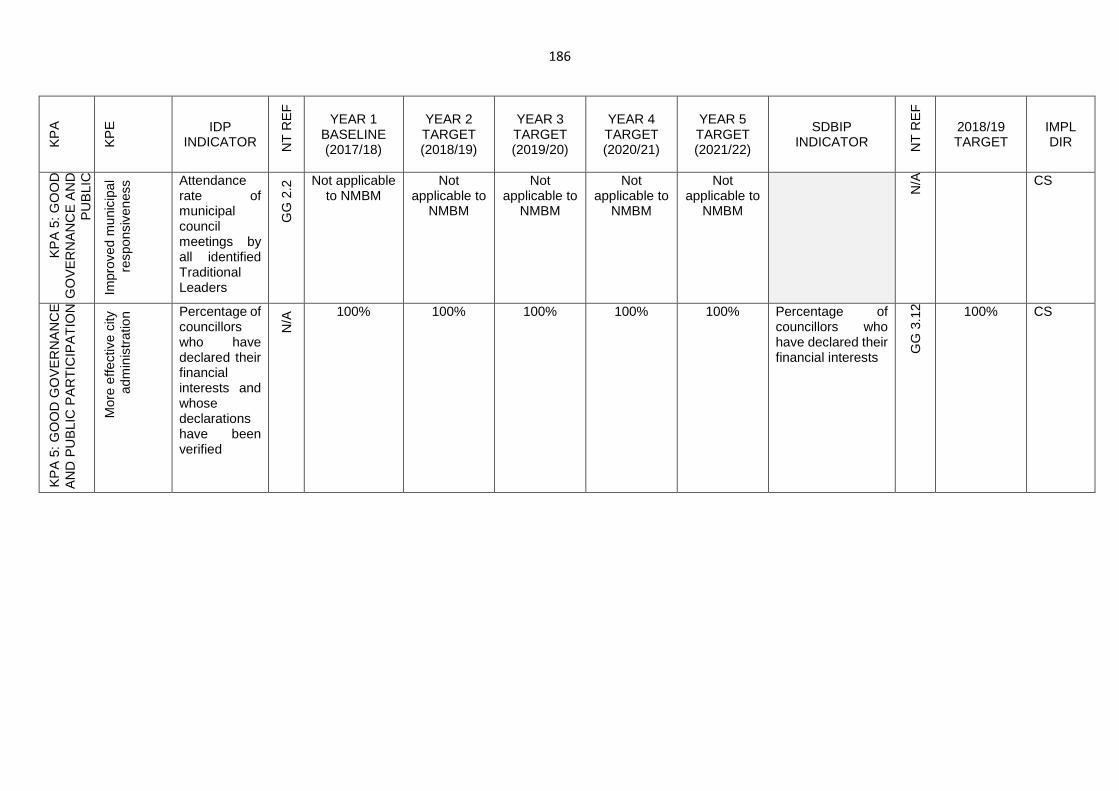
186
KP
A
KP
E
IDP INDICATOR N
T R
EF
YEAR 1 BASELINE (2017/18)
YEAR 2 TARGET (2018/19)
YEAR 3 TARGET (2019/20)
YEAR 4 TARGET (2020/21)
YEAR 5 TARGET (2021/22)
SDBIP INDICATOR N
T R
EF
2018/19 TARGET
IMPL DIR
KP
A 5
: GO
OD
G
OV
ER
NA
NC
E A
ND
P
UB
LIC
P
AR
TIC
IPA
TIO
N
Impr
oved
mun
icip
al
resp
onsi
vene
ss Attendance
rate of municipal council meetings by all identified Traditional Leaders
GG
2.2
Not applicable to NMBM
Not applicable to
NMBM
Not applicable to
NMBM
Not applicable to
NMBM
Not applicable to
NMBM
N/A
CS
KP
A 5
: GO
OD
GO
VE
RN
AN
CE
A
ND
PU
BLI
C P
AR
TIC
IPA
TIO
N
Mor
e ef
fect
ive
city
ad
min
istr
atio
n Percentage of councillors who have declared their financial interests and whose declarations have been verified
N/A
100% 100% 100% 100% 100% Percentage of councillors who have declared their financial interests
GG
3.1
2 100% CS
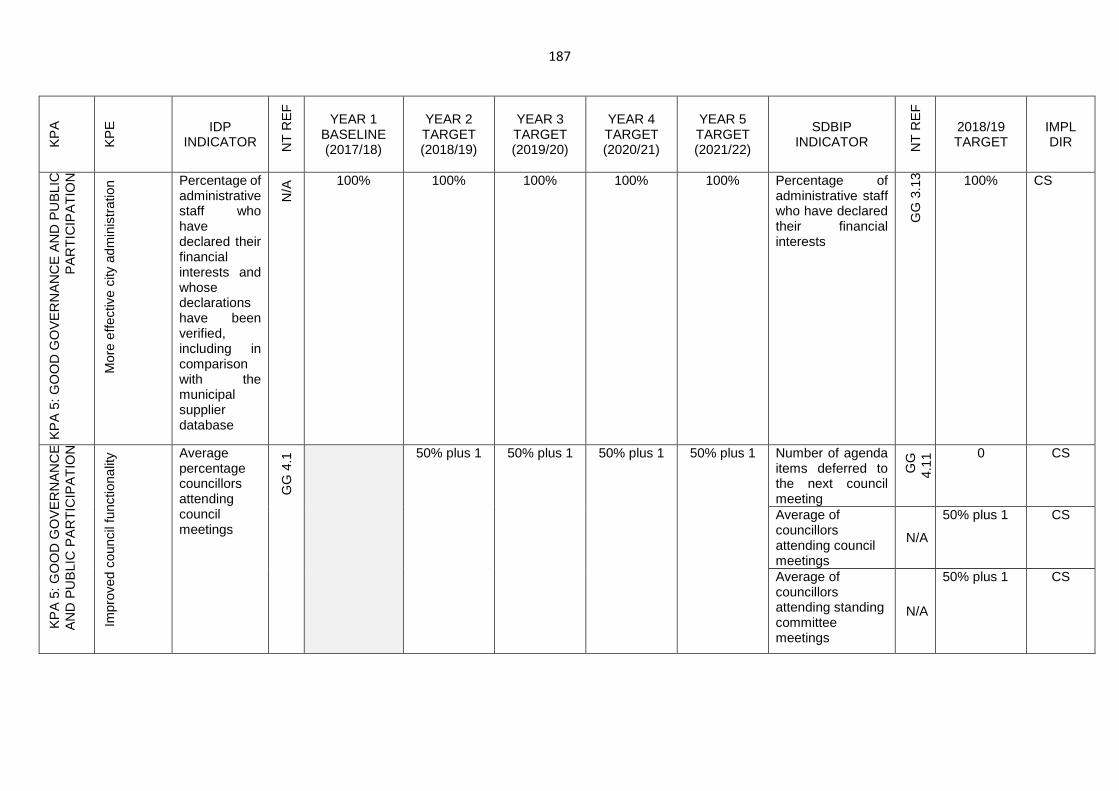
187
KP
A
KP
E
IDP INDICATOR N
T R
EF
YEAR 1 BASELINE (2017/18)
YEAR 2 TARGET (2018/19)
YEAR 3 TARGET (2019/20)
YEAR 4 TARGET (2020/21)
YEAR 5 TARGET (2021/22)
SDBIP INDICATOR N
T R
EF
2018/19 TARGET
IMPL DIR
KP
A 5
: GO
OD
GO
VE
RN
AN
CE
AN
D P
UB
LIC
P
AR
TIC
IPA
TIO
N
Mor
e ef
fect
ive
city
adm
inis
trat
ion Percentage of
administrative staff who have declared their financial interests and whose declarations have been verified, including in comparison with the municipal supplier database
N/A
100% 100% 100% 100% 100% Percentage of administrative staff who have declared their financial interests
GG
3.1
3 100% CS
KP
A 5
: GO
OD
GO
VE
RN
AN
CE
A
ND
PU
BLI
C P
AR
TIC
IPA
TIO
N
Impr
oved
cou
ncil
func
tiona
lity Average
percentage councillors attending council meetings
GG
4.1
50% plus 1 50% plus 1 50% plus 1 50% plus 1 Number of agenda items deferred to the next council meeting
GG
4.
11 0 CS
Average of councillors attending council meetings
N/A
50% plus 1 CS
Average of councillors attending standing committee meetings
N/A
50% plus 1 CS
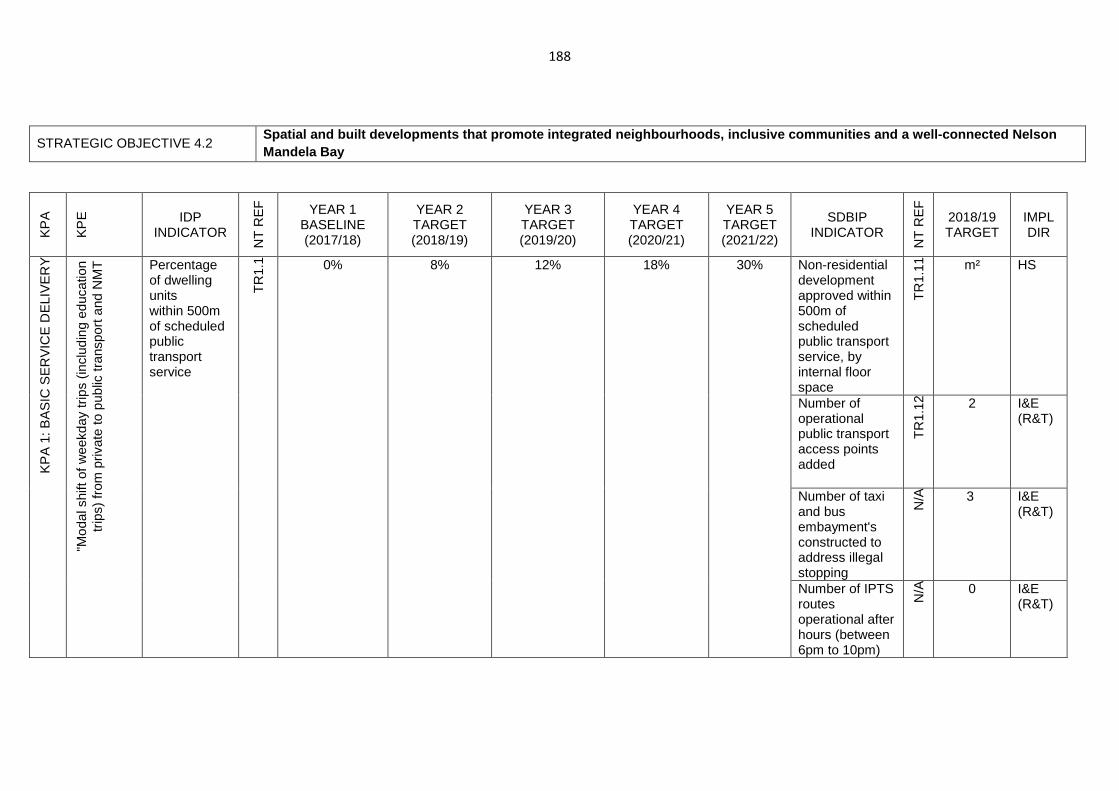
188
STRATEGIC OBJECTIVE 4.2 Spatial and built developments that promote integra ted neighbourhoods, inclusive communities and a wel l-connected Nelson Mandela Bay
KP
A
KP
E
IDP INDICATOR
NT
RE
F
YEAR 1 BASELINE (2017/18)
YEAR 2 TARGET (2018/19)
YEAR 3 TARGET (2019/20)
YEAR 4 TARGET (2020/21)
YEAR 5 TARGET (2021/22)
SDBIP INDICATOR
NT
RE
F
2018/19 TARGET
IMPL DIR
KP
A 1
: BA
SIC
SE
RV
ICE
DE
LIV
ER
Y
"Mod
al s
hift
of w
eekd
ay tr
ips
(incl
udin
g ed
ucat
ion
trip
s) fr
om p
rivat
e to
pub
lic tr
ansp
ort a
nd N
MT
Percentage of dwelling units within 500m of scheduled public transport service
TR
1.1 0% 8% 12% 18% 30% Non-residential
development approved within 500m of scheduled public transport service, by internal floor space
TR
1.11
m² HS
Number of operational public transport access points added
TR
1.12
2 I&E (R&T)
Number of taxi and bus embayment's constructed to address illegal stopping
N/A
3 I&E (R&T)
Number of IPTS routes operational after hours (between 6pm to 10pm)
N/A
0 I&E (R&T)
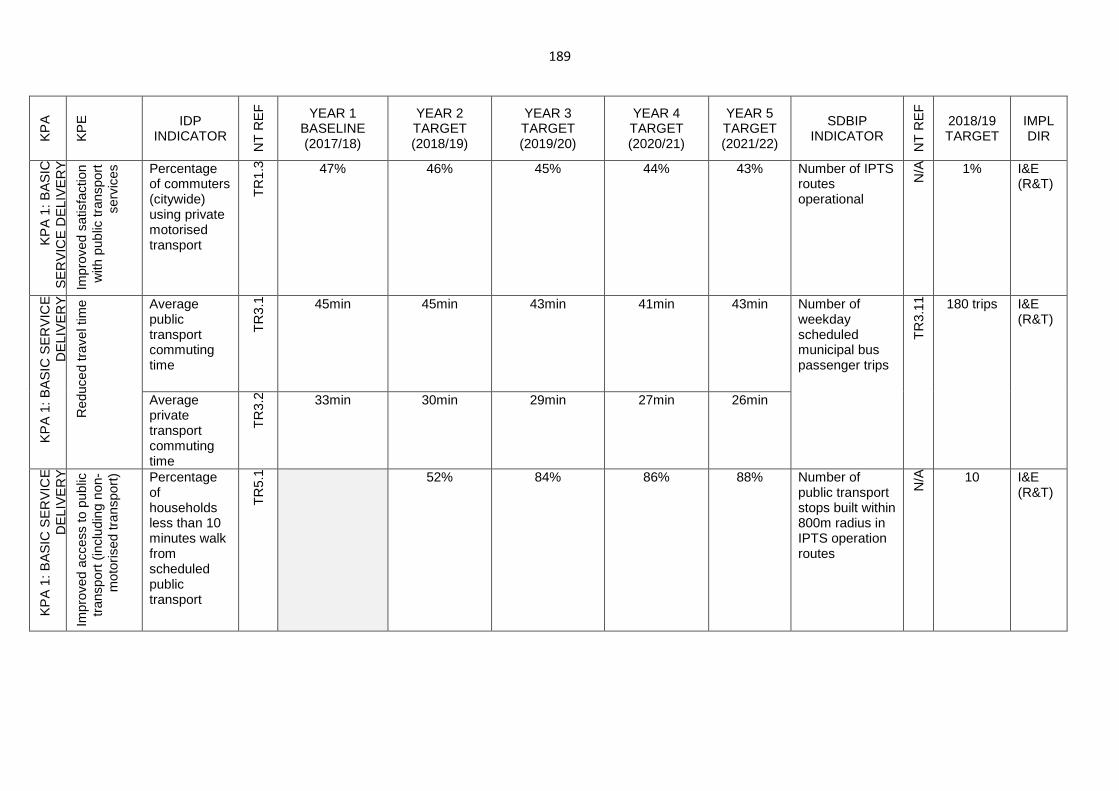
189
KP
A
KP
E
IDP INDICATOR
NT
RE
F
YEAR 1 BASELINE (2017/18)
YEAR 2 TARGET (2018/19)
YEAR 3 TARGET (2019/20)
YEAR 4 TARGET (2020/21)
YEAR 5 TARGET (2021/22)
SDBIP INDICATOR
NT
RE
F
2018/19 TARGET
IMPL DIR
KP
A 1
: BA
SIC
S
ER
VIC
E D
ELI
VE
RY
Impr
oved
sat
isfa
ctio
n w
ith p
ublic
tran
spor
t se
rvic
es
Percentage of commuters (citywide) using private motorised transport
TR
1.3 47% 46% 45% 44% 43% Number of IPTS
routes operational
N/A
1% I&E (R&T)
KP
A 1
: BA
SIC
SE
RV
ICE
D
ELI
VE
RY
Red
uced
trav
el ti
me
Average public transport commuting time
TR
3.1 45min 45min 43min 41min 43min Number of
weekday scheduled municipal bus passenger trips
TR
3.11
180 trips I&E (R&T)
Average private transport commuting time
TR
3.2 33min 30min 29min 27min 26min
KP
A 1
: BA
SIC
SE
RV
ICE
D
ELI
VE
RY
Impr
oved
acc
ess
to p
ublic
tr
ansp
ort (
incl
udin
g no
n-m
otor
ised
tran
spor
t)
Percentage of households less than 10 minutes walk from scheduled public transport
TR
5.1 52% 84% 86% 88% Number of
public transport stops built within 800m radius in IPTS operation routes
N/A
10 I&E (R&T)
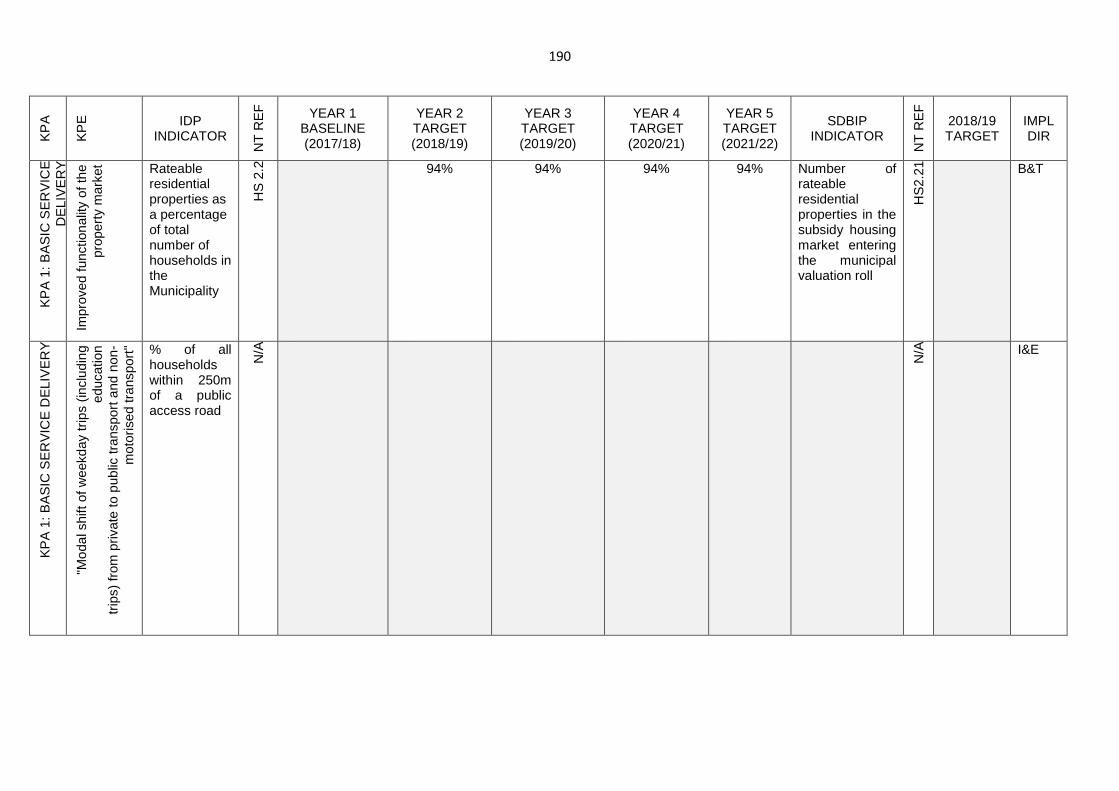
190
KP
A
KP
E
IDP INDICATOR
NT
RE
F
YEAR 1 BASELINE (2017/18)
YEAR 2 TARGET (2018/19)
YEAR 3 TARGET (2019/20)
YEAR 4 TARGET (2020/21)
YEAR 5 TARGET (2021/22)
SDBIP INDICATOR
NT
RE
F
2018/19 TARGET
IMPL DIR
KP
A 1
: BA
SIC
SE
RV
ICE
D
ELI
VE
RY
Impr
oved
func
tiona
lity
of th
e pr
oper
ty m
arke
t Rateable residential properties as a percentage of total number of households in the Municipality
HS
2.2
94% 94% 94% 94% Number of rateable residential properties in the subsidy housing market entering the municipal valuation roll
HS
2.21
B&T
KP
A 1
: BA
SIC
SE
RV
ICE
DE
LIV
ER
Y
"Mod
al s
hift
of w
eekd
ay tr
ips
(incl
udin
g ed
ucat
ion
trip
s) fr
om p
rivat
e to
pub
lic tr
ansp
ort a
nd n
on-
mot
oris
ed tr
ansp
ort"
% of all households within 250m of a public access road
N/A
N/A
I&E
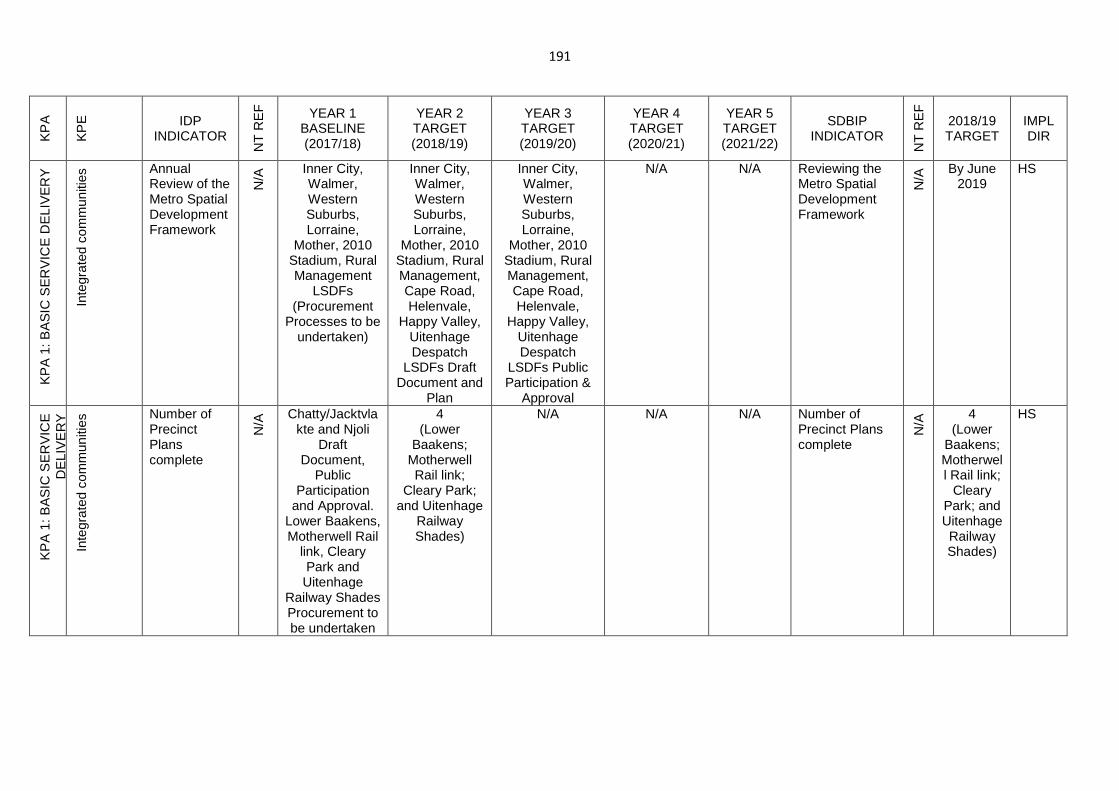
191
KP
A
KP
E
IDP INDICATOR
NT
RE
F
YEAR 1 BASELINE (2017/18)
YEAR 2 TARGET (2018/19)
YEAR 3 TARGET (2019/20)
YEAR 4 TARGET (2020/21)
YEAR 5 TARGET (2021/22)
SDBIP INDICATOR
NT
RE
F
2018/19 TARGET
IMPL DIR
KP
A 1
: BA
SIC
SE
RV
ICE
DE
LIV
ER
Y
Inte
grat
ed c
omm
uniti
es Annual
Review of the Metro Spatial Development Framework
N/A
Inner City, Walmer, Western Suburbs, Lorraine,
Mother, 2010 Stadium, Rural Management
LSDFs (Procurement
Processes to be undertaken)
Inner City, Walmer, Western Suburbs, Lorraine,
Mother, 2010 Stadium, Rural Management, Cape Road, Helenvale,
Happy Valley, Uitenhage Despatch
LSDFs Draft Document and
Plan
Inner City, Walmer, Western Suburbs, Lorraine,
Mother, 2010 Stadium, Rural Management, Cape Road, Helenvale,
Happy Valley, Uitenhage Despatch
LSDFs Public Participation &
Approval
N/A N/A Reviewing the Metro Spatial Development Framework
N/A
By June 2019
HS
KP
A 1
: BA
SIC
SE
RV
ICE
D
ELI
VE
RY
Inte
grat
ed c
omm
uniti
es Number of
Precinct Plans complete
N/A
Chatty/Jacktvlakte and Njoli
Draft Document,
Public Participation
and Approval. Lower Baakens, Motherwell Rail
link, Cleary Park and Uitenhage
Railway Shades Procurement to be undertaken
4 (Lower
Baakens; Motherwell Rail link;
Cleary Park; and Uitenhage
Railway Shades)
N/A N/A N/A Number of Precinct Plans complete
N/A
4 (Lower
Baakens; Motherwell Rail link;
Cleary Park; and Uitenhage Railway Shades)
HS
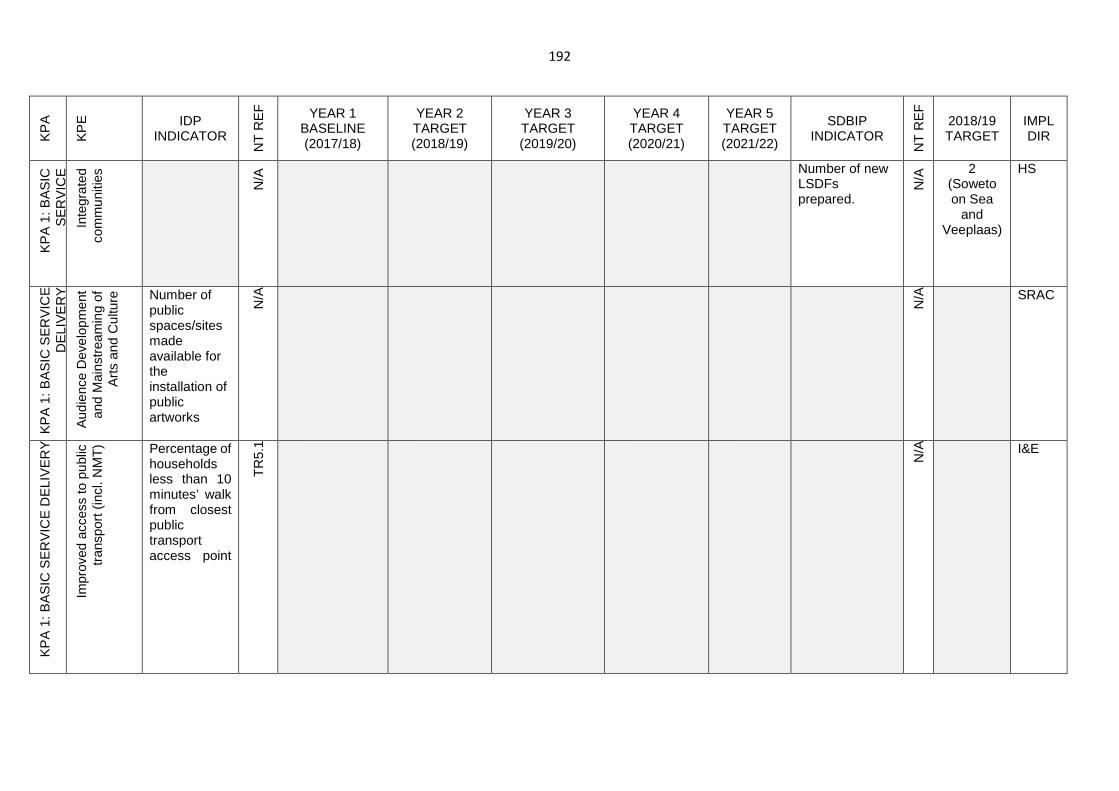
192
KP
A
KP
E
IDP INDICATOR
NT
RE
F
YEAR 1 BASELINE (2017/18)
YEAR 2 TARGET (2018/19)
YEAR 3 TARGET (2019/20)
YEAR 4 TARGET (2020/21)
YEAR 5 TARGET (2021/22)
SDBIP INDICATOR
NT
RE
F
2018/19 TARGET
IMPL DIR
KP
A 1
: BA
SIC
S
ER
VIC
E
Inte
grat
ed
com
mun
ities
N/A
Number of new LSDFs prepared.
N/A
2 (Soweto on Sea
and Veeplaas)
HS
KP
A 1
: BA
SIC
SE
RV
ICE
D
ELI
VE
RY
Aud
ienc
e D
evel
opm
ent
and
Mai
nstr
eam
ing
of
Art
s an
d C
ultu
re
Number of public spaces/sites made available for the installation of public artworks
N/A
N/A
SRAC
KP
A 1
: BA
SIC
SE
RV
ICE
DE
LIV
ER
Y
Impr
oved
acc
ess
to p
ublic
tr
ansp
ort (
incl
. NM
T) Percentage of
households less than 10 minutes’ walk from closest public transport access point
TR
5.1
N/A
I&E
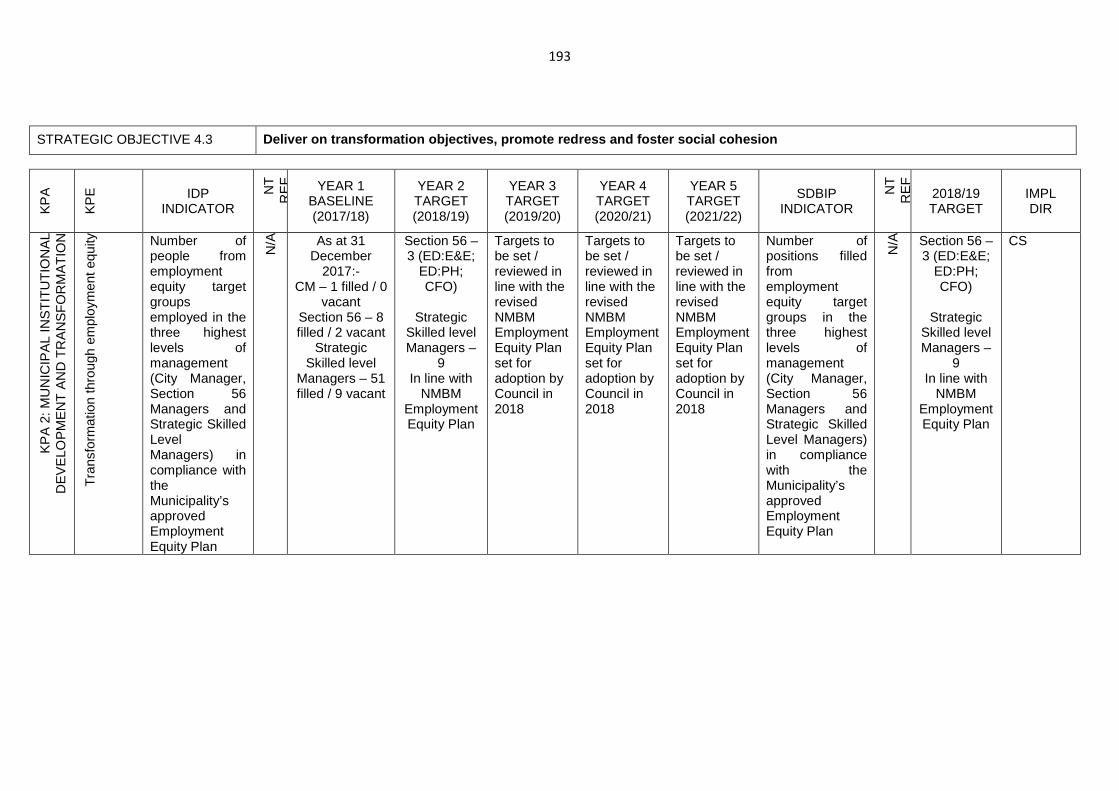
193
STRATEGIC OBJECTIVE 4.3 Deliver on transformation objectives, promote redre ss and foster social cohesion
KP
A
KP
E
IDP INDICATOR
NT
R
EF
YEAR 1 BASELINE (2017/18)
YEAR 2 TARGET (2018/19)
YEAR 3 TARGET (2019/20)
YEAR 4 TARGET (2020/21)
YEAR 5 TARGET (2021/22)
SDBIP INDICATOR
NT
R
EF
2018/19 TARGET
IMPL DIR
KP
A 2
: MU
NIC
IPA
L IN
ST
ITU
TIO
NA
L D
EV
ELO
PM
EN
T A
ND
TR
AN
SF
OR
MA
TIO
N
Tra
nsfo
rmat
ion
thro
ugh
empl
oym
ent e
quity
Number of people from employment equity target groups employed in the three highest levels of management (City Manager, Section 56 Managers and Strategic Skilled Level Managers) in compliance with the Municipality’s approved Employment Equity Plan
N/A
As at 31 December
2017:- CM – 1 filled / 0
vacant Section 56 – 8 filled / 2 vacant
Strategic Skilled level
Managers – 51 filled / 9 vacant
Section 56 – 3 (ED:E&E;
ED:PH; CFO)
Strategic
Skilled level Managers –
9 In line with
NMBM Employment Equity Plan
Targets to be set / reviewed in line with the revised NMBM Employment Equity Plan set for adoption by Council in 2018
Targets to be set / reviewed in line with the revised NMBM Employment Equity Plan set for adoption by Council in 2018
Targets to be set / reviewed in line with the revised NMBM Employment Equity Plan set for adoption by Council in 2018
Number of positions filled from employment equity target groups in the three highest levels of management (City Manager, Section 56 Managers and Strategic Skilled Level Managers) in compliance with the Municipality’s approved Employment Equity Plan
N/A
Section 56 – 3 (ED:E&E;
ED:PH; CFO)
Strategic
Skilled level Managers –
9 In line with
NMBM Employment Equity Plan
CS
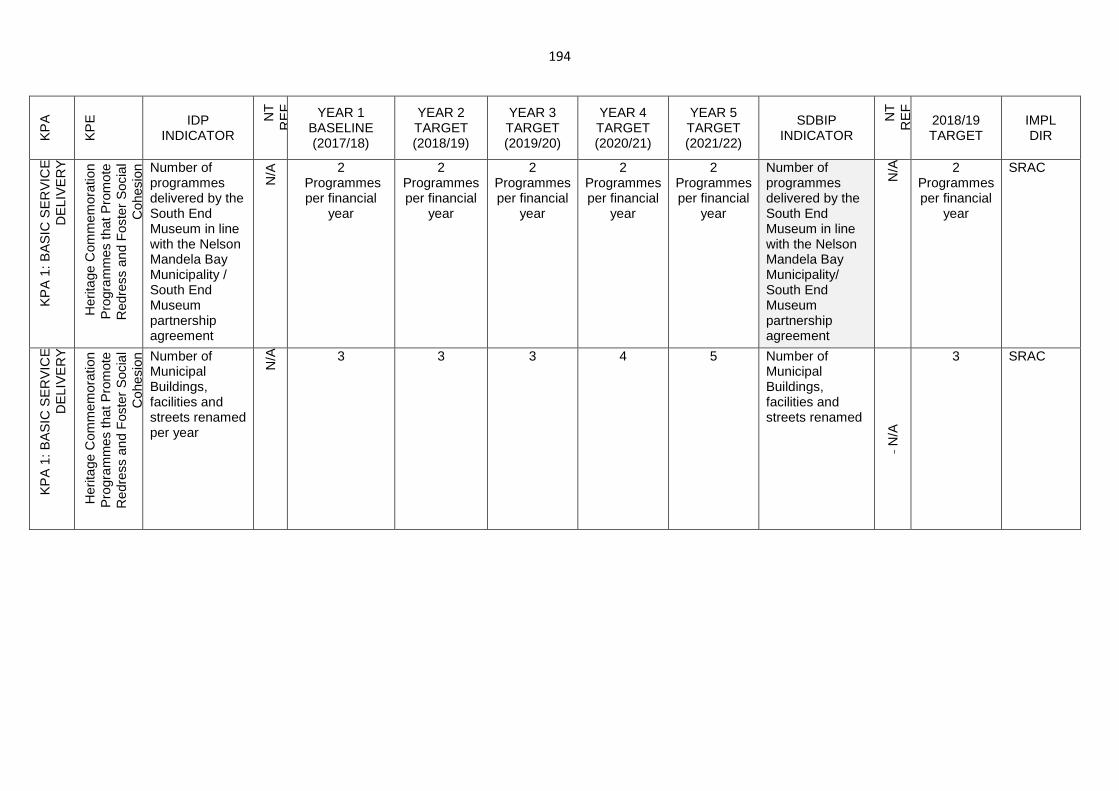
194
KP
A
KP
E
IDP INDICATOR
NT
R
EF
YEAR 1 BASELINE (2017/18)
YEAR 2 TARGET (2018/19)
YEAR 3 TARGET (2019/20)
YEAR 4 TARGET (2020/21)
YEAR 5 TARGET (2021/22)
SDBIP INDICATOR
NT
R
EF
2018/19 TARGET
IMPL DIR
KP
A 1
: BA
SIC
SE
RV
ICE
D
ELI
VE
RY
Her
itage
Com
mem
orat
ion
Pro
gram
mes
that
Pro
mot
e R
edre
ss a
nd F
oste
r S
ocia
l C
ohes
ion Number of
programmes delivered by the South End Museum in line with the Nelson Mandela Bay Municipality / South End Museum partnership agreement
N/A
2 Programmes per financial
year
2 Programmes per financial
year
2 Programmes per financial
year
2 Programmes per financial
year
2 Programmes per financial
year
Number of programmes delivered by the South End Museum in line with the Nelson Mandela Bay Municipality/ South End Museum partnership agreement
N/A
2 Programmes per financial
year
SRAC
KP
A 1
: BA
SIC
SE
RV
ICE
D
ELI
VE
RY
Her
itage
Com
mem
orat
ion
Pro
gram
mes
that
Pro
mot
e R
edre
ss a
nd F
oste
r S
ocia
l C
ohes
ion Number of
Municipal Buildings, facilities and streets renamed per year
N/A
3 3 3 4 5 Number of Municipal Buildings, facilities and streets renamed
N/A
3 SRAC
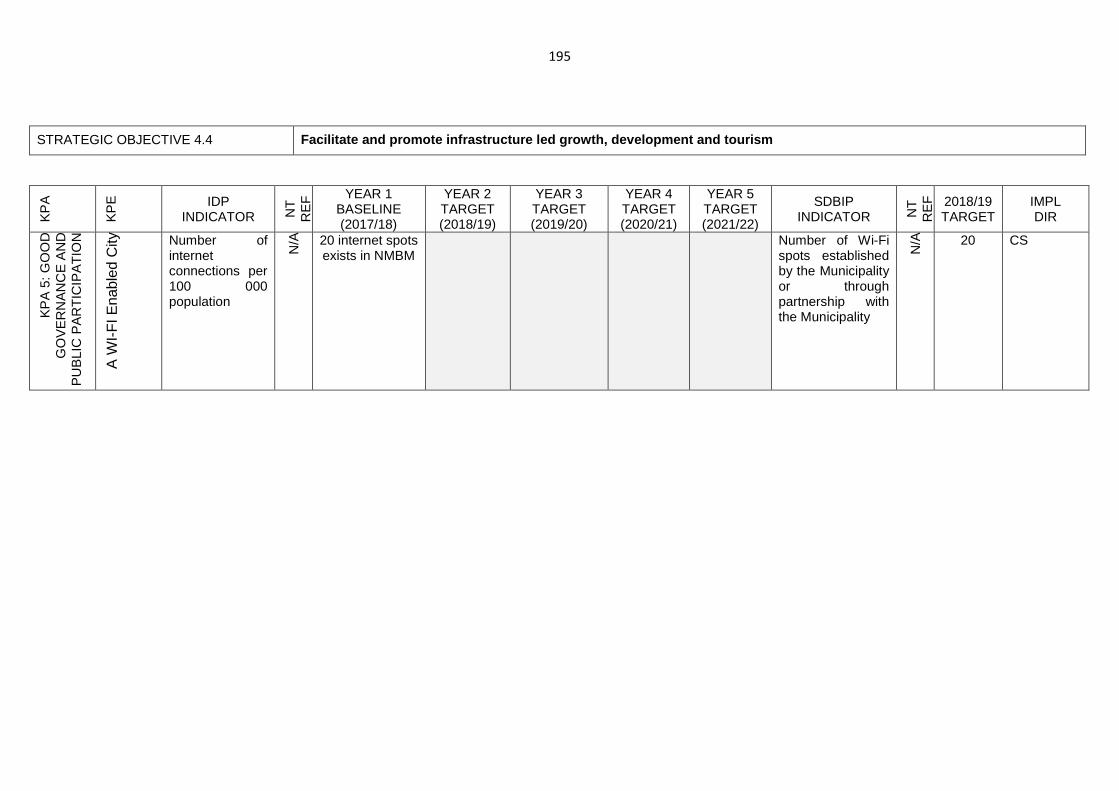
195
STRATEGIC OBJECTIVE 4.4 Facilitate and promote infrastructure led growth, d evelopment and tourism
KP
A
KP
E
IDP INDICATOR N
T
RE
F YEAR 1
BASELINE (2017/18)
YEAR 2 TARGET (2018/19)
YEAR 3 TARGET (2019/20)
YEAR 4 TARGET (2020/21)
YEAR 5 TARGET (2021/22)
SDBIP INDICATOR N
T
RE
F
2018/19 TARGET
IMPL DIR
KP
A 5
: GO
OD
G
OV
ER
NA
NC
E A
ND
P
UB
LIC
PA
RT
ICIP
AT
ION
A W
I-F
I Ena
bled
City
Number of internet connections per 100 000 population
N/A
20 internet spots exists in NMBM
Number of Wi-Fi spots established by the Municipality or through partnership with the Municipality
N/A
20 CS
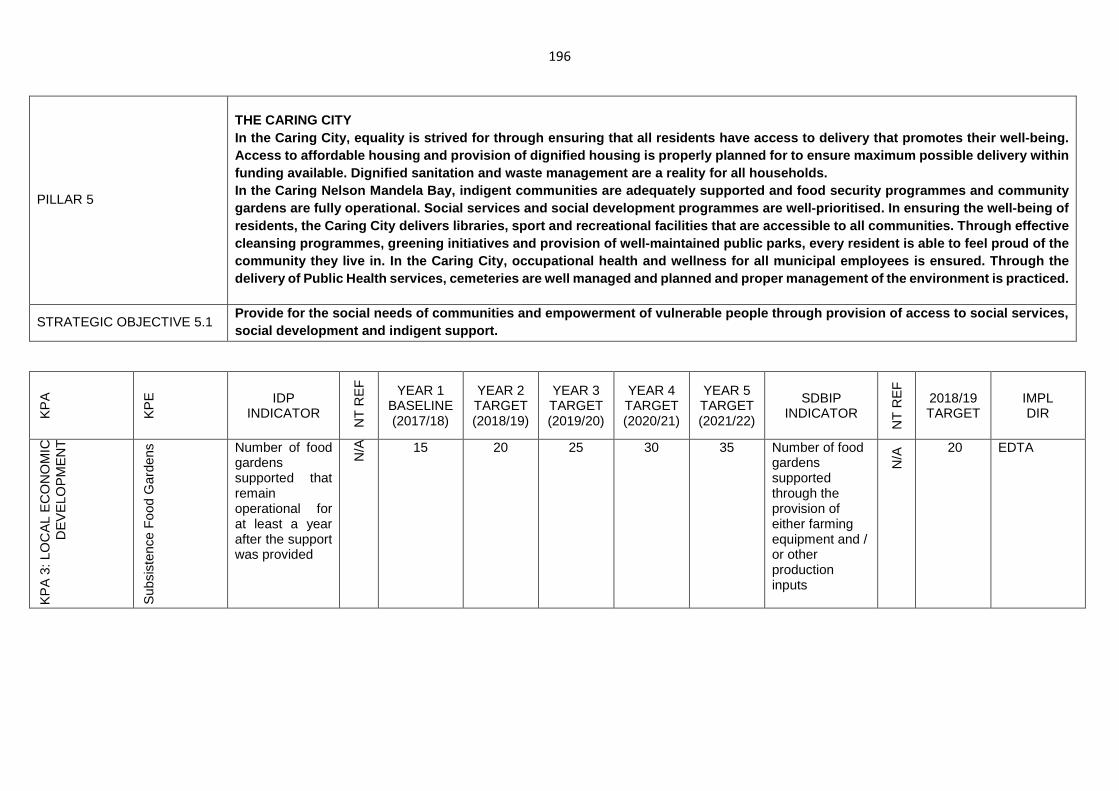
196
PILLAR 5
THE CARING CITY In the Caring City, equality is strived for through ensuring that all residents have access to deliver y that promotes their well-being. Access to affordable housing and provision of digni fied housing is properly planned for to ensure maxi mum possible delivery within funding available. Dignified sanitation and waste m anagement are a reality for all households. In the Caring Nelson Mandela Bay, indigent communit ies are adequately supported and food security prog rammes and community gardens are fully operational. Social services and social development programmes are well-prioritised. In ensuring the well-being of residents, the Caring City delivers libraries, spor t and recreational facilities that are accessible t o all communities. Through effective cleansing programmes, greening initiatives and prov ision of well-maintained public parks, every reside nt is able to feel proud of the community they live in. In the Caring City, occupat ional health and wellness for all municipal employe es is ensured. Through the delivery of Public Health services, cemeteries are well managed and planned and proper management of t he environment is practiced.
STRATEGIC OBJECTIVE 5.1 Provide for the social needs of communities and emp owerment of vulnerable people through provision of access to social services, social development and indigent support.
KP
A
KP
E
IDP INDICATOR
NT
RE
F
YEAR 1 BASELINE (2017/18)
YEAR 2 TARGET (2018/19)
YEAR 3 TARGET (2019/20)
YEAR 4 TARGET (2020/21)
YEAR 5 TARGET (2021/22)
SDBIP INDICATOR
NT
RE
F
2018/19 TARGET
IMPL DIR
KP
A 3
: LO
CA
L E
CO
NO
MIC
D
EV
ELO
PM
EN
T
Sub
sist
ence
Foo
d G
arde
ns
Number of food gardens supported that remain operational for at least a year after the support was provided
N/A
15 20 25 30 35 Number of food gardens supported through the provision of either farming equipment and / or other production inputs
N/A
20 EDTA
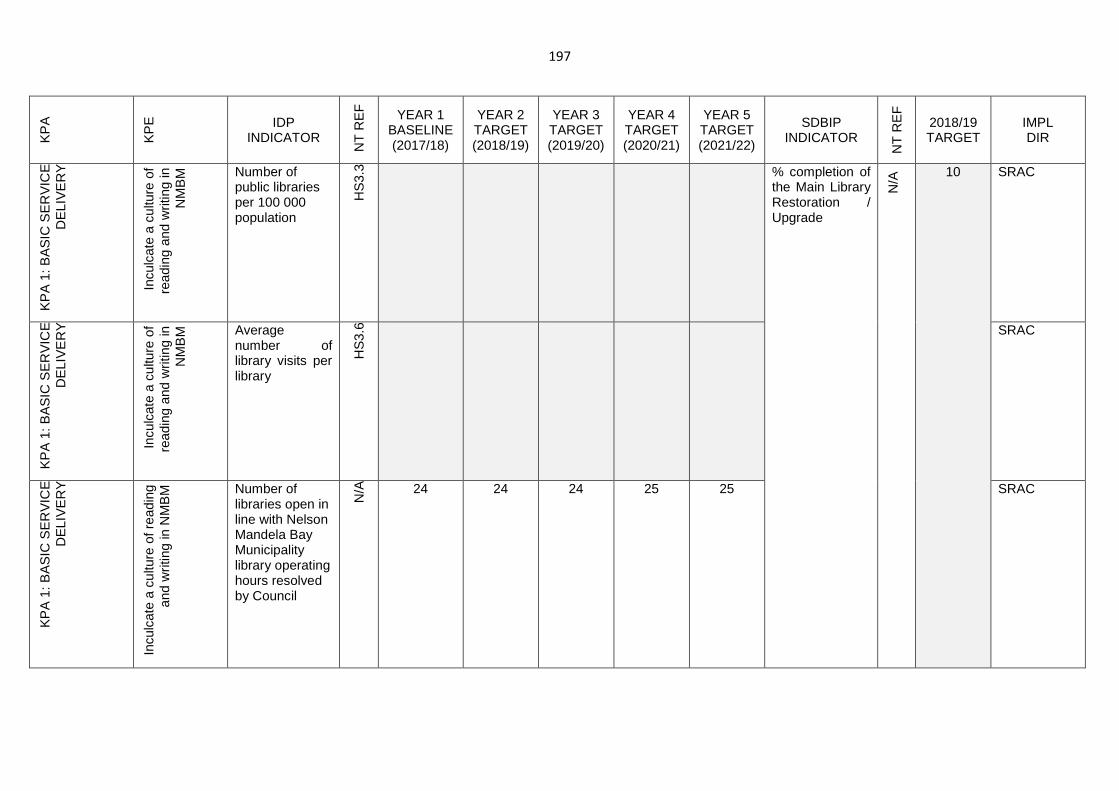
197
KP
A
KP
E
IDP INDICATOR
NT
RE
F
YEAR 1 BASELINE (2017/18)
YEAR 2 TARGET (2018/19)
YEAR 3 TARGET (2019/20)
YEAR 4 TARGET (2020/21)
YEAR 5 TARGET (2021/22)
SDBIP INDICATOR
NT
RE
F
2018/19 TARGET
IMPL DIR
KP
A 1
: BA
SIC
SE
RV
ICE
D
ELI
VE
RY
Incu
lcat
e a
cultu
re o
f re
adin
g an
d w
ritin
g in
N
MB
M
Number of public libraries per 100 000 population
HS
3.3 % completion of
the Main Library Restoration / Upgrade
N/A
10
SRAC
KP
A 1
: BA
SIC
SE
RV
ICE
D
ELI
VE
RY
Incu
lcat
e a
cultu
re o
f re
adin
g an
d w
ritin
g in
N
MB
M
Average number of library visits per library
HS
3.6 SRAC
KP
A 1
: BA
SIC
SE
RV
ICE
D
ELI
VE
RY
Incu
lcat
e a
cultu
re o
f rea
ding
an
d w
ritin
g in
NM
BM
Number of libraries open in line with Nelson Mandela Bay Municipality library operating hours resolved by Council
N/A
24 24 24 25 25 SRAC
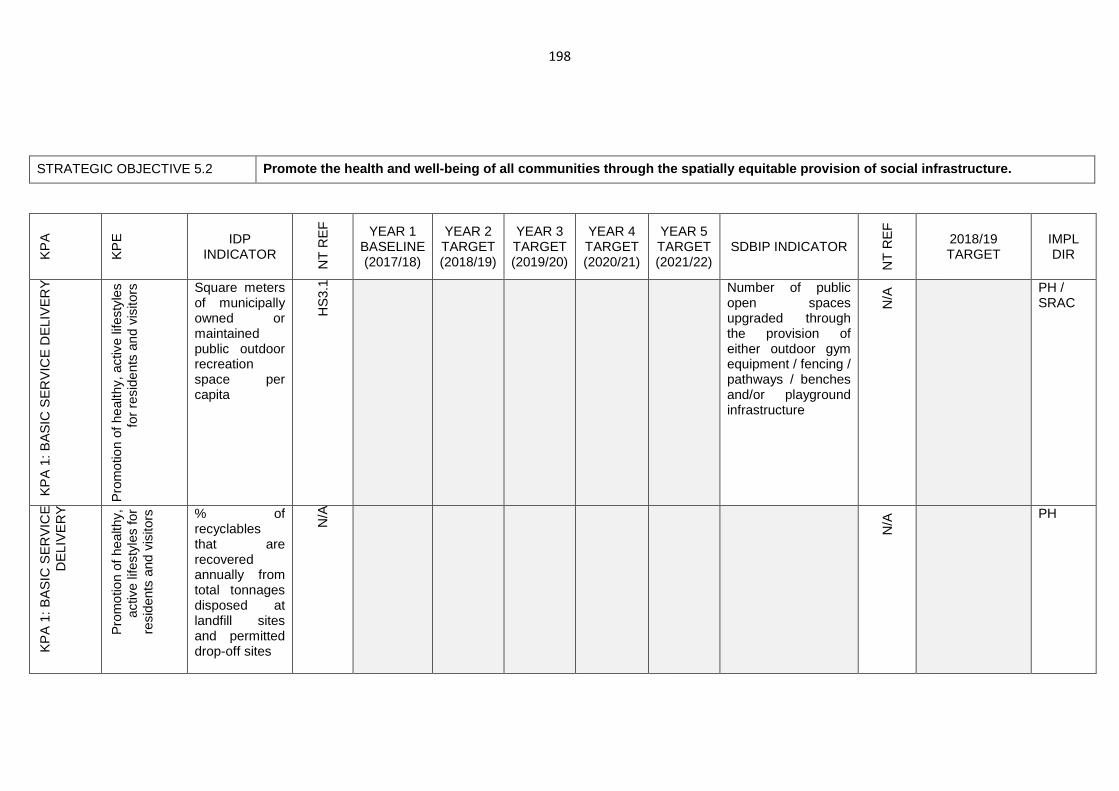
198
STRATEGIC OBJECTIVE 5.2 Promote the health and well-being of all communitie s through the spatially equitable provision of soci al infrastructure.
KP
A
KP
E
IDP INDICATOR
NT
RE
F
YEAR 1 BASELINE (2017/18)
YEAR 2 TARGET (2018/19)
YEAR 3 TARGET (2019/20)
YEAR 4 TARGET (2020/21)
YEAR 5 TARGET (2021/22)
SDBIP INDICATOR
NT
RE
F
2018/19 TARGET
IMPL DIR
KP
A 1
: BA
SIC
SE
RV
ICE
DE
LIV
ER
Y
Pro
mot
ion
of h
ealth
y, a
ctiv
e lif
esty
les
for
resi
dent
s an
d vi
sito
rs
Square meters of municipally owned or maintained public outdoor recreation space per capita
HS
3.1
Number of public open spaces upgraded through the provision of either outdoor gym equipment / fencing / pathways / benches and/or playground infrastructure
N/A
PH / SRAC
KP
A 1
: BA
SIC
SE
RV
ICE
D
ELI
VE
RY
Pro
mot
ion
of h
ealth
y,
activ
e lif
esty
les
for
resi
dent
s an
d vi
sito
rs
% of recyclables that are recovered annually from total tonnages disposed at landfill sites and permitted drop-off sites
N/A
N/A
PH
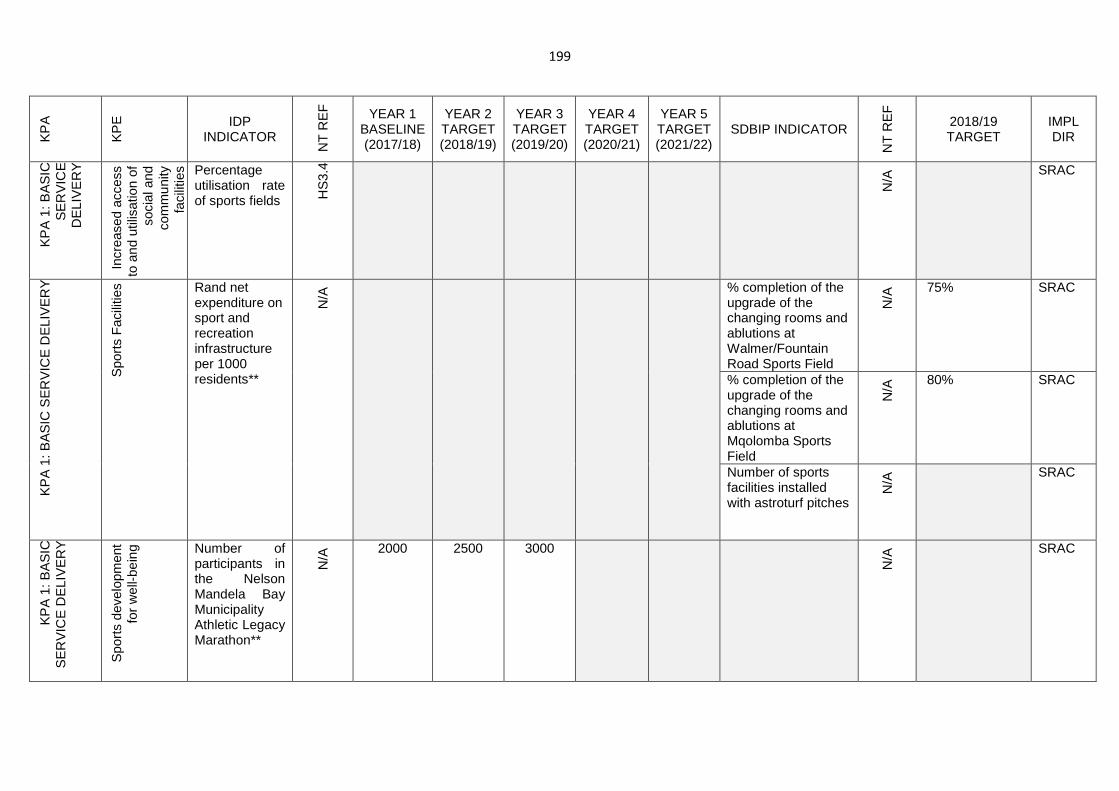
199
KP
A
KP
E
IDP INDICATOR
NT
RE
F
YEAR 1 BASELINE (2017/18)
YEAR 2 TARGET (2018/19)
YEAR 3 TARGET (2019/20)
YEAR 4 TARGET (2020/21)
YEAR 5 TARGET (2021/22)
SDBIP INDICATOR
NT
RE
F
2018/19 TARGET
IMPL DIR
KP
A 1
: BA
SIC
S
ER
VIC
E
DE
LIV
ER
Y
Incr
ease
d ac
cess
to
and
util
isat
ion
of
soci
al a
nd
com
mun
ity
faci
litie
s
Percentage utilisation rate of sports fields H
S3.
4
N/A
SRAC
KP
A 1
: BA
SIC
SE
RV
ICE
DE
LIV
ER
Y
Spo
rts
Fac
ilitie
s Rand net expenditure on sport and recreation infrastructure per 1000 residents**
N/A
% completion of the upgrade of the changing rooms and ablutions at Walmer/Fountain Road Sports Field
N/A
75% SRAC
% completion of the upgrade of the changing rooms and ablutions at Mqolomba Sports Field
N/A
80% SRAC
Number of sports facilities installed with astroturf pitches
N/A
SRAC
KP
A 1
: BA
SIC
S
ER
VIC
E D
ELI
VE
RY
Spo
rts
deve
lopm
ent
for
wel
l-bei
ng
Number of participants in the Nelson Mandela Bay Municipality Athletic Legacy Marathon**
N/A
2000 2500 3000
N/A
SRAC
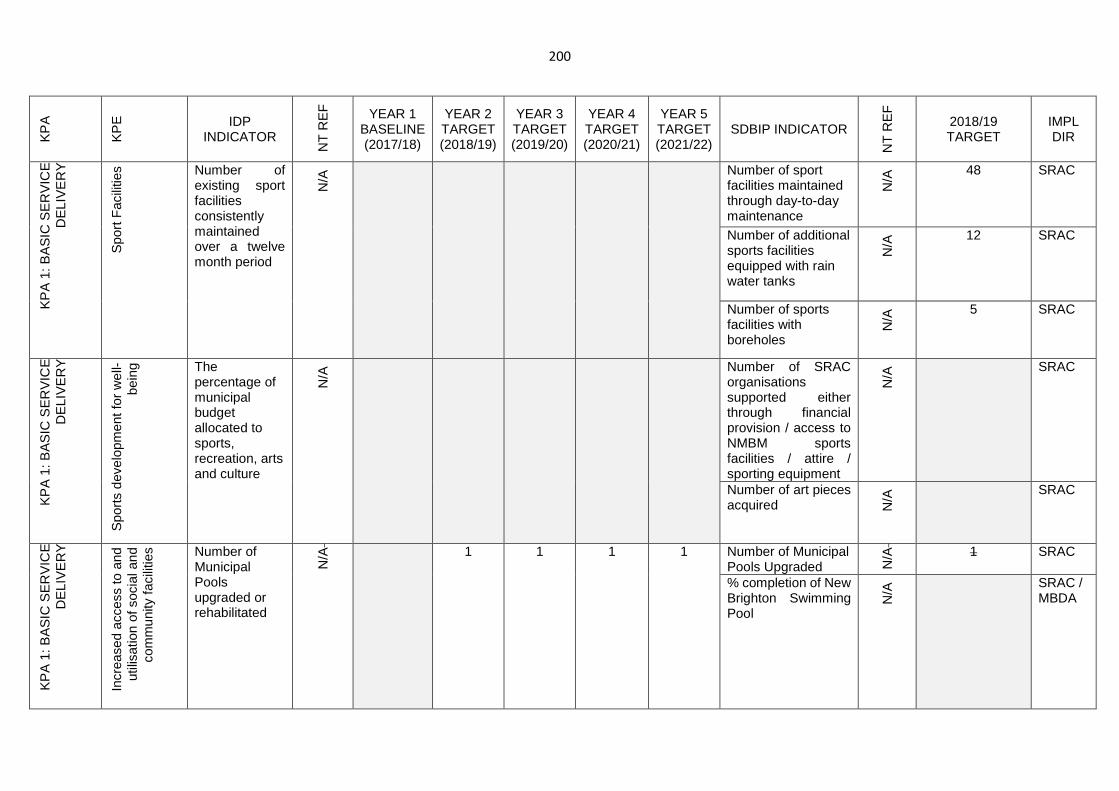
200
KP
A
KP
E
IDP INDICATOR
NT
RE
F
YEAR 1 BASELINE (2017/18)
YEAR 2 TARGET (2018/19)
YEAR 3 TARGET (2019/20)
YEAR 4 TARGET (2020/21)
YEAR 5 TARGET (2021/22)
SDBIP INDICATOR
NT
RE
F
2018/19 TARGET
IMPL DIR
KP
A 1
: BA
SIC
SE
RV
ICE
D
ELI
VE
RY
Spo
rt F
acili
ties Number of
existing sport facilities consistently maintained over a twelve month period
N/A
Number of sport facilities maintained through day-to-day maintenance
N/A
48 SRAC
Number of additional sports facilities equipped with rain water tanks
N/A
12 SRAC
Number of sports facilities with boreholes
N/A
5 SRAC
KP
A 1
: BA
SIC
SE
RV
ICE
D
ELI
VE
RY
Spo
rts
deve
lopm
ent f
or w
ell-
bein
g The percentage of municipal budget allocated to sports, recreation, arts and culture
N/A
Number of SRAC organisations supported either through financial provision / access to NMBM sports facilities / attire / sporting equipment
N/A
SRAC
Number of art pieces acquired
N/A
SRAC
KP
A 1
: BA
SIC
SE
RV
ICE
D
ELI
VE
RY
Incr
ease
d ac
cess
to a
nd
utili
satio
n of
soc
ial a
nd
com
mun
ity fa
cilit
ies Number of
Municipal Pools upgraded or rehabilitated
N/A
1 1 1 1 Number of Municipal Pools Upgraded N
/A
1 SRAC
% completion of New Brighton Swimming Pool
N/A
SRAC / MBDA
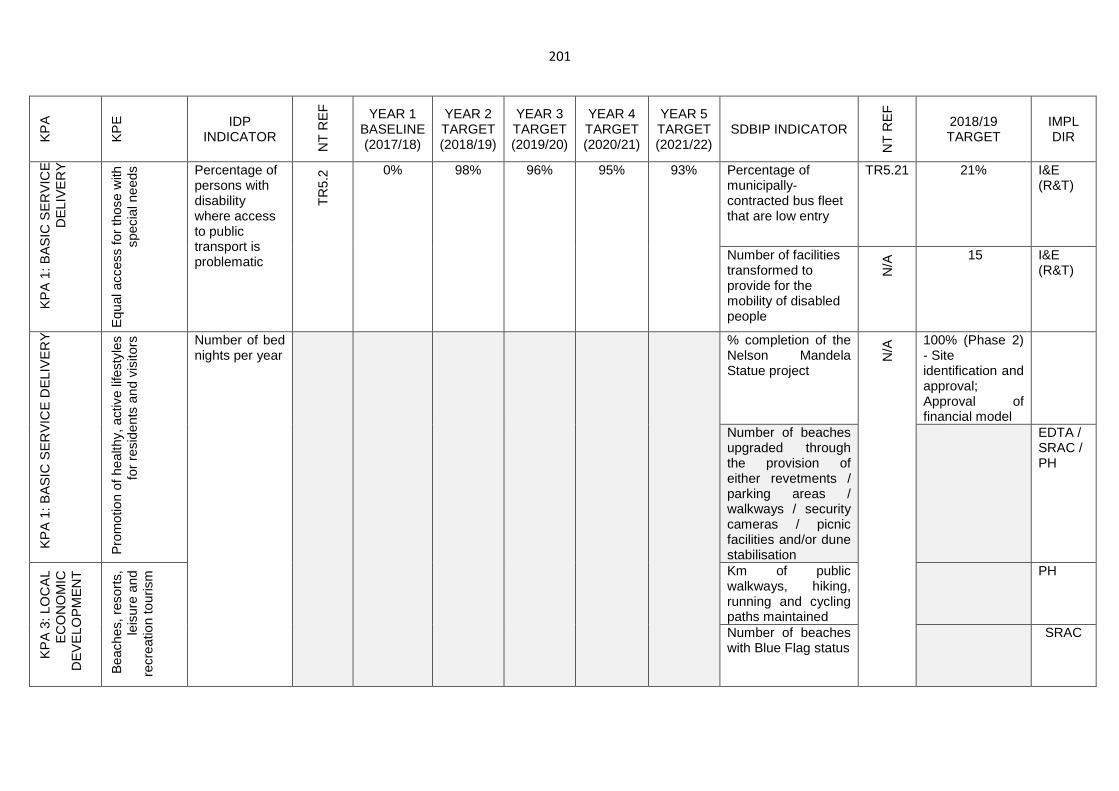
201
KP
A
KP
E
IDP INDICATOR
NT
RE
F
YEAR 1 BASELINE (2017/18)
YEAR 2 TARGET (2018/19)
YEAR 3 TARGET (2019/20)
YEAR 4 TARGET (2020/21)
YEAR 5 TARGET (2021/22)
SDBIP INDICATOR
NT
RE
F
2018/19 TARGET
IMPL DIR
KP
A 1
: BA
SIC
SE
RV
ICE
D
ELI
VE
RY
Equ
al a
cces
s fo
r th
ose
with
sp
ecia
l nee
ds
Percentage of persons with disability where access to public transport is problematic
TR
5.2 0% 98% 96% 95% 93% Percentage of
municipally-contracted bus fleet that are low entry
TR5.21 21% I&E (R&T)
Number of facilities transformed to provide for the mobility of disabled people
N/A
15 I&E (R&T)
KP
A 1
: BA
SIC
SE
RV
ICE
DE
LIV
ER
Y
Pro
mot
ion
of h
ealth
y, a
ctiv
e lif
esty
les
for
resi
dent
s an
d vi
sito
rs
Number of bed nights per year
% completion of the
Nelson Mandela Statue project
N/A
100% (Phase 2) - Site identification and approval; Approval of financial model
Number of beaches upgraded through the provision of either revetments / parking areas / walkways / security cameras / picnic facilities and/or dune stabilisation
EDTA / SRAC / PH
KP
A 3
: LO
CA
L E
CO
NO
MIC
D
EV
ELO
PM
EN
T
Bea
ches
, res
orts
, le
isur
e an
d re
crea
tion
tour
ism
Km of public walkways, hiking, running and cycling paths maintained
PH
Number of beaches with Blue Flag status
SRAC
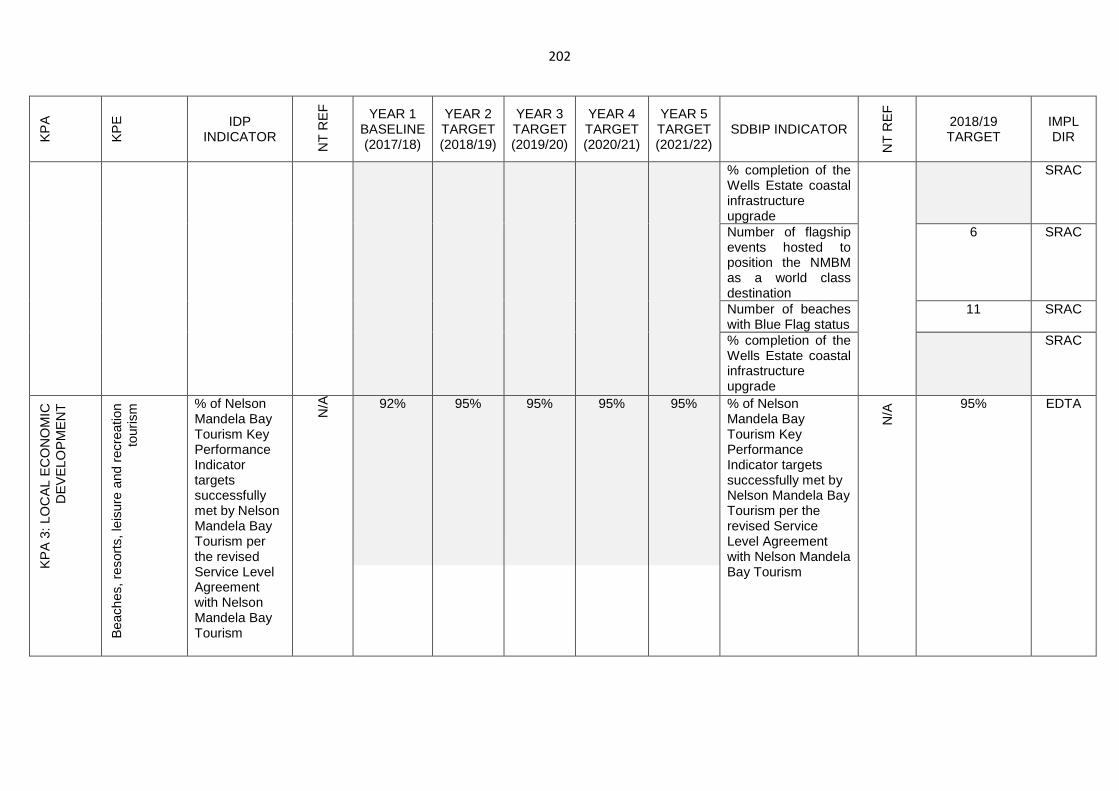
202
KP
A
KP
E
IDP INDICATOR
NT
RE
F
YEAR 1 BASELINE (2017/18)
YEAR 2 TARGET (2018/19)
YEAR 3 TARGET (2019/20)
YEAR 4 TARGET (2020/21)
YEAR 5 TARGET (2021/22)
SDBIP INDICATOR
NT
RE
F
2018/19 TARGET
IMPL DIR
% completion of the Wells Estate coastal infrastructure upgrade
SRAC
Number of flagship events hosted to position the NMBM as a world class destination
6 SRAC
Number of beaches with Blue Flag status
11 SRAC
% completion of the Wells Estate coastal infrastructure upgrade
SRAC
KP
A 3
: LO
CA
L E
CO
NO
MIC
D
EV
ELO
PM
EN
T
Bea
ches
, res
orts
, lei
sure
and
rec
reat
ion
tour
ism
% of Nelson Mandela Bay Tourism Key Performance Indicator targets successfully met by Nelson Mandela Bay Tourism per the revised Service Level Agreement with Nelson Mandela Bay Tourism
N/A
92% 95% 95% 95% 95% % of Nelson Mandela Bay Tourism Key Performance Indicator targets successfully met by Nelson Mandela Bay Tourism per the revised Service Level Agreement with Nelson Mandela Bay Tourism
N/A
95% EDTA
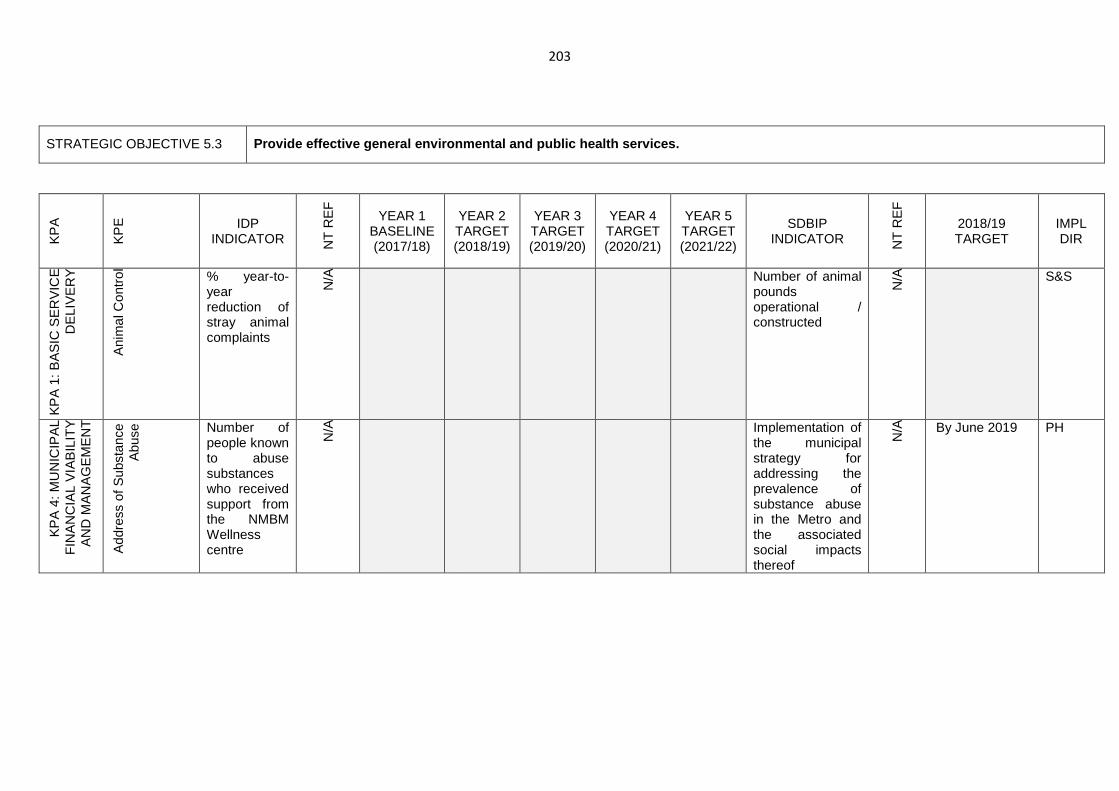
203
STRATEGIC OBJECTIVE 5.3 Provide effective general environmental and public health services.
KP
A
KP
E
IDP INDICATOR N
T R
EF
YEAR 1 BASELINE (2017/18)
YEAR 2 TARGET (2018/19)
YEAR 3 TARGET (2019/20)
YEAR 4 TARGET (2020/21)
YEAR 5 TARGET (2021/22)
SDBIP INDICATOR N
T R
EF
2018/19 TARGET
IMPL DIR
KP
A 1
: BA
SIC
SE
RV
ICE
D
ELI
VE
RY
Ani
mal
Con
trol
% year-to-year reduction of stray animal complaints
N/A
Number of animal pounds operational / constructed
N/A
S&S
KP
A 4
: MU
NIC
IPA
L F
INA
NC
IAL
VIA
BIL
ITY
A
ND
MA
NA
GE
ME
NT
Add
ress
of S
ubst
ance
A
buse
Number of people known to abuse substances who received support from the NMBM Wellness centre
N/A
Implementation of the municipal strategy for addressing the prevalence of substance abuse in the Metro and the associated social impacts thereof
N/A
By June 2019 PH
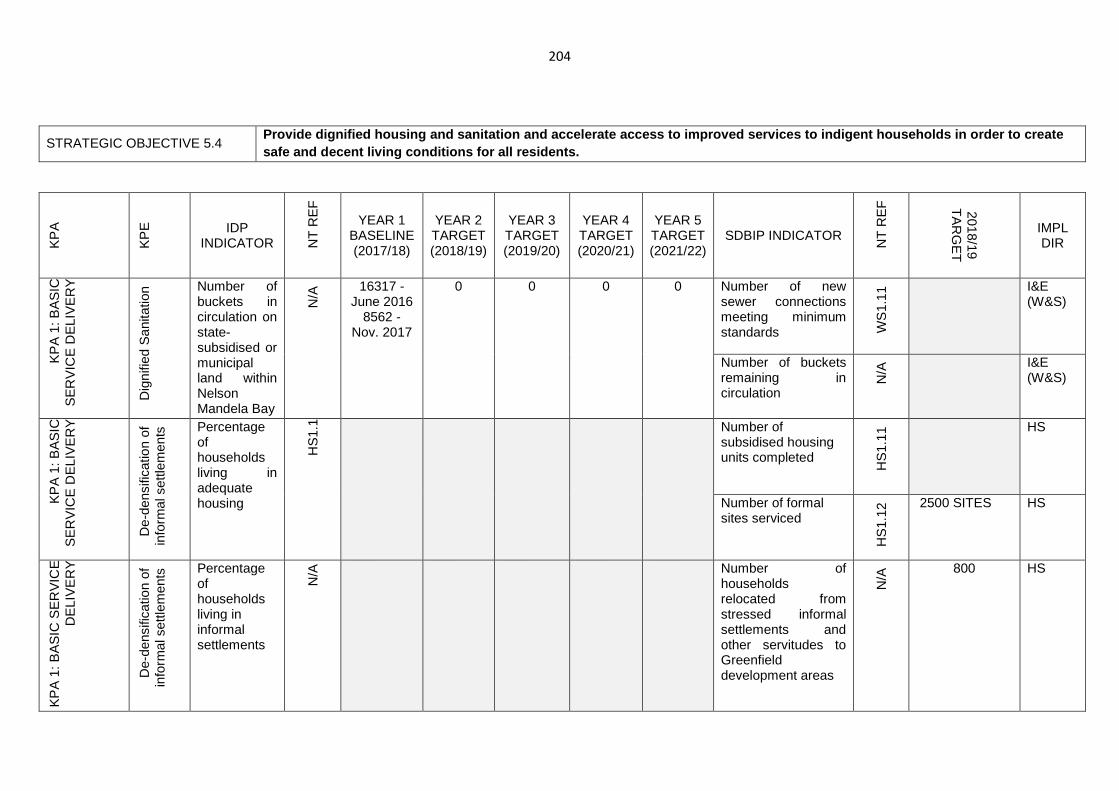
204
STRATEGIC OBJECTIVE 5.4 Provide dignified housing and sanitation and accele rate access to improved services to indigent househ olds in order to create safe and decent living conditions for all residents .
KP
A
KP
E
IDP INDICATOR N
T R
EF
YEAR 1 BASELINE (2017/18)
YEAR 2 TARGET (2018/19)
YEAR 3 TARGET (2019/20)
YEAR 4 TARGET (2020/21)
YEAR 5 TARGET (2021/22)
SDBIP INDICATOR
NT
RE
F
2018/19 T
AR
GE
T
IMPL DIR
KP
A 1
: BA
SIC
S
ER
VIC
E D
ELI
VE
RY
Dig
nifie
d S
anita
tion Number of
buckets in circulation on state-subsidised or municipal land within Nelson Mandela Bay
N/A
16317 - June 2016
8562 - Nov. 2017
0 0 0 0 Number of new sewer connections meeting minimum standards W
S1.
11
I&E (W&S)
Number of buckets remaining in circulation
N/A
I&E (W&S)
KP
A 1
: BA
SIC
S
ER
VIC
E D
ELI
VE
RY
De-
dens
ifica
tion
of
info
rmal
set
tlem
ents
Percentage of households living in adequate housing
HS
1.1 Number of
subsidised housing units completed
HS
1.11
HS
Number of formal sites serviced
HS
1.12
2500 SITES HS
KP
A 1
: BA
SIC
SE
RV
ICE
D
ELI
VE
RY
De-
dens
ifica
tion
of
info
rmal
set
tlem
ents
Percentage of households living in informal settlements
N/A
Number of households relocated from stressed informal settlements and other servitudes to Greenfield development areas
N/A
800 HS
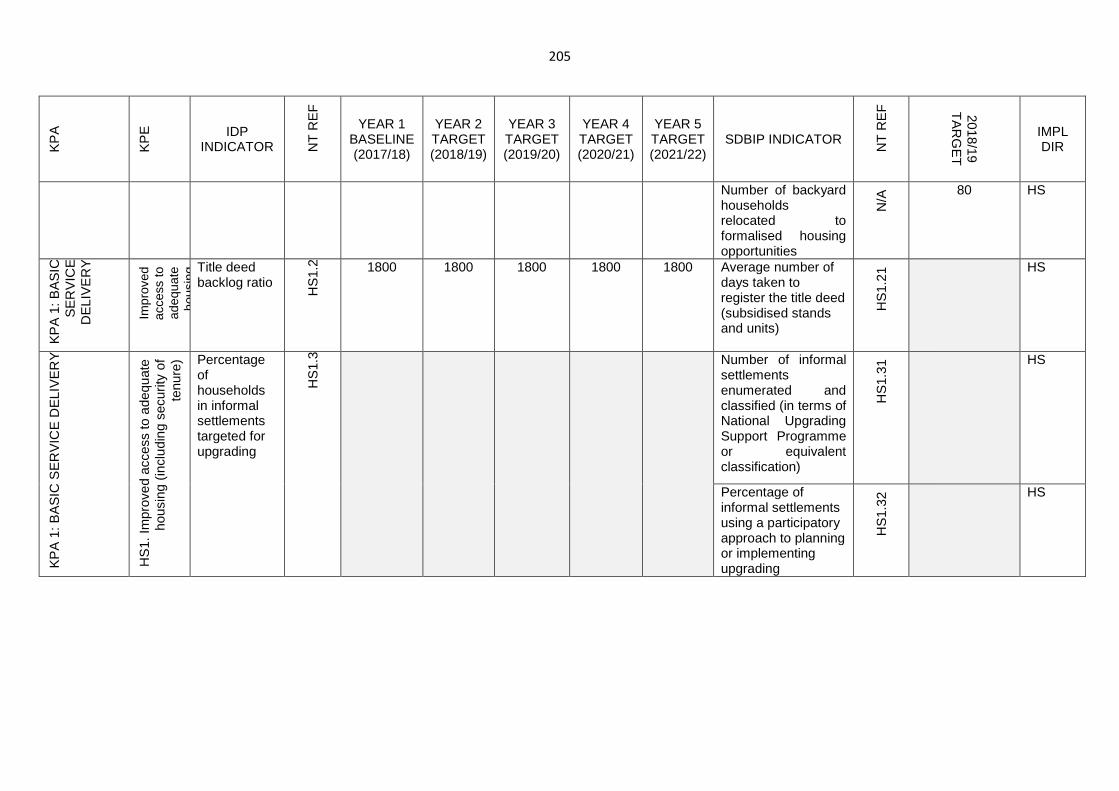
205
KP
A
KP
E
IDP INDICATOR N
T R
EF
YEAR 1 BASELINE (2017/18)
YEAR 2 TARGET (2018/19)
YEAR 3 TARGET (2019/20)
YEAR 4 TARGET (2020/21)
YEAR 5 TARGET (2021/22)
SDBIP INDICATOR
NT
RE
F
2018/19 T
AR
GE
T
IMPL DIR
Number of backyard households relocated to formalised housing opportunities
N/A
80 HS
KP
A 1
: BA
SIC
S
ER
VIC
E
DE
LIV
ER
Y
Impr
oved
ac
cess
to
adeq
uate
ho
usin
g Title deed backlog ratio
HS
1.2 1800 1800 1800 1800 1800 Average number of
days taken to register the title deed (subsidised stands and units)
HS
1.21
HS
KP
A 1
: BA
SIC
SE
RV
ICE
DE
LIV
ER
Y
HS
1. Im
prov
ed a
cces
s to
ade
quat
e ho
usin
g (in
clud
ing
secu
rity
of
tenu
re) Percentage
of households in informal settlements targeted for upgrading
HS
1.3
Number of informal settlements enumerated and classified (in terms of National Upgrading Support Programme or equivalent classification)
HS
1.31
HS
Percentage of informal settlements using a participatory approach to planning or implementing upgrading
HS
1.32
HS
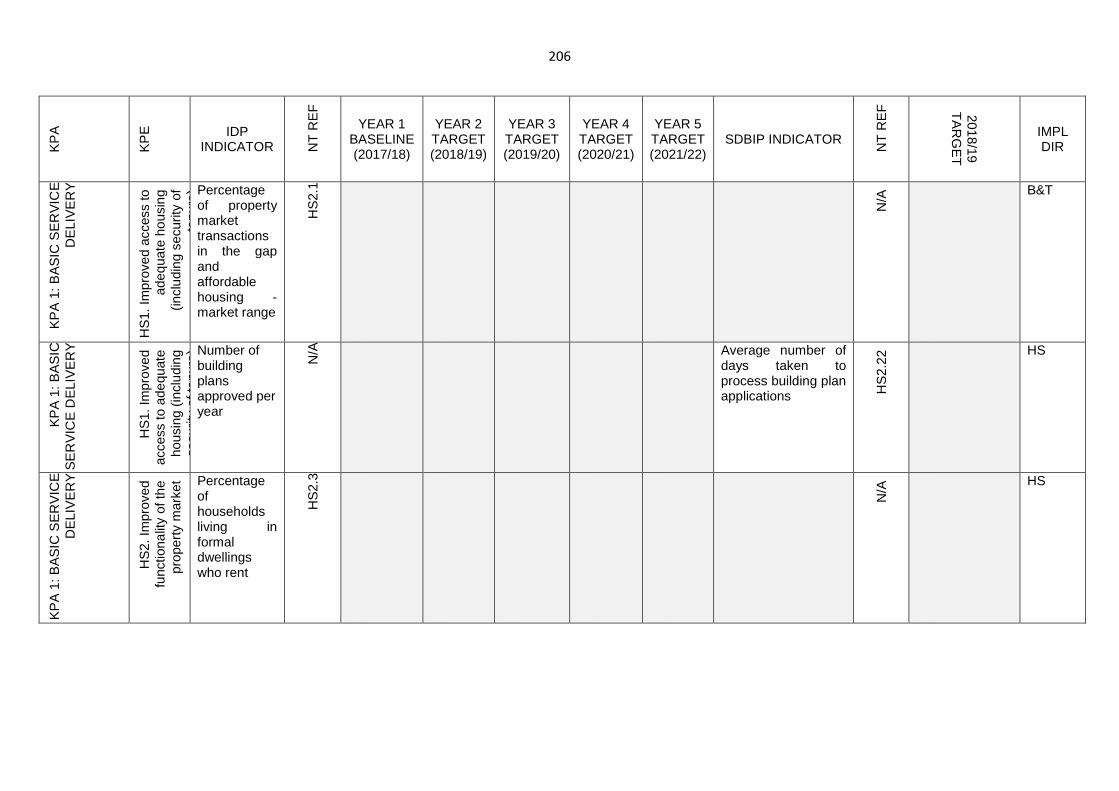
206
KP
A
KP
E
IDP INDICATOR N
T R
EF
YEAR 1 BASELINE (2017/18)
YEAR 2 TARGET (2018/19)
YEAR 3 TARGET (2019/20)
YEAR 4 TARGET (2020/21)
YEAR 5 TARGET (2021/22)
SDBIP INDICATOR
NT
RE
F
2018/19 T
AR
GE
T
IMPL DIR
KP
A 1
: BA
SIC
SE
RV
ICE
D
ELI
VE
RY
HS
1. Im
prov
ed a
cces
s to
ad
equa
te h
ousi
ng
(incl
udin
g se
curit
y of
te
nure
) Percentage of property market transactions in the gap and affordable housing -market range
HS
2.1
N/A
B&T
KP
A 1
: BA
SIC
S
ER
VIC
E D
ELI
VE
RY
HS
1. Im
prov
ed
acce
ss to
ade
quat
e ho
usin
g (in
clud
ing
secu
rity
of te
nure
) Number of building plans approved per year
N/A
Average number of days taken to process building plan applications H
S2.
22
HS
KP
A 1
: BA
SIC
SE
RV
ICE
D
ELI
VE
RY
HS
2. Im
prov
ed
func
tiona
lity
of th
e pr
oper
ty m
arke
t Percentage of households living in formal dwellings who rent
HS
2.3
N/A
HS
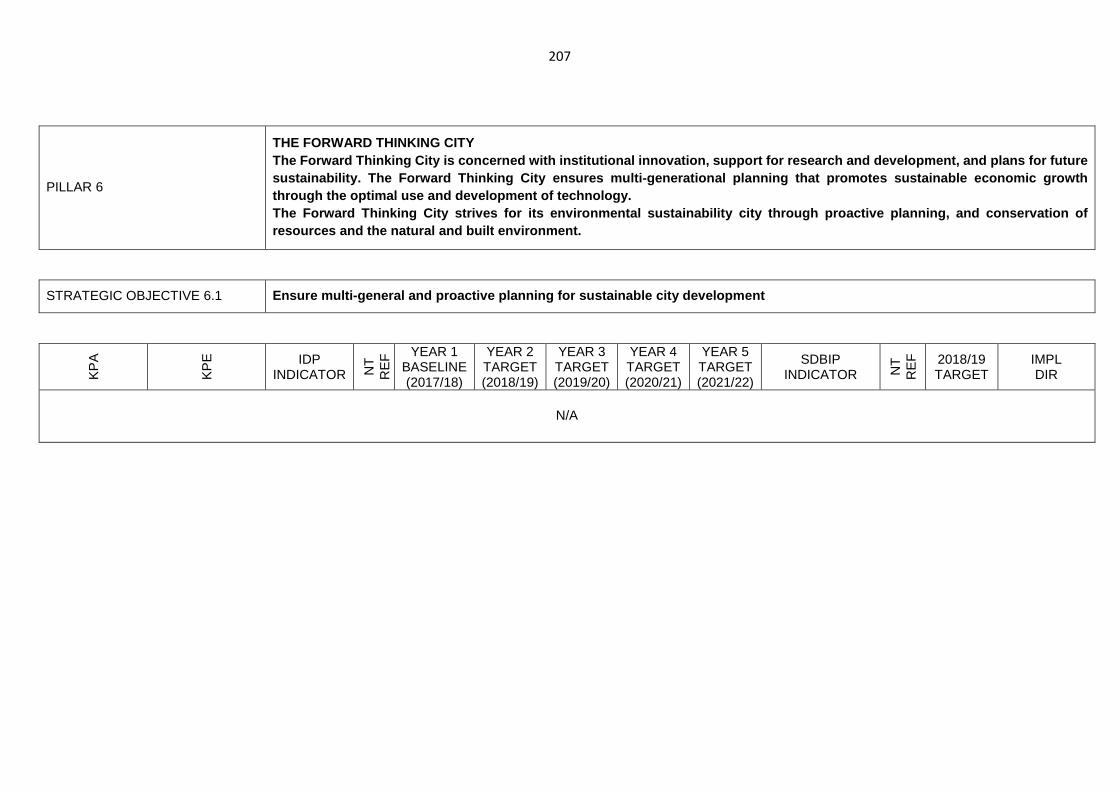
207
PILLAR 6
THE FORWARD THINKING CITY The Forward Thinking City is concerned with institu tional innovation, support for research and develop ment, and plans for future sustainability. The Forward Thinking City ensures m ulti-generational planning that promotes sustainabl e economic growth through the optimal use and development of technolo gy. The Forward Thinking City strives for its environme ntal sustainability city through proactive planning , and conservation of resources and the natural and built environment.
STRATEGIC OBJECTIVE 6.1 Ensure multi-general and proactive planning for sus tainable city development
KP
A
KP
E
IDP INDICATOR N
T
RE
F YEAR 1
BASELINE (2017/18)
YEAR 2 TARGET (2018/19)
YEAR 3 TARGET (2019/20)
YEAR 4 TARGET (2020/21)
YEAR 5 TARGET (2021/22)
SDBIP INDICATOR N
T
RE
F
2018/19 TARGET
IMPL DIR
N/A
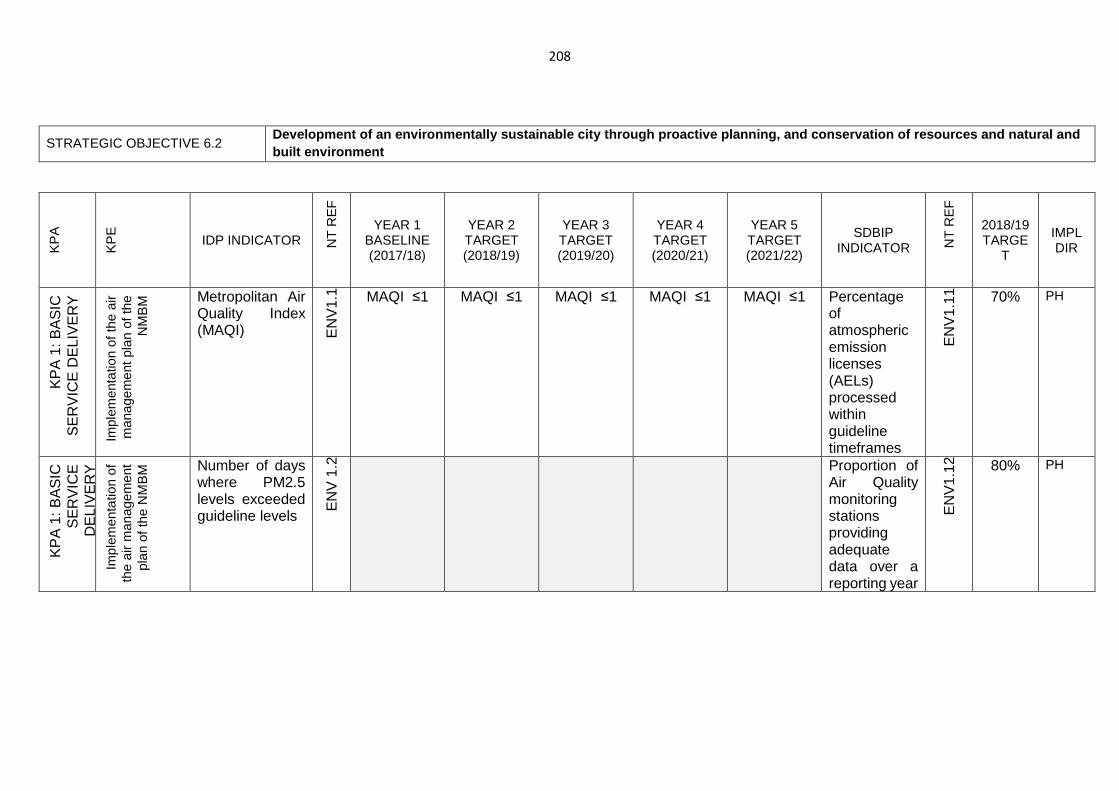
208
STRATEGIC OBJECTIVE 6.2 Development of an environmentally sustainable city through proactive planning, and conservation of res ources and natural and built environment
KP
A
KP
E
IDP INDICATOR NT
RE
F
YEAR 1 BASELINE (2017/18)
YEAR 2 TARGET (2018/19)
YEAR 3 TARGET (2019/20)
YEAR 4 TARGET (2020/21)
YEAR 5 TARGET (2021/22)
SDBIP INDICATOR N
T R
EF
2018/19 TARGE
T
IMPL DIR
KP
A 1
: BA
SIC
S
ER
VIC
E D
ELI
VE
RY
Impl
emen
tatio
n of
the
air
man
agem
ent p
lan
of th
e N
MB
M Metropolitan Air
Quality Index (MAQI)
EN
V1.
1
MAQI ≤1 MAQI ≤1 MAQI ≤1 MAQI ≤1 MAQI ≤1 Percentage of atmospheric emission licenses (AELs) processed within guideline timeframes
EN
V1.
11
70% PH
KP
A 1
: BA
SIC
S
ER
VIC
E
DE
LIV
ER
Y
Impl
emen
tatio
n of
th
e ai
r m
anag
emen
t pl
an o
f the
NM
BM
Number of days where PM2.5 levels exceeded guideline levels
EN
V 1
.2
Proportion of Air Quality monitoring stations providing adequate data over a reporting year
EN
V1.
12
80% PH
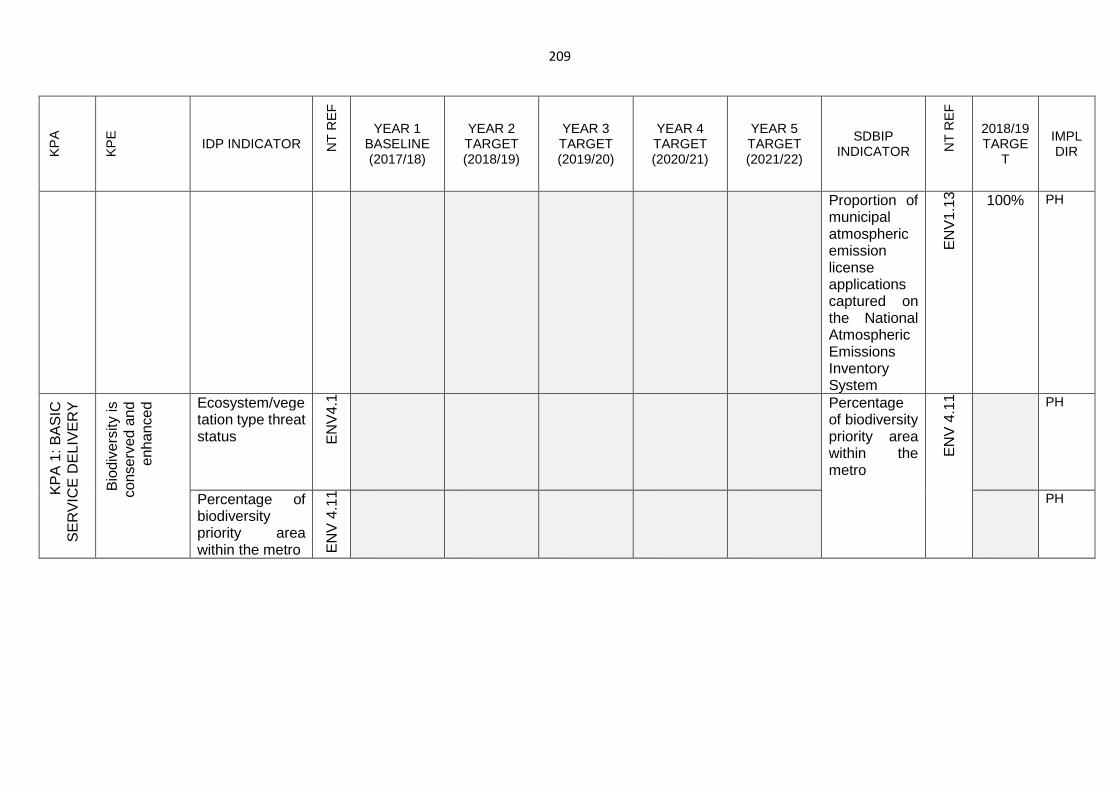
209
KP
A
KP
E
IDP INDICATOR NT
RE
F
YEAR 1 BASELINE (2017/18)
YEAR 2 TARGET (2018/19)
YEAR 3 TARGET (2019/20)
YEAR 4 TARGET (2020/21)
YEAR 5 TARGET (2021/22)
SDBIP INDICATOR N
T R
EF
2018/19 TARGE
T
IMPL DIR
Proportion of municipal atmospheric emission license applications captured on the National Atmospheric Emissions Inventory System
EN
V1.
13
100% PH
KP
A 1
: BA
SIC
S
ER
VIC
E D
ELI
VE
RY
Bio
dive
rsity
is
cons
erve
d an
d en
hanc
ed Ecosystem/vege
tation type threat status E
NV
4.1
Percentage of biodiversity priority area within the metro
EN
V 4
.11
PH
Percentage of biodiversity priority area within the metro E
NV
4.1
1
PH
210
SECTOR DEPARTMENTS INPUT
In line with Intergovernmental Relations and Cooperation between various spheres of
government, a number of Sector Departments were requested to submit their inputs
for inclusion in the municipal IDP to ensure alignment of plans of the various spheres
of government. Below are the submissions received from the various government
departments:
1. PROVINCIAL DEPARTMENT OF ECONOMIC DEVELOPMENT,
ENVIRONMENTAL AFFAIRS AND TOURISM
MANDATE / KEY STRATEGIC OBJECTIVE(S) OF SECTOR DEPA RTMENT /
PARASTATAL/ORGANISATION:
Sustainable development underpinned by economic growth and sound environmental
management.
• ECONOMIC DEVELOPMENT
To promote economic growth and the development of local economies by
aligning LRED initiatives with government programmes, as well as to sustain
economic development and growth through partnerships with key stakeholders.
To this end, the District participates in IDP and LED Strategy Reviews initiated
by local municipalities, as well as forums such as the District Support Team that
support LED initiatives within the various municipal areas
To facilitate the implementation of micro-economic reform strategies through
business development and support. Furthermore, this unit facilitates the
registration of and access to finance by co-operatives and SMME’s. This is
done through referral to Eastern Cape Development Corporation (Imvaba Fund
and Business Loans) and the Small Enterprise Development Agency (Business
Plans, Product and Market Development).
211
To provide redress to valid consumer complaints on unfair business practices,
as well as the promotion of consumer awareness in terms of the National
Consumer Protection Act, 2011. This enables consumers to make educated
decisions
• ENVIRONMENTAL AFFAIRS
The administering of legislation and regulations pertaining to the National
Environmental Management Act (Act 107 of 1998). This mandate includes
legislation such as Environmental Impact Management (EIA regulations),
Waste Management, Air Quality Management and Biodiversity Management.
All permits/approvals issued in terms of the afore-mentioned legislation are
subject to oversight by the Compliance and Enforcement Unit.
To provide Environmental Empowerment Services, that is empowering local
communities and various non-governmental stakeholders pertaining to issues
of environmental concern.
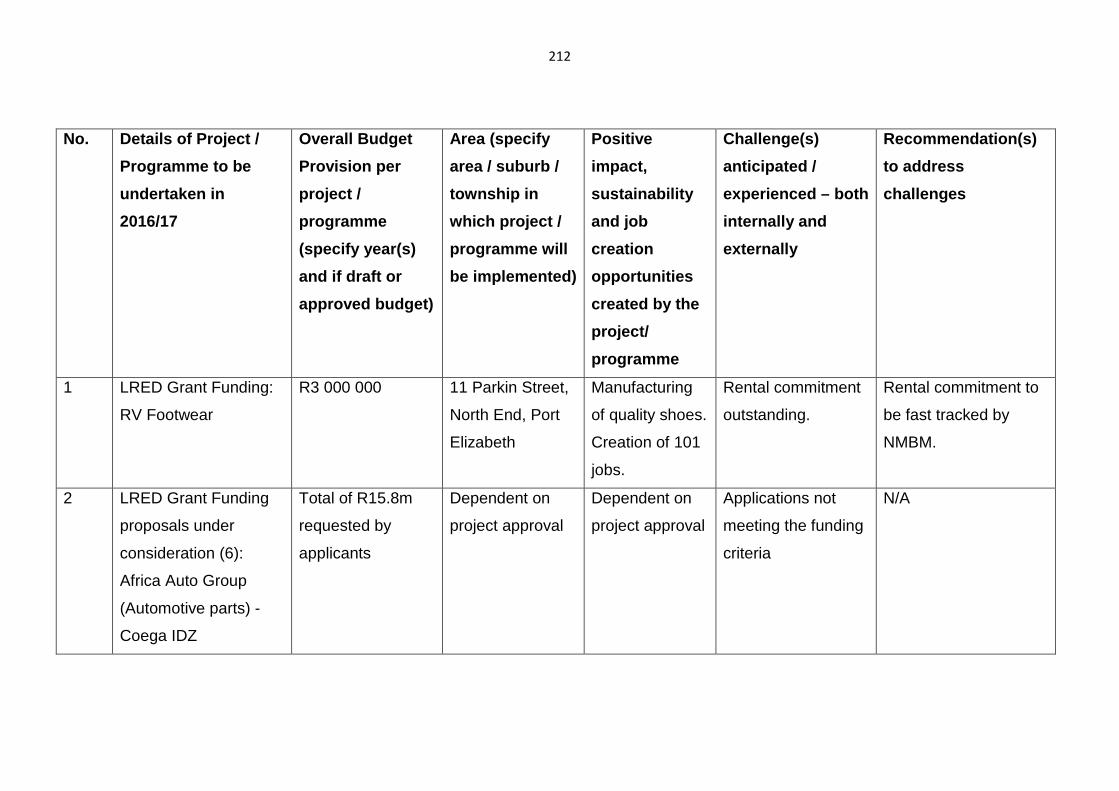
212
No. Details of Project /
Programme to be
undertaken in
2016/17
Overall Budget
Provision per
project /
programme
(specify year(s)
and if draft or
approved budget)
Area (specify
area / suburb /
township in
which project /
programme will
be implemented)
Positive
impact,
sustainability
and job
creation
opportunities
created by the
project/
programme
Challenge(s)
anticipated /
experienced – both
internally and
externally
Recommendation(s)
to address
challenges
1 LRED Grant Funding:
RV Footwear
R3 000 000 11 Parkin Street,
North End, Port
Elizabeth
Manufacturing
of quality shoes.
Creation of 101
jobs.
Rental commitment
outstanding.
Rental commitment to
be fast tracked by
NMBM.
2 LRED Grant Funding
proposals under
consideration (6):
Africa Auto Group
(Automotive parts) -
Coega IDZ
Total of R15.8m
requested by
applicants
Dependent on
project approval
Dependent on
project approval
Applications not
meeting the funding
criteria
N/A
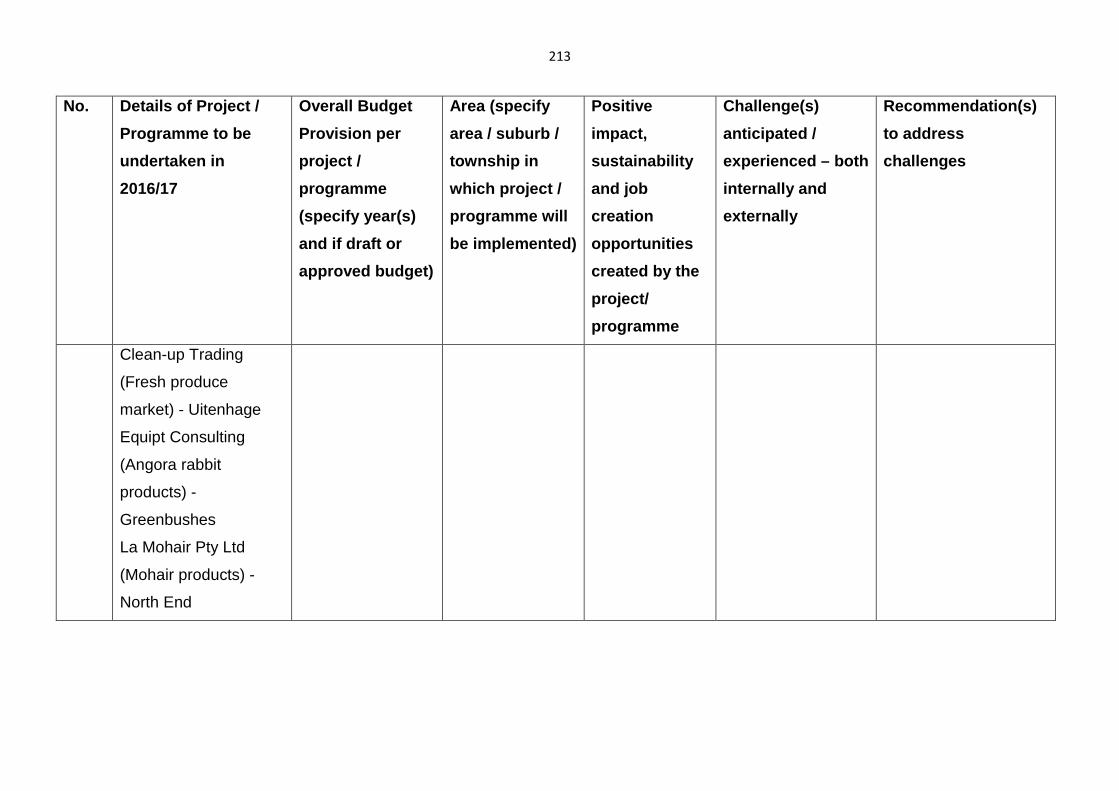
213
No. Details of Project /
Programme to be
undertaken in
2016/17
Overall Budget
Provision per
project /
programme
(specify year(s)
and if draft or
approved budget)
Area (specify
area / suburb /
township in
which project /
programme will
be implemented)
Positive
impact,
sustainability
and job
creation
opportunities
created by the
project/
programme
Challenge(s)
anticipated /
experienced – both
internally and
externally
Recommendation(s)
to address
challenges
Clean-up Trading
(Fresh produce
market) - Uitenhage
Equipt Consulting
(Angora rabbit
products) -
Greenbushes
La Mohair Pty Ltd
(Mohair products) -
North End
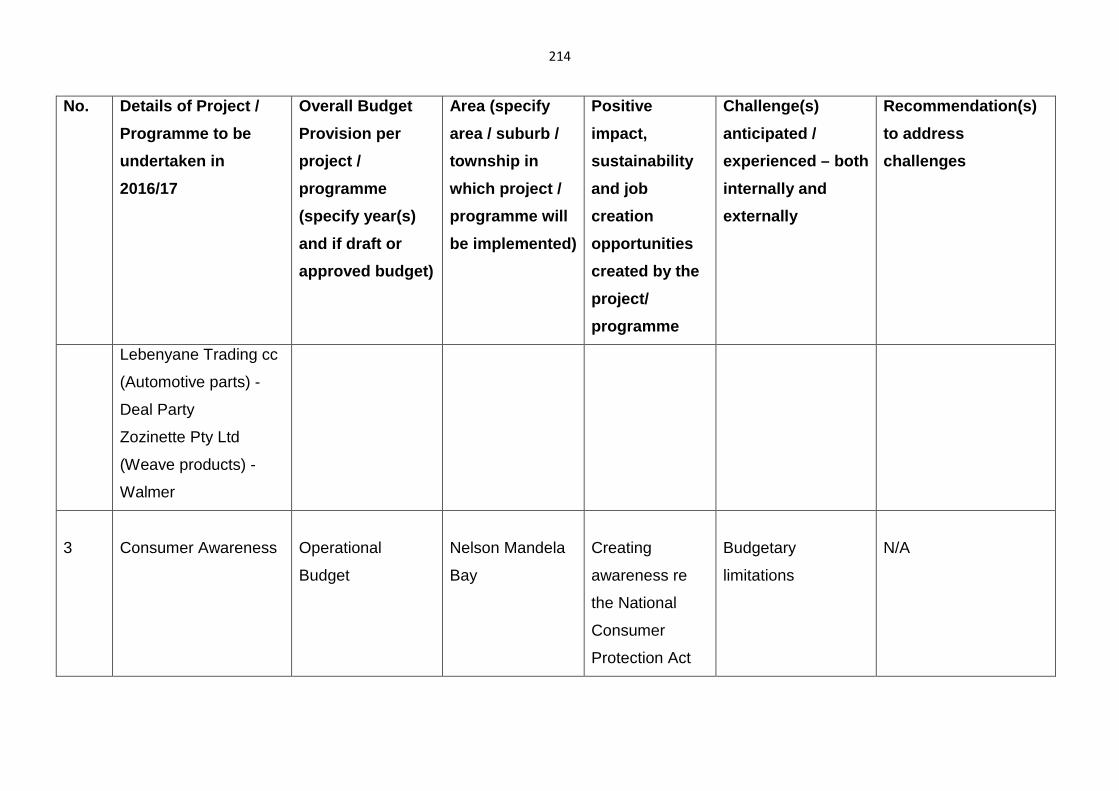
214
No. Details of Project /
Programme to be
undertaken in
2016/17
Overall Budget
Provision per
project /
programme
(specify year(s)
and if draft or
approved budget)
Area (specify
area / suburb /
township in
which project /
programme will
be implemented)
Positive
impact,
sustainability
and job
creation
opportunities
created by the
project/
programme
Challenge(s)
anticipated /
experienced – both
internally and
externally
Recommendation(s)
to address
challenges
Lebenyane Trading cc
(Automotive parts) -
Deal Party
Zozinette Pty Ltd
(Weave products) -
Walmer
3
Consumer Awareness
Operational
Budget
Nelson Mandela
Bay
Creating
awareness re
the National
Consumer
Protection Act
Budgetary
limitations
N/A
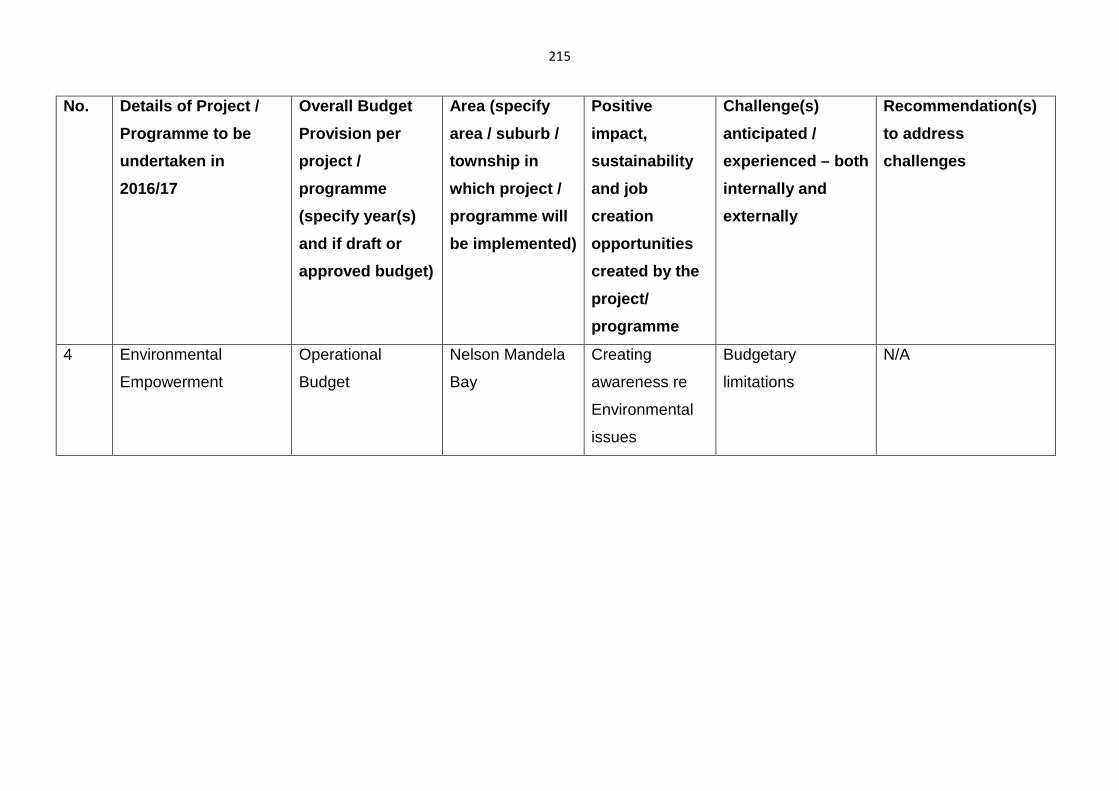
215
No. Details of Project /
Programme to be
undertaken in
2016/17
Overall Budget
Provision per
project /
programme
(specify year(s)
and if draft or
approved budget)
Area (specify
area / suburb /
township in
which project /
programme will
be implemented)
Positive
impact,
sustainability
and job
creation
opportunities
created by the
project/
programme
Challenge(s)
anticipated /
experienced – both
internally and
externally
Recommendation(s)
to address
challenges
4 Environmental
Empowerment
Operational
Budget
Nelson Mandela
Bay
Creating
awareness re
Environmental
issues
Budgetary
limitations
N/A
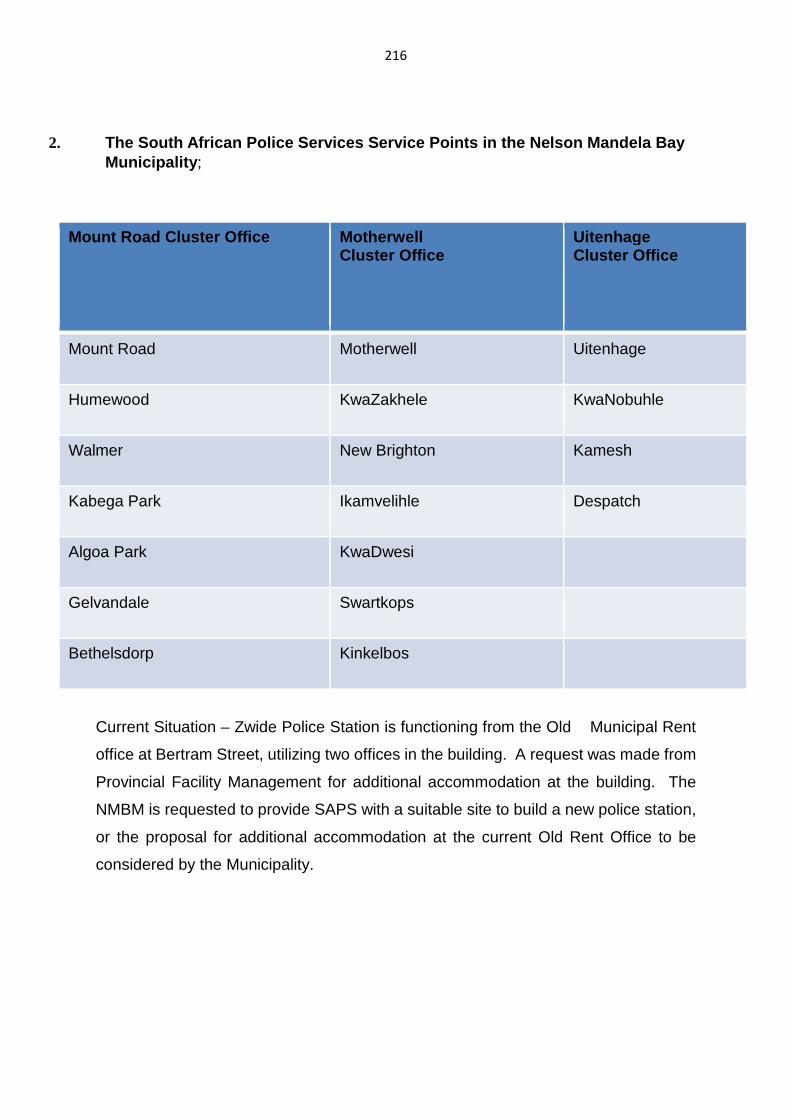
216
2. The South African Police Services Service Points i n the Nelson Mandela Bay Municipality ;
Mount Road Cluster Office Motherwell Cluster Office
Uitenhage Cluster Office
Mount Road Motherwell Uitenhage
Humewood KwaZakhele KwaNobuhle
Walmer New Brighton Kamesh
Kabega Park Ikamvelihle Despatch
Algoa Park KwaDwesi
Gelvandale Swartkops
Bethelsdorp Kinkelbos
Current Situation – Zwide Police Station is functioning from the Old Municipal Rent
office at Bertram Street, utilizing two offices in the building. A request was made from
Provincial Facility Management for additional accommodation at the building. The
NMBM is requested to provide SAPS with a suitable site to build a new police station,
or the proposal for additional accommodation at the current Old Rent Office to be
considered by the Municipality.
217
Bethelsdorp Police Station - Chatty Police Station
Background - The feasibility study was conducted to establish an additional police
station was approved on 2011-12-05 by the Provincial Commissioner. Currently, the
Bethelsdorp Police Station is functioning as the only police station in the area. During
2013, the identified sites, Erf 12638, Erf 11823 and Erf 11900 for building the
proposed police station were visited and it was found not suitable for the envisaged
project. Currently no progress reported on the matter from the Department of Public
Works. The NMBM is requested to provide SAPS with a suitable site to build a new
police station.
Kabega Park Police Station A feasibility study was conducted in 2015 to ascertain if the police station building is
meeting the required SAPS standards with regards to accommodation, SHE
Management requirements and infrastructure. It was found that, the building does not
meet certain standards on several avenues. It is recommended that a new building
should to be built in order to accommodate Kabega Park Police Station. Currently, the
Kabega Park Police is a rental building and belongs to a private owner. The NMBM is
requested to provide SAPS with a suitable site to build a new police station in the
Kabega Park Policing Area.
KwaNobuhle Police Station
The feasibility study conducted in 2013 to establish an additional police station in the
area was not recommended. The NMBM is requested to provide SAPS with a
suitable site, situated more central in the precinct, in order to build a new police
station.
New Brighton Police Station The police station is one of the oldest police stations build in the Port Elizabeth area
and does not fulfil the increased policing requirements of the area. The Metro is
requested to provide SAPS with a suitable site in New Brighton, centrally located in
the precinct, in order to build a new police station.

218
KwaDwesi Police Station
The police station was built during the late 80’s. Most of the infrastructure consists of
prefabricated material. The police station is situated opposite a shopping centre and
next to informal business, obstructing the traffic flow in and out from the police station.
Secondly, the new residential developments create a situation where the station is now
located on the geographical outskirts of the policing area. The Metro is requested to
provide SAPS with a suitable site, situated more central in the precinct, in order to
build a new police station.
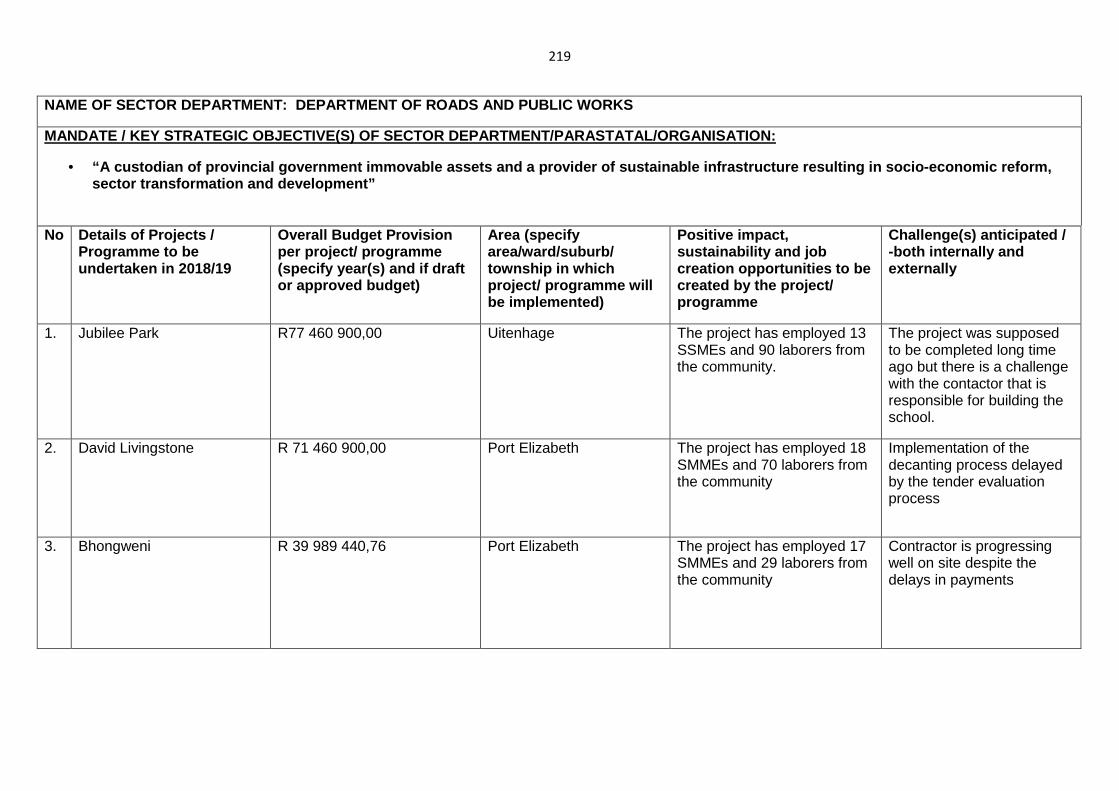
219
NAME OF SECTOR DEPARTMENT: DEPARTMENT OF ROADS AND PUBLIC WORKS
MANDATE / KEY STRATEGIC OBJECTIVE(S) OF SECTOR DEPARTMENT/PARASTATAL/ORGANISATION:
• “A custodian of provincial government immovable ass ets and a provider of sustainable infrastructure re sulting in socio-economic reform, sector transformation and development”
No Details of Projects /
Programme to be undertaken in 2018/19
Overall Budget Provision per project/ programme (specify year(s) and if draft or approved budget)
Area (specify area/ward/suburb/ township in which project/ programme will be implemented)
Positive impact, sustainability and job creation opportunities to be created by the project/ programme
Challenge(s) anticipated / -both internally and externally
1. Jubilee Park R77 460 900,00 Uitenhage The project has employed 13 SSMEs and 90 laborers from the community.
The project was supposed to be completed long time ago but there is a challenge with the contactor that is responsible for building the school.
2. David Livingstone R 71 460 900,00 Port Elizabeth The project has employed 18 SMMEs and 70 laborers from the community
Implementation of the decanting process delayed by the tender evaluation process
3. Bhongweni R 39 989 440,76 Port Elizabeth The project has employed 17 SMMEs and 29 laborers from the community
Contractor is progressing well on site despite the delays in payments
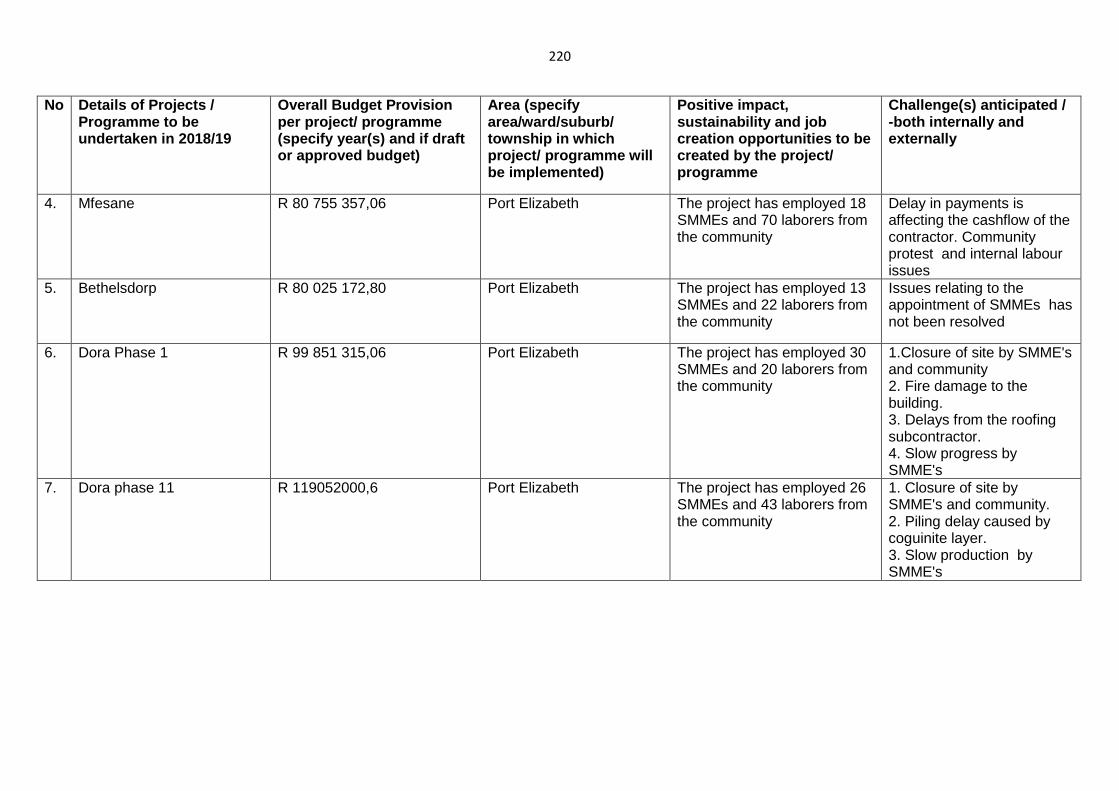
220
No Details of Projects / Programme to be undertaken in 2018/19
Overall Budget Provision per project/ programme (specify year(s) and if draft or approved budget)
Area (specify area/ward/suburb/ township in which project/ programme will be implemented)
Positive impact, sustainability and job creation opportunities to be created by the project/ programme
Challenge(s) anticipated / -both internally and externally
4. Mfesane R 80 755 357,06 Port Elizabeth The project has employed 18 SMMEs and 70 laborers from the community
Delay in payments is affecting the cashflow of the contractor. Community protest and internal labour issues
5. Bethelsdorp R 80 025 172,80 Port Elizabeth The project has employed 13 SMMEs and 22 laborers from the community
Issues relating to the appointment of SMMEs has not been resolved
6. Dora Phase 1 R 99 851 315,06 Port Elizabeth The project has employed 30 SMMEs and 20 laborers from the community
1.Closure of site by SMME's and community 2. Fire damage to the building. 3. Delays from the roofing subcontractor. 4. Slow progress by SMME's
7. Dora phase 11 R 119052000,6 Port Elizabeth The project has employed 26 SMMEs and 43 laborers from the community
1. Closure of site by SMME's and community. 2. Piling delay caused by coguinite layer. 3. Slow production by SMME's
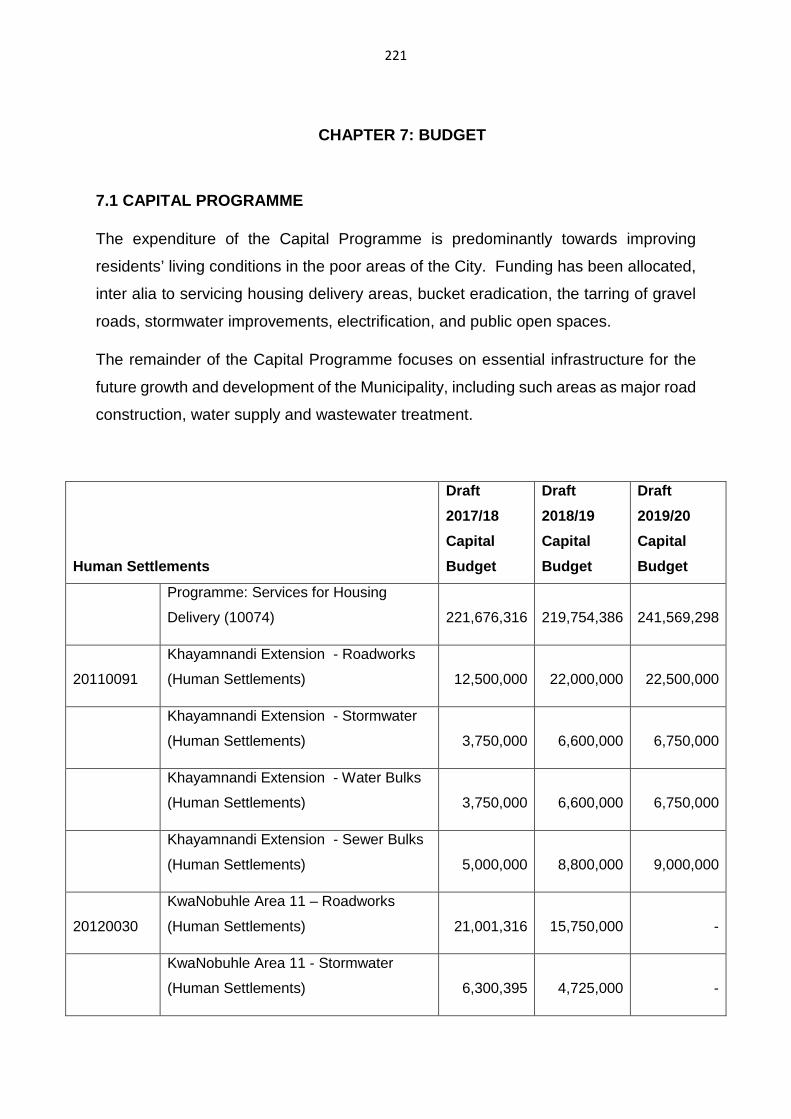
221
CHAPTER 7: BUDGET
7.1 CAPITAL PROGRAMME
The expenditure of the Capital Programme is predominantly towards improving
residents’ living conditions in the poor areas of the City. Funding has been allocated,
inter alia to servicing housing delivery areas, bucket eradication, the tarring of gravel
roads, stormwater improvements, electrification, and public open spaces.
The remainder of the Capital Programme focuses on essential infrastructure for the
future growth and development of the Municipality, including such areas as major road
construction, water supply and wastewater treatment.
Human Settlements
Draft
2017/18
Capital
Budget
Draft
2018/19
Capital
Budget
Draft
2019/20
Capital
Budget
Programme: Services for Housing
Delivery (10074)
221,676,316
219,754,386
241,569,298
20110091
Khayamnandi Extension - Roadworks
(Human Settlements)
12,500,000
22,000,000
22,500,000
Khayamnandi Extension - Stormwater
(Human Settlements)
3,750,000
6,600,000
6,750,000
Khayamnandi Extension - Water Bulks
(Human Settlements)
3,750,000
6,600,000
6,750,000
Khayamnandi Extension - Sewer Bulks
(Human Settlements)
5,000,000
8,800,000
9,000,000
20120030
KwaNobuhle Area 11 – Roadworks
(Human Settlements)
21,001,316
15,750,000
-
KwaNobuhle Area 11 - Stormwater
(Human Settlements)
6,300,395
4,725,000
-
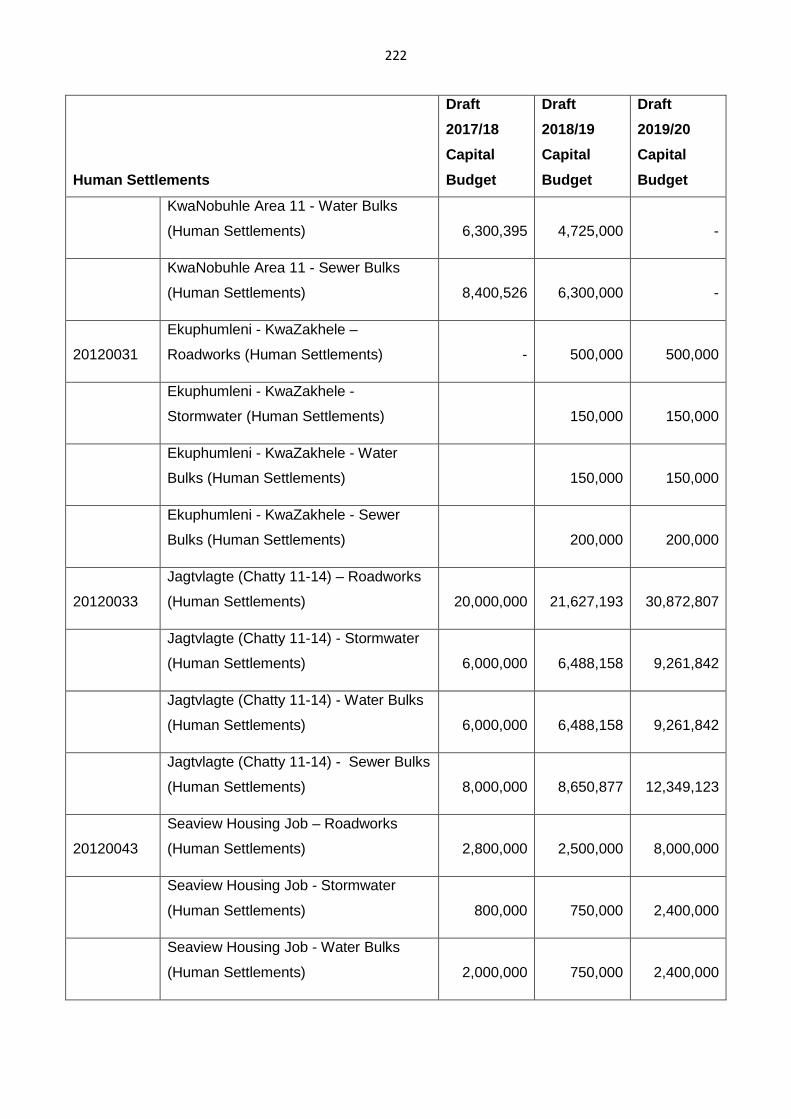
222
Human Settlements
Draft
2017/18
Capital
Budget
Draft
2018/19
Capital
Budget
Draft
2019/20
Capital
Budget
KwaNobuhle Area 11 - Water Bulks
(Human Settlements)
6,300,395
4,725,000
-
KwaNobuhle Area 11 - Sewer Bulks
(Human Settlements)
8,400,526
6,300,000
-
20120031
Ekuphumleni - KwaZakhele –
Roadworks (Human Settlements)
-
500,000
500,000
Ekuphumleni - KwaZakhele -
Stormwater (Human Settlements)
150,000
150,000
Ekuphumleni - KwaZakhele - Water
Bulks (Human Settlements)
150,000
150,000
Ekuphumleni - KwaZakhele - Sewer
Bulks (Human Settlements)
200,000
200,000
20120033
Jagtvlagte (Chatty 11-14) – Roadworks
(Human Settlements)
20,000,000
21,627,193
30,872,807
Jagtvlagte (Chatty 11-14) - Stormwater
(Human Settlements)
6,000,000
6,488,158
9,261,842
Jagtvlagte (Chatty 11-14) - Water Bulks
(Human Settlements)
6,000,000
6,488,158
9,261,842
Jagtvlagte (Chatty 11-14) - Sewer Bulks
(Human Settlements)
8,000,000
8,650,877
12,349,123
20120043
Seaview Housing Job – Roadworks
(Human Settlements)
2,800,000
2,500,000
8,000,000
Seaview Housing Job - Stormwater
(Human Settlements)
800,000
750,000
2,400,000
Seaview Housing Job - Water Bulks
(Human Settlements)
2,000,000
750,000
2,400,000
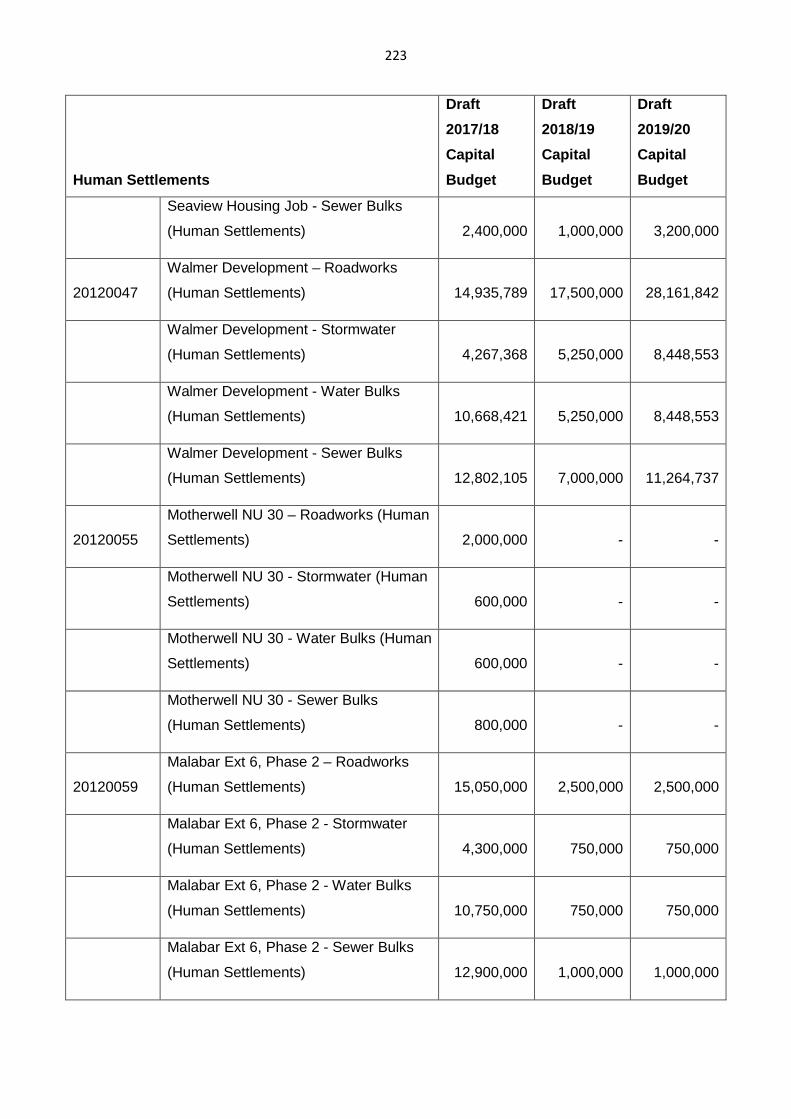
223
Human Settlements
Draft
2017/18
Capital
Budget
Draft
2018/19
Capital
Budget
Draft
2019/20
Capital
Budget
Seaview Housing Job - Sewer Bulks
(Human Settlements)
2,400,000
1,000,000
3,200,000
20120047
Walmer Development – Roadworks
(Human Settlements)
14,935,789
17,500,000
28,161,842
Walmer Development - Stormwater
(Human Settlements)
4,267,368
5,250,000
8,448,553
Walmer Development - Water Bulks
(Human Settlements)
10,668,421
5,250,000
8,448,553
Walmer Development - Sewer Bulks
(Human Settlements)
12,802,105
7,000,000
11,264,737
20120055
Motherwell NU 30 – Roadworks (Human
Settlements)
2,000,000
-
-
Motherwell NU 30 - Stormwater (Human
Settlements)
600,000
-
-
Motherwell NU 30 - Water Bulks (Human
Settlements)
600,000
-
-
Motherwell NU 30 - Sewer Bulks
(Human Settlements)
800,000
-
-
20120059
Malabar Ext 6, Phase 2 – Roadworks
(Human Settlements)
15,050,000
2,500,000
2,500,000
Malabar Ext 6, Phase 2 - Stormwater
(Human Settlements)
4,300,000
750,000
750,000
Malabar Ext 6, Phase 2 - Water Bulks
(Human Settlements)
10,750,000
750,000
750,000
Malabar Ext 6, Phase 2 - Sewer Bulks
(Human Settlements)
12,900,000
1,000,000
1,000,000
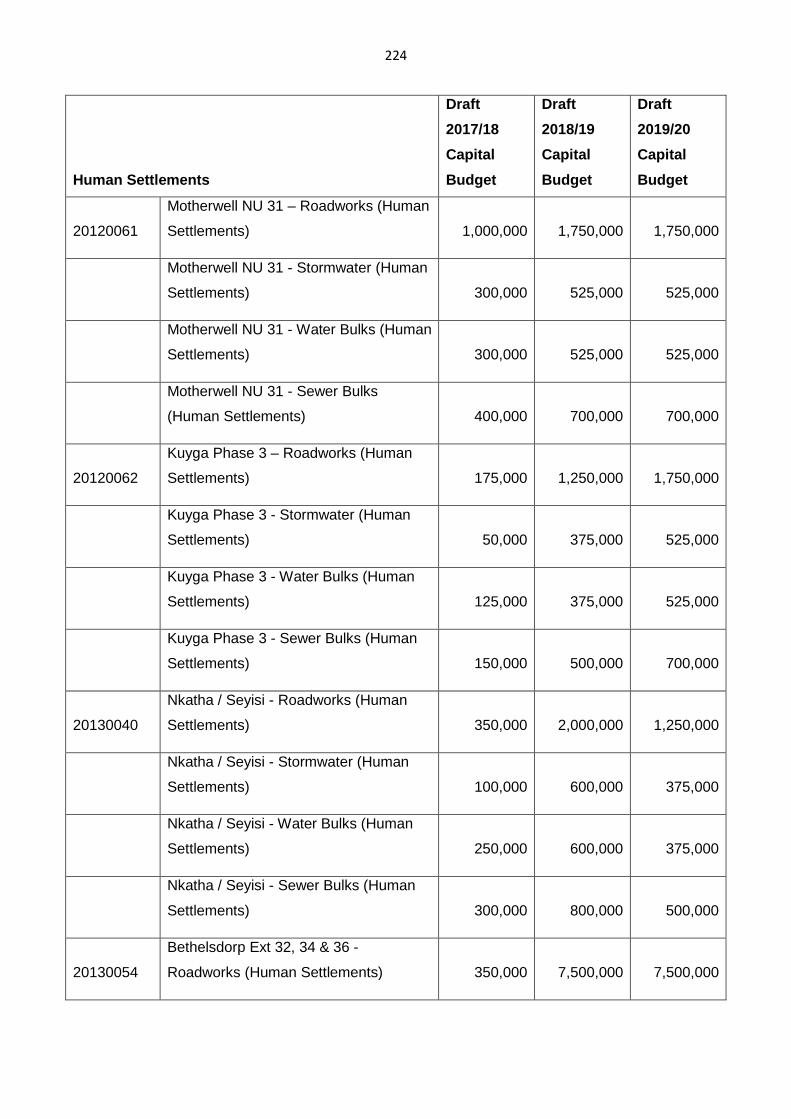
224
Human Settlements
Draft
2017/18
Capital
Budget
Draft
2018/19
Capital
Budget
Draft
2019/20
Capital
Budget
20120061
Motherwell NU 31 – Roadworks (Human
Settlements)
1,000,000
1,750,000
1,750,000
Motherwell NU 31 - Stormwater (Human
Settlements)
300,000
525,000
525,000
Motherwell NU 31 - Water Bulks (Human
Settlements)
300,000
525,000
525,000
Motherwell NU 31 - Sewer Bulks
(Human Settlements)
400,000
700,000
700,000
20120062
Kuyga Phase 3 – Roadworks (Human
Settlements)
175,000
1,250,000
1,750,000
Kuyga Phase 3 - Stormwater (Human
Settlements)
50,000
375,000
525,000
Kuyga Phase 3 - Water Bulks (Human
Settlements)
125,000
375,000
525,000
Kuyga Phase 3 - Sewer Bulks (Human
Settlements)
150,000
500,000
700,000
20130040
Nkatha / Seyisi - Roadworks (Human
Settlements)
350,000
2,000,000
1,250,000
Nkatha / Seyisi - Stormwater (Human
Settlements)
100,000
600,000
375,000
Nkatha / Seyisi - Water Bulks (Human
Settlements)
250,000
600,000
375,000
Nkatha / Seyisi - Sewer Bulks (Human
Settlements)
300,000
800,000
500,000
20130054
Bethelsdorp Ext 32, 34 & 36 -
Roadworks (Human Settlements)
350,000
7,500,000
7,500,000
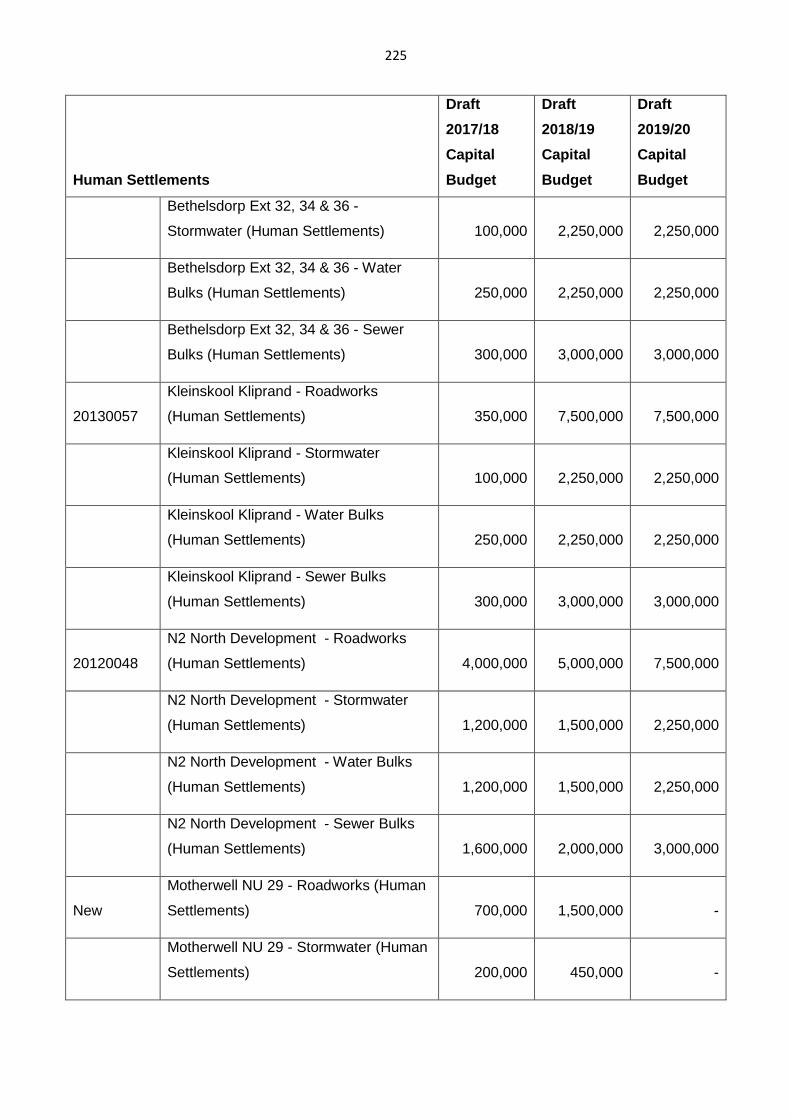
225
Human Settlements
Draft
2017/18
Capital
Budget
Draft
2018/19
Capital
Budget
Draft
2019/20
Capital
Budget
Bethelsdorp Ext 32, 34 & 36 -
Stormwater (Human Settlements)
100,000
2,250,000
2,250,000
Bethelsdorp Ext 32, 34 & 36 - Water
Bulks (Human Settlements)
250,000
2,250,000
2,250,000
Bethelsdorp Ext 32, 34 & 36 - Sewer
Bulks (Human Settlements)
300,000
3,000,000
3,000,000
20130057
Kleinskool Kliprand - Roadworks
(Human Settlements)
350,000
7,500,000
7,500,000
Kleinskool Kliprand - Stormwater
(Human Settlements)
100,000
2,250,000
2,250,000
Kleinskool Kliprand - Water Bulks
(Human Settlements)
250,000
2,250,000
2,250,000
Kleinskool Kliprand - Sewer Bulks
(Human Settlements)
300,000
3,000,000
3,000,000
20120048
N2 North Development - Roadworks
(Human Settlements)
4,000,000
5,000,000
7,500,000
N2 North Development - Stormwater
(Human Settlements)
1,200,000
1,500,000
2,250,000
N2 North Development - Water Bulks
(Human Settlements)
1,200,000
1,500,000
2,250,000
N2 North Development - Sewer Bulks
(Human Settlements)
1,600,000
2,000,000
3,000,000
New
Motherwell NU 29 - Roadworks (Human
Settlements)
700,000
1,500,000
-
Motherwell NU 29 - Stormwater (Human
Settlements)
200,000
450,000
-
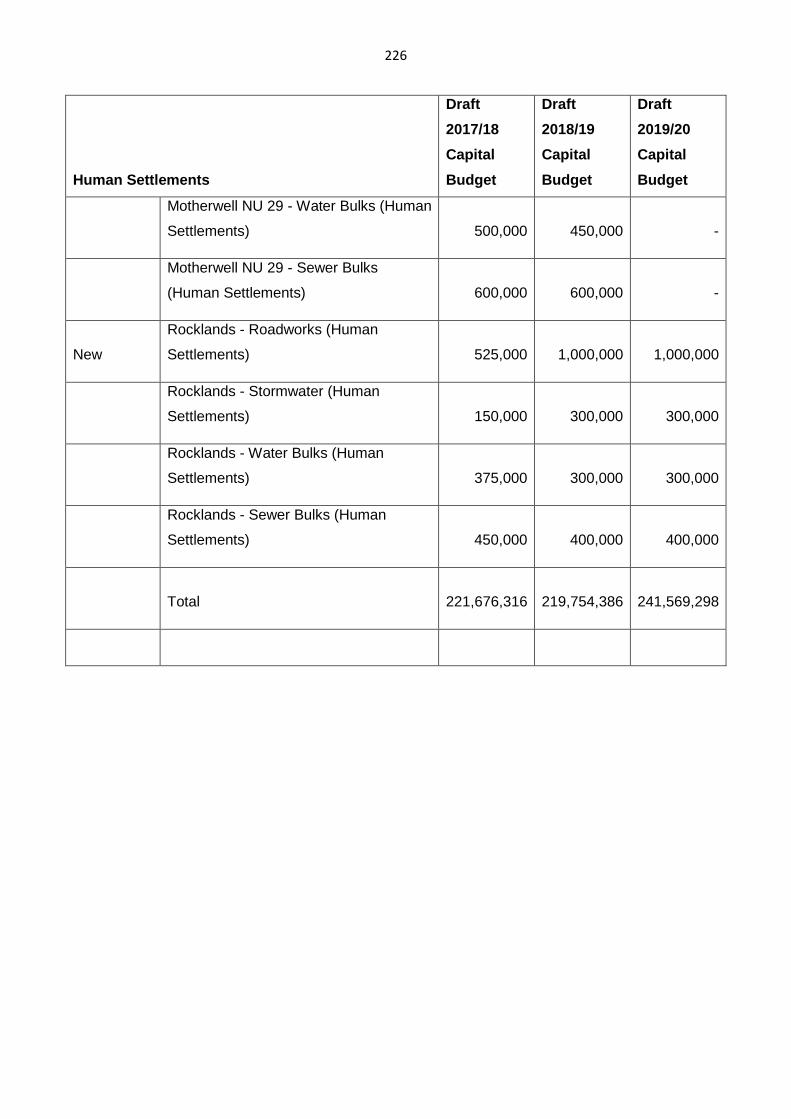
226
Human Settlements
Draft
2017/18
Capital
Budget
Draft
2018/19
Capital
Budget
Draft
2019/20
Capital
Budget
Motherwell NU 29 - Water Bulks (Human
Settlements)
500,000
450,000
-
Motherwell NU 29 - Sewer Bulks
(Human Settlements)
600,000
600,000
-
New
Rocklands - Roadworks (Human
Settlements)
525,000
1,000,000
1,000,000
Rocklands - Stormwater (Human
Settlements)
150,000
300,000
300,000
Rocklands - Water Bulks (Human
Settlements)
375,000
300,000
300,000
Rocklands - Sewer Bulks (Human
Settlements)
450,000
400,000
400,000
Total
221,676,316
219,754,386
241,569,298
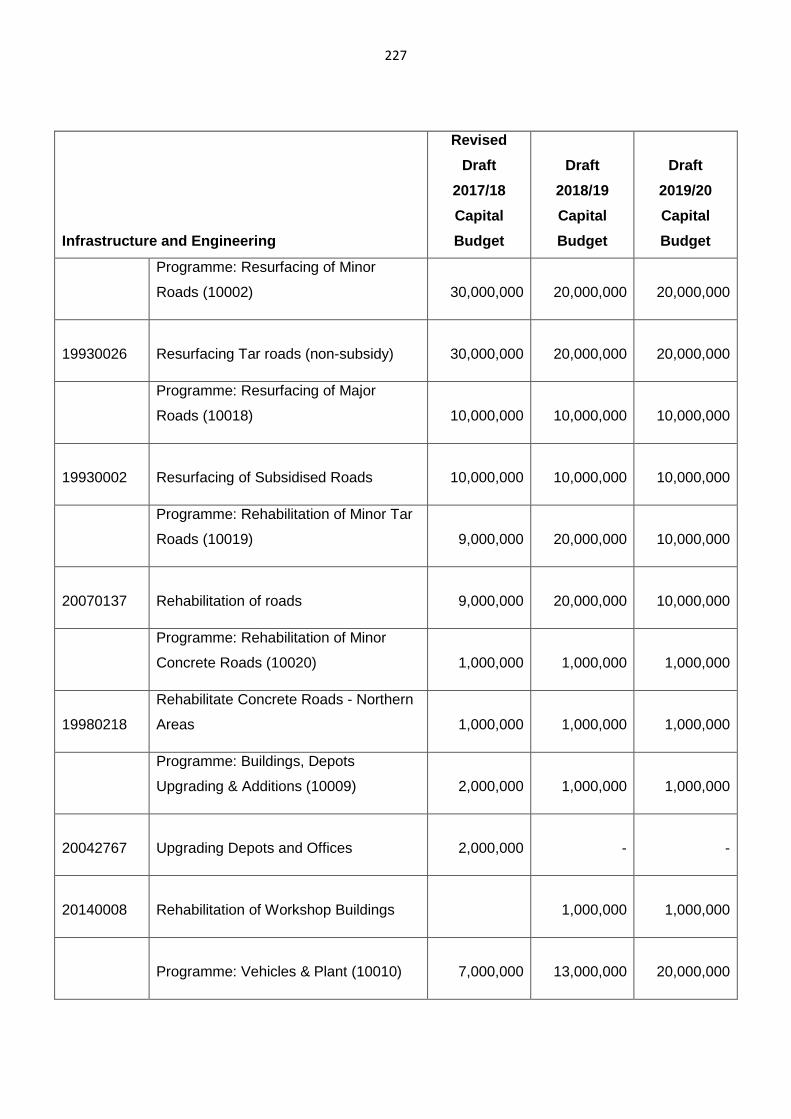
227
Infrastructure and Engineering
Revised
Draft
2017/18
Capital
Budget
Draft
2018/19
Capital
Budget
Draft
2019/20
Capital
Budget
Programme: Resurfacing of Minor
Roads (10002)
30,000,000
20,000,000
20,000,000
19930026 Resurfacing Tar roads (non-subsidy)
30,000,000
20,000,000
20,000,000
Programme: Resurfacing of Major
Roads (10018)
10,000,000
10,000,000
10,000,000
19930002 Resurfacing of Subsidised Roads
10,000,000
10,000,000
10,000,000
Programme: Rehabilitation of Minor Tar
Roads (10019)
9,000,000
20,000,000
10,000,000
20070137 Rehabilitation of roads
9,000,000
20,000,000
10,000,000
Programme: Rehabilitation of Minor
Concrete Roads (10020)
1,000,000
1,000,000
1,000,000
19980218
Rehabilitate Concrete Roads - Northern
Areas
1,000,000
1,000,000
1,000,000
Programme: Buildings, Depots
Upgrading & Additions (10009)
2,000,000
1,000,000
1,000,000
20042767 Upgrading Depots and Offices
2,000,000
- -
20140008 Rehabilitation of Workshop Buildings
1,000,000
1,000,000
Programme: Vehicles & Plant (10010)
7,000,000
13,000,000
20,000,000
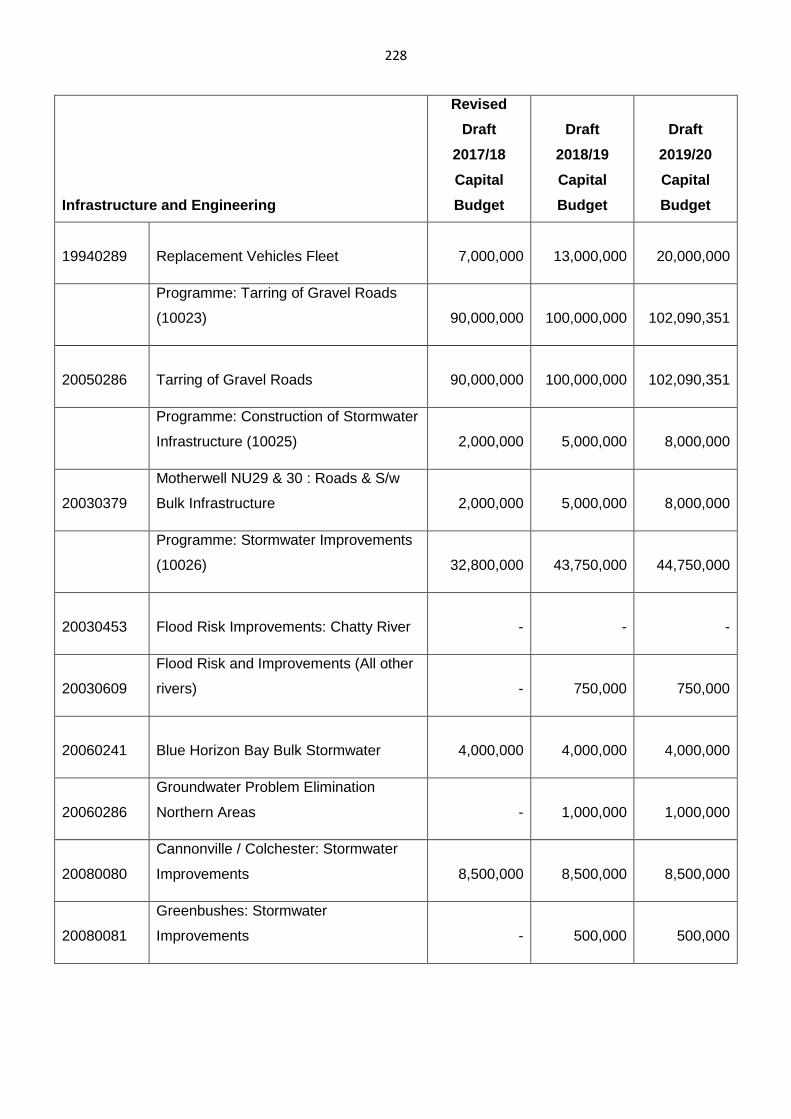
228
Infrastructure and Engineering
Revised
Draft
2017/18
Capital
Budget
Draft
2018/19
Capital
Budget
Draft
2019/20
Capital
Budget
19940289 Replacement Vehicles Fleet
7,000,000
13,000,000
20,000,000
Programme: Tarring of Gravel Roads
(10023)
90,000,000
100,000,000
102,090,351
20050286 Tarring of Gravel Roads
90,000,000
100,000,000
102,090,351
Programme: Construction of Stormwater
Infrastructure (10025)
2,000,000
5,000,000
8,000,000
20030379
Motherwell NU29 & 30 : Roads & S/w
Bulk Infrastructure
2,000,000
5,000,000
8,000,000
Programme: Stormwater Improvements
(10026)
32,800,000
43,750,000
44,750,000
20030453 Flood Risk Improvements: Chatty River
-
- -
20030609
Flood Risk and Improvements (All other
rivers)
-
750,000
750,000
20060241 Blue Horizon Bay Bulk Stormwater
4,000,000
4,000,000
4,000,000
20060286
Groundwater Problem Elimination
Northern Areas
-
1,000,000
1,000,000
20080080
Cannonville / Colchester: Stormwater
Improvements
8,500,000
8,500,000
8,500,000
20080081
Greenbushes: Stormwater
Improvements
-
500,000
500,000
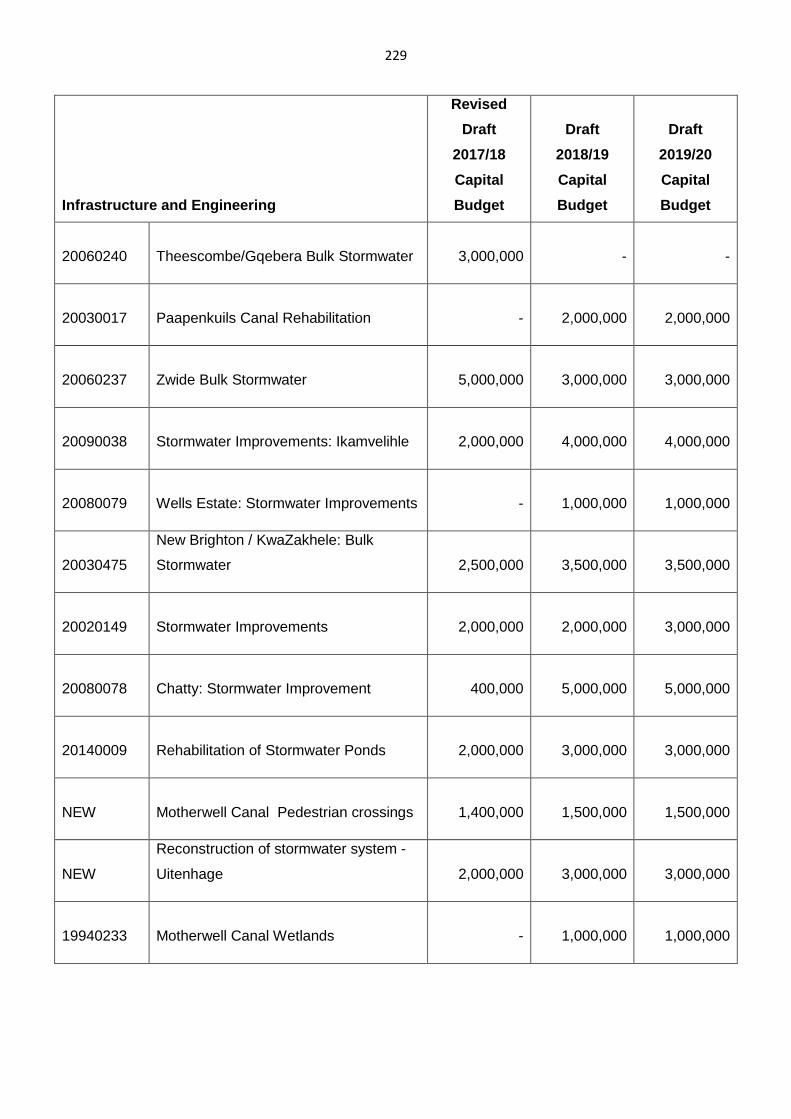
229
Infrastructure and Engineering
Revised
Draft
2017/18
Capital
Budget
Draft
2018/19
Capital
Budget
Draft
2019/20
Capital
Budget
20060240 Theescombe/Gqebera Bulk Stormwater
3,000,000
- -
20030017 Paapenkuils Canal Rehabilitation
-
2,000,000
2,000,000
20060237 Zwide Bulk Stormwater
5,000,000
3,000,000
3,000,000
20090038 Stormwater Improvements: Ikamvelihle
2,000,000
4,000,000
4,000,000
20080079 Wells Estate: Stormwater Improvements
-
1,000,000
1,000,000
20030475
New Brighton / KwaZakhele: Bulk
Stormwater
2,500,000
3,500,000
3,500,000
20020149 Stormwater Improvements
2,000,000
2,000,000
3,000,000
20080078 Chatty: Stormwater Improvement
400,000
5,000,000
5,000,000
20140009 Rehabilitation of Stormwater Ponds
2,000,000
3,000,000
3,000,000
NEW Motherwell Canal Pedestrian crossings
1,400,000
1,500,000
1,500,000
NEW
Reconstruction of stormwater system -
Uitenhage
2,000,000
3,000,000
3,000,000
19940233 Motherwell Canal Wetlands
-
1,000,000
1,000,000
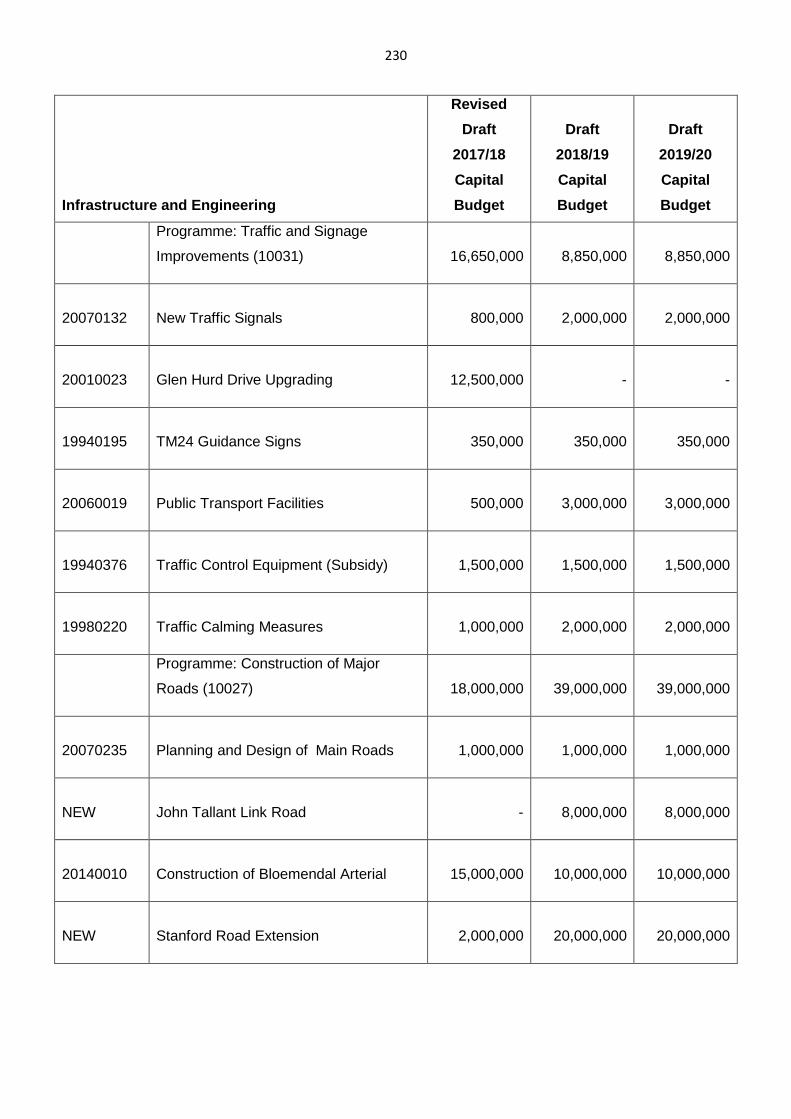
230
Infrastructure and Engineering
Revised
Draft
2017/18
Capital
Budget
Draft
2018/19
Capital
Budget
Draft
2019/20
Capital
Budget
Programme: Traffic and Signage
Improvements (10031)
16,650,000
8,850,000
8,850,000
20070132 New Traffic Signals
800,000
2,000,000
2,000,000
20010023 Glen Hurd Drive Upgrading
12,500,000
- -
19940195 TM24 Guidance Signs
350,000
350,000
350,000
20060019 Public Transport Facilities
500,000
3,000,000
3,000,000
19940376 Traffic Control Equipment (Subsidy)
1,500,000
1,500,000
1,500,000
19980220 Traffic Calming Measures
1,000,000
2,000,000
2,000,000
Programme: Construction of Major
Roads (10027)
18,000,000
39,000,000
39,000,000
20070235 Planning and Design of Main Roads
1,000,000
1,000,000
1,000,000
NEW John Tallant Link Road
-
8,000,000
8,000,000
20140010 Construction of Bloemendal Arterial
15,000,000
10,000,000
10,000,000
NEW Stanford Road Extension
2,000,000
20,000,000
20,000,000
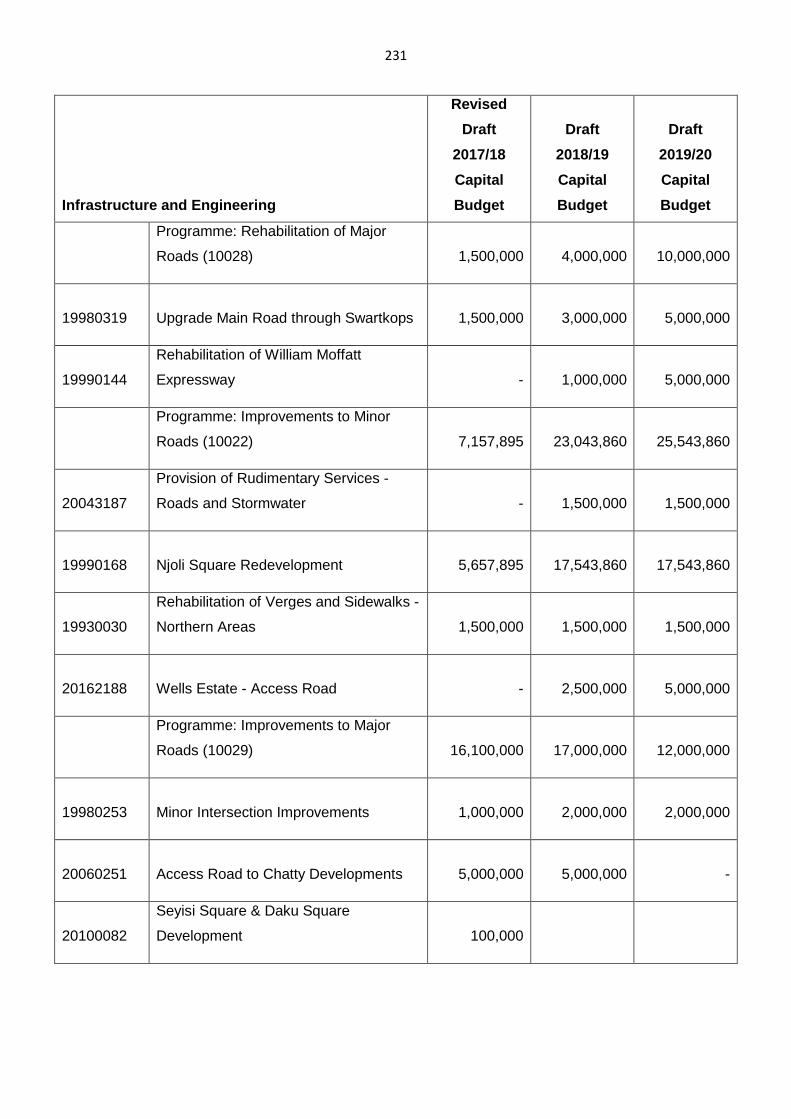
231
Infrastructure and Engineering
Revised
Draft
2017/18
Capital
Budget
Draft
2018/19
Capital
Budget
Draft
2019/20
Capital
Budget
Programme: Rehabilitation of Major
Roads (10028)
1,500,000
4,000,000
10,000,000
19980319 Upgrade Main Road through Swartkops
1,500,000
3,000,000
5,000,000
19990144
Rehabilitation of William Moffatt
Expressway
-
1,000,000
5,000,000
Programme: Improvements to Minor
Roads (10022)
7,157,895
23,043,860
25,543,860
20043187
Provision of Rudimentary Services -
Roads and Stormwater
-
1,500,000
1,500,000
19990168 Njoli Square Redevelopment
5,657,895
17,543,860
17,543,860
19930030
Rehabilitation of Verges and Sidewalks -
Northern Areas
1,500,000
1,500,000
1,500,000
20162188 Wells Estate - Access Road
-
2,500,000
5,000,000
Programme: Improvements to Major
Roads (10029)
16,100,000
17,000,000
12,000,000
19980253 Minor Intersection Improvements
1,000,000
2,000,000
2,000,000
20060251 Access Road to Chatty Developments
5,000,000
5,000,000 -
20100082
Seyisi Square & Daku Square
Development
100,000
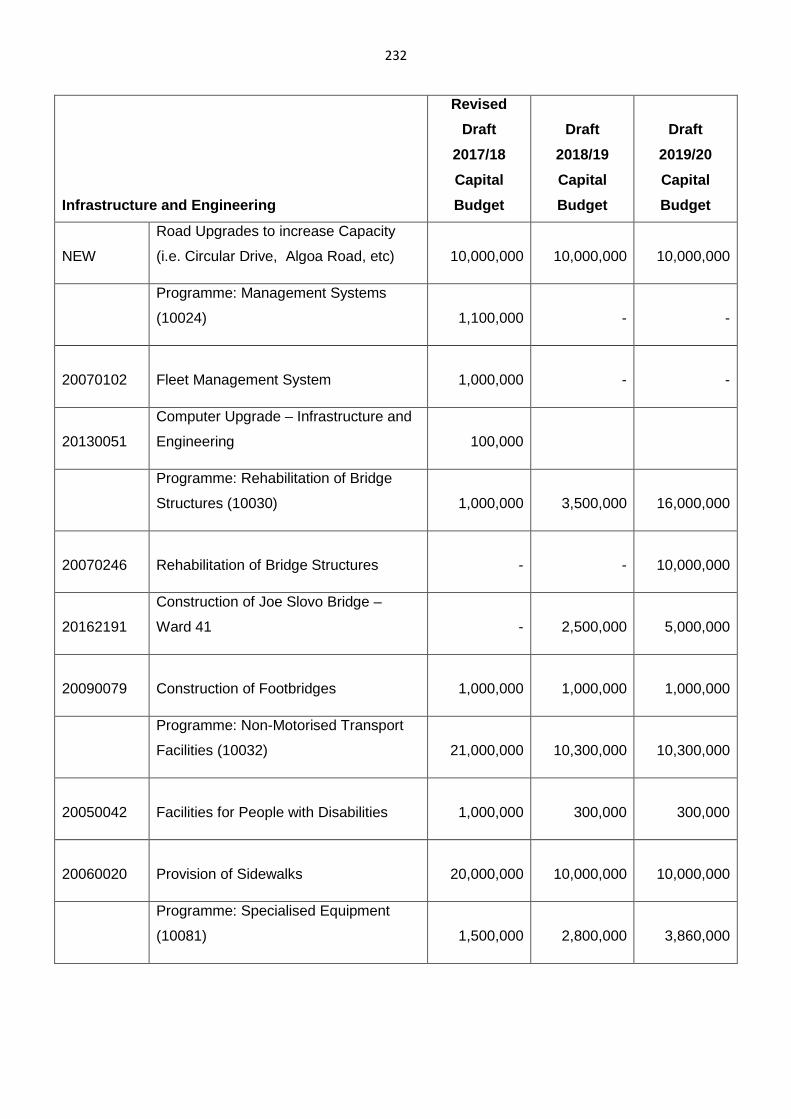
232
Infrastructure and Engineering
Revised
Draft
2017/18
Capital
Budget
Draft
2018/19
Capital
Budget
Draft
2019/20
Capital
Budget
NEW
Road Upgrades to increase Capacity
(i.e. Circular Drive, Algoa Road, etc)
10,000,000
10,000,000
10,000,000
Programme: Management Systems
(10024)
1,100,000
- -
20070102 Fleet Management System
1,000,000
- -
20130051
Computer Upgrade – Infrastructure and
Engineering
100,000
Programme: Rehabilitation of Bridge
Structures (10030)
1,000,000
3,500,000
16,000,000
20070246 Rehabilitation of Bridge Structures
-
-
10,000,000
20162191
Construction of Joe Slovo Bridge –
Ward 41
-
2,500,000
5,000,000
20090079 Construction of Footbridges
1,000,000
1,000,000
1,000,000
Programme: Non-Motorised Transport
Facilities (10032)
21,000,000
10,300,000
10,300,000
20050042 Facilities for People with Disabilities
1,000,000
300,000
300,000
20060020 Provision of Sidewalks
20,000,000
10,000,000
10,000,000
Programme: Specialised Equipment
(10081)
1,500,000
2,800,000
3,860,000
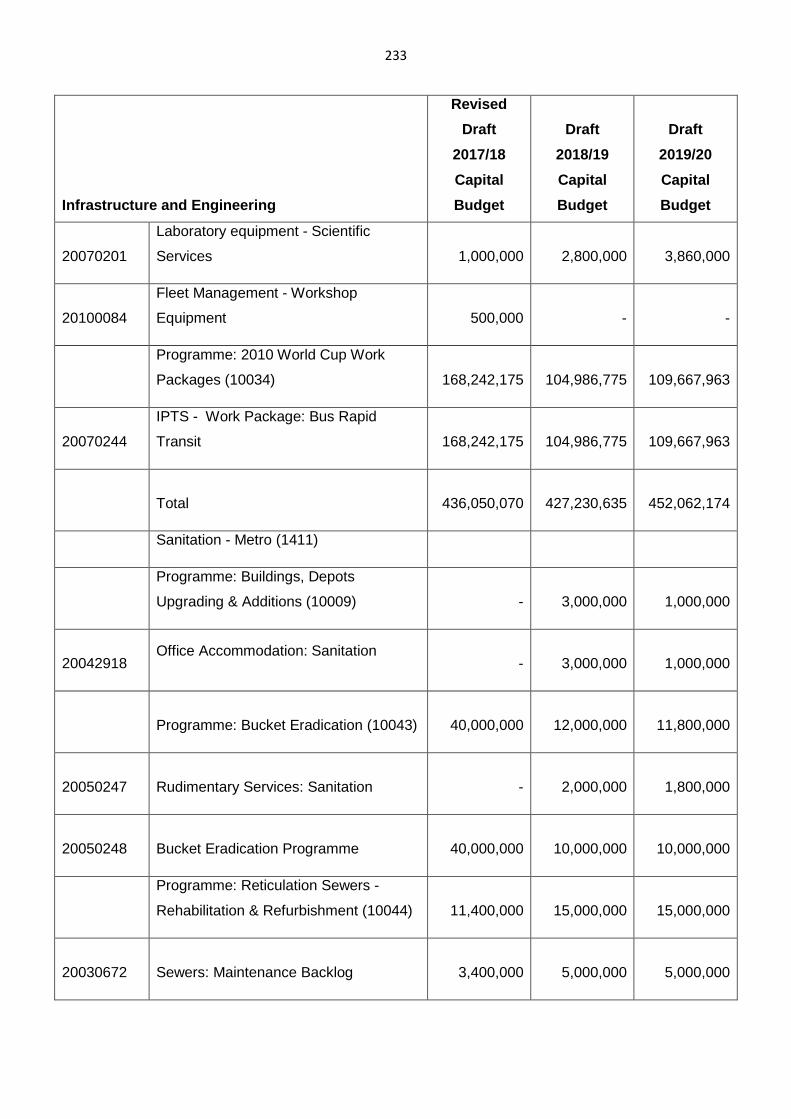
233
Infrastructure and Engineering
Revised
Draft
2017/18
Capital
Budget
Draft
2018/19
Capital
Budget
Draft
2019/20
Capital
Budget
20070201
Laboratory equipment - Scientific
Services
1,000,000
2,800,000
3,860,000
20100084
Fleet Management - Workshop
Equipment
500,000
- -
Programme: 2010 World Cup Work
Packages (10034)
168,242,175
104,986,775
109,667,963
20070244
IPTS - Work Package: Bus Rapid
Transit
168,242,175
104,986,775
109,667,963
Total
436,050,070
427,230,635
452,062,174
Sanitation - Metro (1411)
Programme: Buildings, Depots
Upgrading & Additions (10009)
-
3,000,000
1,000,000
20042918 Office Accommodation: Sanitation
-
3,000,000
1,000,000
Programme: Bucket Eradication (10043)
40,000,000
12,000,000
11,800,000
20050247 Rudimentary Services: Sanitation
-
2,000,000
1,800,000
20050248 Bucket Eradication Programme
40,000,000
10,000,000
10,000,000
Programme: Reticulation Sewers -
Rehabilitation & Refurbishment (10044)
11,400,000
15,000,000
15,000,000
20030672 Sewers: Maintenance Backlog
3,400,000
5,000,000
5,000,000
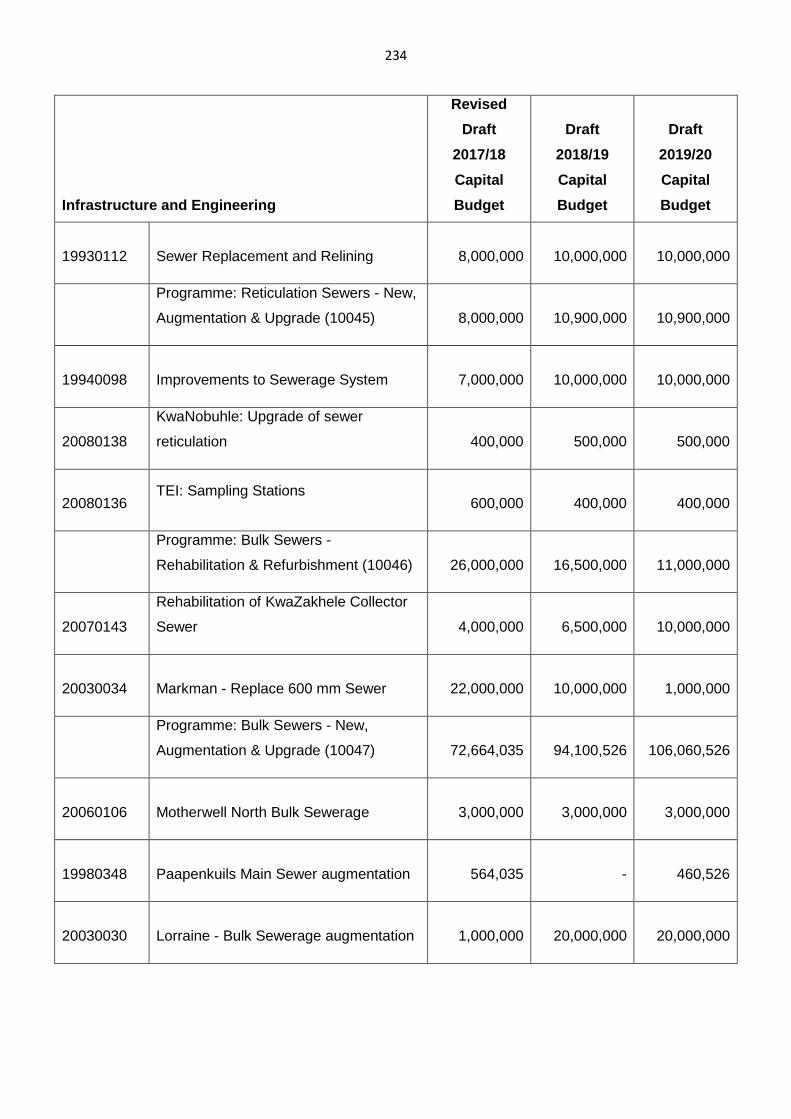
234
Infrastructure and Engineering
Revised
Draft
2017/18
Capital
Budget
Draft
2018/19
Capital
Budget
Draft
2019/20
Capital
Budget
19930112 Sewer Replacement and Relining
8,000,000
10,000,000
10,000,000
Programme: Reticulation Sewers - New,
Augmentation & Upgrade (10045)
8,000,000
10,900,000
10,900,000
19940098 Improvements to Sewerage System
7,000,000
10,000,000
10,000,000
20080138
KwaNobuhle: Upgrade of sewer
reticulation
400,000
500,000
500,000
20080136 TEI: Sampling Stations
600,000
400,000
400,000
Programme: Bulk Sewers -
Rehabilitation & Refurbishment (10046)
26,000,000
16,500,000
11,000,000
20070143
Rehabilitation of KwaZakhele Collector
Sewer
4,000,000
6,500,000
10,000,000
20030034 Markman - Replace 600 mm Sewer
22,000,000
10,000,000
1,000,000
Programme: Bulk Sewers - New,
Augmentation & Upgrade (10047)
72,664,035
94,100,526
106,060,526
20060106 Motherwell North Bulk Sewerage
3,000,000
3,000,000
3,000,000
19980348 Paapenkuils Main Sewer augmentation
564,035
-
460,526
20030030 Lorraine - Bulk Sewerage augmentation
1,000,000
20,000,000
20,000,000
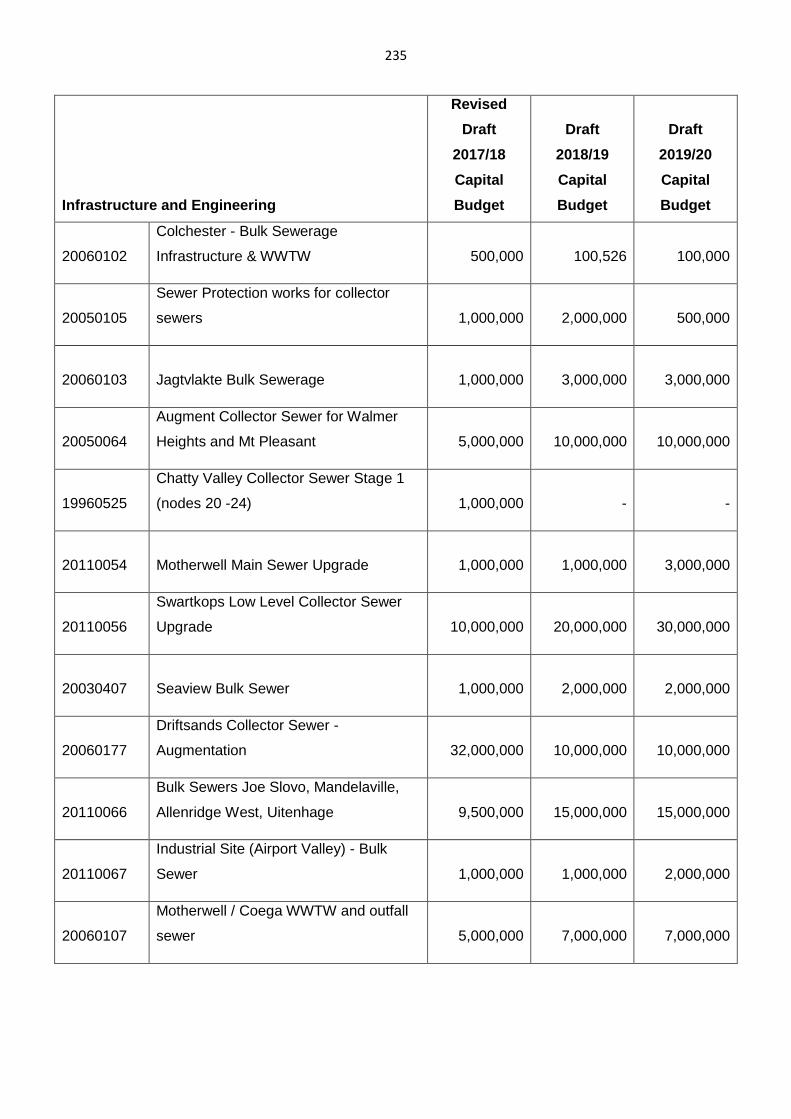
235
Infrastructure and Engineering
Revised
Draft
2017/18
Capital
Budget
Draft
2018/19
Capital
Budget
Draft
2019/20
Capital
Budget
20060102
Colchester - Bulk Sewerage
Infrastructure & WWTW
500,000
100,526
100,000
20050105
Sewer Protection works for collector
sewers
1,000,000
2,000,000
500,000
20060103 Jagtvlakte Bulk Sewerage
1,000,000
3,000,000
3,000,000
20050064
Augment Collector Sewer for Walmer
Heights and Mt Pleasant
5,000,000
10,000,000
10,000,000
19960525
Chatty Valley Collector Sewer Stage 1
(nodes 20 -24)
1,000,000
- -
20110054 Motherwell Main Sewer Upgrade
1,000,000
1,000,000
3,000,000
20110056
Swartkops Low Level Collector Sewer
Upgrade
10,000,000
20,000,000
30,000,000
20030407 Seaview Bulk Sewer
1,000,000
2,000,000
2,000,000
20060177
Driftsands Collector Sewer -
Augmentation
32,000,000
10,000,000
10,000,000
20110066
Bulk Sewers Joe Slovo, Mandelaville,
Allenridge West, Uitenhage
9,500,000
15,000,000
15,000,000
20110067
Industrial Site (Airport Valley) - Bulk
Sewer
1,000,000
1,000,000
2,000,000
20060107
Motherwell / Coega WWTW and outfall
sewer
5,000,000
7,000,000
7,000,000
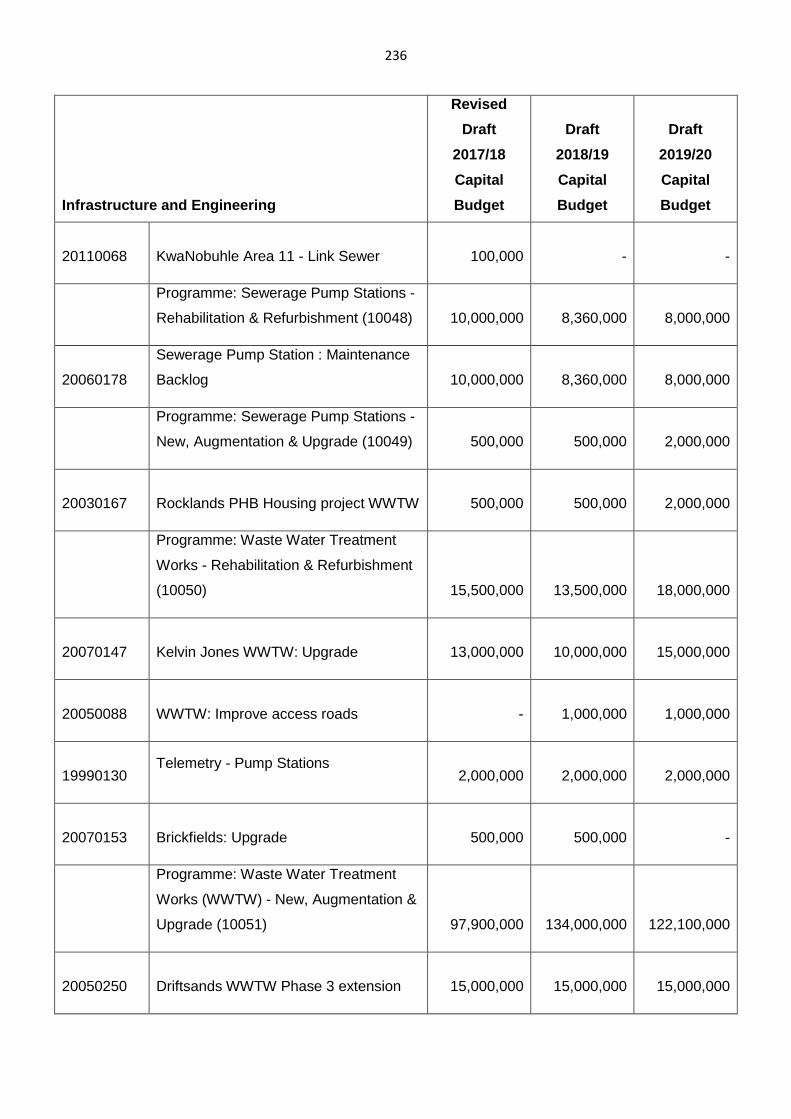
236
Infrastructure and Engineering
Revised
Draft
2017/18
Capital
Budget
Draft
2018/19
Capital
Budget
Draft
2019/20
Capital
Budget
20110068 KwaNobuhle Area 11 - Link Sewer
100,000
- -
Programme: Sewerage Pump Stations -
Rehabilitation & Refurbishment (10048)
10,000,000
8,360,000
8,000,000
20060178
Sewerage Pump Station : Maintenance
Backlog
10,000,000
8,360,000
8,000,000
Programme: Sewerage Pump Stations -
New, Augmentation & Upgrade (10049)
500,000
500,000
2,000,000
20030167 Rocklands PHB Housing project WWTW
500,000
500,000
2,000,000
Programme: Waste Water Treatment
Works - Rehabilitation & Refurbishment
(10050)
15,500,000
13,500,000
18,000,000
20070147 Kelvin Jones WWTW: Upgrade
13,000,000
10,000,000
15,000,000
20050088 WWTW: Improve access roads
-
1,000,000
1,000,000
19990130 Telemetry - Pump Stations
2,000,000
2,000,000
2,000,000
20070153 Brickfields: Upgrade
500,000
500,000 -
Programme: Waste Water Treatment
Works (WWTW) - New, Augmentation &
Upgrade (10051)
97,900,000
134,000,000
122,100,000
20050250 Driftsands WWTW Phase 3 extension
15,000,000
15,000,000
15,000,000
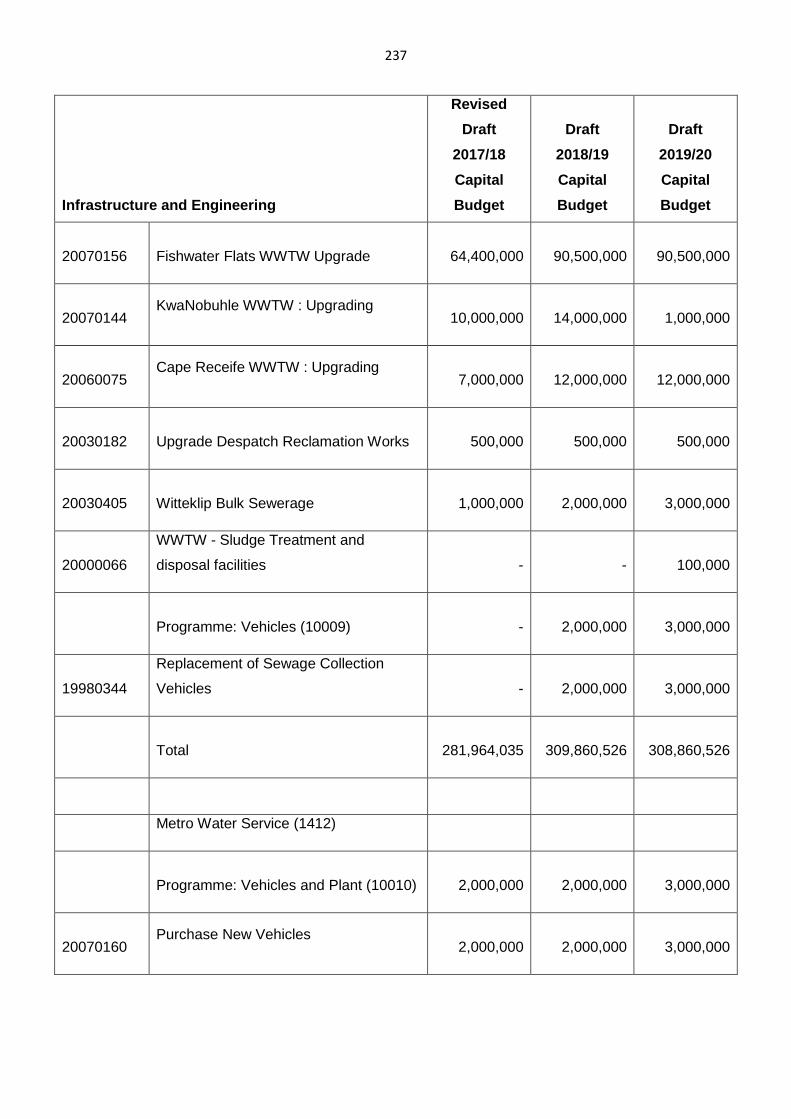
237
Infrastructure and Engineering
Revised
Draft
2017/18
Capital
Budget
Draft
2018/19
Capital
Budget
Draft
2019/20
Capital
Budget
20070156 Fishwater Flats WWTW Upgrade
64,400,000
90,500,000
90,500,000
20070144 KwaNobuhle WWTW : Upgrading
10,000,000
14,000,000
1,000,000
20060075 Cape Receife WWTW : Upgrading
7,000,000
12,000,000
12,000,000
20030182 Upgrade Despatch Reclamation Works
500,000
500,000
500,000
20030405 Witteklip Bulk Sewerage
1,000,000
2,000,000
3,000,000
20000066
WWTW - Sludge Treatment and
disposal facilities
-
-
100,000
Programme: Vehicles (10009)
-
2,000,000
3,000,000
19980344
Replacement of Sewage Collection
Vehicles
-
2,000,000
3,000,000
Total
281,964,035
309,860,526
308,860,526
Metro Water Service (1412)
Programme: Vehicles and Plant (10010)
2,000,000
2,000,000
3,000,000
20070160 Purchase New Vehicles
2,000,000
2,000,000
3,000,000
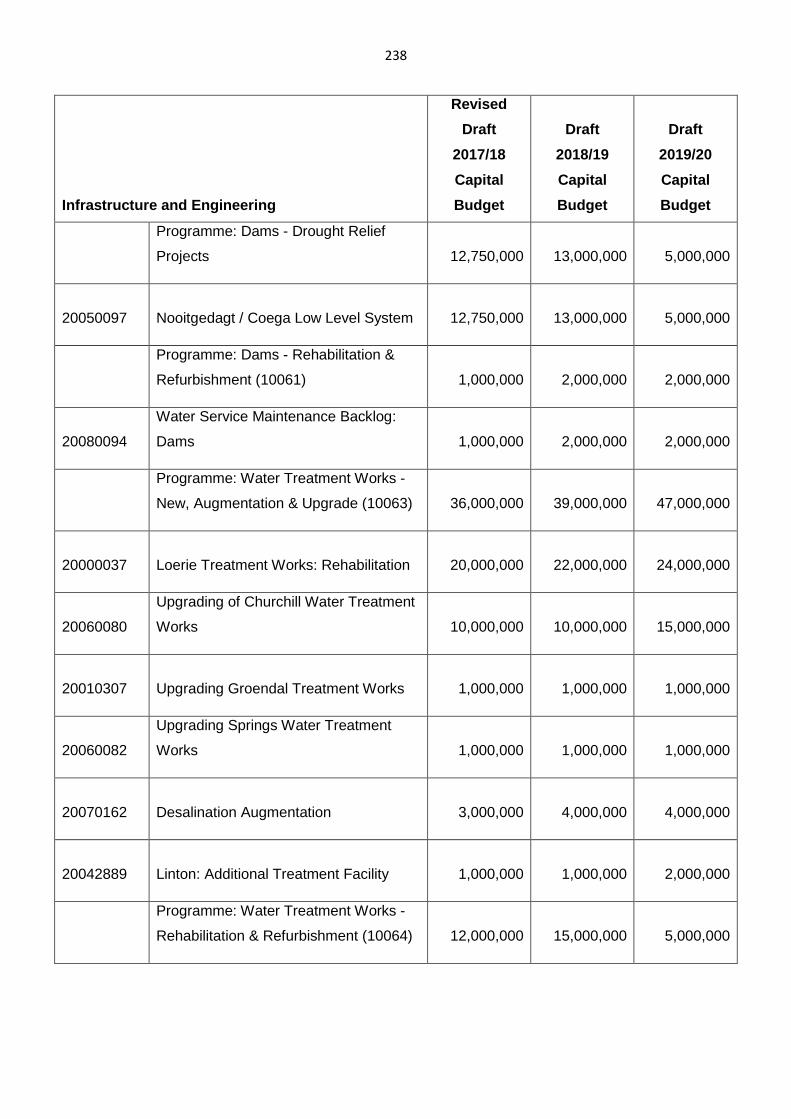
238
Infrastructure and Engineering
Revised
Draft
2017/18
Capital
Budget
Draft
2018/19
Capital
Budget
Draft
2019/20
Capital
Budget
Programme: Dams - Drought Relief
Projects
12,750,000
13,000,000
5,000,000
20050097 Nooitgedagt / Coega Low Level System
12,750,000
13,000,000
5,000,000
Programme: Dams - Rehabilitation &
Refurbishment (10061)
1,000,000
2,000,000
2,000,000
20080094
Water Service Maintenance Backlog:
Dams
1,000,000
2,000,000
2,000,000
Programme: Water Treatment Works -
New, Augmentation & Upgrade (10063)
36,000,000
39,000,000
47,000,000
20000037 Loerie Treatment Works: Rehabilitation
20,000,000
22,000,000
24,000,000
20060080
Upgrading of Churchill Water Treatment
Works
10,000,000
10,000,000
15,000,000
20010307 Upgrading Groendal Treatment Works
1,000,000
1,000,000
1,000,000
20060082
Upgrading Springs Water Treatment
Works
1,000,000
1,000,000
1,000,000
20070162 Desalination Augmentation
3,000,000
4,000,000
4,000,000
20042889 Linton: Additional Treatment Facility
1,000,000
1,000,000
2,000,000
Programme: Water Treatment Works -
Rehabilitation & Refurbishment (10064)
12,000,000
15,000,000
5,000,000
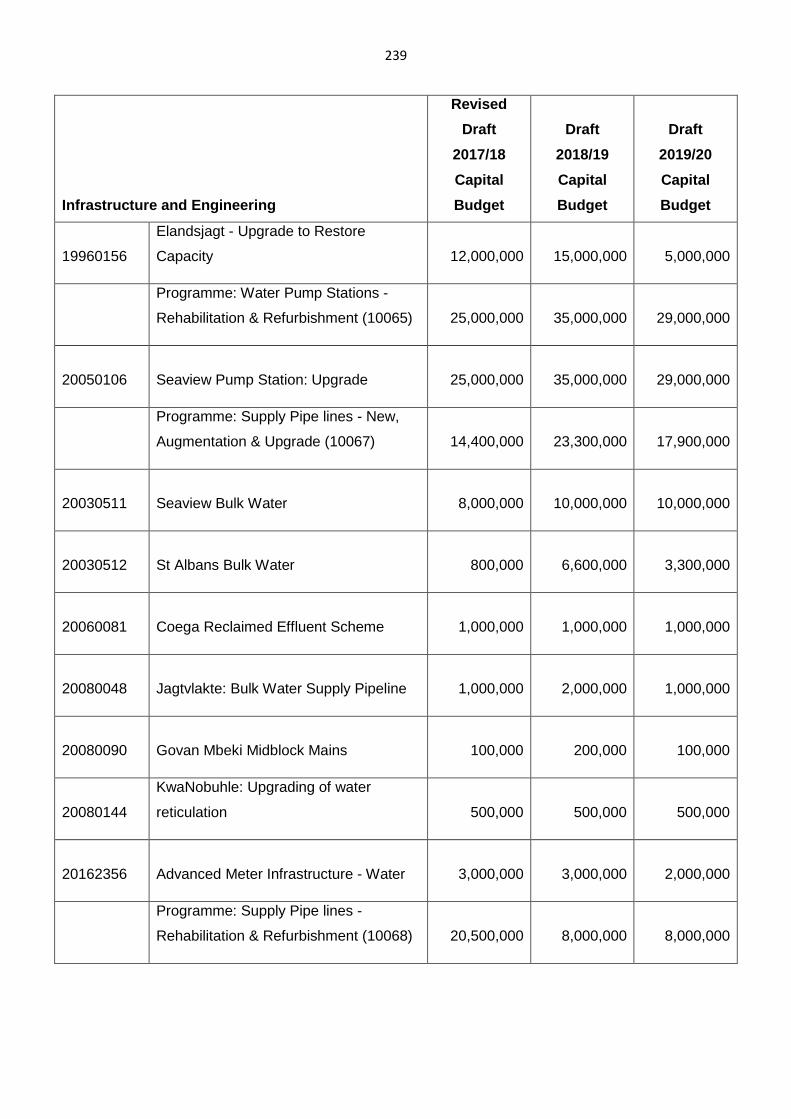
239
Infrastructure and Engineering
Revised
Draft
2017/18
Capital
Budget
Draft
2018/19
Capital
Budget
Draft
2019/20
Capital
Budget
19960156
Elandsjagt - Upgrade to Restore
Capacity
12,000,000
15,000,000
5,000,000
Programme: Water Pump Stations -
Rehabilitation & Refurbishment (10065)
25,000,000
35,000,000
29,000,000
20050106 Seaview Pump Station: Upgrade
25,000,000
35,000,000
29,000,000
Programme: Supply Pipe lines - New,
Augmentation & Upgrade (10067)
14,400,000
23,300,000
17,900,000
20030511 Seaview Bulk Water
8,000,000
10,000,000
10,000,000
20030512 St Albans Bulk Water
800,000
6,600,000
3,300,000
20060081 Coega Reclaimed Effluent Scheme
1,000,000
1,000,000
1,000,000
20080048 Jagtvlakte: Bulk Water Supply Pipeline
1,000,000
2,000,000
1,000,000
20080090 Govan Mbeki Midblock Mains
100,000
200,000
100,000
20080144
KwaNobuhle: Upgrading of water
reticulation
500,000
500,000
500,000
20162356 Advanced Meter Infrastructure - Water
3,000,000
3,000,000
2,000,000
Programme: Supply Pipe lines -
Rehabilitation & Refurbishment (10068)
20,500,000
8,000,000
8,000,000
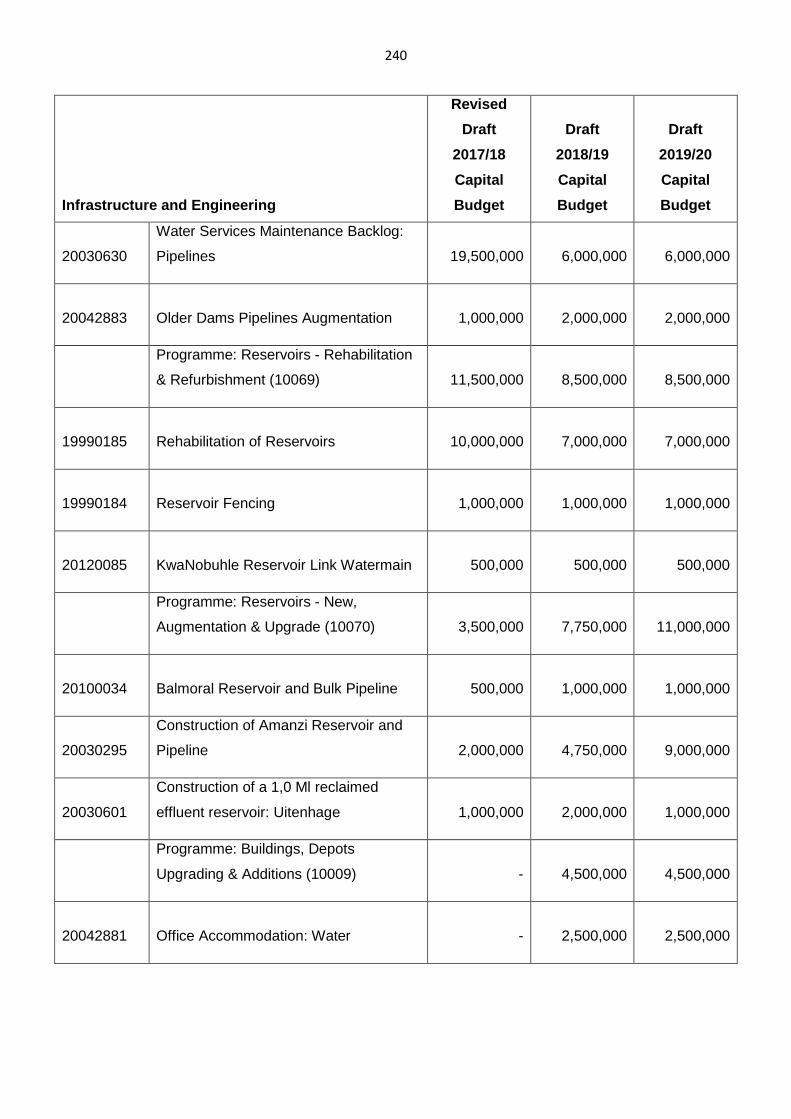
240
Infrastructure and Engineering
Revised
Draft
2017/18
Capital
Budget
Draft
2018/19
Capital
Budget
Draft
2019/20
Capital
Budget
20030630
Water Services Maintenance Backlog:
Pipelines
19,500,000
6,000,000
6,000,000
20042883 Older Dams Pipelines Augmentation
1,000,000
2,000,000
2,000,000
Programme: Reservoirs - Rehabilitation
& Refurbishment (10069)
11,500,000
8,500,000
8,500,000
19990185 Rehabilitation of Reservoirs
10,000,000
7,000,000
7,000,000
19990184 Reservoir Fencing
1,000,000
1,000,000
1,000,000
20120085 KwaNobuhle Reservoir Link Watermain
500,000
500,000
500,000
Programme: Reservoirs - New,
Augmentation & Upgrade (10070)
3,500,000
7,750,000
11,000,000
20100034 Balmoral Reservoir and Bulk Pipeline
500,000
1,000,000
1,000,000
20030295
Construction of Amanzi Reservoir and
Pipeline
2,000,000
4,750,000
9,000,000
20030601
Construction of a 1,0 Ml reclaimed
effluent reservoir: Uitenhage
1,000,000
2,000,000
1,000,000
Programme: Buildings, Depots
Upgrading & Additions (10009)
-
4,500,000
4,500,000
20042881 Office Accommodation: Water
-
2,500,000
2,500,000
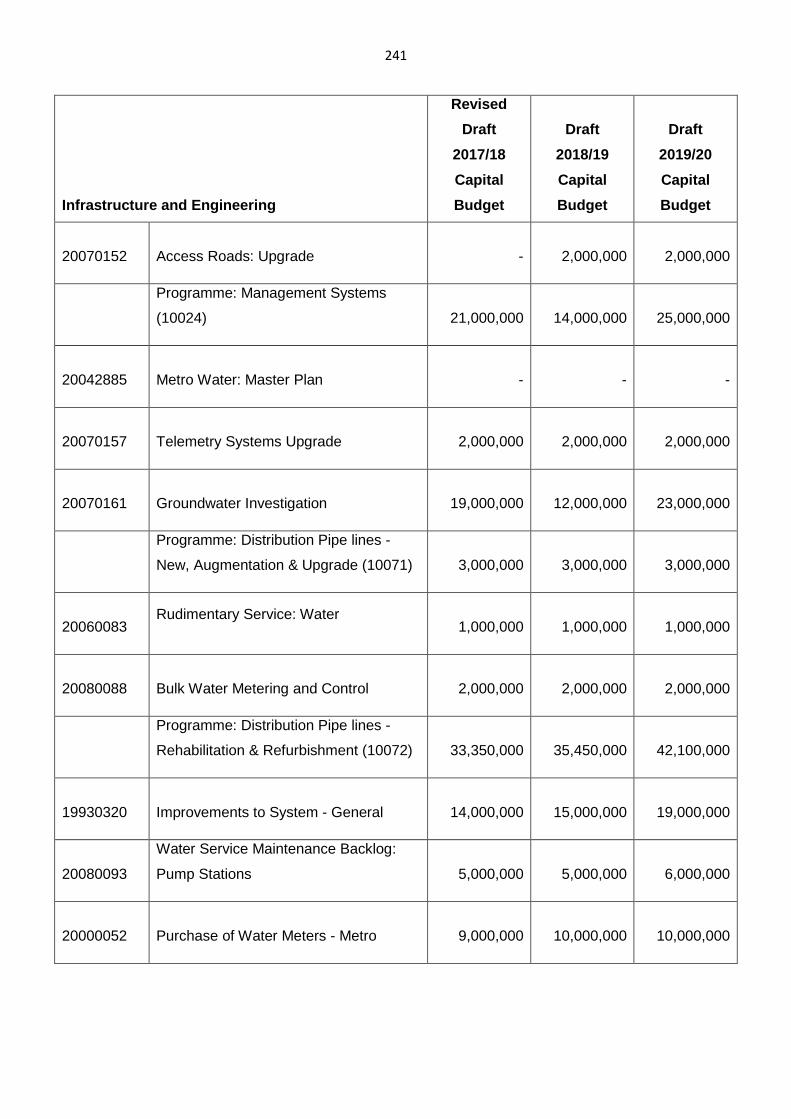
241
Infrastructure and Engineering
Revised
Draft
2017/18
Capital
Budget
Draft
2018/19
Capital
Budget
Draft
2019/20
Capital
Budget
20070152 Access Roads: Upgrade
-
2,000,000
2,000,000
Programme: Management Systems
(10024)
21,000,000
14,000,000
25,000,000
20042885 Metro Water: Master Plan
-
- -
20070157 Telemetry Systems Upgrade
2,000,000
2,000,000
2,000,000
20070161 Groundwater Investigation
19,000,000
12,000,000
23,000,000
Programme: Distribution Pipe lines -
New, Augmentation & Upgrade (10071)
3,000,000
3,000,000
3,000,000
20060083 Rudimentary Service: Water
1,000,000
1,000,000
1,000,000
20080088 Bulk Water Metering and Control
2,000,000
2,000,000
2,000,000
Programme: Distribution Pipe lines -
Rehabilitation & Refurbishment (10072)
33,350,000
35,450,000
42,100,000
19930320 Improvements to System - General
14,000,000
15,000,000
19,000,000
20080093
Water Service Maintenance Backlog:
Pump Stations
5,000,000
5,000,000
6,000,000
20000052 Purchase of Water Meters - Metro
9,000,000
10,000,000
10,000,000
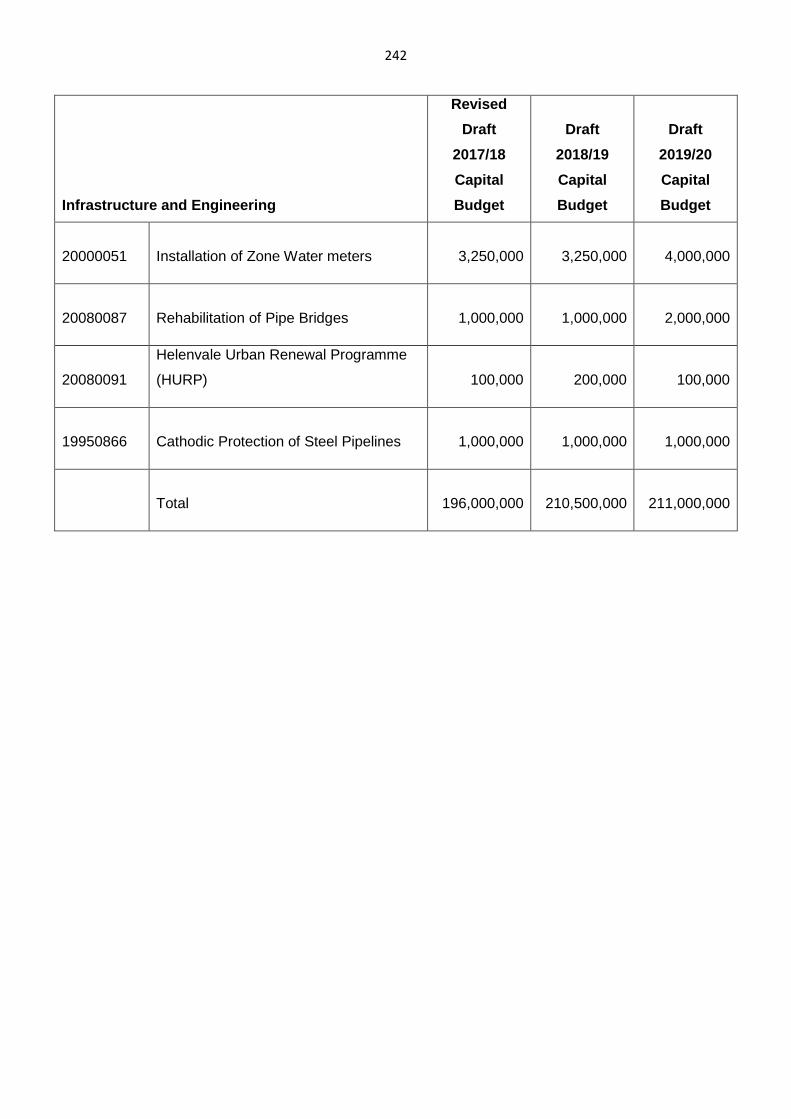
242
Infrastructure and Engineering
Revised
Draft
2017/18
Capital
Budget
Draft
2018/19
Capital
Budget
Draft
2019/20
Capital
Budget
20000051 Installation of Zone Water meters
3,250,000
3,250,000
4,000,000
20080087 Rehabilitation of Pipe Bridges
1,000,000
1,000,000
2,000,000
20080091
Helenvale Urban Renewal Programme
(HURP)
100,000
200,000
100,000
19950866 Cathodic Protection of Steel Pipelines
1,000,000
1,000,000
1,000,000
Total
196,000,000
210,500,000
211,000,000
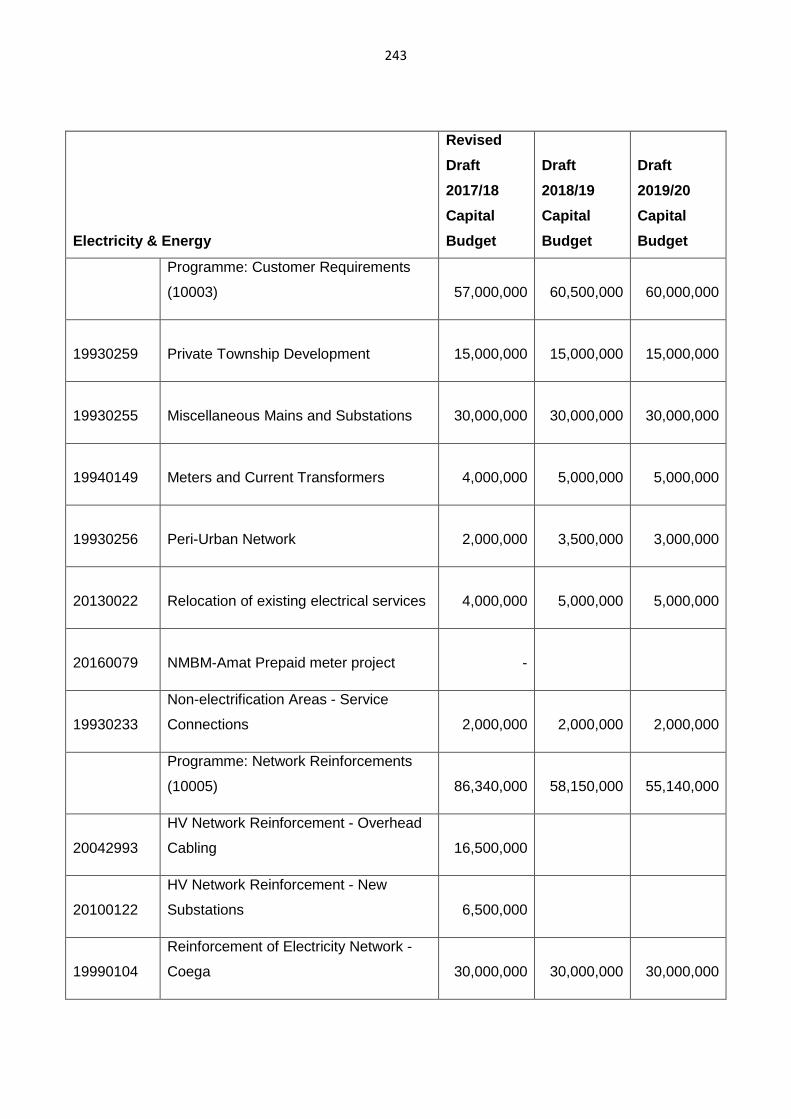
243
Electricity & Energy
Revised
Draft
2017/18
Capital
Budget
Draft
2018/19
Capital
Budget
Draft
2019/20
Capital
Budget
Programme: Customer Requirements
(10003)
57,000,000
60,500,000
60,000,000
19930259 Private Township Development
15,000,000
15,000,000
15,000,000
19930255 Miscellaneous Mains and Substations
30,000,000
30,000,000
30,000,000
19940149 Meters and Current Transformers
4,000,000
5,000,000
5,000,000
19930256 Peri-Urban Network
2,000,000
3,500,000
3,000,000
20130022 Relocation of existing electrical services
4,000,000
5,000,000
5,000,000
20160079 NMBM-Amat Prepaid meter project
-
19930233
Non-electrification Areas - Service
Connections
2,000,000
2,000,000
2,000,000
Programme: Network Reinforcements
(10005)
86,340,000
58,150,000
55,140,000
20042993
HV Network Reinforcement - Overhead
Cabling
16,500,000
20100122
HV Network Reinforcement - New
Substations
6,500,000
19990104
Reinforcement of Electricity Network -
Coega
30,000,000
30,000,000
30,000,000
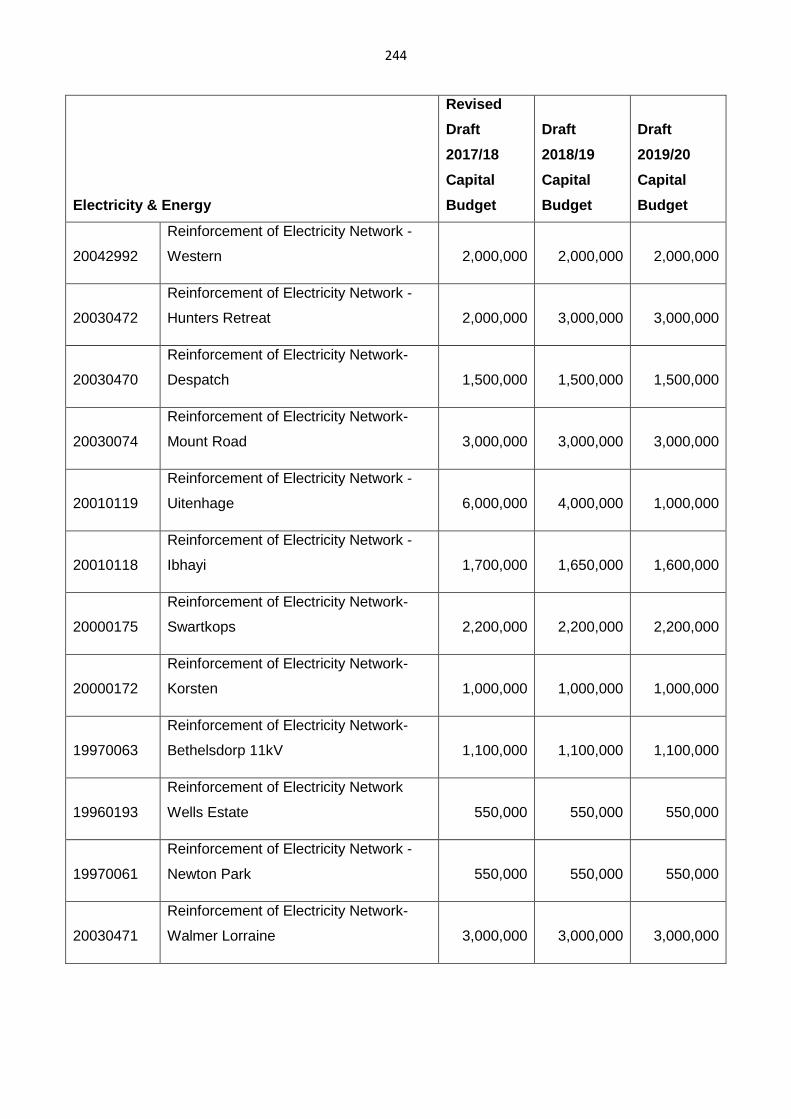
244
Electricity & Energy
Revised
Draft
2017/18
Capital
Budget
Draft
2018/19
Capital
Budget
Draft
2019/20
Capital
Budget
20042992
Reinforcement of Electricity Network -
Western
2,000,000
2,000,000
2,000,000
20030472
Reinforcement of Electricity Network -
Hunters Retreat
2,000,000
3,000,000
3,000,000
20030470
Reinforcement of Electricity Network-
Despatch
1,500,000
1,500,000
1,500,000
20030074
Reinforcement of Electricity Network-
Mount Road
3,000,000
3,000,000
3,000,000
20010119
Reinforcement of Electricity Network -
Uitenhage
6,000,000
4,000,000
1,000,000
20010118
Reinforcement of Electricity Network -
Ibhayi
1,700,000
1,650,000
1,600,000
20000175
Reinforcement of Electricity Network-
Swartkops
2,200,000
2,200,000
2,200,000
20000172
Reinforcement of Electricity Network-
Korsten
1,000,000
1,000,000
1,000,000
19970063
Reinforcement of Electricity Network-
Bethelsdorp 11kV
1,100,000
1,100,000
1,100,000
19960193
Reinforcement of Electricity Network
Wells Estate
550,000
550,000
550,000
19970061
Reinforcement of Electricity Network -
Newton Park
550,000
550,000
550,000
20030471
Reinforcement of Electricity Network-
Walmer Lorraine
3,000,000
3,000,000
3,000,000
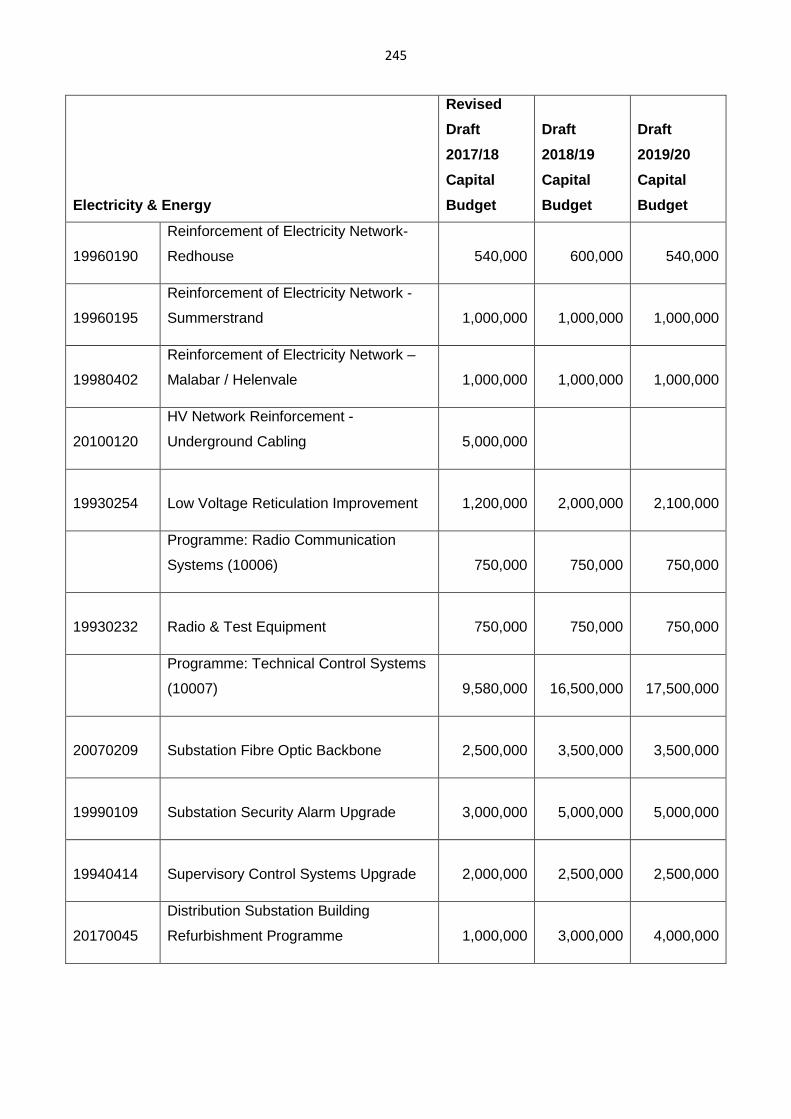
245
Electricity & Energy
Revised
Draft
2017/18
Capital
Budget
Draft
2018/19
Capital
Budget
Draft
2019/20
Capital
Budget
19960190
Reinforcement of Electricity Network-
Redhouse
540,000
600,000
540,000
19960195
Reinforcement of Electricity Network -
Summerstrand
1,000,000
1,000,000
1,000,000
19980402
Reinforcement of Electricity Network –
Malabar / Helenvale
1,000,000
1,000,000
1,000,000
20100120
HV Network Reinforcement -
Underground Cabling
5,000,000
19930254 Low Voltage Reticulation Improvement
1,200,000
2,000,000
2,100,000
Programme: Radio Communication
Systems (10006)
750,000
750,000
750,000
19930232 Radio & Test Equipment
750,000
750,000
750,000
Programme: Technical Control Systems
(10007)
9,580,000
16,500,000
17,500,000
20070209 Substation Fibre Optic Backbone
2,500,000
3,500,000
3,500,000
19990109 Substation Security Alarm Upgrade
3,000,000
5,000,000
5,000,000
19940414 Supervisory Control Systems Upgrade
2,000,000
2,500,000
2,500,000
20170045
Distribution Substation Building
Refurbishment Programme
1,000,000
3,000,000
4,000,000
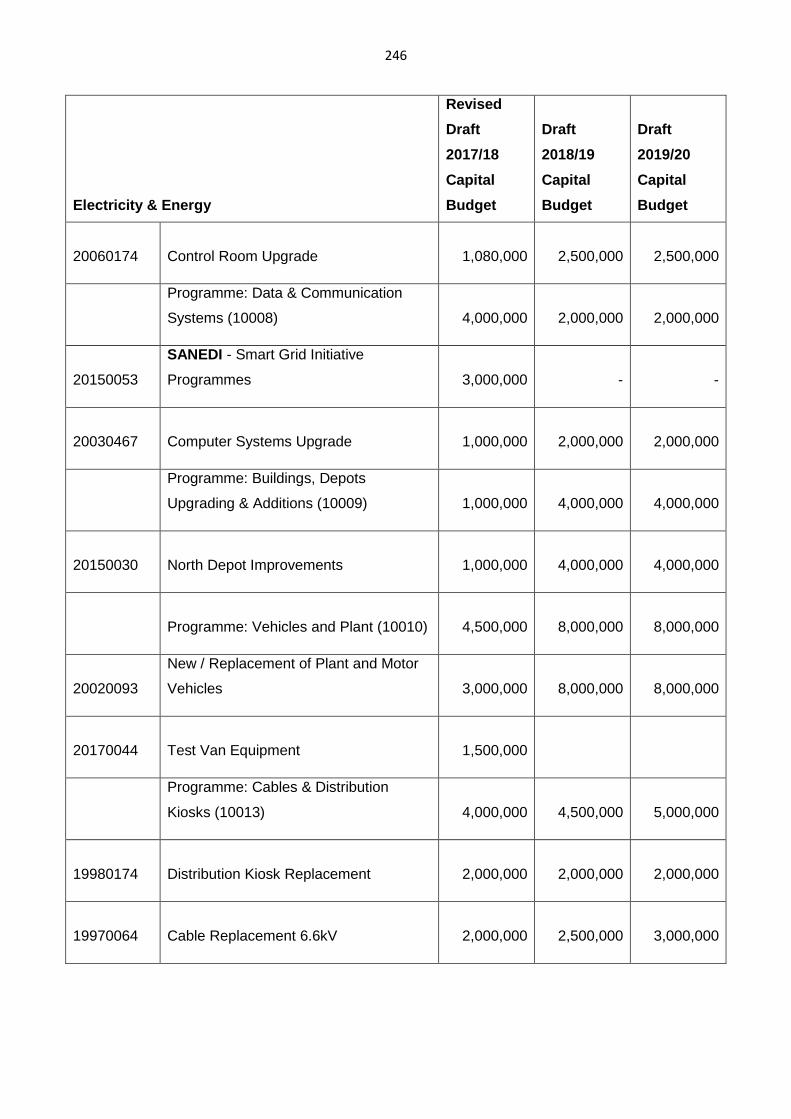
246
Electricity & Energy
Revised
Draft
2017/18
Capital
Budget
Draft
2018/19
Capital
Budget
Draft
2019/20
Capital
Budget
20060174 Control Room Upgrade
1,080,000
2,500,000
2,500,000
Programme: Data & Communication
Systems (10008)
4,000,000
2,000,000
2,000,000
20150053
SANEDI - Smart Grid Initiative
Programmes
3,000,000
-
-
20030467 Computer Systems Upgrade
1,000,000
2,000,000
2,000,000
Programme: Buildings, Depots
Upgrading & Additions (10009)
1,000,000
4,000,000
4,000,000
20150030 North Depot Improvements
1,000,000
4,000,000
4,000,000
Programme: Vehicles and Plant (10010)
4,500,000
8,000,000
8,000,000
20020093
New / Replacement of Plant and Motor
Vehicles
3,000,000
8,000,000
8,000,000
20170044 Test Van Equipment
1,500,000
Programme: Cables & Distribution
Kiosks (10013)
4,000,000
4,500,000
5,000,000
19980174 Distribution Kiosk Replacement
2,000,000
2,000,000
2,000,000
19970064 Cable Replacement 6.6kV
2,000,000
2,500,000
3,000,000
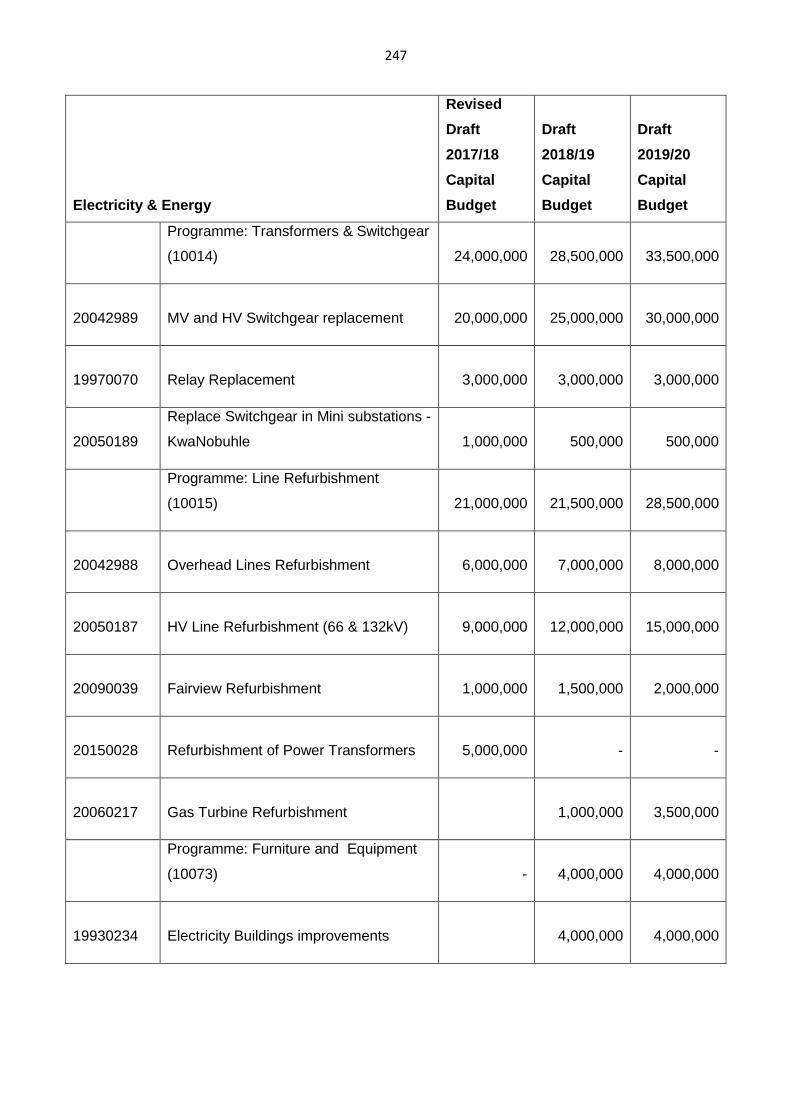
247
Electricity & Energy
Revised
Draft
2017/18
Capital
Budget
Draft
2018/19
Capital
Budget
Draft
2019/20
Capital
Budget
Programme: Transformers & Switchgear
(10014)
24,000,000
28,500,000
33,500,000
20042989 MV and HV Switchgear replacement
20,000,000
25,000,000
30,000,000
19970070 Relay Replacement
3,000,000
3,000,000
3,000,000
20050189
Replace Switchgear in Mini substations -
KwaNobuhle
1,000,000
500,000
500,000
Programme: Line Refurbishment
(10015)
21,000,000
21,500,000
28,500,000
20042988 Overhead Lines Refurbishment
6,000,000
7,000,000
8,000,000
20050187 HV Line Refurbishment (66 & 132kV)
9,000,000
12,000,000
15,000,000
20090039 Fairview Refurbishment
1,000,000
1,500,000
2,000,000
20150028 Refurbishment of Power Transformers
5,000,000
-
-
20060217 Gas Turbine Refurbishment
1,000,000
3,500,000
Programme: Furniture and Equipment
(10073)
-
4,000,000
4,000,000
19930234 Electricity Buildings improvements
4,000,000
4,000,000
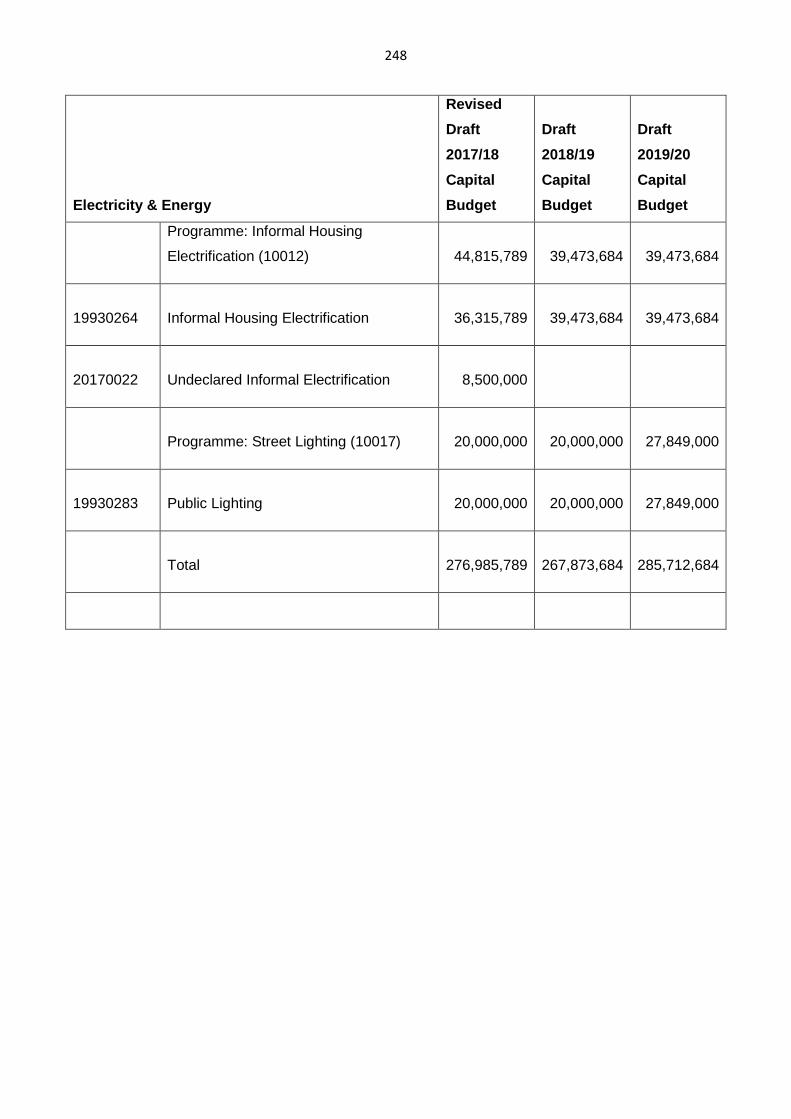
248
Electricity & Energy
Revised
Draft
2017/18
Capital
Budget
Draft
2018/19
Capital
Budget
Draft
2019/20
Capital
Budget
Programme: Informal Housing
Electrification (10012)
44,815,789
39,473,684
39,473,684
19930264 Informal Housing Electrification
36,315,789
39,473,684
39,473,684
20170022 Undeclared Informal Electrification
8,500,000
Programme: Street Lighting (10017)
20,000,000
20,000,000
27,849,000
19930283 Public Lighting
20,000,000
20,000,000
27,849,000
Total
276,985,789
267,873,684
285,712,684
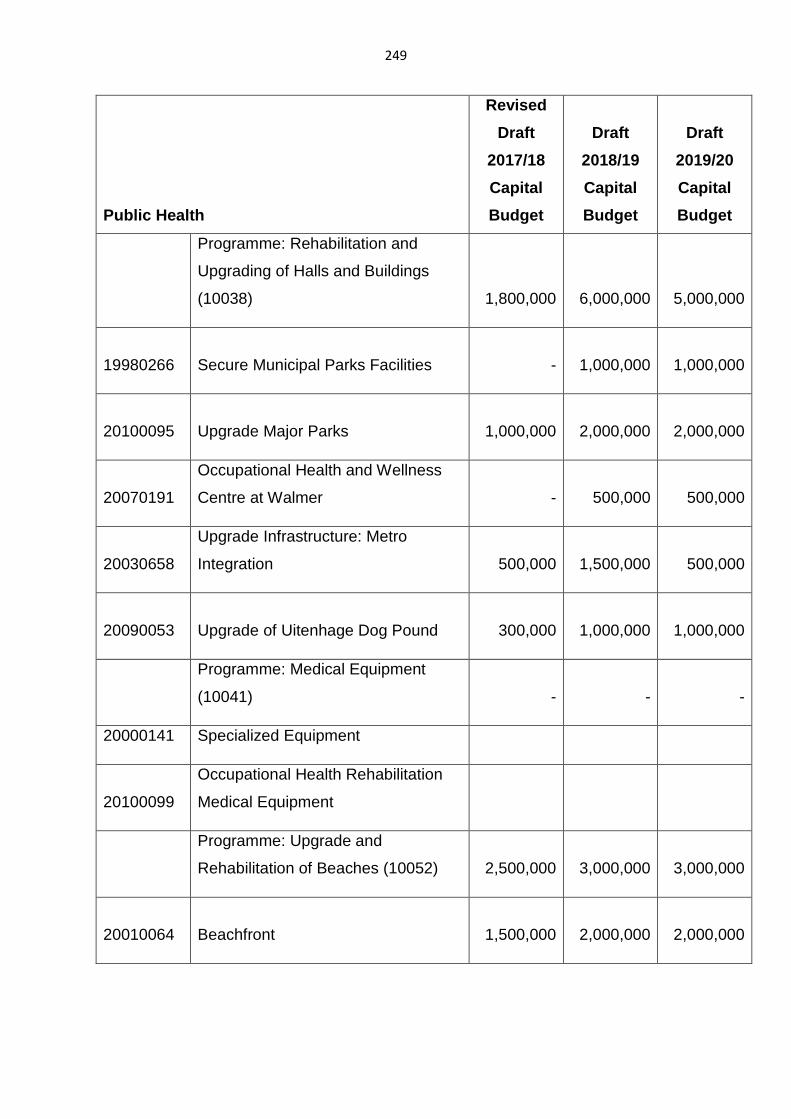
249
Public Health
Revised
Draft
2017/18
Capital
Budget
Draft
2018/19
Capital
Budget
Draft
2019/20
Capital
Budget
Programme: Rehabilitation and
Upgrading of Halls and Buildings
(10038)
1,800,000
6,000,000
5,000,000
19980266 Secure Municipal Parks Facilities
-
1,000,000
1,000,000
20100095 Upgrade Major Parks
1,000,000
2,000,000
2,000,000
20070191
Occupational Health and Wellness
Centre at Walmer
-
500,000
500,000
20030658
Upgrade Infrastructure: Metro
Integration
500,000
1,500,000
500,000
20090053 Upgrade of Uitenhage Dog Pound
300,000
1,000,000
1,000,000
Programme: Medical Equipment
(10041)
-
-
-
20000141 Specialized Equipment
20100099
Occupational Health Rehabilitation
Medical Equipment
Programme: Upgrade and
Rehabilitation of Beaches (10052)
2,500,000
3,000,000
3,000,000
20010064 Beachfront
1,500,000
2,000,000
2,000,000
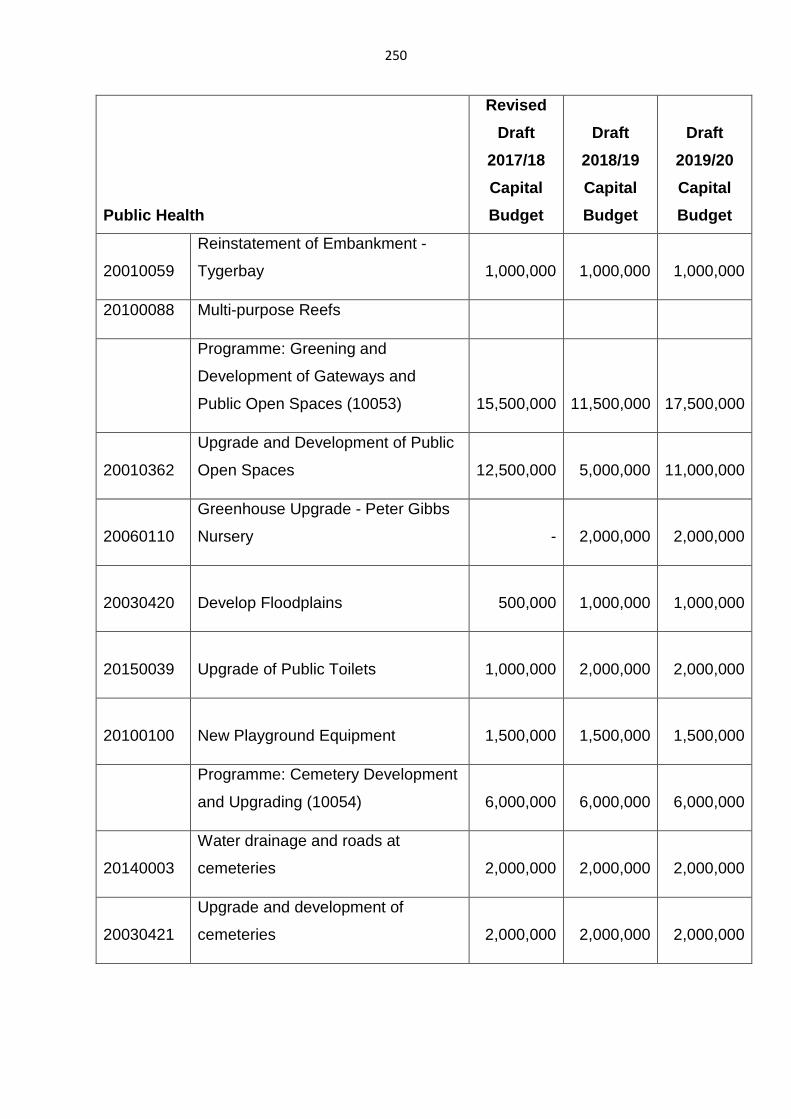
250
Public Health
Revised
Draft
2017/18
Capital
Budget
Draft
2018/19
Capital
Budget
Draft
2019/20
Capital
Budget
20010059
Reinstatement of Embankment -
Tygerbay
1,000,000
1,000,000
1,000,000
20100088 Multi-purpose Reefs
Programme: Greening and
Development of Gateways and
Public Open Spaces (10053)
15,500,000
11,500,000
17,500,000
20010362
Upgrade and Development of Public
Open Spaces
12,500,000
5,000,000
11,000,000
20060110
Greenhouse Upgrade - Peter Gibbs
Nursery
-
2,000,000
2,000,000
20030420 Develop Floodplains
500,000
1,000,000
1,000,000
20150039 Upgrade of Public Toilets
1,000,000
2,000,000
2,000,000
20100100 New Playground Equipment
1,500,000
1,500,000
1,500,000
Programme: Cemetery Development
and Upgrading (10054)
6,000,000
6,000,000
6,000,000
20140003
Water drainage and roads at
cemeteries
2,000,000
2,000,000
2,000,000
20030421
Upgrade and development of
cemeteries
2,000,000
2,000,000
2,000,000
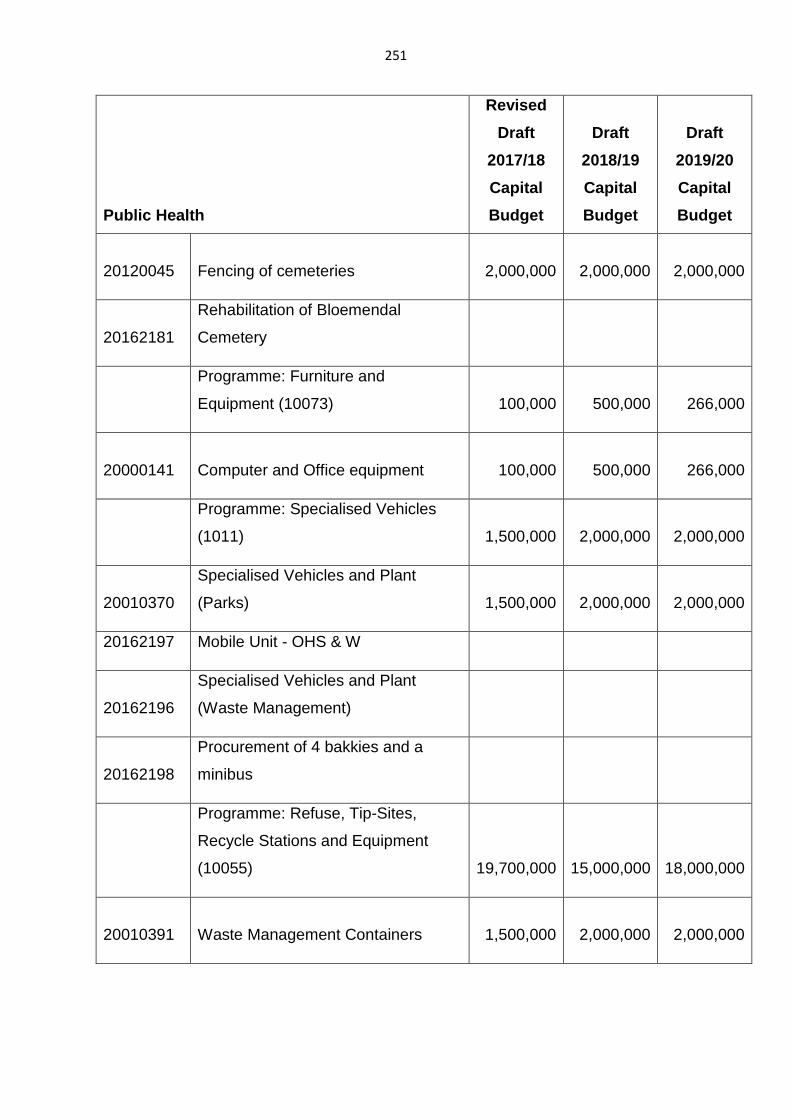
251
Public Health
Revised
Draft
2017/18
Capital
Budget
Draft
2018/19
Capital
Budget
Draft
2019/20
Capital
Budget
20120045 Fencing of cemeteries
2,000,000
2,000,000
2,000,000
20162181
Rehabilitation of Bloemendal
Cemetery
Programme: Furniture and
Equipment (10073)
100,000
500,000
266,000
20000141 Computer and Office equipment
100,000
500,000
266,000
Programme: Specialised Vehicles
(1011)
1,500,000
2,000,000
2,000,000
20010370
Specialised Vehicles and Plant
(Parks)
1,500,000
2,000,000
2,000,000
20162197 Mobile Unit - OHS & W
20162196
Specialised Vehicles and Plant
(Waste Management)
20162198
Procurement of 4 bakkies and a
minibus
Programme: Refuse, Tip-Sites,
Recycle Stations and Equipment
(10055)
19,700,000
15,000,000
18,000,000
20010391 Waste Management Containers
1,500,000
2,000,000
2,000,000
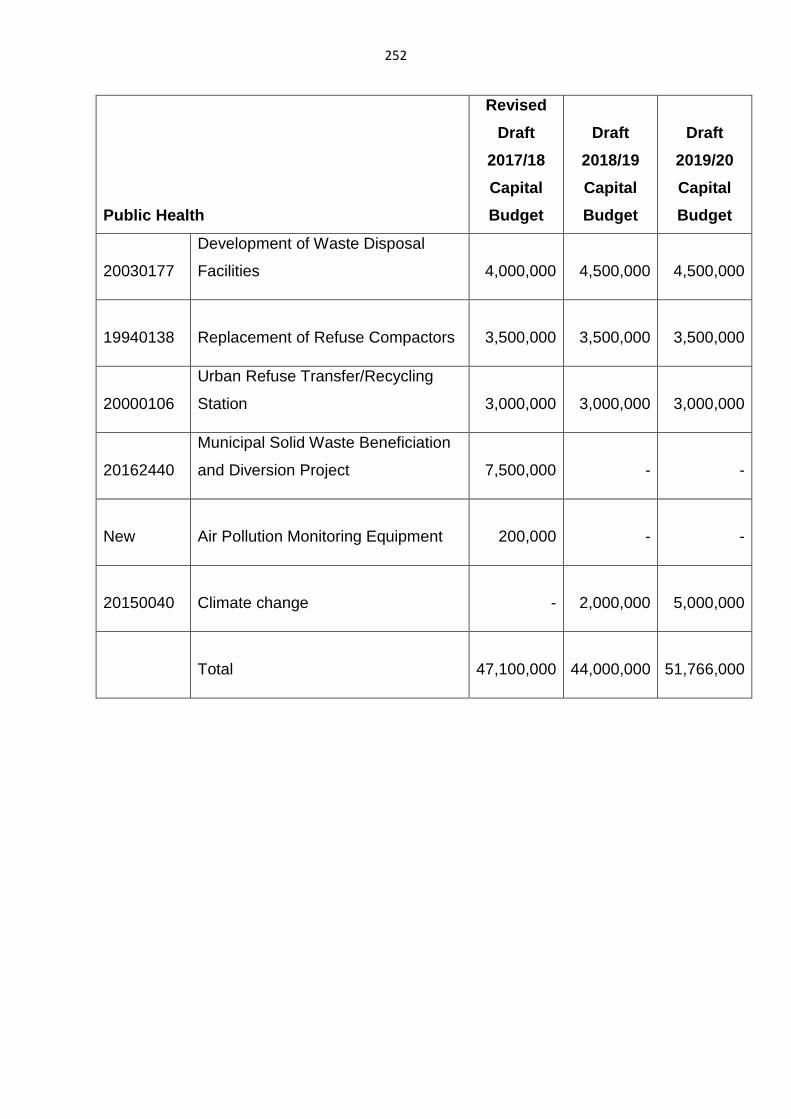
252
Public Health
Revised
Draft
2017/18
Capital
Budget
Draft
2018/19
Capital
Budget
Draft
2019/20
Capital
Budget
20030177
Development of Waste Disposal
Facilities
4,000,000
4,500,000
4,500,000
19940138 Replacement of Refuse Compactors
3,500,000
3,500,000
3,500,000
20000106
Urban Refuse Transfer/Recycling
Station
3,000,000
3,000,000
3,000,000
20162440
Municipal Solid Waste Beneficiation
and Diversion Project
7,500,000
-
-
New Air Pollution Monitoring Equipment
200,000
-
-
20150040 Climate change
-
2,000,000
5,000,000
Total
47,100,000
44,000,000
51,766,000
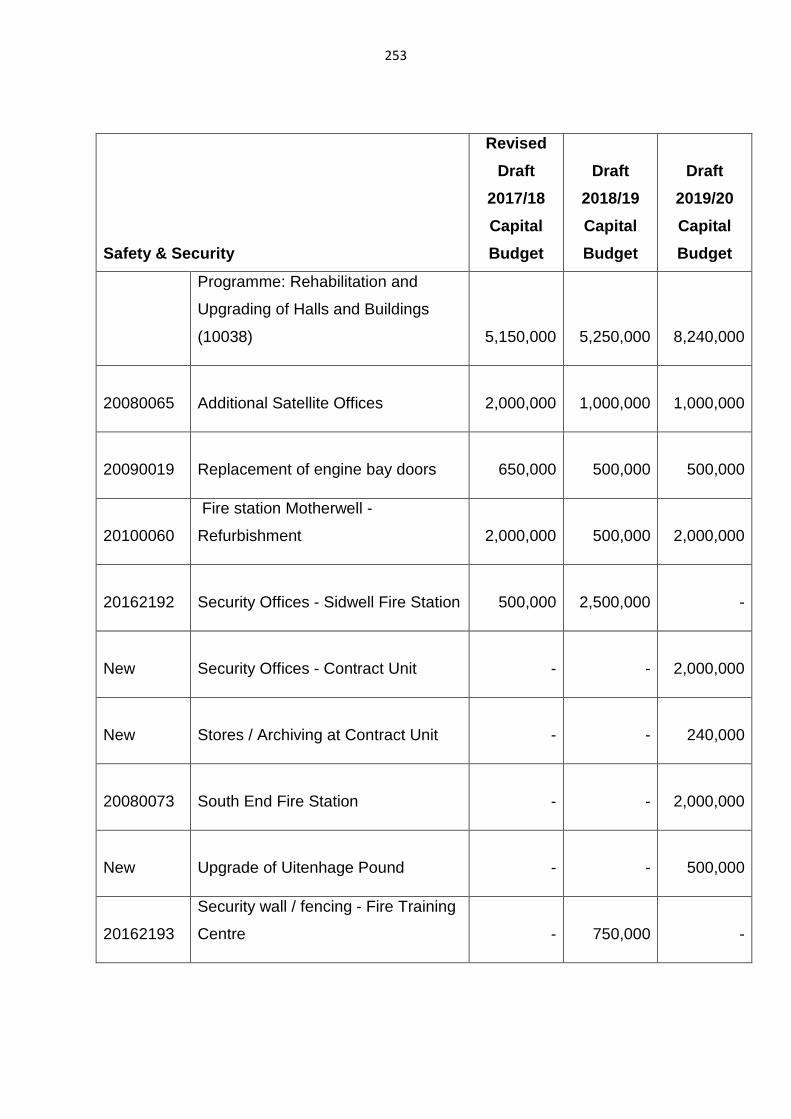
253
Safety & Security
Revised
Draft
2017/18
Capital
Budget
Draft
2018/19
Capital
Budget
Draft
2019/20
Capital
Budget
Programme: Rehabilitation and
Upgrading of Halls and Buildings
(10038)
5,150,000
5,250,000
8,240,000
20080065 Additional Satellite Offices
2,000,000
1,000,000
1,000,000
20090019 Replacement of engine bay doors
650,000
500,000
500,000
20100060
Fire station Motherwell -
Refurbishment
2,000,000
500,000
2,000,000
20162192 Security Offices - Sidwell Fire Station
500,000
2,500,000
-
New Security Offices - Contract Unit
-
-
2,000,000
New Stores / Archiving at Contract Unit
-
-
240,000
20080073 South End Fire Station
-
-
2,000,000
New Upgrade of Uitenhage Pound
-
-
500,000
20162193
Security wall / fencing - Fire Training
Centre
-
750,000
-
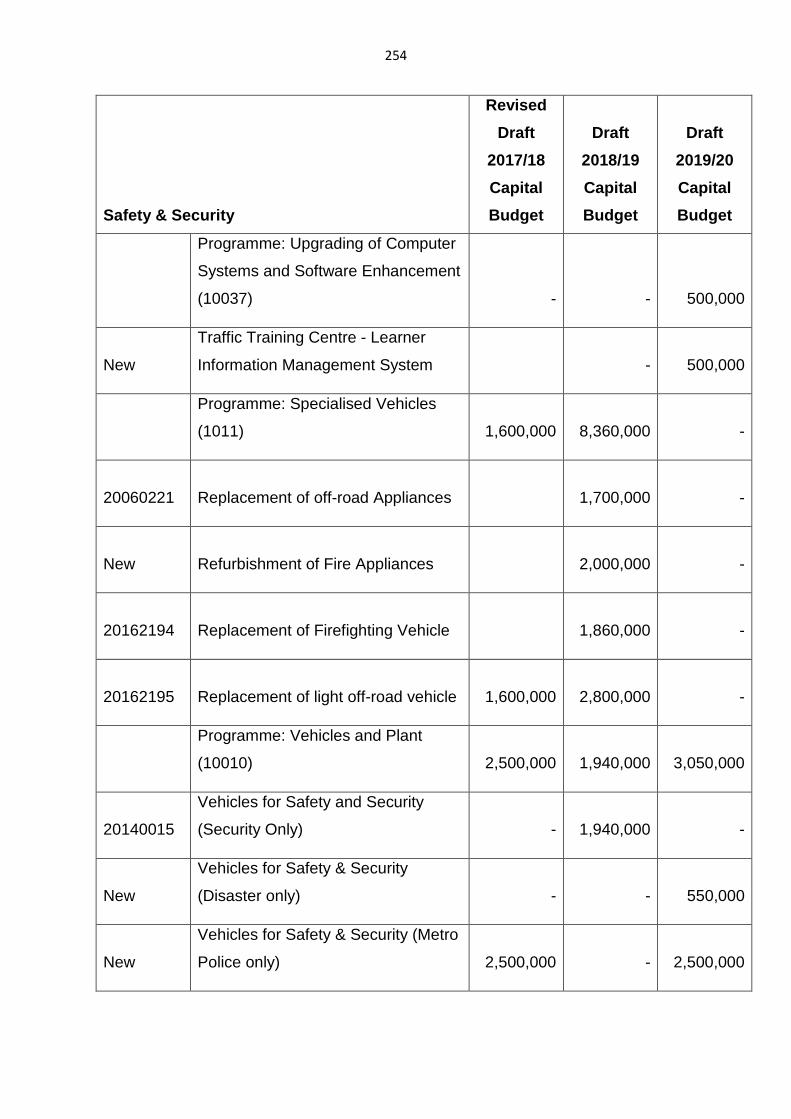
254
Safety & Security
Revised
Draft
2017/18
Capital
Budget
Draft
2018/19
Capital
Budget
Draft
2019/20
Capital
Budget
Programme: Upgrading of Computer
Systems and Software Enhancement
(10037)
-
-
500,000
New
Traffic Training Centre - Learner
Information Management System
-
500,000
Programme: Specialised Vehicles
(1011)
1,600,000
8,360,000
-
20060221 Replacement of off-road Appliances
1,700,000
-
New Refurbishment of Fire Appliances
2,000,000
-
20162194 Replacement of Firefighting Vehicle
1,860,000
-
20162195 Replacement of light off-road vehicle
1,600,000
2,800,000
-
Programme: Vehicles and Plant
(10010)
2,500,000
1,940,000
3,050,000
20140015
Vehicles for Safety and Security
(Security Only)
-
1,940,000
-
New
Vehicles for Safety & Security
(Disaster only)
-
-
550,000
New
Vehicles for Safety & Security (Metro
Police only)
2,500,000
-
2,500,000
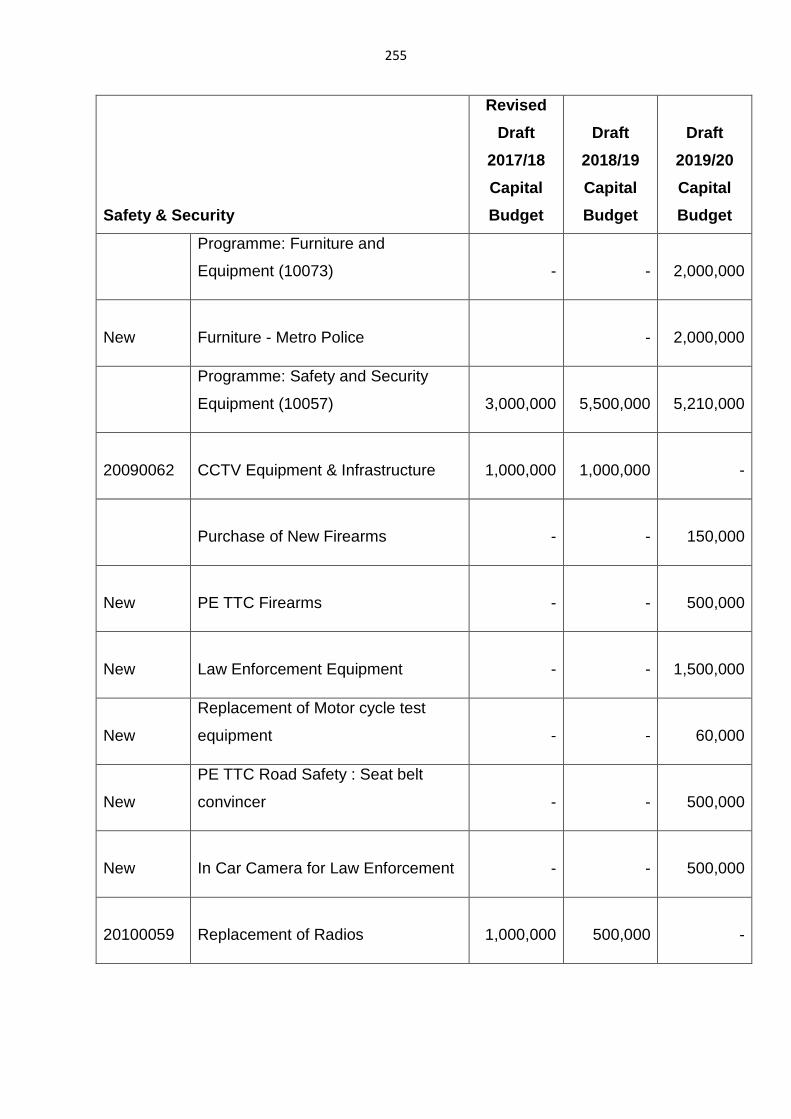
255
Safety & Security
Revised
Draft
2017/18
Capital
Budget
Draft
2018/19
Capital
Budget
Draft
2019/20
Capital
Budget
Programme: Furniture and
Equipment (10073)
-
-
2,000,000
New Furniture - Metro Police
-
2,000,000
Programme: Safety and Security
Equipment (10057)
3,000,000
5,500,000
5,210,000
20090062 CCTV Equipment & Infrastructure
1,000,000
1,000,000
-
Purchase of New Firearms
-
-
150,000
New PE TTC Firearms
-
-
500,000
New Law Enforcement Equipment
-
-
1,500,000
New
Replacement of Motor cycle test
equipment
-
-
60,000
New
PE TTC Road Safety : Seat belt
convincer
-
-
500,000
New In Car Camera for Law Enforcement
-
-
500,000
20100059 Replacement of Radios
1,000,000
500,000
-
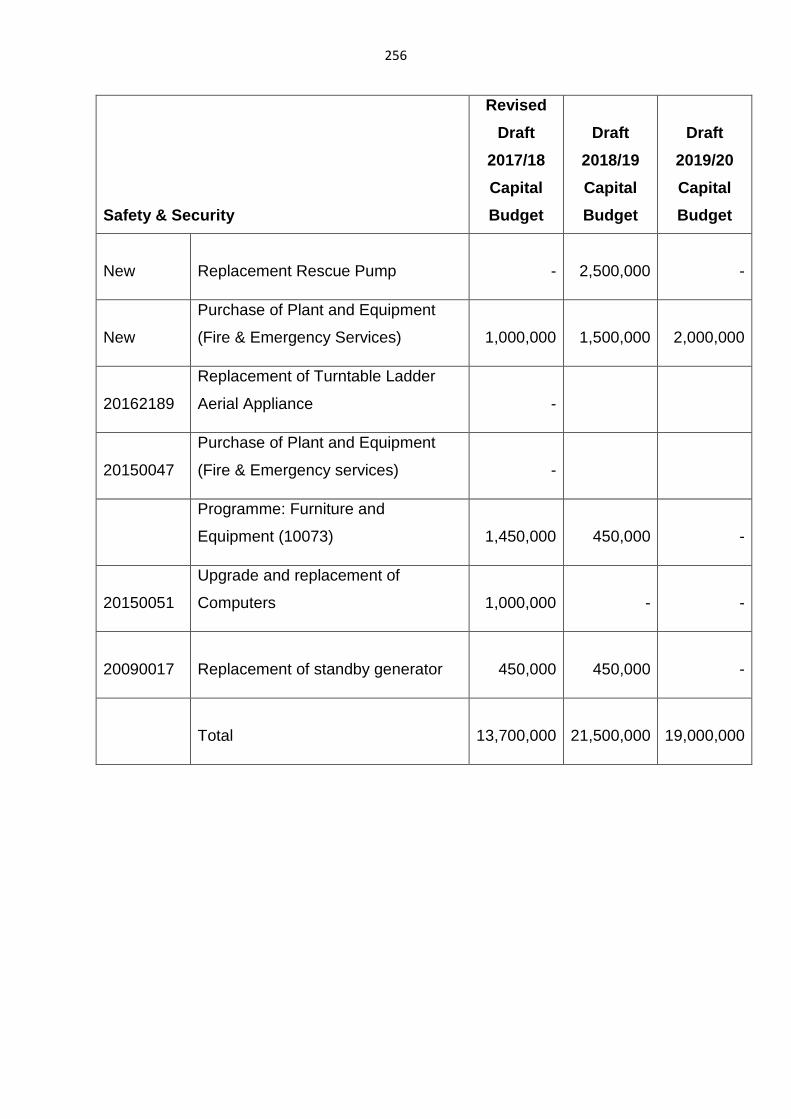
256
Safety & Security
Revised
Draft
2017/18
Capital
Budget
Draft
2018/19
Capital
Budget
Draft
2019/20
Capital
Budget
New Replacement Rescue Pump
-
2,500,000
-
New
Purchase of Plant and Equipment
(Fire & Emergency Services)
1,000,000
1,500,000
2,000,000
20162189
Replacement of Turntable Ladder
Aerial Appliance
-
20150047
Purchase of Plant and Equipment
(Fire & Emergency services)
-
Programme: Furniture and
Equipment (10073)
1,450,000
450,000
-
20150051
Upgrade and replacement of
Computers
1,000,000
-
-
20090017 Replacement of standby generator
450,000
450,000
-
Total
13,700,000
21,500,000
19,000,000
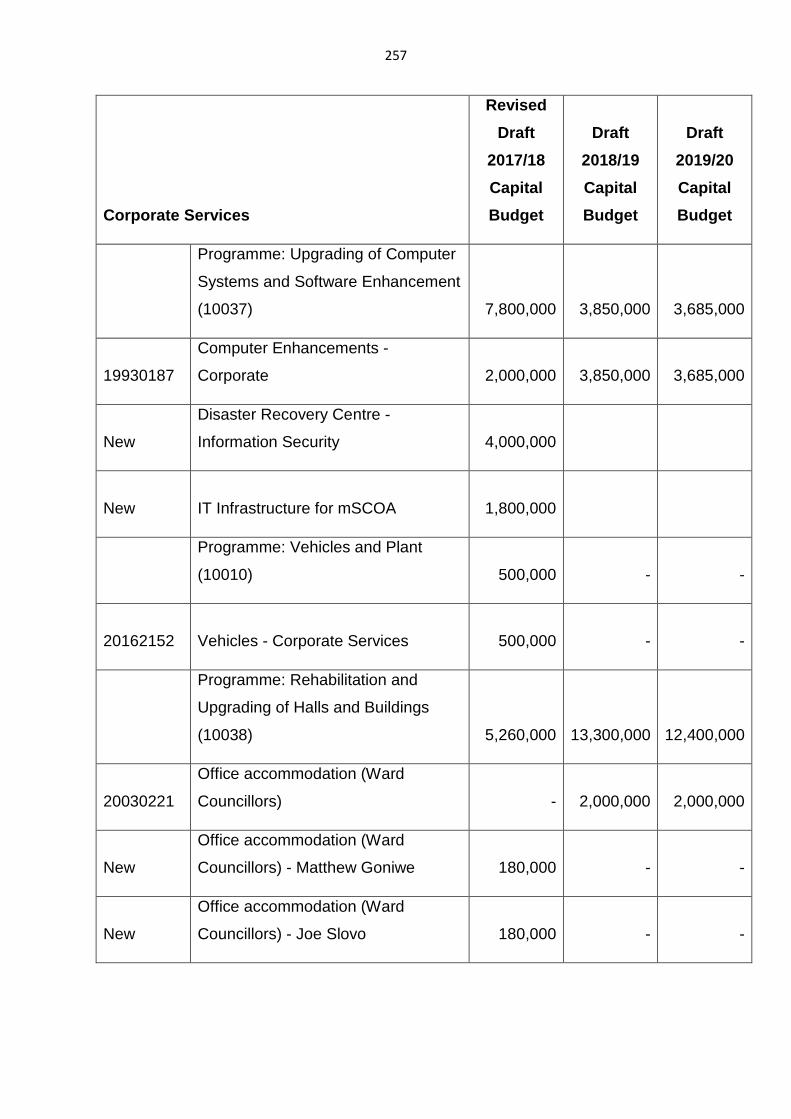
257
Corporate Services
Revised
Draft
2017/18
Capital
Budget
Draft
2018/19
Capital
Budget
Draft
2019/20
Capital
Budget
Programme: Upgrading of Computer
Systems and Software Enhancement
(10037)
7,800,000
3,850,000
3,685,000
19930187
Computer Enhancements -
Corporate
2,000,000
3,850,000
3,685,000
New
Disaster Recovery Centre -
Information Security
4,000,000
New IT Infrastructure for mSCOA
1,800,000
Programme: Vehicles and Plant
(10010)
500,000
-
-
20162152 Vehicles - Corporate Services
500,000
-
-
Programme: Rehabilitation and
Upgrading of Halls and Buildings
(10038)
5,260,000
13,300,000
12,400,000
20030221
Office accommodation (Ward
Councillors)
-
2,000,000
2,000,000
New
Office accommodation (Ward
Councillors) - Matthew Goniwe
180,000
-
-
New
Office accommodation (Ward
Councillors) - Joe Slovo
180,000
-
-
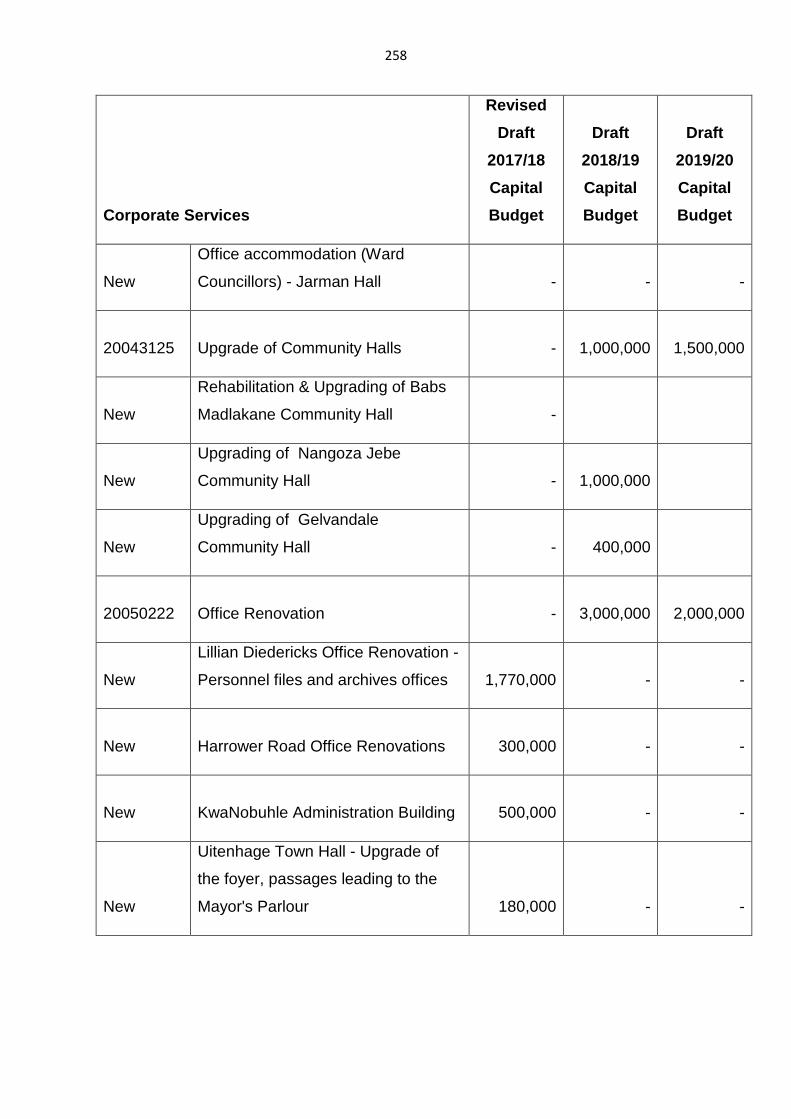
258
Corporate Services
Revised
Draft
2017/18
Capital
Budget
Draft
2018/19
Capital
Budget
Draft
2019/20
Capital
Budget
New
Office accommodation (Ward
Councillors) - Jarman Hall
-
-
-
20043125 Upgrade of Community Halls
-
1,000,000
1,500,000
New
Rehabilitation & Upgrading of Babs
Madlakane Community Hall
-
New
Upgrading of Nangoza Jebe
Community Hall
-
1,000,000
New
Upgrading of Gelvandale
Community Hall
-
400,000
20050222 Office Renovation
-
3,000,000
2,000,000
New
Lillian Diedericks Office Renovation -
Personnel files and archives offices
1,770,000
-
-
New Harrower Road Office Renovations
300,000
-
-
New KwaNobuhle Administration Building
500,000
-
-
New
Uitenhage Town Hall - Upgrade of
the foyer, passages leading to the
Mayor's Parlour
180,000
-
-
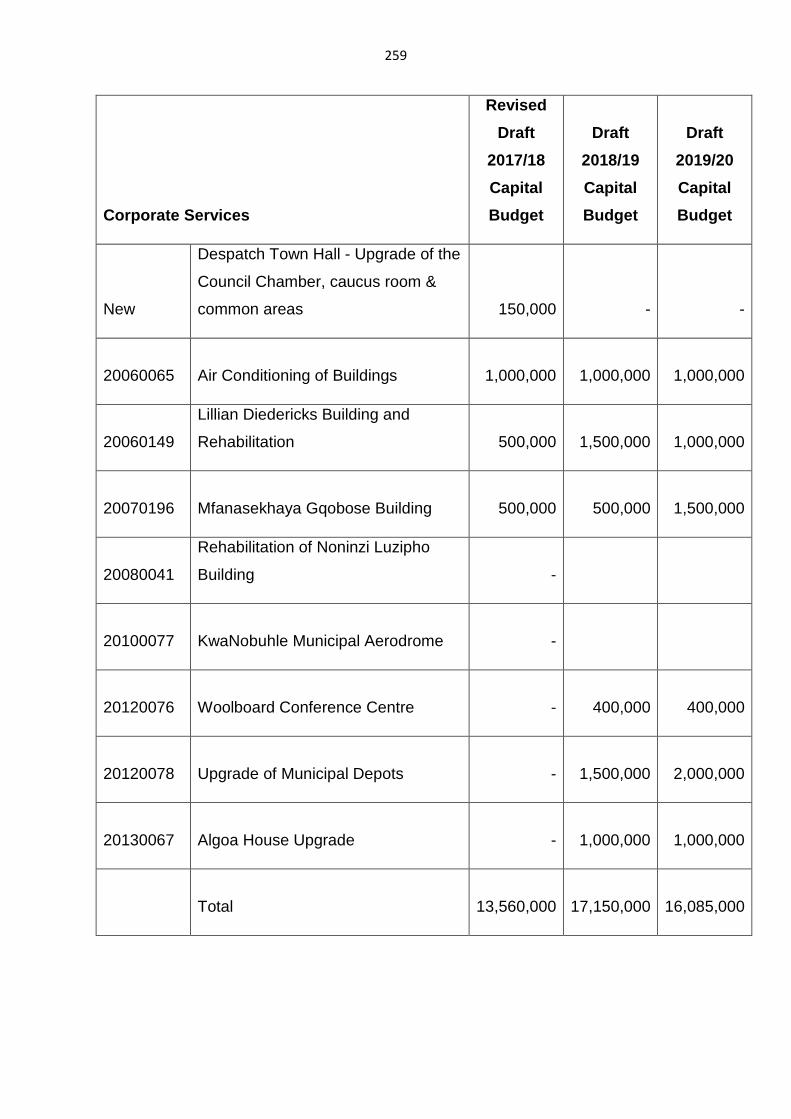
259
Corporate Services
Revised
Draft
2017/18
Capital
Budget
Draft
2018/19
Capital
Budget
Draft
2019/20
Capital
Budget
New
Despatch Town Hall - Upgrade of the
Council Chamber, caucus room &
common areas
150,000
-
-
20060065 Air Conditioning of Buildings
1,000,000
1,000,000
1,000,000
20060149
Lillian Diedericks Building and
Rehabilitation
500,000
1,500,000
1,000,000
20070196 Mfanasekhaya Gqobose Building
500,000
500,000
1,500,000
20080041
Rehabilitation of Noninzi Luzipho
Building
-
20100077 KwaNobuhle Municipal Aerodrome
-
20120076 Woolboard Conference Centre
-
400,000
400,000
20120078 Upgrade of Municipal Depots
-
1,500,000
2,000,000
20130067 Algoa House Upgrade
-
1,000,000
1,000,000
Total
13,560,000
17,150,000
16,085,000
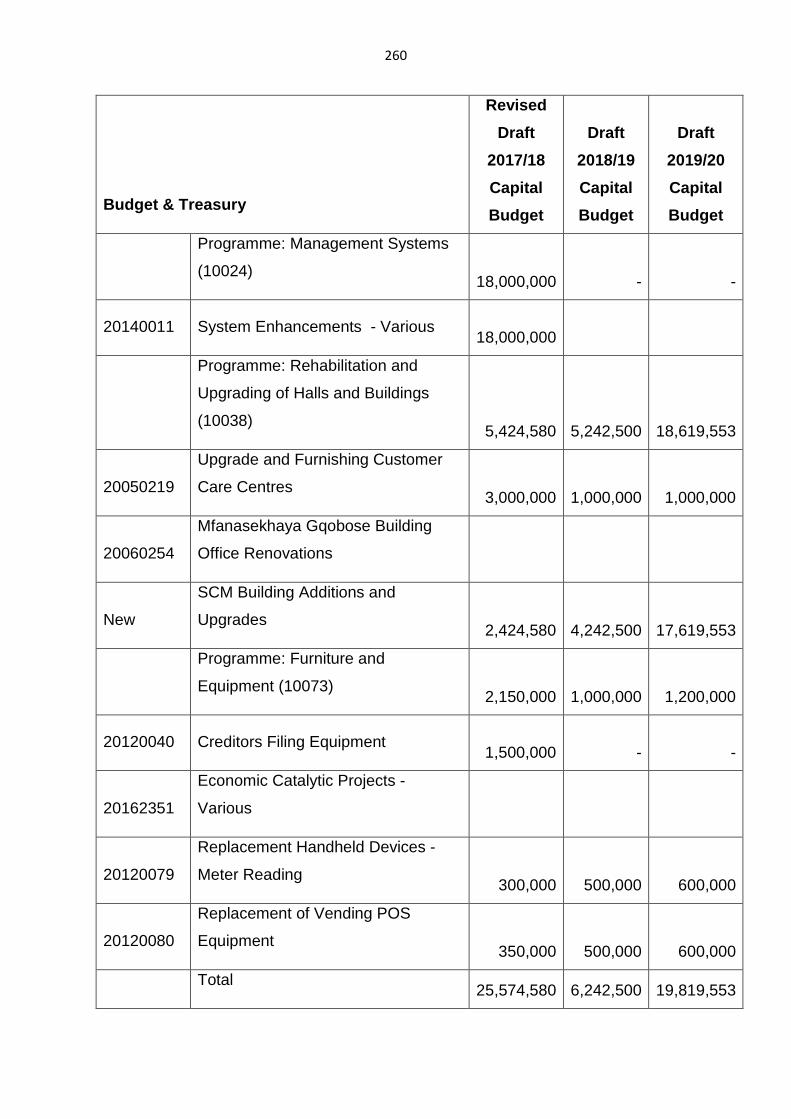
260
Budget & Treasury
Revised
Draft
2017/18
Capital
Budget
Draft
2018/19
Capital
Budget
Draft
2019/20
Capital
Budget
Programme: Management Systems
(10024)
18,000,000
-
-
20140011 System Enhancements - Various
18,000,000
Programme: Rehabilitation and
Upgrading of Halls and Buildings
(10038)
5,424,580
5,242,500
18,619,553
20050219
Upgrade and Furnishing Customer
Care Centres
3,000,000
1,000,000
1,000,000
20060254
Mfanasekhaya Gqobose Building
Office Renovations
New
SCM Building Additions and
Upgrades
2,424,580
4,242,500
17,619,553
Programme: Furniture and
Equipment (10073)
2,150,000
1,000,000
1,200,000
20120040 Creditors Filing Equipment
1,500,000
-
-
20162351
Economic Catalytic Projects -
Various
20120079
Replacement Handheld Devices -
Meter Reading
300,000
500,000
600,000
20120080
Replacement of Vending POS
Equipment
350,000
500,000
600,000
Total 25,574,580 6,242,500 19,819,553
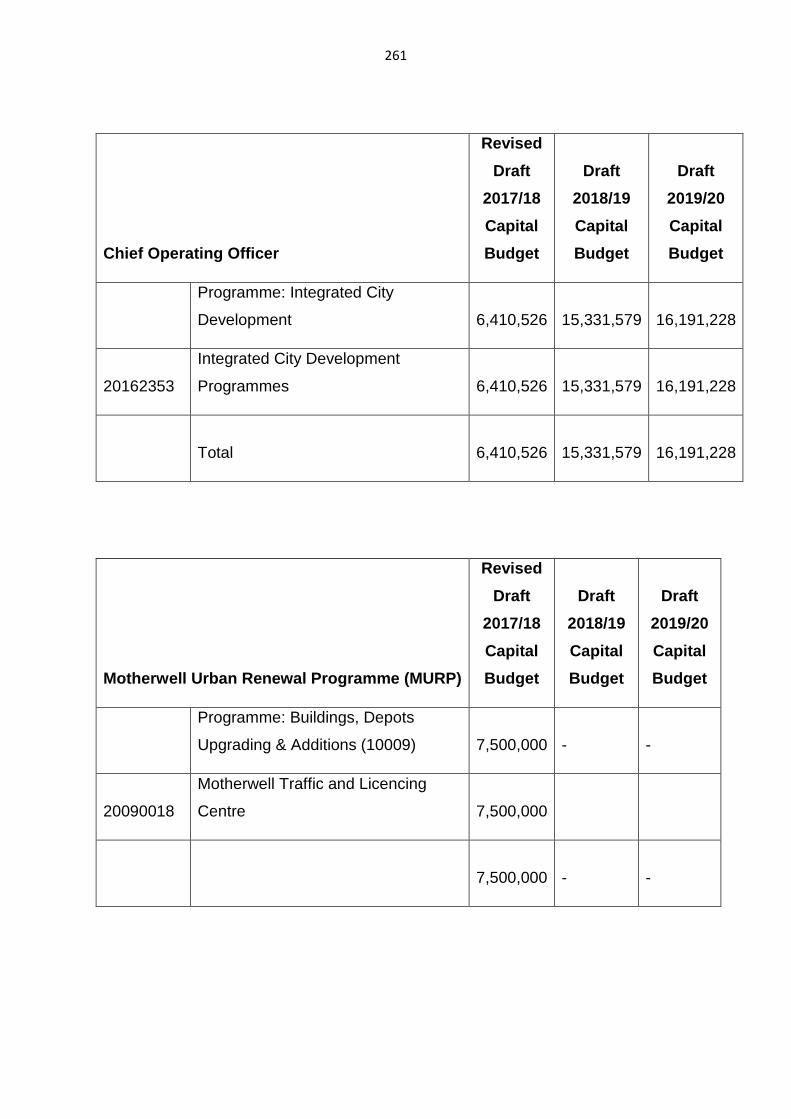
261
Chief Operating Officer
Revised
Draft
2017/18
Capital
Budget
Draft
2018/19
Capital
Budget
Draft
2019/20
Capital
Budget
Programme: Integrated City
Development
6,410,526
15,331,579
16,191,228
20162353
Integrated City Development
Programmes
6,410,526
15,331,579
16,191,228
Total
6,410,526
15,331,579
16,191,228
Motherwell Urban Renewal Programme (MURP)
Revised
Draft
2017/18
Capital
Budget
Draft
2018/19
Capital
Budget
Draft
2019/20
Capital
Budget
Programme: Buildings, Depots
Upgrading & Additions (10009)
7,500,000
-
-
20090018
Motherwell Traffic and Licencing
Centre
7,500,000
7,500,000
-
-
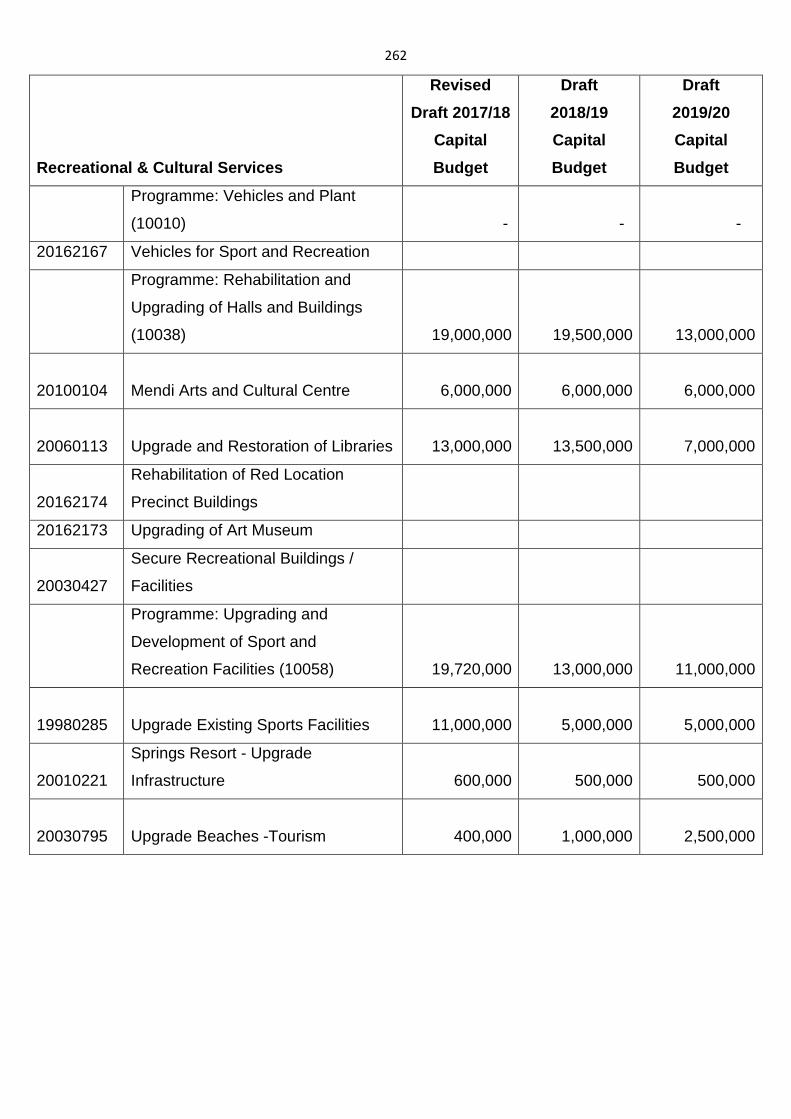
262
Recreational & Cultural Services
Revised
Draft 2017/18
Capital
Budget
Draft
2018/19
Capital
Budget
Draft
2019/20
Capital
Budget
Programme: Vehicles and Plant
(10010) - - -
20162167 Vehicles for Sport and Recreation
Programme: Rehabilitation and
Upgrading of Halls and Buildings
(10038)
19,000,000
19,500,000
13,000,000
20100104 Mendi Arts and Cultural Centre
6,000,000
6,000,000
6,000,000
20060113 Upgrade and Restoration of Libraries
13,000,000
13,500,000
7,000,000
20162174
Rehabilitation of Red Location
Precinct Buildings
20162173 Upgrading of Art Museum
20030427
Secure Recreational Buildings /
Facilities
Programme: Upgrading and
Development of Sport and
Recreation Facilities (10058)
19,720,000
13,000,000
11,000,000
19980285 Upgrade Existing Sports Facilities
11,000,000
5,000,000
5,000,000
20010221
Springs Resort - Upgrade
Infrastructure
600,000
500,000
500,000
20030795 Upgrade Beaches -Tourism
400,000
1,000,000
2,500,000
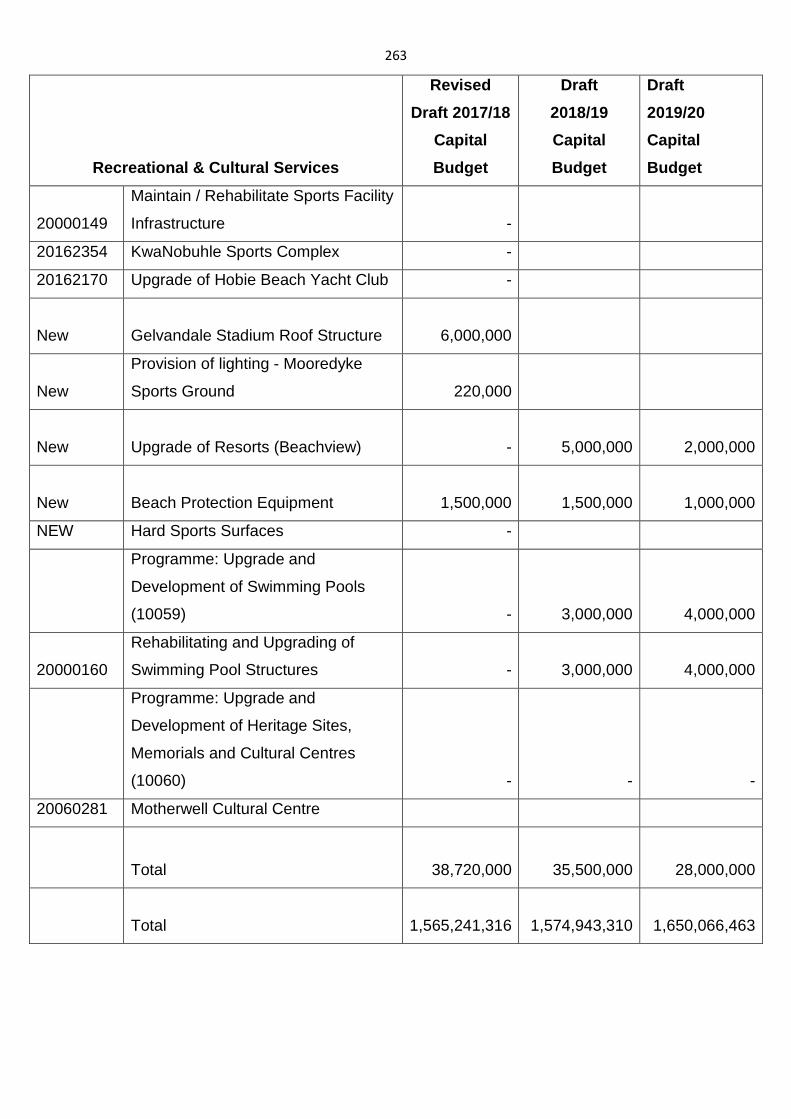
263
Recreational & Cultural Services
Revised
Draft 2017/18
Capital
Budget
Draft
2018/19
Capital
Budget
Draft
2019/20
Capital
Budget
20000149
Maintain / Rehabilitate Sports Facility
Infrastructure -
20162354 KwaNobuhle Sports Complex -
20162170 Upgrade of Hobie Beach Yacht Club -
New Gelvandale Stadium Roof Structure
6,000,000
New
Provision of lighting - Mooredyke
Sports Ground
220,000
New Upgrade of Resorts (Beachview) -
5,000,000
2,000,000
New Beach Protection Equipment
1,500,000
1,500,000
1,000,000
NEW Hard Sports Surfaces -
Programme: Upgrade and
Development of Swimming Pools
(10059) -
3,000,000
4,000,000
20000160
Rehabilitating and Upgrading of
Swimming Pool Structures -
3,000,000
4,000,000
Programme: Upgrade and
Development of Heritage Sites,
Memorials and Cultural Centres
(10060) - - -
20060281 Motherwell Cultural Centre
Total
38,720,000
35,500,000
28,000,000
Total
1,565,241,316 1,574,943,310 1,650,066,463
264
7.2 FINANCIAL SUSTAINABILITY AND VIABILITY
7.2.1 INTRODUCTION
The institution must ensure that it becomes financially sustainable in order to deliver
on its objectives in terms of the IDP. The Budget and Treasury Directorate operates
within the parameters determined by the Municipal Financial Management Act
(MFMA) (56 of 2003), together with the applicable Regulations, and it is the
responsibility of this Directorate to ensure compliance across the institution. The
Directorate provides financial related services and support to all Council structures
and other municipal directorates and strives to ensure a well-run city.
Over the last number of years, the Municipality has experienced a significant decrease
in its collection rate, which in turn has led to a marked increase in the outstanding debt
owed to the institution. As a direct result of the aforesaid, the institution has over recent
years been unable to maintain cost coverage of three months, as required by National
Treasury. During the 2016/17 financial year, the institution has seen a marked
improvement in the collection rate as Council enforced strict adherence to the NMB
Credit Control Policy and launched a vigorous debt collection campaign.
The Municipality has now stabilised its finances and significantly improved its cash
holdings. The Budget and Treasury team will continue to strive to improve the financial
position of the institution by focusing on five core principles:
• Collection of all outstanding debt from those that can afford to pay for their
municipal services.
• Optimising operational efficiency within the institution in order to maximise
service delivery spending.
• Reforming Supply Chain processes within the institution in order to ensure
that said processes do not only become far more transparent, but also far
less cumbersome than in the past.
265
• Measures will also be put in place to ensure that Council receives value for
money through all of its tenders.
• Refining the Assistance to the Poor (ATTP) Policy in terms of which indigent
families qualify for a free basket of municipal services, so as to ensure that
the application process is as uncomplicated and efficient as possible.
Free Basic Services (FBS) - Indigent
The Municipality has an approved Indigent Policy referred to as the Assistance to the
Poor (ATTP) Policy, which is reviewed on an annual basis. This Policy does not
provide for a committee system which considers and approves Indigent applications,
as the qualifying criteria, as stipulated in the policy, is contained in the on-line Indigent
System where applications are captured and assessed after a site visit is completed
and authorised. The Indigent Section has a dedicated team of 39 staff members who
assist with the completion of application forms and attend to the on-site verification of
households who apply for subsidy.
The schedules below indicate the cost of FBS for the past two (2) financial years.
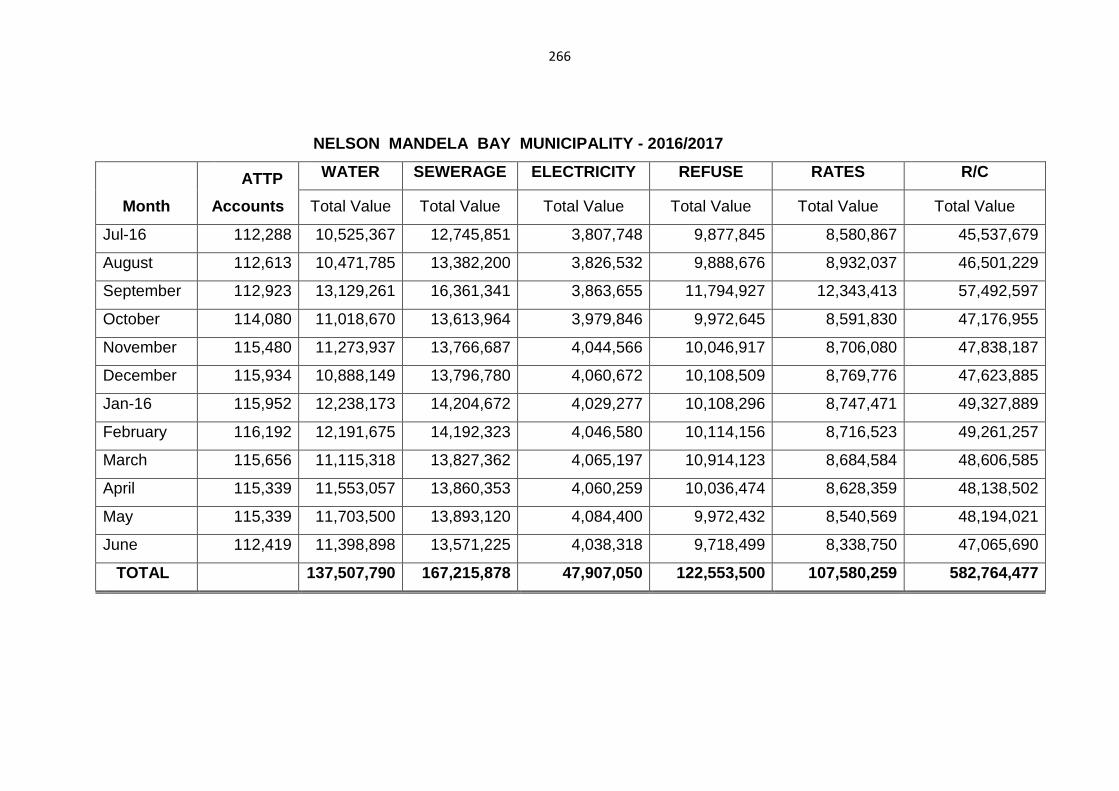
266
NELSON MANDELA BAY MUNICIPALITY - 2016/2017
Month
ATTP
Accounts
WATER SEWERAGE ELECTRICITY REFUSE RATES R/C
Total Value Total Value Total Value Total Value Total Value Total Value
Jul-16 112,288 10,525,367 12,745,851 3,807,748 9,877,845 8,580,867 45,537,679
August 112,613 10,471,785 13,382,200 3,826,532 9,888,676 8,932,037 46,501,229
September 112,923 13,129,261 16,361,341 3,863,655 11,794,927 12,343,413 57,492,597
October 114,080 11,018,670 13,613,964 3,979,846 9,972,645 8,591,830 47,176,955
November 115,480 11,273,937 13,766,687 4,044,566 10,046,917 8,706,080 47,838,187
December 115,934 10,888,149 13,796,780 4,060,672 10,108,509 8,769,776 47,623,885
Jan-16 115,952 12,238,173 14,204,672 4,029,277 10,108,296 8,747,471 49,327,889
February 116,192 12,191,675 14,192,323 4,046,580 10,114,156 8,716,523 49,261,257
March 115,656 11,115,318 13,827,362 4,065,197 10,914,123 8,684,584 48,606,585
April 115,339 11,553,057 13,860,353 4,060,259 10,036,474 8,628,359 48,138,502
May 115,339 11,703,500 13,893,120 4,084,400 9,972,432 8,540,569 48,194,021
June 112,419 11,398,898 13,571,225 4,038,318 9,718,499 8,338,750 47,065,690
TOTAL 137,507,790 167,215,878 47,907,050 122,553,500 107,580,259 582,764,477
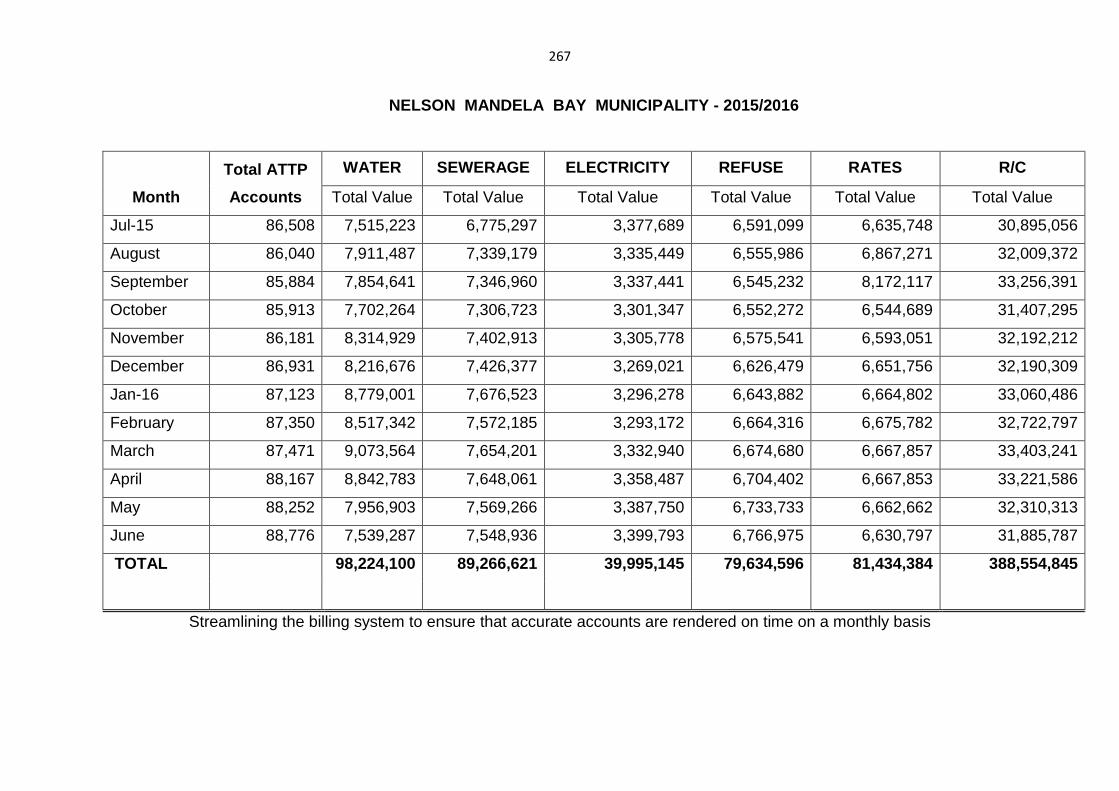
267
NELSON MANDELA BAY MUNICIPALITY - 2015/2016
Month
Total ATTP
Accounts
WATER SEWERAGE ELECTRICITY REFUSE RATES R/C
Total Value Total Value Total Value Total Value Total Value Total Value
Jul-15 86,508 7,515,223 6,775,297 3,377,689 6,591,099 6,635,748 30,895,056
August 86,040 7,911,487 7,339,179 3,335,449 6,555,986 6,867,271 32,009,372
September 85,884 7,854,641 7,346,960 3,337,441 6,545,232 8,172,117 33,256,391
October 85,913 7,702,264 7,306,723 3,301,347 6,552,272 6,544,689 31,407,295
November 86,181 8,314,929 7,402,913 3,305,778 6,575,541 6,593,051 32,192,212
December 86,931 8,216,676 7,426,377 3,269,021 6,626,479 6,651,756 32,190,309
Jan-16 87,123 8,779,001 7,676,523 3,296,278 6,643,882 6,664,802 33,060,486
February 87,350 8,517,342 7,572,185 3,293,172 6,664,316 6,675,782 32,722,797
March 87,471 9,073,564 7,654,201 3,332,940 6,674,680 6,667,857 33,403,241
April 88,167 8,842,783 7,648,061 3,358,487 6,704,402 6,667,853 33,221,586
May 88,252 7,956,903 7,569,266 3,387,750 6,733,733 6,662,662 32,310,313
June 88,776 7,539,287 7,548,936 3,399,793 6,766,975 6,630,797 31,885,787
TOTAL 98,224,100 89,266,621 39,995,145 79,634,596 81,434,384 388,554,845
Streamlining the billing system to ensure that accurate accounts are rendered on time on a monthly basis
268
7.2.2 Delivery Approach
In terms of the Municipal Systems Act of 2000, Financial Sustainability is defined as
follows:
“in relation to the provision of a municipal service, means the provision of a municipal
service in a manner aimed at ensuring that the financing of that service from internal
and external resource, including budgeted income, grants and subsidies for that
service, is sufficient to cover the costs of:
The initial capital expenditure required for the service;
Operating the service; and
Maintaining, repairing and replacing the physical assets used in the provision of the
service”.
The Municipality experienced a serious cash-flow crisis during the 2010/11 financial
year. The recovery at the time was guided by a comprehensive Financial Recovery
Plan, aimed at placing the institution in a sound and sustainable financial position,
thereby ensuring its ability to meet its obligations.
Proper, adequate and regular financial management oversight is therefore crucial to
ensure this ongoing financial sustainability. This can be achieved through the effective
implementation of financial policies and procedures, not only within the Directorate
itself, but throughout the institution.
269
In addition to the above, the Budget and Treasury Directorate must:
• address the weaknesses identified in the SWOT analysis;
• give attention to the opportunities that have been documented;
• build on the strengths of the Directorate; and
• develop strategies to mitigate the risks identified, where possible.
In dealing with the above, priority and emphasis must be given to the following:
• Increased debt collection and credit control measures;
• revenue optimisation;
• operational efficiency and cost containment measures;
• proper procurement planning by all directorates; and
• ensuring value for money during the procurement process;
• proper tariff modelling;
• ensuring a cost coverage ratio of three months;
• the development of a Long-term Financial Plan.
In addition, the NMBM is in the process of developing a policy governing the Long-
term Financial Plan of the Municipality. This will serve as a guiding document for the
institution and contribute towards the establishment of a well-run and forward-thinking
city.
7.2.3 Long-Term Financial Sustainability Plan (LTFS P)
Long-term financial planning forms a key element of the Integrated Development Plan
(IDP), which enables local government to set priorities aligned to achieving the
strategic objectives of Council. The Long-term Financial Sustainability Plan (LTFSP)
must be constructed over a minimum period of 10 years and will be instrumental in
270
indicating the financial sustainability of the Nelson Mandela’s Bay Municipality over
the short, medium and long term.
The LTFSP is underpinned by a number of financial strategies, assumptions and
performance indicators, which will enable Council to make informed decisions to
ensure financial sustainability, while at the same time meeting the increasing service
delivery demands of local communities with the limited available resources.
Council has a legislative requirement to comply with the principles of sound financial
management, as detailed in the Municipal Finance Management Act No. 56 of 2003
(MFMA). National Treasury has played a pivotal role in the introduction of financial
management reforms across government since 1994, and local government since
1996. National Treasury’s primary objective was to secure the sound and sustainable
management of the financial affairs of government (national, provincial and local) and
to lead such reforms through policies, guidelines, regulatory interventions, circulars,
training etc., as well as provide hands-on support to municipalities.
The MFMA further aims to modernise budget, accounting and financial management
practices by placing local government finances on a sustainable footing in order to
maximise the capacity of municipalities to deliver services across communities. It also
aims to put in place a sound financial framework by clarifying and separating the roles
and responsibilities of the Council, Mayor and officials.
The NMBM is committed to work with National Treasury, as a pilot project, to develop
a long-term financial planning model as a basis for its Long-term Financial
Strategy/Plan. Extensive work has been done on the model, which is currently being
amended to comply with the SCOA accounting reforms.
A key component of sound financial management is the preparation of longer-term
financial strategies, plans and budgets. When preparing an LTFSP, a municipality
must take the following into consideration:
271
• Capital and Operating Budgets
• Master plans and Backlog reports – Asset Management
• Consumption levels/units
• Losses and unaccounted for units
• Revenue streams
• Financial or other risks that may impact on financial sustainability
• Staffing levels
A policy governing the Long-term Financial Management Plan has been developed
and is in the process of being submitted to Council. The Policy assists the institution
in dealing with long-term financial management matters, even though not exhaustive
or comprehensive, and also takes into account all other regulatory requirements.
Key Objectives of the Long-term Financial Sustainability Plan (LTSFP)
The key objectives of the LTFSP are to ensure the financial sustainability of the NMBM
and therefore:
• The ability of the Municipality to meet its current and future service delivery
obligations and financial requirements, and
• The ability of the Municipality to retain sufficient financial capacity to be able to
manage and absorb future financial risks without external assistance or having
to significantly adjust revenue or expenditure.
• This implies that the Municipality must maintain a strong cash position, whilst
simultaneously developing its capacity to expand and meet the increasing
needs of the communities. Key performance indicators (KPIs) that have been
identified, will assist in ensuring that:
• the NMBM maintains a strong cash position;
• service delivery is maintained;
272
• there is adequate capital spending – new and renewal;
• there is adequate spending on repairs and maintenance;
• the working capital levels are sufficient;
• the debt levels are minimised (reduced) and affordable;
• revenue streams are expanded and maximised.
7.2.4 Financial Plan
Section 26 (h) of the Local Government: Municipal Systems Act, as amended,
stipulates that a financial plan must be prepared as part of the Municipality’s Integrated
Development Plan.
Over recent years, financial sustainability in local government has become
increasingly difficult to maintain, as the demand for services expands beyond the
available revenue streams. Municipalities need to be proactive in minimising costs and
maximising operational efficiencies in order to meet these demands. In July 2010, the
NMBM was faced with serious cash and sustainability challenges as a result of the
absence of robust long-term financial planning.
The Five-year Financial Plan includes an Operating Budget and Capital Budget, both
informed by IDP priorities. It takes into account the Key Performance Areas reflected
in the IDP. All programmes contained in the Budget are reflected in the IDP. The
review of the Municipality’s IDP therefore has a ripple effect on the Budget.
In addition to being informed by the IDP, the municipal fiscal environment is influenced
by a variety of macro-economic measures. National Treasury determines the ceiling
of year-on-year increases in the total Operating Budget, whilst the National Energy
Regulator of SA (NERSA) regulates electricity tariff increases. Various government
departments also affect municipal service delivery through the level of grants and
subsidies.
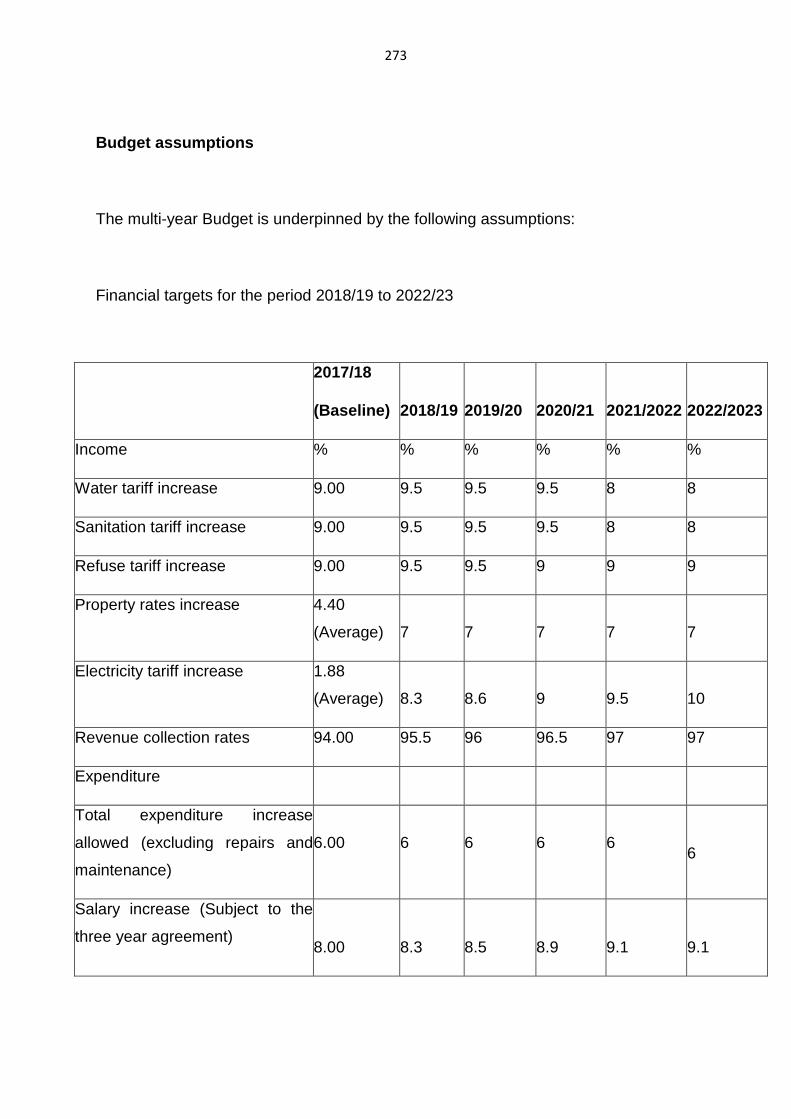
273
Budget assumptions
The multi-year Budget is underpinned by the following assumptions:
Financial targets for the period 2018/19 to 2022/23
2017/18
(Baseline) 2018/19 2019/20 2020/21 2021/2022
2022/2023
Income % % % % % %
Water tariff increase 9.00 9.5 9.5 9.5 8 8
Sanitation tariff increase 9.00 9.5 9.5 9.5 8 8
Refuse tariff increase 9.00 9.5 9.5 9 9 9
Property rates increase 4.40
(Average) 7 7 7 7 7
Electricity tariff increase 1.88
(Average) 8.3 8.6 9 9.5 10
Revenue collection rates 94.00 95.5 96 96.5 97 97
Expenditure
Total expenditure increase
allowed (excluding repairs and
maintenance)
6.00 6 6 6 6
6
Salary increase (Subject to the
three year agreement)
8.00 8.3 8.5 8.9 9.1 9.1
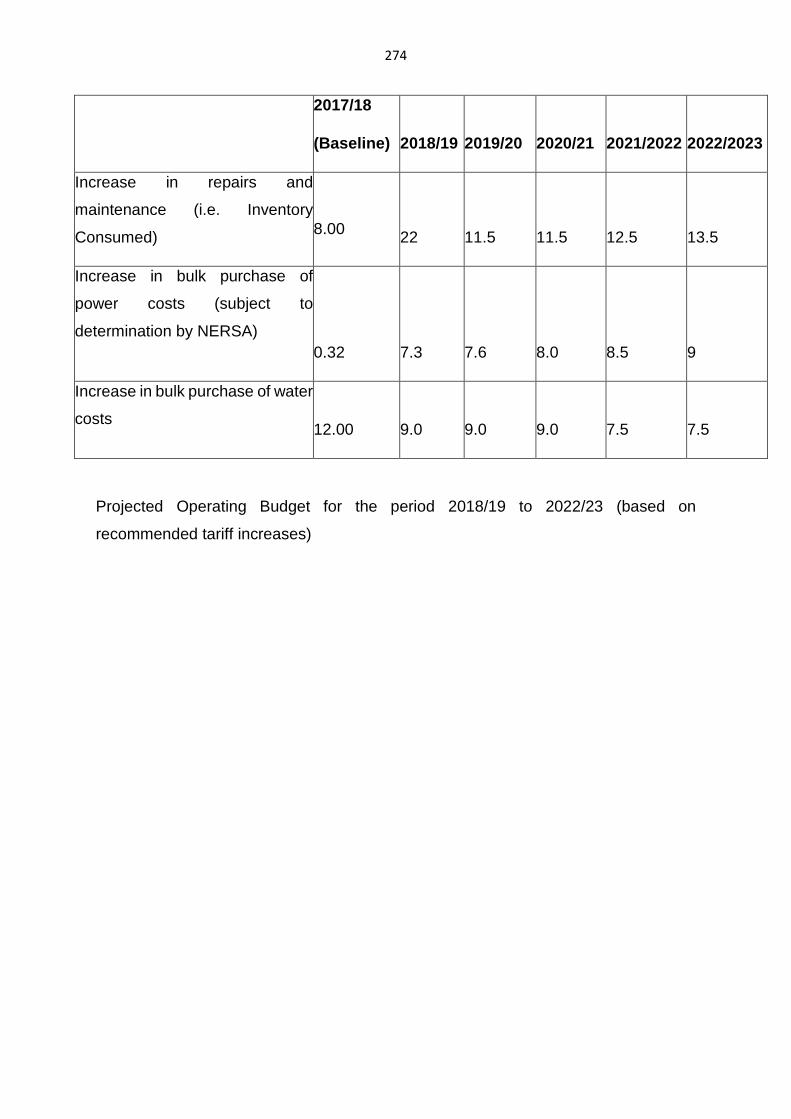
274
2017/18
(Baseline) 2018/19 2019/20 2020/21 2021/2022
2022/2023
Increase in repairs and
maintenance (i.e. Inventory
Consumed)
8.00 22 11.5 11.5 12.5 13.5
Increase in bulk purchase of
power costs (subject to
determination by NERSA)
0.32 7.3 7.6 8.0 8.5 9
Increase in bulk purchase of water
costs
12.00 9.0 9.0 9.0 7.5 7.5
Projected Operating Budget for the period 2018/19 to 2022/23 (based on
recommended tariff increases)
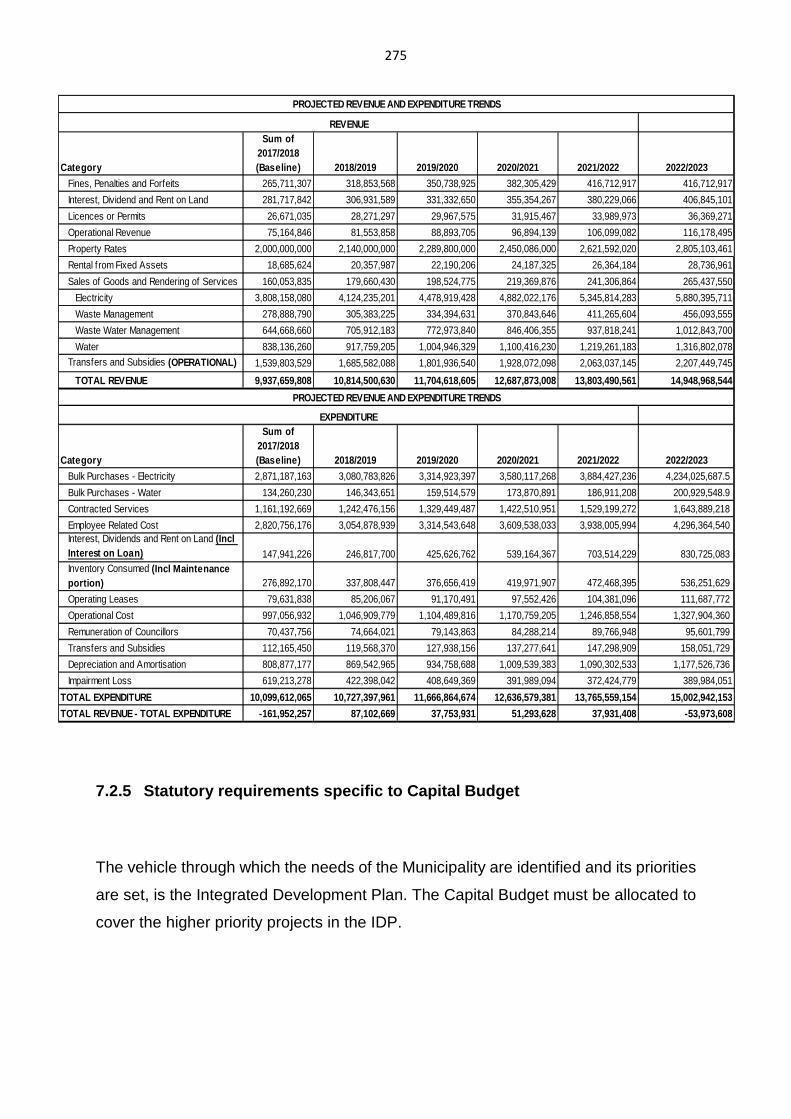
275
7.2.5 Statutory requirements specific to Capital Bu dget
The vehicle through which the needs of the Municipality are identified and its priorities
are set, is the Integrated Development Plan. The Capital Budget must be allocated to
cover the higher priority projects in the IDP.
Category
Sum of 2017/2018 (Baseline) 2018/2019 2019/2020 2020/2021 2021/2022 2022/ 2023
Fines, Penalties and Forfeits 265,711,307 318,853,568 350,738,925 382,305,429 416,712,917 416,712,917
Interest, Dividend and Rent on Land 281,717,842 306,931,589 331,332,650 355,354,267 380,229,066 406,845,101
Licences or Permits 26,671,035 28,271,297 29,967,575 31,915,467 33,989,973 36,369,271
Operational Revenue 75,164,846 81,553,858 88,893,705 96,894,139 106,099,082 116,178,495
Property Rates 2,000,000,000 2,140,000,000 2,289,800,000 2,450,086,000 2,621,592,020 2,805,103,461
Rental from Fixed Assets 18,685,624 20,357,987 22,190,206 24,187,325 26,364,184 28,736,961
Sales of Goods and Rendering of Services 160,053,835 179,660,430 198,524,775 219,369,876 241,306,864 265,437,550
Electricity 3,808,158,080 4,124,235,201 4,478,919,428 4,882,022,176 5,345,814,283 5,880,395,711
Waste Management 278,888,790 305,383,225 334,394,631 370,843,646 411,265,604 456,093,555
Waste Water Management 644,668,660 705,912,183 772,973,840 846,406,355 937,818,241 1,012,843,700
Water 838,136,260 917,759,205 1,004,946,329 1,100,416,230 1,219,261,183 1,316,802,078
Transfers and Subsidies (OPERATIONAL) 1,539,803,529 1,685,582,088 1,801,936,540 1,928,072,098 2,063,037,145 2,207,449,745
TOTAL REVENUE 9,937,659,808 10,814,500,630 11,704,618,605 12,687,873,008 13,803,490,561 14,948,968,544
Category
Sum of 2017/2018 (Baseline) 2018/2019 2019/2020 2020/2021 2021/2022 2022/ 2023
Bulk Purchases - Electricity 2,871,187,163 3,080,783,826 3,314,923,397 3,580,117,268 3,884,427,236 4,234,025,687.5
Bulk Purchases - Water 134,260,230 146,343,651 159,514,579 173,870,891 186,911,208 200,929,548.9
Contracted Services 1,161,192,669 1,242,476,156 1,329,449,487 1,422,510,951 1,529,199,272 1,643,889,218
Employee Related Cost 2,820,756,176 3,054,878,939 3,314,543,648 3,609,538,033 3,938,005,994 4,296,364,540 Interest, Dividends and Rent on Land (Incl Interest on Loan) 147,941,226 246,817,700 425,626,762 539,164,367 703,514,229 830,725,083 Inventory Consumed (Incl Maintenance portion) 276,892,170 337,808,447 376,656,419 419,971,907 472,468,395 536,251,629
Operating Leases 79,631,838 85,206,067 91,170,491 97,552,426 104,381,096 111,687,772
Operational Cost 997,056,932 1,046,909,779 1,104,489,816 1,170,759,205 1,246,858,554 1,327,904,360
Remuneration of Councillors 70,437,756 74,664,021 79,143,863 84,288,214 89,766,948 95,601,799
Transfers and Subsidies 112,165,450 119,568,370 127,938,156 137,277,641 147,298,909 158,051,729
Depreciation and Amortisation 808,877,177 869,542,965 934,758,688 1,009,539,383 1,090,302,533 1,177,526,736
Impairment Loss 619,213,278 422,398,042 408,649,369 391,989,094 372,424,779 389,984,051
TOTAL EXPENDITURE 10,099,612,065 10,727,397,961 11,666,864,674 12,636,579,381 13,765,559,154 15,002,942,153
TOTAL REVENUE - TOTAL EXPENDITURE -161,952,257 87,102 ,669 37,753,931 51,293,628 37,931,408 -53,973,608
REVENUE
EXPENDITURE
PROJECTED REVENUE AND EXPENDITURE TRENDS
PROJECTED REVENUE AND EXPENDITURE TRENDS
276
The Municipal Finance Management Act (Act No. 56, 2003) states that:
“19.1 A Municipality may spend money on a capital project only if-: -
• the money for the project, excluding the cost of feasibility studies conducted by
or on behalf of the Municipality, has been appropriated in the capital budget;
• the project, including the total cost, has been approved by the council;
• the sources of funding have been considered, are available and have not been
committed for other purposes.
19.2 Before approving a capital project in terms of Section 19 (1) (b), the council of
a municipality must consider-
the project cost covering all financial years until the project is operational; and
the future operational costs and revenue on the project, including municipal tax and
tariff implications.”
Furthermore, the Financial Standing Orders state that
“1.5 Every Director shall, in respect of the activities of the Directorate, in consultation
with the Executive Director: Budget and Treasury, prepare: -
a draft Capital Budget in respect of the ensuing financial year and a draft Capital
Programme for the following two financial years, based on the following principles:
Year Two of the current Capital Programme shall become the new Capital Budget and
Year Three of the current Capital Programme shall become Year Two in the new
Capital Programme and New projects shall enter the Programme in Year Three.”
277
a) 7.2.6 Credit Rating
A credit rating is an evaluation of the credit risk of a prospective debtor, predicting its
ability to pay back the debt, and an implicit forecast of the likelihood of the debtor
defaulting.
On 28 November 2017 Moody’s Investors Services, an internationally recognised
credit ratings agency, placed the long-term global scale rating of the NMBM, together
with those of other Metro’s under review for downgrade. This followed the weakening
of the South African government’s credit profile. On 01 December 2017, Moody’s
Investor Services assigned a Baa3/Aa1.za national scale issuer rating to the NMBM
which takes into account the NMBM’s solid financial performance and low debt.
External loan funding is currently being considered for the next five-year period; this
will, however, need to be structured in a sustainable manner without having a negative
impact on the Municipality’s credit rating going forward.
7.2.7 Policies / By-Laws
The Directorate is reliant on the following policies and by-laws to assist it in achieving
the respective IDP priorities:
• Financial Management Policy
• Revenue Enhancement Master Plan
• Assistance to the Poor Policy
• Cash Management and Investment Policy
• Tariffs Policy
• Creditors Payment Policy
278
• Asset Management and Disposal Policy (the Municipality has a Generally
Recognized Accounting Practices (GRAP) compliant asset register)
• Supply Chain Management Policy
• Rates Policy
• Long-term Funding Policy
• Funding and Reserves Policy
• Customer Care and Revenue Management By-laws
• Unauthorized, Irregular, Fruitless and Wasteful (UIF+W) Expenditure Policy
• Credit Control Policy
The Budget related policies are updated on an annual basis.
7.2.8 Property Valuation Rolls
The rating of property is implemented impartially, fairly, equitable and without bias,
and these principles also apply to the setting of criteria for exemptions, reductions and
rebates, contemplated in Section 15 of the Municipal Property Rating Act.
The rating of property will be implemented in a way that:
• is developmental oriented;
• supports sustainable local government by providing a stable and buoyant
revenue source within the discretionary control of the Municipality;
• supports local and socio-economic development;
• promotes simplicity, uniformity, certainty in the property rates assessment
process;
• gives due consideration to the need for a simple and practical process of billing
and collection of property rates;
• promotes sustainable land management, especially that which reduces the risk
from natural disasters; and
• achieves national and local environmental management objectives.
279
The NMBM has an updated Valuation Roll, which has been implemented. One
supplementary valuation is completed per financial year.
The NMBM has further implemented a General Valuation (GV) on 1 July 2017. The
relevant notice indicating that the valuation roll is open for public inspection and the
valuation roll is published on the municipal website in terms of section 49 of the
Municipal Property Rates Act, 2004. The next General Valuation will be implemented
on 1 July 2021, based on property valuations as at 1 July 2020. Ensuring that the
Valuation Roll is updated on a regular basis will achieve a sustainable rates base, in
order to generate income to provide quality services in a Well Run City.
Financial Reporting
The NMBM received a qualified audit report for the 2016/17 financial year. The
qualification was based on following:
The lack of adequate systems in place to identify and disclose all irregular expenditure
incurred during the year, as required by Section 125(2)(d)(i) of the MFMA.
Sufficient appropriate evidence could not be obtained for the retention of creditors
The municipality did not assess whether there were any indications that its
expectations about the useful lives of PPE had changed, as required by SA Standard
of GRAP 17.
An audit action plan is being developed to address the issues raised by the Auditor-
General, as with all previous audit reports. These action plans are monitored by the
Internal Audit Division.
In order to improve the audit outcomes of the 2016/17 financial year, an interim
financial statements (2016/17 financial year) Circular No. 1 of 2017 was submitted to
all directorates on 14 February 2017. The 2016/17 Annual Financial Statements were
280
presented to the Auditor-General on 31 August 2017, and the consolidated annual
financial statements were presented to the Auditor-General on 30 September 2017.
The municipality compiles and submits all the required legislated financial reports,
which includes, inter-alia, those reports required in terms of Sections 71, 52 (d) 72 and
121 of the MFMA.
7.2.9 Implementation of SCOA Regulations
The objective of the Standard Chart of Accounts (SCOA) Regulations is to provide for
a national standard for the uniform recording and classification of municipal budget
and financial information at a transactional level, by prescribing a standard chart of
accounts for municipalities that:
is aligned to the budget formats and accounting standards prescribed for
municipalities; and
enables uniform information sets to be recorded in terms of national norms and
standards across the whole of government, for the purpose of national policy
coordination and reporting, benchmarking and performance measurement in the local
government sphere.
The NMBM’s implementation of the SCOA Regulations on 01 July 2017 will align itself
to the Well Run City Pillar, upon its compliance to the SCOA assessment check that
will be undertaken by National Treasury.
In addition, National Treasury aims to improve the credibility and reliability of financial
data, as well as general business processes and applications.
On 20 June 2014, Council considered an item dealing with the Municipal Regulations
for the SCOA and resolved, inter alia:
That Council adopts the Municipal Regulations on the Standard Chart of Accounts, as
gazetted for implementation, effective 1 July 2017.
That the City Manager drafts an Implementation Plan to ensure the implementation of
the SCOA, effective 1 July 2017.
281
On 13 November 2014, the SCOA Implementation Plan was adopted by Council and
submitted to National Treasury on 14 November 2014.
The implementation of the SCOA will result in significant changes in the Municipality’s
business processes and will influence, amongst other things, the following:
• The Municipality’s accounting systems
• The preparation of budgets
• Reporting requirements
• Re-organization of cost centres
The above changes to business processes will ensure that the NMBM is aligned to its
six Pillars as follows:
The Well Run City : The implementation of the SCOA Regulations on 01 July 2017
will facilitate compliance with the Regulations, as well as pave the way for the NMBM’s
SCOA compliance assessment, to be conducted by the National Treasury. This will
further give credence to the NMBM’s aim of guaranteeing transparent budgeting;
transparent and efficient spending and performance monitoring. Furthermore, the re-
organisation of the NMBM’s cost centres closer to the Regulation’s Functional
Segment requirement will also support this Pillar.
The Opportunity City : This will be achieved as a result of implementing an accounting
system that aids efficiency; performance measurement; transparency and
benchmarking. The efficient use of public funds will result in further investor confidence
and more investment opportunities being identified within the NMBM.
The Safe City : This will be achieved through linking the NMBM’s budget to its IDP and
the Safety and Security Directorate’s SDBIP, as it relates to ensuring a safe city. In
addition, the reporting requirements will assist the benchmarking of the NMBM’s safety
and security processes and their outcomes to other government institutions.
282
The Inclusive City : This will be achieved by linking the NMBM’s Budget to its IDP and
the SDBIP of all its directorates as it relates to the outcomes of the public participation
sessions held with local communities. The reporting requirements will assist in
transparent reporting and benchmarking of the NMBM to the respective legislative
requirements on creating an all-inclusive society, e.g. the Constitution; the
Employment Equity Act; the Labour Relations Act; the Municipal Finance Management
Act; the Preferential Procurement Policy Framework Act; the Occupational Health and
Safety Act, etc.
The Caring City : This will be achieved through linking the prescribed budget
preparation processes to the Regulations, which will in turn facilitate the benchmarking
of the NMBM’s budget for social cohesion and social upliftment and their outcomes to
other government institutions.
The Forward Thinking City : The reporting requirements enabled by the SCOA
Regulations will assist the City in identifying economic, financial, technological and
social opportunities within the NMBM, as well as enable the implementation of these
opportunities. The Regulations will allow National Treasury to easily conduct
benchmarking exercises across all spheres of government and all municipalities,
which will allow the NMBM to identify and implement solutions that will conform to the
definition of “The Forward Thinking City” across its functional areas, such as energy
efficient service offerings; water-wise projects; sustainable socio-economic upliftment;
environmental awareness; cost-saving technologies, etc.
The benefits of implementing the SCOA include:
• Standardization of all municipal and the whole-of-government reporting, which
leads to a reduction in the Auditor-General’s interpretations of multiple charts
of accounts.
• Improved transparency and accountability, leading to a high level of service
delivery and contributing to a well-run municipality.
• Providing for evidence based financial management, leading to improved
municipal bench-marking, policy making and interventions.
283
• Bringing higher levels of cooperative government by enabling the submission
of credible, reliable and timely municipal information.
In order to meet the tight deadlines prescribed by National Treasury in respect of the
implementation of the SCOA, a service provider was appointed to provide and
implement a complete SCOA compliant Enterprise Resource Planning (ERP) System.
The benefits of an ERP System are:
• Web-based, which allows for dynamic access, e.g. via 3G or VPN sign-on.
• Real time online posting of financial transactions.
• Integration of planning and budgeting processes as a core feature (golden
thread).
• Seamless integration of the standard business processes of local government.
7.2.10 Revenue Enhancement and Improvement of Debt Recovery
The escalating arrear consumer debt of the NMBM has resulted in the institution
soliciting the services of an external party, a specialist in the field of debt collection
and revenue enhancement, to curb its escalating arrears and identify new revenue
streams. The service provider was appointed for a three-year period in December
2015, where-after the project commenced in terms of a staged approach.
The major work streams identified, are the following:
• Baseline diagnostics
• Data cleansing and analysis
• Command and control centre
• Field verification
• Debt management (focusing on debt older than 120 days), and
• Income and cost optimization
284
The project serves to strengthen and expand on the revenue base of the municipality.
The collection rate for the 2016/17 financial year is calculated at 94.3%. The collection
rate as at 31 December 2017 is calculated at 94.46%
Expenditure
Conditional Grants
The NMBM manages its conditional grants in terms of the DoRA requirements and
submits all required statutory reports in terms of the relevant requirements.
Remuneration
Councilor remuneration is determined annually in terms of the relevant Government
Notice issued by the Minister of COGTA in terms of the Remuneration of Public Office-
Bearers Act, 1998 (Act No 20 of 1998).
The upper limits of total remuneration packages payable to municipal managers and
managers directly accountable to municipal managers are determined and paid in
accordance with the annual government notice issued by the Minister of COGTA in
terms of Regulation 35 of the Local Government: Regulations on Appointment and
Conditions of Employment of Senior Managers as issued in terms of Government
Notice No 21 as published under Government Gazette No 37245 of 17 January 2014.
The overall increase in human resource costs as relevant to all other municipal
employees is determined in line with the relevant SALGBC agreement in this regard.
As at 30 September 2017 employee costs constituted 22.62% of the total operating
revenue.
Finance costs
All financing costs in terms of external loan funding agreements are serviced in terms
of the relevant approved funding agreements.
Payments to service providers
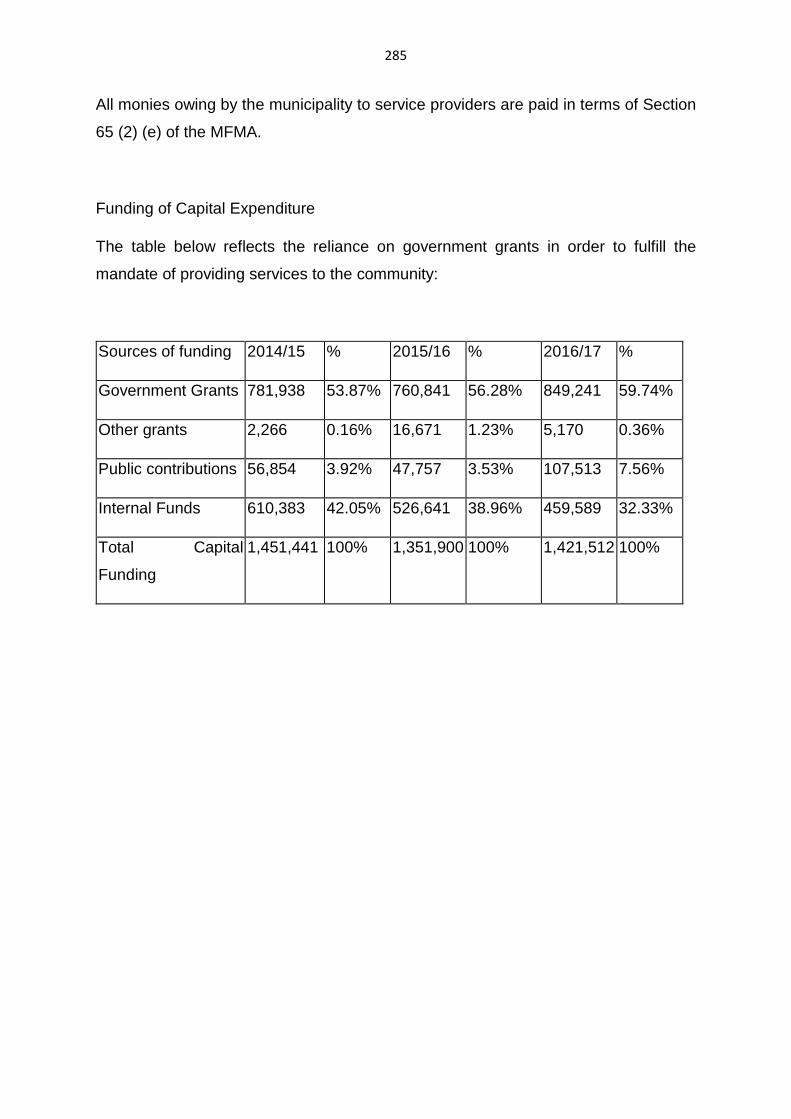
285
All monies owing by the municipality to service providers are paid in terms of Section
65 (2) (e) of the MFMA.
Funding of Capital Expenditure
The table below reflects the reliance on government grants in order to fulfill the
mandate of providing services to the community:
Sources of funding 2014/15 % 2015/16 % 2016/17 %
Government Grants 781,938 53.87% 760,841 56.28% 849,241 59.74%
Other grants 2,266 0.16% 16,671 1.23% 5,170 0.36%
Public contributions 56,854 3.92% 47,757 3.53% 107,513 7.56%
Internal Funds 610,383 42.05% 526,641 38.96% 459,589 32.33%
Total Capital
Funding
1,451,441 100% 1,351,900 100% 1,421,512 100%
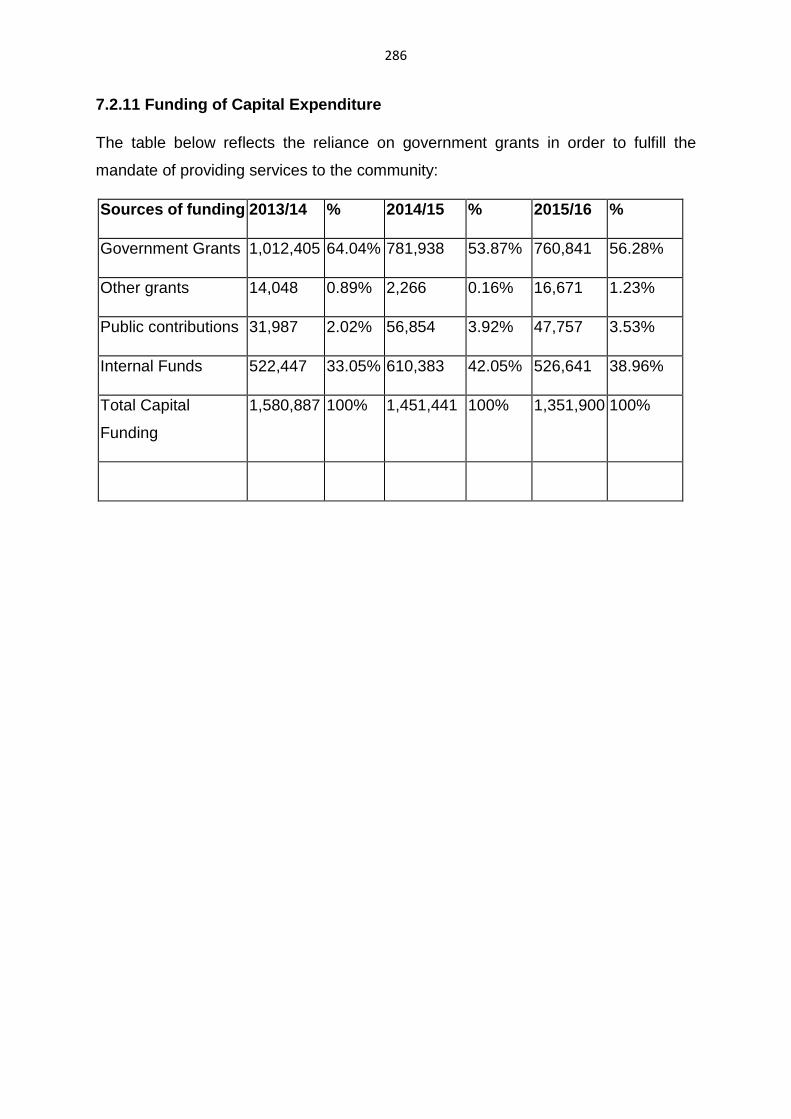
286
7.2.11 Funding of Capital Expenditure
The table below reflects the reliance on government grants in order to fulfill the
mandate of providing services to the community:
Sources of funding 2013/14 % 2014/15 % 2015/16 %
Government Grants 1,012,405 64.04% 781,938 53.87% 760,841 56.28%
Other grants 14,048 0.89% 2,266 0.16% 16,671 1.23%
Public contributions 31,987 2.02% 56,854 3.92% 47,757 3.53%
Internal Funds 522,447 33.05% 610,383 42.05% 526,641 38.96%
Total Capital
Funding
1,580,887 100% 1,451,441 100% 1,351,900 100%
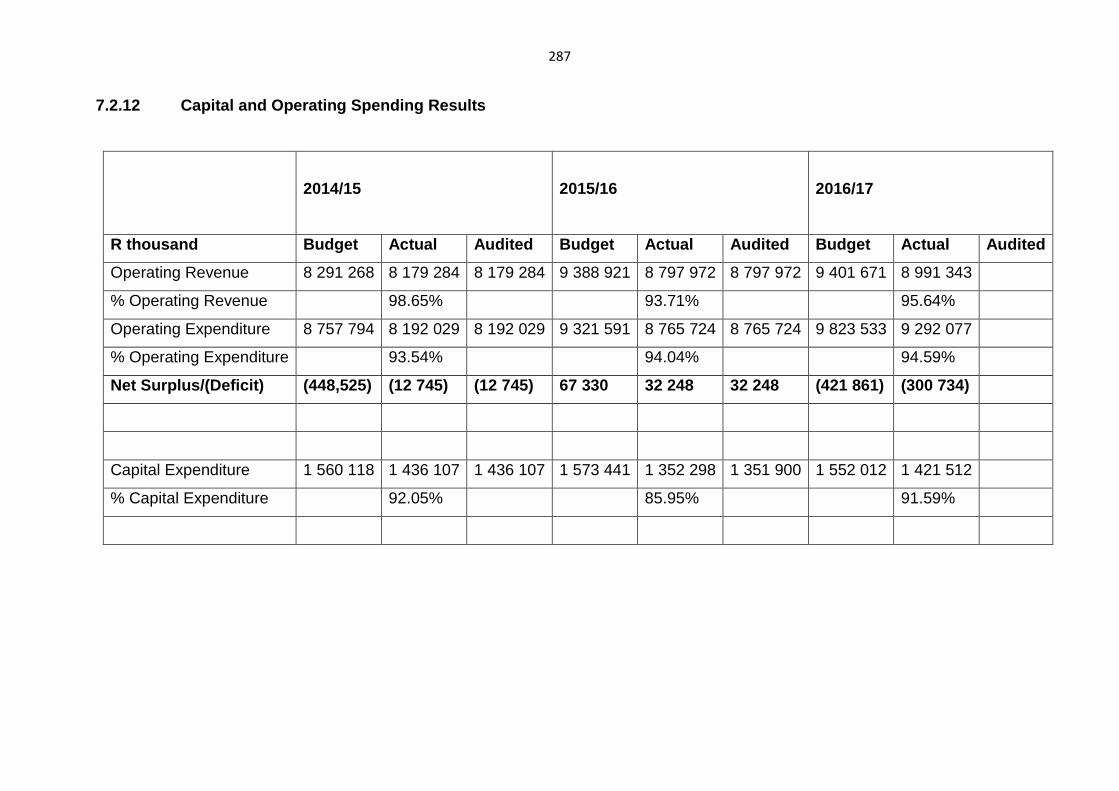
287
7.2.12 Capital and Operating Spending Results
2014/15
2015/16
2016/17
R thousand Budget Actual Audited Budget Actual Audi ted Budget Actual Audited
Operating Revenue 8 291 268 8 179 284 8 179 284 9 388 921 8 797 972 8 797 972 9 401 671 8 991 343
% Operating Revenue 98.65% 93.71% 95.64%
Operating Expenditure 8 757 794 8 192 029 8 192 029 9 321 591 8 765 724 8 765 724 9 823 533 9 292 077
% Operating Expenditure 93.54% 94.04% 94.59%
Net Surplus/(Deficit) (448,525) (12 745) (12 745) 6 7 330 32 248 32 248 (421 861) (300 734)
Capital Expenditure 1 560 118 1 436 107 1 436 107 1 573 441 1 352 298 1 351 900 1 552 012 1 421 512
% Capital Expenditure 92.05% 85.95% 91.59%
288
CHAPTER 8: OVERSIGHT, REPORTING, MONITORING AND EVA LUATION
This Chapter outlines the important aspects of oversight, reporting, monitoring and
evaluation in order to ensure the accountable and well aligned delivery of this
Integrated Development Plan and its six pillars by the Nelson Mandela Bay
Municipality.
The key offices, role-players, structures and tools for these important functions are
discussed below and include:
• Executive Mayor
• City Manager
• Municipal Public Accounts Committee
• Rules and Ethics Committee
• Office of the Auditor-General
• NMBM Audit Committee
• NMBM Internal Audit and Risk Assurance
• Performance, Monitoring and Evaluation
• Supply Chain Management
• Ward Committees
8.1 Executive Mayor
The Executive Mayor is required to identify and prioritise the needs of the Municipality.
These are to be reflected in the IDP and Budget, which also need to take into account
applicable national and provincial plans.
The Executive Mayor is required to evaluate the progress of the performance of the
institution in the implementation of the IDP. This is done through the institutional
Performance Management System. The Executive Mayor must provide political
leadership and guidance in the annual revision, preparation and timeous approval of
289
the IDP, the annual Budget and the Service Delivery and Budget Implementation Plan
(SDBIP).
The Executive Mayor has delegated the development and implementation of the
Performance Management System to the City Manager, in terms of the Municipal
Systems Act.
8.2 City Manager
The City Manager must provide operational guidance on the annual revision,
preparation and timeous approval of the IDP, the annual Budget and the SDBIP and
ensure strategic alignment between them.
In relation to IDP implementation, oversight, monitoring and evaluation, the City
Manager is inter alia responsible for the following:
• Developing an effective, efficient and accountable administration that is able to
implement the institutional IDP; in addition, ensuring an administration
responsive to the needs of the citizens, business and other sectors.
• Ensuring that all business of the administration is conducted in a manner that
is consistent with the IDP.
• Overseeing the implementation of the IDP, whilst ensuring integrated multi-
disciplinary orientated service delivery.
• Ensuring that a performance management system is in place for the
administration in order to determine whether the municipal targets set in the
IDP are being met.
• Ensuring regular reporting on progress with the implementation of the IDP to
the relevant Council structures.
The City Manager has delegated the development of the institution’s Performance
Management System to the Chief Operating Officer; and the cascading of
performance management in respect of non-Section 57 employees to the Executive
Director: Corporate Services.
290
The City Manager must inculcate an organisational culture that is conducive to
effective performance management within an appropriate organisational structure that
can meet the demands of the IDP, and ensure that the Performance Management
System is current, effective and efficient.
8.3 Municipal Public Accounts Committee
The Municipal Public Accounts Committee (MPAC) is a key structure in Council and
the mechanism through which it exercises oversight over the expenditure of public
money. With regard to financial management, MPAC enables Council to fulfil its
obligation to ensure that the spending of ratepayers’ money and Council’s stewardship
of public assets is done economically, efficiently and effectively.
MPAC conducts its affairs in a non-party political manner in order to ensure neutrality
and maximise its effectiveness. It also ensures that the Municipality’s Oversight
Report on the Annual Report is prepared for adoption by Council, as required in terms
of the Municipal Finance Management Act (MFMA).
MPAC also has the responsibility to investigate and advise Council in respect of
unauthorised, irregular or fruitless and wasteful expenditure.
The Municipality’s Municipal Public Accounts Committee currently comprises the
following members:
• African National Congress (ANC) – 5 members
• Democratic Alliance (DA) – 6 members
• Economic Freedom Fighters (EFF) – 2 members and also one occupying
Chairperson position
• Patriotic Alliance (PA) – 1 member
• United Democratic Movement (UDM) – 1 member
291
8.4 Rules and Ethics Committee
A Rules and Ethics Committee was recently established for the purpose of monitoring
and reviewing the Rules of Order of Council.
The objectives of this Committee include:
• Inculcating a respect for the rule of law in the institution.
• Upholding Council’s Rules of Order, thereby promoting stability in Council.
• Putting the people first (Batho Pele principles).
• Ensuring open and constructive debate.
• Respecting divergent views.
• Enhancing the effective management of Council and Standing Committee
meetings.
• Fostering a sense of collective responsibility among Councillors in advancing
service delivery and deepening democracy.
8.5 Office of the Auditor-General
The Auditor-General of South Africa has a constitutional mandate and, as the supreme
audit institution of South Africa, exists to strengthen South Africa’s democracy by
enabling oversight, accountability and governance in the public sector through
auditing, thereby building public confidence.
The Auditor-General checks the spending of public money by determining whether it
has been used properly and for the intended purposes. This is done by performing an
annual audit. The results of the annual audit will reveal whether the Municipality is
adhering to legislation and good practice or whether there are areas that require
improvement. One of the areas examined, is that of irregular, fruitless and wasteful
expenditure - where there is such expenditure, the Accounting Officer must investigate
and take appropriate action.
292
The Auditor-General also audits the planning processes and performance information
of the Municipality and its municipal entity (MBDA).
8.6 Audit Committee
The Audit Committee is appointed by Council as an independent advisory body. The
Audit Committee advises the Council, political office-bearers, the Accounting Officer
and the Executive Management Team on matters such as the following:
• Internal financial control and internal audits.
• Risk management.
• Accounting policies.
• Adequacy, reliability and accuracy of financial reporting and information.
• Performance management.
• Effective governance.
• Compliance with the MFMA, the annual Division of Revenue Act (DoRA) and
any other applicable legislation.
• Performance evaluation.
• Any other issues referred to it by the Municipality or its municipal entity.
Furthermore, the Audit Committee reviews the annual financial statements in order to
provide an authoritative and credible view of the Municipality’s financial position, its
efficiency and effectiveness, as well as its overall level of legislative compliance.
The Audit Committee responds to Council on any issues raised by the Auditor-General
in the Audit Report. Furthermore, it conducts investigations into the financial affairs of
the Municipality as may be necessary.
8.7 Internal Audit and Risk Assurance
In terms of Section 165 of the MFMA, the Accounting Officer must establish effective
systems of internal control to provide reasonable assurance that the Municipality’s
financial and non-financial objectives are achieved. In the execution of this
293
responsibility and also to promote ethics, good governance and integrity in the
institution, the Internal Audit Services and Risk Assurance was established.
The role of Internal Audit is to assist the City Manager and directorates in meeting their
objectives and discharging their responsibilities by providing independent and
objective quality assurance reviews of the adequacy and effectiveness of the controls
set up by Management to help run the organisation. These include consultancy
services.
Although the Risk Management Unit of the Municipality is responsible for the
identification of risk exposure, the risks recorded in Council’s Risk Register are used
to compile the Annual and Three-year Internal Audit Plans.
The Forensic Audit Services Section complements the broader justice system and
forms part of the Internal Audit Sub-directorate of the Municipality. The forensics
component derives its NMBM mandate from the Anti-Fraud and Anti-Corruption
Strategy, the NMBM Internal Audit Charter, the MFMA, and the Prevention and
Combatting of Corrupt Activities Act.
An Ethics Hotline was recently established, and the Internal Audit Sub-directorate
investigates all matters reported.
8.8 Performance, Monitoring and Evaluation
8.8.1 Performance Management
The municipal performance management function describes measures, evaluates and
reports on how the Municipality’s processes relating to the implementation of the IDP
will be conducted, organised and managed. This includes identifying role-players,
stakeholders and key timelines. Performance management therefore holds the key to
the successful implementation of the IDP.
Integrated development planning enables the achievement of the planning stage of
performance management. The Service Delivery and Budget Implementation Plan
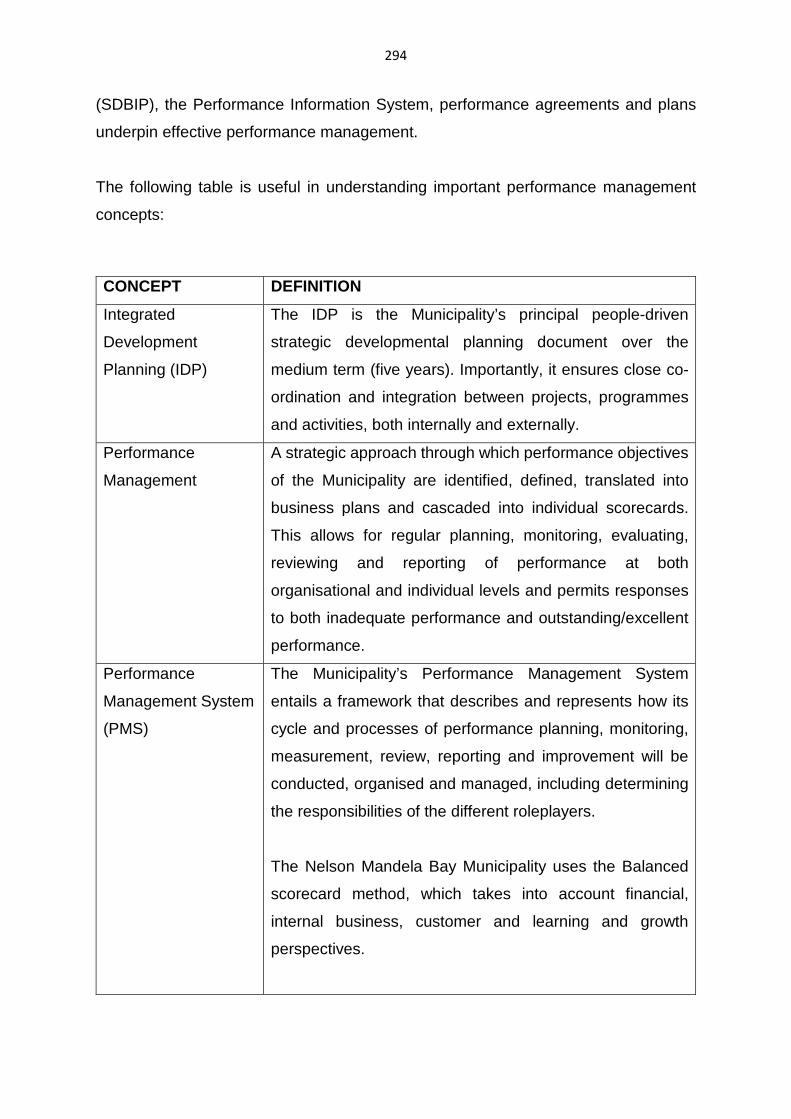
294
(SDBIP), the Performance Information System, performance agreements and plans
underpin effective performance management.
The following table is useful in understanding important performance management
concepts:
CONCEPT DEFINITION
Integrated
Development
Planning (IDP)
The IDP is the Municipality’s principal people-driven
strategic developmental planning document over the
medium term (five years). Importantly, it ensures close co-
ordination and integration between projects, programmes
and activities, both internally and externally.
Performance
Management
A strategic approach through which performance objectives
of the Municipality are identified, defined, translated into
business plans and cascaded into individual scorecards.
This allows for regular planning, monitoring, evaluating,
reviewing and reporting of performance at both
organisational and individual levels and permits responses
to both inadequate performance and outstanding/excellent
performance.
Performance
Management System
(PMS)
The Municipality’s Performance Management System
entails a framework that describes and represents how its
cycle and processes of performance planning, monitoring,
measurement, review, reporting and improvement will be
conducted, organised and managed, including determining
the responsibilities of the different roleplayers.
The Nelson Mandela Bay Municipality uses the Balanced
scorecard method, which takes into account financial,
internal business, customer and learning and growth
perspectives.
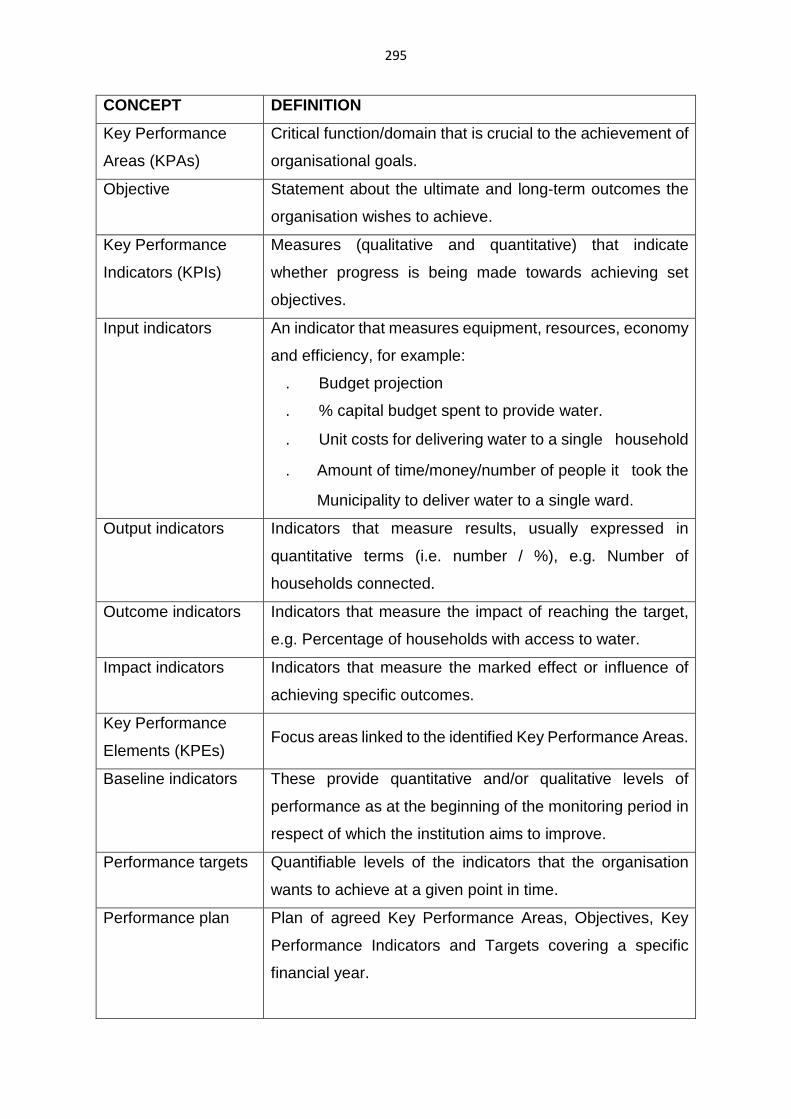
295
CONCEPT DEFINITION
Key Performance
Areas (KPAs)
Critical function/domain that is crucial to the achievement of
organisational goals.
Objective Statement about the ultimate and long-term outcomes the
organisation wishes to achieve.
Key Performance
Indicators (KPIs)
Measures (qualitative and quantitative) that indicate
whether progress is being made towards achieving set
objectives.
Input indicators
An indicator that measures equipment, resources, economy
and efficiency, for example:
. Budget projection
. % capital budget spent to provide water.
. Unit costs for delivering water to a single household
. Amount of time/money/number of people it took the
Municipality to deliver water to a single ward.
Output indicators
Indicators that measure results, usually expressed in
quantitative terms (i.e. number / %), e.g. Number of
households connected.
Outcome indicators
Indicators that measure the impact of reaching the target,
e.g. Percentage of households with access to water.
Impact indicators Indicators that measure the marked effect or influence of
achieving specific outcomes.
Key Performance
Elements (KPEs) Focus areas linked to the identified Key Performance Areas.
Baseline indicators These provide quantitative and/or qualitative levels of
performance as at the beginning of the monitoring period in
respect of which the institution aims to improve.
Performance targets Quantifiable levels of the indicators that the organisation
wants to achieve at a given point in time.
Performance plan Plan of agreed Key Performance Areas, Objectives, Key
Performance Indicators and Targets covering a specific
financial year.
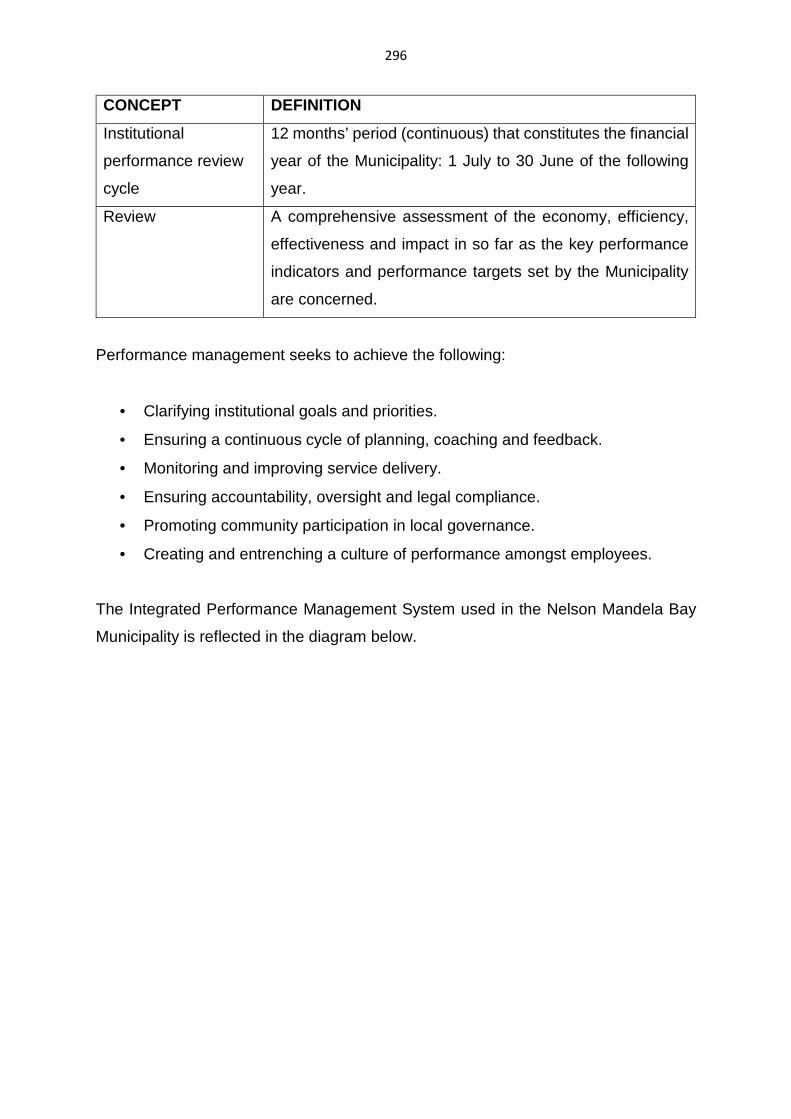
296
CONCEPT DEFINITION
Institutional
performance review
cycle
12 months’ period (continuous) that constitutes the financial
year of the Municipality: 1 July to 30 June of the following
year.
Review
A comprehensive assessment of the economy, efficiency,
effectiveness and impact in so far as the key performance
indicators and performance targets set by the Municipality
are concerned.
Performance management seeks to achieve the following:
• Clarifying institutional goals and priorities.
• Ensuring a continuous cycle of planning, coaching and feedback.
• Monitoring and improving service delivery.
• Ensuring accountability, oversight and legal compliance.
• Promoting community participation in local governance.
• Creating and entrenching a culture of performance amongst employees.
The Integrated Performance Management System used in the Nelson Mandela Bay
Municipality is reflected in the diagram below.
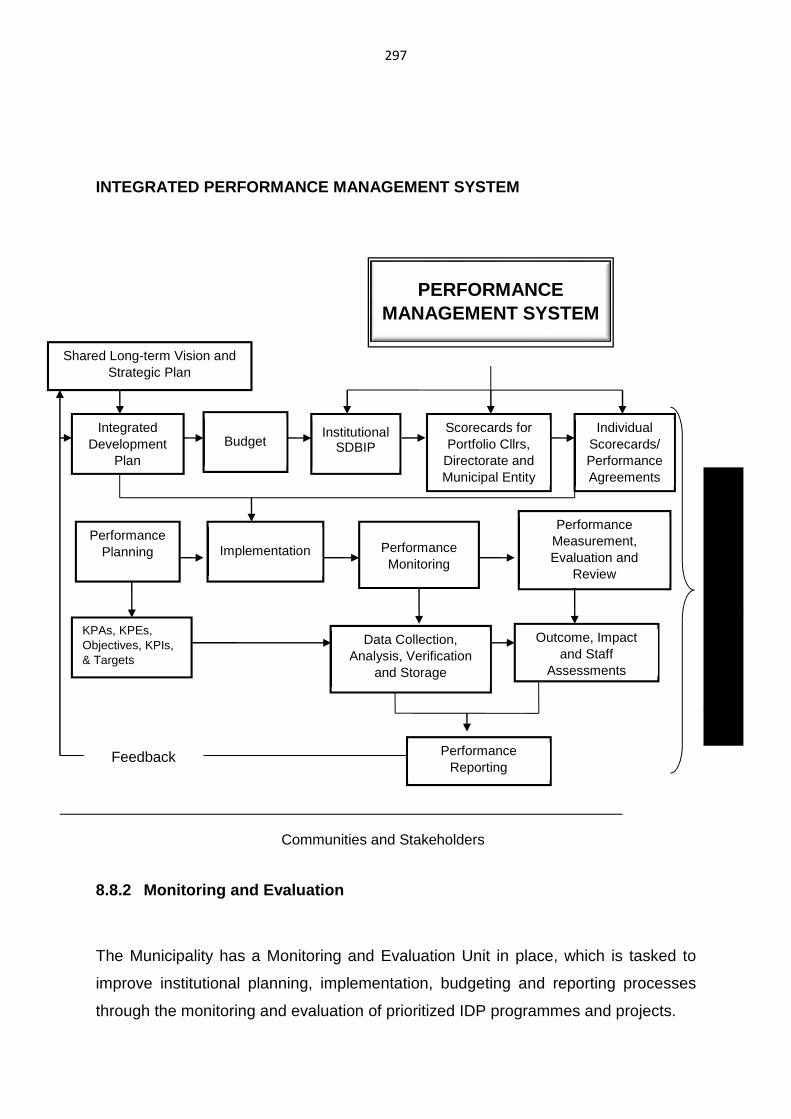
297
INTEGRATED PERFORMANCE MANAGEMENT SYSTEM
8.8.2 Monitoring and Evaluation
The Municipality has a Monitoring and Evaluation Unit in place, which is tasked to
improve institutional planning, implementation, budgeting and reporting processes
through the monitoring and evaluation of prioritized IDP programmes and projects.
Institutional SDBIP
Budget
Performance Measurement, Evaluation and
Review
Outcome, Impact and Staff
Assessments
Individual Scorecards/ Performance Agreements
Scorecards for Portfolio Cllrs,
Directorate and Municipal Entity
Implementation
Performance Reporting
Data Collection, Analysis, Verification
and Storage
Integrated Development
Plan
Performance Monitoring
Feedback
Communities and Stakeholders
Shared Long-term Vision and Strategic Plan
Performance Planning
KPAs, KPEs, Objectives, KPIs, & Targets
PERFORMANCE MANAGEMENT SYSTEM
298
Towards this end, the focus is on the following:
• Monitoring and evaluation of the IDP implementation for tracking service
delivery progress and sustainability, and evaluating alternative options for
service delivery.
• Monitoring, evaluating and reporting on the performance of consultants /
service providers to ensure that the expected delivery outputs and outcomes
are achieved.
• Monitoring and evaluating Ward-Based Capital expenditure to ensure that the
objectives are achieved as planned.
• Monitoring the implementation of Council resolutions through the development
and maintenance of a matrix.
8.9 Supply Chain Management
The Municipality has an approved Supply Chain Management Policy which is required
to be reviewed on an annual basis. Inter alia, the policy provides for a committee
system to achieve and ensure competitive procurement. The Committees established
in compliance with the National Standards for Bid Committees, are as follows:
• The Bid Specification Committee
• The Bid Evaluation Committee
• The Bid Adjudication Committee
An Integrated Contracts Management System tracks the award of tenders from the
time of approval of the specifications to the time of final award.
The Municipality has embarked on the development and implementation of a Quality
Management System (QMS), in compliance with ISO 9001:2015. This process
commenced in March 2016 and is due for completion in 2018.
299
8.10 Ward Committees
The main function of a Ward Committee is to act as the formal communication channel
between Council and the community. The Ward Committees therefore provide the
channel through which communities can most effectively lodge their complaints and
concerns.
The roles and responsibilities of Ward Committees include:
• Create formal unbiased communication channels and cooperative partnerships
between the Municipality and the community within each ward.
• Promote harmonious relationships between residents of the ward, the Ward
Councillor and the Municipality.
• Facilitate participation in the IDP processes.
• Act as a reference group/advisory body on Council policies and issues that
affect the communities in the ward.
• Serve as an agent for mobilising community action.
• Act as a conduit for community complaints and feedback on Council responses.
• Make recommendations on any matters that may affect the ward or Council.
8.11 Special Sectors and Mainstreaming
The Nelson Mandela Bay Municipality has established an institutional framework that
coordinates and facilitates the mainstreaming of the best interests of children, people
with disabilities, elderly, women and youth through Special Programmes Unit within
Constituency Services.
In an effort to ensure integration and synergy, all Directorates are required to ensure
special sectors development is central in their planning, budgeting, implementation of
their projects and programmes. The Special Programmes Unit in conjunction with
Directorates and collaboration with relevant stakeholders is expected to conduct its
business in the following manner;
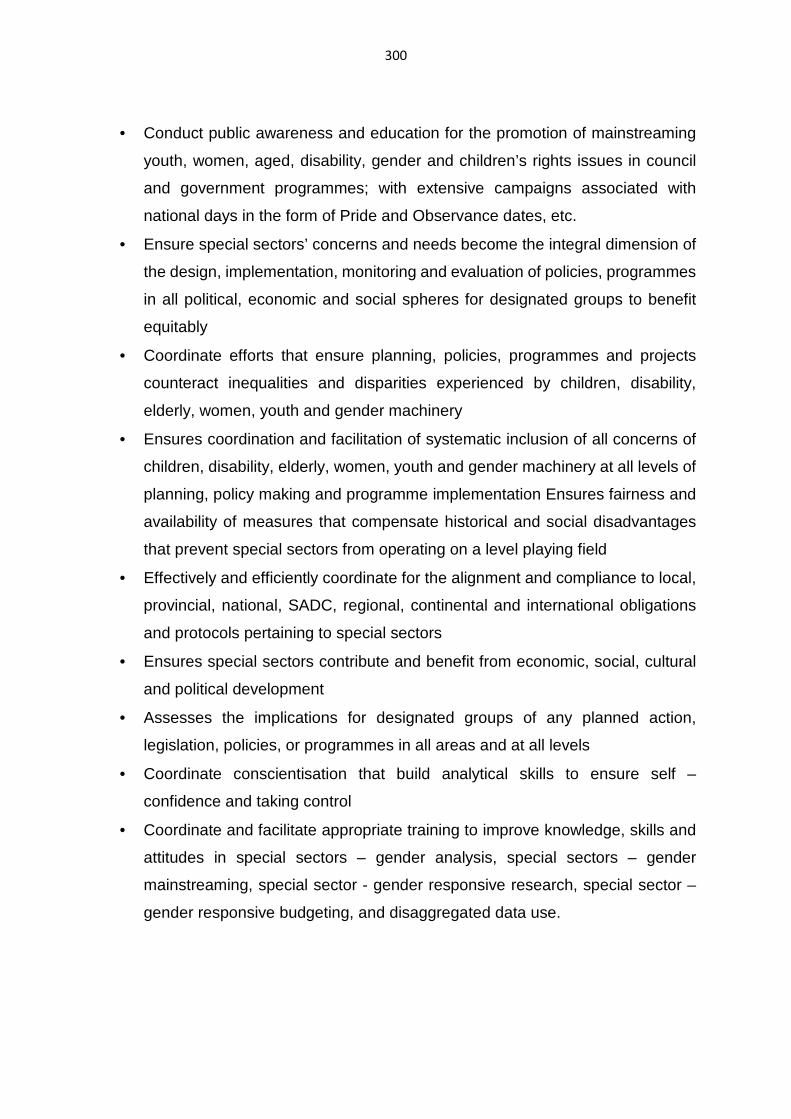
300
• Conduct public awareness and education for the promotion of mainstreaming
youth, women, aged, disability, gender and children’s rights issues in council
and government programmes; with extensive campaigns associated with
national days in the form of Pride and Observance dates, etc.
• Ensure special sectors’ concerns and needs become the integral dimension of
the design, implementation, monitoring and evaluation of policies, programmes
in all political, economic and social spheres for designated groups to benefit
equitably
• Coordinate efforts that ensure planning, policies, programmes and projects
counteract inequalities and disparities experienced by children, disability,
elderly, women, youth and gender machinery
• Ensures coordination and facilitation of systematic inclusion of all concerns of
children, disability, elderly, women, youth and gender machinery at all levels of
planning, policy making and programme implementation Ensures fairness and
availability of measures that compensate historical and social disadvantages
that prevent special sectors from operating on a level playing field
• Effectively and efficiently coordinate for the alignment and compliance to local,
provincial, national, SADC, regional, continental and international obligations
and protocols pertaining to special sectors
• Ensures special sectors contribute and benefit from economic, social, cultural
and political development
• Assesses the implications for designated groups of any planned action,
legislation, policies, or programmes in all areas and at all levels
• Coordinate conscientisation that build analytical skills to ensure self –
confidence and taking control
• Coordinate and facilitate appropriate training to improve knowledge, skills and
attitudes in special sectors – gender analysis, special sectors – gender
mainstreaming, special sector - gender responsive research, special sector –
gender responsive budgeting, and disaggregated data use.

ANNEXURE “A”
DOCUMENTED CHANGES IN THE IDP
The IDP is a five-year plan that is reviewed annually. This page deals with all the
changes that have been done in the document for ease of reference.
Changes effected to date are as follows:
1. Cover page – inserted 2nd Edition First Draft – Page 1
2. A Poem on institutional performance on page 2 as requested by the Executive
Mayor is inserted
3. IDP definition on page 3
4. On page 4, a Map of the NMBM reflecting new Ward Boundaries after the
demarcation processes of 2015 is included
5. The revised Table of Contents on pages 5 - 6
6. Revised Foreword by the City Manager on page 14
7. Revised strategic objectives in line with the 6 Pillars on pages 23 - 26
8. On page 27 - 28, reflection on political party seat allocation in Council
9. Changes in the Mayoral Committee Members is in line with the latest reshuffling
of Mayoral by the Executive Mayor from pages 29 - 30
10. On page 34, the 1.6 Heading is changed
11. New information on IDP and Budget Time-Schedule is included on page 45
12. Pages 45 – 47, new information is included on the Implementation of the Long
Term Development Plan
13. Changes on page 56 on Pillar 1 (Well Run City)
14. Changes on page 60 on Opportunity City
15. New information on public participation of 18 – 24 August 2017 on
pages 76 – 77
16. Revised list of catalytic programmes on page 102
17. Pages 127 – 201, changes effected by Directorates in their chapters
18. Changes in the Delivery Plan chapter on page 202 - 211
19. Chapter on Financial Sustainability and Viability from page 258 – 281 is revised
20. Pages 293 contain proposed changes on information dealing with Ward
Committees 21. Pages 293 – 294 contain new information on Special Sectors and
Mainstreaming
Page 1 of 6
ANNEXURE “B”
REPORT ON PUBLIC PARTICIPATION PROGRAMME (18 – 24 A UGUST 2017) 1. BACKGROUND
Chapter Seven (7) of the Constitution of the Republic of South Africa, Act 108 of 1996, Chapter 4 and 5 of Local Government Municipal Systems Act, 32 of 2000 and, Chapter 4 of the Municipal Finance Management Act Number 56 of 2003 compel municipalities to engage communities in public participation. This should not only be done as a compliance exercise but also as an honest engagement with communities in order for all programmes that a municipality is implementing within the 5 year cycle of its Integrated Development Planning (IDP) to be informed by the priorities of its citizens.
Communities must own development taking place within its municipal space. At Nelson Mandela Bay Municipality (NMBM), the current political administration has introduced a new dimension on public participation. To make it more meaningful, they introduced the ranking of priorities in their order of importance.
The 2018/19 IDP / Budget public participation programme was approved by the Strategic Planning Steering Committee that was established by the Executive Mayor to oversee the whole planning and implementation processes. The entire programme was rolled out within five days with approximately four (4) meetings per day taking place at the same time in various venues.
All necessary preparatory requirements were done and the programme went out smoothly without major challenges. Despite very cold weathers during the times of the meetings, a number of the residents of the NMBM attended.
During the meeting with Councillors on the 18 August 2017, some amendments to the programme were suggested and effected. This resulted in an additional meeting being accommodated on the 24 August 2017 at the Newton Park Library. This additional meeting was to accommodate the following Ward; 6, 7, 8, 9, Portion of ward 12 and 39. All logistical arrangements for this additional meeting were to be facilitated by the Ward Councillors concerned.
Page 2 of 6
All the meetings took place as planned and without many disruptions except the following:
a) The meeting planned for 22 August 2017 with the Municipal Unions did not take place because the Municipal Unions did not show up.
b) In Gelvandale Hall on the 23 August 2017, disruptions and chaos occurred after an announcement that, the Ward Based Allocation document distributed at the meeting was not correct. A new document was then printed, distributed and the meeting continued.
c) Another meeting where disruptions occurred was in George Botha Hall on the
23 August 2017. The disruptions because community members objected to incorrect ward allocation of projects to wards that were affected by the new Ward demarcation process related to the 2016 Local Government Elections. As a result, a large number of people left the meeting but, the meeting continued until it was finalized.
2. COMMUNICATION AND MARKETING OF THE PROGRAMME
Various methods of communication and marketing were used to make communities aware about the programme. It was advertised in the various print media houses, various radio slots and news reads were arranged by Communications Directorate. The whole programme was uploaded in the NMBM Website. There was also regular loud hailing of the programme to relevant communities informing them about these meetings. Also, all Ward Councillors and Ward Committees were also requested to market the programme within their communities
The interaction and consultation process with communities is not only limited to the attendance of public participation meetings but also, communities are encouraged to make written submissions via emails, faxes or even verbal submissions to the IDP Office.
A total of 3026 residents attended the meetings. It is further noted that, of the 120 Councillors who were invited to attend the meeting, 39 Councillors attended.
Higher numbers of attendance by community members was more noticeable in the following venues; George Botha Hall with Ward Committees where 425 Ward Committee members attended the meeting. It is also noticeable that, in the following venues attendance by community members was in excess of 200. These were; Allan Ridge Hall with 299, Soweto Multi-Purpose Centre with 289, Lillian Ngoyi Sports Centre with 289, Babs Madlakane Community Hall with 231 and Gelvandale Community Hall with 221.
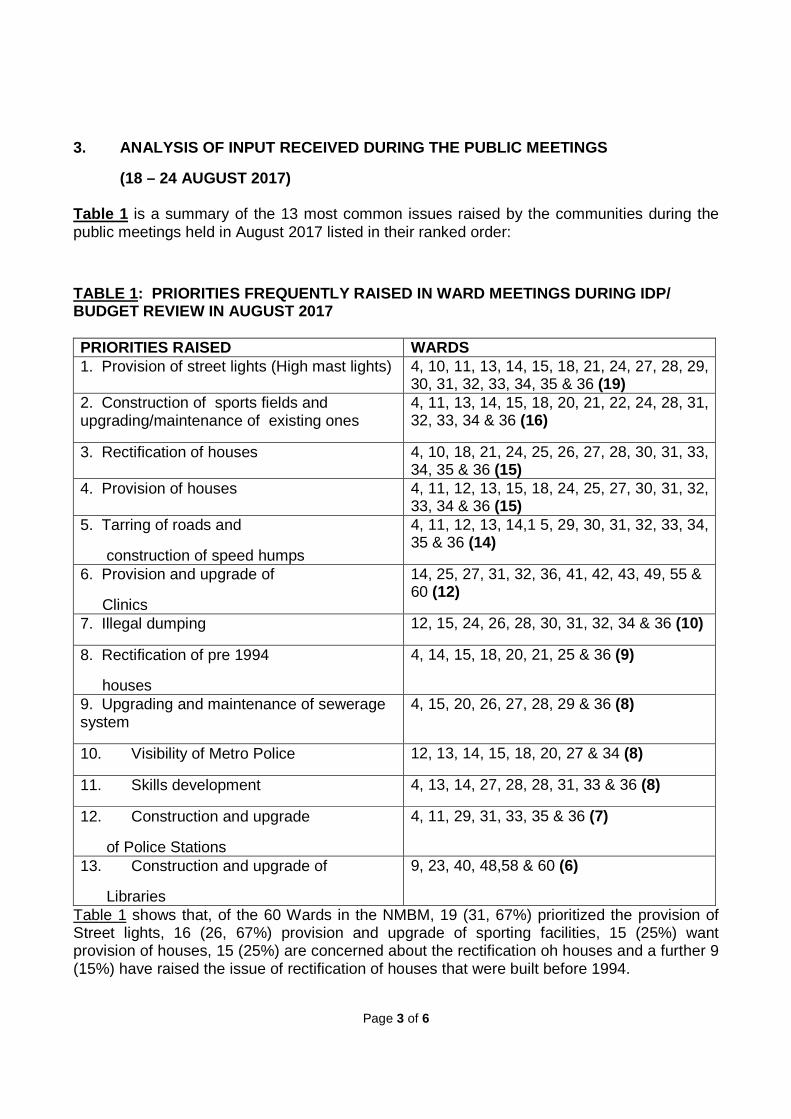
Page 3 of 6
3. ANALYSIS OF INPUT RECEIVED DURING THE PUBLIC MEE TINGS
(18 – 24 AUGUST 2017) Table 1 is a summary of the 13 most common issues raised by the communities during the public meetings held in August 2017 listed in their ranked order:
TABLE 1: PRIORITIES FREQUENTLY RAISED IN WARD MEET INGS DURING IDP/ BUDGET REVIEW IN AUGUST 2017
PRIORITIES RAISED WARDS 1. Provision of street lights (High mast lights) 4, 10, 11, 13, 14, 15, 18, 21, 24, 27, 28, 29,
30, 31, 32, 33, 34, 35 & 36 (19) 2. Construction of sports fields and upgrading/maintenance of existing ones
4, 11, 13, 14, 15, 18, 20, 21, 22, 24, 28, 31, 32, 33, 34 & 36 (16)
3. Rectification of houses 4, 10, 18, 21, 24, 25, 26, 27, 28, 30, 31, 33, 34, 35 & 36 (15)
4. Provision of houses 4, 11, 12, 13, 15, 18, 24, 25, 27, 30, 31, 32, 33, 34 & 36 (15)
5. Tarring of roads and
construction of speed humps
4, 11, 12, 13, 14,1 5, 29, 30, 31, 32, 33, 34, 35 & 36 (14)
6. Provision and upgrade of
Clinics
14, 25, 27, 31, 32, 36, 41, 42, 43, 49, 55 & 60 (12)
7. Illegal dumping 12, 15, 24, 26, 28, 30, 31, 32, 34 & 36 (10)
8. Rectification of pre 1994
houses
4, 14, 15, 18, 20, 21, 25 & 36 (9)
9. Upgrading and maintenance of sewerage system
4, 15, 20, 26, 27, 28, 29 & 36 (8)
10. Visibility of Metro Police 12, 13, 14, 15, 18, 20, 27 & 34 (8)
11. Skills development 4, 13, 14, 27, 28, 28, 31, 33 & 36 (8)
12. Construction and upgrade
of Police Stations
4, 11, 29, 31, 33, 35 & 36 (7)
13. Construction and upgrade of
Libraries
9, 23, 40, 48,58 & 60 (6)
Table 1 shows that, of the 60 Wards in the NMBM, 19 (31, 67%) prioritized the provision of Street lights, 16 (26, 67%) provision and upgrade of sporting facilities, 15 (25%) want provision of houses, 15 (25%) are concerned about the rectification oh houses and a further 9 (15%) have raised the issue of rectification of houses that were built before 1994.
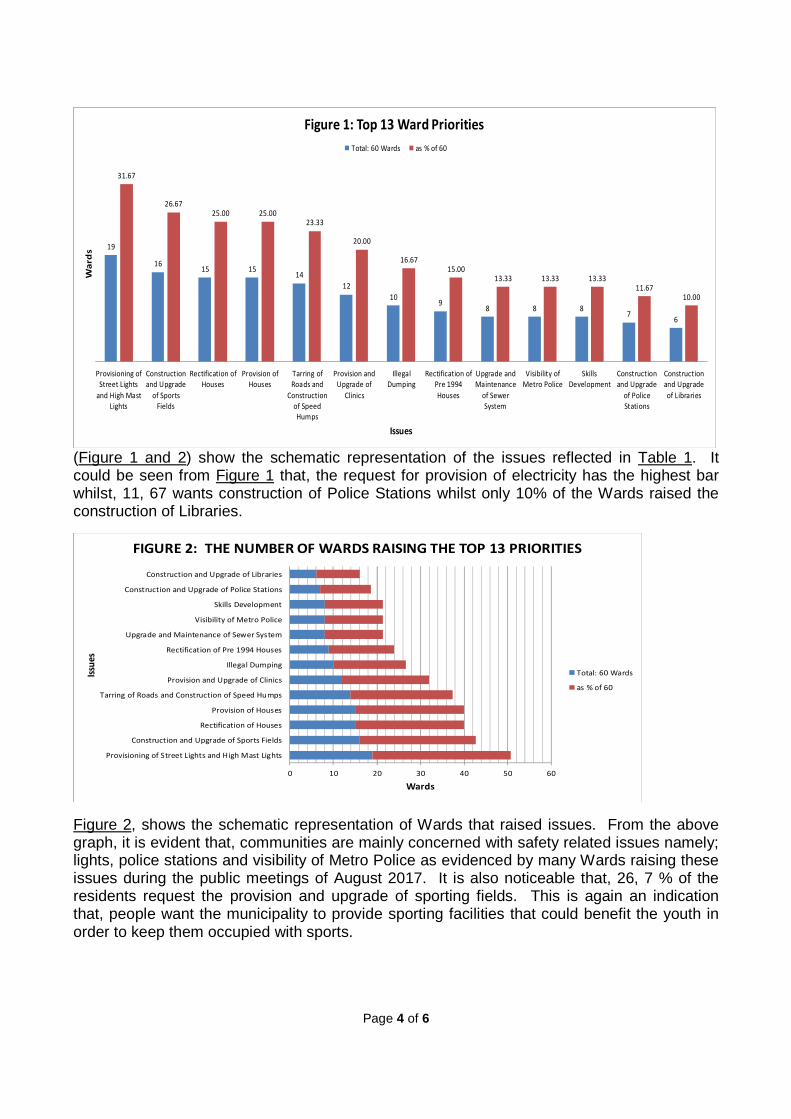
Page 4 of 6
19
1615 15
14
12
109
8 8 87
6
31.67
26.67
25.00 25.0023.33
20.00
16.67
15.0013.33 13.33 13.33
11.6710.00
Provisioning of
Street Lights
and High Mast
Lights
Construction
and Upgrade
of Sports
Fields
Rectification of
Houses
Provision of
Houses
Tarring of
Roads and
Construction
of Speed
Humps
Provision and
Upgrade of
Clinics
Illegal
Dumping
Rectification of
Pre 1994
Houses
Upgrade and
Maintenance
of Sewer
System
Visibility of
Metro Police
Skills
Development
Construction
and Upgrade
of Police
Stations
Construction
and Upgrade
of Libraries
Wa
rd
s
Issues
Figure 1: Top 13 Ward Priorities
Total: 60 Wards as % of 60
(Figure 1 and 2) show the schematic representation of the issues reflected in Table 1. It could be seen from Figure 1 that, the request for provision of electricity has the highest bar whilst, 11, 67 wants construction of Police Stations whilst only 10% of the Wards raised the construction of Libraries.
Provisioning of Street Lights and High Mast Lights
Construction and Upgrade of Sports Fields
Rectification of Houses
Provision of Houses
Tarring of Roads and Construction of Speed Humps
Provision and Upgrade of Clinics
Illegal Dumping
Rectification of Pre 1994 Houses
Upgrade and Maintenance of Sewer System
Visibility of Metro Police
Skills Development
Construction and Upgrade of Police Stations
Construction and Upgrade of Libraries
0 10 20 30 40 50 60
Issu
es
Wards
FIGURE 2: THE NUMBER OF WARDS RAISING THE TOP 13 PRIORITIES
Total: 60 Wards
as % of 60
Figure 2, shows the schematic representation of Wards that raised issues. From the above graph, it is evident that, communities are mainly concerned with safety related issues namely; lights, police stations and visibility of Metro Police as evidenced by many Wards raising these issues during the public meetings of August 2017. It is also noticeable that, 26, 7 % of the residents request the provision and upgrade of sporting fields. This is again an indication that, people want the municipality to provide sporting facilities that could benefit the youth in order to keep them occupied with sports.
Page 5 of 6
It is further noted from graphs above that, there are a number of Wards that want the municipality to rectify their houses including those houses that were built before 1994. It is clear that, a large number of wards raised issues that are Human Settlement related. This constitutes 39 (26, 5%) of the total number of wards that raised Human Settlement related issues.
One of the most important issues is, accommodating People with Disabilities in public meetings by providing services that are convenient for them to participate in public meetings. This issue came out strongly in a number of public meetings especially the one held with the Special Sector on the 23 August 2017. Such issues as, providing signs language interpreters in future meetings and also converting some of the municipal documents in braille could go a long way in addressing some of the concerns raised by the Special Sectors in a number of public platforms.
Priorities raised by the communities and the various stakeholders are consolidated in a report attached as (Annexure “C”) .
4. FINANCIAL COSTS RELATED TO THE PROGRAMME
Loud Hailing : R 114 513.00
PA system : R 41 097.00
Transport : R 127 152.00
Radio Slots : R 78 817. 42
Adverts : R 46 296. 77
Security : R 14 228. 98
Venues : R 5356. 00
GRAND TOTAL : R427 461.17
5. CHALLENGES
Although the meetings went out well, there were some challenges that were experienced. Namely;
• In Wards 36 and 4, the loud hailers encountered problems where they were not allowed to do their job. They were even threatened with burning of their vehicles. The matter was resolved in Ward 4. Even though they were not allowed to loud hail in Ward 36, residents from Ward 36 attended the planned meeting.
Page 6 of 6
• Ward Councillors were requested to submit their ranked priorities by the 25 August 2017. Of the 60 Ward Councillors in the NMBM, the following Ward Councillors submitted; Wards 1, 2, 6, 9, 10, 12, 13, 14, 15, 23, 24, 25, 29, 31, 32, 33, 34, 36, 39, 40, 41, 47, 48, 49, 52, 53, 55, 57, 59 and 60.
• 30 (50%) of the 60 Ward Councillors submitted their ranked priorities to the IDP Office as requested.
• Where community issues were not ranked during the meetings, Ward Councillors were expected to attend to such issues during their respective ward meetings that led to the submission of ranked priorities by Ward Councillors.
• Sector Departments invited did not attend the meetings except for the Office of the Premier and COGTA (Provincially). A separate session with these Departments and State Owned Enterprises (SOEs) is planned for 29 September 2017.
6. CONCLUSION
Despite the minor challenges experienced during the rollout of the programme, the IDP / Budget review meetings were generally very successful. The political Principals attached to the programme played their oversight role. The Officials, who were involved in the planning and rollout of the programme, were also very committed to its success.
A number of community members expressed concerns in the cluster approach that was used. The proposed approach going forward is that, the responsibility of holding these IDP / Budget meetings should be done at the level of Ward Councillors. The required logistical arrangements on how this should be done will be discussed with the relevant political principals.
It also needs mention that, priorities that are of operational nature have been elevated to relevant Directorates for their urgent attention. Others of capital nature will be included in the IDP for budget allocation consideration and implementation. Those that fall within the mandate of other Sector Departments will be elevated to the relevant Department and will be discussed during the IDP Representative Forum meeting planned for the 29 September 2017.
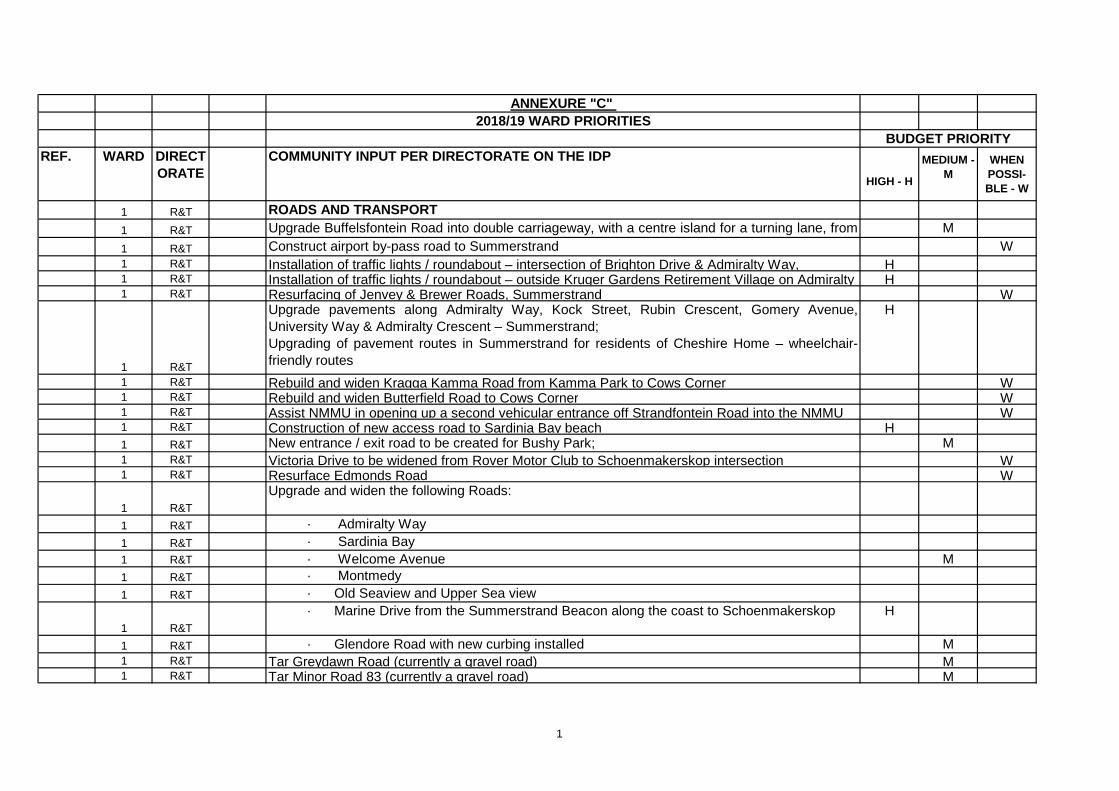
ANNEXURE "C" 2018/19 WARD PRIORITIES
REF. WARD DIRECTORATE
COMMUNITY INPUT PER DIRECTORATE ON THE IDP
HIGH - H
MEDIUM - M
WHEN POSSI-BLE - W
1 R&T ROADS AND TRANSPORT1 R&T Upgrade Buffelsfontein Road into double carriageway, with a centre island for a turning lane, from M
1 R&T Construct airport by-pass road to Summerstrand W1 R&T Installation of traffic lights / roundabout – intersection of Brighton Drive & Admiralty Way, H1 R&T Installation of traffic lights / roundabout – outside Kruger Gardens Retirement Village on Admiralty H1 R&T Resurfacing of Jenvey & Brewer Roads, Summerstrand W
1 R&T
Upgrade pavements along Admiralty Way, Kock Street, Rubin Crescent, Gomery Avenue,University Way & Admiralty Crescent – Summerstrand;Upgrading of pavement routes in Summerstrand for residents of Cheshire Home – wheelchair-friendly routes
H
1 R&T Rebuild and widen Kragga Kamma Road from Kamma Park to Cows Corner W1 R&T Rebuild and widen Butterfield Road to Cows Corner W1 R&T Assist NMMU in opening up a second vehicular entrance off Strandfontein Road into the NMMU W1 R&T Construction of new access road to Sardinia Bay beach H1 R&T New entrance / exit road to be created for Bushy Park; M1 R&T Victoria Drive to be widened from Rover Motor Club to Schoenmakerskop intersection W1 R&T Resurface Edmonds Road W
1 R&T
Upgrade and widen the following Roads:
1 R&T · Admiralty Way1 R&T · Sardinia Bay1 R&T · Welcome Avenue M1 R&T · Montmedy1 R&T · Old Seaview and Upper Sea view
1 R&T
· Marine Drive from the Summerstrand Beacon along the coast to Schoenmakerskop H
1 R&T · Glendore Road with new curbing installed M1 R&T Tar Greydawn Road (currently a gravel road) M1 R&T Tar Minor Road 83 (currently a gravel road) M
BUDGET PRIORITY
1
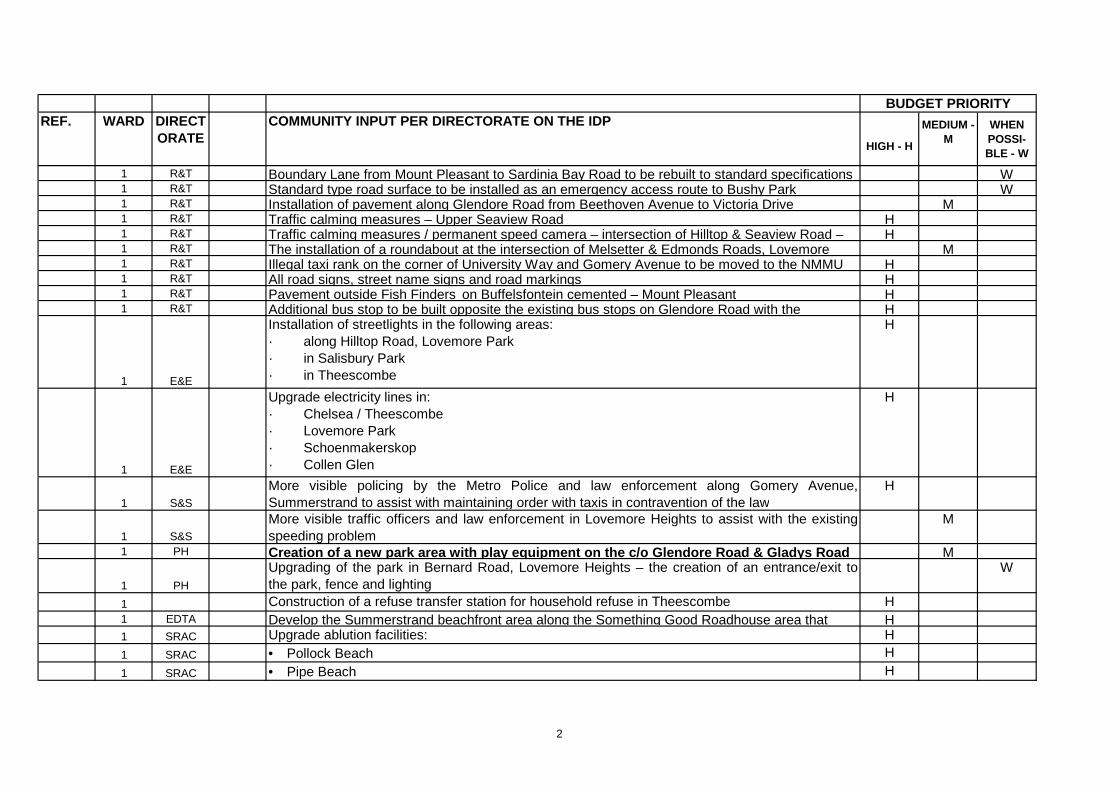
REF. WARD DIRECTORATE
COMMUNITY INPUT PER DIRECTORATE ON THE IDP
HIGH - H
MEDIUM - M
WHEN POSSI-BLE - W
BUDGET PRIORITY
1 R&T Boundary Lane from Mount Pleasant to Sardinia Bay Road to be rebuilt to standard specifications W1 R&T Standard type road surface to be installed as an emergency access route to Bushy Park W1 R&T Installation of pavement along Glendore Road from Beethoven Avenue to Victoria Drive M1 R&T Traffic calming measures – Upper Seaview Road H1 R&T Traffic calming measures / permanent speed camera – intersection of Hilltop & Seaview Road – H1 R&T The installation of a roundabout at the intersection of Melsetter & Edmonds Roads, Lovemore M1 R&T Illegal taxi rank on the corner of University Way and Gomery Avenue to be moved to the NMMU H1 R&T All road signs, street name signs and road markings H1 R&T Pavement outside Fish Finders on Buffelsfontein cemented – Mount Pleasant H1 R&T Additional bus stop to be built opposite the existing bus stops on Glendore Road with the H
1 E&E
Installation of streetlights in the following areas:· along Hilltop Road, Lovemore Park· in Salisbury Park· in Theescombe
H
1 E&E
Upgrade electricity lines in:· Chelsea / Theescombe· Lovemore Park· Schoenmakerskop· Collen Glen
H
1 S&S
More visible policing by the Metro Police and law enforcement along Gomery Avenue,Summerstrand to assist with maintaining order with taxis in contravention of the law
H
1 S&S
More visible traffic officers and law enforcement in Lovemore Heights to assist with the existingspeeding problem
M
1 PH Creation of a new park area with play equipment on the c/o Glendore Road & Gladys Road M
1 PH
Upgrading of the park in Bernard Road, Lovemore Heights – the creation of an entrance/exit tothe park, fence and lighting
W
1 Construction of a refuse transfer station for household refuse in Theescombe H1 EDTA Develop the Summerstrand beachfront area along the Something Good Roadhouse area that H1 SRAC Upgrade ablution facilities: H1 SRAC • Pollock Beach H
1 SRAC • Pipe Beach H
2
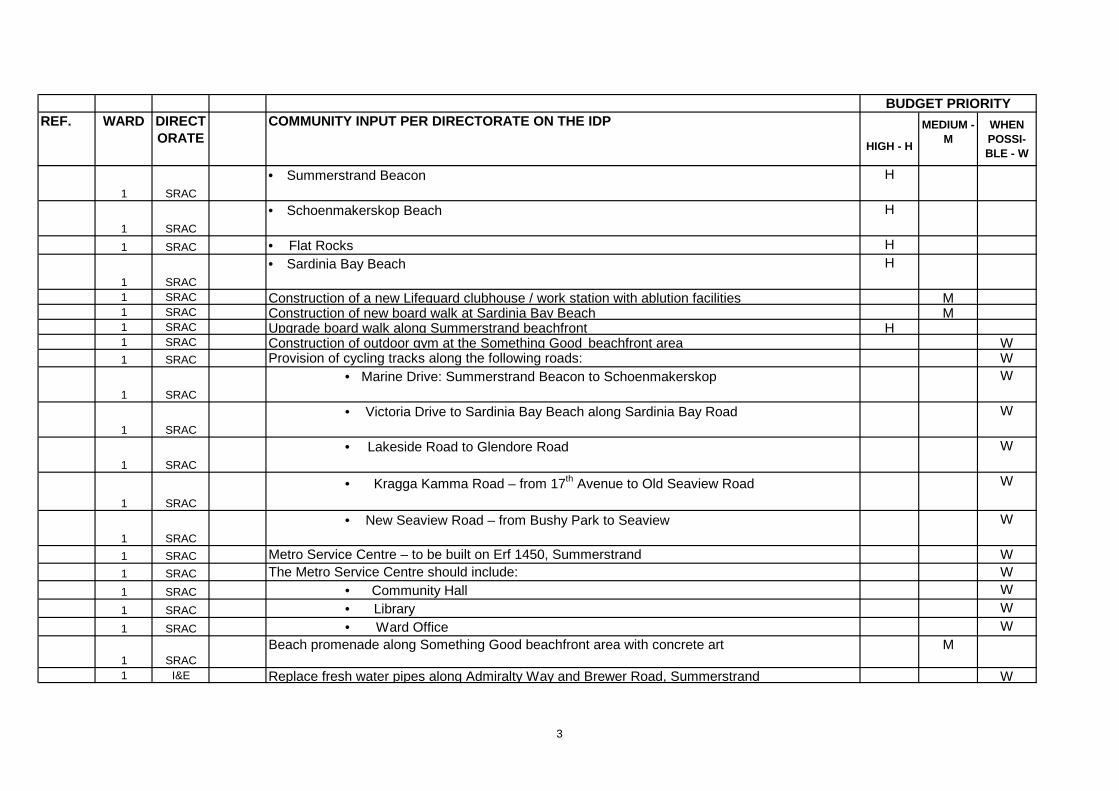
REF. WARD DIRECTORATE
COMMUNITY INPUT PER DIRECTORATE ON THE IDP
HIGH - H
MEDIUM - M
WHEN POSSI-BLE - W
BUDGET PRIORITY
1 SRAC
• Summerstrand Beacon H
1 SRAC
• Schoenmakerskop Beach H
1 SRAC • Flat Rocks H
1 SRAC
• Sardinia Bay Beach H
1 SRAC Construction of a new Lifeguard clubhouse / work station with ablution facilities M1 SRAC Construction of new board walk at Sardinia Bay Beach M1 SRAC Upgrade board walk along Summerstrand beachfront H1 SRAC Construction of outdoor gym at the Something Good beachfront area W1 SRAC Provision of cycling tracks along the following roads: W
1 SRAC
• Marine Drive: Summerstrand Beacon to Schoenmakerskop W
1 SRAC
• Victoria Drive to Sardinia Bay Beach along Sardinia Bay Road W
1 SRAC
• Lakeside Road to Glendore Road W
1 SRAC
• Kragga Kamma Road – from 17th Avenue to Old Seaview Road W
1 SRAC
• New Seaview Road – from Bushy Park to Seaview W
1 SRAC Metro Service Centre – to be built on Erf 1450, Summerstrand W1 SRAC The Metro Service Centre should include: W1 SRAC • Community Hall W
1 SRAC • Library W
1 SRAC • Ward Office W
1 SRACBeach promenade along Something Good beachfront area with concrete art M
1 I&E Replace fresh water pipes along Admiralty Way and Brewer Road, Summerstrand W
3
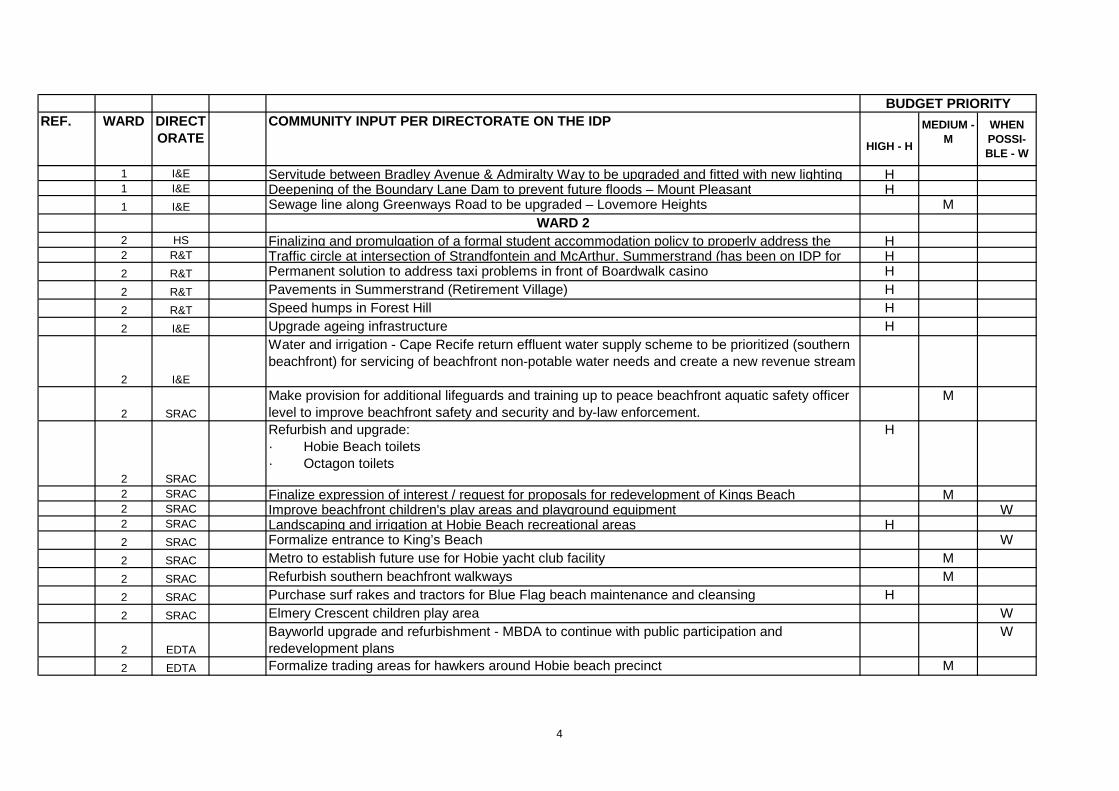
REF. WARD DIRECTORATE
COMMUNITY INPUT PER DIRECTORATE ON THE IDP
HIGH - H
MEDIUM - M
WHEN POSSI-BLE - W
BUDGET PRIORITY
1 I&E Servitude between Bradley Avenue & Admiralty Way to be upgraded and fitted with new lighting H1 I&E Deepening of the Boundary Lane Dam to prevent future floods – Mount Pleasant H1 I&E Sewage line along Greenways Road to be upgraded – Lovemore Heights M
WARD 22 HS Finalizing and promulgation of a formal student accommodation policy to properly address the H2 R&T Traffic circle at intersection of Strandfontein and McArthur, Summerstrand (has been on IDP for H2 R&T Permanent solution to address taxi problems in front of Boardwalk casino H
2 R&T Pavements in Summerstrand (Retirement Village) H
2 R&T Speed humps in Forest Hill H
2 I&E Upgrade ageing infrastructure H
2 I&E
Water and irrigation - Cape Recife return effluent water supply scheme to be prioritized (southern beachfront) for servicing of beachfront non-potable water needs and create a new revenue stream
2 SRAC
Make provision for additional lifeguards and training up to peace beachfront aquatic safety officer level to improve beachfront safety and security and by-law enforcement.
M
2 SRAC
Refurbish and upgrade: · Hobie Beach toilets· Octagon toilets
H
2 SRAC Finalize expression of interest / request for proposals for redevelopment of Kings Beach M2 SRAC Improve beachfront children's play areas and playground equipment W2 SRAC Landscaping and irrigation at Hobie Beach recreational areas H2 SRAC Formalize entrance to King’s Beach W
2 SRAC Metro to establish future use for Hobie yacht club facility M
2 SRAC Refurbish southern beachfront walkways M
2 SRAC Purchase surf rakes and tractors for Blue Flag beach maintenance and cleansing H
2 SRAC Elmery Crescent children play area W
2 EDTA
Bayworld upgrade and refurbishment - MBDA to continue with public participation and redevelopment plans
W
2 EDTA Formalize trading areas for hawkers around Hobie beach precinct M
4
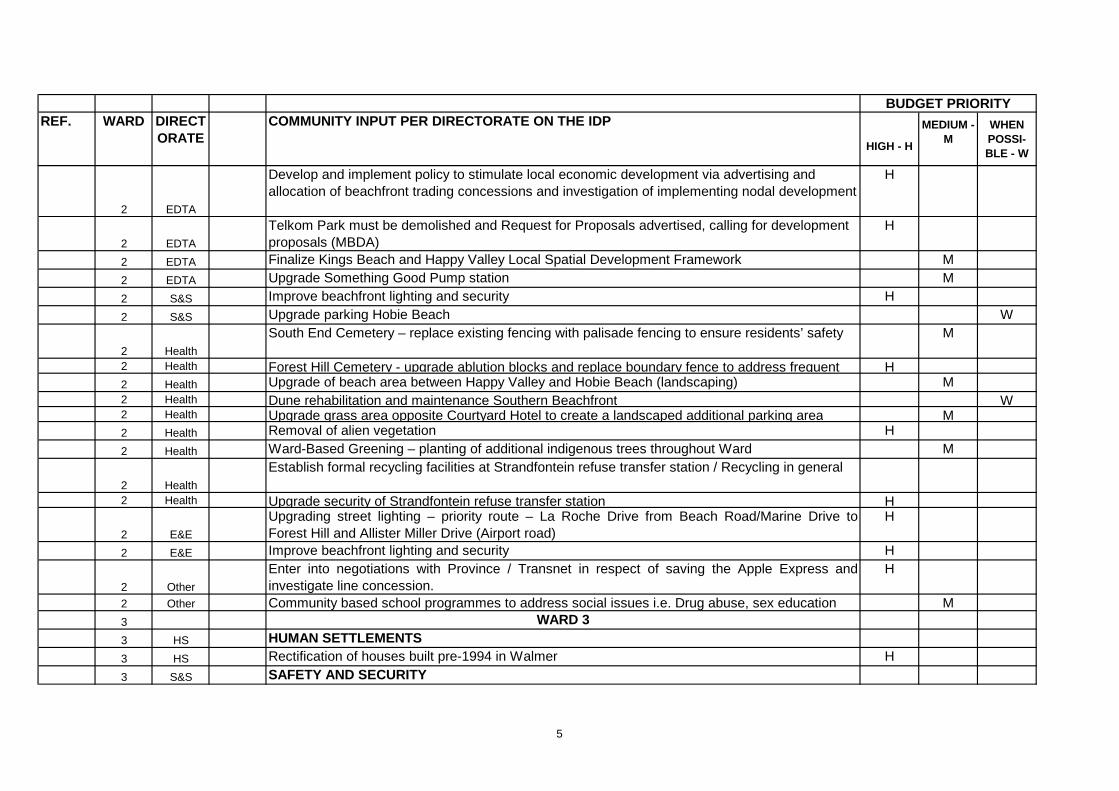
REF. WARD DIRECTORATE
COMMUNITY INPUT PER DIRECTORATE ON THE IDP
HIGH - H
MEDIUM - M
WHEN POSSI-BLE - W
BUDGET PRIORITY
2 EDTA
Develop and implement policy to stimulate local economic development via advertising and allocation of beachfront trading concessions and investigation of implementing nodal development
H
2 EDTA
Telkom Park must be demolished and Request for Proposals advertised, calling for development proposals (MBDA)
H
2 EDTA Finalize Kings Beach and Happy Valley Local Spatial Development Framework M
2 EDTA Upgrade Something Good Pump station M
2 S&S Improve beachfront lighting and security H
2 S&S Upgrade parking Hobie Beach W
2 Health
South End Cemetery – replace existing fencing with palisade fencing to ensure residents’ safety M
2 Health Forest Hill Cemetery - upgrade ablution blocks and replace boundary fence to address frequent H2 Health Upgrade of beach area between Happy Valley and Hobie Beach (landscaping) M2 Health Dune rehabilitation and maintenance Southern Beachfront W2 Health Upgrade grass area opposite Courtyard Hotel to create a landscaped additional parking area M2 Health Removal of alien vegetation H
2 Health Ward-Based Greening – planting of additional indigenous trees throughout Ward M
2 Health
Establish formal recycling facilities at Strandfontein refuse transfer station / Recycling in general
2 Health Upgrade security of Strandfontein refuse transfer station H
2 E&E
Upgrading street lighting – priority route – La Roche Drive from Beach Road/Marine Drive toForest Hill and Allister Miller Drive (Airport road)
H
2 E&E Improve beachfront lighting and security H
2 Other
Enter into negotiations with Province / Transnet in respect of saving the Apple Express andinvestigate line concession.
H
2 Other Community based school programmes to address social issues i.e. Drug abuse, sex education M3 WARD 33 HS HUMAN SETTLEMENTS3 HS Rectification of houses built pre-1994 in Walmer H
3 S&S SAFETY AND SECURITY
5
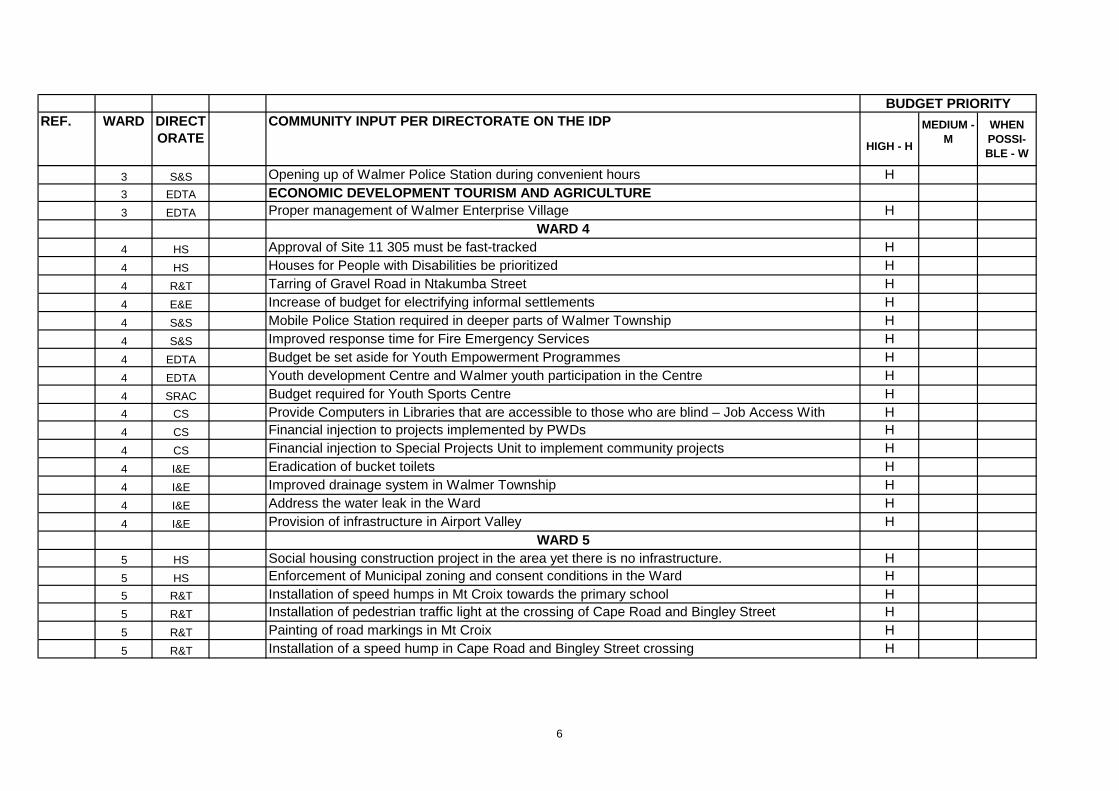
REF. WARD DIRECTORATE
COMMUNITY INPUT PER DIRECTORATE ON THE IDP
HIGH - H
MEDIUM - M
WHEN POSSI-BLE - W
BUDGET PRIORITY
3 S&S Opening up of Walmer Police Station during convenient hours H3 EDTA ECONOMIC DEVELOPMENT TOURISM AND AGRICULTURE3 EDTA Proper management of Walmer Enterprise Village H
WARD 44 HS Approval of Site 11 305 must be fast-tracked H
4 HS Houses for People with Disabilities be prioritized H
4 R&T Tarring of Gravel Road in Ntakumba Street H
4 E&E Increase of budget for electrifying informal settlements H
4 S&S Mobile Police Station required in deeper parts of Walmer Township H
4 S&S Improved response time for Fire Emergency Services H
4 EDTA Budget be set aside for Youth Empowerment Programmes H
4 EDTA Youth development Centre and Walmer youth participation in the Centre H
4 SRAC Budget required for Youth Sports Centre H4 CS Provide Computers in Libraries that are accessible to those who are blind – Job Access With H4 CS Financial injection to projects implemented by PWDs H
4 CS Financial injection to Special Projects Unit to implement community projects H
4 I&E Eradication of bucket toilets H
4 I&E Improved drainage system in Walmer Township H
4 I&E Address the water leak in the Ward H
4 I&E Provision of infrastructure in Airport Valley HWARD 5
5 HS Social housing construction project in the area yet there is no infrastructure. H5 HS Enforcement of Municipal zoning and consent conditions in the Ward H5 R&T Installation of speed humps in Mt Croix towards the primary school H5 R&T Installation of pedestrian traffic light at the crossing of Cape Road and Bingley Street H
5 R&T Painting of road markings in Mt Croix H
5 R&T Installation of a speed hump in Cape Road and Bingley Street crossing H
6
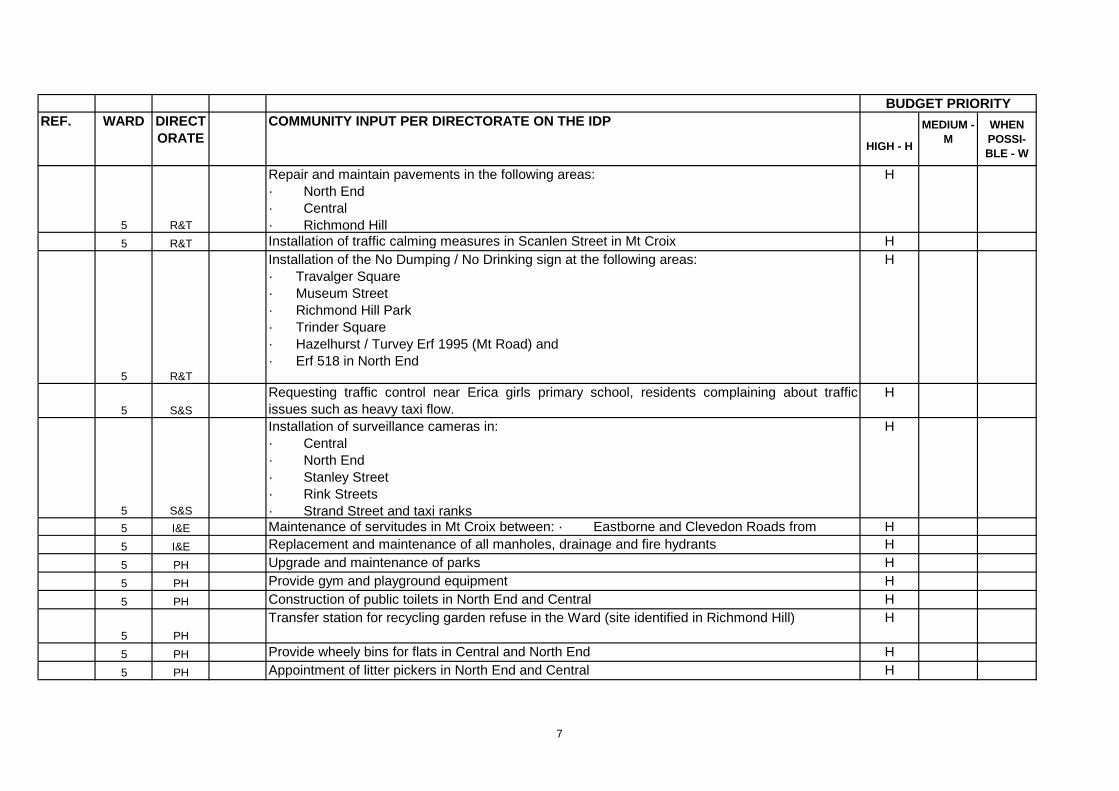
REF. WARD DIRECTORATE
COMMUNITY INPUT PER DIRECTORATE ON THE IDP
HIGH - H
MEDIUM - M
WHEN POSSI-BLE - W
BUDGET PRIORITY
5 R&T
Repair and maintain pavements in the following areas:· North End· Central· Richmond Hill
H
5 R&T Installation of traffic calming measures in Scanlen Street in Mt Croix H
5 R&T
Installation of the No Dumping / No Drinking sign at the following areas:· Travalger Square· Museum Street· Richmond Hill Park· Trinder Square· Hazelhurst / Turvey Erf 1995 (Mt Road) and· Erf 518 in North End
H
5 S&S
Requesting traffic control near Erica girls primary school, residents complaining about trafficissues such as heavy taxi flow.
H
5 S&S
Installation of surveillance cameras in:· Central· North End· Stanley Street· Rink Streets· Strand Street and taxi ranks
H
5 I&E Maintenance of servitudes in Mt Croix between: · Eastborne and Clevedon Roads from H5 I&E Replacement and maintenance of all manholes, drainage and fire hydrants H
5 PH Upgrade and maintenance of parks H
5 PH Provide gym and playground equipment H
5 PH Construction of public toilets in North End and Central H
5 PH
Transfer station for recycling garden refuse in the Ward (site identified in Richmond Hill) H
5 PH Provide wheely bins for flats in Central and North End H
5 PH Appointment of litter pickers in North End and Central H
7
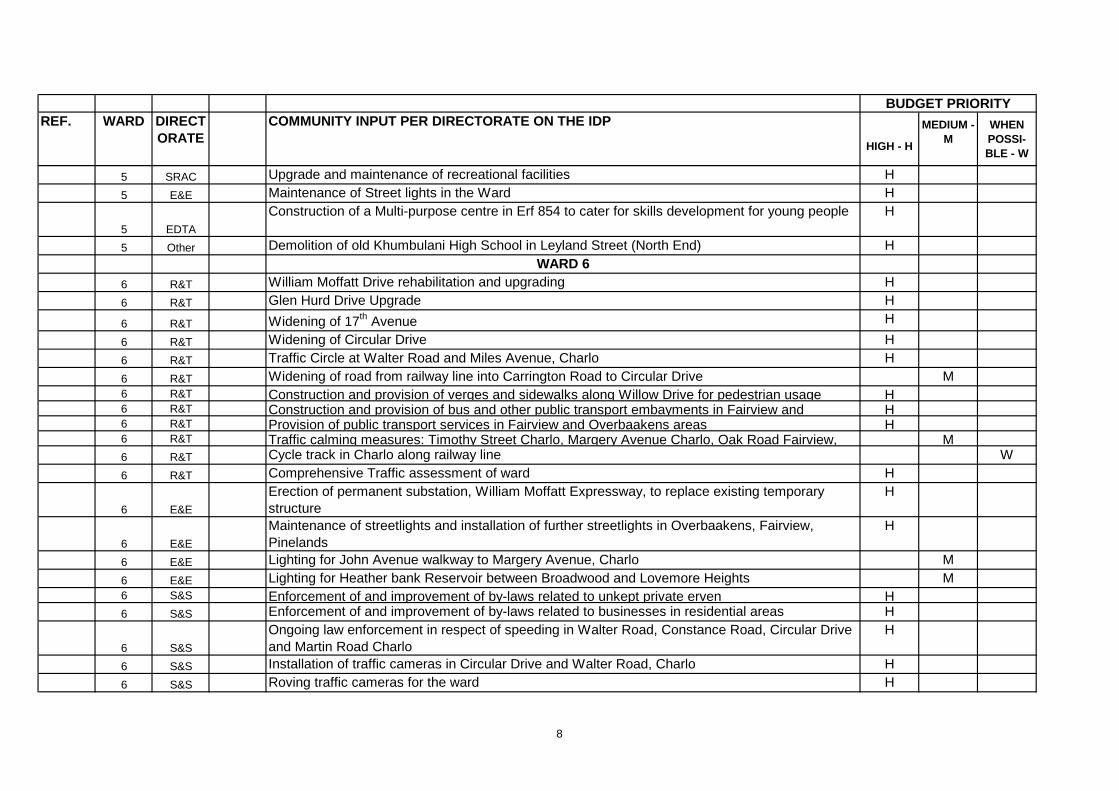
REF. WARD DIRECTORATE
COMMUNITY INPUT PER DIRECTORATE ON THE IDP
HIGH - H
MEDIUM - M
WHEN POSSI-BLE - W
BUDGET PRIORITY
5 SRAC Upgrade and maintenance of recreational facilities H
5 E&E Maintenance of Street lights in the Ward H
5 EDTA
Construction of a Multi-purpose centre in Erf 854 to cater for skills development for young people H
5 Other Demolition of old Khumbulani High School in Leyland Street (North End) HWARD 6
6 R&T William Moffatt Drive rehabilitation and upgrading H
6 R&T Glen Hurd Drive Upgrade H
6 R&T Widening of 17th Avenue H
6 R&T Widening of Circular Drive H
6 R&T Traffic Circle at Walter Road and Miles Avenue, Charlo H
6 R&T Widening of road from railway line into Carrington Road to Circular Drive M6 R&T Construction and provision of verges and sidewalks along Willow Drive for pedestrian usage H6 R&T Construction and provision of bus and other public transport embayments in Fairview and H6 R&T Provision of public transport services in Fairview and Overbaakens areas H6 R&T Traffic calming measures: Timothy Street Charlo, Margery Avenue Charlo, Oak Road Fairview, M6 R&T Cycle track in Charlo along railway line W
6 R&T Comprehensive Traffic assessment of ward H
6 E&E
Erection of permanent substation, William Moffatt Expressway, to replace existing temporary structure
H
6 E&E
Maintenance of streetlights and installation of further streetlights in Overbaakens, Fairview, Pinelands
H
6 E&E Lighting for John Avenue walkway to Margery Avenue, Charlo M
6 E&E Lighting for Heather bank Reservoir between Broadwood and Lovemore Heights M6 S&S Enforcement of and improvement of by-laws related to unkept private erven H6 S&S Enforcement of and improvement of by-laws related to businesses in residential areas H
6 S&S
Ongoing law enforcement in respect of speeding in Walter Road, Constance Road, Circular Drive and Martin Road Charlo
H
6 S&S Installation of traffic cameras in Circular Drive and Walter Road, Charlo H
6 S&S Roving traffic cameras for the ward H
8
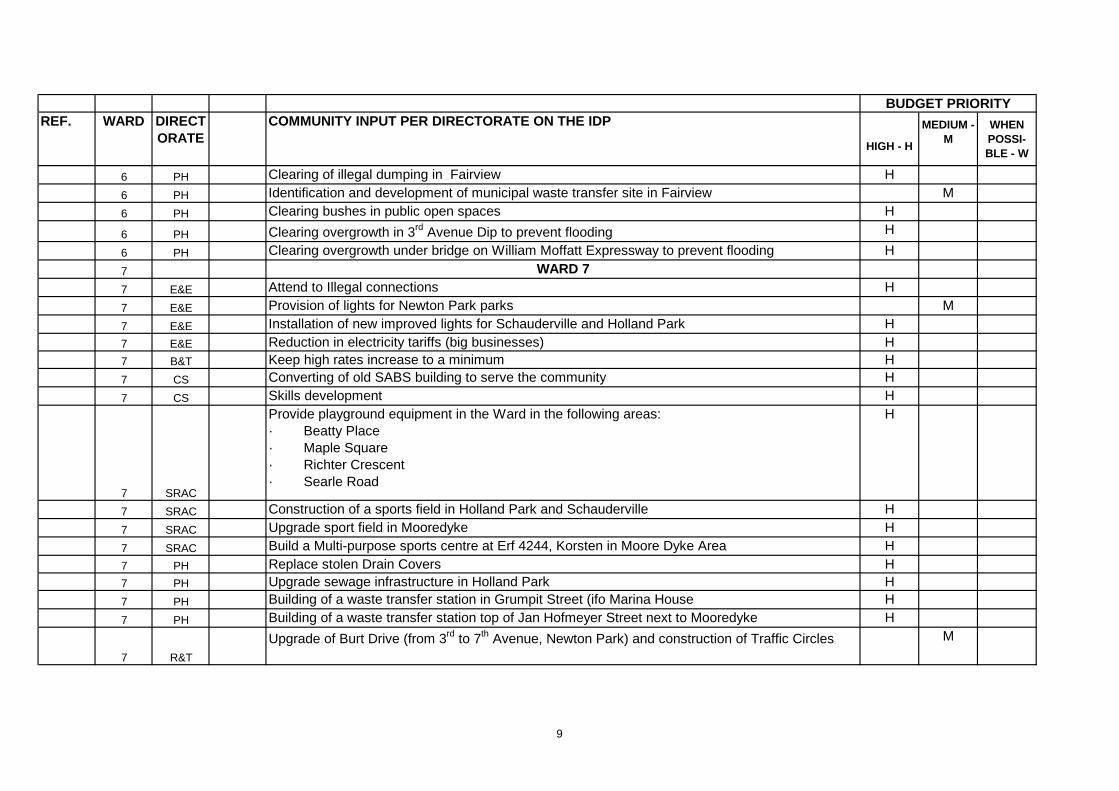
REF. WARD DIRECTORATE
COMMUNITY INPUT PER DIRECTORATE ON THE IDP
HIGH - H
MEDIUM - M
WHEN POSSI-BLE - W
BUDGET PRIORITY
6 PH Clearing of illegal dumping in Fairview H
6 PH Identification and development of municipal waste transfer site in Fairview M
6 PH Clearing bushes in public open spaces H
6 PH Clearing overgrowth in 3rd Avenue Dip to prevent flooding H
6 PH Clearing overgrowth under bridge on William Moffatt Expressway to prevent flooding H
7 WARD 77 E&E Attend to Illegal connections H
7 E&E Provision of lights for Newton Park parks M
7 E&E Installation of new improved lights for Schauderville and Holland Park H7 E&E Reduction in electricity tariffs (big businesses) H7 B&T Keep high rates increase to a minimum H7 CS Converting of old SABS building to serve the community H
7 CS Skills development H
7 SRAC
Provide playground equipment in the Ward in the following areas:· Beatty Place· Maple Square· Richter Crescent· Searle Road
H
7 SRAC Construction of a sports field in Holland Park and Schauderville H
7 SRAC Upgrade sport field in Mooredyke H
7 SRAC Build a Multi-purpose sports centre at Erf 4244, Korsten in Moore Dyke Area H7 PH Replace stolen Drain Covers H7 PH Upgrade sewage infrastructure in Holland Park H7 PH Building of a waste transfer station in Grumpit Street (ifo Marina House H
7 PH Building of a waste transfer station top of Jan Hofmeyer Street next to Mooredyke H
7 R&T
Upgrade of Burt Drive (from 3rd to 7th Avenue, Newton Park) and construction of Traffic Circles M
9
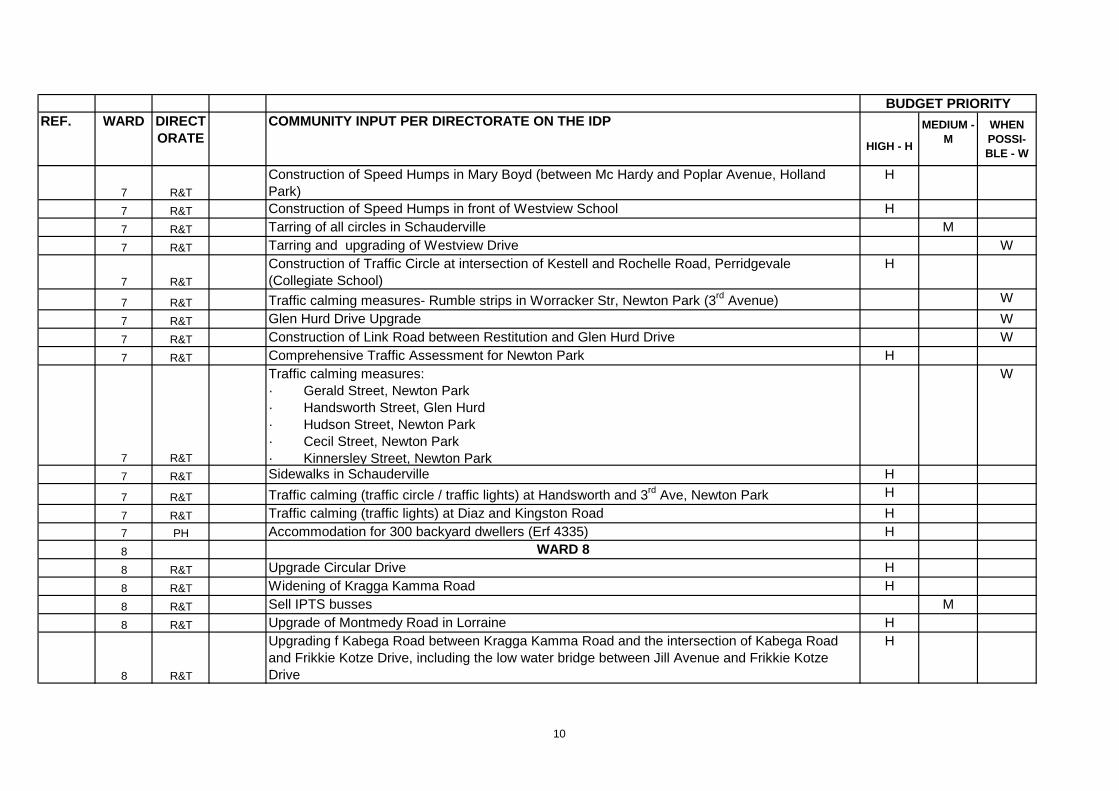
REF. WARD DIRECTORATE
COMMUNITY INPUT PER DIRECTORATE ON THE IDP
HIGH - H
MEDIUM - M
WHEN POSSI-BLE - W
BUDGET PRIORITY
7 R&T
Construction of Speed Humps in Mary Boyd (between Mc Hardy and Poplar Avenue, Holland Park)
H
7 R&T Construction of Speed Humps in front of Westview School H
7 R&T Tarring of all circles in Schauderville M
7 R&T Tarring and upgrading of Westview Drive W
7 R&T
Construction of Traffic Circle at intersection of Kestell and Rochelle Road, Perridgevale (Collegiate School)
H
7 R&T Traffic calming measures- Rumble strips in Worracker Str, Newton Park (3rd Avenue) W
7 R&T Glen Hurd Drive Upgrade W
7 R&T Construction of Link Road between Restitution and Glen Hurd Drive W
7 R&T Comprehensive Traffic Assessment for Newton Park H
7 R&T
Traffic calming measures:· Gerald Street, Newton Park· Handsworth Street, Glen Hurd· Hudson Street, Newton Park· Cecil Street, Newton Park· Kinnersley Street, Newton Park
W
7 R&T Sidewalks in Schauderville H
7 R&T Traffic calming (traffic circle / traffic lights) at Handsworth and 3rd Ave, Newton Park H
7 R&T Traffic calming (traffic lights) at Diaz and Kingston Road H7 PH Accommodation for 300 backyard dwellers (Erf 4335) H8 WARD 88 R&T Upgrade Circular Drive H
8 R&T Widening of Kragga Kamma Road H
8 R&T Sell IPTS busses M
8 R&T Upgrade of Montmedy Road in Lorraine H
8 R&T
Upgrading f Kabega Road between Kragga Kamma Road and the intersection of Kabega Road and Frikkie Kotze Drive, including the low water bridge between Jill Avenue and Frikkie Kotze Drive
H
10
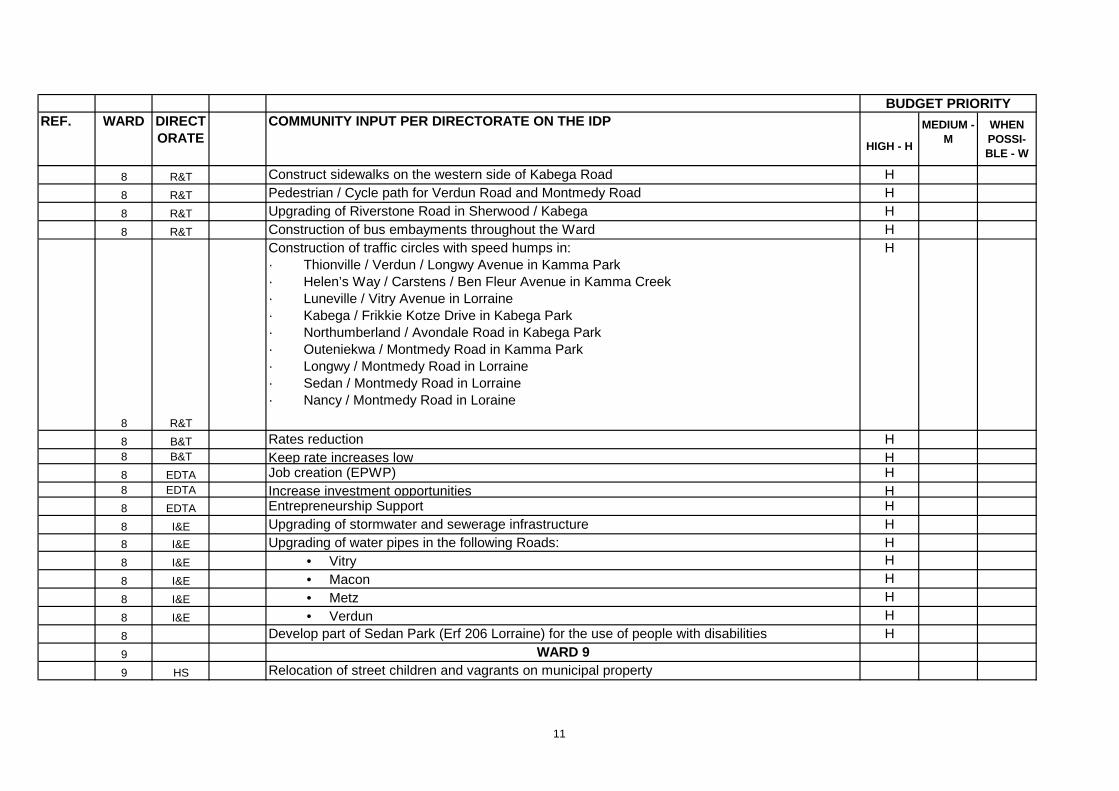
REF. WARD DIRECTORATE
COMMUNITY INPUT PER DIRECTORATE ON THE IDP
HIGH - H
MEDIUM - M
WHEN POSSI-BLE - W
BUDGET PRIORITY
8 R&T Construct sidewalks on the western side of Kabega Road H
8 R&T Pedestrian / Cycle path for Verdun Road and Montmedy Road H
8 R&T Upgrading of Riverstone Road in Sherwood / Kabega H
8 R&T Construction of bus embayments throughout the Ward H
8 R&T
Construction of traffic circles with speed humps in:· Thionville / Verdun / Longwy Avenue in Kamma Park· Helen’s Way / Carstens / Ben Fleur Avenue in Kamma Creek· Luneville / Vitry Avenue in Lorraine· Kabega / Frikkie Kotze Drive in Kabega Park· Northumberland / Avondale Road in Kabega Park· Outeniekwa / Montmedy Road in Kamma Park· Longwy / Montmedy Road in Lorraine· Sedan / Montmedy Road in Lorraine· Nancy / Montmedy Road in Loraine
H
8 B&T Rates reduction H8 B&T Keep rate increases low H8 EDTA Job creation (EPWP) H8 EDTA Increase investment opportunities H8 EDTA Entrepreneurship Support H
8 I&E Upgrading of stormwater and sewerage infrastructure H8 I&E Upgrading of water pipes in the following Roads: H8 I&E • Vitry H
8 I&E • Macon H
8 I&E • Metz H
8 I&E • Verdun H
8 Develop part of Sedan Park (Erf 206 Lorraine) for the use of people with disabilities H
9 WARD 99 HS Relocation of street children and vagrants on municipal property
11
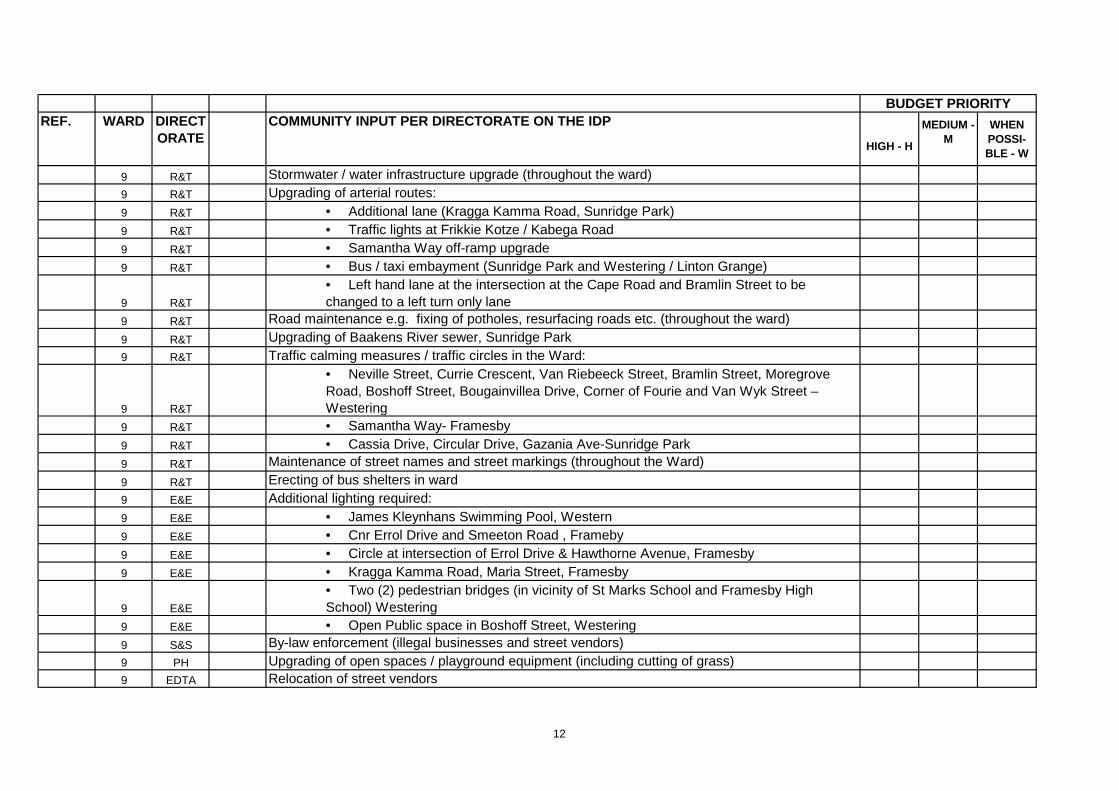
REF. WARD DIRECTORATE
COMMUNITY INPUT PER DIRECTORATE ON THE IDP
HIGH - H
MEDIUM - M
WHEN POSSI-BLE - W
BUDGET PRIORITY
9 R&T Stormwater / water infrastructure upgrade (throughout the ward)9 R&T Upgrading of arterial routes: 9 R&T • Additional lane (Kragga Kamma Road, Sunridge Park)9 R&T • Traffic lights at Frikkie Kotze / Kabega Road9 R&T • Samantha Way off-ramp upgrade9 R&T • Bus / taxi embayment (Sunridge Park and Westering / Linton Grange)
9 R&T
• Left hand lane at the intersection at the Cape Road and Bramlin Street to be changed to a left turn only lane
9 R&T Road maintenance e.g. fixing of potholes, resurfacing roads etc. (throughout the ward)
9 R&T Upgrading of Baakens River sewer, Sunridge Park9 R&T Traffic calming measures / traffic circles in the Ward:
9 R&T
• Neville Street, Currie Crescent, Van Riebeeck Street, Bramlin Street, Moregrove Road, Boshoff Street, Bougainvillea Drive, Corner of Fourie and Van Wyk Street – Westering
9 R&T • Samantha Way- Framesby9 R&T • Cassia Drive, Circular Drive, Gazania Ave-Sunridge Park9 R&T Maintenance of street names and street markings (throughout the Ward)
9 R&T Erecting of bus shelters in ward9 E&E Additional lighting required:9 E&E • James Kleynhans Swimming Pool, Western9 E&E • Cnr Errol Drive and Smeeton Road , Frameby9 E&E • Circle at intersection of Errol Drive & Hawthorne Avenue, Framesby9 E&E • Kragga Kamma Road, Maria Street, Framesby
9 E&E
• Two (2) pedestrian bridges (in vicinity of St Marks School and Framesby High School) Westering
9 E&E • Open Public space in Boshoff Street, Westering9 S&S By-law enforcement (illegal businesses and street vendors)9 PH Upgrading of open spaces / playground equipment (including cutting of grass)9 EDTA Relocation of street vendors
12
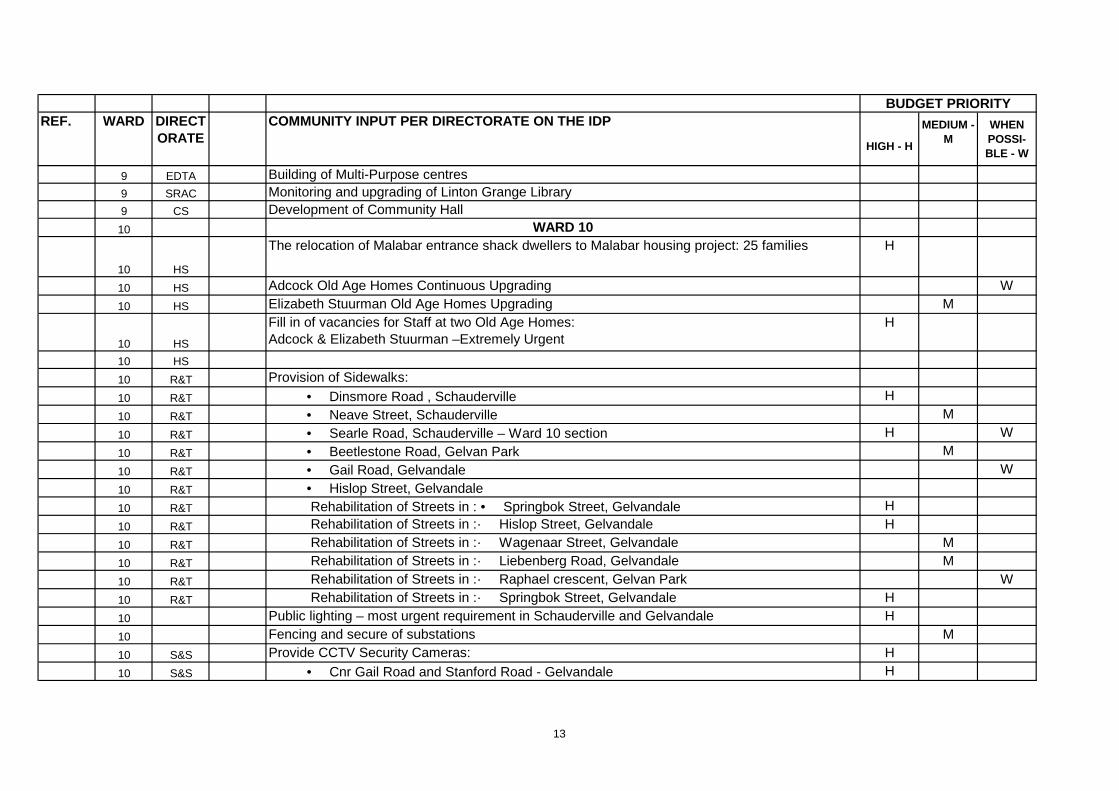
REF. WARD DIRECTORATE
COMMUNITY INPUT PER DIRECTORATE ON THE IDP
HIGH - H
MEDIUM - M
WHEN POSSI-BLE - W
BUDGET PRIORITY
9 EDTA Building of Multi-Purpose centres 9 SRAC Monitoring and upgrading of Linton Grange Library 9 CS Development of Community Hall
10 WARD 10
10 HS
The relocation of Malabar entrance shack dwellers to Malabar housing project: 25 families H
10 HS Adcock Old Age Homes Continuous Upgrading W
10 HS Elizabeth Stuurman Old Age Homes Upgrading M
10 HS
Fill in of vacancies for Staff at two Old Age Homes: Adcock & Elizabeth Stuurman –Extremely Urgent
H
10 HS
10 R&T Provision of Sidewalks: 10 R&T • Dinsmore Road , Schauderville H
10 R&T • Neave Street, Schauderville M
10 R&T • Searle Road, Schauderville – Ward 10 section H W
10 R&T • Beetlestone Road, Gelvan Park M
10 R&T • Gail Road, Gelvandale W
10 R&T • Hislop Street, Gelvandale10 R&T Rehabilitation of Streets in : • Springbok Street, Gelvandale H
10 R&T Rehabilitation of Streets in :· Hislop Street, Gelvandale H
10 R&T Rehabilitation of Streets in :· Wagenaar Street, Gelvandale M
10 R&T Rehabilitation of Streets in :· Liebenberg Road, Gelvandale M
10 R&T Rehabilitation of Streets in :· Raphael crescent, Gelvan Park W
10 R&T Rehabilitation of Streets in :· Springbok Street, Gelvandale H
10 Public lighting – most urgent requirement in Schauderville and Gelvandale H
10 Fencing and secure of substations M
10 S&S Provide CCTV Security Cameras: H
10 S&S • Cnr Gail Road and Stanford Road - Gelvandale H
13
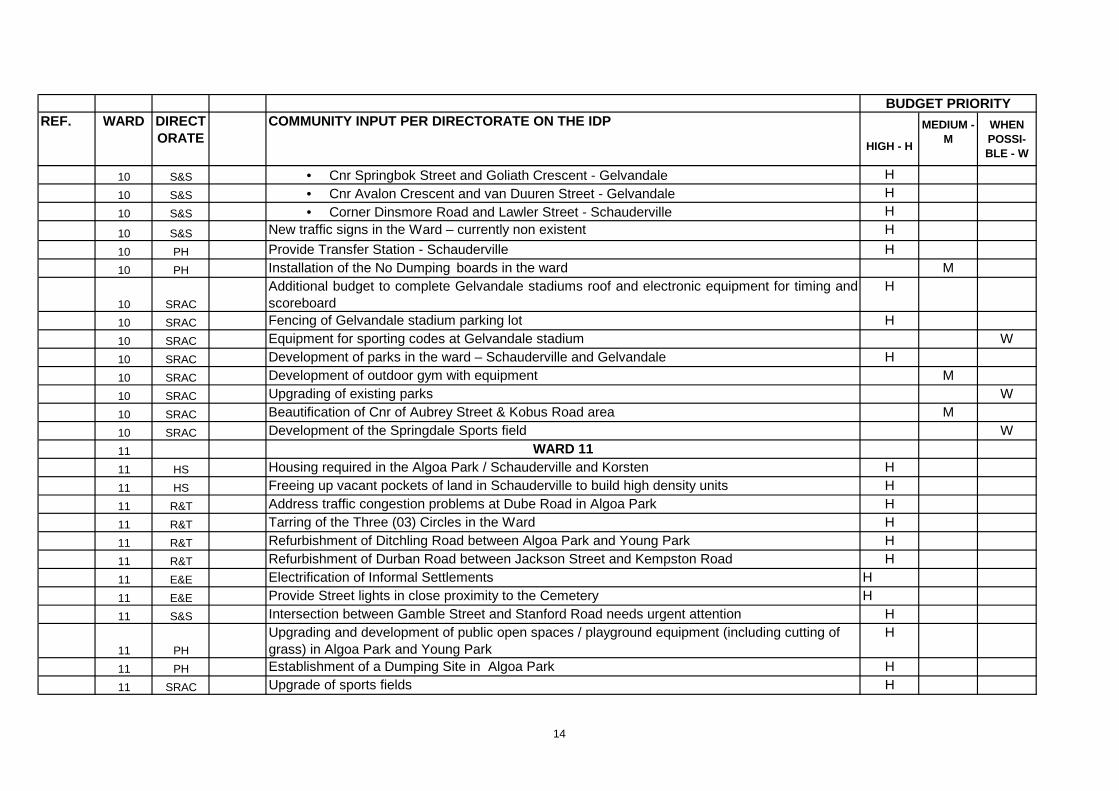
REF. WARD DIRECTORATE
COMMUNITY INPUT PER DIRECTORATE ON THE IDP
HIGH - H
MEDIUM - M
WHEN POSSI-BLE - W
BUDGET PRIORITY
10 S&S • Cnr Springbok Street and Goliath Crescent - Gelvandale H
10 S&S • Cnr Avalon Crescent and van Duuren Street - Gelvandale H
10 S&S • Corner Dinsmore Road and Lawler Street - Schauderville H
10 S&S New traffic signs in the Ward – currently non existent H
10 PH Provide Transfer Station - Schauderville H
10 PH Installation of the No Dumping boards in the ward M
10 SRAC
Additional budget to complete Gelvandale stadiums roof and electronic equipment for timing andscoreboard
H
10 SRAC Fencing of Gelvandale stadium parking lot H
10 SRAC Equipment for sporting codes at Gelvandale stadium W
10 SRAC Development of parks in the ward – Schauderville and Gelvandale H
10 SRAC Development of outdoor gym with equipment M
10 SRAC Upgrading of existing parks W
10 SRAC Beautification of Cnr of Aubrey Street & Kobus Road area M
10 SRAC Development of the Springdale Sports field W
11 WARD 1111 HS Housing required in the Algoa Park / Schauderville and Korsten H
11 HS Freeing up vacant pockets of land in Schauderville to build high density units H
11 R&T Address traffic congestion problems at Dube Road in Algoa Park H
11 R&T Tarring of the Three (03) Circles in the Ward H
11 R&T Refurbishment of Ditchling Road between Algoa Park and Young Park H
11 R&T Refurbishment of Durban Road between Jackson Street and Kempston Road H
11 E&E Electrification of Informal Settlements H
11 E&E Provide Street lights in close proximity to the Cemetery H
11 S&S Intersection between Gamble Street and Stanford Road needs urgent attention H
11 PH
Upgrading and development of public open spaces / playground equipment (including cutting of grass) in Algoa Park and Young Park
H
11 PH Establishment of a Dumping Site in Algoa Park H
11 SRAC Upgrade of sports fields H
14
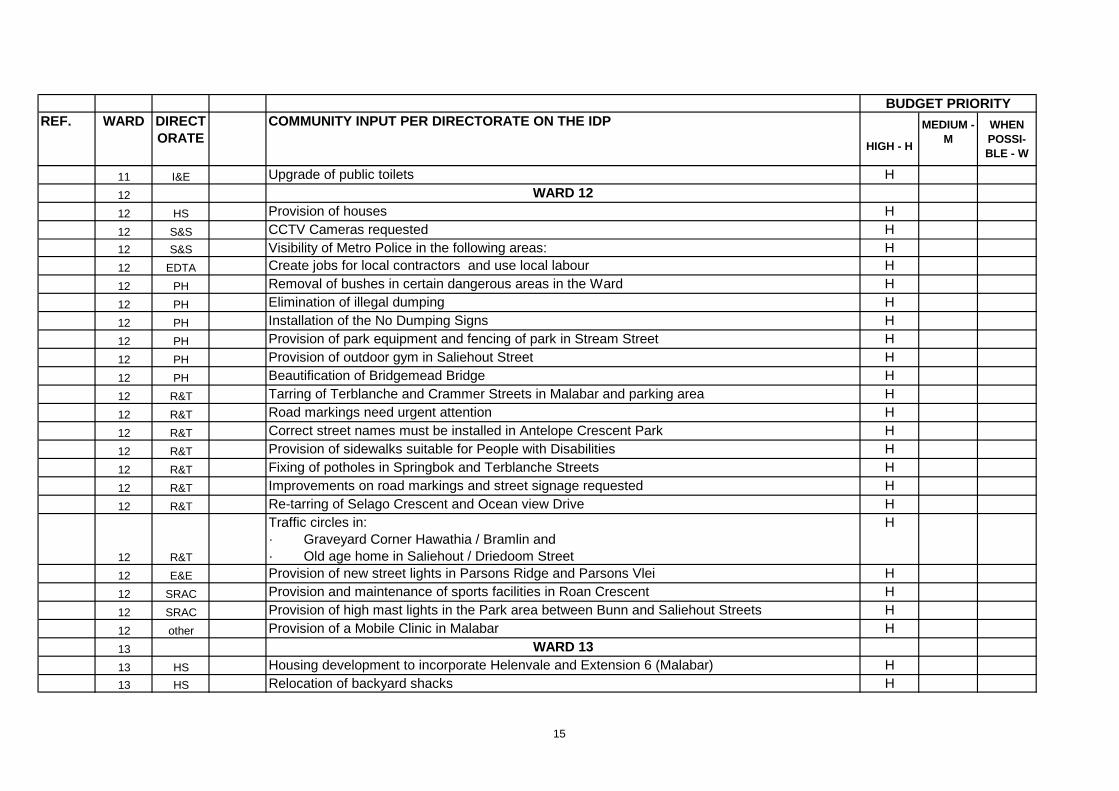
REF. WARD DIRECTORATE
COMMUNITY INPUT PER DIRECTORATE ON THE IDP
HIGH - H
MEDIUM - M
WHEN POSSI-BLE - W
BUDGET PRIORITY
11 I&E Upgrade of public toilets H
12 WARD 1212 HS Provision of houses H
12 S&S CCTV Cameras requested H12 S&S Visibility of Metro Police in the following areas: H12 EDTA Create jobs for local contractors and use local labour H
12 PH Removal of bushes in certain dangerous areas in the Ward H
12 PH Elimination of illegal dumping H
12 PH Installation of the No Dumping Signs H
12 PH Provision of park equipment and fencing of park in Stream Street H
12 PH Provision of outdoor gym in Saliehout Street H
12 PH Beautification of Bridgemead Bridge H
12 R&T Tarring of Terblanche and Crammer Streets in Malabar and parking area H
12 R&T Road markings need urgent attention H
12 R&T Correct street names must be installed in Antelope Crescent Park H
12 R&T Provision of sidewalks suitable for People with Disabilities H
12 R&T Fixing of potholes in Springbok and Terblanche Streets H
12 R&T Improvements on road markings and street signage requested H
12 R&T Re-tarring of Selago Crescent and Ocean view Drive H
12 R&T
Traffic circles in:· Graveyard Corner Hawathia / Bramlin and· Old age home in Saliehout / Driedoom Street
H
12 E&E Provision of new street lights in Parsons Ridge and Parsons Vlei H
12 SRAC Provision and maintenance of sports facilities in Roan Crescent H
12 SRAC Provision of high mast lights in the Park area between Bunn and Saliehout Streets H
12 other Provision of a Mobile Clinic in Malabar H
13 WARD 1313 HS Housing development to incorporate Helenvale and Extension 6 (Malabar) H13 HS Relocation of backyard shacks H
15
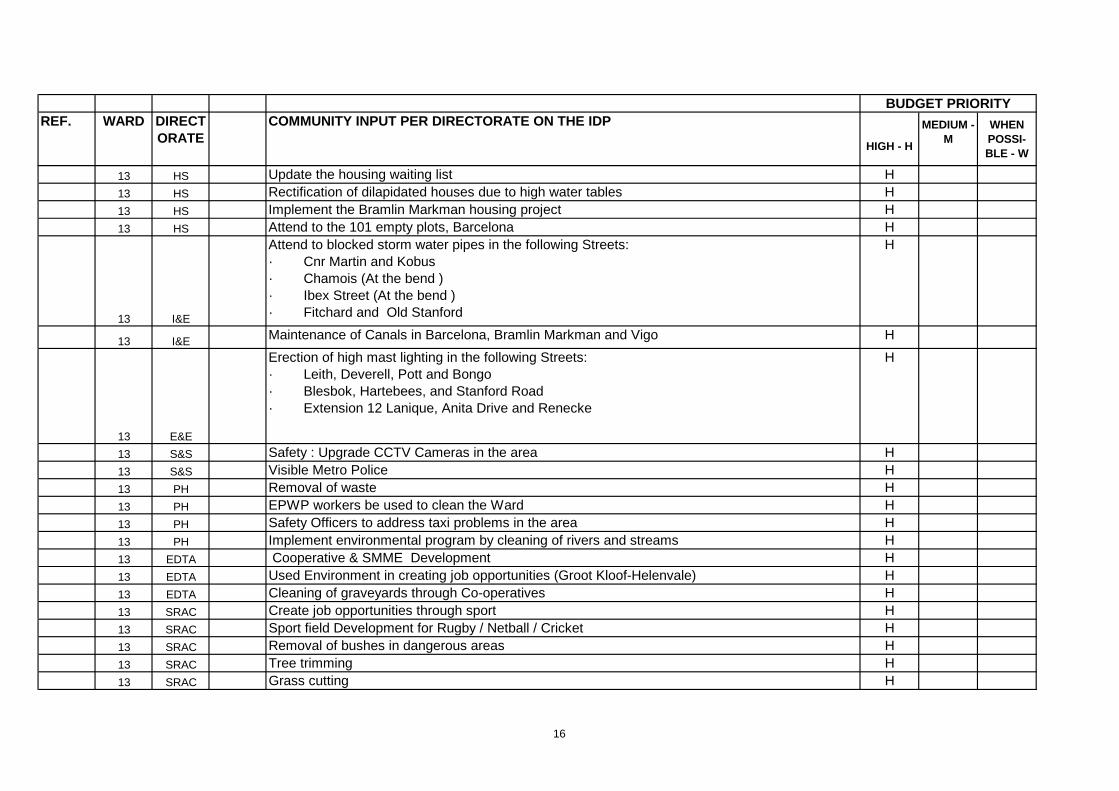
REF. WARD DIRECTORATE
COMMUNITY INPUT PER DIRECTORATE ON THE IDP
HIGH - H
MEDIUM - M
WHEN POSSI-BLE - W
BUDGET PRIORITY
13 HS Update the housing waiting list H13 HS Rectification of dilapidated houses due to high water tables H13 HS Implement the Bramlin Markman housing project H13 HS Attend to the 101 empty plots, Barcelona H
13 I&E
Attend to blocked storm water pipes in the following Streets:· Cnr Martin and Kobus · Chamois (At the bend )· Ibex Street (At the bend )· Fitchard and Old Stanford
H
13 I&E Maintenance of Canals in Barcelona, Bramlin Markman and Vigo H
13 E&E
Erection of high mast lighting in the following Streets:· Leith, Deverell, Pott and Bongo · Blesbok, Hartebees, and Stanford Road· Extension 12 Lanique, Anita Drive and Renecke
H
13 S&S Safety : Upgrade CCTV Cameras in the area H13 S&S Visible Metro Police H13 PH Removal of waste H13 PH EPWP workers be used to clean the Ward H13 PH Safety Officers to address taxi problems in the area H13 PH Implement environmental program by cleaning of rivers and streams H13 EDTA Cooperative & SMME Development H13 EDTA Used Environment in creating job opportunities (Groot Kloof-Helenvale) H13 EDTA Cleaning of graveyards through Co-operatives H13 SRAC Create job opportunities through sport H13 SRAC Sport field Development for Rugby / Netball / Cricket H13 SRAC Removal of bushes in dangerous areas H13 SRAC Tree trimming H13 SRAC Grass cutting H
16
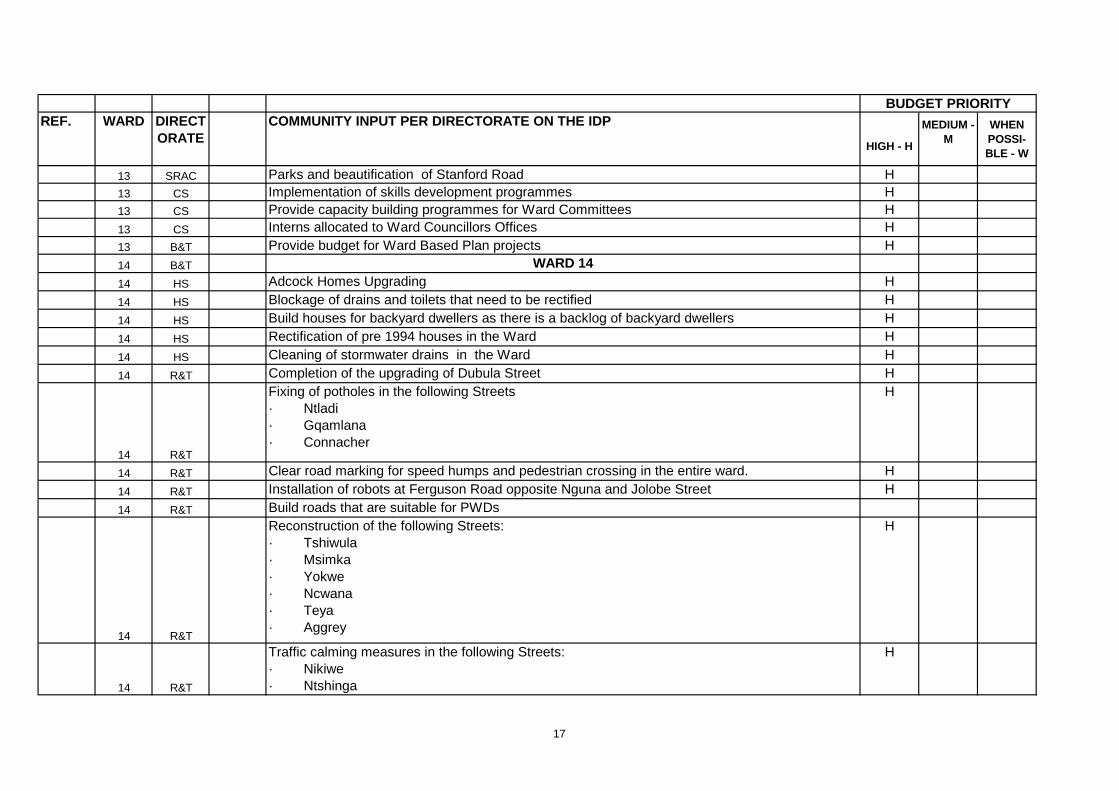
REF. WARD DIRECTORATE
COMMUNITY INPUT PER DIRECTORATE ON THE IDP
HIGH - H
MEDIUM - M
WHEN POSSI-BLE - W
BUDGET PRIORITY
13 SRAC Parks and beautification of Stanford Road H13 CS Implementation of skills development programmes H13 CS Provide capacity building programmes for Ward Committees H13 CS Interns allocated to Ward Councillors Offices H13 B&T Provide budget for Ward Based Plan projects H14 B&T WARD 1414 HS Adcock Homes Upgrading H
14 HS Blockage of drains and toilets that need to be rectified H
14 HS Build houses for backyard dwellers as there is a backlog of backyard dwellers H
14 HS Rectification of pre 1994 houses in the Ward H
14 HS Cleaning of stormwater drains in the Ward H
14 R&T Completion of the upgrading of Dubula Street H
14 R&T
Fixing of potholes in the following Streets· Ntladi· Gqamlana· Connacher
H
14 R&T Clear road marking for speed humps and pedestrian crossing in the entire ward. H
14 R&T Installation of robots at Ferguson Road opposite Nguna and Jolobe Street H
14 R&T Build roads that are suitable for PWDs
14 R&T
Reconstruction of the following Streets:· Tshiwula· Msimka· Yokwe· Ncwana· Teya· Aggrey
H
14 R&T
Traffic calming measures in the following Streets:· Nikiwe · Ntshinga
H
17
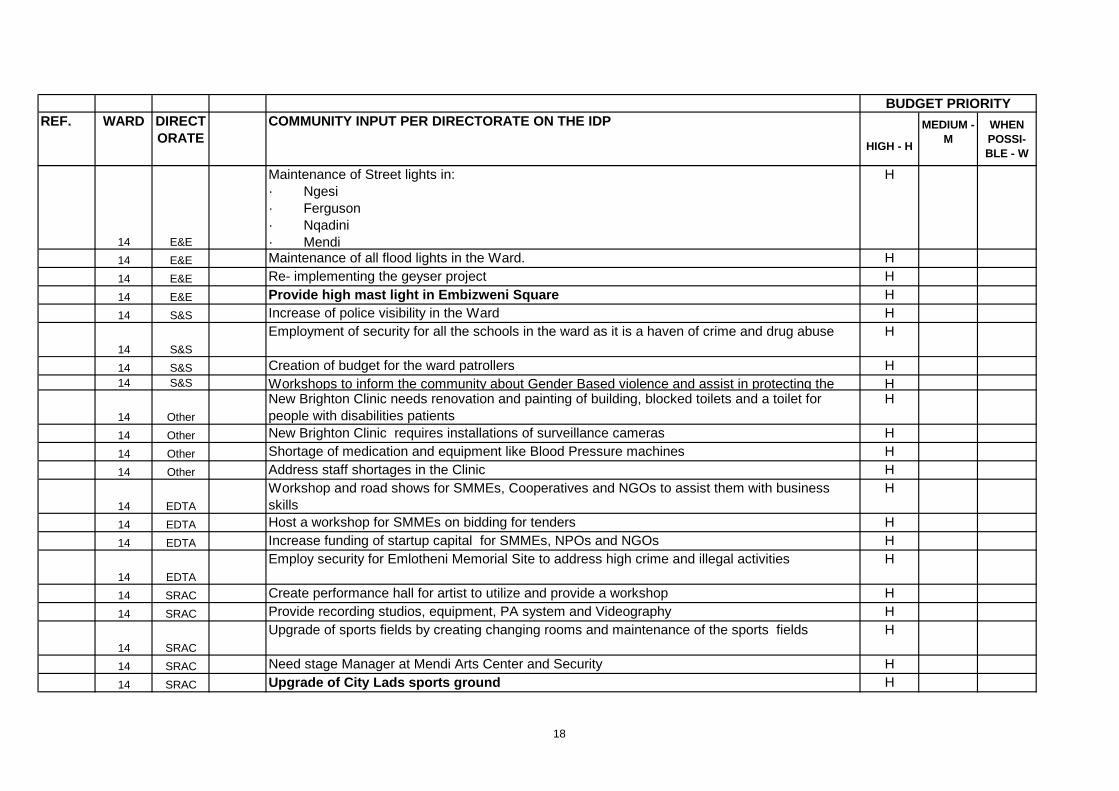
REF. WARD DIRECTORATE
COMMUNITY INPUT PER DIRECTORATE ON THE IDP
HIGH - H
MEDIUM - M
WHEN POSSI-BLE - W
BUDGET PRIORITY
14 E&E
Maintenance of Street lights in:· Ngesi· Ferguson· Nqadini· Mendi
H
14 E&E Maintenance of all flood lights in the Ward. H
14 E&E Re- implementing the geyser project H
14 E&E Provide high mast light in Embizweni Square H
14 S&S Increase of police visibility in the Ward H
14 S&S
Employment of security for all the schools in the ward as it is a haven of crime and drug abuse H
14 S&S Creation of budget for the ward patrollers H14 S&S Workshops to inform the community about Gender Based violence and assist in protecting the H
14 Other
New Brighton Clinic needs renovation and painting of building, blocked toilets and a toilet for people with disabilities patients
H
14 Other New Brighton Clinic requires installations of surveillance cameras H
14 Other Shortage of medication and equipment like Blood Pressure machines H
14 Other Address staff shortages in the Clinic H
14 EDTA
Workshop and road shows for SMMEs, Cooperatives and NGOs to assist them with business skills
H
14 EDTA Host a workshop for SMMEs on bidding for tenders H
14 EDTA Increase funding of startup capital for SMMEs, NPOs and NGOs H
14 EDTA
Employ security for Emlotheni Memorial Site to address high crime and illegal activities H
14 SRAC Create performance hall for artist to utilize and provide a workshop H
14 SRAC Provide recording studios, equipment, PA system and Videography H
14 SRAC
Upgrade of sports fields by creating changing rooms and maintenance of the sports fields H
14 SRAC Need stage Manager at Mendi Arts Center and Security H
14 SRAC Upgrade of City Lads sports ground H
18
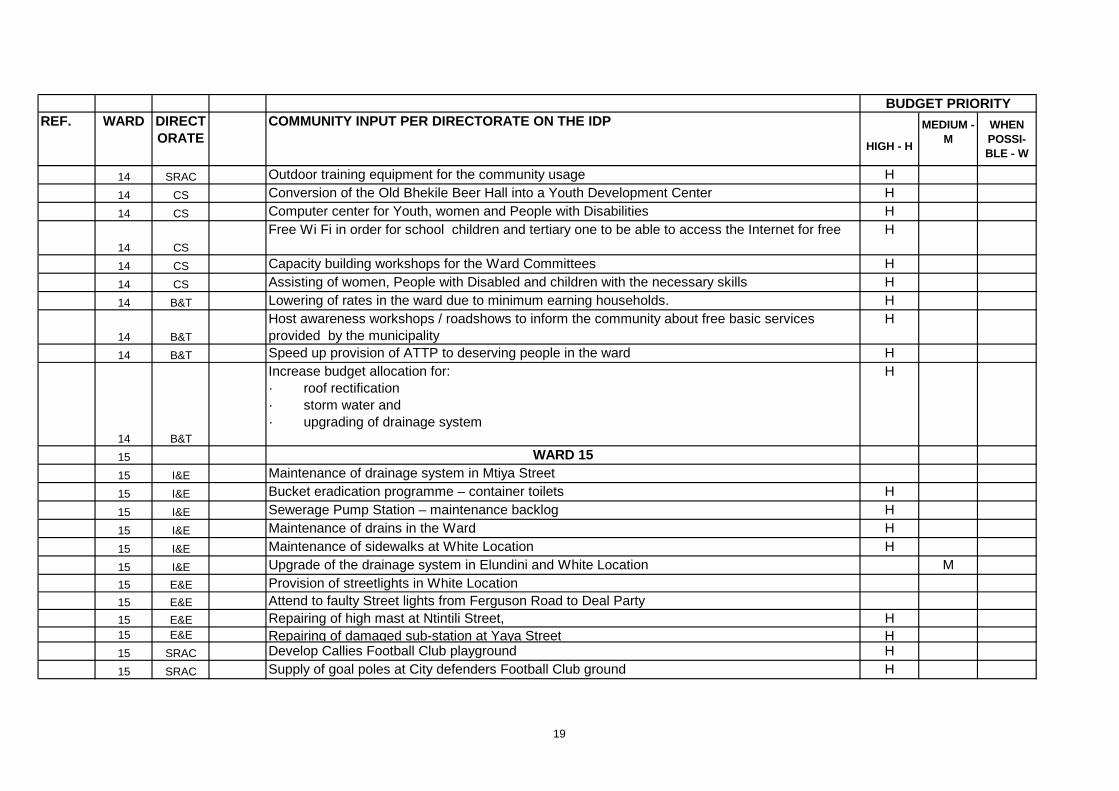
REF. WARD DIRECTORATE
COMMUNITY INPUT PER DIRECTORATE ON THE IDP
HIGH - H
MEDIUM - M
WHEN POSSI-BLE - W
BUDGET PRIORITY
14 SRAC Outdoor training equipment for the community usage H
14 CS Conversion of the Old Bhekile Beer Hall into a Youth Development Center H
14 CS Computer center for Youth, women and People with Disabilities H
14 CS
Free Wi Fi in order for school children and tertiary one to be able to access the Internet for free H
14 CS Capacity building workshops for the Ward Committees H
14 CS Assisting of women, People with Disabled and children with the necessary skills H
14 B&T Lowering of rates in the ward due to minimum earning households. H
14 B&T
Host awareness workshops / roadshows to inform the community about free basic services provided by the municipality
H
14 B&T Speed up provision of ATTP to deserving people in the ward H
14 B&T
Increase budget allocation for:· roof rectification· storm water and · upgrading of drainage system
H
15 WARD 1515 I&E Maintenance of drainage system in Mtiya Street
15 I&E Bucket eradication programme – container toilets H
15 I&E Sewerage Pump Station – maintenance backlog H
15 I&E Maintenance of drains in the Ward H
15 I&E Maintenance of sidewalks at White Location H
15 I&E Upgrade of the drainage system in Elundini and White Location M15 E&E Provision of streetlights in White Location15 E&E Attend to faulty Street lights from Ferguson Road to Deal Party15 E&E Repairing of high mast at Ntintili Street, H15 E&E Repairing of damaged sub-station at Yaya Street H15 SRAC Develop Callies Football Club playground H
15 SRAC Supply of goal poles at City defenders Football Club ground H
19
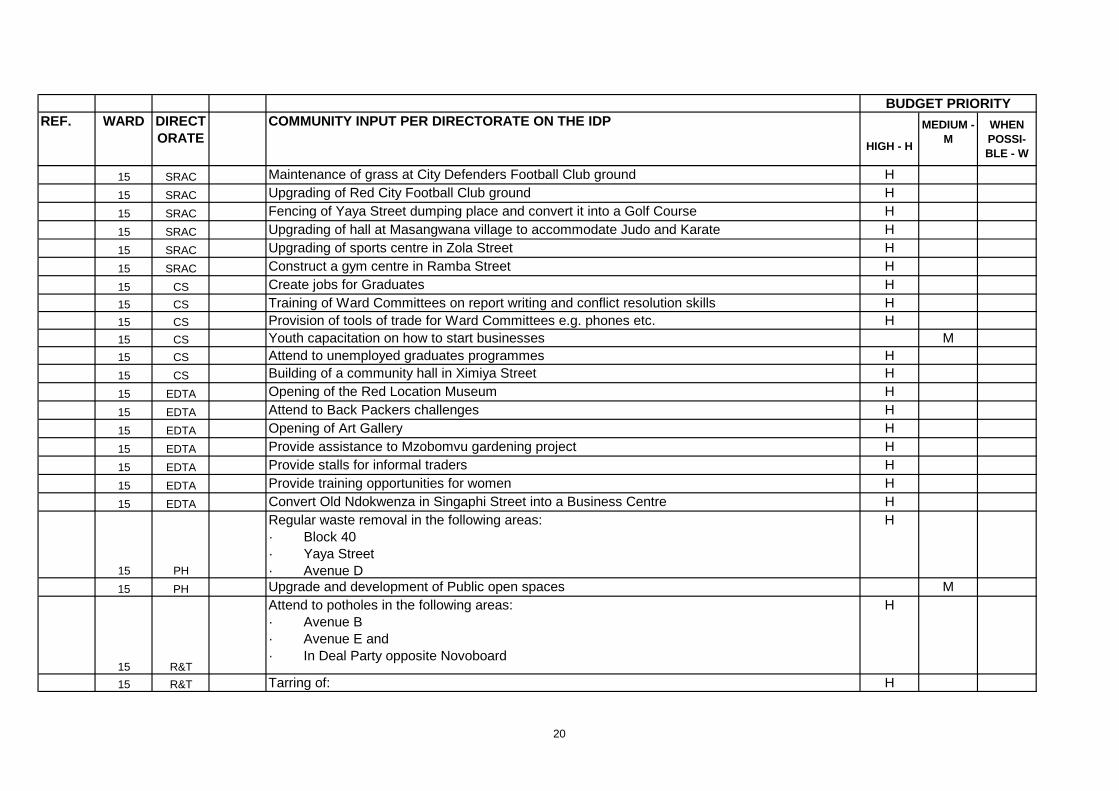
REF. WARD DIRECTORATE
COMMUNITY INPUT PER DIRECTORATE ON THE IDP
HIGH - H
MEDIUM - M
WHEN POSSI-BLE - W
BUDGET PRIORITY
15 SRAC Maintenance of grass at City Defenders Football Club ground H
15 SRAC Upgrading of Red City Football Club ground H
15 SRAC Fencing of Yaya Street dumping place and convert it into a Golf Course H
15 SRAC Upgrading of hall at Masangwana village to accommodate Judo and Karate H
15 SRAC Upgrading of sports centre in Zola Street H
15 SRAC Construct a gym centre in Ramba Street H
15 CS Create jobs for Graduates H15 CS Training of Ward Committees on report writing and conflict resolution skills H15 CS Provision of tools of trade for Ward Committees e.g. phones etc. H15 CS Youth capacitation on how to start businesses M15 CS Attend to unemployed graduates programmes H15 CS Building of a community hall in Ximiya Street H
15 EDTA Opening of the Red Location Museum H
15 EDTA Attend to Back Packers challenges H
15 EDTA Opening of Art Gallery H
15 EDTA Provide assistance to Mzobomvu gardening project H
15 EDTA Provide stalls for informal traders H
15 EDTA Provide training opportunities for women H
15 EDTA Convert Old Ndokwenza in Singaphi Street into a Business Centre H
15 PH
Regular waste removal in the following areas:· Block 40· Yaya Street· Avenue D
H
15 PH Upgrade and development of Public open spaces M
15 R&T
Attend to potholes in the following areas:· Avenue B· Avenue E and · In Deal Party opposite Novoboard
H
15 R&T Tarring of: H
20
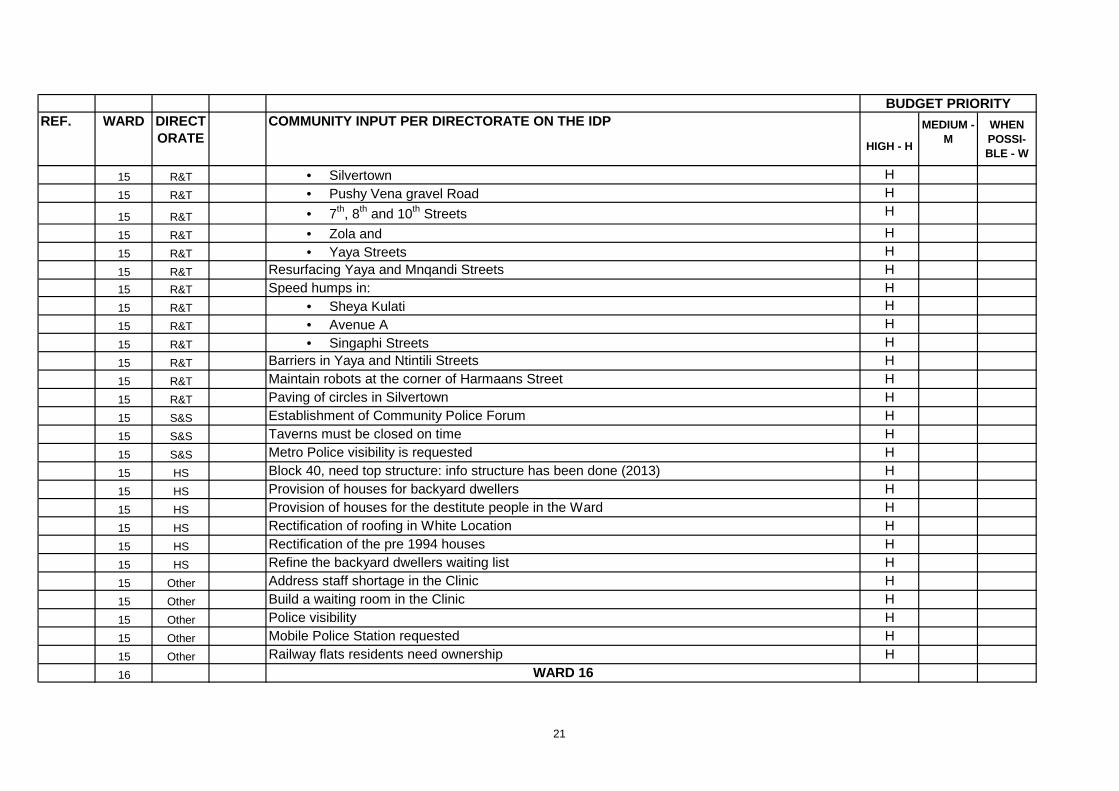
REF. WARD DIRECTORATE
COMMUNITY INPUT PER DIRECTORATE ON THE IDP
HIGH - H
MEDIUM - M
WHEN POSSI-BLE - W
BUDGET PRIORITY
15 R&T • Silvertown H
15 R&T • Pushy Vena gravel Road H
15 R&T • 7th, 8th and 10th Streets H
15 R&T • Zola and H
15 R&T • Yaya Streets H
15 R&T Resurfacing Yaya and Mnqandi Streets H15 R&T Speed humps in: H15 R&T • Sheya Kulati H
15 R&T • Avenue A H
15 R&T • Singaphi Streets H
15 R&T Barriers in Yaya and Ntintili Streets H
15 R&T Maintain robots at the corner of Harmaans Street H
15 R&T Paving of circles in Silvertown H
15 S&S Establishment of Community Police Forum H
15 S&S Taverns must be closed on time H
15 S&S Metro Police visibility is requested H
15 HS Block 40, need top structure: info structure has been done (2013) H
15 HS Provision of houses for backyard dwellers H
15 HS Provision of houses for the destitute people in the Ward H
15 HS Rectification of roofing in White Location H
15 HS Rectification of the pre 1994 houses H
15 HS Refine the backyard dwellers waiting list H
15 Other Address staff shortage in the Clinic H
15 Other Build a waiting room in the Clinic H
15 Other Police visibility H
15 Other Mobile Police Station requested H
15 Other Railway flats residents need ownership H
16 WARD 16
21
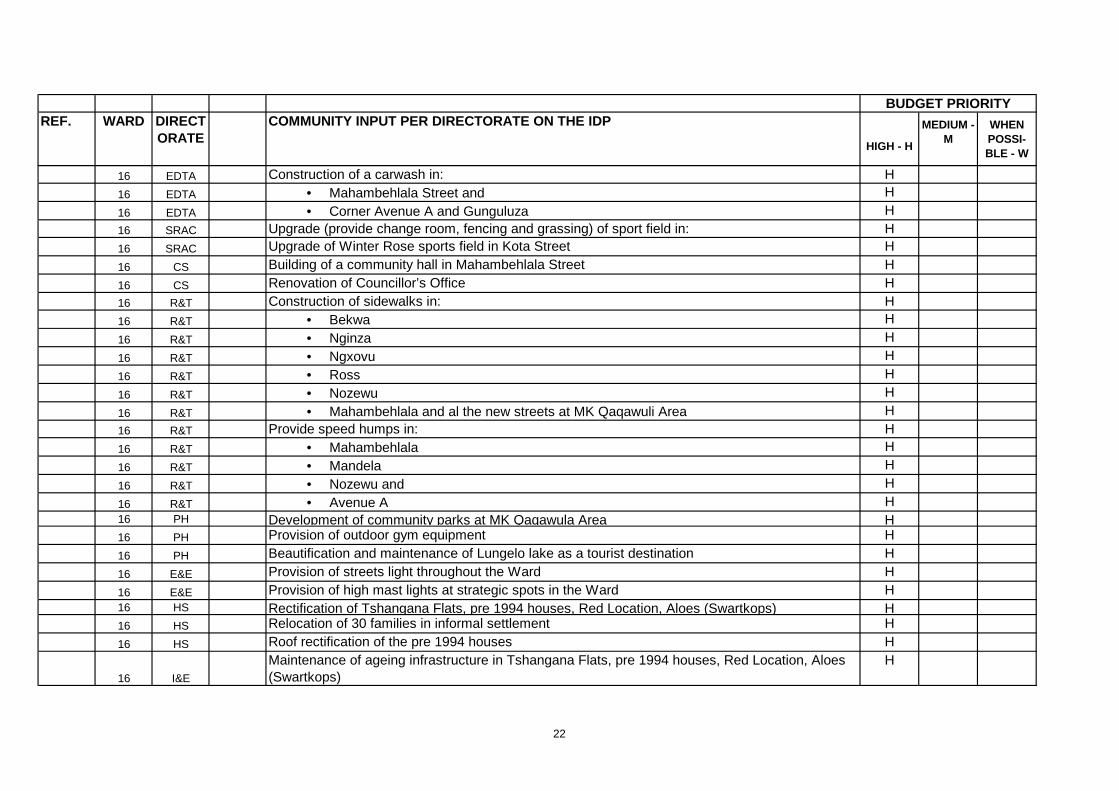
REF. WARD DIRECTORATE
COMMUNITY INPUT PER DIRECTORATE ON THE IDP
HIGH - H
MEDIUM - M
WHEN POSSI-BLE - W
BUDGET PRIORITY
16 EDTA Construction of a carwash in: H16 EDTA • Mahambehlala Street and H
16 EDTA • Corner Avenue A and Gunguluza H16 SRAC Upgrade (provide change room, fencing and grassing) of sport field in: H16 SRAC Upgrade of Winter Rose sports field in Kota Street H
16 CS Building of a community hall in Mahambehlala Street H
16 CS Renovation of Councillor’s Office H16 R&T Construction of sidewalks in: H16 R&T • Bekwa H
16 R&T • Nginza H
16 R&T • Ngxovu H
16 R&T • Ross H
16 R&T • Nozewu H
16 R&T • Mahambehlala and al the new streets at MK Qaqawuli Area H16 R&T Provide speed humps in: H16 R&T • Mahambehlala H
16 R&T • Mandela H
16 R&T • Nozewu and H
16 R&T • Avenue A H16 PH Development of community parks at MK Qaqawula Area H16 PH Provision of outdoor gym equipment H
16 PH Beautification and maintenance of Lungelo lake as a tourist destination H
16 E&E Provision of streets light throughout the Ward H
16 E&E Provision of high mast lights at strategic spots in the Ward H16 HS Rectification of Tshangana Flats, pre 1994 houses, Red Location, Aloes (Swartkops) H16 HS Relocation of 30 families in informal settlement H
16 HS Roof rectification of the pre 1994 houses H
16 I&E
Maintenance of ageing infrastructure in Tshangana Flats, pre 1994 houses, Red Location, Aloes (Swartkops)
H
22
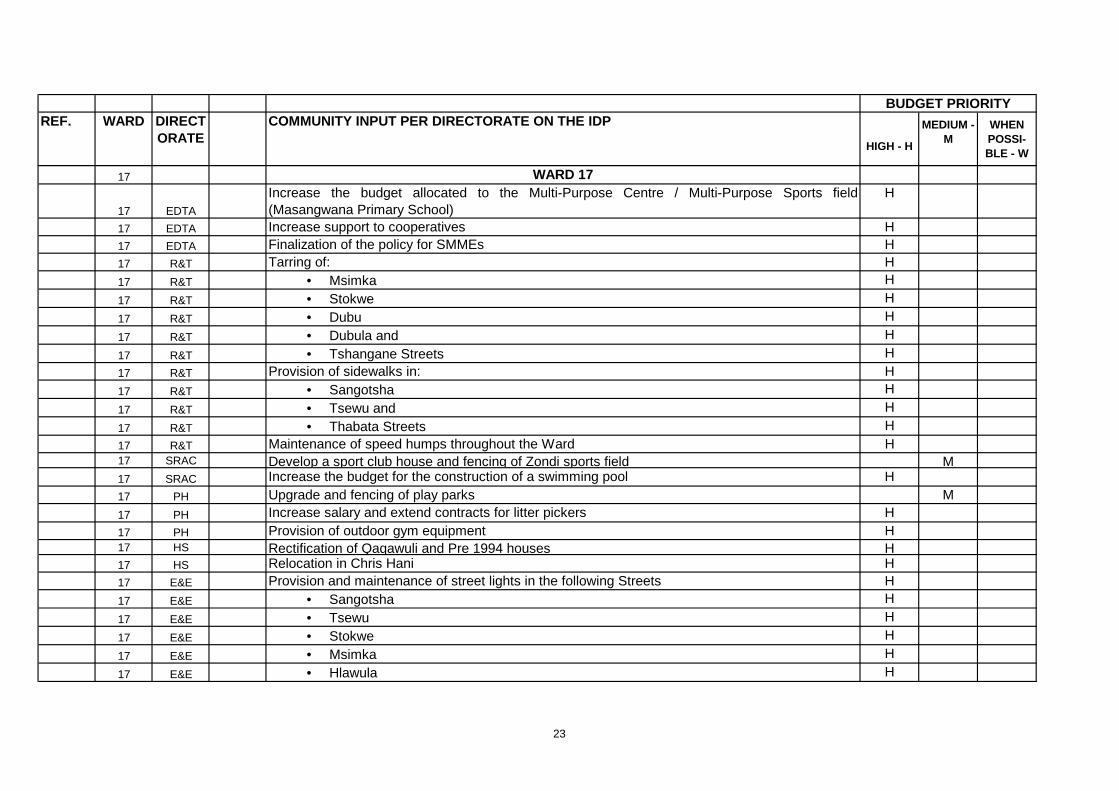
REF. WARD DIRECTORATE
COMMUNITY INPUT PER DIRECTORATE ON THE IDP
HIGH - H
MEDIUM - M
WHEN POSSI-BLE - W
BUDGET PRIORITY
17 WARD 17
17 EDTA
Increase the budget allocated to the Multi-Purpose Centre / Multi-Purpose Sports field(Masangwana Primary School)
H
17 EDTA Increase support to cooperatives H17 EDTA Finalization of the policy for SMMEs H17 R&T Tarring of: H17 R&T • Msimka H
17 R&T • Stokwe H
17 R&T • Dubu H
17 R&T • Dubula and H
17 R&T • Tshangane Streets H17 R&T Provision of sidewalks in: H17 R&T • Sangotsha H
17 R&T • Tsewu and H
17 R&T • Thabata Streets H17 R&T Maintenance of speed humps throughout the Ward H17 SRAC Develop a sport club house and fencing of Zondi sports field M17 SRAC Increase the budget for the construction of a swimming pool H17 PH Upgrade and fencing of play parks M17 PH Increase salary and extend contracts for litter pickers H17 PH Provision of outdoor gym equipment H17 HS Rectification of Qaqawuli and Pre 1994 houses H17 HS Relocation in Chris Hani H17 E&E Provision and maintenance of street lights in the following Streets H17 E&E • Sangotsha H
17 E&E • Tsewu H
17 E&E • Stokwe H
17 E&E • Msimka H
17 E&E • Hlawula H
23
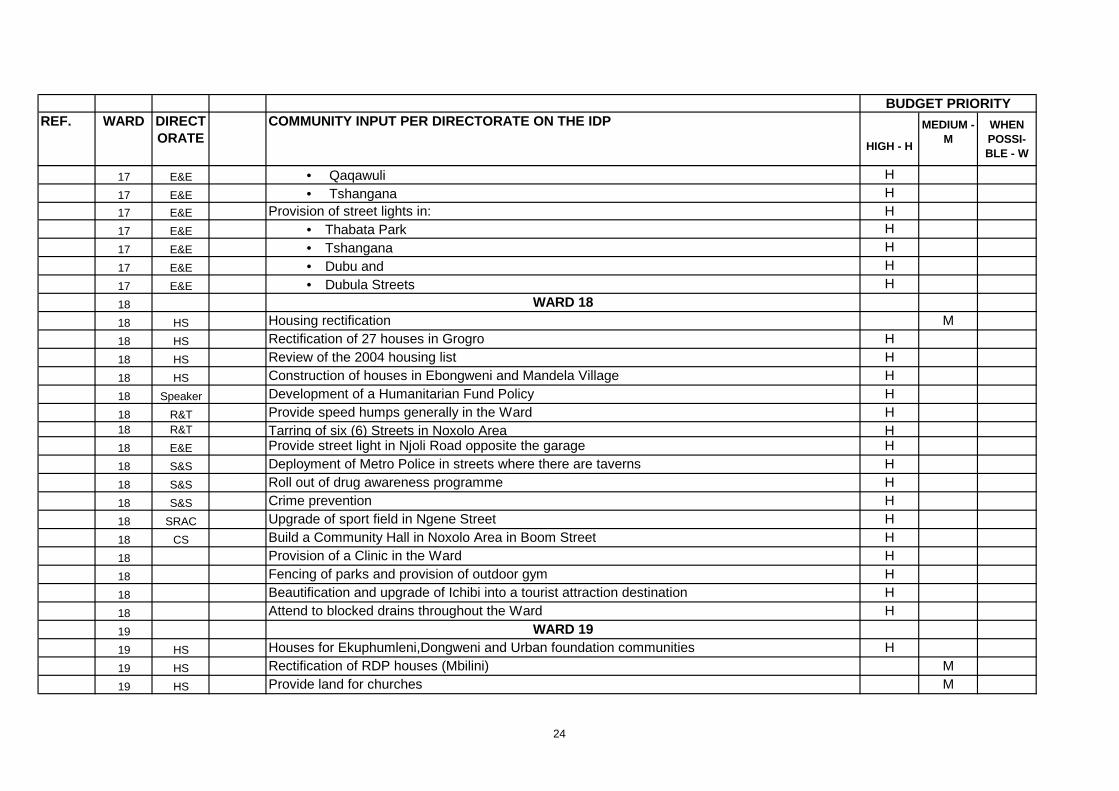
REF. WARD DIRECTORATE
COMMUNITY INPUT PER DIRECTORATE ON THE IDP
HIGH - H
MEDIUM - M
WHEN POSSI-BLE - W
BUDGET PRIORITY
17 E&E • Qaqawuli H
17 E&E • Tshangana H17 E&E Provision of street lights in: H17 E&E • Thabata Park H
17 E&E • Tshangana H
17 E&E • Dubu and H
17 E&E • Dubula Streets H
18 WARD 1818 HS Housing rectification M
18 HS Rectification of 27 houses in Grogro H
18 HS Review of the 2004 housing list H
18 HS Construction of houses in Ebongweni and Mandela Village H
18 Speaker Development of a Humanitarian Fund Policy H
18 R&T Provide speed humps generally in the Ward H18 R&T Tarring of six (6) Streets in Noxolo Area H18 E&E Provide street light in Njoli Road opposite the garage H
18 S&S Deployment of Metro Police in streets where there are taverns H
18 S&S Roll out of drug awareness programme H
18 S&S Crime prevention H
18 SRAC Upgrade of sport field in Ngene Street H
18 CS Build a Community Hall in Noxolo Area in Boom Street H
18 Provision of a Clinic in the Ward H
18 Fencing of parks and provision of outdoor gym H
18 Beautification and upgrade of Ichibi into a tourist attraction destination H
18 Attend to blocked drains throughout the Ward H
19 WARD 1919 HS Houses for Ekuphumleni,Dongweni and Urban foundation communities H
19 HS Rectification of RDP houses (Mbilini) M
19 HS Provide land for churches M
24
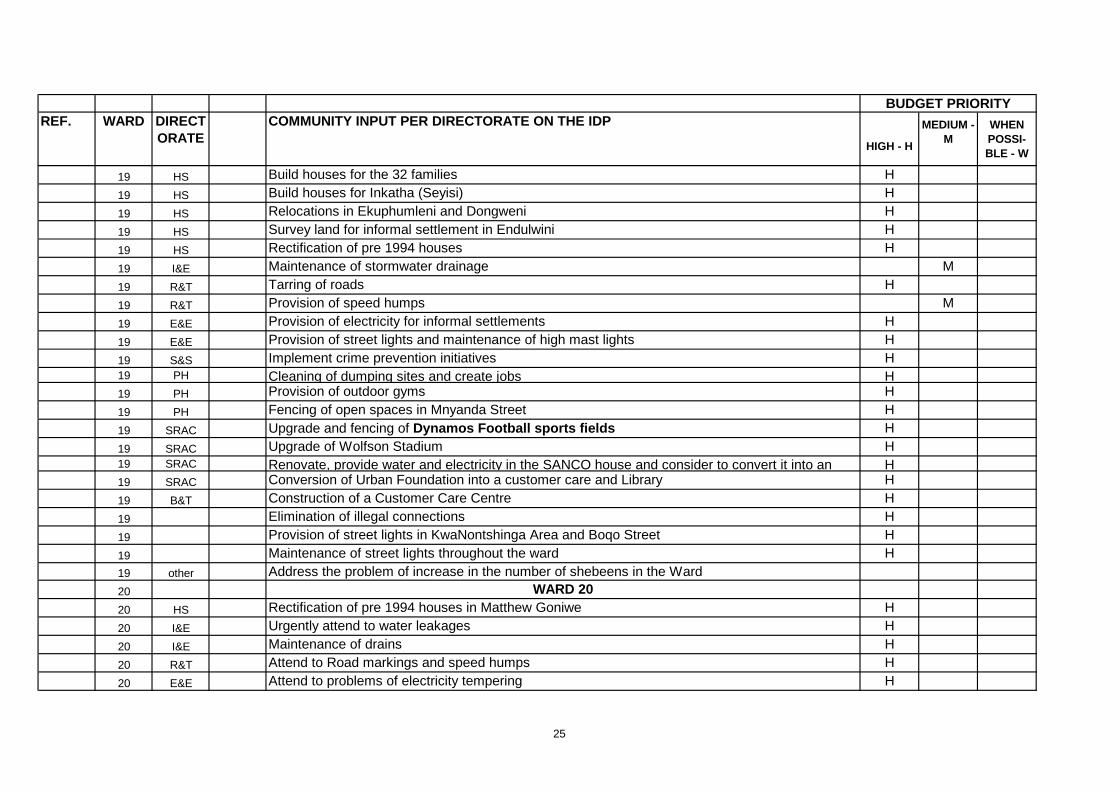
REF. WARD DIRECTORATE
COMMUNITY INPUT PER DIRECTORATE ON THE IDP
HIGH - H
MEDIUM - M
WHEN POSSI-BLE - W
BUDGET PRIORITY
19 HS Build houses for the 32 families H
19 HS Build houses for Inkatha (Seyisi) H
19 HS Relocations in Ekuphumleni and Dongweni H
19 HS Survey land for informal settlement in Endulwini H
19 HS Rectification of pre 1994 houses H
19 I&E Maintenance of stormwater drainage M
19 R&T Tarring of roads H
19 R&T Provision of speed humps M
19 E&E Provision of electricity for informal settlements H
19 E&E Provision of street lights and maintenance of high mast lights H
19 S&S Implement crime prevention initiatives H19 PH Cleaning of dumping sites and create jobs H19 PH Provision of outdoor gyms H
19 PH Fencing of open spaces in Mnyanda Street H
19 SRAC Upgrade and fencing of Dynamos Football sports fields H
19 SRAC Upgrade of Wolfson Stadium H19 SRAC Renovate, provide water and electricity in the SANCO house and consider to convert it into an H19 SRAC Conversion of Urban Foundation into a customer care and Library H
19 B&T Construction of a Customer Care Centre H
19 Elimination of illegal connections H
19 Provision of street lights in KwaNontshinga Area and Boqo Street H
19 Maintenance of street lights throughout the ward H19 other Address the problem of increase in the number of shebeens in the Ward20 WARD 2020 HS Rectification of pre 1994 houses in Matthew Goniwe H
20 I&E Urgently attend to water leakages H
20 I&E Maintenance of drains H
20 R&T Attend to Road markings and speed humps H
20 E&E Attend to problems of electricity tempering H
25
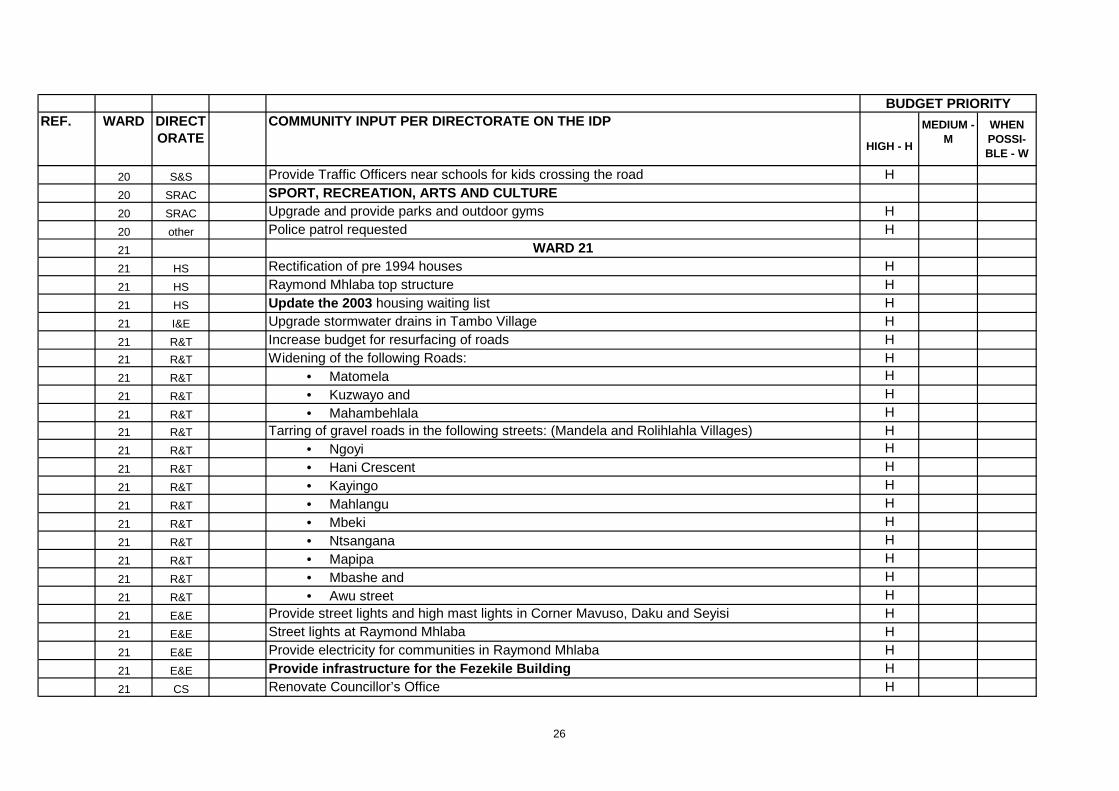
REF. WARD DIRECTORATE
COMMUNITY INPUT PER DIRECTORATE ON THE IDP
HIGH - H
MEDIUM - M
WHEN POSSI-BLE - W
BUDGET PRIORITY
20 S&S Provide Traffic Officers near schools for kids crossing the road H
20 SRAC SPORT, RECREATION, ARTS AND CULTURE20 SRAC Upgrade and provide parks and outdoor gyms H
20 other Police patrol requested H
21 WARD 2121 HS Rectification of pre 1994 houses H
21 HS Raymond Mhlaba top structure H
21 HS Update the 2003 housing waiting list H
21 I&E Upgrade stormwater drains in Tambo Village H
21 R&T Increase budget for resurfacing of roads H21 R&T Widening of the following Roads: H21 R&T • Matomela H
21 R&T • Kuzwayo and H
21 R&T • Mahambehlala H21 R&T Tarring of gravel roads in the following streets: (Mandela and Rolihlahla Villages) H21 R&T • Ngoyi H
21 R&T • Hani Crescent H
21 R&T • Kayingo H
21 R&T • Mahlangu H
21 R&T • Mbeki H
21 R&T • Ntsangana H
21 R&T • Mapipa H
21 R&T • Mbashe and H
21 R&T • Awu street H
21 E&E Provide street lights and high mast lights in Corner Mavuso, Daku and Seyisi H
21 E&E Street lights at Raymond Mhlaba H
21 E&E Provide electricity for communities in Raymond Mhlaba H
21 E&E Provide infrastructure for the Fezekile Building H
21 CS Renovate Councillor’s Office H
26
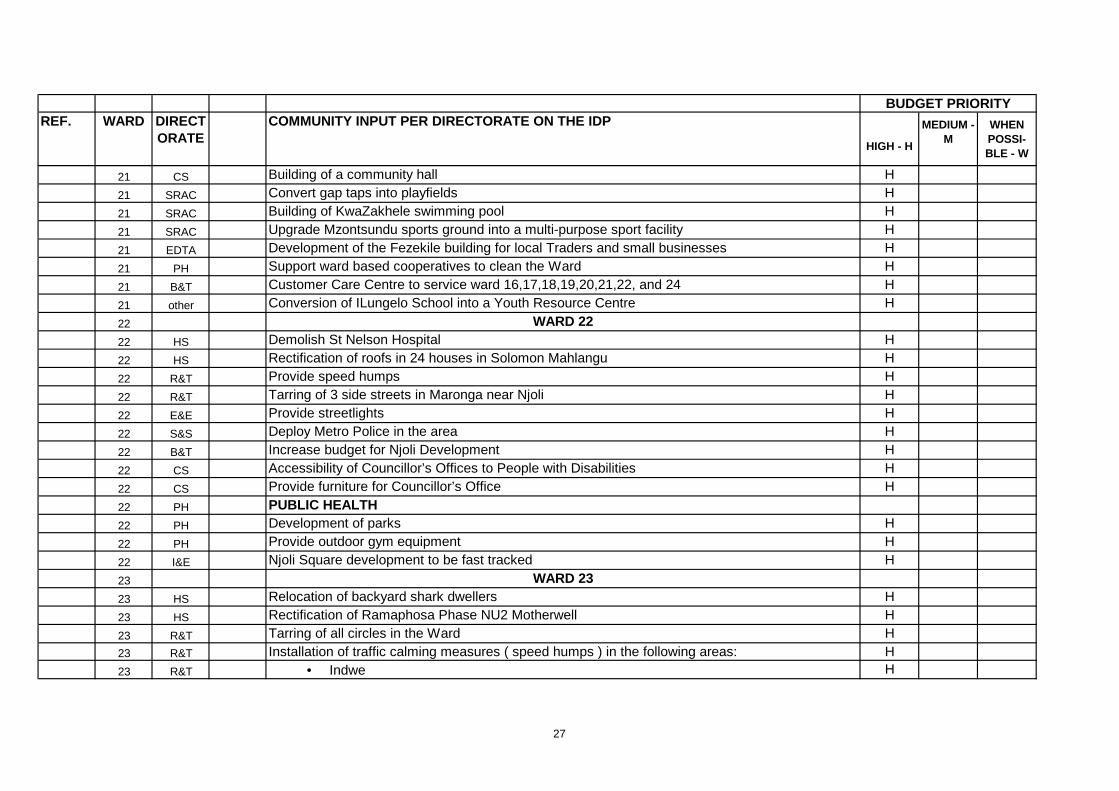
REF. WARD DIRECTORATE
COMMUNITY INPUT PER DIRECTORATE ON THE IDP
HIGH - H
MEDIUM - M
WHEN POSSI-BLE - W
BUDGET PRIORITY
21 CS Building of a community hall H
21 SRAC Convert gap taps into playfields H
21 SRAC Building of KwaZakhele swimming pool H
21 SRAC Upgrade Mzontsundu sports ground into a multi-purpose sport facility H
21 EDTA Development of the Fezekile building for local Traders and small businesses H
21 PH Support ward based cooperatives to clean the Ward H
21 B&T Customer Care Centre to service ward 16,17,18,19,20,21,22, and 24 H
21 other Conversion of ILungelo School into a Youth Resource Centre H
22 WARD 2222 HS Demolish St Nelson Hospital H
22 HS Rectification of roofs in 24 houses in Solomon Mahlangu H
22 R&T Provide speed humps H
22 R&T Tarring of 3 side streets in Maronga near Njoli H
22 E&E Provide streetlights H
22 S&S Deploy Metro Police in the area H
22 B&T Increase budget for Njoli Development H
22 CS Accessibility of Councillor’s Offices to People with Disabilities H
22 CS Provide furniture for Councillor’s Office H
22 PH PUBLIC HEALTH22 PH Development of parks H
22 PH Provide outdoor gym equipment H
22 I&E Njoli Square development to be fast tracked H
23 WARD 2323 HS Relocation of backyard shark dwellers H
23 HS Rectification of Ramaphosa Phase NU2 Motherwell H
23 R&T Tarring of all circles in the Ward H23 R&T Installation of traffic calming measures ( speed humps ) in the following areas: H23 R&T • Indwe H
27
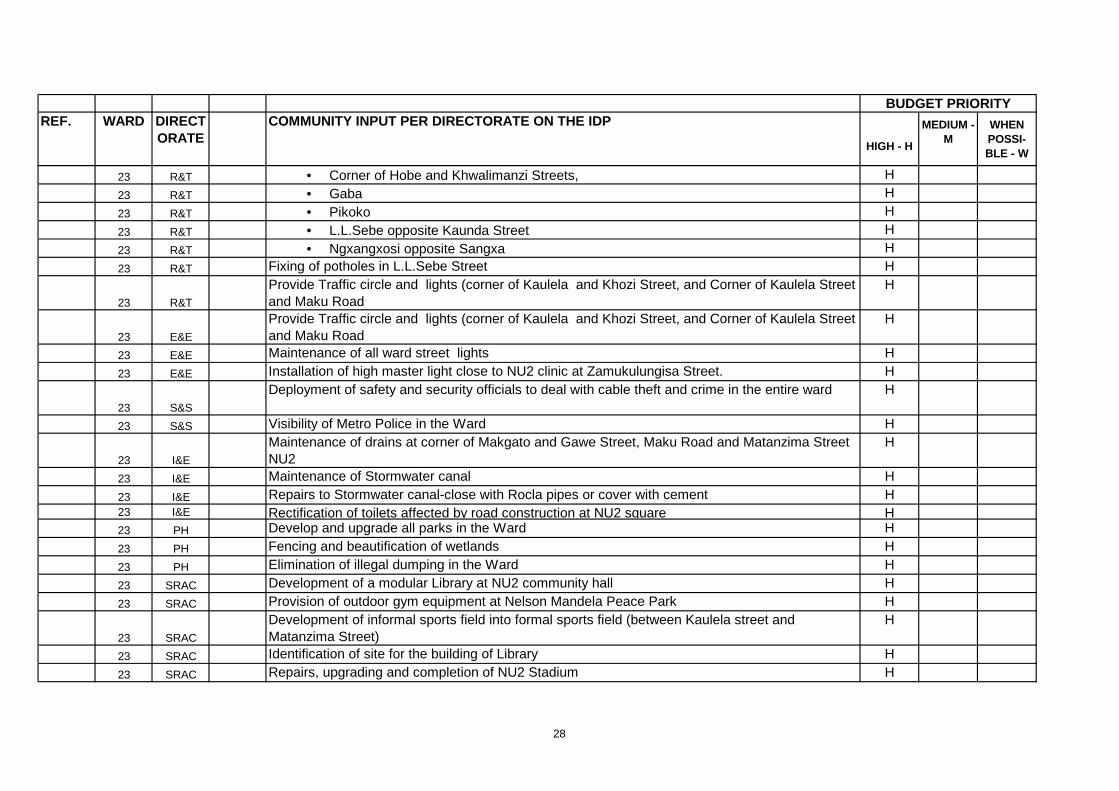
REF. WARD DIRECTORATE
COMMUNITY INPUT PER DIRECTORATE ON THE IDP
HIGH - H
MEDIUM - M
WHEN POSSI-BLE - W
BUDGET PRIORITY
23 R&T • Corner of Hobe and Khwalimanzi Streets, H
23 R&T • Gaba H
23 R&T • Pikoko H
23 R&T • L.L.Sebe opposite Kaunda Street H
23 R&T • Ngxangxosi opposite Sangxa H
23 R&T Fixing of potholes in L.L.Sebe Street H
23 R&T
Provide Traffic circle and lights (corner of Kaulela and Khozi Street, and Corner of Kaulela Street and Maku Road
H
23 E&E
Provide Traffic circle and lights (corner of Kaulela and Khozi Street, and Corner of Kaulela Street and Maku Road
H
23 E&E Maintenance of all ward street lights H
23 E&E Installation of high master light close to NU2 clinic at Zamukulungisa Street. H
23 S&S
Deployment of safety and security officials to deal with cable theft and crime in the entire ward H
23 S&S Visibility of Metro Police in the Ward H
23 I&E
Maintenance of drains at corner of Makgato and Gawe Street, Maku Road and Matanzima Street NU2
H
23 I&E Maintenance of Stormwater canal H
23 I&E Repairs to Stormwater canal-close with Rocla pipes or cover with cement H23 I&E Rectification of toilets affected by road construction at NU2 square H23 PH Develop and upgrade all parks in the Ward H
23 PH Fencing and beautification of wetlands H
23 PH Elimination of illegal dumping in the Ward H
23 SRAC Development of a modular Library at NU2 community hall H
23 SRAC Provision of outdoor gym equipment at Nelson Mandela Peace Park H
23 SRAC
Development of informal sports field into formal sports field (between Kaulela street and Matanzima Street)
H
23 SRAC Identification of site for the building of Library H
23 SRAC Repairs, upgrading and completion of NU2 Stadium H
28
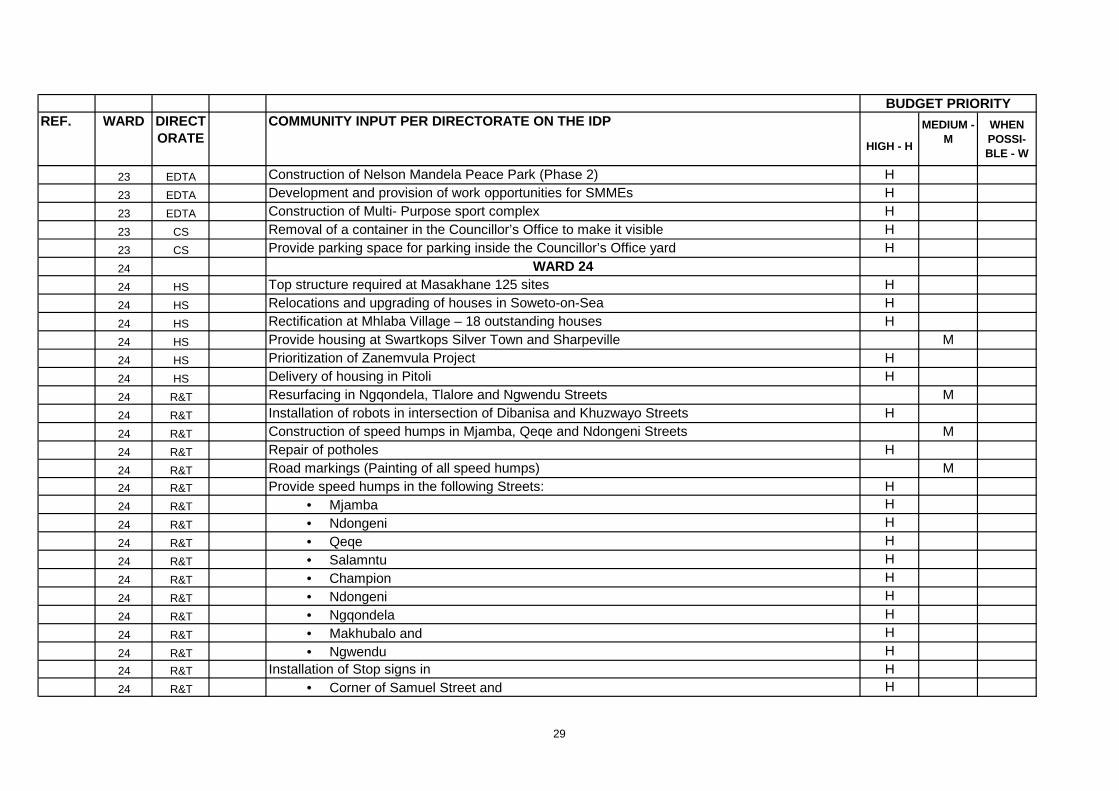
REF. WARD DIRECTORATE
COMMUNITY INPUT PER DIRECTORATE ON THE IDP
HIGH - H
MEDIUM - M
WHEN POSSI-BLE - W
BUDGET PRIORITY
23 EDTA Construction of Nelson Mandela Peace Park (Phase 2) H
23 EDTA Development and provision of work opportunities for SMMEs H
23 EDTA Construction of Multi- Purpose sport complex H
23 CS Removal of a container in the Councillor’s Office to make it visible H
23 CS Provide parking space for parking inside the Councillor’s Office yard H
24 WARD 2424 HS Top structure required at Masakhane 125 sites H
24 HS Relocations and upgrading of houses in Soweto-on-Sea H
24 HS Rectification at Mhlaba Village – 18 outstanding houses H
24 HS Provide housing at Swartkops Silver Town and Sharpeville M
24 HS Prioritization of Zanemvula Project H
24 HS Delivery of housing in Pitoli H
24 R&T Resurfacing in Ngqondela, Tlalore and Ngwendu Streets M
24 R&T Installation of robots in intersection of Dibanisa and Khuzwayo Streets H
24 R&T Construction of speed humps in Mjamba, Qeqe and Ndongeni Streets M
24 R&T Repair of potholes H
24 R&T Road markings (Painting of all speed humps) M24 R&T Provide speed humps in the following Streets: H24 R&T • Mjamba H
24 R&T • Ndongeni H
24 R&T • Qeqe H
24 R&T • Salamntu H
24 R&T • Champion H
24 R&T • Ndongeni H
24 R&T • Ngqondela H
24 R&T • Makhubalo and H
24 R&T • Ngwendu H24 R&T Installation of Stop signs in H24 R&T • Corner of Samuel Street and H
29
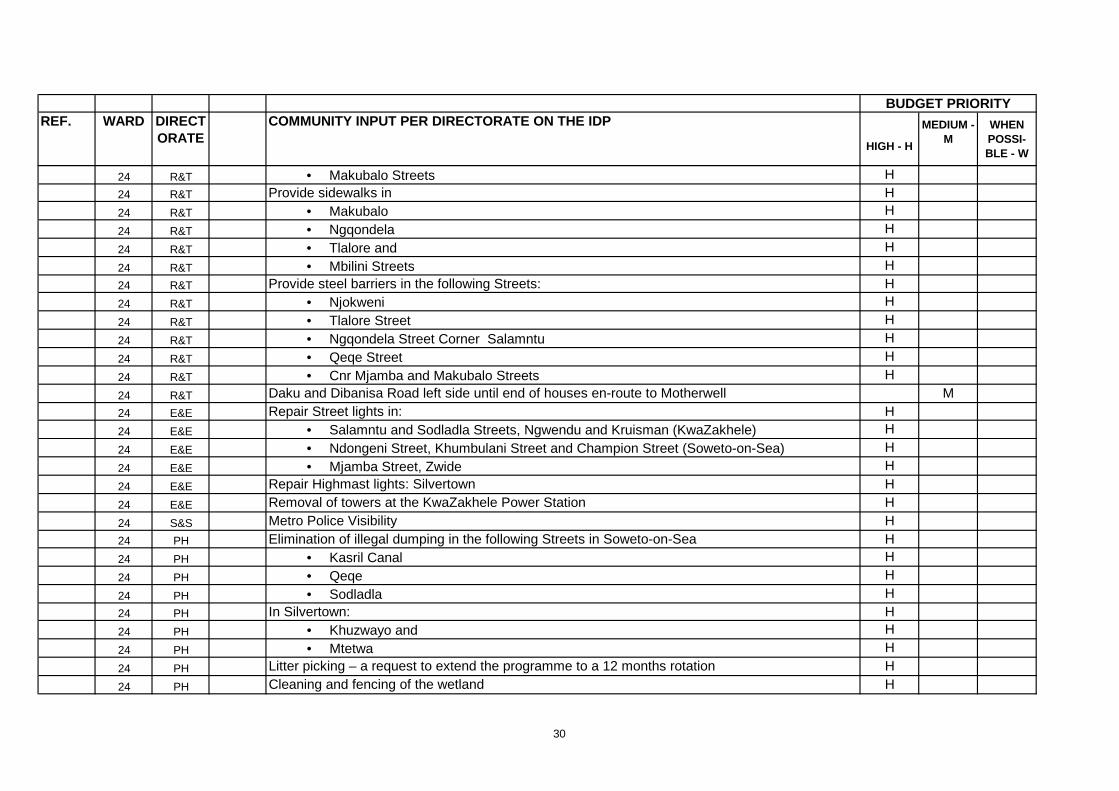
REF. WARD DIRECTORATE
COMMUNITY INPUT PER DIRECTORATE ON THE IDP
HIGH - H
MEDIUM - M
WHEN POSSI-BLE - W
BUDGET PRIORITY
24 R&T • Makubalo Streets H24 R&T Provide sidewalks in H24 R&T • Makubalo H
24 R&T • Ngqondela H
24 R&T • Tlalore and H
24 R&T • Mbilini Streets H24 R&T Provide steel barriers in the following Streets: H24 R&T • Njokweni H
24 R&T • Tlalore Street H
24 R&T • Ngqondela Street Corner Salamntu H
24 R&T • Qeqe Street H
24 R&T • Cnr Mjamba and Makubalo Streets H
24 R&T Daku and Dibanisa Road left side until end of houses en-route to Motherwell M24 E&E Repair Street lights in: H24 E&E • Salamntu and Sodladla Streets, Ngwendu and Kruisman (KwaZakhele) H
24 E&E • Ndongeni Street, Khumbulani Street and Champion Street (Soweto-on-Sea) H
24 E&E • Mjamba Street, Zwide H
24 E&E Repair Highmast lights: Silvertown H
24 E&E Removal of towers at the KwaZakhele Power Station H
24 S&S Metro Police Visibility H24 PH Elimination of illegal dumping in the following Streets in Soweto-on-Sea H24 PH • Kasril Canal H
24 PH • Qeqe H
24 PH • Sodladla H24 PH In Silvertown: H24 PH • Khuzwayo and H
24 PH • Mtetwa H
24 PH Litter picking – a request to extend the programme to a 12 months rotation H
24 PH Cleaning and fencing of the wetland H
30
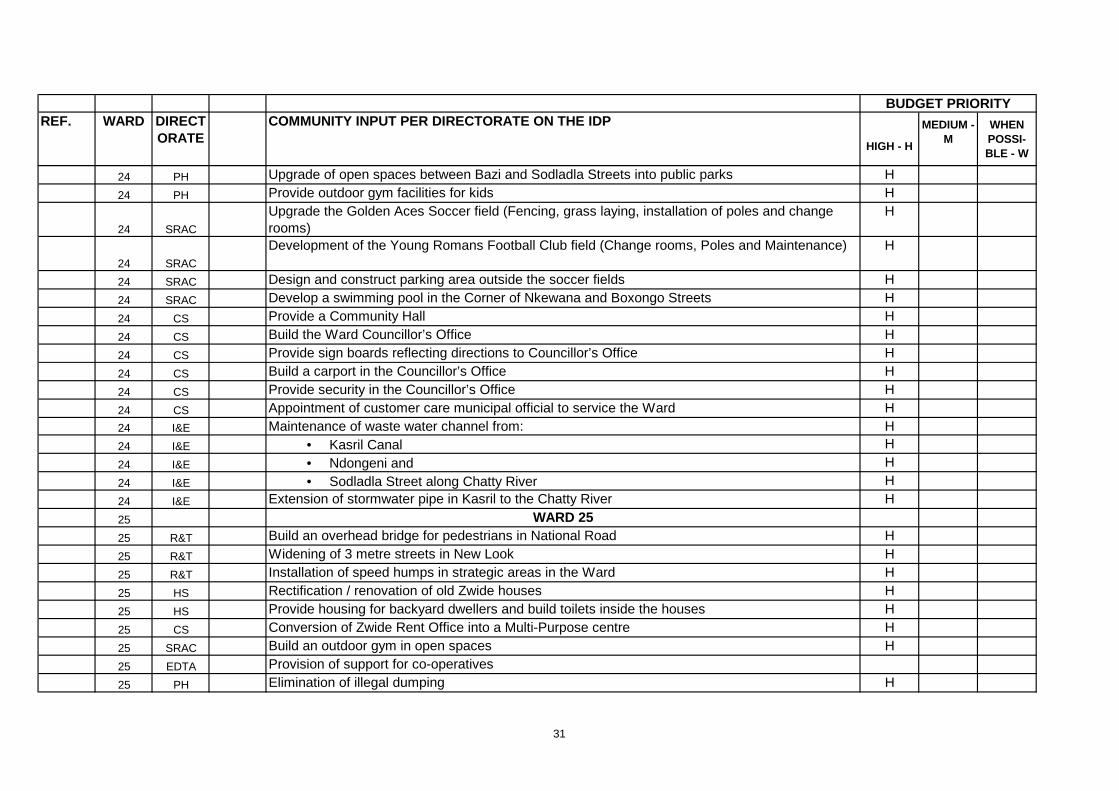
REF. WARD DIRECTORATE
COMMUNITY INPUT PER DIRECTORATE ON THE IDP
HIGH - H
MEDIUM - M
WHEN POSSI-BLE - W
BUDGET PRIORITY
24 PH Upgrade of open spaces between Bazi and Sodladla Streets into public parks H
24 PH Provide outdoor gym facilities for kids H
24 SRAC
Upgrade the Golden Aces Soccer field (Fencing, grass laying, installation of poles and change rooms)
H
24 SRAC
Development of the Young Romans Football Club field (Change rooms, Poles and Maintenance) H
24 SRAC Design and construct parking area outside the soccer fields H
24 SRAC Develop a swimming pool in the Corner of Nkewana and Boxongo Streets H
24 CS Provide a Community Hall H
24 CS Build the Ward Councillor’s Office H
24 CS Provide sign boards reflecting directions to Councillor’s Office H
24 CS Build a carport in the Councillor’s Office H
24 CS Provide security in the Councillor’s Office H
24 CS Appointment of customer care municipal official to service the Ward H24 I&E Maintenance of waste water channel from: H24 I&E • Kasril Canal H
24 I&E • Ndongeni and H
24 I&E • Sodladla Street along Chatty River H
24 I&E Extension of stormwater pipe in Kasril to the Chatty River H
25 WARD 2525 R&T Build an overhead bridge for pedestrians in National Road H
25 R&T Widening of 3 metre streets in New Look H
25 R&T Installation of speed humps in strategic areas in the Ward H
25 HS Rectification / renovation of old Zwide houses H
25 HS Provide housing for backyard dwellers and build toilets inside the houses H
25 CS Conversion of Zwide Rent Office into a Multi-Purpose centre H
25 SRAC Build an outdoor gym in open spaces H
25 EDTA Provision of support for co-operatives
25 PH Elimination of illegal dumping H
31
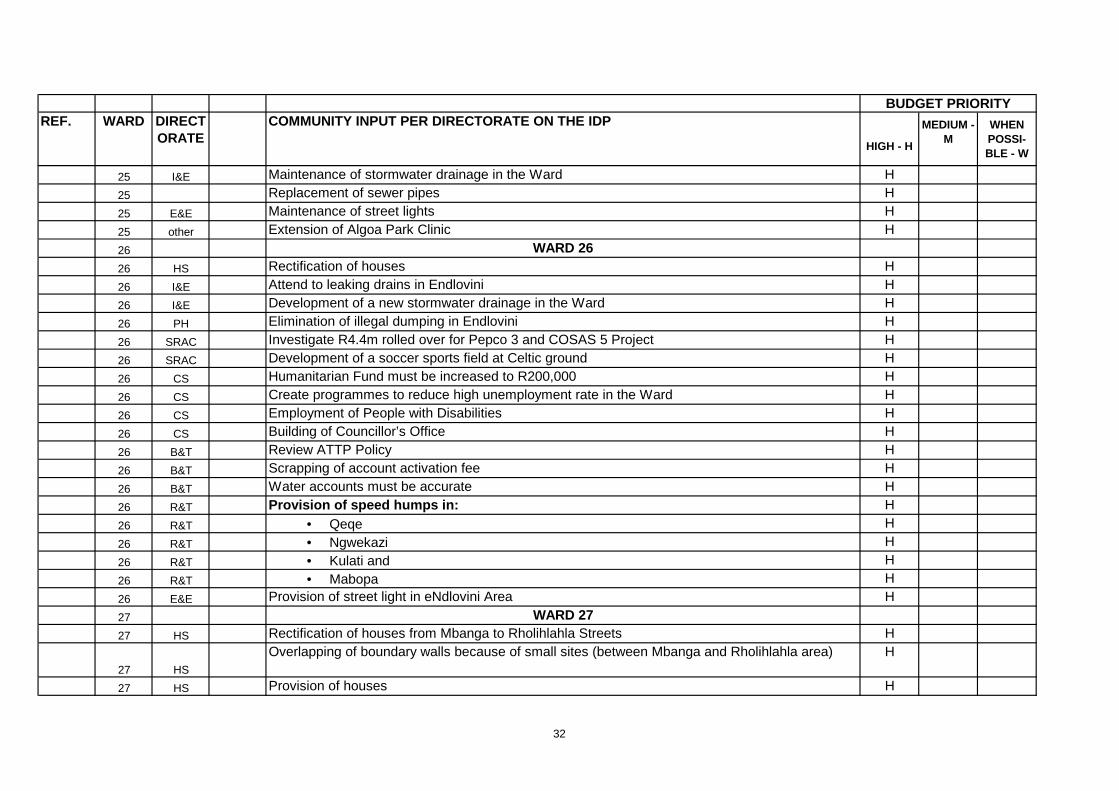
REF. WARD DIRECTORATE
COMMUNITY INPUT PER DIRECTORATE ON THE IDP
HIGH - H
MEDIUM - M
WHEN POSSI-BLE - W
BUDGET PRIORITY
25 I&E Maintenance of stormwater drainage in the Ward H
25 Replacement of sewer pipes H
25 E&E Maintenance of street lights H
25 other Extension of Algoa Park Clinic H
26 WARD 2626 HS Rectification of houses H
26 I&E Attend to leaking drains in Endlovini H
26 I&E Development of a new stormwater drainage in the Ward H
26 PH Elimination of illegal dumping in Endlovini H
26 SRAC Investigate R4.4m rolled over for Pepco 3 and COSAS 5 Project H
26 SRAC Development of a soccer sports field at Celtic ground H
26 CS Humanitarian Fund must be increased to R200,000 H
26 CS Create programmes to reduce high unemployment rate in the Ward H
26 CS Employment of People with Disabilities H
26 CS Building of Councillor’s Office H
26 B&T Review ATTP Policy H
26 B&T Scrapping of account activation fee H
26 B&T Water accounts must be accurate H
26 R&T Provision of speed humps in: H
26 R&T • Qeqe H
26 R&T • Ngwekazi H
26 R&T • Kulati and H
26 R&T • Mabopa H
26 E&E Provision of street light in eNdlovini Area H
27 WARD 2727 HS Rectification of houses from Mbanga to Rholihlahla Streets H
27 HS
Overlapping of boundary walls because of small sites (between Mbanga and Rholihlahla area) H
27 HS Provision of houses H
32
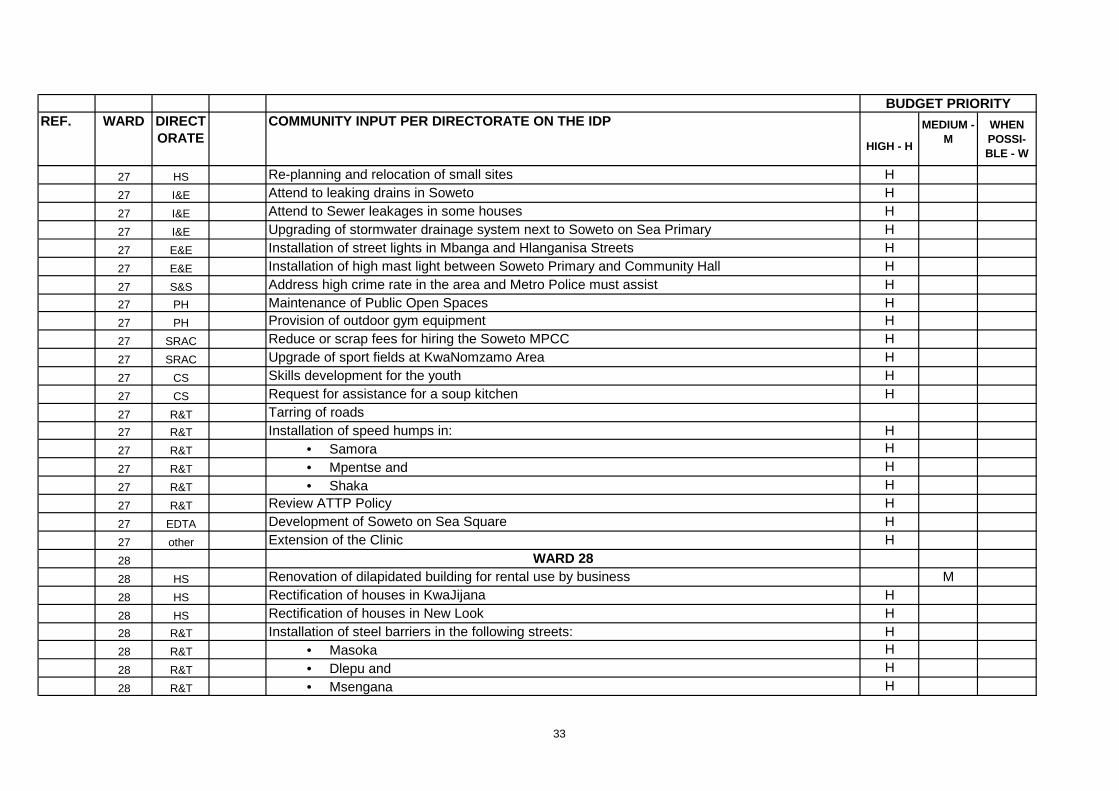
REF. WARD DIRECTORATE
COMMUNITY INPUT PER DIRECTORATE ON THE IDP
HIGH - H
MEDIUM - M
WHEN POSSI-BLE - W
BUDGET PRIORITY
27 HS Re-planning and relocation of small sites H
27 I&E Attend to leaking drains in Soweto H
27 I&E Attend to Sewer leakages in some houses H
27 I&E Upgrading of stormwater drainage system next to Soweto on Sea Primary H
27 E&E Installation of street lights in Mbanga and Hlanganisa Streets H
27 E&E Installation of high mast light between Soweto Primary and Community Hall H
27 S&S Address high crime rate in the area and Metro Police must assist H27 PH Maintenance of Public Open Spaces H27 PH Provision of outdoor gym equipment H
27 SRAC Reduce or scrap fees for hiring the Soweto MPCC H
27 SRAC Upgrade of sport fields at KwaNomzamo Area H
27 CS Skills development for the youth H
27 CS Request for assistance for a soup kitchen H
27 R&T Tarring of roads27 R&T Installation of speed humps in: H27 R&T • Samora H
27 R&T • Mpentse and H
27 R&T • Shaka H
27 R&T Review ATTP Policy H
27 EDTA Development of Soweto on Sea Square H
27 other Extension of the Clinic H
28 WARD 2828 HS Renovation of dilapidated building for rental use by business M
28 HS Rectification of houses in KwaJijana H
28 HS Rectification of houses in New Look H28 R&T Installation of steel barriers in the following streets: H28 R&T • Masoka H
28 R&T • Dlepu and H
28 R&T • Msengana H
33
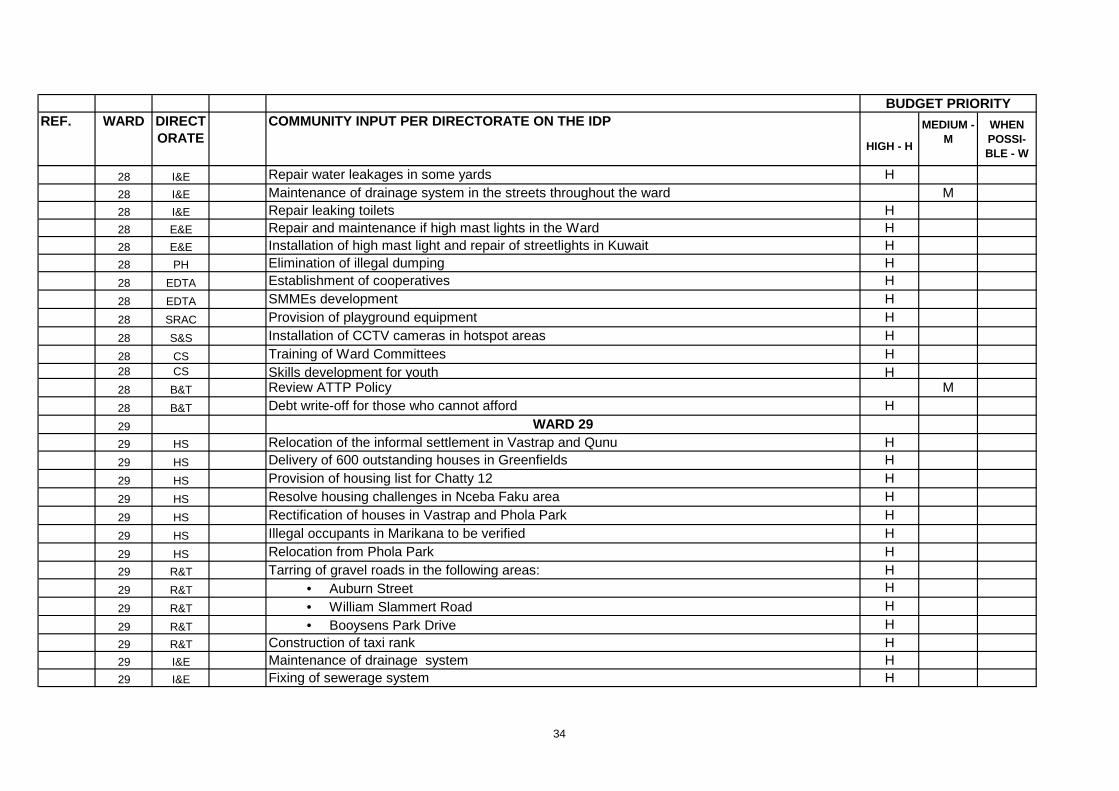
REF. WARD DIRECTORATE
COMMUNITY INPUT PER DIRECTORATE ON THE IDP
HIGH - H
MEDIUM - M
WHEN POSSI-BLE - W
BUDGET PRIORITY
28 I&E Repair water leakages in some yards H28 I&E Maintenance of drainage system in the streets throughout the ward M28 I&E Repair leaking toilets H28 E&E Repair and maintenance if high mast lights in the Ward H28 E&E Installation of high mast light and repair of streetlights in Kuwait H28 PH Elimination of illegal dumping H28 EDTA Establishment of cooperatives H
28 EDTA SMMEs development H
28 SRAC Provision of playground equipment H
28 S&S Installation of CCTV cameras in hotspot areas H
28 CS Training of Ward Committees H28 CS Skills development for youth H28 B&T Review ATTP Policy M
28 B&T Debt write-off for those who cannot afford H
29 WARD 2929 HS Relocation of the informal settlement in Vastrap and Qunu H29 HS Delivery of 600 outstanding houses in Greenfields H
29 HS Provision of housing list for Chatty 12 H
29 HS Resolve housing challenges in Nceba Faku area H
29 HS Rectification of houses in Vastrap and Phola Park H
29 HS Illegal occupants in Marikana to be verified H
29 HS Relocation from Phola Park H29 R&T Tarring of gravel roads in the following areas: H29 R&T • Auburn Street H
29 R&T • William Slammert Road H
29 R&T • Booysens Park Drive H29 R&T Construction of taxi rank H29 I&E Maintenance of drainage system H29 I&E Fixing of sewerage system H
34
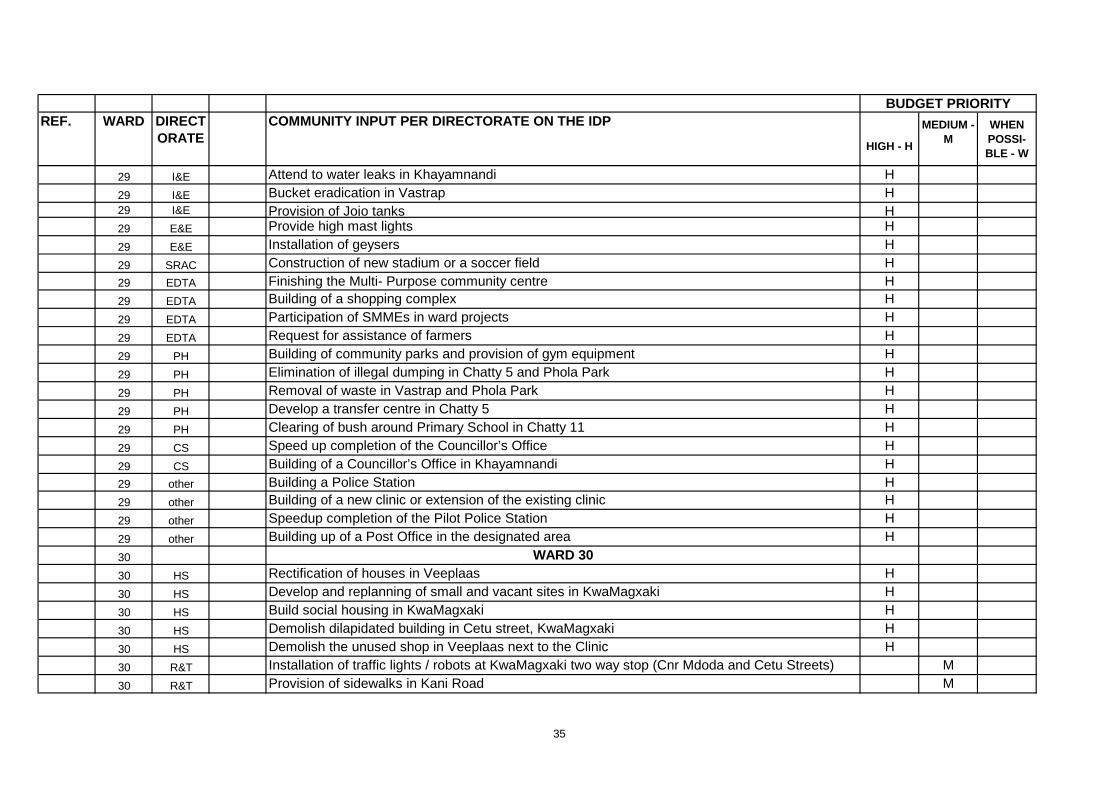
REF. WARD DIRECTORATE
COMMUNITY INPUT PER DIRECTORATE ON THE IDP
HIGH - H
MEDIUM - M
WHEN POSSI-BLE - W
BUDGET PRIORITY
29 I&E Attend to water leaks in Khayamnandi H
29 I&E Bucket eradication in Vastrap H29 I&E Provision of Jojo tanks H29 E&E Provide high mast lights H
29 E&E Installation of geysers H
29 SRAC Construction of new stadium or a soccer field H29 EDTA Finishing the Multi- Purpose community centre H29 EDTA Building of a shopping complex H
29 EDTA Participation of SMMEs in ward projects H
29 EDTA Request for assistance of farmers H
29 PH Building of community parks and provision of gym equipment H
29 PH Elimination of illegal dumping in Chatty 5 and Phola Park H
29 PH Removal of waste in Vastrap and Phola Park H
29 PH Develop a transfer centre in Chatty 5 H
29 PH Clearing of bush around Primary School in Chatty 11 H
29 CS Speed up completion of the Councillor’s Office H
29 CS Building of a Councillor’s Office in Khayamnandi H29 other Building a Police Station H29 other Building of a new clinic or extension of the existing clinic H
29 other Speedup completion of the Pilot Police Station H
29 other Building up of a Post Office in the designated area H
30 WARD 3030 HS Rectification of houses in Veeplaas H
30 HS Develop and replanning of small and vacant sites in KwaMagxaki H
30 HS Build social housing in KwaMagxaki H
30 HS Demolish dilapidated building in Cetu street, KwaMagxaki H
30 HS Demolish the unused shop in Veeplaas next to the Clinic H
30 R&T Installation of traffic lights / robots at KwaMagxaki two way stop (Cnr Mdoda and Cetu Streets) M
30 R&T Provision of sidewalks in Kani Road M
35
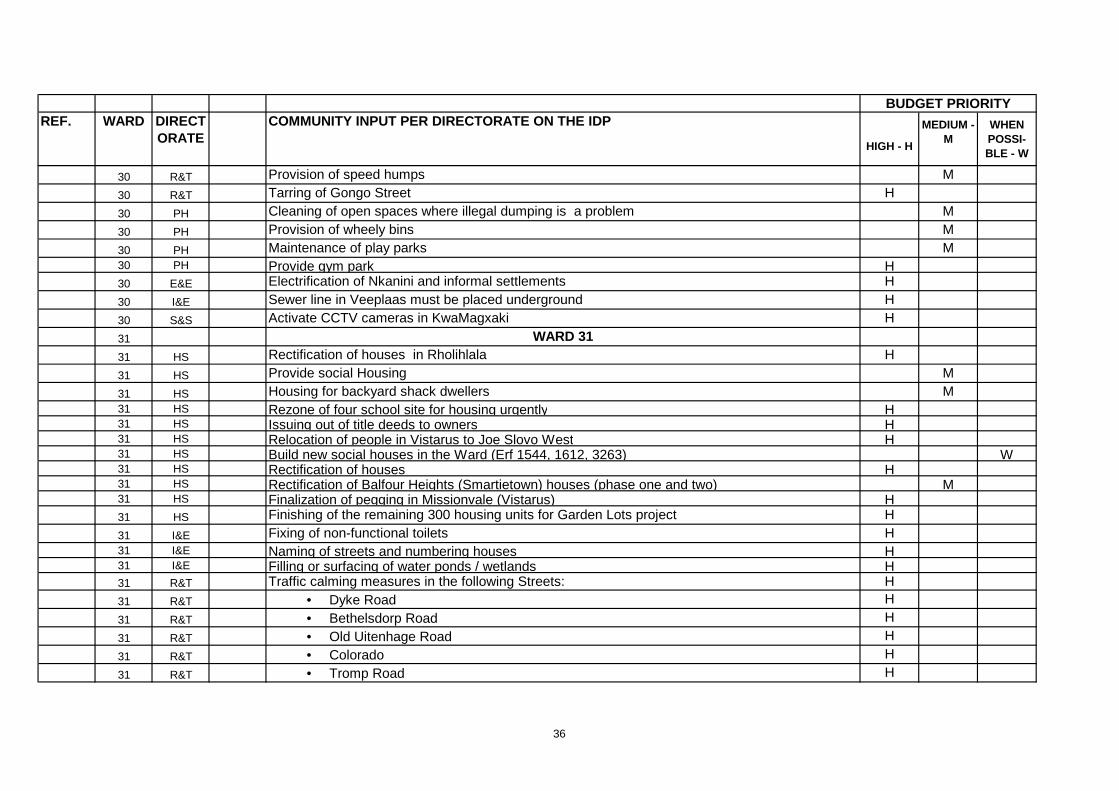
REF. WARD DIRECTORATE
COMMUNITY INPUT PER DIRECTORATE ON THE IDP
HIGH - H
MEDIUM - M
WHEN POSSI-BLE - W
BUDGET PRIORITY
30 R&T Provision of speed humps M
30 R&T Tarring of Gongo Street H
30 PH Cleaning of open spaces where illegal dumping is a problem M
30 PH Provision of wheely bins M
30 PH Maintenance of play parks M30 PH Provide gym park H30 E&E Electrification of Nkanini and informal settlements H
30 I&E Sewer line in Veeplaas must be placed underground H
30 S&S Activate CCTV cameras in KwaMagxaki H
31 WARD 3131 HS Rectification of houses in Rholihlala H
31 HS Provide social Housing M
31 HS Housing for backyard shack dwellers M31 HS Rezone of four school site for housing urgently H31 HS Issuing out of title deeds to owners H31 HS Relocation of people in Vistarus to Joe Slovo West H31 HS Build new social houses in the Ward (Erf 1544, 1612, 3263) W31 HS Rectification of houses H31 HS Rectification of Balfour Heights (Smartietown) houses (phase one and two) M31 HS Finalization of pegging in Missionvale (Vistarus) H31 HS Finishing of the remaining 300 housing units for Garden Lots project H
31 I&E Fixing of non-functional toilets H31 I&E Naming of streets and numbering houses H31 I&E Filling or surfacing of water ponds / wetlands H31 R&T Traffic calming measures in the following Streets: H31 R&T • Dyke Road H
31 R&T • Bethelsdorp Road H
31 R&T • Old Uitenhage Road H
31 R&T • Colorado H
31 R&T • Tromp Road H
36
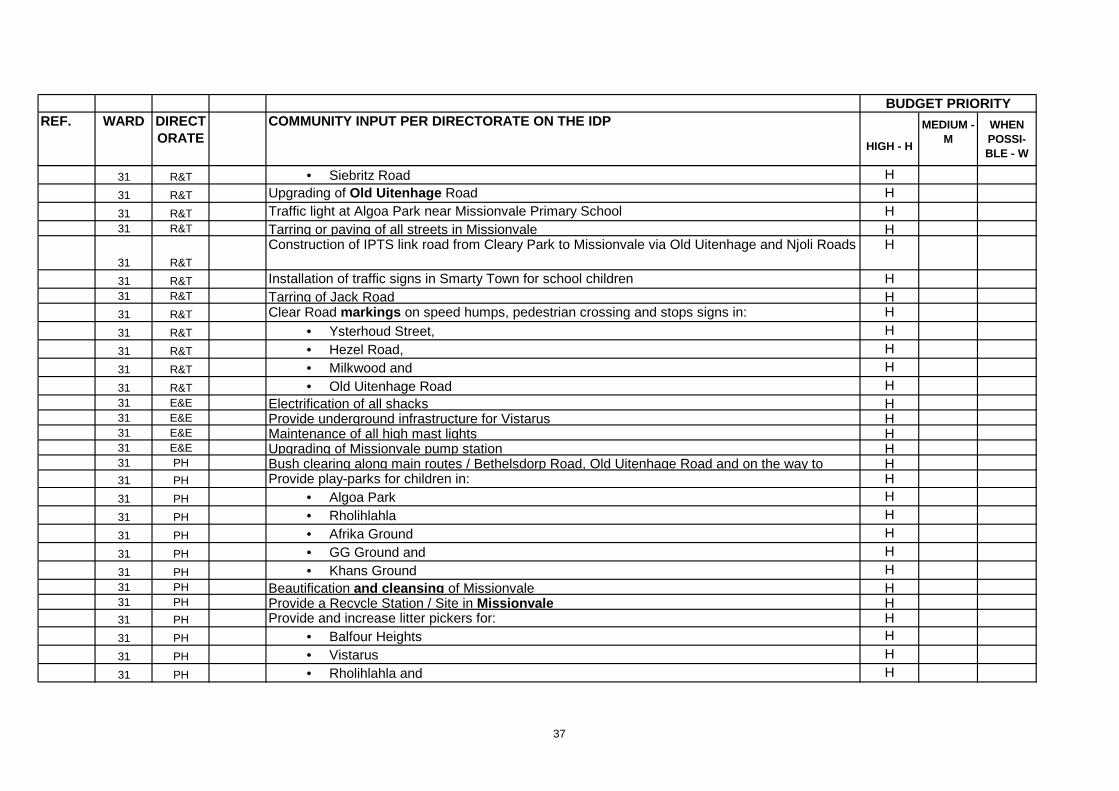
REF. WARD DIRECTORATE
COMMUNITY INPUT PER DIRECTORATE ON THE IDP
HIGH - H
MEDIUM - M
WHEN POSSI-BLE - W
BUDGET PRIORITY
31 R&T • Siebritz Road H
31 R&T Upgrading of Old Uitenhage Road H
31 R&T Traffic light at Algoa Park near Missionvale Primary School H31 R&T Tarring or paving of all streets in Missionvale H
31 R&T
Construction of IPTS link road from Cleary Park to Missionvale via Old Uitenhage and Njoli Roads H
31 R&T Installation of traffic signs in Smarty Town for school children H31 R&T Tarring of Jack Road H31 R&T Clear Road markings on speed humps, pedestrian crossing and stops signs in: H
31 R&T • Ysterhoud Street, H
31 R&T • Hezel Road, H
31 R&T • Milkwood and H
31 R&T • Old Uitenhage Road H31 E&E Electrification of all shacks H31 E&E Provide underground infrastructure for Vistarus H31 E&E Maintenance of all high mast lights H31 E&E Upgrading of Missionvale pump station H31 PH Bush clearing along main routes / Bethelsdorp Road, Old Uitenhage Road and on the way to H31 PH Provide play-parks for children in: H31 PH • Algoa Park H
31 PH • Rholihlahla H
31 PH • Afrika Ground H
31 PH • GG Ground and H
31 PH • Khans Ground H31 PH Beautification and cleansing of Missionvale H31 PH Provide a Recycle Station / Site in Missionvale H31 PH Provide and increase litter pickers for: H31 PH • Balfour Heights H
31 PH • Vistarus H
31 PH • Rholihlahla and H
37
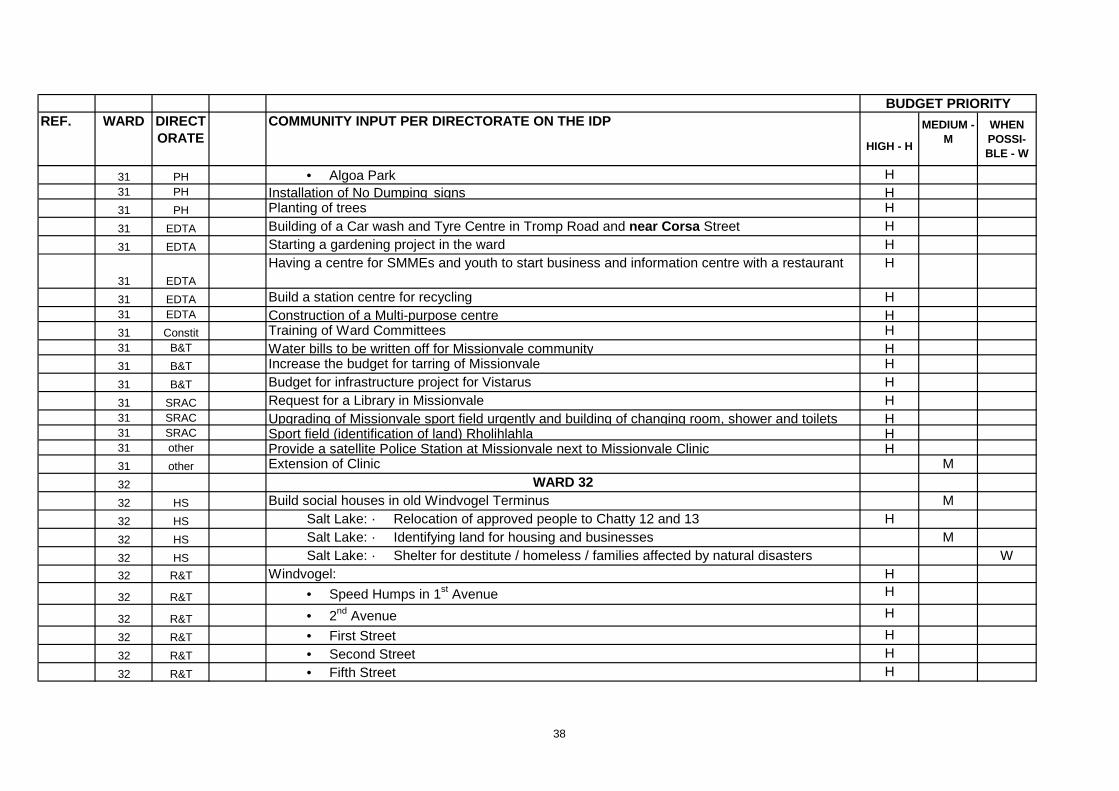
REF. WARD DIRECTORATE
COMMUNITY INPUT PER DIRECTORATE ON THE IDP
HIGH - H
MEDIUM - M
WHEN POSSI-BLE - W
BUDGET PRIORITY
31 PH • Algoa Park H31 PH Installation of No Dumping signs H31 PH Planting of trees H
31 EDTA Building of a Car wash and Tyre Centre in Tromp Road and near Corsa Street H
31 EDTA Starting a gardening project in the ward H
31 EDTA
Having a centre for SMMEs and youth to start business and information centre with a restaurant H
31 EDTA Build a station centre for recycling H31 EDTA Construction of a Multi-purpose centre H31 Constit Training of Ward Committees H31 B&T Water bills to be written off for Missionvale community H31 B&T Increase the budget for tarring of Missionvale H
31 B&T Budget for infrastructure project for Vistarus H
31 SRAC Request for a Library in Missionvale H31 SRAC Upgrading of Missionvale sport field urgently and building of changing room, shower and toilets H31 SRAC Sport field (identification of land) Rholihlahla H31 other Provide a satellite Police Station at Missionvale next to Missionvale Clinic H31 other Extension of Clinic M
32 WARD 3232 HS Build social houses in old Windvogel Terminus M
32 HS Salt Lake: · Relocation of approved people to Chatty 12 and 13 H
32 HS Salt Lake: · Identifying land for housing and businesses M
32 HS Salt Lake: · Shelter for destitute / homeless / families affected by natural disasters W32 R&T Windvogel: H
32 R&T • Speed Humps in 1st Avenue H
32 R&T • 2nd Avenue H
32 R&T • First Street H
32 R&T • Second Street H
32 R&T • Fifth Street H
38
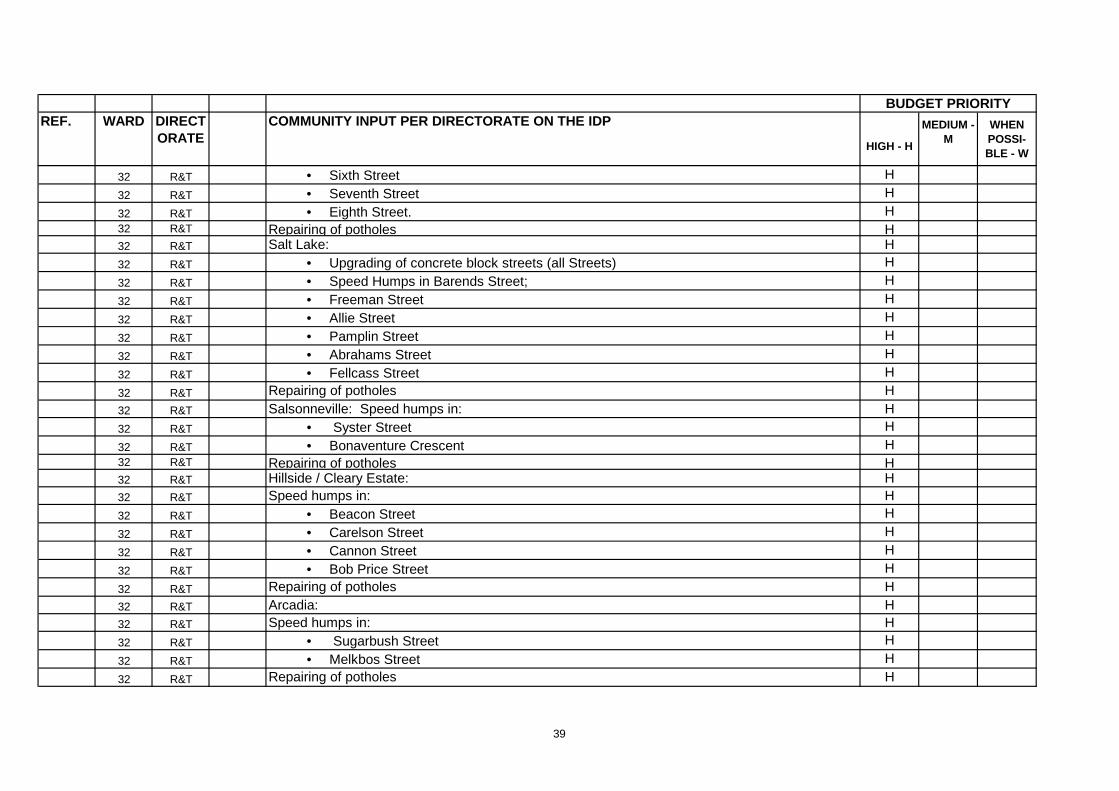
REF. WARD DIRECTORATE
COMMUNITY INPUT PER DIRECTORATE ON THE IDP
HIGH - H
MEDIUM - M
WHEN POSSI-BLE - W
BUDGET PRIORITY
32 R&T • Sixth Street H
32 R&T • Seventh Street H
32 R&T • Eighth Street. H32 R&T Repairing of potholes H32 R&T Salt Lake: H32 R&T • Upgrading of concrete block streets (all Streets) H
32 R&T • Speed Humps in Barends Street; H
32 R&T • Freeman Street H
32 R&T • Allie Street H
32 R&T • Pamplin Street H
32 R&T • Abrahams Street H
32 R&T • Fellcass Street H
32 R&T Repairing of potholes H32 R&T Salsonneville: Speed humps in: H32 R&T • Syster Street H
32 R&T • Bonaventure Crescent H32 R&T Repairing of potholes H32 R&T Hillside / Cleary Estate: H32 R&T Speed humps in: H32 R&T • Beacon Street H
32 R&T • Carelson Street H
32 R&T • Cannon Street H
32 R&T • Bob Price Street H
32 R&T Repairing of potholes H32 R&T Arcadia: H32 R&T Speed humps in: H32 R&T • Sugarbush Street H
32 R&T • Melkbos Street H
32 R&T Repairing of potholes H
39
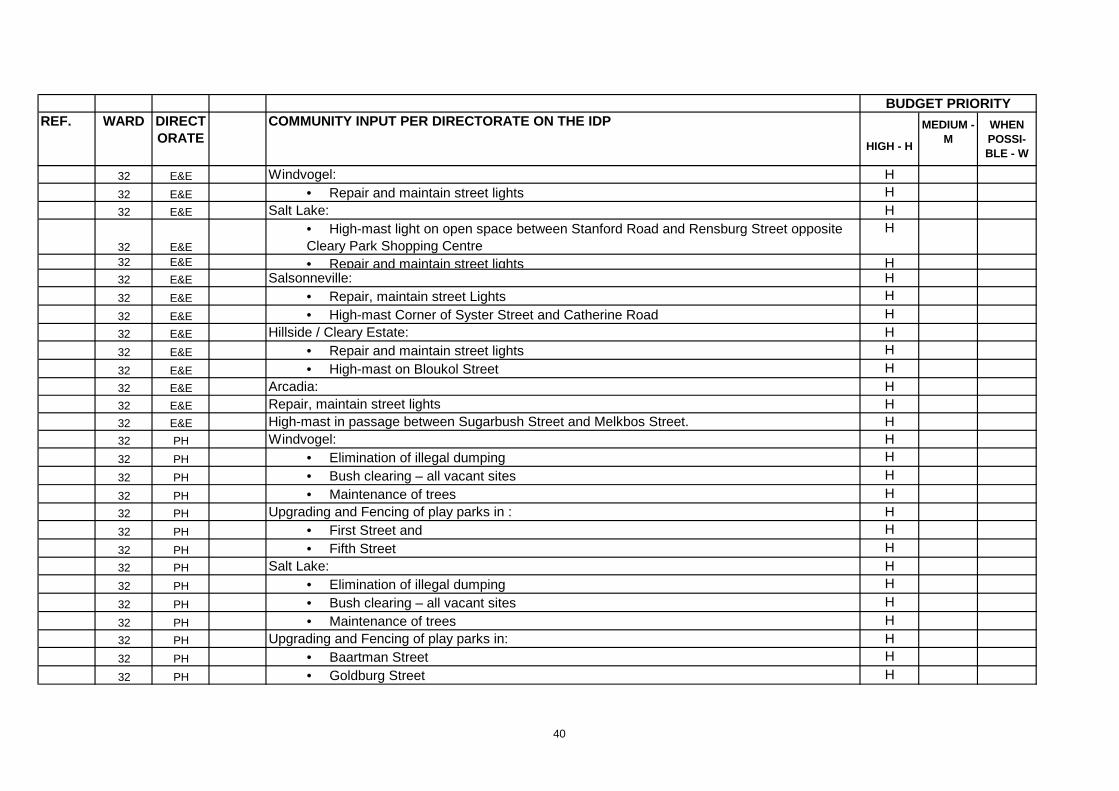
REF. WARD DIRECTORATE
COMMUNITY INPUT PER DIRECTORATE ON THE IDP
HIGH - H
MEDIUM - M
WHEN POSSI-BLE - W
BUDGET PRIORITY
32 E&E Windvogel: H32 E&E • Repair and maintain street lights H32 E&E Salt Lake: H
32 E&E
• High-mast light on open space between Stanford Road and Rensburg Street opposite Cleary Park Shopping Centre
H
32 E&E • Repair and maintain street lights H32 E&E Salsonneville: H32 E&E • Repair, maintain street Lights H
32 E&E • High-mast Corner of Syster Street and Catherine Road H32 E&E Hillside / Cleary Estate: H32 E&E • Repair and maintain street lights H
32 E&E • High-mast on Bloukol Street H32 E&E Arcadia: H32 E&E Repair, maintain street lights H32 E&E High-mast in passage between Sugarbush Street and Melkbos Street. H32 PH Windvogel: H32 PH • Elimination of illegal dumping H
32 PH • Bush clearing – all vacant sites H
32 PH • Maintenance of trees H32 PH Upgrading and Fencing of play parks in : H32 PH • First Street and H
32 PH • Fifth Street H32 PH Salt Lake: H32 PH • Elimination of illegal dumping H
32 PH • Bush clearing – all vacant sites H
32 PH • Maintenance of trees H32 PH Upgrading and Fencing of play parks in: H32 PH • Baartman Street H
32 PH • Goldburg Street H
40
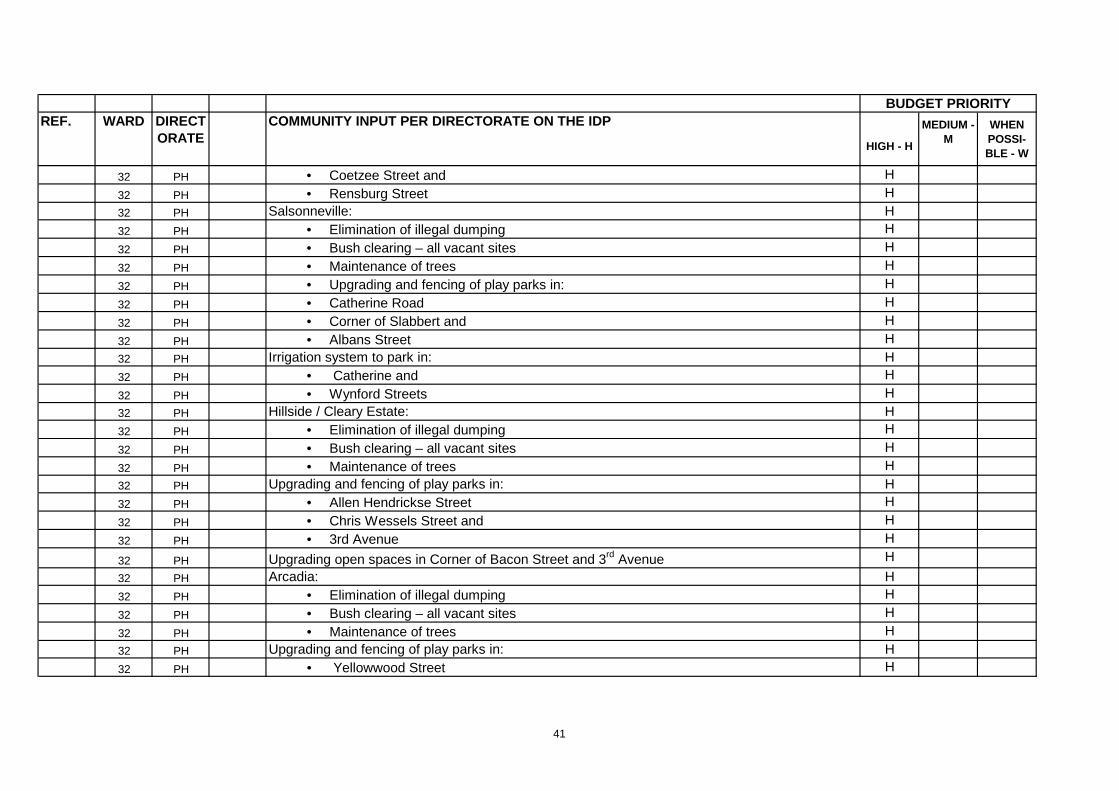
REF. WARD DIRECTORATE
COMMUNITY INPUT PER DIRECTORATE ON THE IDP
HIGH - H
MEDIUM - M
WHEN POSSI-BLE - W
BUDGET PRIORITY
32 PH • Coetzee Street and H
32 PH • Rensburg Street H32 PH Salsonneville: H32 PH • Elimination of illegal dumping H
32 PH • Bush clearing – all vacant sites H
32 PH • Maintenance of trees H
32 PH • Upgrading and fencing of play parks in: H
32 PH • Catherine Road H
32 PH • Corner of Slabbert and H
32 PH • Albans Street H32 PH Irrigation system to park in: H32 PH • Catherine and H
32 PH • Wynford Streets H32 PH Hillside / Cleary Estate: H32 PH • Elimination of illegal dumping H
32 PH • Bush clearing – all vacant sites H
32 PH • Maintenance of trees H32 PH Upgrading and fencing of play parks in: H32 PH • Allen Hendrickse Street H
32 PH • Chris Wessels Street and H
32 PH • 3rd Avenue H
32 PH Upgrading open spaces in Corner of Bacon Street and 3rd Avenue H
32 PH Arcadia: H32 PH • Elimination of illegal dumping H
32 PH • Bush clearing – all vacant sites H
32 PH • Maintenance of trees H32 PH Upgrading and fencing of play parks in: H32 PH • Yellowwood Street H
41
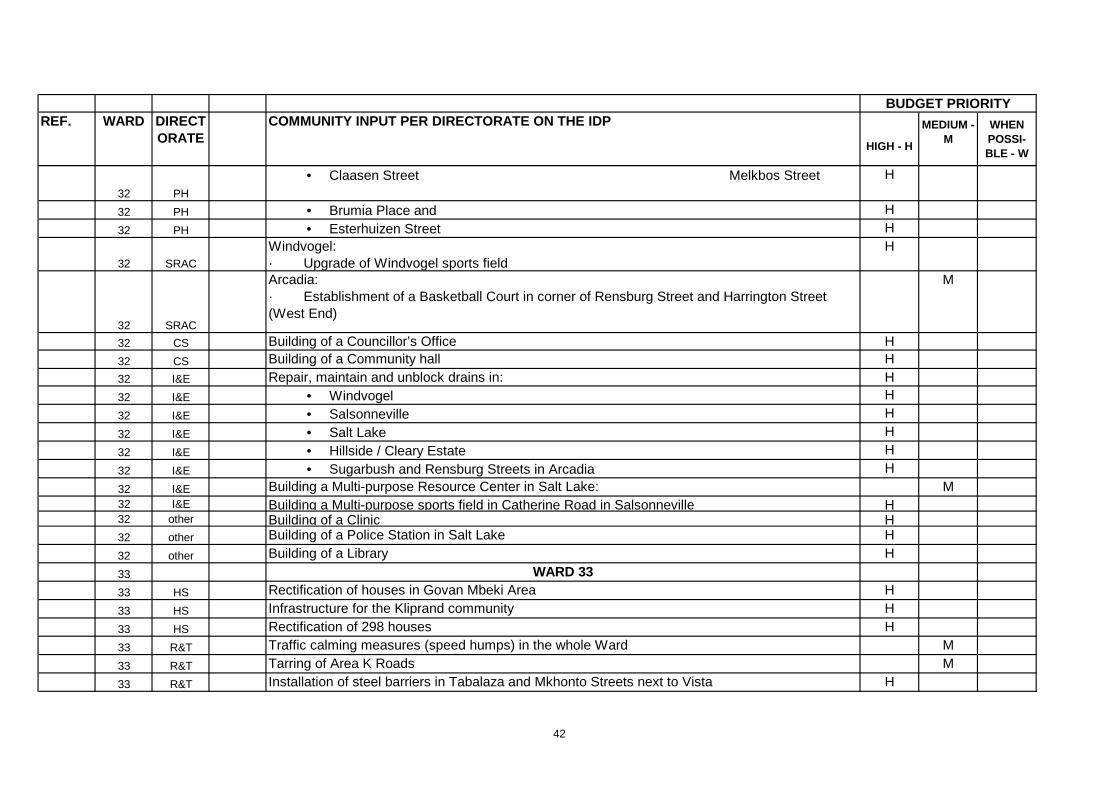
REF. WARD DIRECTORATE
COMMUNITY INPUT PER DIRECTORATE ON THE IDP
HIGH - H
MEDIUM - M
WHEN POSSI-BLE - W
BUDGET PRIORITY
32 PH
• Claasen Street Melkbos Street H
32 PH • Brumia Place and H
32 PH • Esterhuizen Street H
32 SRAC
Windvogel:· Upgrade of Windvogel sports field
H
32 SRAC
Arcadia:· Establishment of a Basketball Court in corner of Rensburg Street and Harrington Street (West End)
M
32 CS Building of a Councillor’s Office H32 CS Building of a Community hall H32 I&E Repair, maintain and unblock drains in: H32 I&E • Windvogel H
32 I&E • Salsonneville H
32 I&E • Salt Lake H
32 I&E • Hillside / Cleary Estate H
32 I&E • Sugarbush and Rensburg Streets in Arcadia H
32 I&E Building a Multi-purpose Resource Center in Salt Lake: M32 I&E Building a Multi-purpose sports field in Catherine Road in Salsonneville H32 other Building of a Clinic H32 other Building of a Police Station in Salt Lake H
32 other Building of a Library H
33 WARD 3333 HS Rectification of houses in Govan Mbeki Area H
33 HS Infrastructure for the Kliprand community H
33 HS Rectification of 298 houses H
33 R&T Traffic calming measures (speed humps) in the whole Ward M
33 R&T Tarring of Area K Roads M
33 R&T Installation of steel barriers in Tabalaza and Mkhonto Streets next to Vista H
42
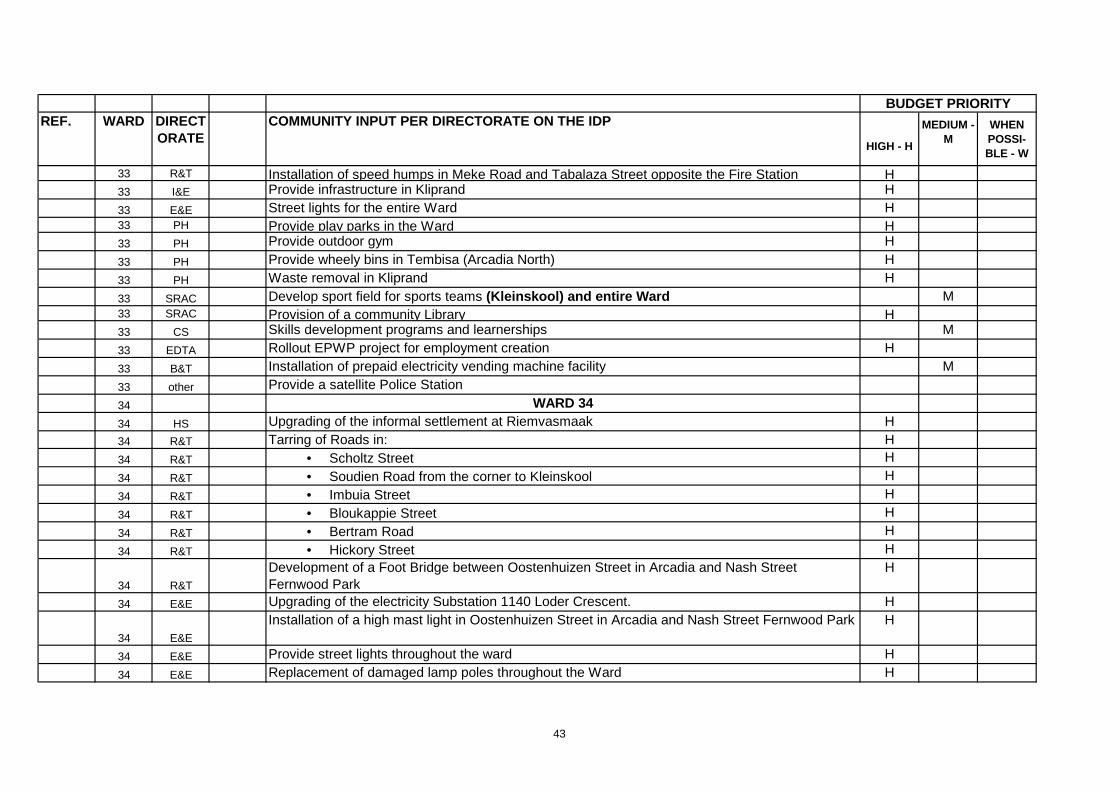
REF. WARD DIRECTORATE
COMMUNITY INPUT PER DIRECTORATE ON THE IDP
HIGH - H
MEDIUM - M
WHEN POSSI-BLE - W
BUDGET PRIORITY
33 R&T Installation of speed humps in Meke Road and Tabalaza Street opposite the Fire Station H33 I&E Provide infrastructure in Kliprand H
33 E&E Street lights for the entire Ward H33 PH Provide play parks in the Ward H33 PH Provide outdoor gym H
33 PH Provide wheely bins in Tembisa (Arcadia North) H
33 PH Waste removal in Kliprand H
33 SRAC Develop sport field for sports teams (Kleinskool) and entire Ward M33 SRAC Provision of a community Library H33 CS Skills development programs and learnerships M
33 EDTA Rollout EPWP project for employment creation H
33 B&T Installation of prepaid electricity vending machine facility M
33 other Provide a satellite Police Station
34 WARD 3434 HS Upgrading of the informal settlement at Riemvasmaak H34 R&T Tarring of Roads in: H34 R&T • Scholtz Street H
34 R&T • Soudien Road from the corner to Kleinskool H
34 R&T • Imbuia Street H
34 R&T • Bloukappie Street H
34 R&T • Bertram Road H
34 R&T • Hickory Street H
34 R&T
Development of a Foot Bridge between Oostenhuizen Street in Arcadia and Nash Street Fernwood Park
H
34 E&E Upgrading of the electricity Substation 1140 Loder Crescent. H
34 E&E
Installation of a high mast light in Oostenhuizen Street in Arcadia and Nash Street Fernwood Park H
34 E&E Provide street lights throughout the ward H
34 E&E Replacement of damaged lamp poles throughout the Ward H
43
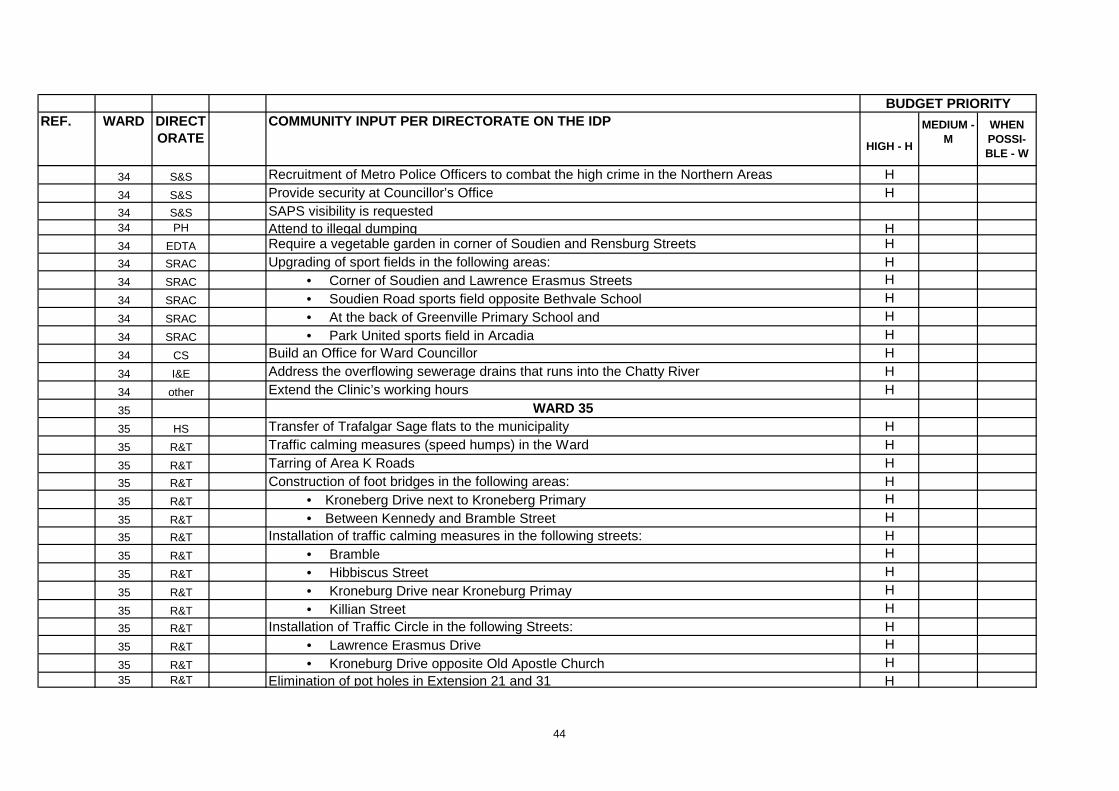
REF. WARD DIRECTORATE
COMMUNITY INPUT PER DIRECTORATE ON THE IDP
HIGH - H
MEDIUM - M
WHEN POSSI-BLE - W
BUDGET PRIORITY
34 S&S Recruitment of Metro Police Officers to combat the high crime in the Northern Areas H
34 S&S Provide security at Councillor’s Office H34 S&S SAPS visibility is requested34 PH Attend to illegal dumping H34 EDTA Require a vegetable garden in corner of Soudien and Rensburg Streets H34 SRAC Upgrading of sport fields in the following areas: H34 SRAC • Corner of Soudien and Lawrence Erasmus Streets H
34 SRAC • Soudien Road sports field opposite Bethvale School H
34 SRAC • At the back of Greenville Primary School and H
34 SRAC • Park United sports field in Arcadia H
34 CS Build an Office for Ward Councillor H
34 I&E Address the overflowing sewerage drains that runs into the Chatty River H
34 other Extend the Clinic’s working hours H
35 WARD 3535 HS Transfer of Trafalgar Sage flats to the municipality H
35 R&T Traffic calming measures (speed humps) in the Ward H
35 R&T Tarring of Area K Roads H35 R&T Construction of foot bridges in the following areas: H35 R&T • Kroneberg Drive next to Kroneberg Primary H
35 R&T • Between Kennedy and Bramble Street H35 R&T Installation of traffic calming measures in the following streets: H35 R&T • Bramble H
35 R&T • Hibbiscus Street H
35 R&T • Kroneburg Drive near Kroneburg Primay H
35 R&T • Killian Street H35 R&T Installation of Traffic Circle in the following Streets: H35 R&T • Lawrence Erasmus Drive H
35 R&T • Kroneburg Drive opposite Old Apostle Church H35 R&T Elimination of pot holes in Extension 21 and 31 H
44
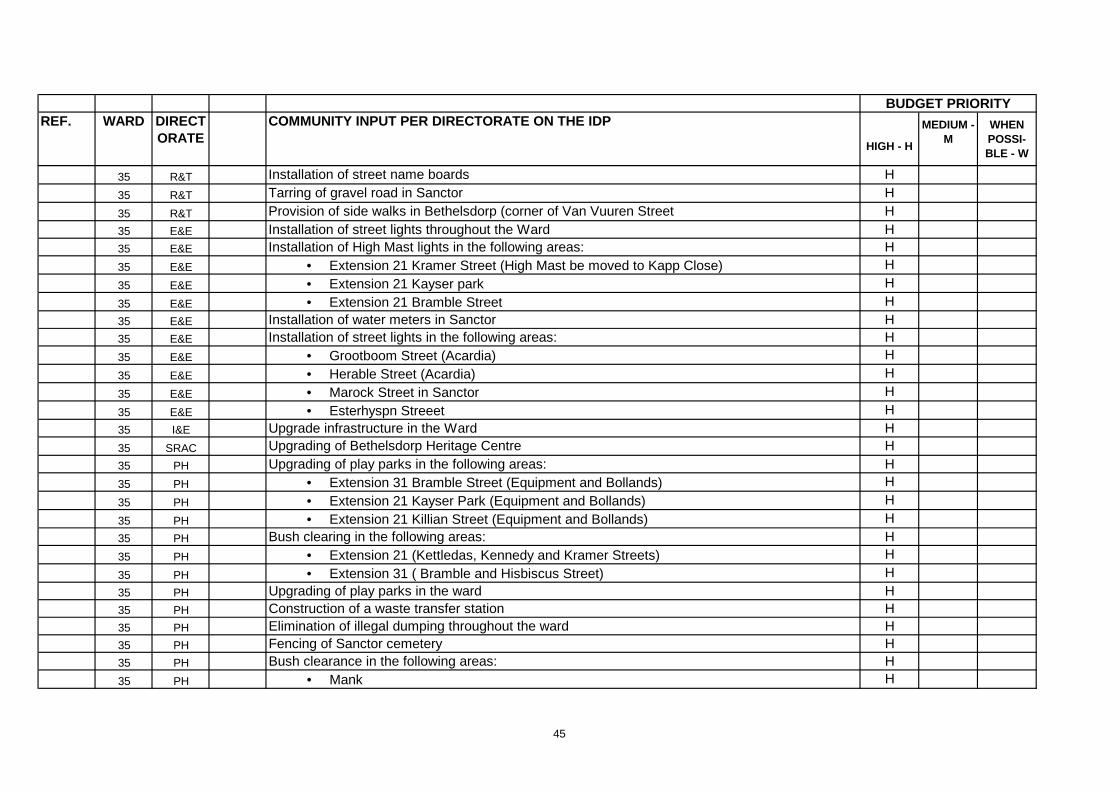
REF. WARD DIRECTORATE
COMMUNITY INPUT PER DIRECTORATE ON THE IDP
HIGH - H
MEDIUM - M
WHEN POSSI-BLE - W
BUDGET PRIORITY
35 R&T Installation of street name boards H
35 R&T Tarring of gravel road in Sanctor H
35 R&T Provision of side walks in Bethelsdorp (corner of Van Vuuren Street H35 E&E Installation of street lights throughout the Ward H35 E&E Installation of High Mast lights in the following areas: H35 E&E • Extension 21 Kramer Street (High Mast be moved to Kapp Close) H
35 E&E • Extension 21 Kayser park H
35 E&E • Extension 21 Bramble Street H35 E&E Installation of water meters in Sanctor H35 E&E Installation of street lights in the following areas: H35 E&E • Grootboom Street (Acardia) H
35 E&E • Herable Street (Acardia) H
35 E&E • Marock Street in Sanctor H
35 E&E • Esterhyspn Streeet H35 I&E Upgrade infrastructure in the Ward H35 SRAC Upgrading of Bethelsdorp Heritage Centre H35 PH Upgrading of play parks in the following areas: H35 PH • Extension 31 Bramble Street (Equipment and Bollands) H
35 PH • Extension 21 Kayser Park (Equipment and Bollands) H
35 PH • Extension 21 Killian Street (Equipment and Bollands) H35 PH Bush clearing in the following areas: H35 PH • Extension 21 (Kettledas, Kennedy and Kramer Streets) H
35 PH • Extension 31 ( Bramble and Hisbiscus Street) H35 PH Upgrading of play parks in the ward H35 PH Construction of a waste transfer station H35 PH Elimination of illegal dumping throughout the ward H35 PH Fencing of Sanctor cemetery H35 PH Bush clearance in the following areas: H35 PH • Mank H
45
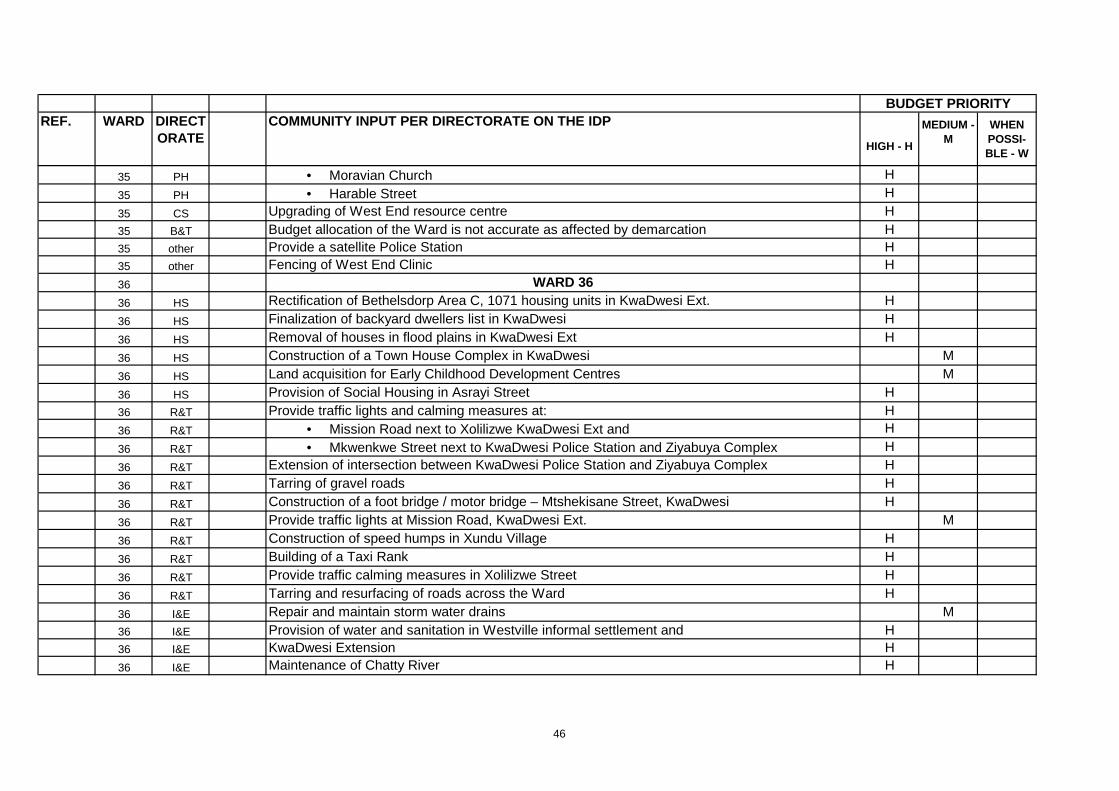
REF. WARD DIRECTORATE
COMMUNITY INPUT PER DIRECTORATE ON THE IDP
HIGH - H
MEDIUM - M
WHEN POSSI-BLE - W
BUDGET PRIORITY
35 PH • Moravian Church H
35 PH • Harable Street H
35 CS Upgrading of West End resource centre H35 B&T Budget allocation of the Ward is not accurate as affected by demarcation H35 other Provide a satellite Police Station H35 other Fencing of West End Clinic H36 WARD 3636 HS Rectification of Bethelsdorp Area C, 1071 housing units in KwaDwesi Ext. H
36 HS Finalization of backyard dwellers list in KwaDwesi H
36 HS Removal of houses in flood plains in KwaDwesi Ext H
36 HS Construction of a Town House Complex in KwaDwesi M
36 HS Land acquisition for Early Childhood Development Centres M
36 HS Provision of Social Housing in Asrayi Street H36 R&T Provide traffic lights and calming measures at: H36 R&T • Mission Road next to Xolilizwe KwaDwesi Ext and H
36 R&T • Mkwenkwe Street next to KwaDwesi Police Station and Ziyabuya Complex H
36 R&T Extension of intersection between KwaDwesi Police Station and Ziyabuya Complex H
36 R&T Tarring of gravel roads H
36 R&T Construction of a foot bridge / motor bridge – Mtshekisane Street, KwaDwesi H
36 R&T Provide traffic lights at Mission Road, KwaDwesi Ext. M
36 R&T Construction of speed humps in Xundu Village H
36 R&T Building of a Taxi Rank H
36 R&T Provide traffic calming measures in Xolilizwe Street H
36 R&T Tarring and resurfacing of roads across the Ward H
36 I&E Repair and maintain storm water drains M36 I&E Provision of water and sanitation in Westville informal settlement and H36 I&E KwaDwesi Extension H36 I&E Maintenance of Chatty River H
46
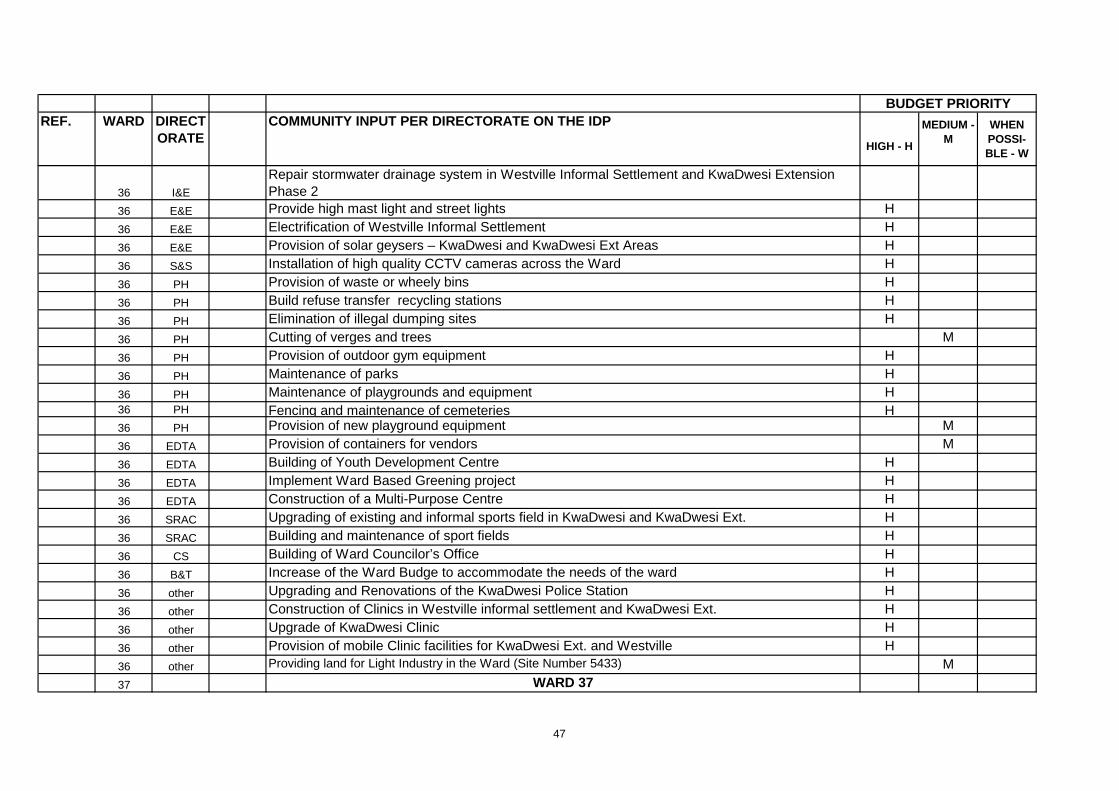
REF. WARD DIRECTORATE
COMMUNITY INPUT PER DIRECTORATE ON THE IDP
HIGH - H
MEDIUM - M
WHEN POSSI-BLE - W
BUDGET PRIORITY
36 I&E
Repair stormwater drainage system in Westville Informal Settlement and KwaDwesi Extension Phase 2
36 E&E Provide high mast light and street lights H
36 E&E Electrification of Westville Informal Settlement H
36 E&E Provision of solar geysers – KwaDwesi and KwaDwesi Ext Areas H
36 S&S Installation of high quality CCTV cameras across the Ward H
36 PH Provision of waste or wheely bins H
36 PH Build refuse transfer recycling stations H
36 PH Elimination of illegal dumping sites H
36 PH Cutting of verges and trees M
36 PH Provision of outdoor gym equipment H
36 PH Maintenance of parks H
36 PH Maintenance of playgrounds and equipment H36 PH Fencing and maintenance of cemeteries H36 PH Provision of new playground equipment M
36 EDTA Provision of containers for vendors M
36 EDTA Building of Youth Development Centre H
36 EDTA Implement Ward Based Greening project H
36 EDTA Construction of a Multi-Purpose Centre H
36 SRAC Upgrading of existing and informal sports field in KwaDwesi and KwaDwesi Ext. H
36 SRAC Building and maintenance of sport fields H
36 CS Building of Ward Councilor’s Office H
36 B&T Increase of the Ward Budge to accommodate the needs of the ward H
36 other Upgrading and Renovations of the KwaDwesi Police Station H
36 other Construction of Clinics in Westville informal settlement and KwaDwesi Ext. H
36 other Upgrade of KwaDwesi Clinic H
36 other Provision of mobile Clinic facilities for KwaDwesi Ext. and Westville H
36 other Providing land for Light Industry in the Ward (Site Number 5433) M
37 WARD 37
47
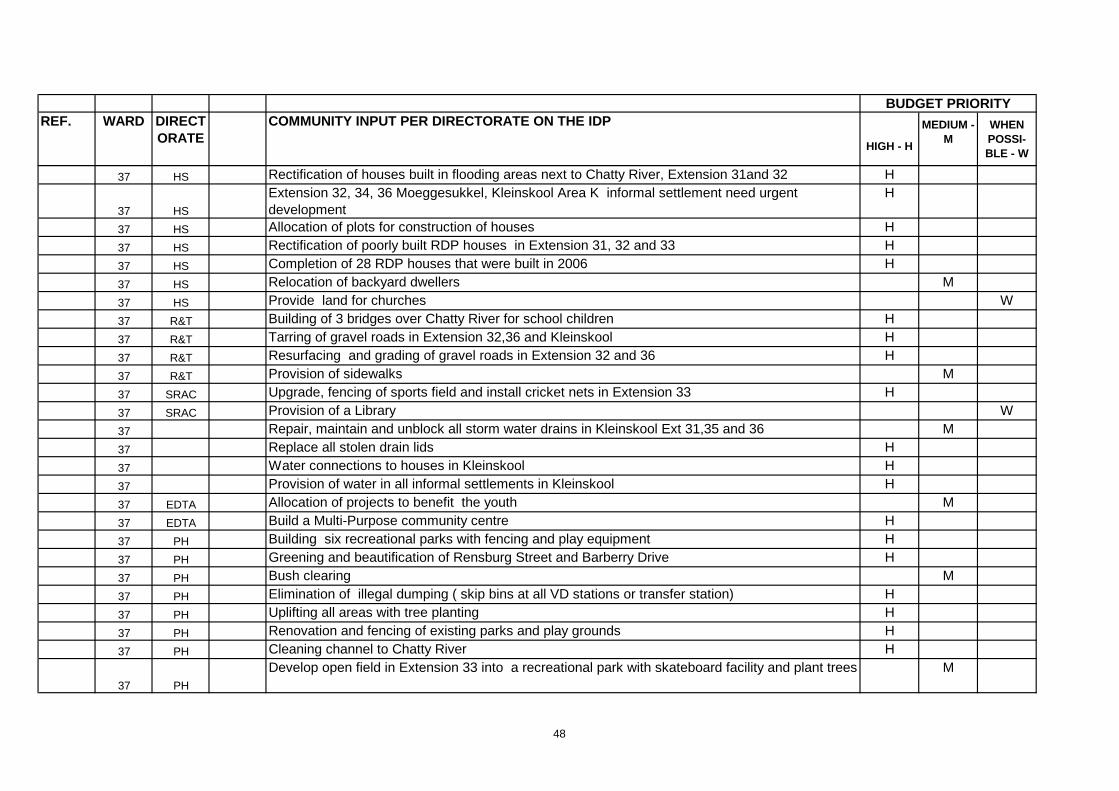
REF. WARD DIRECTORATE
COMMUNITY INPUT PER DIRECTORATE ON THE IDP
HIGH - H
MEDIUM - M
WHEN POSSI-BLE - W
BUDGET PRIORITY
37 HS Rectification of houses built in flooding areas next to Chatty River, Extension 31and 32 H
37 HS
Extension 32, 34, 36 Moeggesukkel, Kleinskool Area K informal settlement need urgent development
H
37 HS Allocation of plots for construction of houses H
37 HS Rectification of poorly built RDP houses in Extension 31, 32 and 33 H
37 HS Completion of 28 RDP houses that were built in 2006 H
37 HS Relocation of backyard dwellers M
37 HS Provide land for churches W
37 R&T Building of 3 bridges over Chatty River for school children H
37 R&T Tarring of gravel roads in Extension 32,36 and Kleinskool H
37 R&T Resurfacing and grading of gravel roads in Extension 32 and 36 H
37 R&T Provision of sidewalks M
37 SRAC Upgrade, fencing of sports field and install cricket nets in Extension 33 H
37 SRAC Provision of a Library W
37 Repair, maintain and unblock all storm water drains in Kleinskool Ext 31,35 and 36 M
37 Replace all stolen drain lids H
37 Water connections to houses in Kleinskool H
37 Provision of water in all informal settlements in Kleinskool H
37 EDTA Allocation of projects to benefit the youth M
37 EDTA Build a Multi-Purpose community centre H
37 PH Building six recreational parks with fencing and play equipment H
37 PH Greening and beautification of Rensburg Street and Barberry Drive H
37 PH Bush clearing M
37 PH Elimination of illegal dumping ( skip bins at all VD stations or transfer station) H
37 PH Uplifting all areas with tree planting H
37 PH Renovation and fencing of existing parks and play grounds H
37 PH Cleaning channel to Chatty River H
37 PH
Develop open field in Extension 33 into a recreational park with skateboard facility and plant trees M
48
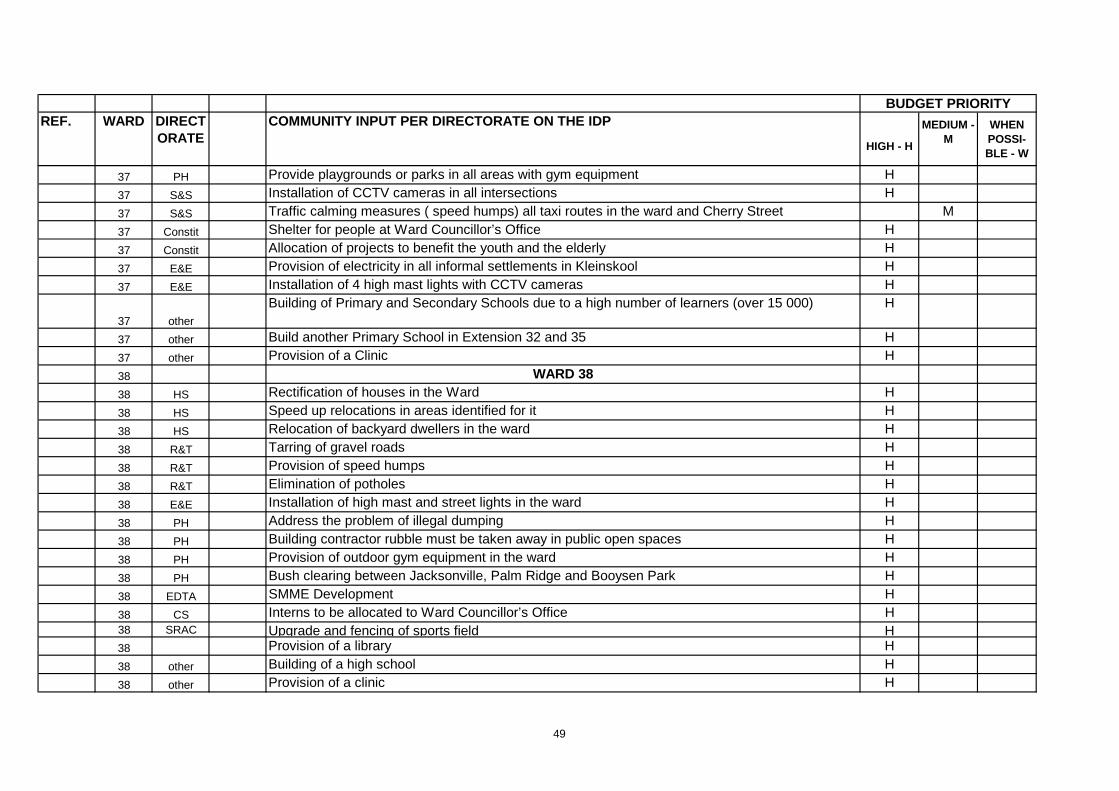
REF. WARD DIRECTORATE
COMMUNITY INPUT PER DIRECTORATE ON THE IDP
HIGH - H
MEDIUM - M
WHEN POSSI-BLE - W
BUDGET PRIORITY
37 PH Provide playgrounds or parks in all areas with gym equipment H
37 S&S Installation of CCTV cameras in all intersections H
37 S&S Traffic calming measures ( speed humps) all taxi routes in the ward and Cherry Street M
37 Constit Shelter for people at Ward Councillor’s Office H
37 Constit Allocation of projects to benefit the youth and the elderly H
37 E&E Provision of electricity in all informal settlements in Kleinskool H
37 E&E Installation of 4 high mast lights with CCTV cameras H
37 other
Building of Primary and Secondary Schools due to a high number of learners (over 15 000) H
37 other Build another Primary School in Extension 32 and 35 H
37 other Provision of a Clinic H
38 WARD 3838 HS Rectification of houses in the Ward H
38 HS Speed up relocations in areas identified for it H
38 HS Relocation of backyard dwellers in the ward H
38 R&T Tarring of gravel roads H
38 R&T Provision of speed humps H
38 R&T Elimination of potholes H
38 E&E Installation of high mast and street lights in the ward H
38 PH Address the problem of illegal dumping H
38 PH Building contractor rubble must be taken away in public open spaces H
38 PH Provision of outdoor gym equipment in the ward H
38 PH Bush clearing between Jacksonville, Palm Ridge and Booysen Park H
38 EDTA SMME Development H
38 CS Interns to be allocated to Ward Councillor’s Office H38 SRAC Upgrade and fencing of sports field H38 Provision of a library H
38 other Building of a high school H
38 other Provision of a clinic H
49
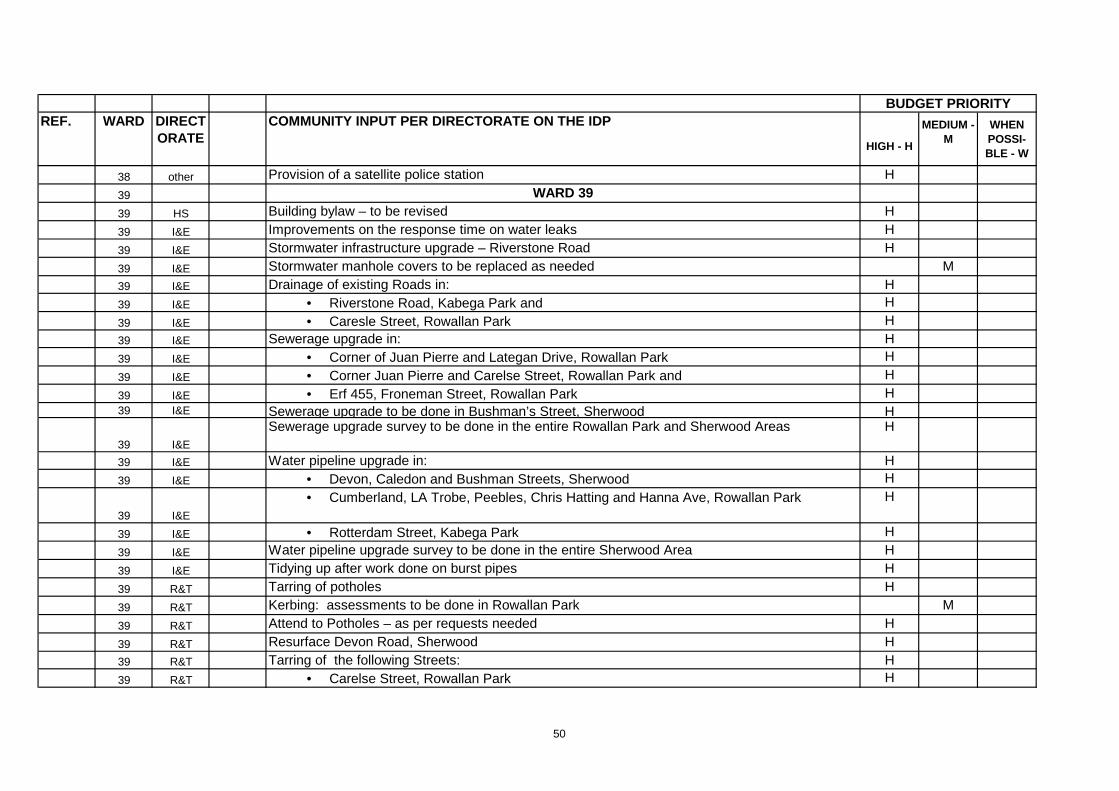
REF. WARD DIRECTORATE
COMMUNITY INPUT PER DIRECTORATE ON THE IDP
HIGH - H
MEDIUM - M
WHEN POSSI-BLE - W
BUDGET PRIORITY
38 other Provision of a satellite police station H
39 WARD 3939 HS Building bylaw – to be revised H
39 I&E Improvements on the response time on water leaks H
39 I&E Stormwater infrastructure upgrade – Riverstone Road H
39 I&E Stormwater manhole covers to be replaced as needed M39 I&E Drainage of existing Roads in: H39 I&E • Riverstone Road, Kabega Park and H
39 I&E • Caresle Street, Rowallan Park H39 I&E Sewerage upgrade in: H39 I&E • Corner of Juan Pierre and Lategan Drive, Rowallan Park H
39 I&E • Corner Juan Pierre and Carelse Street, Rowallan Park and H
39 I&E • Erf 455, Froneman Street, Rowallan Park H39 I&E Sewerage upgrade to be done in Bushman’s Street, Sherwood H
39 I&E
Sewerage upgrade survey to be done in the entire Rowallan Park and Sherwood Areas H
39 I&E Water pipeline upgrade in: H39 I&E • Devon, Caledon and Bushman Streets, Sherwood H
39 I&E
• Cumberland, LA Trobe, Peebles, Chris Hatting and Hanna Ave, Rowallan Park H
39 I&E • Rotterdam Street, Kabega Park H
39 I&E Water pipeline upgrade survey to be done in the entire Sherwood Area H
39 I&E Tidying up after work done on burst pipes H
39 R&T Tarring of potholes H
39 R&T Kerbing: assessments to be done in Rowallan Park M
39 R&T Attend to Potholes – as per requests needed H
39 R&T Resurface Devon Road, Sherwood H39 R&T Tarring of the following Streets: H39 R&T • Carelse Street, Rowallan Park H
50
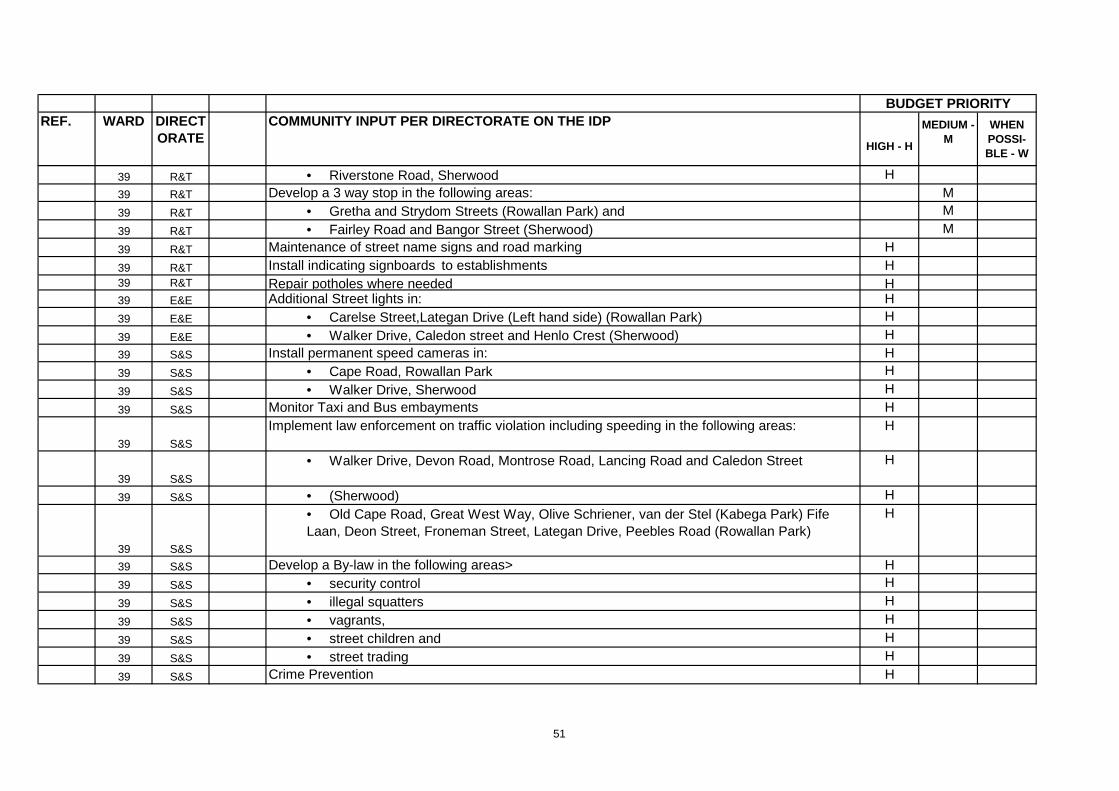
REF. WARD DIRECTORATE
COMMUNITY INPUT PER DIRECTORATE ON THE IDP
HIGH - H
MEDIUM - M
WHEN POSSI-BLE - W
BUDGET PRIORITY
39 R&T • Riverstone Road, Sherwood H39 R&T Develop a 3 way stop in the following areas: M39 R&T • Gretha and Strydom Streets (Rowallan Park) and M
39 R&T • Fairley Road and Bangor Street (Sherwood) M
39 R&T Maintenance of street name signs and road marking H
39 R&T Install indicating signboards to establishments H39 R&T Repair potholes where needed H39 E&E Additional Street lights in: H39 E&E • Carelse Street,Lategan Drive (Left hand side) (Rowallan Park) H
39 E&E • Walker Drive, Caledon street and Henlo Crest (Sherwood) H39 S&S Install permanent speed cameras in: H39 S&S • Cape Road, Rowallan Park H
39 S&S • Walker Drive, Sherwood H
39 S&S Monitor Taxi and Bus embayments H
39 S&S
Implement law enforcement on traffic violation including speeding in the following areas: H
39 S&S
• Walker Drive, Devon Road, Montrose Road, Lancing Road and Caledon Street H
39 S&S • (Sherwood) H
39 S&S
• Old Cape Road, Great West Way, Olive Schriener, van der Stel (Kabega Park) Fife Laan, Deon Street, Froneman Street, Lategan Drive, Peebles Road (Rowallan Park)
H
39 S&S Develop a By-law in the following areas> H39 S&S • security control H
39 S&S • illegal squatters H
39 S&S • vagrants, H
39 S&S • street children and H
39 S&S • street trading H
39 S&S Crime Prevention H
51
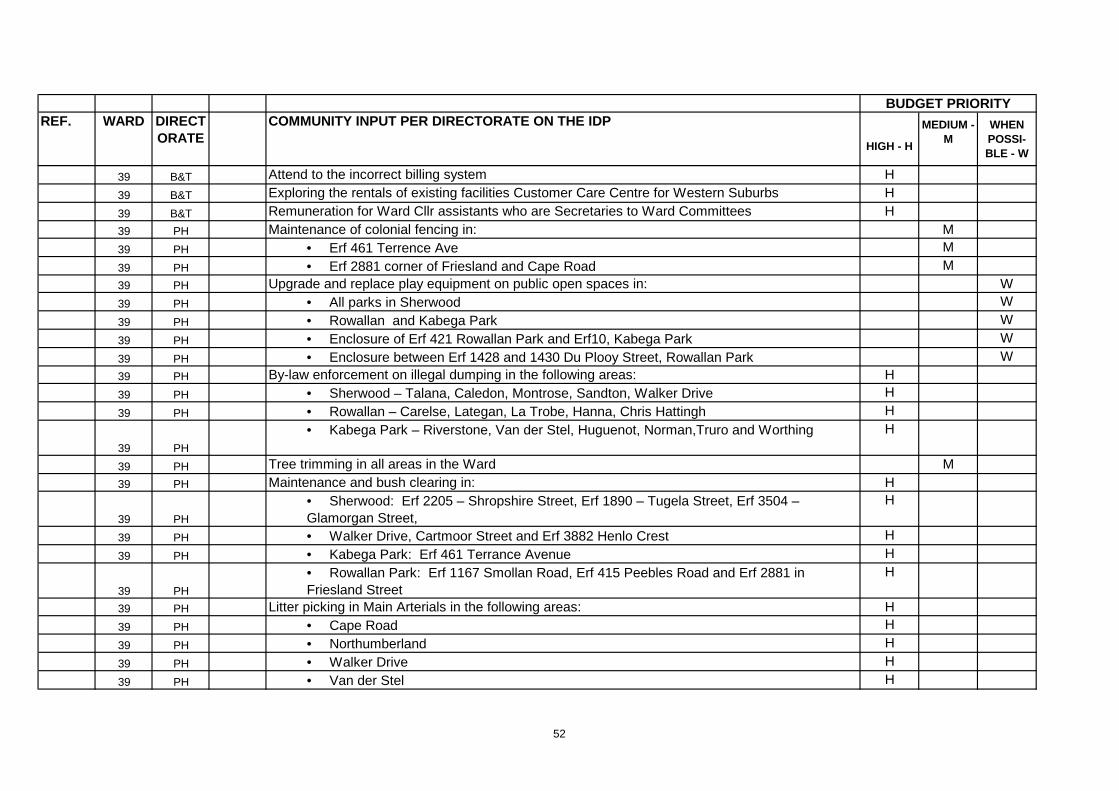
REF. WARD DIRECTORATE
COMMUNITY INPUT PER DIRECTORATE ON THE IDP
HIGH - H
MEDIUM - M
WHEN POSSI-BLE - W
BUDGET PRIORITY
39 B&T Attend to the incorrect billing system H
39 B&T Exploring the rentals of existing facilities Customer Care Centre for Western Suburbs H
39 B&T Remuneration for Ward Cllr assistants who are Secretaries to Ward Committees H39 PH Maintenance of colonial fencing in: M39 PH • Erf 461 Terrence Ave M
39 PH • Erf 2881 corner of Friesland and Cape Road M39 PH Upgrade and replace play equipment on public open spaces in: W39 PH • All parks in Sherwood W
39 PH • Rowallan and Kabega Park W
39 PH • Enclosure of Erf 421 Rowallan Park and Erf10, Kabega Park W
39 PH • Enclosure between Erf 1428 and 1430 Du Plooy Street, Rowallan Park W39 PH By-law enforcement on illegal dumping in the following areas: H39 PH • Sherwood – Talana, Caledon, Montrose, Sandton, Walker Drive H
39 PH • Rowallan – Carelse, Lategan, La Trobe, Hanna, Chris Hattingh H
39 PH
• Kabega Park – Riverstone, Van der Stel, Huguenot, Norman,Truro and Worthing H
39 PH Tree trimming in all areas in the Ward M39 PH Maintenance and bush clearing in: H
39 PH
• Sherwood: Erf 2205 – Shropshire Street, Erf 1890 – Tugela Street, Erf 3504 – Glamorgan Street,
H
39 PH • Walker Drive, Cartmoor Street and Erf 3882 Henlo Crest H
39 PH • Kabega Park: Erf 461 Terrance Avenue H
39 PH
• Rowallan Park: Erf 1167 Smollan Road, Erf 415 Peebles Road and Erf 2881 in Friesland Street
H
39 PH Litter picking in Main Arterials in the following areas: H39 PH • Cape Road H
39 PH • Northumberland H
39 PH • Walker Drive H
39 PH • Van der Stel H
52
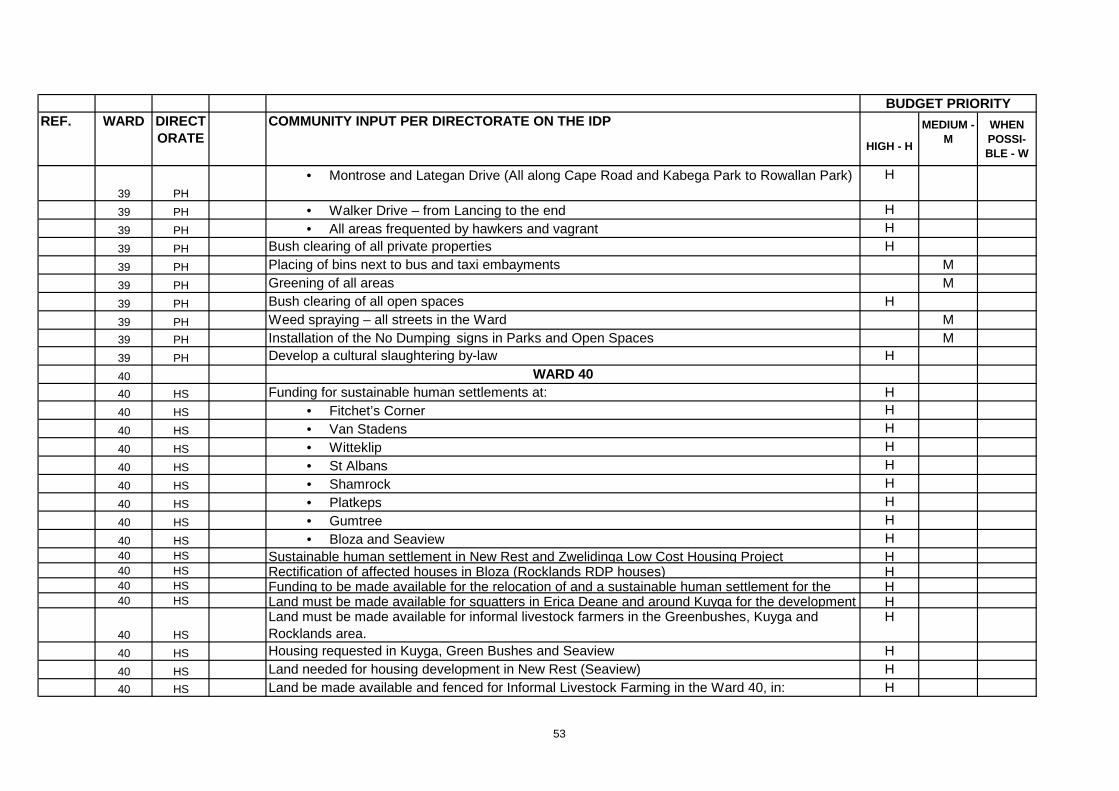
REF. WARD DIRECTORATE
COMMUNITY INPUT PER DIRECTORATE ON THE IDP
HIGH - H
MEDIUM - M
WHEN POSSI-BLE - W
BUDGET PRIORITY
39 PH
• Montrose and Lategan Drive (All along Cape Road and Kabega Park to Rowallan Park) H
39 PH • Walker Drive – from Lancing to the end H
39 PH • All areas frequented by hawkers and vagrant H
39 PH Bush clearing of all private properties H
39 PH Placing of bins next to bus and taxi embayments M
39 PH Greening of all areas M
39 PH Bush clearing of all open spaces H
39 PH Weed spraying – all streets in the Ward M39 PH Installation of the No Dumping signs in Parks and Open Spaces M39 PH Develop a cultural slaughtering by-law H
40 WARD 4040 HS Funding for sustainable human settlements at: H40 HS • Fitchet’s Corner H
40 HS • Van Stadens H
40 HS • Witteklip H
40 HS • St Albans H
40 HS • Shamrock H
40 HS • Platkeps H
40 HS • Gumtree H
40 HS • Bloza and Seaview H40 HS Sustainable human settlement in New Rest and Zwelidinga Low Cost Housing Project H40 HS Rectification of affected houses in Bloza (Rocklands RDP houses) H40 HS Funding to be made available for the relocation of and a sustainable human settlement for the H40 HS Land must be made available for squatters in Erica Deane and around Kuyga for the development H
40 HS
Land must be made available for informal livestock farmers in the Greenbushes, Kuyga and Rocklands area.
H
40 HS Housing requested in Kuyga, Green Bushes and Seaview H
40 HS Land needed for housing development in New Rest (Seaview) H40 HS Land be made available and fenced for Informal Livestock Farming in the Ward 40, in: H
53
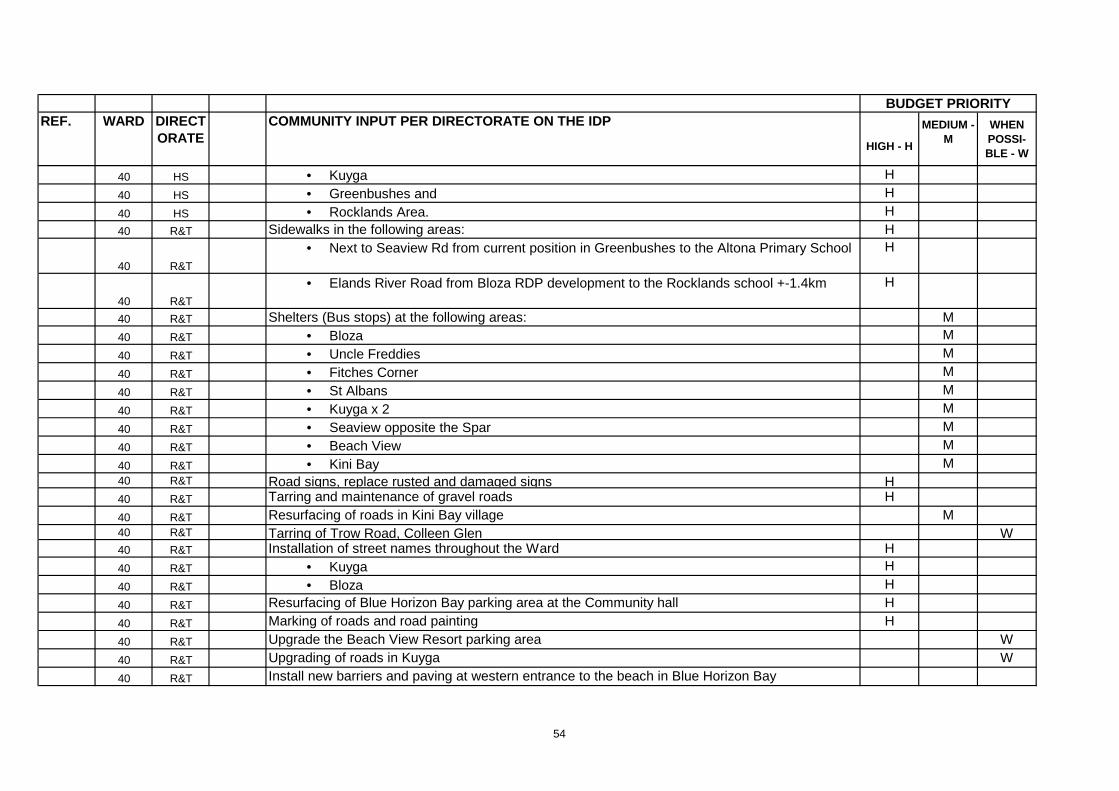
REF. WARD DIRECTORATE
COMMUNITY INPUT PER DIRECTORATE ON THE IDP
HIGH - H
MEDIUM - M
WHEN POSSI-BLE - W
BUDGET PRIORITY
40 HS • Kuyga H
40 HS • Greenbushes and H
40 HS • Rocklands Area. H40 R&T Sidewalks in the following areas: H
40 R&T
• Next to Seaview Rd from current position in Greenbushes to the Altona Primary School H
40 R&T
• Elands River Road from Bloza RDP development to the Rocklands school +-1.4km H
40 R&T Shelters (Bus stops) at the following areas: M40 R&T • Bloza M
40 R&T • Uncle Freddies M
40 R&T • Fitches Corner M
40 R&T • St Albans M
40 R&T • Kuyga x 2 M
40 R&T • Seaview opposite the Spar M
40 R&T • Beach View M
40 R&T • Kini Bay M40 R&T Road signs, replace rusted and damaged signs H40 R&T Tarring and maintenance of gravel roads H
40 R&T Resurfacing of roads in Kini Bay village M40 R&T Tarring of Trow Road, Colleen Glen W40 R&T Installation of street names throughout the Ward H40 R&T • Kuyga H
40 R&T • Bloza H
40 R&T Resurfacing of Blue Horizon Bay parking area at the Community hall H
40 R&T Marking of roads and road painting H
40 R&T Upgrade the Beach View Resort parking area W
40 R&T Upgrading of roads in Kuyga W
40 R&T Install new barriers and paving at western entrance to the beach in Blue Horizon Bay
54
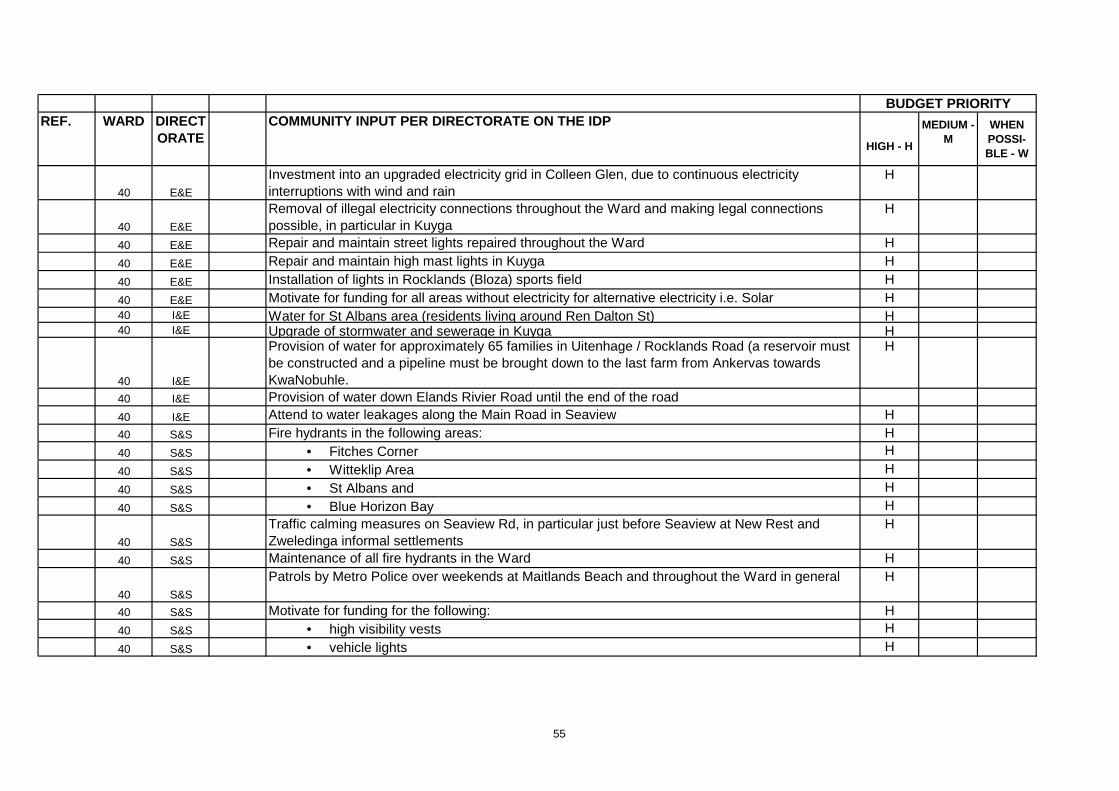
REF. WARD DIRECTORATE
COMMUNITY INPUT PER DIRECTORATE ON THE IDP
HIGH - H
MEDIUM - M
WHEN POSSI-BLE - W
BUDGET PRIORITY
40 E&E
Investment into an upgraded electricity grid in Colleen Glen, due to continuous electricity interruptions with wind and rain
H
40 E&E
Removal of illegal electricity connections throughout the Ward and making legal connections possible, in particular in Kuyga
H
40 E&E Repair and maintain street lights repaired throughout the Ward H
40 E&E Repair and maintain high mast lights in Kuyga H
40 E&E Installation of lights in Rocklands (Bloza) sports field H
40 E&E Motivate for funding for all areas without electricity for alternative electricity i.e. Solar H40 I&E Water for St Albans area (residents living around Ren Dalton St) H40 I&E Upgrade of stormwater and sewerage in Kuyga H
40 I&E
Provision of water for approximately 65 families in Uitenhage / Rocklands Road (a reservoir must be constructed and a pipeline must be brought down to the last farm from Ankervas towards KwaNobuhle.
H
40 I&E Provision of water down Elands Rivier Road until the end of the road40 I&E Attend to water leakages along the Main Road in Seaview H40 S&S Fire hydrants in the following areas: H40 S&S • Fitches Corner H
40 S&S • Witteklip Area H
40 S&S • St Albans and H
40 S&S • Blue Horizon Bay H
40 S&S
Traffic calming measures on Seaview Rd, in particular just before Seaview at New Rest and Zweledinga informal settlements
H
40 S&S Maintenance of all fire hydrants in the Ward H
40 S&S
Patrols by Metro Police over weekends at Maitlands Beach and throughout the Ward in general H
40 S&S Motivate for funding for the following: H40 S&S • high visibility vests H
40 S&S • vehicle lights H
55
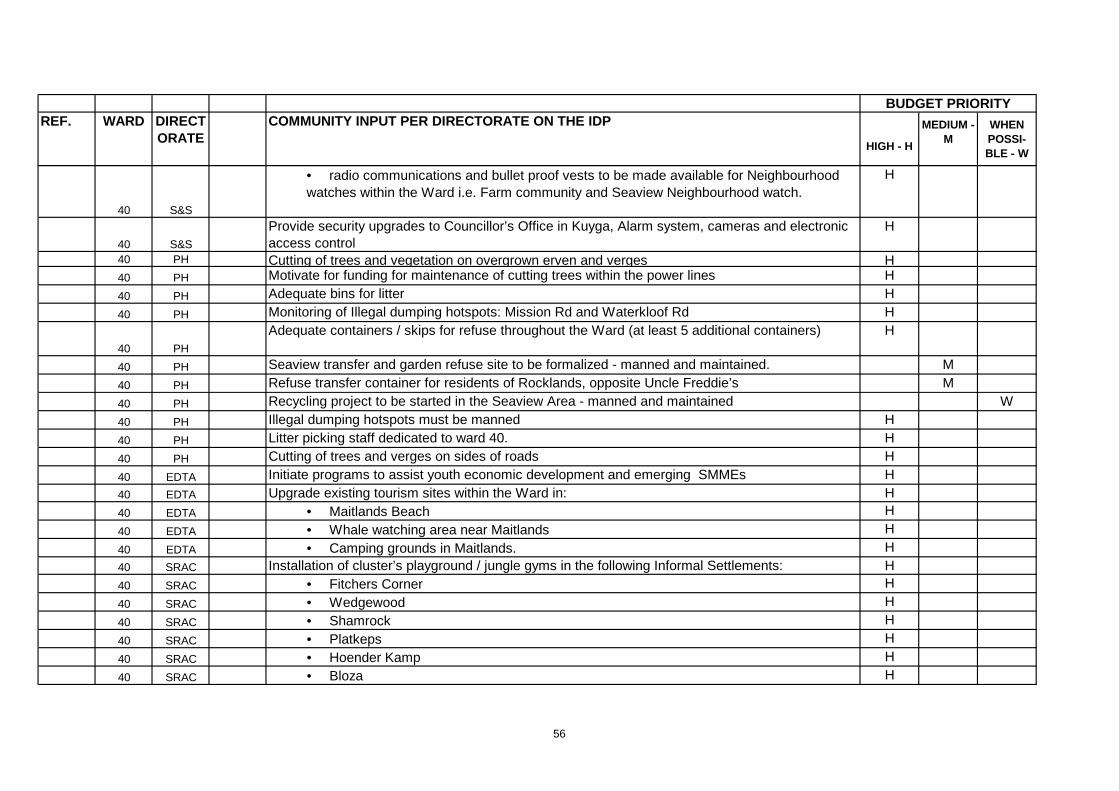
REF. WARD DIRECTORATE
COMMUNITY INPUT PER DIRECTORATE ON THE IDP
HIGH - H
MEDIUM - M
WHEN POSSI-BLE - W
BUDGET PRIORITY
40 S&S
• radio communications and bullet proof vests to be made available for Neighbourhood watches within the Ward i.e. Farm community and Seaview Neighbourhood watch.
H
40 S&S
Provide security upgrades to Councillor’s Office in Kuyga, Alarm system, cameras and electronic access control
H
40 PH Cutting of trees and vegetation on overgrown erven and verges H40 PH Motivate for funding for maintenance of cutting trees within the power lines H
40 PH Adequate bins for litter H
40 PH Monitoring of Illegal dumping hotspots: Mission Rd and Waterkloof Rd H
40 PH
Adequate containers / skips for refuse throughout the Ward (at least 5 additional containers) H
40 PH Seaview transfer and garden refuse site to be formalized - manned and maintained. M
40 PH Refuse transfer container for residents of Rocklands, opposite Uncle Freddie’s M
40 PH Recycling project to be started in the Seaview Area - manned and maintained W
40 PH Illegal dumping hotspots must be manned H
40 PH Litter picking staff dedicated to ward 40. H
40 PH Cutting of trees and verges on sides of roads H
40 EDTA Initiate programs to assist youth economic development and emerging SMMEs H40 EDTA Upgrade existing tourism sites within the Ward in: H40 EDTA • Maitlands Beach H
40 EDTA • Whale watching area near Maitlands H
40 EDTA • Camping grounds in Maitlands. H40 SRAC Installation of cluster’s playground / jungle gyms in the following Informal Settlements: H40 SRAC • Fitchers Corner H
40 SRAC • Wedgewood H
40 SRAC • Shamrock H
40 SRAC • Platkeps H
40 SRAC • Hoender Kamp H
40 SRAC • Bloza H
56
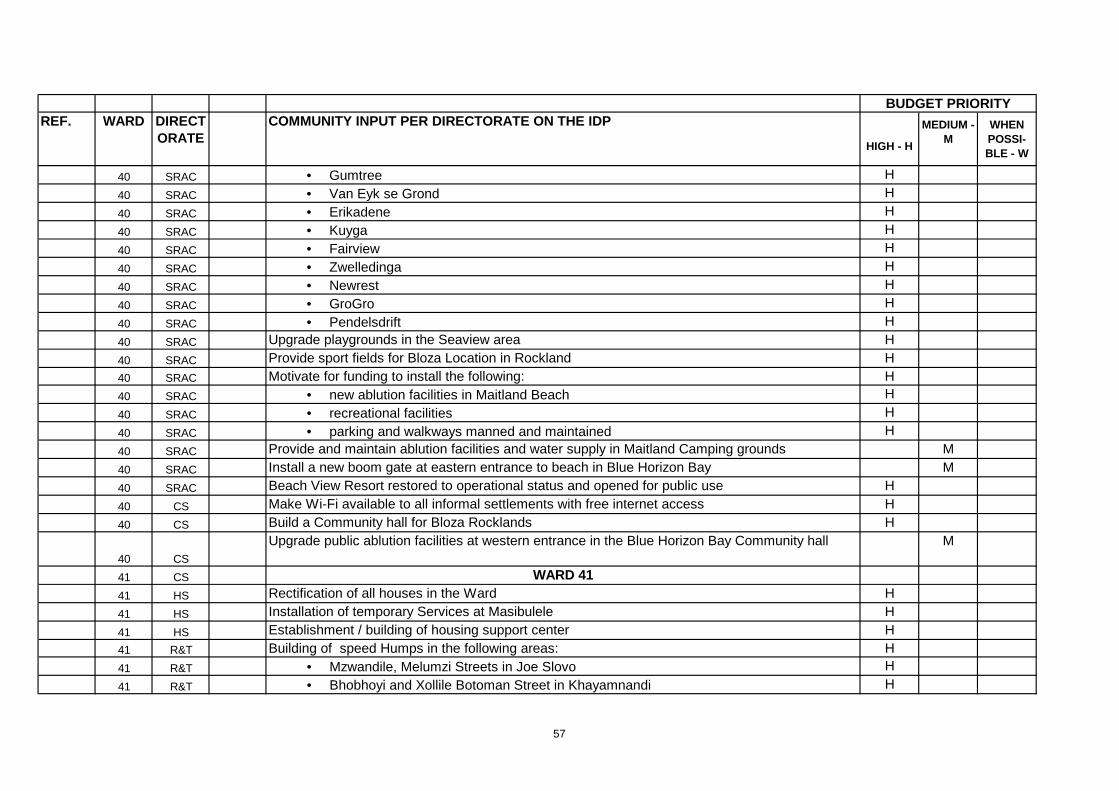
REF. WARD DIRECTORATE
COMMUNITY INPUT PER DIRECTORATE ON THE IDP
HIGH - H
MEDIUM - M
WHEN POSSI-BLE - W
BUDGET PRIORITY
40 SRAC • Gumtree H
40 SRAC • Van Eyk se Grond H
40 SRAC • Erikadene H
40 SRAC • Kuyga H
40 SRAC • Fairview H
40 SRAC • Zwelledinga H
40 SRAC • Newrest H
40 SRAC • GroGro H
40 SRAC • Pendelsdrift H
40 SRAC Upgrade playgrounds in the Seaview area H
40 SRAC Provide sport fields for Bloza Location in Rockland H40 SRAC Motivate for funding to install the following: H40 SRAC • new ablution facilities in Maitland Beach H
40 SRAC • recreational facilities H
40 SRAC • parking and walkways manned and maintained H
40 SRAC Provide and maintain ablution facilities and water supply in Maitland Camping grounds M
40 SRAC Install a new boom gate at eastern entrance to beach in Blue Horizon Bay M
40 SRAC Beach View Resort restored to operational status and opened for public use H
40 CS Make Wi-Fi available to all informal settlements with free internet access H
40 CS Build a Community hall for Bloza Rocklands H
40 CS
Upgrade public ablution facilities at western entrance in the Blue Horizon Bay Community hall M
41 CS WARD 4141 HS Rectification of all houses in the Ward H
41 HS Installation of temporary Services at Masibulele H
41 HS Establishment / building of housing support center H41 R&T Building of speed Humps in the following areas: H41 R&T • Mzwandile, Melumzi Streets in Joe Slovo H
41 R&T • Bhobhoyi and Xollile Botoman Street in Khayamnandi H
57
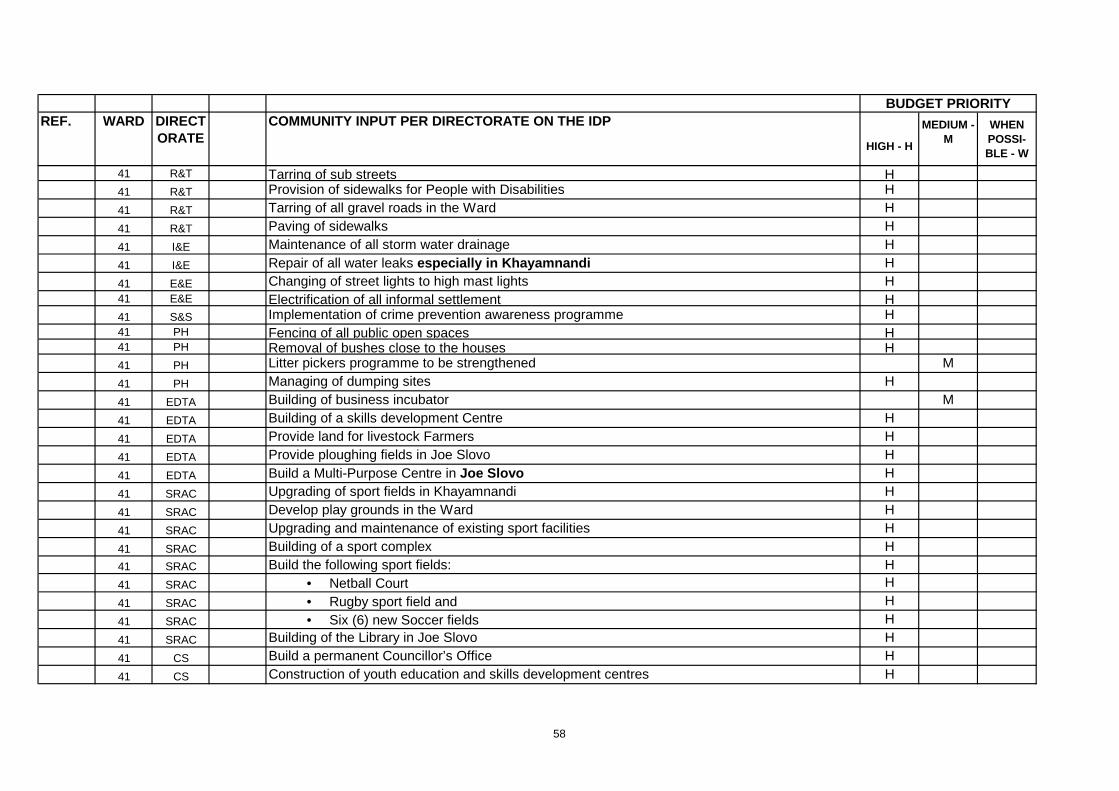
REF. WARD DIRECTORATE
COMMUNITY INPUT PER DIRECTORATE ON THE IDP
HIGH - H
MEDIUM - M
WHEN POSSI-BLE - W
BUDGET PRIORITY
41 R&T Tarring of sub streets H41 R&T Provision of sidewalks for People with Disabilities H
41 R&T Tarring of all gravel roads in the Ward H
41 R&T Paving of sidewalks H
41 I&E Maintenance of all storm water drainage H
41 I&E Repair of all water leaks especially in Khayamnandi H
41 E&E Changing of street lights to high mast lights H41 E&E Electrification of all informal settlement H41 S&S Implementation of crime prevention awareness programme H41 PH Fencing of all public open spaces H41 PH Removal of bushes close to the houses H41 PH Litter pickers programme to be strengthened M
41 PH Managing of dumping sites H
41 EDTA Building of business incubator M
41 EDTA Building of a skills development Centre H
41 EDTA Provide land for livestock Farmers H
41 EDTA Provide ploughing fields in Joe Slovo H
41 EDTA Build a Multi-Purpose Centre in Joe Slovo H
41 SRAC Upgrading of sport fields in Khayamnandi H
41 SRAC Develop play grounds in the Ward H
41 SRAC Upgrading and maintenance of existing sport facilities H
41 SRAC Building of a sport complex H41 SRAC Build the following sport fields: H41 SRAC • Netball Court H
41 SRAC • Rugby sport field and H
41 SRAC • Six (6) new Soccer fields H
41 SRAC Building of the Library in Joe Slovo H
41 CS Build a permanent Councillor’s Office H
41 CS Construction of youth education and skills development centres H
58
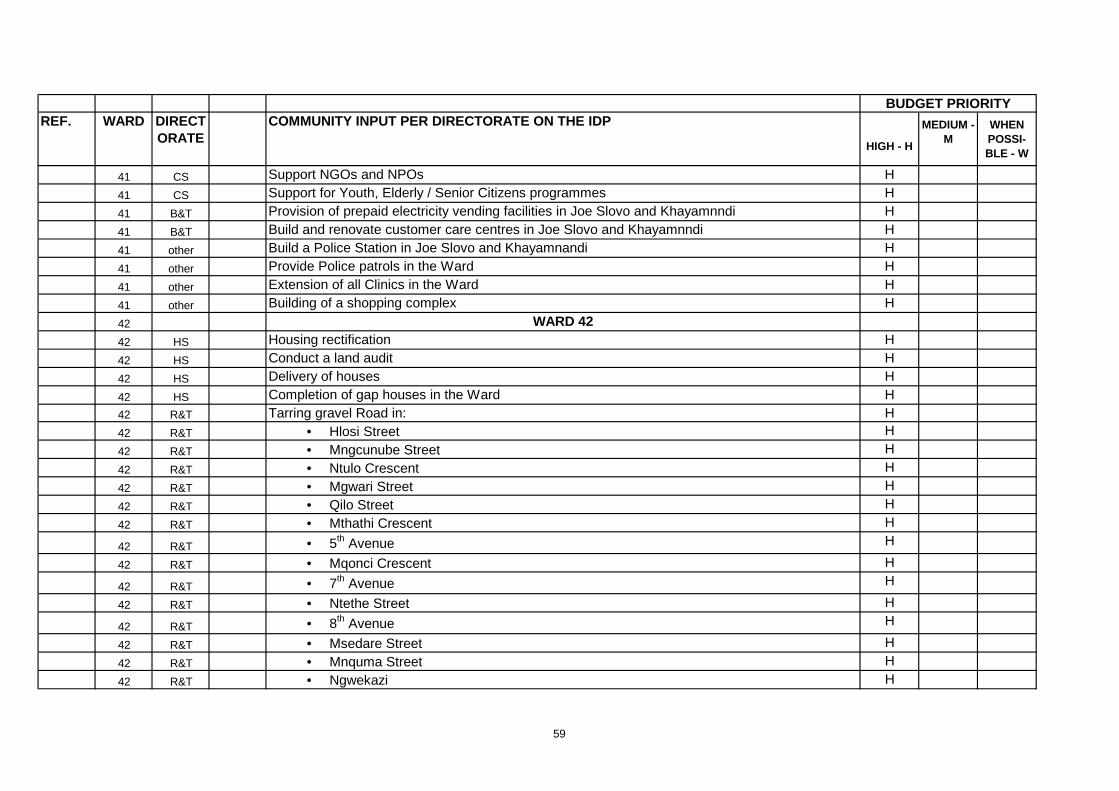
REF. WARD DIRECTORATE
COMMUNITY INPUT PER DIRECTORATE ON THE IDP
HIGH - H
MEDIUM - M
WHEN POSSI-BLE - W
BUDGET PRIORITY
41 CS Support NGOs and NPOs H
41 CS Support for Youth, Elderly / Senior Citizens programmes H
41 B&T Provision of prepaid electricity vending facilities in Joe Slovo and Khayamnndi H
41 B&T Build and renovate customer care centres in Joe Slovo and Khayamnndi H
41 other Build a Police Station in Joe Slovo and Khayamnandi H
41 other Provide Police patrols in the Ward H
41 other Extension of all Clinics in the Ward H
41 other Building of a shopping complex H
42 WARD 4242 HS Housing rectification H
42 HS Conduct a land audit H
42 HS Delivery of houses H
42 HS Completion of gap houses in the Ward H42 R&T Tarring gravel Road in: H42 R&T • Hlosi Street H
42 R&T • Mngcunube Street H
42 R&T • Ntulo Crescent H
42 R&T • Mgwari Street H
42 R&T • Qilo Street H
42 R&T • Mthathi Crescent H
42 R&T • 5th Avenue H
42 R&T • Mqonci Crescent H
42 R&T • 7th Avenue H
42 R&T • Ntethe Street H
42 R&T • 8th Avenue H
42 R&T • Msedare Street H
42 R&T • Mnquma Street H
42 R&T • Ngwekazi H
59
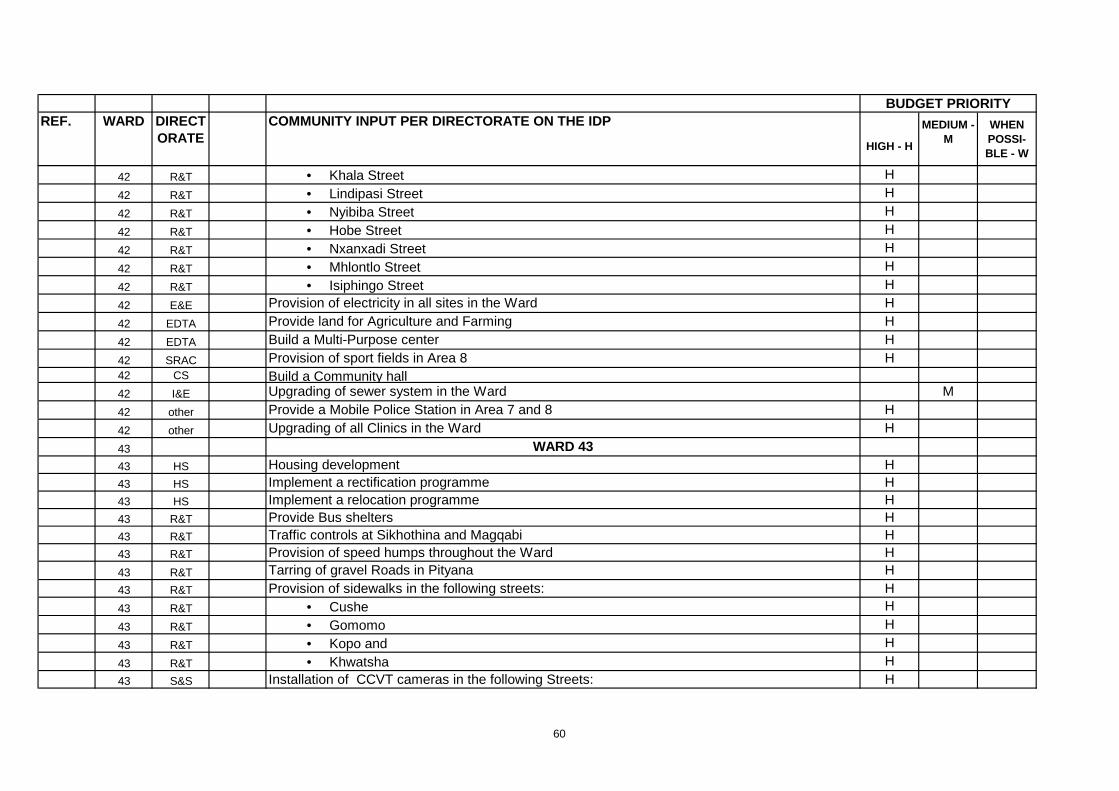
REF. WARD DIRECTORATE
COMMUNITY INPUT PER DIRECTORATE ON THE IDP
HIGH - H
MEDIUM - M
WHEN POSSI-BLE - W
BUDGET PRIORITY
42 R&T • Khala Street H
42 R&T • Lindipasi Street H
42 R&T • Nyibiba Street H
42 R&T • Hobe Street H
42 R&T • Nxanxadi Street H
42 R&T • Mhlontlo Street H
42 R&T • Isiphingo Street H
42 E&E Provision of electricity in all sites in the Ward H
42 EDTA Provide land for Agriculture and Farming H
42 EDTA Build a Multi-Purpose center H
42 SRAC Provision of sport fields in Area 8 H42 CS Build a Community hall 42 I&E Upgrading of sewer system in the Ward M
42 other Provide a Mobile Police Station in Area 7 and 8 H
42 other Upgrading of all Clinics in the Ward H
43 WARD 4343 HS Housing development H43 HS Implement a rectification programme H43 HS Implement a relocation programme H43 R&T Provide Bus shelters H43 R&T Traffic controls at Sikhothina and Magqabi H43 R&T Provision of speed humps throughout the Ward H43 R&T Tarring of gravel Roads in Pityana H43 R&T Provision of sidewalks in the following streets: H43 R&T • Cushe H
43 R&T • Gomomo H
43 R&T • Kopo and H
43 R&T • Khwatsha H43 S&S Installation of CCVT cameras in the following Streets: H
60
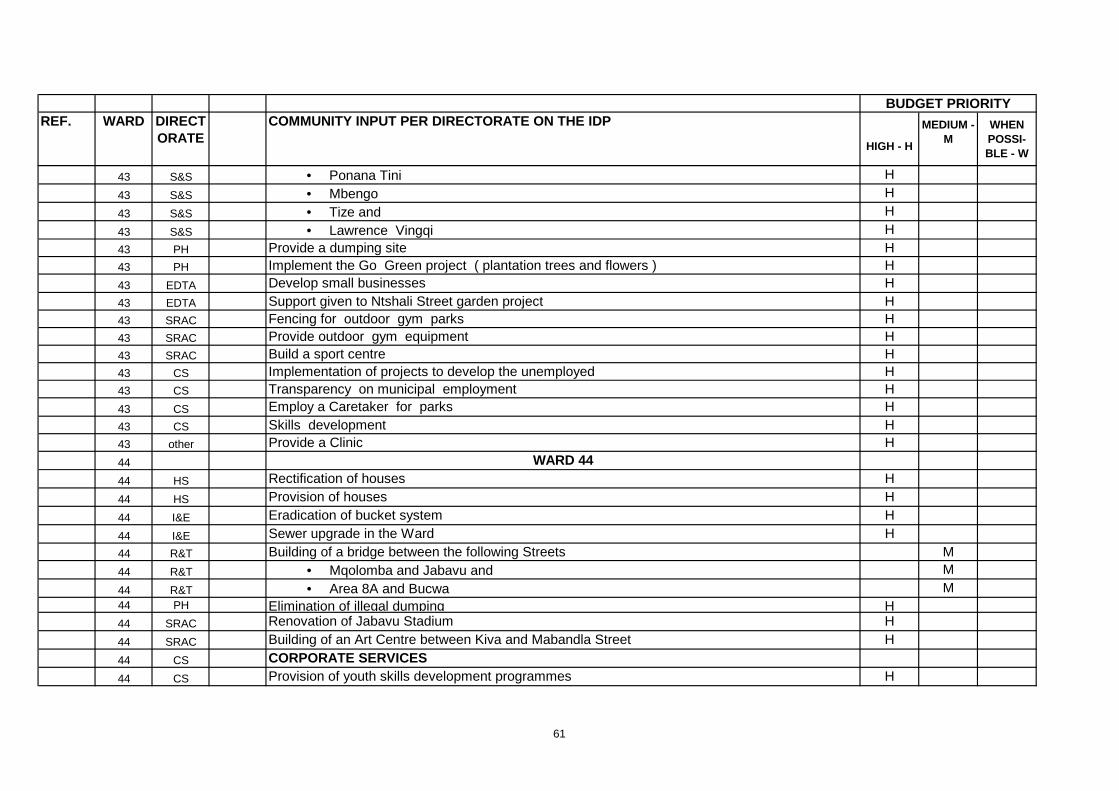
REF. WARD DIRECTORATE
COMMUNITY INPUT PER DIRECTORATE ON THE IDP
HIGH - H
MEDIUM - M
WHEN POSSI-BLE - W
BUDGET PRIORITY
43 S&S • Ponana Tini H
43 S&S • Mbengo H
43 S&S • Tize and H
43 S&S • Lawrence Vingqi H43 PH Provide a dumping site H43 PH Implement the Go Green project ( plantation trees and flowers ) H43 EDTA Develop small businesses H43 EDTA Support given to Ntshali Street garden project H43 SRAC Fencing for outdoor gym parks H43 SRAC Provide outdoor gym equipment H43 SRAC Build a sport centre H43 CS Implementation of projects to develop the unemployed H43 CS Transparency on municipal employment H43 CS Employ a Caretaker for parks H43 CS Skills development H43 other Provide a Clinic H44 WARD 4444 HS Rectification of houses H
44 HS Provision of houses H
44 I&E Eradication of bucket system H
44 I&E Sewer upgrade in the Ward H44 R&T Building of a bridge between the following Streets M44 R&T • Mqolomba and Jabavu and M
44 R&T • Area 8A and Bucwa M44 PH Elimination of illegal dumping H44 SRAC Renovation of Jabavu Stadium H
44 SRAC Building of an Art Centre between Kiva and Mabandla Street H
44 CS CORPORATE SERVICES44 CS Provision of youth skills development programmes H
61
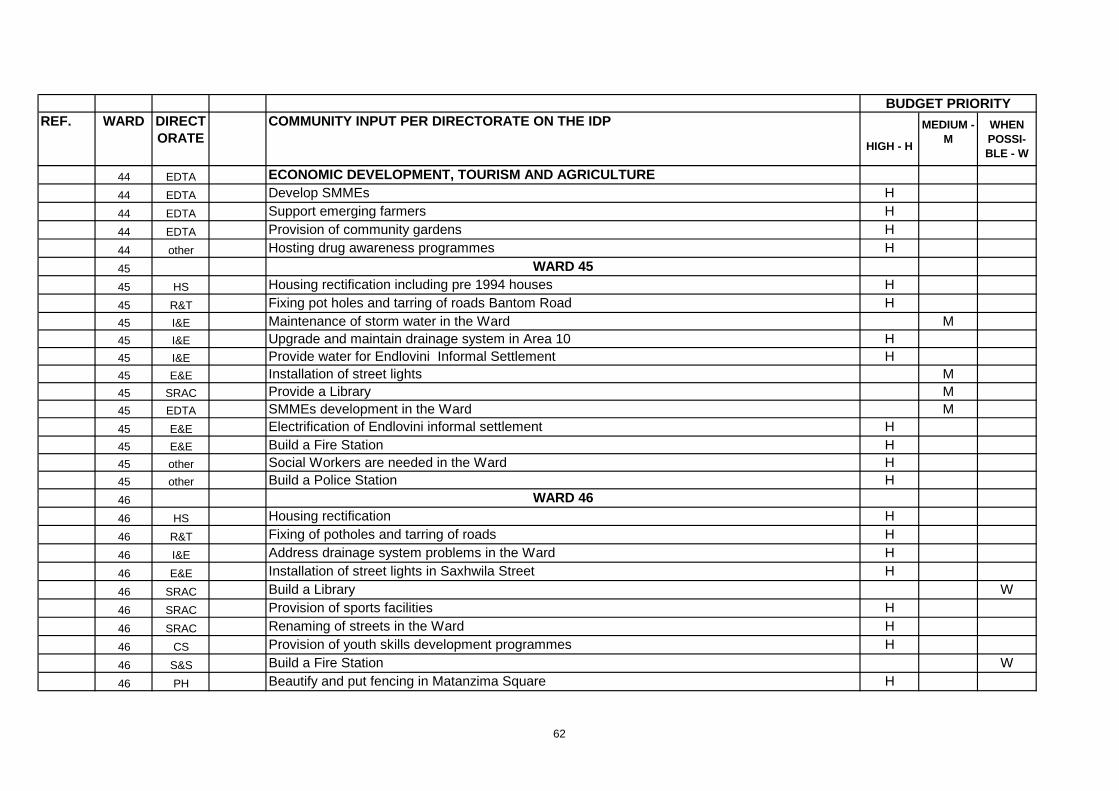
REF. WARD DIRECTORATE
COMMUNITY INPUT PER DIRECTORATE ON THE IDP
HIGH - H
MEDIUM - M
WHEN POSSI-BLE - W
BUDGET PRIORITY
44 EDTA ECONOMIC DEVELOPMENT, TOURISM AND AGRICULTURE44 EDTA Develop SMMEs H
44 EDTA Support emerging farmers H
44 EDTA Provision of community gardens H
44 other Hosting drug awareness programmes H
45 WARD 4545 HS Housing rectification including pre 1994 houses H
45 R&T Fixing pot holes and tarring of roads Bantom Road H 45 I&E Maintenance of storm water in the Ward M45 I&E Upgrade and maintain drainage system in Area 10 H45 I&E Provide water for Endlovini Informal Settlement H45 E&E Installation of street lights M45 SRAC Provide a Library M45 EDTA SMMEs development in the Ward M45 E&E Electrification of Endlovini informal settlement H45 E&E Build a Fire Station H45 other Social Workers are needed in the Ward H45 other Build a Police Station H46 WARD 4646 HS Housing rectification H
46 R&T Fixing of potholes and tarring of roads H
46 I&E Address drainage system problems in the Ward H
46 E&E Installation of street lights in Saxhwila Street H
46 SRAC Build a Library W
46 SRAC Provision of sports facilities H
46 SRAC Renaming of streets in the Ward H
46 CS Provision of youth skills development programmes H
46 S&S Build a Fire Station W
46 PH Beautify and put fencing in Matanzima Square H
62
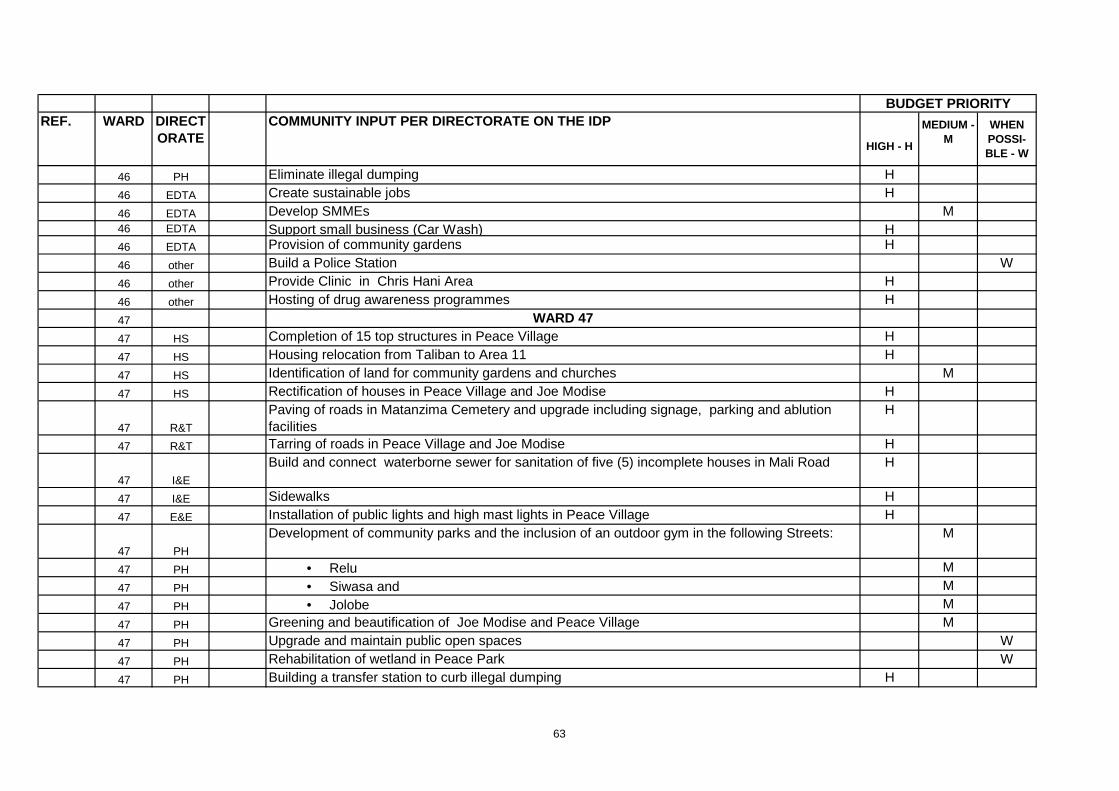
REF. WARD DIRECTORATE
COMMUNITY INPUT PER DIRECTORATE ON THE IDP
HIGH - H
MEDIUM - M
WHEN POSSI-BLE - W
BUDGET PRIORITY
46 PH Eliminate illegal dumping H
46 EDTA Create sustainable jobs H
46 EDTA Develop SMMEs M46 EDTA Support small business (Car Wash) H46 EDTA Provision of community gardens H
46 other Build a Police Station W
46 other Provide Clinic in Chris Hani Area H
46 other Hosting of drug awareness programmes H
47 WARD 4747 HS Completion of 15 top structures in Peace Village H
47 HS Housing relocation from Taliban to Area 11 H
47 HS Identification of land for community gardens and churches M
47 HS Rectification of houses in Peace Village and Joe Modise H
47 R&T
Paving of roads in Matanzima Cemetery and upgrade including signage, parking and ablution facilities
H
47 R&T Tarring of roads in Peace Village and Joe Modise H
47 I&E
Build and connect waterborne sewer for sanitation of five (5) incomplete houses in Mali Road H
47 I&E Sidewalks H
47 E&E Installation of public lights and high mast lights in Peace Village H
47 PH
Development of community parks and the inclusion of an outdoor gym in the following Streets: M
47 PH • Relu M
47 PH • Siwasa and M
47 PH • Jolobe M
47 PH Greening and beautification of Joe Modise and Peace Village M
47 PH Upgrade and maintain public open spaces W
47 PH Rehabilitation of wetland in Peace Park W
47 PH Building a transfer station to curb illegal dumping H
63
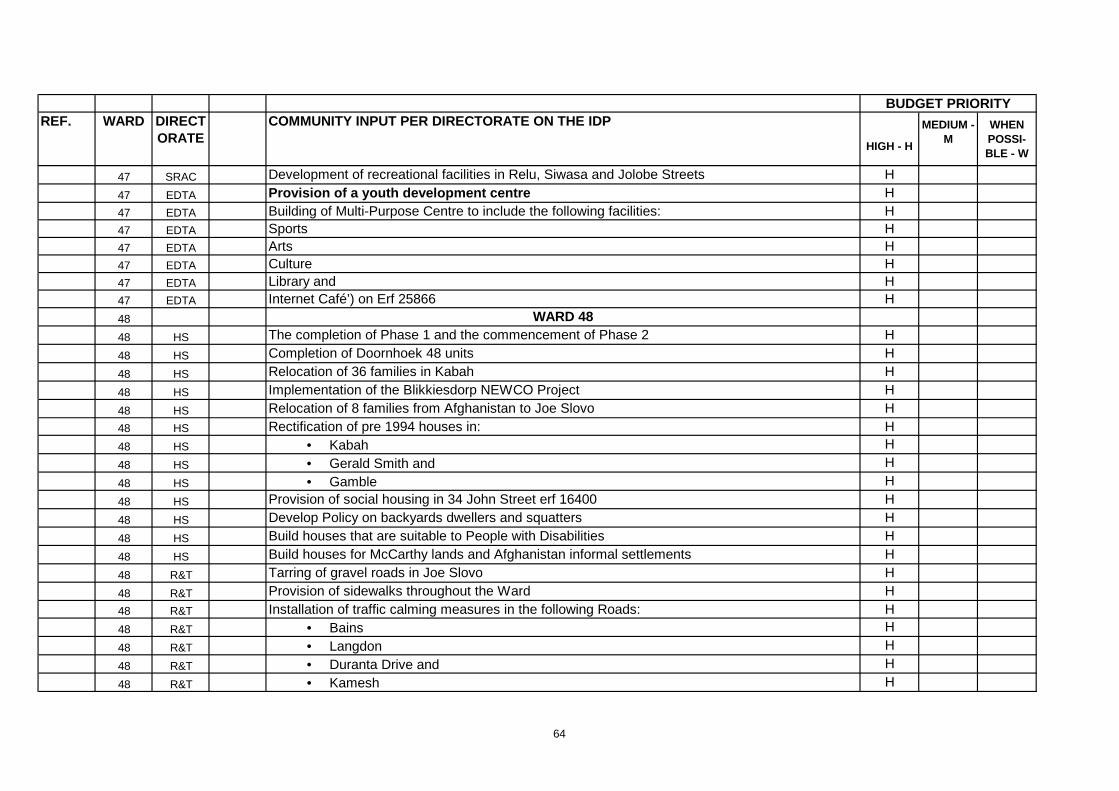
REF. WARD DIRECTORATE
COMMUNITY INPUT PER DIRECTORATE ON THE IDP
HIGH - H
MEDIUM - M
WHEN POSSI-BLE - W
BUDGET PRIORITY
47 SRAC Development of recreational facilities in Relu, Siwasa and Jolobe Streets H
47 EDTA Provision of a youth development centre H47 EDTA Building of Multi-Purpose Centre to include the following facilities: H47 EDTA Sports H47 EDTA Arts H47 EDTA Culture H47 EDTA Library and H47 EDTA Internet Café’) on Erf 25866 H48 WARD 4848 HS The completion of Phase 1 and the commencement of Phase 2 H
48 HS Completion of Doornhoek 48 units H
48 HS Relocation of 36 families in Kabah H
48 HS Implementation of the Blikkiesdorp NEWCO Project H
48 HS Relocation of 8 families from Afghanistan to Joe Slovo H48 HS Rectification of pre 1994 houses in: H48 HS • Kabah H
48 HS • Gerald Smith and H
48 HS • Gamble H
48 HS Provision of social housing in 34 John Street erf 16400 H
48 HS Develop Policy on backyards dwellers and squatters H
48 HS Build houses that are suitable to People with Disabilities H
48 HS Build houses for McCarthy lands and Afghanistan informal settlements H
48 R&T Tarring of gravel roads in Joe Slovo H
48 R&T Provision of sidewalks throughout the Ward H48 R&T Installation of traffic calming measures in the following Roads: H48 R&T • Bains H
48 R&T • Langdon H
48 R&T • Duranta Drive and H
48 R&T • Kamesh H
64
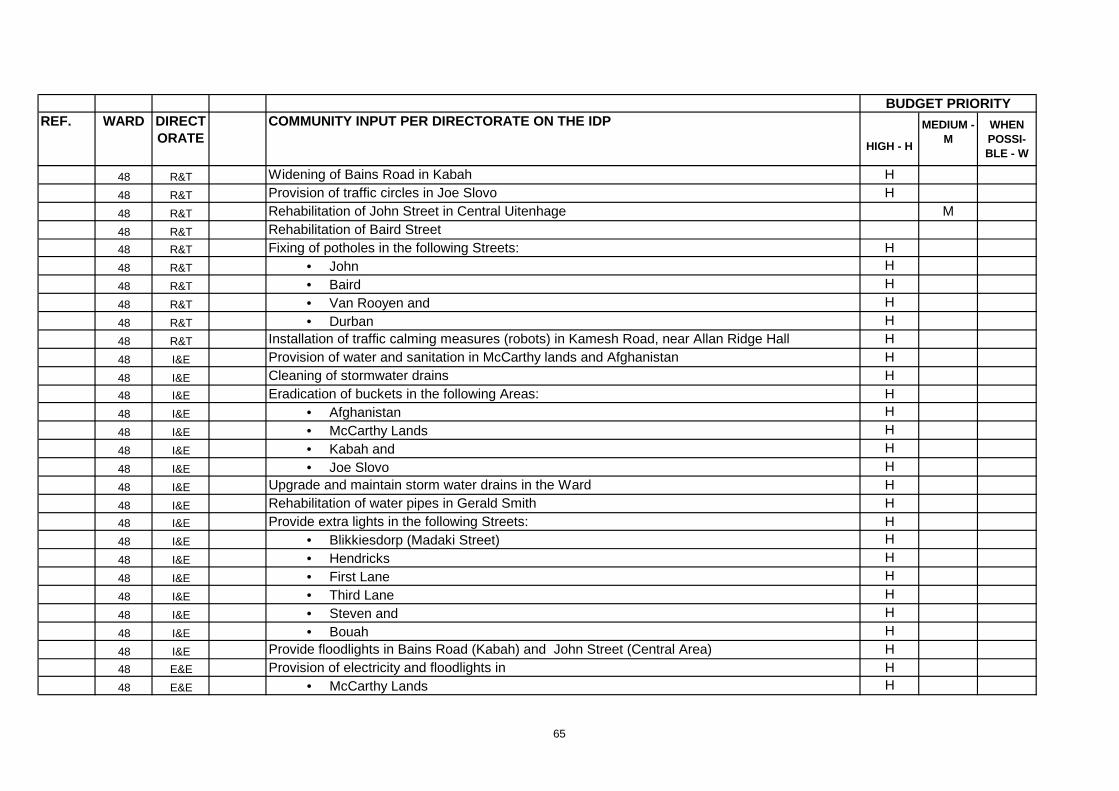
REF. WARD DIRECTORATE
COMMUNITY INPUT PER DIRECTORATE ON THE IDP
HIGH - H
MEDIUM - M
WHEN POSSI-BLE - W
BUDGET PRIORITY
48 R&T Widening of Bains Road in Kabah H
48 R&T Provision of traffic circles in Joe Slovo H
48 R&T Rehabilitation of John Street in Central Uitenhage M
48 R&T Rehabilitation of Baird Street48 R&T Fixing of potholes in the following Streets: H48 R&T • John H
48 R&T • Baird H
48 R&T • Van Rooyen and H
48 R&T • Durban H
48 R&T Installation of traffic calming measures (robots) in Kamesh Road, near Allan Ridge Hall H
48 I&E Provision of water and sanitation in McCarthy lands and Afghanistan H
48 I&E Cleaning of stormwater drains H48 I&E Eradication of buckets in the following Areas: H48 I&E • Afghanistan H
48 I&E • McCarthy Lands H
48 I&E • Kabah and H
48 I&E • Joe Slovo H
48 I&E Upgrade and maintain storm water drains in the Ward H
48 I&E Rehabilitation of water pipes in Gerald Smith H48 I&E Provide extra lights in the following Streets: H48 I&E • Blikkiesdorp (Madaki Street) H
48 I&E • Hendricks H
48 I&E • First Lane H
48 I&E • Third Lane H
48 I&E • Steven and H
48 I&E • Bouah H
48 I&E Provide floodlights in Bains Road (Kabah) and John Street (Central Area) H48 E&E Provision of electricity and floodlights in H48 E&E • McCarthy Lands H
65
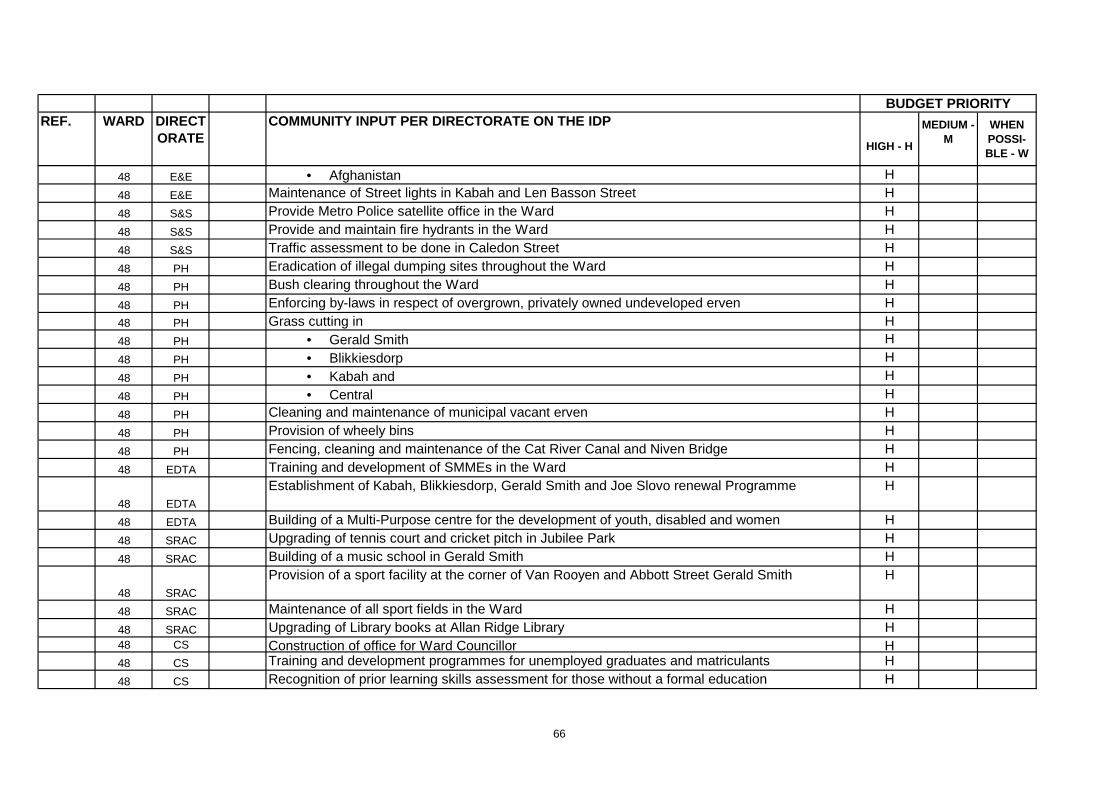
REF. WARD DIRECTORATE
COMMUNITY INPUT PER DIRECTORATE ON THE IDP
HIGH - H
MEDIUM - M
WHEN POSSI-BLE - W
BUDGET PRIORITY
48 E&E • Afghanistan H
48 E&E Maintenance of Street lights in Kabah and Len Basson Street H
48 S&S Provide Metro Police satellite office in the Ward H
48 S&S Provide and maintain fire hydrants in the Ward H
48 S&S Traffic assessment to be done in Caledon Street H
48 PH Eradication of illegal dumping sites throughout the Ward H
48 PH Bush clearing throughout the Ward H
48 PH Enforcing by-laws in respect of overgrown, privately owned undeveloped erven H48 PH Grass cutting in H48 PH • Gerald Smith H
48 PH • Blikkiesdorp H
48 PH • Kabah and H
48 PH • Central H
48 PH Cleaning and maintenance of municipal vacant erven H
48 PH Provision of wheely bins H
48 PH Fencing, cleaning and maintenance of the Cat River Canal and Niven Bridge H
48 EDTA Training and development of SMMEs in the Ward H
48 EDTA
Establishment of Kabah, Blikkiesdorp, Gerald Smith and Joe Slovo renewal Programme H
48 EDTA Building of a Multi-Purpose centre for the development of youth, disabled and women H
48 SRAC Upgrading of tennis court and cricket pitch in Jubilee Park H
48 SRAC Building of a music school in Gerald Smith H
48 SRAC
Provision of a sport facility at the corner of Van Rooyen and Abbott Street Gerald Smith H
48 SRAC Maintenance of all sport fields in the Ward H
48 SRAC Upgrading of Library books at Allan Ridge Library H48 CS Construction of office for Ward Councillor H48 CS Training and development programmes for unemployed graduates and matriculants H
48 CS Recognition of prior learning skills assessment for those without a formal education H
66
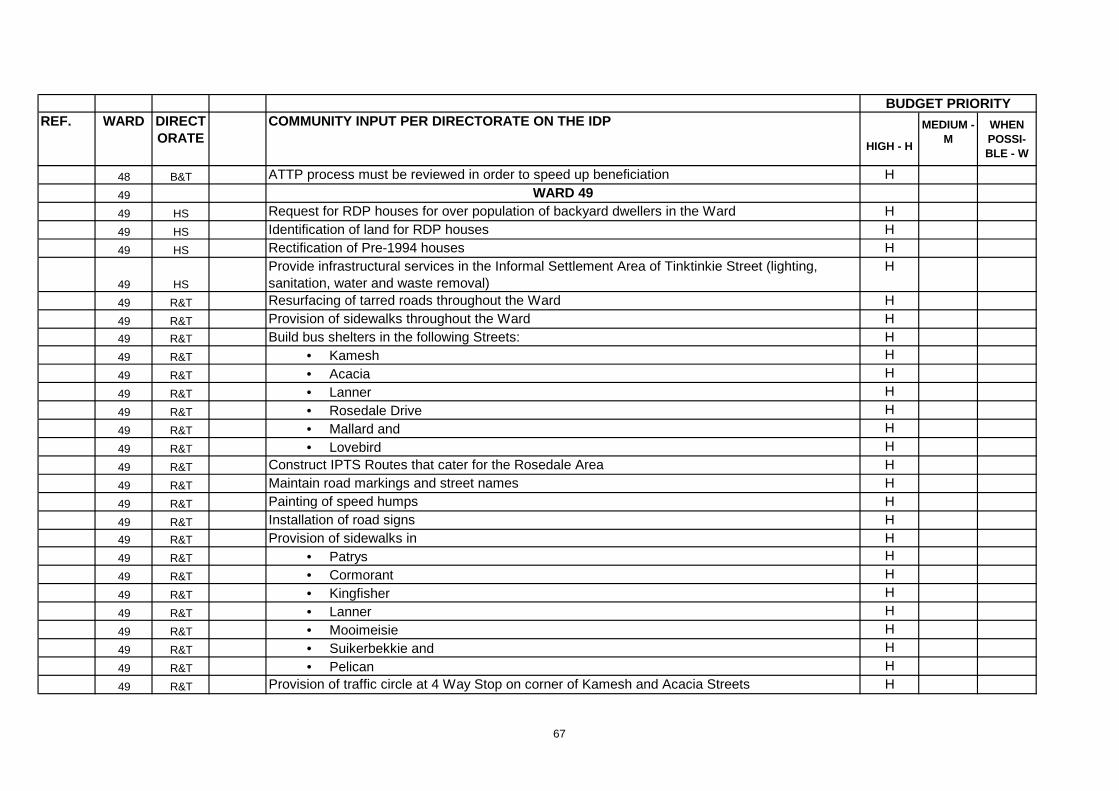
REF. WARD DIRECTORATE
COMMUNITY INPUT PER DIRECTORATE ON THE IDP
HIGH - H
MEDIUM - M
WHEN POSSI-BLE - W
BUDGET PRIORITY
48 B&T ATTP process must be reviewed in order to speed up beneficiation H
49 WARD 4949 HS Request for RDP houses for over population of backyard dwellers in the Ward H
49 HS Identification of land for RDP houses H
49 HS Rectification of Pre-1994 houses H
49 HS
Provide infrastructural services in the Informal Settlement Area of Tinktinkie Street (lighting, sanitation, water and waste removal)
H
49 R&T Resurfacing of tarred roads throughout the Ward H
49 R&T Provision of sidewalks throughout the Ward H49 R&T Build bus shelters in the following Streets: H49 R&T • Kamesh H
49 R&T • Acacia H
49 R&T • Lanner H
49 R&T • Rosedale Drive H
49 R&T • Mallard and H
49 R&T • Lovebird H
49 R&T Construct IPTS Routes that cater for the Rosedale Area H
49 R&T Maintain road markings and street names H
49 R&T Painting of speed humps H
49 R&T Installation of road signs H49 R&T Provision of sidewalks in H49 R&T • Patrys H
49 R&T • Cormorant H
49 R&T • Kingfisher H
49 R&T • Lanner H
49 R&T • Mooimeisie H
49 R&T • Suikerbekkie and H
49 R&T • Pelican H
49 R&T Provision of traffic circle at 4 Way Stop on corner of Kamesh and Acacia Streets H
67
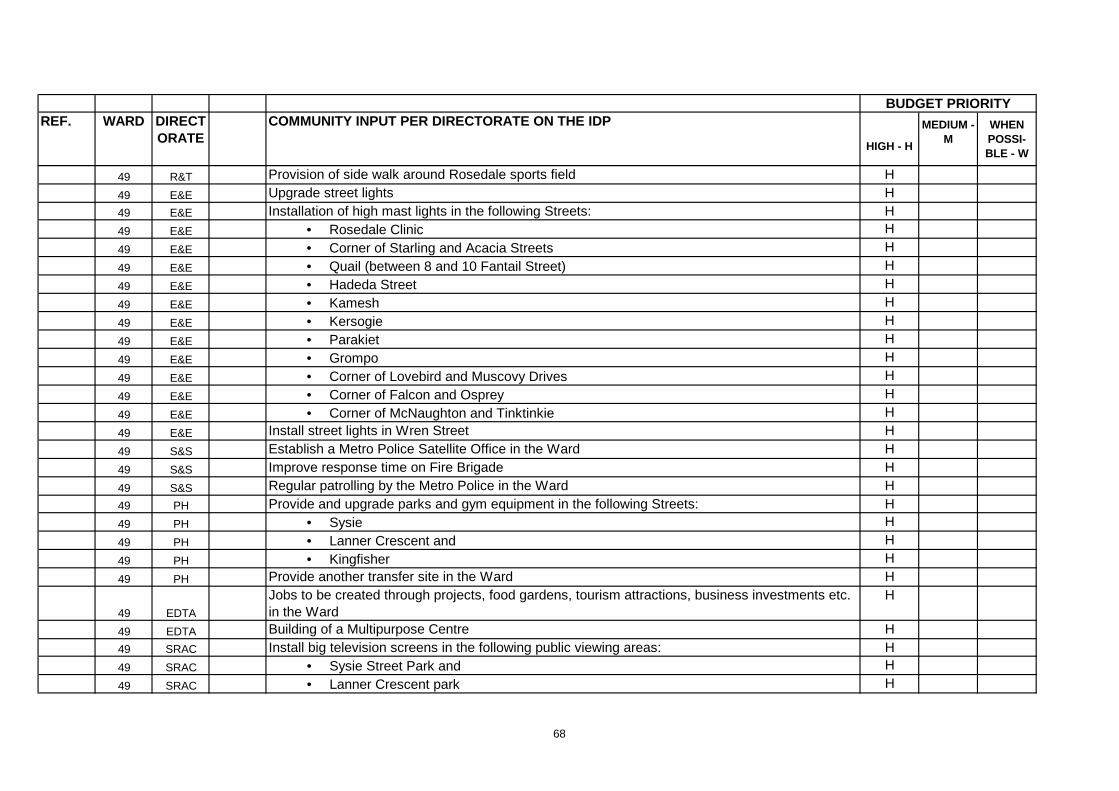
REF. WARD DIRECTORATE
COMMUNITY INPUT PER DIRECTORATE ON THE IDP
HIGH - H
MEDIUM - M
WHEN POSSI-BLE - W
BUDGET PRIORITY
49 R&T Provision of side walk around Rosedale sports field H
49 E&E Upgrade street lights H49 E&E Installation of high mast lights in the following Streets: H49 E&E • Rosedale Clinic H
49 E&E • Corner of Starling and Acacia Streets H
49 E&E • Quail (between 8 and 10 Fantail Street) H
49 E&E • Hadeda Street H
49 E&E • Kamesh H
49 E&E • Kersogie H
49 E&E • Parakiet H
49 E&E • Grompo H
49 E&E • Corner of Lovebird and Muscovy Drives H
49 E&E • Corner of Falcon and Osprey H
49 E&E • Corner of McNaughton and Tinktinkie H
49 E&E Install street lights in Wren Street H
49 S&S Establish a Metro Police Satellite Office in the Ward H
49 S&S Improve response time on Fire Brigade H
49 S&S Regular patrolling by the Metro Police in the Ward H49 PH Provide and upgrade parks and gym equipment in the following Streets: H49 PH • Sysie H
49 PH • Lanner Crescent and H
49 PH • Kingfisher H
49 PH Provide another transfer site in the Ward H
49 EDTA
Jobs to be created through projects, food gardens, tourism attractions, business investments etc. in the Ward
H
49 EDTA Building of a Multipurpose Centre H49 SRAC Install big television screens in the following public viewing areas: H49 SRAC • Sysie Street Park and H
49 SRAC • Lanner Crescent park H
68
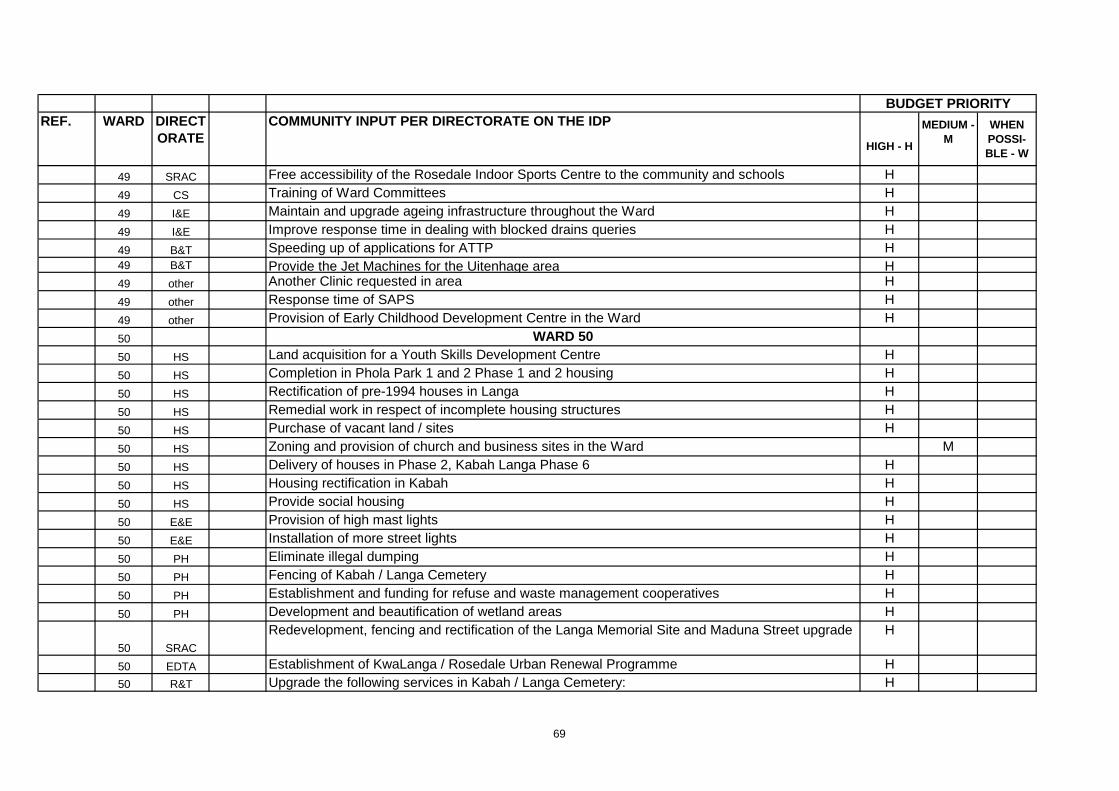
REF. WARD DIRECTORATE
COMMUNITY INPUT PER DIRECTORATE ON THE IDP
HIGH - H
MEDIUM - M
WHEN POSSI-BLE - W
BUDGET PRIORITY
49 SRAC Free accessibility of the Rosedale Indoor Sports Centre to the community and schools H
49 CS Training of Ward Committees H
49 I&E Maintain and upgrade ageing infrastructure throughout the Ward H
49 I&E Improve response time in dealing with blocked drains queries H
49 B&T Speeding up of applications for ATTP H49 B&T Provide the Jet Machines for the Uitenhage area H49 other Another Clinic requested in area H
49 other Response time of SAPS H
49 other Provision of Early Childhood Development Centre in the Ward H
50 WARD 5050 HS Land acquisition for a Youth Skills Development Centre H
50 HS Completion in Phola Park 1 and 2 Phase 1 and 2 housing H
50 HS Rectification of pre-1994 houses in Langa H
50 HS Remedial work in respect of incomplete housing structures H
50 HS Purchase of vacant land / sites H
50 HS Zoning and provision of church and business sites in the Ward M
50 HS Delivery of houses in Phase 2, Kabah Langa Phase 6 H
50 HS Housing rectification in Kabah H
50 HS Provide social housing H
50 E&E Provision of high mast lights H
50 E&E Installation of more street lights H
50 PH Eliminate illegal dumping H
50 PH Fencing of Kabah / Langa Cemetery H
50 PH Establishment and funding for refuse and waste management cooperatives H
50 PH Development and beautification of wetland areas H
50 SRAC
Redevelopment, fencing and rectification of the Langa Memorial Site and Maduna Street upgrade H
50 EDTA Establishment of KwaLanga / Rosedale Urban Renewal Programme H50 R&T Upgrade the following services in Kabah / Langa Cemetery: H
69
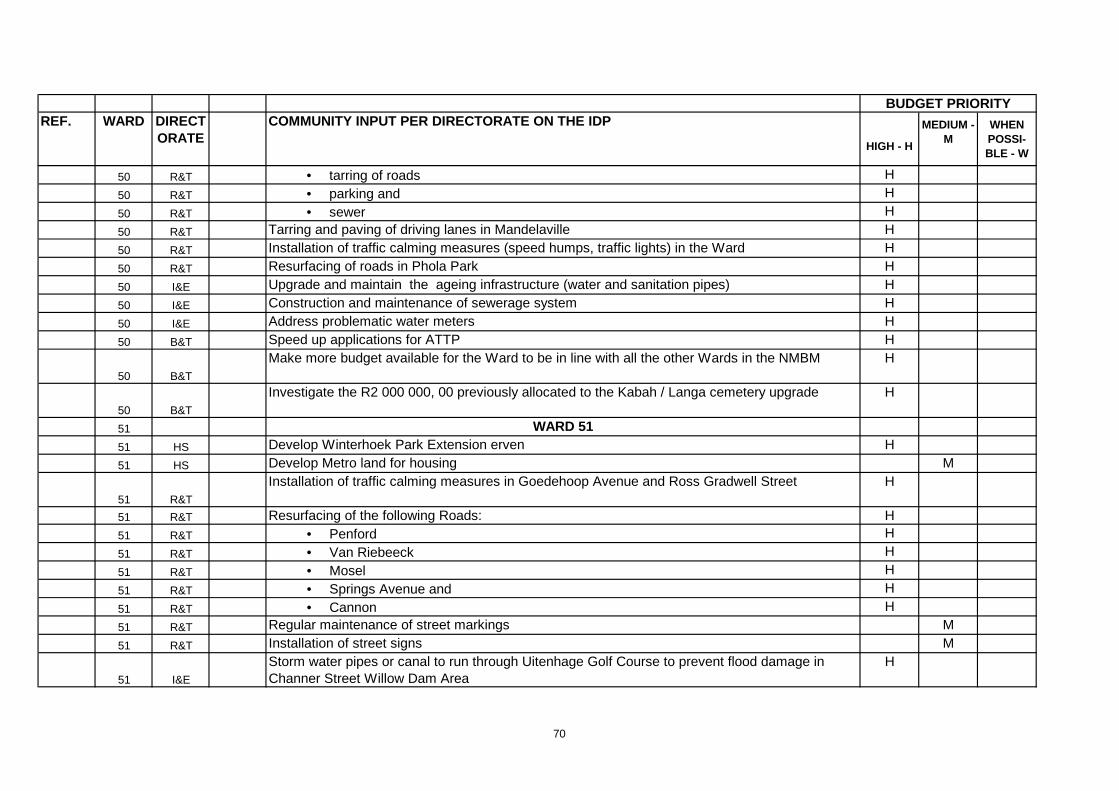
REF. WARD DIRECTORATE
COMMUNITY INPUT PER DIRECTORATE ON THE IDP
HIGH - H
MEDIUM - M
WHEN POSSI-BLE - W
BUDGET PRIORITY
50 R&T • tarring of roads H
50 R&T • parking and H
50 R&T • sewer H
50 R&T Tarring and paving of driving lanes in Mandelaville H
50 R&T Installation of traffic calming measures (speed humps, traffic lights) in the Ward H
50 R&T Resurfacing of roads in Phola Park H
50 I&E Upgrade and maintain the ageing infrastructure (water and sanitation pipes) H
50 I&E Construction and maintenance of sewerage system H
50 I&E Address problematic water meters H
50 B&T Speed up applications for ATTP H
50 B&T
Make more budget available for the Ward to be in line with all the other Wards in the NMBM H
50 B&T
Investigate the R2 000 000, 00 previously allocated to the Kabah / Langa cemetery upgrade H
51 WARD 5151 HS Develop Winterhoek Park Extension erven H
51 HS Develop Metro land for housing M
51 R&T
Installation of traffic calming measures in Goedehoop Avenue and Ross Gradwell Street H
51 R&T Resurfacing of the following Roads: H51 R&T • Penford H
51 R&T • Van Riebeeck H
51 R&T • Mosel H
51 R&T • Springs Avenue and H
51 R&T • Cannon H
51 R&T Regular maintenance of street markings M
51 R&T Installation of street signs M
51 I&E
Storm water pipes or canal to run through Uitenhage Golf Course to prevent flood damage in Channer Street Willow Dam Area
H
70
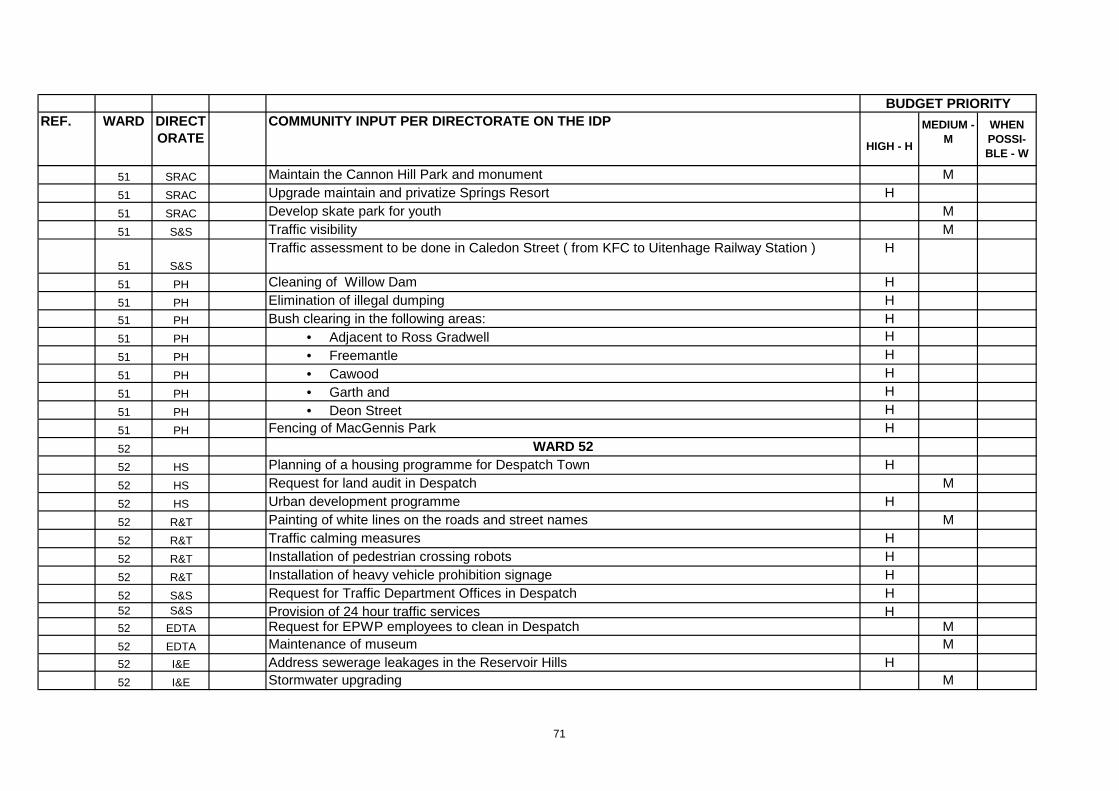
REF. WARD DIRECTORATE
COMMUNITY INPUT PER DIRECTORATE ON THE IDP
HIGH - H
MEDIUM - M
WHEN POSSI-BLE - W
BUDGET PRIORITY
51 SRAC Maintain the Cannon Hill Park and monument M
51 SRAC Upgrade maintain and privatize Springs Resort H
51 SRAC Develop skate park for youth M
51 S&S Traffic visibility M
51 S&S
Traffic assessment to be done in Caledon Street ( from KFC to Uitenhage Railway Station ) H
51 PH Cleaning of Willow Dam H
51 PH Elimination of illegal dumping H51 PH Bush clearing in the following areas: H51 PH • Adjacent to Ross Gradwell H
51 PH • Freemantle H
51 PH • Cawood H
51 PH • Garth and H
51 PH • Deon Street H
51 PH Fencing of MacGennis Park H
52 WARD 5252 HS Planning of a housing programme for Despatch Town H
52 HS Request for land audit in Despatch M
52 HS Urban development programme H
52 R&T Painting of white lines on the roads and street names M
52 R&T Traffic calming measures H
52 R&T Installation of pedestrian crossing robots H
52 R&T Installation of heavy vehicle prohibition signage H
52 S&S Request for Traffic Department Offices in Despatch H52 S&S Provision of 24 hour traffic services H52 EDTA Request for EPWP employees to clean in Despatch M52 EDTA Maintenance of museum M52 I&E Address sewerage leakages in the Reservoir Hills H52 I&E Stormwater upgrading M
71
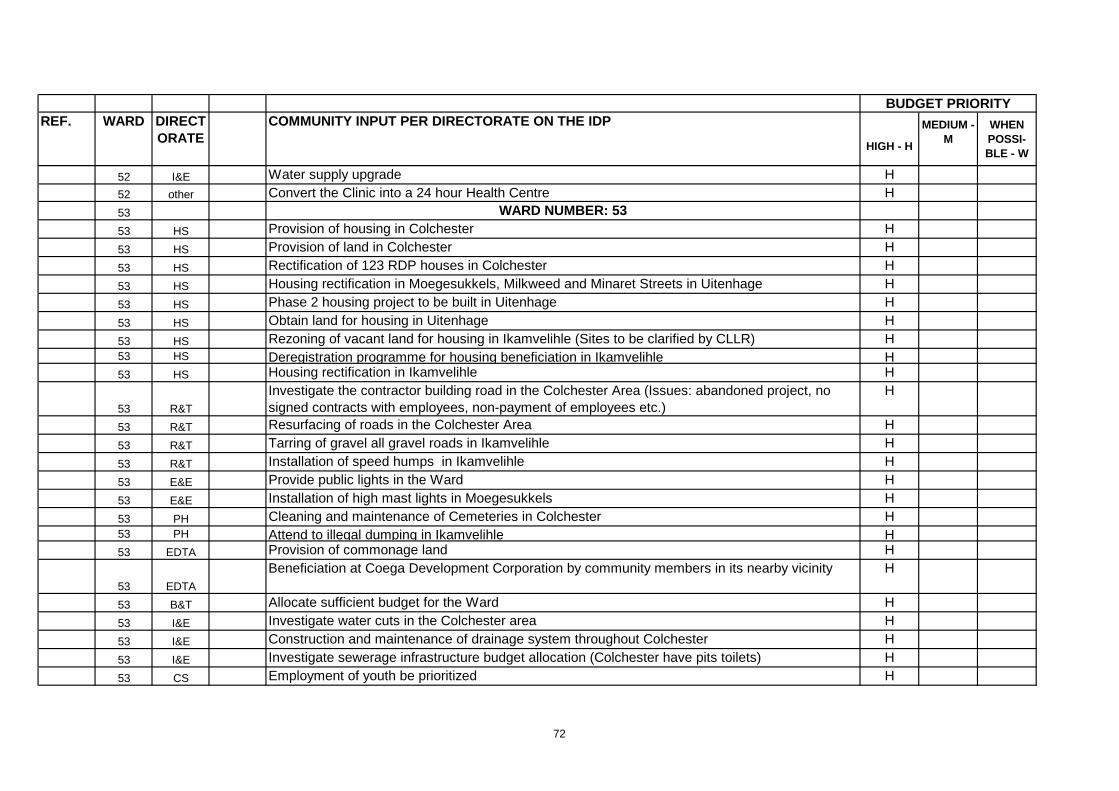
REF. WARD DIRECTORATE
COMMUNITY INPUT PER DIRECTORATE ON THE IDP
HIGH - H
MEDIUM - M
WHEN POSSI-BLE - W
BUDGET PRIORITY
52 I&E Water supply upgrade H52 other Convert the Clinic into a 24 hour Health Centre H53 WARD NUMBER: 5353 HS Provision of housing in Colchester H
53 HS Provision of land in Colchester H
53 HS Rectification of 123 RDP houses in Colchester H
53 HS Housing rectification in Moegesukkels, Milkweed and Minaret Streets in Uitenhage H
53 HS Phase 2 housing project to be built in Uitenhage H
53 HS Obtain land for housing in Uitenhage H
53 HS Rezoning of vacant land for housing in Ikamvelihle (Sites to be clarified by CLLR) H53 HS Deregistration programme for housing beneficiation in Ikamvelihle H53 HS Housing rectification in Ikamvelihle H
53 R&T
Investigate the contractor building road in the Colchester Area (Issues: abandoned project, no signed contracts with employees, non-payment of employees etc.)
H
53 R&T Resurfacing of roads in the Colchester Area H
53 R&T Tarring of gravel all gravel roads in Ikamvelihle H
53 R&T Installation of speed humps in Ikamvelihle H
53 E&E Provide public lights in the Ward H
53 E&E Installation of high mast lights in Moegesukkels H
53 PH Cleaning and maintenance of Cemeteries in Colchester H53 PH Attend to illegal dumping in Ikamvelihle H53 EDTA Provision of commonage land H
53 EDTA
Beneficiation at Coega Development Corporation by community members in its nearby vicinity H
53 B&T Allocate sufficient budget for the Ward H
53 I&E Investigate water cuts in the Colchester area H
53 I&E Construction and maintenance of drainage system throughout Colchester H
53 I&E Investigate sewerage infrastructure budget allocation (Colchester have pits toilets) H
53 CS Employment of youth be prioritized H
72
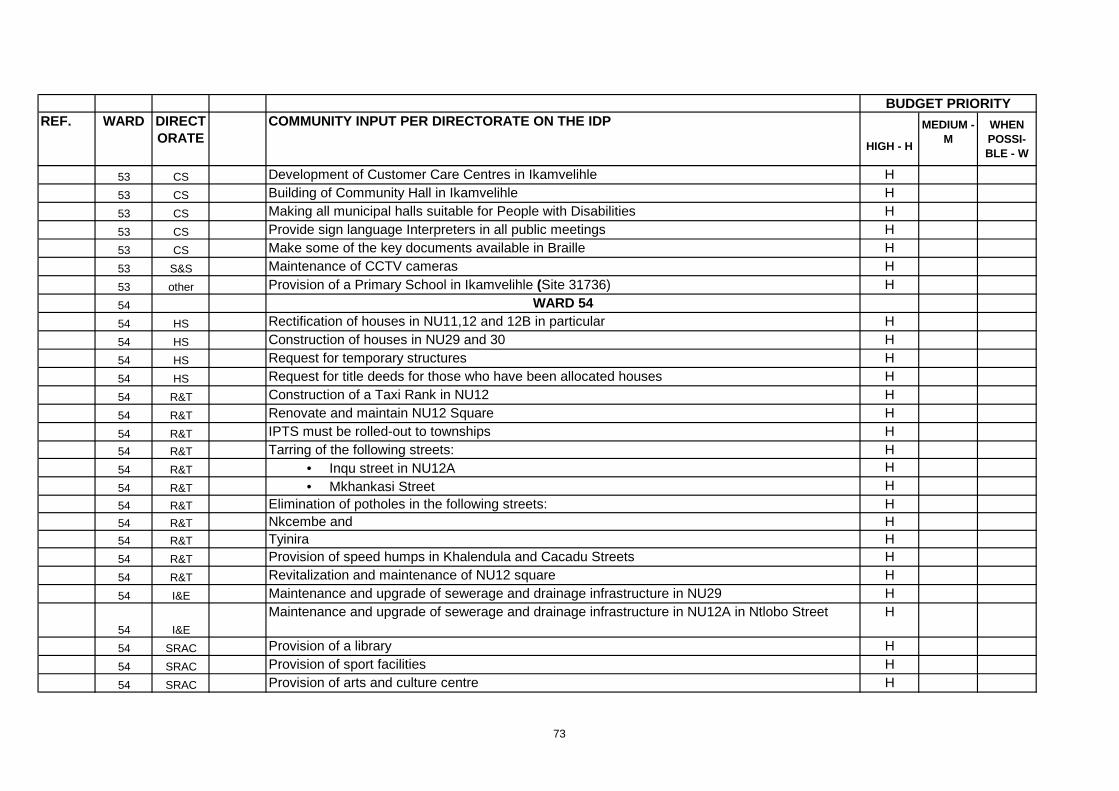
REF. WARD DIRECTORATE
COMMUNITY INPUT PER DIRECTORATE ON THE IDP
HIGH - H
MEDIUM - M
WHEN POSSI-BLE - W
BUDGET PRIORITY
53 CS Development of Customer Care Centres in Ikamvelihle H
53 CS Building of Community Hall in Ikamvelihle H
53 CS Making all municipal halls suitable for People with Disabilities H
53 CS Provide sign language Interpreters in all public meetings H
53 CS Make some of the key documents available in Braille H
53 S&S Maintenance of CCTV cameras H
53 other Provision of a Primary School in Ikamvelihle (Site 31736) H
54 WARD 5454 HS Rectification of houses in NU11,12 and 12B in particular H
54 HS Construction of houses in NU29 and 30 H
54 HS Request for temporary structures H
54 HS Request for title deeds for those who have been allocated houses H
54 R&T Construction of a Taxi Rank in NU12 H
54 R&T Renovate and maintain NU12 Square H
54 R&T IPTS must be rolled-out to townships H54 R&T Tarring of the following streets: H54 R&T • Inqu street in NU12A H
54 R&T • Mkhankasi Street H54 R&T Elimination of potholes in the following streets: H54 R&T Nkcembe and H54 R&T Tyinira H54 R&T Provision of speed humps in Khalendula and Cacadu Streets H
54 R&T Revitalization and maintenance of NU12 square H
54 I&E Maintenance and upgrade of sewerage and drainage infrastructure in NU29 H
54 I&E
Maintenance and upgrade of sewerage and drainage infrastructure in NU12A in Ntlobo Street H
54 SRAC Provision of a library H
54 SRAC Provision of sport facilities H
54 SRAC Provision of arts and culture centre H
73
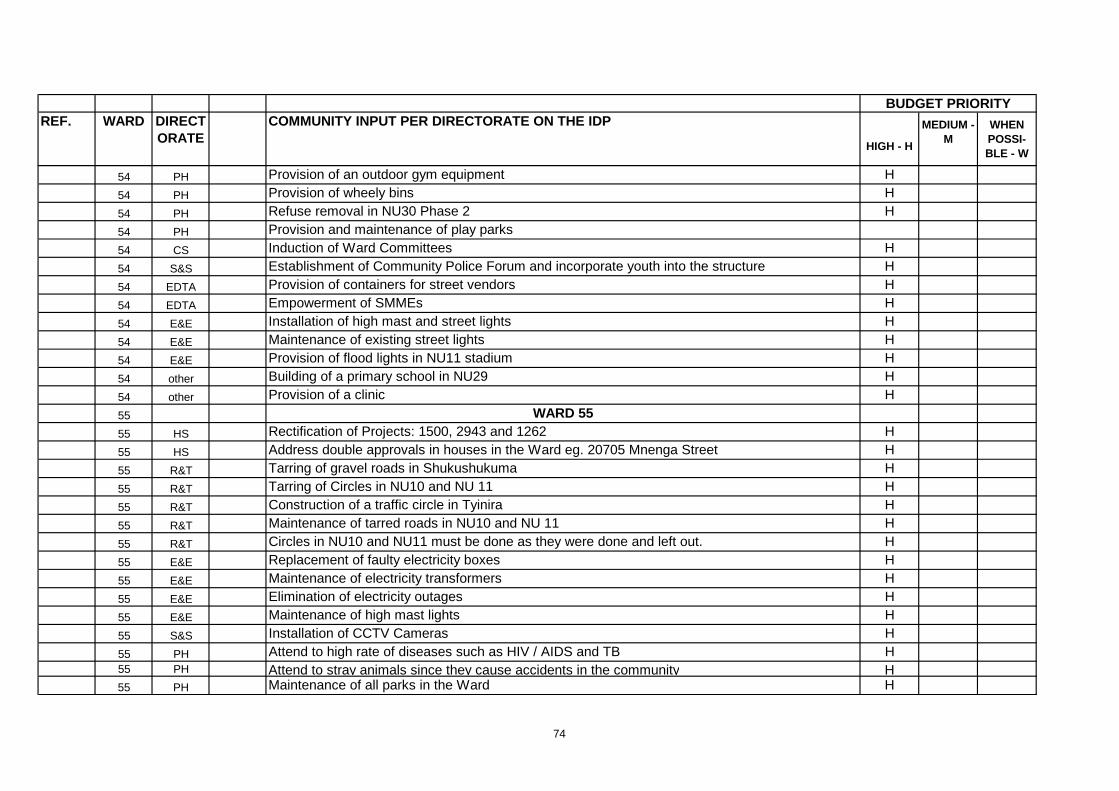
REF. WARD DIRECTORATE
COMMUNITY INPUT PER DIRECTORATE ON THE IDP
HIGH - H
MEDIUM - M
WHEN POSSI-BLE - W
BUDGET PRIORITY
54 PH Provision of an outdoor gym equipment H
54 PH Provision of wheely bins H
54 PH Refuse removal in NU30 Phase 2 H
54 PH Provision and maintenance of play parks
54 CS Induction of Ward Committees H
54 S&S Establishment of Community Police Forum and incorporate youth into the structure H
54 EDTA Provision of containers for street vendors H
54 EDTA Empowerment of SMMEs H
54 E&E Installation of high mast and street lights H
54 E&E Maintenance of existing street lights H
54 E&E Provision of flood lights in NU11 stadium H
54 other Building of a primary school in NU29 H
54 other Provision of a clinic H
55 WARD 5555 HS Rectification of Projects: 1500, 2943 and 1262 H
55 HS Address double approvals in houses in the Ward eg. 20705 Mnenga Street H
55 R&T Tarring of gravel roads in Shukushukuma H
55 R&T Tarring of Circles in NU10 and NU 11 H
55 R&T Construction of a traffic circle in Tyinira H
55 R&T Maintenance of tarred roads in NU10 and NU 11 H
55 R&T Circles in NU10 and NU11 must be done as they were done and left out. H
55 E&E Replacement of faulty electricity boxes H
55 E&E Maintenance of electricity transformers H
55 E&E Elimination of electricity outages H
55 E&E Maintenance of high mast lights H
55 S&S Installation of CCTV Cameras H
55 PH Attend to high rate of diseases such as HIV / AIDS and TB H55 PH Attend to stray animals since they cause accidents in the community H55 PH Maintenance of all parks in the Ward H
74
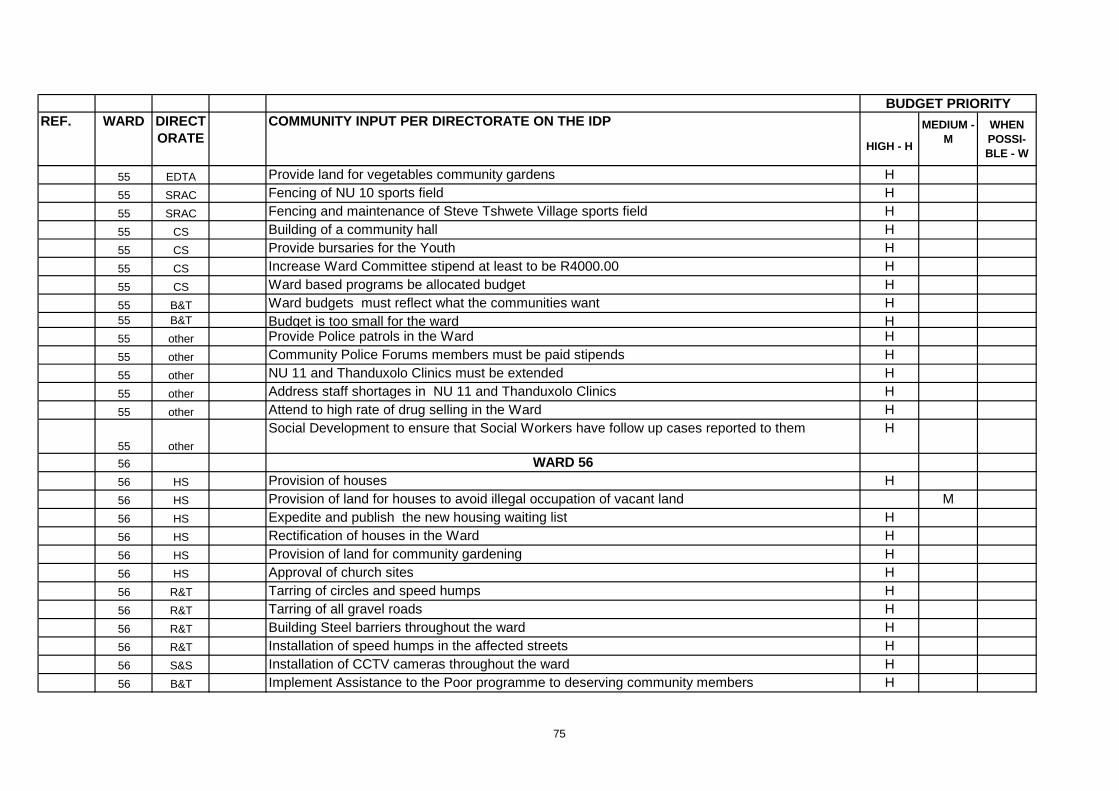
REF. WARD DIRECTORATE
COMMUNITY INPUT PER DIRECTORATE ON THE IDP
HIGH - H
MEDIUM - M
WHEN POSSI-BLE - W
BUDGET PRIORITY
55 EDTA Provide land for vegetables community gardens H
55 SRAC Fencing of NU 10 sports field H
55 SRAC Fencing and maintenance of Steve Tshwete Village sports field H
55 CS Building of a community hall H
55 CS Provide bursaries for the Youth H
55 CS Increase Ward Committee stipend at least to be R4000.00 H
55 CS Ward based programs be allocated budget H
55 B&T Ward budgets must reflect what the communities want H55 B&T Budget is too small for the ward H55 other Provide Police patrols in the Ward H
55 other Community Police Forums members must be paid stipends H
55 other NU 11 and Thanduxolo Clinics must be extended H
55 other Address staff shortages in NU 11 and Thanduxolo Clinics H
55 other Attend to high rate of drug selling in the Ward H
55 other
Social Development to ensure that Social Workers have follow up cases reported to them H
56 WARD 5656 HS Provision of houses H56 HS Provision of land for houses to avoid illegal occupation of vacant land M56 HS Expedite and publish the new housing waiting list H56 HS Rectification of houses in the Ward H56 HS Provision of land for community gardening H56 HS Approval of church sites H56 R&T Tarring of circles and speed humps H56 R&T Tarring of all gravel roads H56 R&T Building Steel barriers throughout the ward H56 R&T Installation of speed humps in the affected streets H56 S&S Installation of CCTV cameras throughout the ward H56 B&T Implement Assistance to the Poor programme to deserving community members H
75
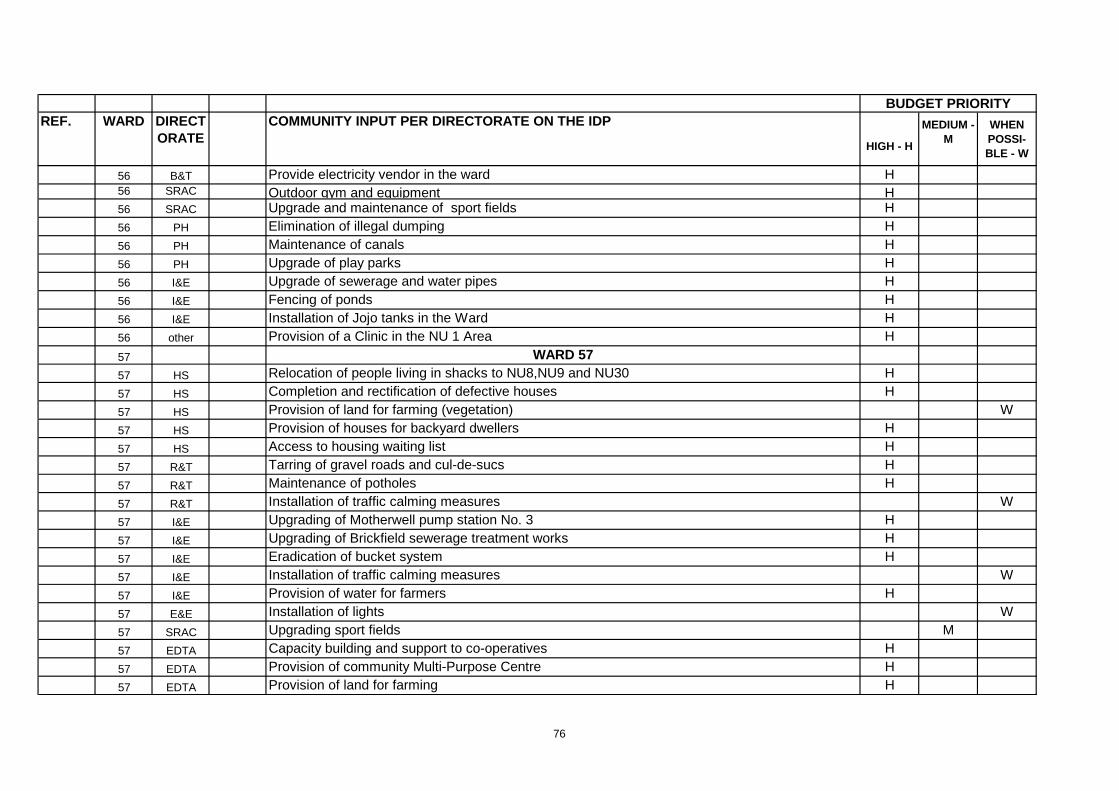
REF. WARD DIRECTORATE
COMMUNITY INPUT PER DIRECTORATE ON THE IDP
HIGH - H
MEDIUM - M
WHEN POSSI-BLE - W
BUDGET PRIORITY
56 B&T Provide electricity vendor in the ward H56 SRAC Outdoor gym and equipment H56 SRAC Upgrade and maintenance of sport fields H56 PH Elimination of illegal dumping H56 PH Maintenance of canals H56 PH Upgrade of play parks H56 I&E Upgrade of sewerage and water pipes H56 I&E Fencing of ponds H56 I&E Installation of Jojo tanks in the Ward H56 other Provision of a Clinic in the NU 1 Area H
57 WARD 5757 HS Relocation of people living in shacks to NU8,NU9 and NU30 H
57 HS Completion and rectification of defective houses H
57 HS Provision of land for farming (vegetation) W
57 HS Provision of houses for backyard dwellers H
57 HS Access to housing waiting list H
57 R&T Tarring of gravel roads and cul-de-sucs H
57 R&T Maintenance of potholes H
57 R&T Installation of traffic calming measures W
57 I&E Upgrading of Motherwell pump station No. 3 H
57 I&E Upgrading of Brickfield sewerage treatment works H
57 I&E Eradication of bucket system H
57 I&E Installation of traffic calming measures W
57 I&E Provision of water for farmers H
57 E&E Installation of lights W
57 SRAC Upgrading sport fields M
57 EDTA Capacity building and support to co-operatives H
57 EDTA Provision of community Multi-Purpose Centre H
57 EDTA Provision of land for farming H
76
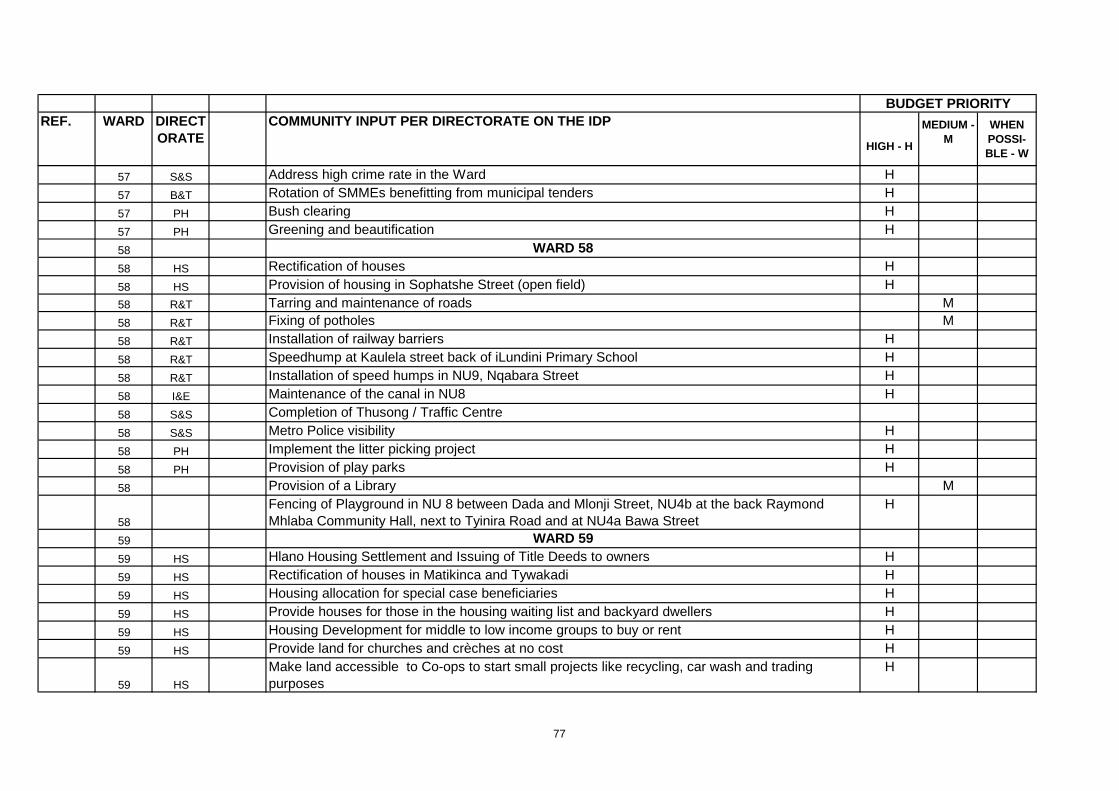
REF. WARD DIRECTORATE
COMMUNITY INPUT PER DIRECTORATE ON THE IDP
HIGH - H
MEDIUM - M
WHEN POSSI-BLE - W
BUDGET PRIORITY
57 S&S Address high crime rate in the Ward H
57 B&T Rotation of SMMEs benefitting from municipal tenders H
57 PH Bush clearing H
57 PH Greening and beautification H
58 WARD 5858 HS Rectification of houses H
58 HS Provision of housing in Sophatshe Street (open field) H58 R&T Tarring and maintenance of roads M58 R&T Fixing of potholes M
58 R&T Installation of railway barriers H
58 R&T Speedhump at Kaulela street back of iLundini Primary School H
58 R&T Installation of speed humps in NU9, Nqabara Street H
58 I&E Maintenance of the canal in NU8 H
58 S&S Completion of Thusong / Traffic Centre
58 S&S Metro Police visibility H
58 PH Implement the litter picking project H
58 PH Provision of play parks H
58 Provision of a Library M
58
Fencing of Playground in NU 8 between Dada and Mlonji Street, NU4b at the back Raymond Mhlaba Community Hall, next to Tyinira Road and at NU4a Bawa Street
H
59 WARD 59 59 HS Hlano Housing Settlement and Issuing of Title Deeds to owners H
59 HS Rectification of houses in Matikinca and Tywakadi H
59 HS Housing allocation for special case beneficiaries H
59 HS Provide houses for those in the housing waiting list and backyard dwellers H
59 HS Housing Development for middle to low income groups to buy or rent H
59 HS Provide land for churches and crèches at no cost H
59 HS
Make land accessible to Co-ops to start small projects like recycling, car wash and trading purposes
H
77
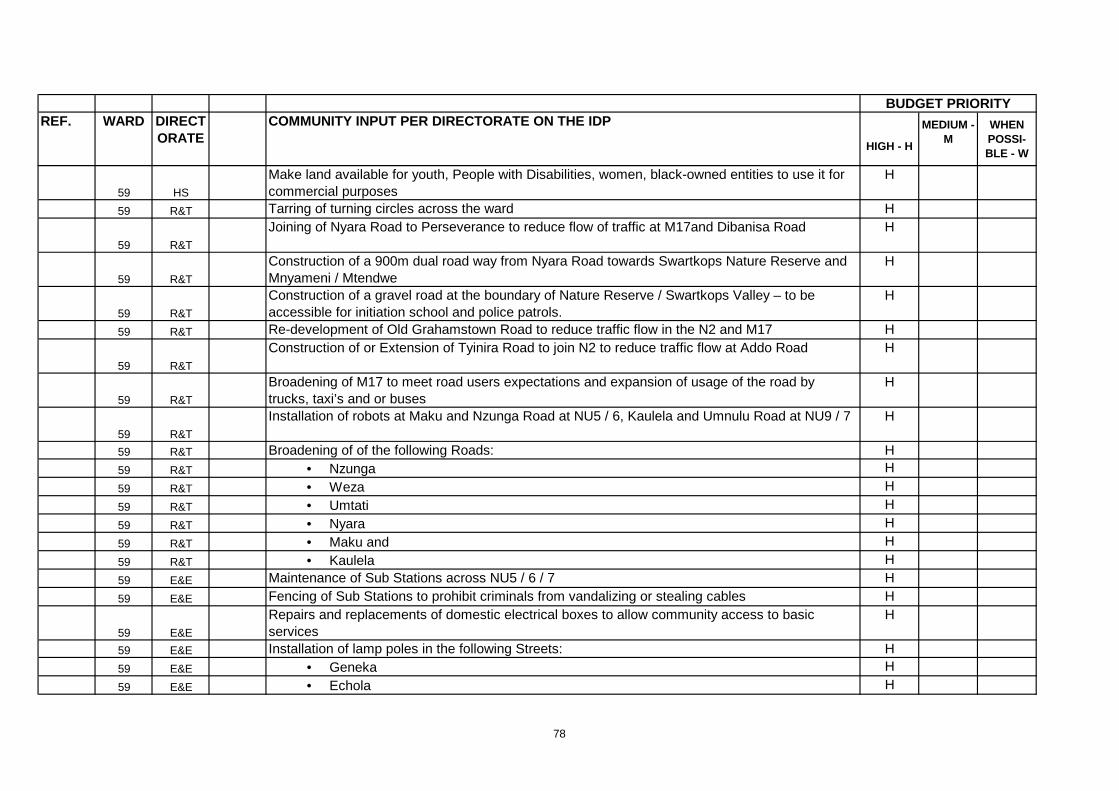
REF. WARD DIRECTORATE
COMMUNITY INPUT PER DIRECTORATE ON THE IDP
HIGH - H
MEDIUM - M
WHEN POSSI-BLE - W
BUDGET PRIORITY
59 HS
Make land available for youth, People with Disabilities, women, black-owned entities to use it for commercial purposes
H
59 R&T Tarring of turning circles across the ward H
59 R&T
Joining of Nyara Road to Perseverance to reduce flow of traffic at M17and Dibanisa Road H
59 R&T
Construction of a 900m dual road way from Nyara Road towards Swartkops Nature Reserve and Mnyameni / Mtendwe
H
59 R&T
Construction of a gravel road at the boundary of Nature Reserve / Swartkops Valley – to be accessible for initiation school and police patrols.
H
59 R&T Re-development of Old Grahamstown Road to reduce traffic flow in the N2 and M17 H
59 R&T
Construction of or Extension of Tyinira Road to join N2 to reduce traffic flow at Addo Road H
59 R&T
Broadening of M17 to meet road users expectations and expansion of usage of the road by trucks, taxi’s and or buses
H
59 R&T
Installation of robots at Maku and Nzunga Road at NU5 / 6, Kaulela and Umnulu Road at NU9 / 7 H
59 R&T Broadening of of the following Roads: H59 R&T • Nzunga H
59 R&T • Weza H
59 R&T • Umtati H
59 R&T • Nyara H
59 R&T • Maku and H
59 R&T • Kaulela H
59 E&E Maintenance of Sub Stations across NU5 / 6 / 7 H
59 E&E Fencing of Sub Stations to prohibit criminals from vandalizing or stealing cables H
59 E&E
Repairs and replacements of domestic electrical boxes to allow community access to basic services
H
59 E&E Installation of lamp poles in the following Streets: H59 E&E • Geneka H
59 E&E • Echola H
78
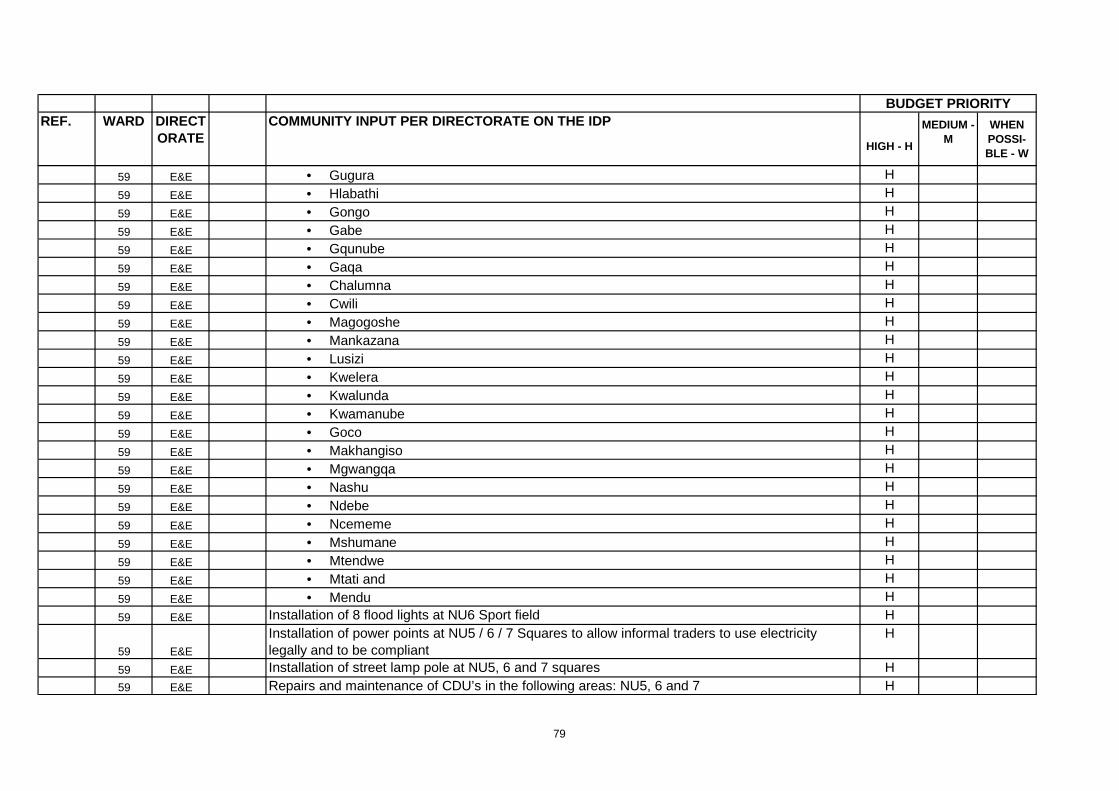
REF. WARD DIRECTORATE
COMMUNITY INPUT PER DIRECTORATE ON THE IDP
HIGH - H
MEDIUM - M
WHEN POSSI-BLE - W
BUDGET PRIORITY
59 E&E • Gugura H
59 E&E • Hlabathi H
59 E&E • Gongo H
59 E&E • Gabe H
59 E&E • Gqunube H
59 E&E • Gaqa H
59 E&E • Chalumna H
59 E&E • Cwili H
59 E&E • Magogoshe H
59 E&E • Mankazana H
59 E&E • Lusizi H
59 E&E • Kwelera H
59 E&E • Kwalunda H
59 E&E • Kwamanube H
59 E&E • Goco H
59 E&E • Makhangiso H
59 E&E • Mgwangqa H
59 E&E • Nashu H
59 E&E • Ndebe H
59 E&E • Ncememe H
59 E&E • Mshumane H
59 E&E • Mtendwe H
59 E&E • Mtati and H
59 E&E • Mendu H
59 E&E Installation of 8 flood lights at NU6 Sport field H
59 E&E
Installation of power points at NU5 / 6 / 7 Squares to allow informal traders to use electricity legally and to be compliant
H
59 E&E Installation of street lamp pole at NU5, 6 and 7 squares H59 E&E Repairs and maintenance of CDU’s in the following areas: NU5, 6 and 7 H
79
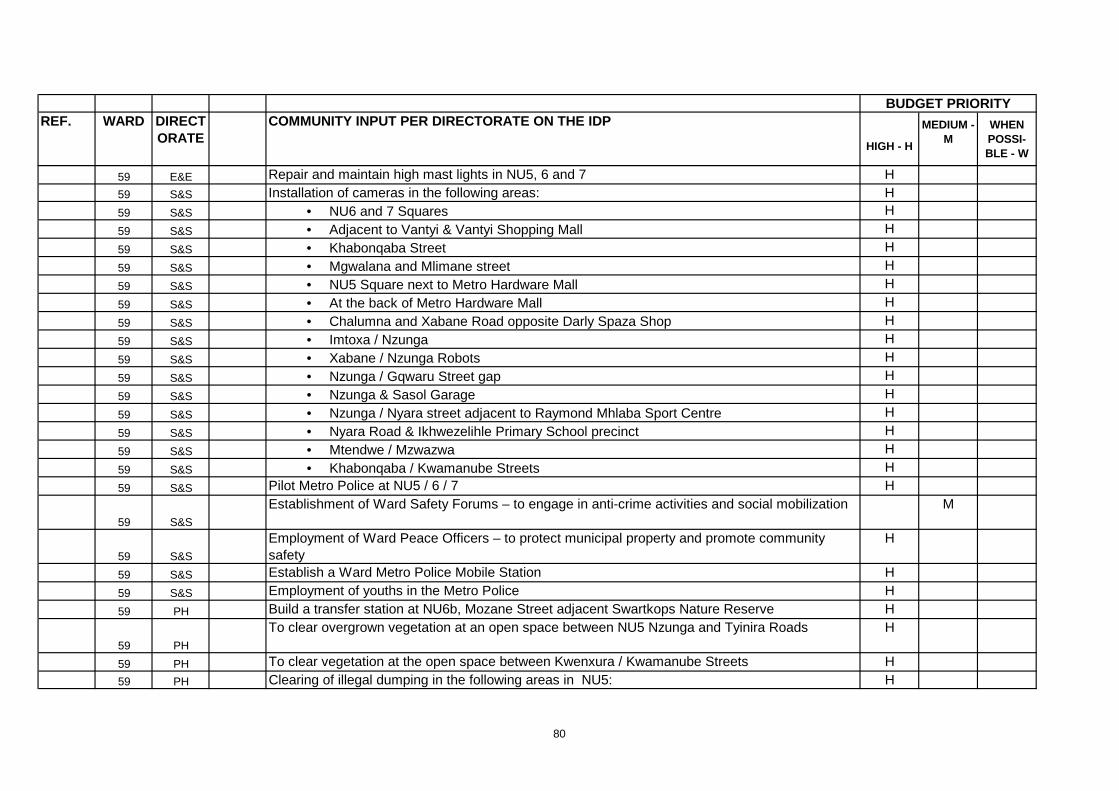
REF. WARD DIRECTORATE
COMMUNITY INPUT PER DIRECTORATE ON THE IDP
HIGH - H
MEDIUM - M
WHEN POSSI-BLE - W
BUDGET PRIORITY
59 E&E Repair and maintain high mast lights in NU5, 6 and 7 H59 S&S Installation of cameras in the following areas: H59 S&S • NU6 and 7 Squares H
59 S&S • Adjacent to Vantyi & Vantyi Shopping Mall H
59 S&S • Khabonqaba Street H
59 S&S • Mgwalana and Mlimane street H
59 S&S • NU5 Square next to Metro Hardware Mall H
59 S&S • At the back of Metro Hardware Mall H
59 S&S • Chalumna and Xabane Road opposite Darly Spaza Shop H
59 S&S • Imtoxa / Nzunga H
59 S&S • Xabane / Nzunga Robots H
59 S&S • Nzunga / Gqwaru Street gap H
59 S&S • Nzunga & Sasol Garage H
59 S&S • Nzunga / Nyara street adjacent to Raymond Mhlaba Sport Centre H
59 S&S • Nyara Road & Ikhwezelihle Primary School precinct H
59 S&S • Mtendwe / Mzwazwa H
59 S&S • Khabonqaba / Kwamanube Streets H
59 S&S Pilot Metro Police at NU5 / 6 / 7 H
59 S&S
Establishment of Ward Safety Forums – to engage in anti-crime activities and social mobilization M
59 S&S
Employment of Ward Peace Officers – to protect municipal property and promote community safety
H
59 S&S Establish a Ward Metro Police Mobile Station H
59 S&S Employment of youths in the Metro Police H
59 PH Build a transfer station at NU6b, Mozane Street adjacent Swartkops Nature Reserve H
59 PH
To clear overgrown vegetation at an open space between NU5 Nzunga and Tyinira Roads H
59 PH To clear vegetation at the open space between Kwenxura / Kwamanube Streets H59 PH Clearing of illegal dumping in the following areas in NU5: H
80
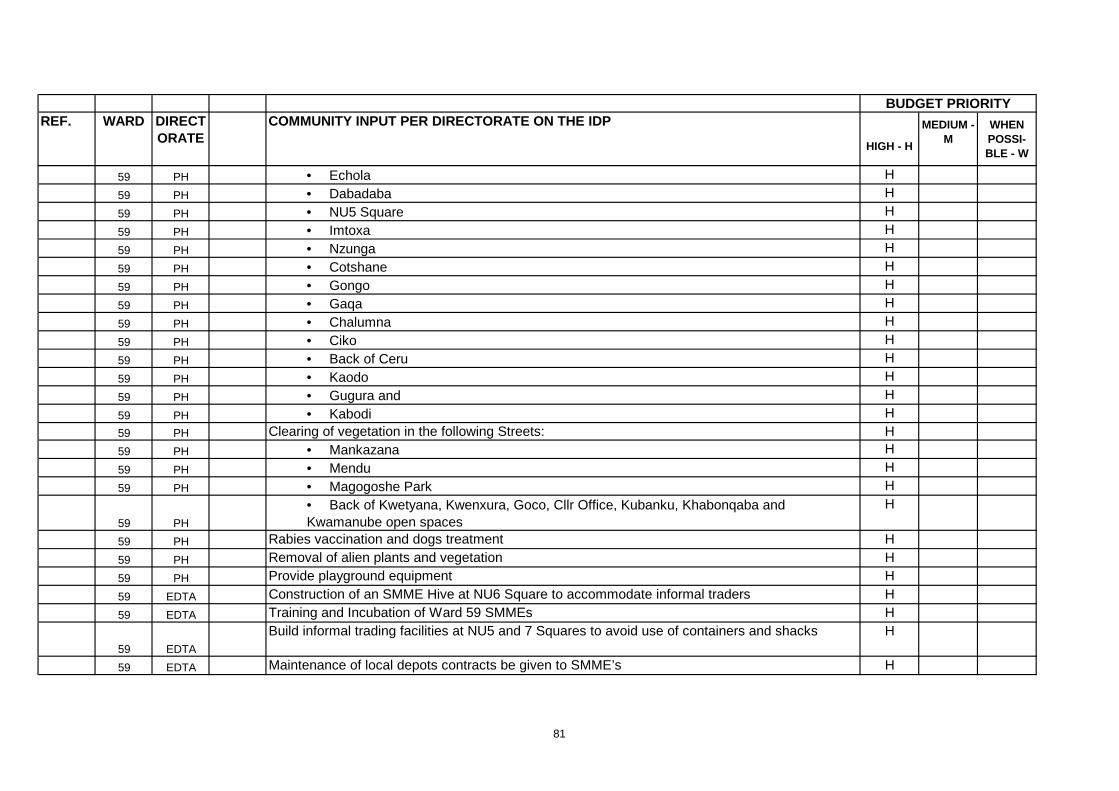
REF. WARD DIRECTORATE
COMMUNITY INPUT PER DIRECTORATE ON THE IDP
HIGH - H
MEDIUM - M
WHEN POSSI-BLE - W
BUDGET PRIORITY
59 PH • Echola H
59 PH • Dabadaba H
59 PH • NU5 Square H
59 PH • Imtoxa H
59 PH • Nzunga H
59 PH • Cotshane H
59 PH • Gongo H
59 PH • Gaqa H
59 PH • Chalumna H
59 PH • Ciko H
59 PH • Back of Ceru H
59 PH • Kaodo H
59 PH • Gugura and H
59 PH • Kabodi H59 PH Clearing of vegetation in the following Streets: H59 PH • Mankazana H
59 PH • Mendu H
59 PH • Magogoshe Park H
59 PH
• Back of Kwetyana, Kwenxura, Goco, Cllr Office, Kubanku, Khabonqaba and Kwamanube open spaces
H
59 PH Rabies vaccination and dogs treatment H
59 PH Removal of alien plants and vegetation H
59 PH Provide playground equipment H
59 EDTA Construction of an SMME Hive at NU6 Square to accommodate informal traders H
59 EDTA Training and Incubation of Ward 59 SMMEs H
59 EDTA
Build informal trading facilities at NU5 and 7 Squares to avoid use of containers and shacks H
59 EDTA Maintenance of local depots contracts be given to SMME’s H
81
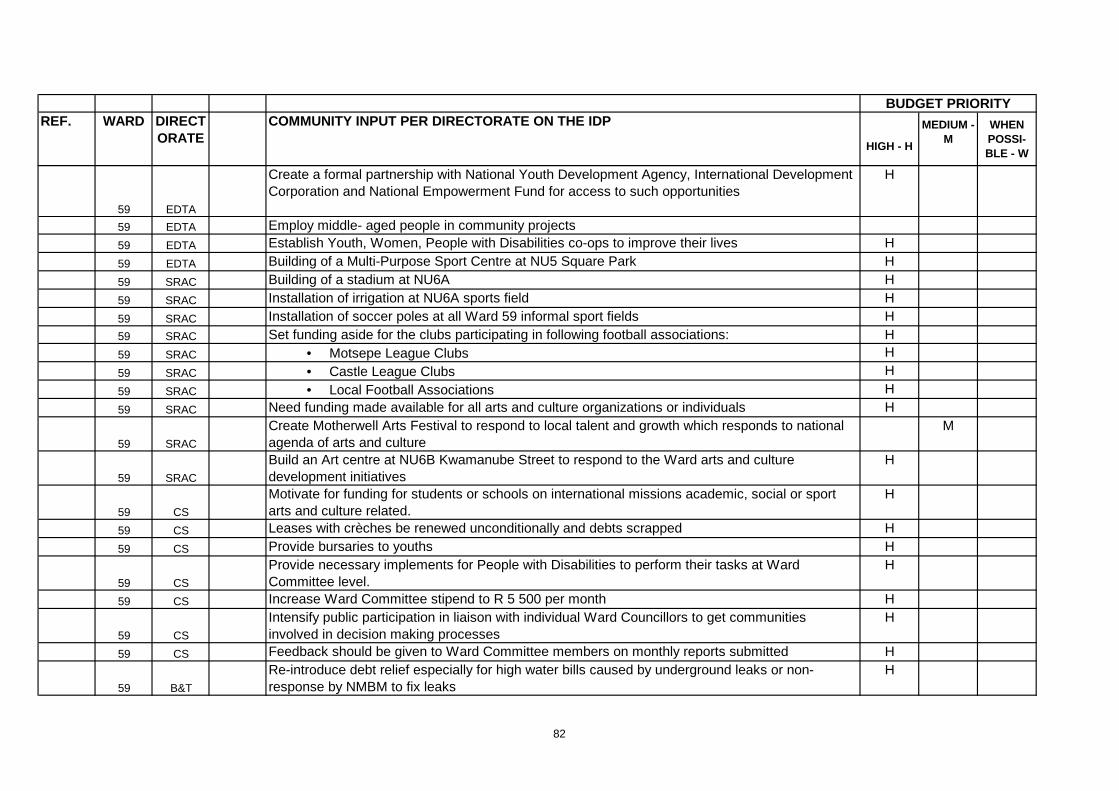
REF. WARD DIRECTORATE
COMMUNITY INPUT PER DIRECTORATE ON THE IDP
HIGH - H
MEDIUM - M
WHEN POSSI-BLE - W
BUDGET PRIORITY
59 EDTA
Create a formal partnership with National Youth Development Agency, International Development Corporation and National Empowerment Fund for access to such opportunities
H
59 EDTA Employ middle- aged people in community projects59 EDTA Establish Youth, Women, People with Disabilities co-ops to improve their lives H
59 EDTA Building of a Multi-Purpose Sport Centre at NU5 Square Park H
59 SRAC Building of a stadium at NU6A H
59 SRAC Installation of irrigation at NU6A sports field H
59 SRAC Installation of soccer poles at all Ward 59 informal sport fields H59 SRAC Set funding aside for the clubs participating in following football associations: H59 SRAC • Motsepe League Clubs H
59 SRAC • Castle League Clubs H
59 SRAC • Local Football Associations H
59 SRAC Need funding made available for all arts and culture organizations or individuals H
59 SRAC
Create Motherwell Arts Festival to respond to local talent and growth which responds to national agenda of arts and culture
M
59 SRAC
Build an Art centre at NU6B Kwamanube Street to respond to the Ward arts and culture development initiatives
H
59 CS
Motivate for funding for students or schools on international missions academic, social or sport arts and culture related.
H
59 CS Leases with crèches be renewed unconditionally and debts scrapped H
59 CS Provide bursaries to youths H
59 CS
Provide necessary implements for People with Disabilities to perform their tasks at Ward Committee level.
H
59 CS Increase Ward Committee stipend to R 5 500 per month H
59 CS
Intensify public participation in liaison with individual Ward Councillors to get communities involved in decision making processes
H
59 CS Feedback should be given to Ward Committee members on monthly reports submitted H
59 B&T
Re-introduce debt relief especially for high water bills caused by underground leaks or non-response by NMBM to fix leaks
H
82
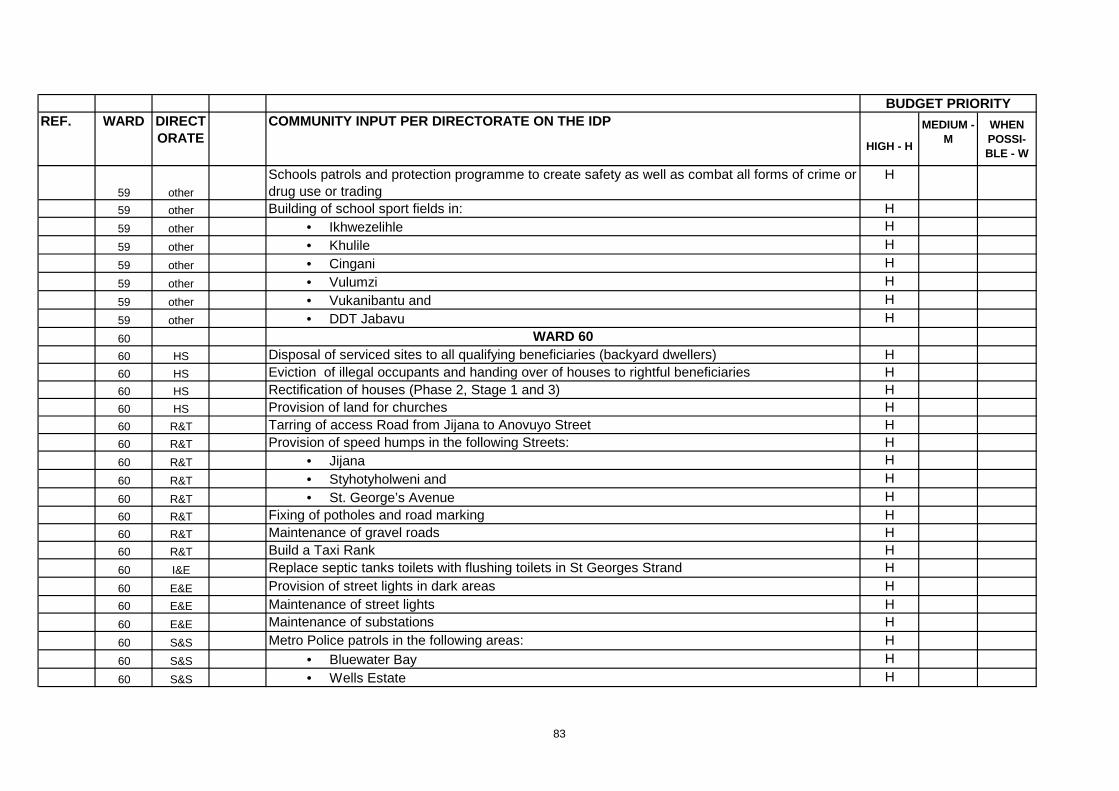
REF. WARD DIRECTORATE
COMMUNITY INPUT PER DIRECTORATE ON THE IDP
HIGH - H
MEDIUM - M
WHEN POSSI-BLE - W
BUDGET PRIORITY
59 other
Schools patrols and protection programme to create safety as well as combat all forms of crime or drug use or trading
H
59 other Building of school sport fields in: H59 other • Ikhwezelihle H
59 other • Khulile H
59 other • Cingani H
59 other • Vulumzi H
59 other • Vukanibantu and H
59 other • DDT Jabavu H
60 WARD 6060 HS Disposal of serviced sites to all qualifying beneficiaries (backyard dwellers) H60 HS Eviction of illegal occupants and handing over of houses to rightful beneficiaries H60 HS Rectification of houses (Phase 2, Stage 1 and 3) H60 HS Provision of land for churches H60 R&T Tarring of access Road from Jijana to Anovuyo Street H60 R&T Provision of speed humps in the following Streets: H60 R&T • Jijana H
60 R&T • Styhotyholweni and H
60 R&T • St. George’s Avenue H60 R&T Fixing of potholes and road marking H60 R&T Maintenance of gravel roads H60 R&T Build a Taxi Rank H60 I&E Replace septic tanks toilets with flushing toilets in St Georges Strand H
60 E&E Provision of street lights in dark areas H60 E&E Maintenance of street lights H60 E&E Maintenance of substations H
60 S&S Metro Police patrols in the following areas: H
60 S&S • Bluewater Bay H
60 S&S • Wells Estate H
83
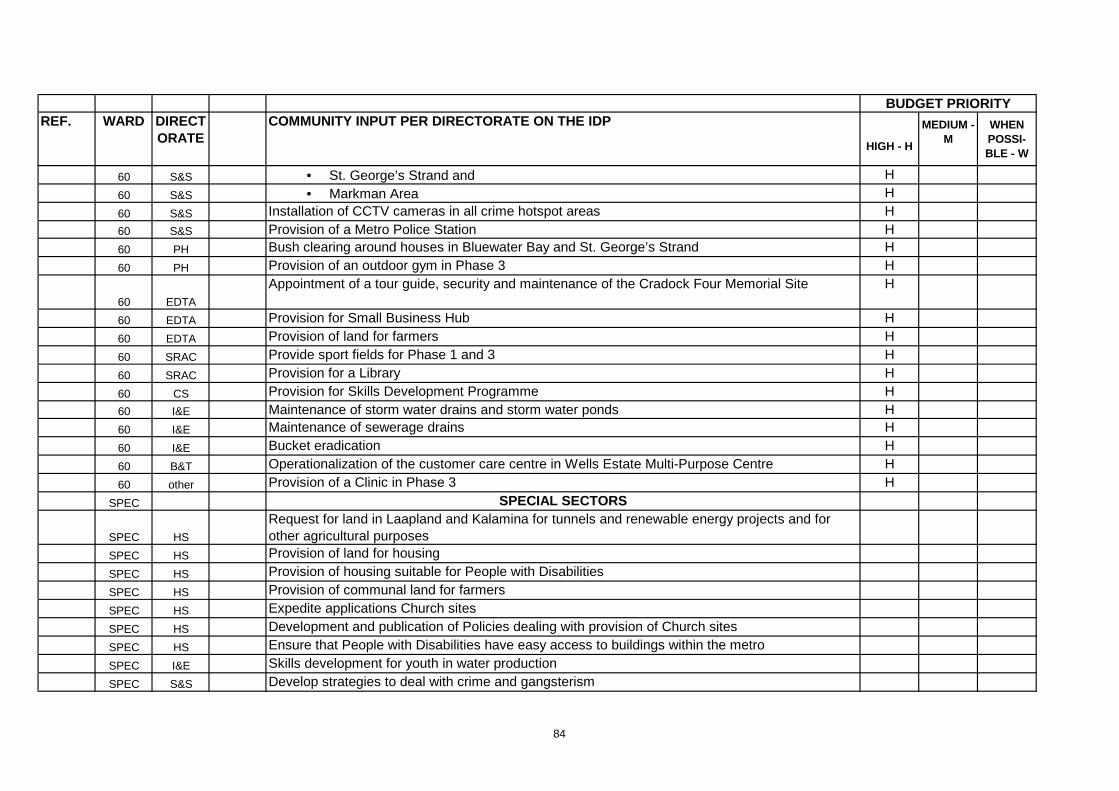
REF. WARD DIRECTORATE
COMMUNITY INPUT PER DIRECTORATE ON THE IDP
HIGH - H
MEDIUM - M
WHEN POSSI-BLE - W
BUDGET PRIORITY
60 S&S • St. George’s Strand and H
60 S&S • Markman Area H
60 S&S Installation of CCTV cameras in all crime hotspot areas H60 S&S Provision of a Metro Police Station H60 PH Bush clearing around houses in Bluewater Bay and St. George’s Strand H
60 PH Provision of an outdoor gym in Phase 3 H
60 EDTA
Appointment of a tour guide, security and maintenance of the Cradock Four Memorial Site H
60 EDTA Provision for Small Business Hub H
60 EDTA Provision of land for farmers H
60 SRAC Provide sport fields for Phase 1 and 3 H
60 SRAC Provision for a Library H
60 CS Provision for Skills Development Programme H60 I&E Maintenance of storm water drains and storm water ponds H60 I&E Maintenance of sewerage drains H
60 I&E Bucket eradication H
60 B&T Operationalization of the customer care centre in Wells Estate Multi-Purpose Centre H
60 other Provision of a Clinic in Phase 3 H
SPEC SPECIAL SECTORS
SPEC HS
Request for land in Laapland and Kalamina for tunnels and renewable energy projects and for other agricultural purposes
SPEC HS Provision of land for housing
SPEC HS Provision of housing suitable for People with Disabilities
SPEC HS Provision of communal land for farmers
SPEC HS Expedite applications Church sites
SPEC HS Development and publication of Policies dealing with provision of Church sites
SPEC HS Ensure that People with Disabilities have easy access to buildings within the metro
SPEC I&E Skills development for youth in water production
SPEC S&S Develop strategies to deal with crime and gangsterism
84
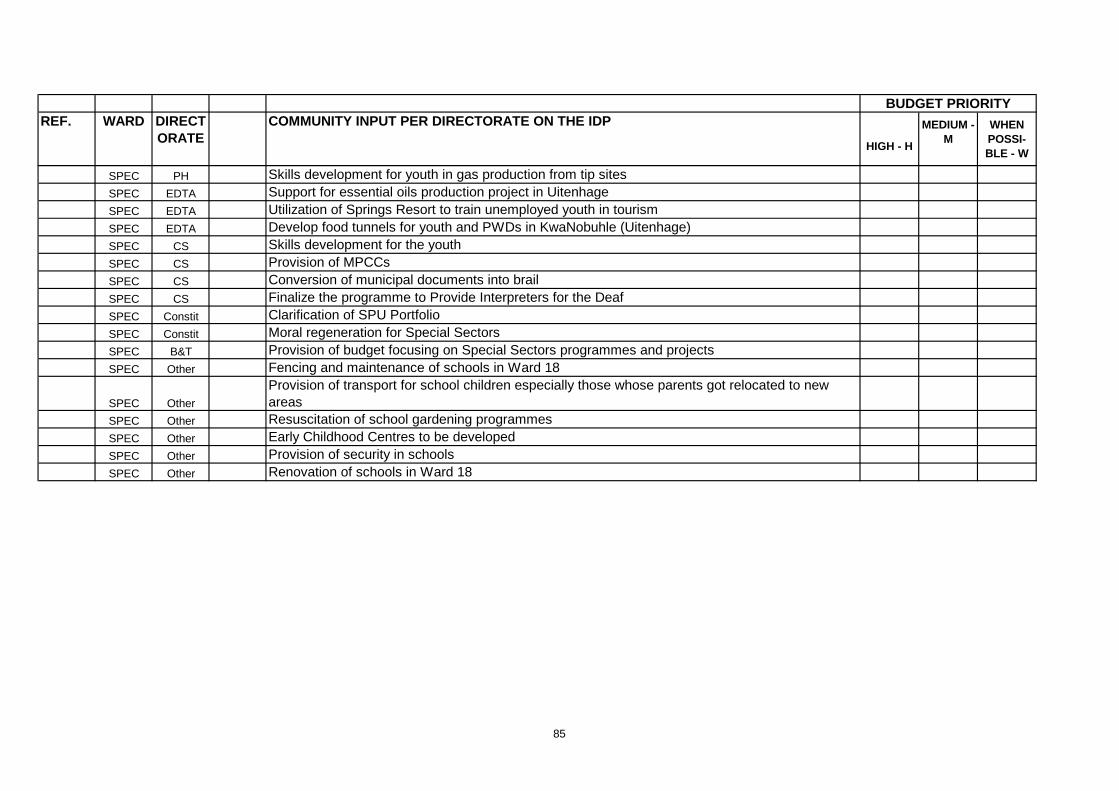
REF. WARD DIRECTORATE
COMMUNITY INPUT PER DIRECTORATE ON THE IDP
HIGH - H
MEDIUM - M
WHEN POSSI-BLE - W
BUDGET PRIORITY
SPEC PH Skills development for youth in gas production from tip sitesSPEC EDTA Support for essential oils production project in UitenhageSPEC EDTA Utilization of Springs Resort to train unemployed youth in tourismSPEC EDTA Develop food tunnels for youth and PWDs in KwaNobuhle (Uitenhage)SPEC CS Skills development for the youth SPEC CS Provision of MPCCsSPEC CS Conversion of municipal documents into brailSPEC CS Finalize the programme to Provide Interpreters for the DeafSPEC Constit Clarification of SPU PortfolioSPEC Constit Moral regeneration for Special SectorsSPEC B&T Provision of budget focusing on Special Sectors programmes and projectsSPEC Other Fencing and maintenance of schools in Ward 18
SPEC Other
Provision of transport for school children especially those whose parents got relocated to new areas
SPEC Other Resuscitation of school gardening programmesSPEC Other Early Childhood Centres to be developed SPEC Other Provision of security in schoolsSPEC Other Renovation of schools in Ward 18
85


