DISCLOSURE APPENDIX CONTAINS ANALYST CERTIFICATIONS AND THE STATUS OF NON-US ANALYSTS. U.S. Disclosure: Credit Suisse does and seeks to do business with companies covered in its research reports. As a result, investors should be aware that the Firm may have a conflict of interest that could affect the objectivity of this report. Investors should consider this report as only a single factor in making their investment decision. 03 May 2012 Asia Pacific/Singapore Equity Research Specialty Hardlines OSIM International (OSIL.SI / OSIM SP) SMALL & MID CAP RESEARCH Shaping up ■ Initiate with OUTPERFORM rating. We initiate coverage of OSIM, with an OUTPERFORM rating, and 53% potential upside to our S$1.85 target price based on the discounted cash flow (DCF)-methodology. ■ A turnaround story with legs. OSIM has achieved 12 consecutive quarters of YoY earnings growth, after returning to profitability in 1Q09. We see further earnings traction, given its strong product pipeline, improving sales growth momentum and margin expansion. As a result, we see sales growth accelerating from a 7% CAGR over FY09-11, to a 14% CAGR from FY12- 15E, with forecast net profit rising at a 16% CAGR over the same period. ■ Multiple growth drivers ahead. OSIM’s growth is expected to be driven by new product launches and a roll-out of its global retail and distribution network. We forecast OSIM’s store count to jump 27% to almost 1,500 by the end of FY15E. This would be led by: (1) its expansion in China, with a net increase of 50 OSIM outlets targeted per year and growth focused for the RichLife business in seven key cities; (2) Taiwan, given the stronger contribution from its new GNC franchise; and (3) further ahead, increasing growth momentum from the TWG Tea deal. At the same time, OSIM aims to increase the profitability of existing outlets to drive earnings growth. ■ Valuations look compelling. OSIM trades at 11.1/9.3x FY12E/13E P/E, against our target FY12E P/E of 17.0x, with reference to China/Hong Kong speciality retailers and brand footwear/apparel names. Key risks are: (1) weak macro economies impacting demand; (2) failure to execute on store expansion plans; (3) lack of sales traction for new products; (4) poor inventory management; (5) brand dilution; (6) proliferation of counterfeit/look-alike products; and (7) competition. Financial and valuation metrics Year 12/11A 12/12E 12/13E 12/14E Revenue (S$ mn) 553.7 626.0 719.3 823.2 EBITDA (S$ mn) 111.8 127.4 149.4 169.3 EBIT (S$ mn) 100.4 115.5 136.4 153.7 Net profit (S$ mn) 69.1 80.2 96.4 110.2 EPS (CS adj.) (S$) 0.10 0.11 0.13 0.15 Change from previous EPS (%) n.a. 0 0 0 Consensus EPS (S$) n.a. 0.11 0.12 0.14 EPS growth (%) 38.0 6.7 20.3 14.3 P/E (x) 12.0 11.2 9.3 8.2 Dividend yield (%) 2.5 2.9 3.3 3.7 EV/EBITDA (x) 7.7 6.5 5.1 4.1 P/B (x) 5.4 4.1 3.1 2.5 ROE (%) 50.5 41.5 37.8 33.7 Net debt/equity (%) net cash net cash net cash net cash Source: Company data, Thomson Reuters, Credit Suisse estimates Rating OUTPERFORM* [V] Price (02 May 12, S$) 1.22 Target price (S$) 1.85¹ Chg to TP (%) 51.9 Market cap. (S$ mn) 918 Enterprise value (S$ mn) 826.72 Number of shares (mn) 752.14 Free float (%) 31.1 52-week price range 1.73 - 0.99 *Stock ratings are relative to the relevant country benchmark. ¹Target price is for 12 months. [V] = Stock considered volatile (see Disclosure Appendix). Research Analysts Su Tye Chua 65 6212 3014 [email protected]
Transcript
DISCLOSURE APPENDIX CONTAINS ANALYST CERTIFICATIONS AND THE STATUS OF NON-US ANALYSTS. U.S. Disclosure: Credit Suisse does and seeks to do business with companies covered in its research reports. As a result, investors should be aware that the Firm may have a conflict of interest that could affect the objectivity of this report. Investors should consider this report as only a single factor in making their investment decision.
03 May 2012Asia Pacific/Singapore
Equity ResearchSpecialty Hardlines
OSIM International (OSIL.SI / OSIM SP)
SMALL & MID CAP RESEARCH
Shaping up ■ Initiate with OUTPERFORM rating. We initiate coverage of OSIM, with an
OUTPERFORM rating, and 53% potential upside to our S$1.85 target price based on the discounted cash flow (DCF)-methodology.
■ A turnaround story with legs. OSIM has achieved 12 consecutive quarters of YoY earnings growth, after returning to profitability in 1Q09. We see further earnings traction, given its strong product pipeline, improving sales growth momentum and margin expansion. As a result, we see sales growth accelerating from a 7% CAGR over FY09-11, to a 14% CAGR from FY12-15E, with forecast net profit rising at a 16% CAGR over the same period.
■ Multiple growth drivers ahead. OSIM’s growth is expected to be driven by new product launches and a roll-out of its global retail and distribution network. We forecast OSIM’s store count to jump 27% to almost 1,500 by the end of FY15E. This would be led by: (1) its expansion in China, with a net increase of 50 OSIM outlets targeted per year and growth focused for the RichLife business in seven key cities; (2) Taiwan, given the stronger contribution from its new GNC franchise; and (3) further ahead, increasing growth momentum from the TWG Tea deal. At the same time, OSIM aims to increase the profitability of existing outlets to drive earnings growth.
■ Valuations look compelling. OSIM trades at 11.1/9.3x FY12E/13E P/E, against our target FY12E P/E of 17.0x, with reference to China/Hong Kong speciality retailers and brand footwear/apparel names. Key risks are: (1) weak macro economies impacting demand; (2) failure to execute on store expansion plans; (3) lack of sales traction for new products; (4) poor inventory management; (5) brand dilution; (6) proliferation of counterfeit/look-alike products; and (7) competition.
Rating OUTPERFORM* [V] Price (02 May 12, S$) 1.22 Target price (S$) 1.85¹ Chg to TP (%) 51.9 Market cap. (S$ mn) 918 Enterprise value (S$ mn) 826.72 Number of shares (mn) 752.14 Free float (%) 31.1 52-week price range 1.73 - 0.99 *Stock ratings are relative to the relevant country benchmark. ¹Target price is for 12 months. [V] = Stock considered volatile (see Disclosure Appendix).
Shaping up A turnaround story with legs OSIM has achieved 12 consecutive quarters of YoY earnings growth, after returning to profitability in 1Q09. We see further earnings traction, given its strong product pipeline, improving sales growth momentum, and margin expansion. We see sales growth accelerating from a 7% CAGR over FY09-11, to a 14% CAGR from FY12-15E, with forecast net profit rising at a 16% CAGR over the same period.
Multiple growth drivers ahead OSIM’s growth is expected to be driven by new product launches and the roll-out of its global retail and distribution network. We forecast OSIM’s store count to jump 27% from 1,168 at end-FY11, to 1,484 by end-FY15E. This would be led by: (1) its expansion in China, where management is targeting a net increase of 50 OSIM outlets per year, while focusing on drive growth of its RichLife business in seven key cities; (2) Taiwan to boost contribution from its GNC franchise from FY12; and (3) increasing sales growth momentum from its TWG Tea acquisition announced in April 2011. At the same time, OSIM aims to increase the profitability of existing outlets to drive earnings growth. Management’s long-term strategy is to build the OSIM name into an umbrella brand for healthcare and lifestyle products, retailing them through franchise outlets globally. Near term, we expect OSIM to report record core net profit for its Mar-12 quarter on 7 May after market close, underpinned by strong volumes from the launch of the new uPhoria leg massager in Dec-11, and further sales traction for the uDivine massage chair.
Valuations are compelling We derive our S$1.85 target price from a discounted cash flow (DCF)-based methodology and explicitly forecast long-term valuation drivers. We assume a weighted average cost of capital (WACC) of 10.5% and terminal growth of 3%. Our target price implies an FY12E/13E P/E of 17.0x/14.2x, which is compelling versus OSIM’s current valuation of 11.1x/9.3x P/E. Our target P/E also compares favourably to OSIM’s historical 12-month forward P/E of 14.0x, the average FY12E/13E P/E multiples of 20.0x/15.5x for comparable China/Hong Kong speciality retailers, and the average FY12E/13E P/E multiples of 17.0x/14.0x for China/Hong Kong-branded footwear/apparel companies. We compare OSIM against these companies, as nearly 60% of its revenues are derived from North Asia, with future growth largely China-focused. With 53% upside, we initiate coverage with an OUTPERFORM rating.
Investment risks The key risks to our investment thesis for OSIM are: (1) weak macros impacting demand for its products; (2) failure to execute on store expansion plans implying downside risks to our revenue and earnings estimates; (3) lack of sales traction for new products; (4) poor inventory management; (5) brand dilution; (6) proliferation of counterfeit products; and (7) competition.
We see sales growth for OSIM, accelerating from 7% CAGR over FY09-11, to 14% CAGR from FY12-15E
New products and store network expansion are key growth drivers
Our target price of S$1.85 assumes a WACC of 10.5% and terminal growth of 3% ...
… and implies an FY12E P/E of 17.0x
03 May 2012
OSIM International (OSIL.SI / OSIM SP) 4
OSIM International OSIL.SI / OSIM SP Price (30 Apr 12): S$1.21, Rating:: OUTPERFORM, Target Price: S$1.85
Target price scenario Scenario TP %Up/Dwn Assumptions Upside Central Case 1.85 53.1 Downside
Source: Company data, Thomson Reuters, Credit Suisse estimates.
12MF P/E multiple
0
5
10
15
20
25
2007 2008 2009 2010 2011 2012
12MF P/B multiple
0
1
2
3
4
5
6
7
2007 2008 2009 2010 2011 2012
Source: IBES
03 May 2012
OSIM International (OSIL.SI / OSIM SP) 5
A turnaround story with legs OSIM has achieved 12 consecutive quarters of YoY earnings growth, after returning to profitability in 1Q09. We see further earnings traction, given its strong product pipeline, improving sales growth momentum and margin expansion. We see sales growth accelerating from a 7% CAGR over FY09-11, to a 14% CAGR from FY12-15E, with forecast net profit rising at a 16% CAGR over the same period.
Further sales traction OSIM has achieved 12 consecutive quarters of YoY earnings growth, after returning to profitability in 1Q09. This was underpinned by same-store sales growth (SSSG) and margin expansion, on a better product mix and operating efficiency gains.
Thus, while revenues rose at a 7% CAGR from FY08-11, gross profit increased at a 10% CAGR, with operating profit jumping by a 60% CAGR.
Figure 8: Revenue, gross profit and operating profit growth—YoY change
0.0
10.0
20.0
30.0
40.0
50.0
60.0
70.0
80.0
FY09 FY10 FY11
Rev enue Gross profit Operating profit
(%)
Source: Company data, Credit Suisse estimates
We see growth accelerating on further store openings and margin expansion, with earnings forecast to have a 16% CAGR from FY12-15E
03 May 2012
OSIM International (OSIL.SI / OSIM SP) 6
Product launches We see further sales traction at OSIM, given its strong product pipeline. OSIM’s growth is expected to be driven by new product launches and management targets to launch a new product, or derivative of an existing product, every quarter. We are optimistic that OSIM will be able to achieve this, given the strong track record of product launches since the 2002 introduction of the iMedic, OSIM’s first massage chair (see Appendix for OSIM’s product roadmap).
OSIM launched the uDivine in 4Q10, which was the key growth driver in 2011.
Figure 9: OSIM—recent product launches
uDivine uCrown Pro uVenus
Launched Nov-10: Human 3-D massage chair Launched May-11: Anti-stress head and eye massage Launched May-11: Ambient purifier
uPapa Music Sync uDivine Sport uPhoria
Launched Jul-11: Power-drum shoulder
massage Launched Aug-11: Ultra-luxe massage chair
inspired by sportscar interior Launched Nov-11: ‘Tui-Na’ leg massager
Source: Company data, Credit Suisse research
In FY12, we see growth driven by:
(1) The uPhoria leg massager (launched in 4Q11)
(2) The uSoffa Runway (a smaller massage chair targeted towards women) in 1Q12; and
(3) The uDivine App massage chair (a new version of uDivine with the capability to connect to an iPhone app via Bluetooth) in 2Q12
Growth strategy is well-aligned Our analysis of OSIM’s past 12 quarters’ performance reaffirms our view that its growth strategy is strongly aligned towards underlying market demand fundamentals. Thus, in more mature markets (South Asia), revenue growth for OSIM is mostly dependent on SSSG, and here we believe that management is executing well on driving profitability across its retail network by closing unprofitable stores.
Therefore, while the number of OSIM stores in South Asia fell by 22% from FY08-11, we estimate that sales per store likely increased at a CAGR of 13% YoY during the same period.
OSIM has a strong product pipeline, and plans to launch new products every quarter
Moving forward, growth in South Asia will be driven by SSSG, as OSIM continues to focus on profitability
03 May 2012
OSIM International (OSIL.SI / OSIM SP) 7
Figure 10: Number of stores (South Asia) vs. sales/store (YoY change)
However, in newer markets, OSIM drives top-line growth via the opening of new stores. This is led by OSIM’s push into China, which we estimate generates almost half of total revenues from North Asia, where penetration is relatively low.
A closer look at the North Asia OSIM business suggests that even as the number of stores has increased by 17% from FY08-11, sales/store based on our estimates have lagged the growth in South Asia, increasing at a 6% CAGR during the same period.
Sales/store growth has lagged store growth in North Asia
03 May 2012
OSIM International (OSIL.SI / OSIM SP) 8
Figure 12: Number of stores (North Asia) vs. sales/store (YoY change)
Notwithstanding that China is a very fragmented market, we estimate that OSIM likely commands a 5% share of the health and wellness equipment market in China, which, according to Frost and Sullivan, a global research and consulting firm, is expected to experience an 18.3% CAGR from 2010-15E.
Figure 13: Total health and wellness equipment market in China and OSIM China sales
5.0
10.0
15.0
20.0
25.0
30.0
FY10 FY11 FY12E FY13E FY14E FY15E
0.0
0.3
0.6
0.9
1.2
1.5
China total health and w ellness equipment market Osim China sales (RHS)
(RMB bn) (RMB bn)
Source: Frost & Sullivan, Credit Suisse estimates
We therefore see significant headroom for growth, especially given the company’s strong premium positioning. This also supports OSIM’s strategy to increase store count in China to boost its profile and brand franchise over the near to medium term. Hence, we see upside driven by stronger growth momentum for OSIM’s North Asia operations over the coming 12-18 months, as management executes on improving profitability across its store network.
China’s health and wellness market is expected to have a 18.4% CAGR from 2010-15E
We see further room for growth, as OSIM seeks to increase its store count in China
03 May 2012
OSIM International (OSIL.SI / OSIM SP) 9
TWG’s expansion an added boost OSIM in April 2011 announced the acquisition of a 35% stake in TWG Tea (parent) for S$31.4 mn, along with the setting up of a 60:40 JV, which will focus on four markets in North Asia: China, Hong Kong, South Korea and Taiwan. TWG (the parent) operates nine flagship (salon and boutique) stores, with six in Singapore, and one each in Japan, the UK and the US. It has also announced plans to open four new stores in 1H12—one in Kuala Lumpur, two in Dubai and one in Bangkok.
OSIM’s TWG operations in North Asia saw the opening of its first flagship store in the IFC Mall in Hong Kong in December 2011, and plans are underway for four more stores in Hong Kong, Shanghai, and Taipei this year. We have limited material information on TWG and its financials, but according to management, TWG’s operational metrics, such as sales and profitability per store are higher than those of OSIM’s. We therefore expect these stores to contribute to both revenue and earnings from FY12E.
Stronger revenue growth momentum We see stronger revenue growth momentum, forecasting revenue to increase at a 14% CAGR from FY12-15E, from a 7% CAGR for FY08-11. Earnings have recovered strongly from losses of S$7.7 mn in FY08, and we forecast net profit to rise at a 16% CAGR from FY12-15E.
Sales and profitability per TWG store exceed those of OSIM’s
03 May 2012
OSIM International (OSIL.SI / OSIM SP) 10
Multiple growth drivers ahead OSIM’s growth is expected to be driven by new product launches, and the roll-out of its global retail and distribution network. In China, management is targeting a net increase of 50 OSIM outlets per year, and to focus its RichLife outlet expansion in seven cities (previously 19). At the same time, OSIM aims to increase the profitability of existing outlets to drive earnings growth. Management’s long-term strategy is to build the OSIM name into an umbrella brand for healthcare and lifestyle products, retailing them through franchise outlets globally.
Store network expansion After expanding in 2010, OSIM rationalised store count and closed 16 unprofitable stores during 2011. Management is targeting a net annual increase of 50 OSIM outlets in China, and ten in other markets, from 2012-15E. However, we are more conservative in our forecasts, and have factored in a net increase of 40 OSIM outlets in China and zero increase in other markets, as we see further store closures which could partly offset new store openings. We believe that this is slightly ahead of the historical trend of net OSIM store openings, which have averaged 32 per year since 2000. However, excluding the period from FY08-10, when there were stores closures during the global financial crisis, net store openings averaged 63 per year.
The GNC/RichLife network has experienced a 21% CAGR from a total of 153 outlets in 2008 to 270 in 2011, which management admitted was due to an over-expansion of its RichLife store network in too many cities during this time, where the number of outlets more than doubled from 42 in 2009 to 95 in 2011. OSIM has since scaled back growth ambitions, and will instead focused on strengthening its management teams before embarking on expanding the number of outlets there.
Management does not expect the RichLife business in China to turn profitable in 2012, but the extent of losses should narrow, as OSIM rationalises the number of stores by reducing its presence from 19 cities to 7-8 cities in order to focus on improving their profitability. Thus, we expect OSIM will continue to reduce store count this year. However, we forecast a net increase of 30 stores, primarily due to the addition of 34 GNC Taiwan stores from January 2012. We believe that the nutritional supplements market in Asia is still emerging and we expect demand growth to be driven by increasing consumer awareness and a
OSIM plans to increase its China network by 50 outlets per year
GNC/Richlife network had a 21% CAGR from 2008-11—but management plans to scale back on growth
Profitability will remain the focus for 2012 – management expect losses to narrow this year
03 May 2012
OSIM International (OSIL.SI / OSIM SP) 11
focus on health and well-being. We model in a modest YoY increase of GNC and RichLife stores from FY13E onwards.
Figure 16: Number of GNC/RichLife stores (net change)
We also model in four new TWG stores for North Asia in FY12E, with management targeting to open 1-2 each in China, Hong Kong and Taiwan. TWG (the parent) has announced plans to open new stores in 1H12 in Kuala Lumpur, Dubai and Bangkok, and we model in four new stores in FY12E. We believe that the pace of store openings could accelerate from FY13E, especially in North Asia, with OSIM expecting to see about 5-8 TWG outlets in each country within the next three to five years.
Improving store profitability seen We forecast sales/store for OSIM to increase at an average 2-5% CAGR from FY12-15E, against our estimate of the 6-13% CAGR achieved from FY08-11. We believe that North Asia store numbers are likely to grow faster, given OSIM’s China expansion plans and supportive demand fundamentals, given rising affluence and increasing appetites for lifestyle products.
We forecast sales/store for GNC/RichLife to increase at an average 10-11% CAGR from FY12-15E. OSIM acquired a majority controlling stake in GNC Taiwan in January 2012, and plans to introduce its customer loyalty programme into the stores over the coming months, which offers substantial scope for increases in store productivity over the coming quarters.
We forecast TWG to contribute S$5 mn in revenue in FY12E, rising to about S$40 mn by FY15E, in line with strong growth momentum in the store expansion. Including the contribution from the associate contribution from TWG (the parent), TWG could be expected to generate about 9% of OSIM’s earnings by FY15E.
Further potential upside to margins In a bid to lower overall purchasing costs, OSIM has, over the years, increasingly shifted its supplier base from Japan to its 30% associate, DT-OSIM Healthcare Appliances (DT) which now manufactures the bulk of its massage products, from less than half just two years ago. This has resulted in an improvement in gross margins. Operationally, we believe that OSIM’s direct interest in, and coupled with the increased product order volumes to its own supplier, will also help in its inventory management and planning.
We forecast new store openings to have a 2-5% CAGR from FY12-15E …
… with TWG contributing to 9% of OSIM’s earnings by FY15E
03 May 2012
OSIM International (OSIL.SI / OSIM SP) 12
Figure 17: OSIM’s gross margin trend (1Q09 to 4Q11)
60.0
62.0
64.0
66.0
68.0
70.0
72.0
1Q 2Q 3Q 4Q
2009 2010 2011
(%)
Source: Company data, Credit Suisse estimates
We believe that margins could see further upside in the near term and forecast gross margins to rise further to 70% in FY13E. We believe that this is reasonable, as we draw a comparison of OSIM’s margins against those of OTO’s. OTO retails health and wellness products under its own brand name, and is a smaller competitor with sales concentrated in Hong Kong and Macau. We note that OTO has historically achieved average gross margins of 76-83% for new products. OSIM’s new leg massager, the uPhoria, was just introduced at end-2011 and is in its initial launch phase, which should support margins in the coming quarters. Second, about 93-95% of OSIM’s sales are through its retail distribution channels, which command stronger margins than wholesale operations.
Figure 18: OSIM vs. OTO—gross margin comparison
50
55
60
65
70
75
80
85
FY05 FY06 FY07 FY08 FY09 FY10 FY11 FY12 FY13 FY14
OTO OSIM
(%)
Source: Company data, Credit Suisse estimates
03 May 2012
OSIM International (OSIL.SI / OSIM SP) 13
Operating leverage We believe that the improvement in gross margins has so far been a key driver of operating margin expansion and we further expect marginal accretion in FY12E/13E.
Other costs The biggest cost items in OSIM’s business are rental and staff costs, which have averaged about 17-20% of sales each, based on our estimates. We continue to expect rentals to rise in tandem with the inflationary backdrop in OSIM’s key markets, coupled with asset enhancement initiatives in many of the prime malls where the OSIM, GNC and RichLife stores are positioned. This is likely to cap any significant upside from operating leverage. However, we factor in some improvement in staff sales productivity, consistent with OSIM’s expansion strategy, which supports future operating margin accretion.
Figure 20: OSIM’s revenue and staff costs comparison
0.0100.0200.0300.0400.0500.0600.0700.0800.0900.0
1,000.0
FY00 FY02 FY04 FY06 FY08 FY10 FY12E FY14E
12.0
13.0
14.0
15.0
16.0
17.0
18.0
Rev enue Staff costs (of sales) - RHS
(S$ mn) (%)
Source: Company data, Credit Suisse estimates
03 May 2012
OSIM International (OSIL.SI / OSIM SP) 14
Expecting record March 2012 net profit OSIM will report its March 2012 quarter results on 7 May after the market’s close. We estimate sales of S$158.8 mn, up 6% YoY and net profit of S$20.9 mn, up 4% YoY, largely due to the higher earnings base in 1Q11. However, based on our estimates, we expect OSIM to have achieved record quarterly core net profit in 1Q12. The quarter’s performance would be underpinned by further sales traction for the uDivine massage chair and rising volumes from the launch of the new uPhoria leg massager in December 2011, which would also support margins.
03 May 2012
OSIM International (OSIL.SI / OSIM SP) 15
Valuations look compelling We derive our S$1.85 target price from a DCF-based methodology and explicitly forecast long-term valuation drivers. We assume a WACC of 10.5% and terminal growth of 3%. Our target price implies FY12E/13E P/Es of 17.0x/14.2x, compelling versus OSIM’s current valuation of 11.1x/9.3x P/E.
Our target P/E also compares to OSIM’s historical 12-month forward P/E of 14x, which we believe is justified by the stronger forecast growth and margin profile which OSIM commands.
OSIM’s valuation also compares favourably against the average FY12E/13E P/E multiples of 20.0x/15.5x for comparable China/Hong Kong speciality retailers, and the average FY12E/13E P/E multiples of 17.0x/14.0x for China/Hong Kong-branded footwear/apparel companies. We compare OSIM against these companies, as nearly 60% of its revenues are derived from North Asia, and future growth would be largely China-focused.
China/ HK Specialty Retail Esprit 330 HK U 16.00 12.50 -21.9 2,663 27.7 83.0 30.0 17.1 247.6 1.3 2.3 2.0Prada 1913 HK NR 52.70 NR NR 17,383 16.3 n.a 24.4 19.8 n.a. 6.1 27.2 0.0Samsonite 1910 HK NR 15.04 NR NR 2,728 4.2 32.2 15.9 13.2 56.2 2.5 17.1 0.0L'Occitane 973 HK NR 20.70 NR NR 3,941 1.7 26.3 23.2 19.5 16.2 4.0 18.7 0.0Ports Design 589 HK NR 11.40 NR NR 836 1.1 11.7 10.1 8.6 16.6 2.5 26.3 0.1Lifestyle 1212 HK NR 18.20 NR NR 3,916 4.9 16.3 15.5 13.4 10.5 3.1 22.1 0.0Average 5,244 9.3 33.9 19.8 15.3 69.4 3.3 19.0 0.4China/ HK Footwear Daphne Int'l 210 HK NR 11.08 NR NR 2,353 5.7 21.2 16.2 13.3 26.2 3.9 25.8 0.0Belle 1888 HK O 15.22 14.30 -6.1 16,547 33.1 24.5 21.0 17.7 17.9 5.0 21.8 1.3Li Ning 2331 HK NR 7.14 NR NR 972 6.2 15.9 14.6 11.4 18.0 1.6 11.5 0.0Average 6,624 15.0 20.5 17.3 14.1 20.7 3.5 19.7 0.4Healthcare Brands OTO 6880 HK NR 0.53 NR NR 22 4.3 n.a. n.a. n.a. n.a. n.a. n.a. n.a.Ogawa OGAW MK NR 0.38 NR NR 15 0.3 n.a. n.a. n.a. n.a. n.a. n.a. n.a.Eu Yan Sang EYSAN SP NR 0.68 NR NR 243 0.2 12.4 11.2 9.9 11.6 2.1 18.4 0.0Average 93 1.6 12.4 11.2 9.9 11.6 2.1 18.4 0.0Overall average 3,962.3 10.2 21.6 15.4 12.3 38.3 2.8 19.6 0.5Source: IBES, Credit Suisse estimates
Balance sheet cashed up In July 2011 OSIM successfully raised S$120 mn through a convertible bond (CB) issue (due 2016), with a 2.75% coupon and a S$2.025 conversion price. The CBs are also embedded with a call and put option post July 2014. Assuming full conversion, this would result in the issuance of 59.3 mn new shares, or 7.4% of total outstanding shares. Management plans to use this amount to fund future acquisitions. We think it is unlikely that OSIM will embark on any transformational deal, similar to the Brookstone acquisition. Instead, we believe that OSIM will continue to develop its brand portfolio, and is likely targeting companies, which have an emerging or existing brand or product franchise profile in niche markets, whereby management could drive sales growth by leveraging OSIM’s expanding Pan-Asian retail and distribution platform.
03 May 2012
OSIM International (OSIL.SI / OSIM SP) 17
Risks The key risks to our investment thesis for OSIM are: weak macros impacting demand for its products, failure to execute on store expansion plans implying downside risks to our revenue and earnings estimates, lack of sales traction for new products, poor inventory management, brand dilution, proliferation of counterfeit products, and competition.
Weak macro economies impacting demand OSIM’s products are discretionary in nature with demand correlated to changes in the overall macroeconomic backdrop. We do not think there will be a hard-landing scenario, and in any case, fundamentals in Asia, which generate more than 90% of OSIM’s revenues, remain sound, with consumption relatively more resilient, versus the rest of the world. However, a prolonged period of economic uncertainty could weigh on sentiment, and affect demand for OSIM’s products. This risk is also exacerbated by the high operating leverage of OSIM’s business.
Failure to execute on store expansion plans Our revenue estimates are primarily driven by our assumptions on increases in store count, which we believe are conservative, both against management’s growth targets, and compared to historical average run-rates. However, failure to execute on these expansion plans, either due to the inability in finding new store locations, or unexpected closure of existing stores, will imply downside risk to our revenue as well as earnings forecasts.
Lack of sales traction for new products OSIM’s strong product pipeline is the key driver to its growth momentum. OSIM has successfully leveraged its competencies in marketing and product development, and demonstrated a strong track record in delivering products which appeal to its customer base. It remains critical for OSIM to continue to be able to predict and keep pace with the constant changes in consumer preferences, which would allow it to adjust its product mix, or introduce new products that are commercially viable in a timely manner, to drive sales traction, and revenue growth.
Brand dilution The OSIM brand remains the key value driver of its business, and OSIM will have to carefully manage this to prevent any dilution. For now, OSIM has continued to focus on positioning its core products at the “luxury” end of its market segment, where the entry barriers are more stringent. Management has also continued to seek new channels to raise the OSIM brand profile, for instance, via sponsorship of high-profile corporate events, such as the OSIM International Triathlon since 2001, the OSIM Singapore Golf Masters (from 2005-08), and the BMF World Superseries (2011-13), which should help boost the brand’s presence globally. OSIM’s strategy is to participate in or sponsor high-profile corporate events such as triathlons, a multi-disciplinary sport that encourages stamina, endurance and strength, and promotes a healthy lifestyle, qualities that are strongly aligned with OSIM’s own corporate culture. A dedicated marketing budget (at about 6-7% of sales), coupled with celebrity endorsements and tie-ups for key product launches (e.g. Andy Lau, the Hong Kong actor and singer, for the uDivine massage chair and its derivatives), also reinforce our underlying confidence in the success of these efforts.
03 May 2012
OSIM International (OSIL.SI / OSIM SP) 18
Poor inventory management OSIM needs to manage the roll-out of its operations effectively. Should its network expand too quickly, there is a risk of an inventory build-up in the distribution channels. For now, OSIM seems to have managed this well. Inventory levels have actually improved from 120-160 days during FY06-09, to 90-120 days during FY09-11, despite sales growth in the past 12 quarters.
Proliferation of counterfeit/look-alike products One of the most common problems faced by retailers operating in China is the proliferation of counterfeit products, and OSIM learnt a painful lesson during FY06-07 with its uZap slimming belt and massager, by finding out the hard way, that the true cost of legal action far exceeds the penalties for the contravention of intellectual property (IP) laws in China. OSIM is likely to mitigate this by accelerating its pace of product innovation, since the shelf-life of its new products is likely to be abruptly shortened by imitations. We believe that OSIM will have to be even more aggressive in its marketing initiatives and seek other A&P channels, given the strength of its franchise in China and the breadth of its product portfolio. This suggests that there are still ample opportunities and compelling monetary reasons for the imitators to continue to gain at the company’s expense.
Competition Competition in the health and wellness equipment market is intense, with the industry characterised by rapid launches of new models, continuous technological advancement, evolving industry standards and changing customer needs. OSIM has so far stayed ahead of its competitors through its marketing initiatives, and strong management of its brand name. However, we believe that the GNC nutritional supplements business is likely to face rising competition from the many online retailers distributing similar products at lower prices. Here, OSIM plans to further develop its own brand portfolio, LAC, and to leverage its existing GNC retail infrastructure to drive sales growth.
03 May 2012
OSIM International (OSIL.SI / OSIM SP) 19
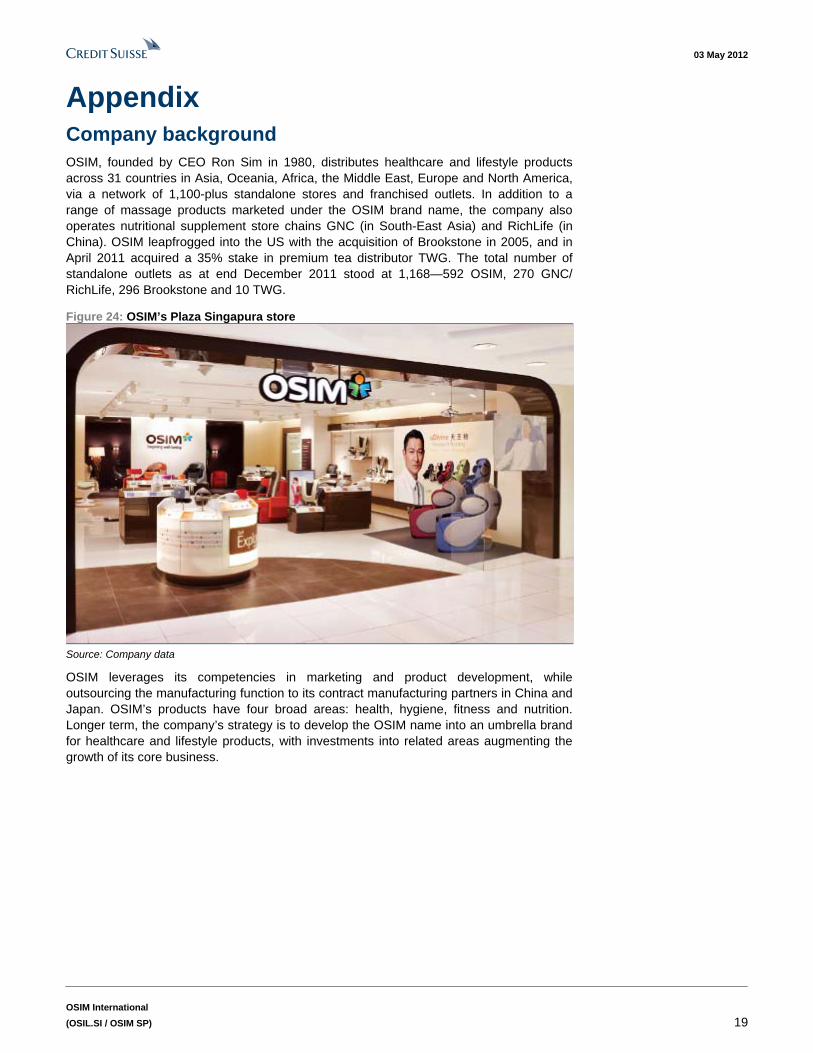
Appendix Company background OSIM, founded by CEO Ron Sim in 1980, distributes healthcare and lifestyle products across 31 countries in Asia, Oceania, Africa, the Middle East, Europe and North America, via a network of 1,100-plus standalone stores and franchised outlets. In addition to a range of massage products marketed under the OSIM brand name, the company also operates nutritional supplement store chains GNC (in South-East Asia) and RichLife (in China). OSIM leapfrogged into the US with the acquisition of Brookstone in 2005, and in April 2011 acquired a 35% stake in premium tea distributor TWG. The total number of standalone outlets as at end December 2011 stood at 1,168—592 OSIM, 270 GNC/ RichLife, 296 Brookstone and 10 TWG.
Figure 24: OSIM’s Plaza Singapura store
Source: Company data
OSIM leverages its competencies in marketing and product development, while outsourcing the manufacturing function to its contract manufacturing partners in China and Japan. OSIM’s products have four broad areas: health, hygiene, fitness and nutrition. Longer term, the company’s strategy is to develop the OSIM name into an umbrella brand for healthcare and lifestyle products, with investments into related areas augmenting the growth of its core business.
03 May 2012
OSIM International (OSIL.SI / OSIM SP) 20
Figure 25: Value chain Some outsourced, but increasingly undertaken by in-house design teams in Singapore, Shanghai, US, Europe and Japan, with IP rights owned by OSIM
All production needs are outsourced to third party contract manufacturers in Japan, and China (massage chairs, foot massagers) through 30%-owned JV
Retail/Distribution: Through 1,168 retail outlets in North Asia, South Asia, and other franchisees in Middle East, US, and Europe
Wholesale (small): To hospitals, pharmacies, Chinese medical halls, health clubs, beauty centres, fitness centres
ONI retails/distributes nutritional supplements through its 175 GNC stores (in Singapore, Malaysia, Brunei, Australia, and Taiwan) and 95 RichLife stores (in China)
TWG retails/distributes its luxury tea and products to airlines, hotels, and through 10 salons/boutiques in North Asia (60%-owned JV), and South Asia (35%-owned associate).
Design
Other income streams
Sourcing
Sales channels
Some outsourced, but increasingly undertaken by in-house design teams in Singapore, Shanghai, US, Europe and Japan, with IP rights owned by OSIM
All production needs are outsourced to third party contract manufacturers in Japan, and China (massage chairs, foot massagers) through 30%-owned JV
Retail/Distribution: Through 1,168 retail outlets in North Asia, South Asia, and other franchisees in Middle East, US, and Europe
Wholesale (small): To hospitals, pharmacies, Chinese medical halls, health clubs, beauty centres, fitness centres
ONI retails/distributes nutritional supplements through its 175 GNC stores (in Singapore, Malaysia, Brunei, Australia, and Taiwan) and 95 RichLife stores (in China)
TWG retails/distributes its luxury tea and products to airlines, hotels, and through 10 salons/boutiques in North Asia (60%-owned JV), and South Asia (35%-owned associate).
Design
Other income streams
Sourcing
Sales channels
Source: Company data, Credit Suisse estimates
OSIM’s current business can be classified into three broad product segments: massage products (under the OSIM brand umbrella), health and nutritional supplements (under the 94.6%-owned subsidiary, OSIM Nutrients Incorporated Pte Ltd (or ONI), and luxury tea (through the TWG acquisition in April 2011). We estimate that massage products generated about 75-80% of OSIM’s revenues in FY11, with the remaining 20-25% contributed by sales of health and nutritional supplements.
OSIM does not disclose sales contribution by product segment but by reporting revenue across three key markets: North Asia; South Asia; and America/Africa/Europe/Middle East/Oceania. In FY11, North Asia generated 57% of OSIM’s revenues, with South Asia at 37%, and the remainder contributed by its operations in America/Africa/Europe/Middle East/Oceania.
Figure 26: Revenue breakdown by segment (FY11) Figure 27: Revenue breakdown by geography (FY11)
Retail93%
Distribution7%
North Asia57%
South Asia37%
America/ Africa/ Europe/ Middle East/
Oceania6%
Source: Company data, Credit Suisse estimates Source: Company data, Credit Suisse estimates
03 May 2012
OSIM International (OSIL.SI / OSIM SP) 21
New products OSIM’s strong product pipeline is a key driver of its growth momentum. Over the years, the company has continued to leverage off the success of its Millennium Chair, the first massage chair marketed under the OSIM brand name in the 1990s, and consistently introduced new key products every quarter. OSIM’s most popular products have typically been its massage chairs, which have higher selling prices, while its smaller hand-held and foot massagers command better margins.
03 May 2012
OSIM International (OSIL.SI / OSIM SP) 22
Figure 28: OSIM’s product roadmap Date launched
Product Description
Feb-02 iMedic First massage chair under OSIM brand Feb-03 iTwin Foot massager Apr-03 iSymphonic Massage chair that synchronises both massage and audio-visual signals Dec-03 iSense Electro-foot massager with micro-conductive fibre Mar-04 Nourish REFINE Nutritional skincare supplement Apr-04 iSymphonic AV Enhancement of the i-Symphonic Jun-04 iEcologi Vacuum cleaner utilising both heat and water. Aug-04 NORO range Secondary brand focussed on selling lower-priced massage chairs Nov-04 iDesire Massage chair with full body massage functions Feb-05 iSqueeze 3-in-1 foot, calf and ankle massager Feb-05 iPamper Handheld massager Mar-05 iCare 200 Eye massager Mar-05 iCheck 500 Blood pressure and body fat monitor Mar-05 iTango Portable pulse massager with radio Mar-05 iLife Air purifier Oct-05 uZap Slimming belt and massager Dec-05 iGallop Horse riding simulator Mar-06 iDesire ROBO Massage chair with voice control function Sep-06 iMedic Pro First mid-priced massage chair Sep-06 iGogo Massaging MP3 player Dec-06 uPilot Designer massager chair with joystick function Dec-06 uZap Mini Similar to u-Zap, targeting smaller body parts Dec-06 uZap Papa Massager with drumming action Jan-07 uPilot Designer massage chair with patented ROBO-Stic technology Feb-07 uPapa Power drum-massage Sep-07 uSqueez Warm leg massager Dec-07 uSpace Well-being chair Jan-08 uRobic Cardio-Twist exercise machine Feb-08 uYoyo Massage and exercise chair Jul-08 uMedic Multi-purpose full body massage chair with retractable foot rest Aug-08 uCrown Anti-stress head massager Feb-09 uSqueez Warm Leg massager with heat therapy Apr-09 uDream Hybrid 3-System family massage chair Jun-09 uPapa Hug Snug-fit and versatile massager Jul-09 uDesire Convertible massage chair Oct-09 uKimono Kimono inspired slim belt massager Jan-10 uSoffa Petit Little massage sofa Apr-10 uMama Warm Wearable 360° , multi-point, upper body massager Jun-10 uSoffa Full-body massage sofa Nov-10 uDivine Human-3D massage chair May-11 uCrown Pro Anti-stress head and eye massager May-11 uVenus Ambient purifier Jul-11 uPapa Music Sync Power-drum shoulder massage Aug-11 uDivine Sport Ultra-luxe massage chair inspired by the plush interiors of a sportscar 2H11 Taut Nutritional supplement (GNC) 2H11 Zhi Nutritional supplement (GNC) 2H11 uPhoria Leg massager with 'tui na' features 2012 uSoffa Runway Chic' massage chair
Source: Company data, Credit Suisse estimates
03 May 2012
OSIM International (OSIL.SI / OSIM SP) 23
Marketing expertise OSIM has strengthened its business around its successful marketing know-how and careful management of its brand name. The company has achieved this by faithfully allocating about 6-7% of sales to its advertising and promotion budget. This is a strategy that has seen significant success so far – OSIM’s products are typically priced at a premium to those of its competitors.
Strong sales growth has also allowed OSIM to increase its dollar ad-spend significantly. This increase in marketing exposure has snowballed into celebrity endorsements, with a growing number of Asian personalities, including Chinese actress Gong Li, and most recently Hong Kong actor Andy Lau being associated with OSIM.
Figure 29: Celebrity endorsements Celebrity Country Profile Gong Li China Actress Carina Lau Hong Kong Actress Zhang Fei Taiwan Talk show host Fiona Xie Singapore Actress Louis Koo Hong Kong Actor Jacelyn Tay Singapore Actress Ix Shen Singapore Actor Jeanette Aw Singapore Actress Lin Chi-Ling Taiwan Actress S.H.E Taiwan Singer Xiao S Taiwan Talk show host Andy Lau Hong Kong/International Actor/Singer Olivia Ong Singapore Singer
Source: Company data, Credit Suisse estimates
Strong brand recognition Results from a 2008 independent survey conducted by market research firm, Synovate, and supported by International Enterprise Singapore, identified OSIM as the No.1 healthy lifestyle products brand in consumers’ minds across Asia. Survey respondents from Singapore, Malaysia, Indonesia, Hong Kong, Taiwan and China, OSIM’s key markets, ranked OSIM as the Most Preferred Healthy Lifestyle Brand, the Most Preferred Massage Chair Brand, as well as the ‘Top of Mind Recall Healthy Lifestyle Brand in Asia’.
In 2010, OSIM ranked first in the massage chair market in terms of units sold with a market share of 68%, and in terms of sales revenue with a market share of 75% in Hong Kong, nearly four times that of its nearest competitor, and with the top two brands accounting for 85% of the total market, according to research consultant Frost and Sullivan.
03 May 2012
OSIM International (OSIL.SI / OSIM SP) 24
Figure 30: Massage chair market share in Hong Kong by units sold (2010)
Figure 31: Massage chair market share in Hong Kong by sales revenue (2010)
OSIM68%
OTO18%
Sany o0%
Others1%
Panasonic5%OGAWA
8%
OSIM75%
OTO11%
OGAWA7%
Panasonic6%
Others1%
Sany o0%
Source: Company data, Credit Suisse estimates Source: Company data, Credit Suisse estimates
More importantly, OSIM’s premium market positioning is evident by the higher selling prices which it commands.
Figure 32: Comparison of units sold and average prices for massage chair brands in Hong Kong (2010)
Figure 33: Comparison of units sold and average prices for massage equipment brands in Hong Kong (2010)
OTO
OSIM
OGAWA
Panasonic
Sany o
0.00
0.50
1.00
1.50
2.00
2.50
0 20000 40000 60000 80000 100000 120000 140000
Average price (HK$k)
Units sold
Source: Company data, Credit Suisse estimates
Acquisitions Brookstone
In April 2005, OSIM led a syndicate, comprising of Temasek Holdings, and JW Childs, a US-based private equity firm, to acquire US-listed specialty retail chain Brookstone for US$456 mn. The acquisition was funded by a combination of US$248 mn equity and US$205 mn debt. OSIM contributed US$90 mn to the equity portion of the deal through borrowings and held a 55% stake in the company, after the transaction was completed in July 2005, while the debt undertaken for the acquisition is ring-fenced and non-recourse to OSIM.
Figure 34: Structure of transaction
BrookstoneInc
OSIM Brookstone
Holdings
BrookstoneAcq Corp
Acquirer
Special Purpose Vehicle
Target
Source: Company data, Credit Suisse estimates
Figure 35: Consortium investment bid structure for Brookstone (US$ mn) Value OSIM Temasek + JW Childs Mgmt team Common share 123 90 25 8 Pref share 125 0 125 0 Total equity 248 90 150 8 Non-recourse debt 205 - - - Source: Company data, Credit Suisse estimates
03 May 2012
OSIM International (OSIL.SI / OSIM SP) 26
Brookstone is a speciality retailer selling gifts, gadgets and other products primarily targeted at men, via multiple distribution channels, including retail stores, catalogues and through the Internet. The company operates about 300 Brookstone stores in the US and Puerto Rico, and also sells its items online and through its two catalogues – Brookstone and Hard-To-Find Tools. Brookstone’s outlets are largely located in high-traffic shopping malls, including 39 stores in airport terminals. These airport outlets are attractive as they reduce reliance on the holiday season.
The investment rationale was strategically sound, as it would have allowed OSIM to leapfrog ahead of its 1,000 store (in 2008) target, and at the same time, gain a foothold in the US consumer market. It was initially hoped that Brookstone would be re-listed after five years, thereby providing an exit for Temasek, JW Childs and management. However, despite growing its EBITDA from US$41.7 mn in FY04 to US$55.4 mn in 2007, Brookstone recorded significant losses during the global financial crisis in 2008, on lower sales and high debt service costs. This prompted OSIM to write-off the Brookstone investment in 2008. Brookstone further restructured its debt profile, from US$170 mn due 2012, to US$135.5 mn due in 2014, primarily to postpone the potential IPO target, and subsequently invested US$9.6 mn in Brookstone’s senior preferred notes. We have not included any value from Brookstone into our forecasts..
Figure 36: Brookstone
Source: Company data
ONI (previously Global Active)
In April 2003, OSIM acquired a 29.9% stake in Global Active (GLA), a retailer and distributor of health food and nutritional supplements. GLA holds the franchise rights for the General Nutrition Centres (GNC) brand of nutritional products in Singapore, Malaysia, Brunei and China and US military bases in Guam, Korea and Japan, and operates a total of 139 in these geographies. Although this stake was reduced to 23.9% when GLA was listed in 2004, OSIM afterwards increased its shareholding through a put-and-call agreement, and subsequently privatised GLA towards the end of FY05. In 2010, OSIM converted its Australian operations (from retail) to franchised outlets, which resulted in lower sales recognition but better profitability, and in 2011, OSIM renamed its subsidiary as OSIM Nutritional Incorporated Pte Ltd (ONI), which currently operates 175 franchise
03 May 2012
OSIM International (OSIL.SI / OSIM SP) 27
stores of GNC in Singapore, Malaysia, Brunei, Australia, and Taiwan, and another 95 RichLife stores in China. In January 2012, OSIM acquired a majority controlling stake in the GNC Taiwan franchise for S$6.6 mn, which operates 34 GNC stores in the country.
Figure 37: GNC Figure 38: RichLife
Source: Company data Source: Company data
TWG Tea
In April 2011, OSIM acquired a 35% stake in TWG for S$31.4 mn. TWG is a luxury tea brand, which operates ten flagship (salon and boutique) stores, with six in Singapore, and one each in Japan, the UK and the US, and has announced plans to open four new stores in 1H12 – one in Kuala Lumpur, two in Dubai, and one in Bangkok. TWG positions its stores in prime locations, such as in Ion Orchard and the Marina Bay Sands in Singapore. OSIM has also set up a 60-40 JV with TWG (Parent) to develop its presence in the North Asian markets of Hong Kong, China, Taiwan, and South Korea. The TWG JV opened its first store in the IFC Mall in Hong Kong, in December 2011, and is targeting to open four more stores in Hong Kong, Shanghai, and Taipei this year. According to management, TWG generates about 80% of sales from its standalone stores with the remaining 20% through distribution to hotels, restaurants and airlines. About 60-70% of sales at the standalone stores are derived from tea, with the rest directly through in-store F&B sales.
03 May 2012
OSIM International (OSIL.SI / OSIM SP) 28
Figure 39: TWG Store (Marina Bay Sands)
Source: Company data
Figure 40: TWG shareholding structure
OSIM International Ltd
TWG Tea (Parent) OSIM-TWG (North-Asia)40%
35% 60%
Source: Company data, Credit Suisse research
Companies Mentioned (Price as of 30 Apr 12) Belle International Holdings Ltd (1880.HK, HK$15.22, OUTPERFORM, TP HK$17.60) Daphne International (0210.HK, HK$11.08, NOT RATED) Esprit Holdings (0330.HK, HK$16.00, UNDERPERFORM [V], TP HK$12.50) Eu Yan Sang (EYSI.SI, HK$0.68, NOT RATED) General Nutrition Centers, Inc. (GNC, $40.99, OUTPERFORM, TP $42.00) Li Ning Co Ltd (2331.HK, HK$7.14, OUTPERFORM [V], TP HK$10.00) Lifestyle International Holdings Ltd (1212.HK, HK$18.20, OUTPERFORM, TP HK$23.80) L'Occitane (0973.HK, HK$20.70, NOT RATED) Ogawa (OGAW.KL, RM0.38, NOT RATED) OSIM International (OSIL.SI, S$1.21, OUTPERFORM, TP S$1.85) OTO Holdings (6880.HK, HK$0.53, NOT RATED) Ports Design Limited (0589.HK, HK$11.40) PRADA S.p.A. (1913.HK, HK$52.70) Samsonite (1910.HK, HK$15.04, NOT RATED)
03 May 2012
OSIM International (OSIL.SI / OSIM SP) 29
Disclosure Appendix
Important Global Disclosures I, Su Tye Chua, certify that (1) the views expressed in this report accurately reflect my personal views about all of the subject companies and securities and (2) no part of my compensation was, is or will be directly or indirectly related to the specific recommendations or views expressed in this report. See the Companies Mentioned section for full company names. 3-Year Price, Target Price and Rating Change History Chart for OSIL.SI OSIL.SI Closing
The analyst(s) responsible for preparing this research report received compensation that is based upon various factors including Credit Suisse's total revenues, a portion of which are generated by Credit Suisse's investment banking activities. Analysts’ stock ratings are defined as follows: Outperform (O): The stock’s total return is expected to outperform the relevant benchmark* by at least 10-15% (or more, depending on perceived risk) over the next 12 months. Neutral (N): The stock’s total return is expected to be in line with the relevant benchmark* (range of ±10-15%) over the next 12 months. Underperform (U): The stock’s total return is expected to underperform the relevant benchmark* by 10-15% or more over the next 12 months. *Relevant benchmark by region: As of 29th May 2009, Australia, New Zealand, U.S. and Canadian ratings are based on (1) a stock’s absolute total return potential to its current share price and (2) the relative attractiveness of a stock’s total return potential within an analyst’s coverage universe**, with Outperforms representing the most attractive, Neutrals the less attractive, and Underperforms the least attractive investment opportunities. Some U.S. and Canadian ratings may fall outside the absolute total return ranges defined above, depending on market conditions and industry factors. For Latin American, Japanese, and non-Japan Asia stocks, ratings are based on a stock’s total return relative to the average total return of the relevant country or regional benchmark; for European stocks, ratings are based on a stock’s total return relative to the analyst's coverage universe**. For Australian and New Zealand stocks, 12-month rolling yield is incorporated in the absolute total return calculation and a 15% and a 7.5% threshold replace the 10-15% level in the Outperform and Underperform stock rating definitions, respectively. The 15% and 7.5% thresholds replace the +10-15% and -10-15% levels in the Neutral stock rating definition, respectively. **An analyst's coverage universe consists of all companies covered by the analyst within the relevant sector. Restricted (R): In certain circumstances, Credit Suisse policy and/or applicable law and regulations preclude certain types of communications, including an investment recommendation, during the course of Credit Suisse's engagement in an investment banking transaction and in certain other circumstances. Volatility Indicator [V]: A stock is defined as volatile if the stock price has moved up or down by 20% or more in a month in at least 8 of the past 24 months or the analyst expects significant volatility going forward.
Analysts’ coverage universe weightings are distinct from analysts’ stock ratings and are based on the expected performance of an analyst’s coverage universe* versus the relevant broad market benchmark**: Overweight: Industry expected to outperform the relevant broad market benchmark over the next 12 months. Market Weight: Industry expected to perform in-line with the relevant broad market benchmark over the next 12 months. Underweight: Industry expected to underperform the relevant broad market benchmark over the next 12 months. *An analyst’s coverage universe consists of all companies covered by the analyst within the relevant sector. **The broad market benchmark is based on the expected return of the local market index (e.g., the S&P 500 in the U.S.) over the next 12 months.
03 May 2012
OSIM International (OSIL.SI / OSIM SP) 30
Credit Suisse’s distribution of stock ratings (and banking clients) is: Global Ratings Distribution
*For purposes of the NYSE and NASD ratings distribution disclosure requirements, our stock ratings of Outperform, Neutral, and Underperform most closely correspond to Buy, Hold, and Sell, respectively; however, the meanings are not the same, as our stock ratings are determined on a relative basis. (Please refer to definitions above.) An investor's decision to buy or sell a security should be based on investment objectives, current holdings, and other individual factors. Credit Suisse’s policy is to update research reports as it deems appropriate, based on developments with the subject company, the sector or the market that may have a material impact on the research views or opinions stated herein. Credit Suisse's policy is only to publish investment research that is impartial, independent, clear, fair and not misleading. For more detail please refer to Credit Suisse's Policies for Managing Conflicts of Interest in connection with Investment Research: http://www.csfb.com/research-and-analytics/disclaimer/managing_conflicts_disclaimer.html Credit Suisse does not provide any tax advice. Any statement herein regarding any US federal tax is not intended or written to be used, and cannot be used, by any taxpayer for the purposes of avoiding any penalties. See the Companies Mentioned section for full company names. Price Target: (12 months) for (OSIL.SI) Method: We derive our S$1.85 target price from a DCF-based methodology and explicitly forecast long-term valuation drivers. We assume a WACC of 10.5% and terminal growth of 3%. Risks: The key risks to our investment thesis for OSIM are: weak macros impacting demand for its products, failure to execute on store expansion plans implying downside risks to our revenue and earnings estimates, lack of sales traction for new products, poor inventory management, brand dilution, proliferation of counterfeit products, and competition. Please refer to the firm's disclosure website at www.credit-suisse.com/researchdisclosures for the definitions of abbreviations typically used in the target price method and risk sections.
See the Companies Mentioned section for full company names. The subject company (OSIL.SI) currently is, or was during the 12-month period preceding the date of distribution of this report, a client of Credit Suisse. Credit Suisse provided investment banking services to the subject company (OSIL.SI) within the past 12 months. Credit Suisse has managed or co-managed a public offering of securities for the subject company (OSIL.SI) within the past 12 months. Credit Suisse has received investment banking related compensation from the subject company (OSIL.SI) within the past 12 months. Credit Suisse expects to receive or intends to seek investment banking related compensation from the subject company (OSIL.SI) within the next 3 months. Important Regional Disclosures Singapore recipients should contact a Singapore financial adviser for any matters arising from this research report. The analyst(s) involved in the preparation of this report have not visited the material operations of the subject company (OSIL.SI) within the past 12 months. Restrictions on certain Canadian securities are indicated by the following abbreviations: NVS--Non-Voting shares; RVS--Restricted Voting Shares; SVS--Subordinate Voting Shares. Individuals receiving this report from a Canadian investment dealer that is not affiliated with Credit Suisse should be advised that this report may not contain regulatory disclosures the non-affiliated Canadian investment dealer would be required to make if this were its own report. For Credit Suisse Securities (Canada), Inc.'s policies and procedures regarding the dissemination of equity research, please visit http://www.csfb.com/legal_terms/canada_research_policy.shtml. As of the date of this report, Credit Suisse acts as a market maker or liquidity provider in the equities securities that are the subject of this report. Principal is not guaranteed in the case of equities because equity prices are variable. Commission is the commission rate or the amount agreed with a customer when setting up an account or at anytime after that. Taiwanese Disclosures: This research report is for reference only. Investors should carefully consider their own investment risk. Investment results are the responsibility of the individual investor. Reports may not be reprinted without permission of CS. Reports written by Taiwan-based analysts on non-Taiwan listed companies are not considered recommendations to buy or sell securities under Taiwan Stock Exchange Operational Regulations Governing Securities Firms Recommending Trades in Securities to Customers. To the extent this is a report authored in whole or in part by a non-U.S. analyst and is made available in the U.S., the following are important disclosures regarding any non-U.S. analyst contributors: The non-U.S. research analysts listed below (if any) are not registered/qualified as research analysts with FINRA. The non-U.S. research analysts listed below may not be associated persons of CSSU and therefore may not be subject to the NASD Rule 2711 and NYSE Rule 472 restrictions on communications with a subject company, public appearances and trading securities held by a research analyst account. • Su Tye Chua, non-U.S. analyst, is a research analyst employed by Credit Suisse AG, Singapore Branch. For Credit Suisse disclosure information on other companies mentioned in this report, please visit the website at www.credit-suisse.com/researchdisclosures or call +1 (877) 291-2683. Disclaimers continue on next page.
03 May 2012Asia Pacific/Singapore
Equity Research
OSIM - Shaping up (Final).doc
This report is not directed to, or intended for distribution to or use by, any person or entity who is a citizen or resident of or located in any locality, state, country or other jurisdiction where such distribution, publication, availability or use would be contrary to law or regulation or which would subject Credit Suisse AG, the Swiss bank, or its subsidiaries or its affiliates (“CS”) to any registration or licensing requirement within such jurisdiction. All material presented in this report, unless specifically indicated otherwise, is under copyright to CS. None of the material, nor its content, nor any copy of it, may be altered in any way, transmitted to, copied or distributed to any other party, without the prior express written permission of CS. All trademarks, service marks and logos used in this report are trademarks or service marks or registered trademarks or service marks of CS or its affiliates. The information, tools and material presented in this report are provided to you for information purposes only and are not to be used or considered as an offer or the solicitation of an offer to sell or to buy or subscribe for securities or other financial instruments. CS may not have taken any steps to ensure that the securities referred to in this report are suitable for any particular investor. CS will not treat recipients as its customers by virtue of their receiving the report. The investments or services contained or referred to in this report may not be suitable for you and it is recommended that you consult an independent investment advisor if you are in doubt about such investments or investment services. Nothing in this report constitutes investment, legal, accounting or tax advice or a representation that any investment or strategy is suitable or appropriate to your individual circumstances or otherwise constitutes a personal recommendation to you. CS does not offer advice on the tax consequences of investment and you are advised to contact an independent tax adviser. Please note in particular that the bases and levels of taxation may change. CS believes the information and opinions in the Disclosure Appendix of this report are accurate and complete. Information and opinions presented in the other sections of the report were obtained or derived from sources CS believes are reliable, but CS makes no representations as to their accuracy or completeness. Additional information is available upon request. CS accepts no liability for loss arising from the use of the material presented in this report, except that this exclusion of liability does not apply to the extent that liability arises under specific statutes or regulations applicable to CS. This report is not to be relied upon in substitution for the exercise of independent judgment. CS may have issued, and may in the future issue, a trading call regarding this security. Trading calls are short term trading opportunities based on market events and catalysts, while stock ratings reflect investment recommendations based on expected total return over a 12-month period as defined in the disclosure section. Because trading calls and stock ratings reflect different assumptions and analytical methods, trading calls may differ directionally from the stock rating. In addition, CS may have issued, and may in the future issue, other reports that are inconsistent with, and reach different conclusions from, the information presented in this report. Those reports reflect the different assumptions, views and analytical methods of the analysts who prepared them and CS is under no obligation to ensure that such other reports are brought to the attention of any recipient of this report. CS is involved in many businesses that relate to companies mentioned in this report. These businesses include specialized trading, risk arbitrage, market making, and other proprietary trading. Past performance should not be taken as an indication or guarantee of future performance, and no representation or warranty, express or implied, is made regarding future performance. Information, opinions and estimates contained in this report reflect a judgement at its original date of publication by CS and are subject to change without notice. The price, value of and income from any of the securities or financial instruments mentioned in this report can fall as well as rise. The value of securities and financial instruments is subject to exchange rate fluctuation that may have a positive or adverse effect on the price or income of such securities or financial instruments. Investors in securities such as ADR’s, the values of which are influenced by currency volatility, effectively assume this risk. Structured securities are complex instruments, typically involve a high degree of risk and are intended for sale only to sophisticated investors who are capable of understanding and assuming the risks involved. The market value of any structured security may be affected by changes in economic, financial and political factors (including, but not limited to, spot and forward interest and exchange rates), time to maturity, market conditions and volatility, and the credit quality of any issuer or reference issuer. Any investor interested in purchasing a structured product should conduct their own investigation and analysis of the product and consult with their own professional advisers as to the risks involved in making such a purchase. Some investments discussed in this report have a high level of volatility. High volatility investments may experience sudden and large falls in their value causing losses when that investment is realised. Those losses may equal your original investment. Indeed, in the case of some investments the potential losses may exceed the amount of initial investment, in such circumstances you may be required to pay more money to support those losses. Income yields from investments may fluctuate and, in consequence, initial capital paid to make the investment may be used as part of that income yield. Some investments may not be readily realisable and it may be difficult to sell or realise those investments, similarly it may prove difficult for you to obtain reliable information about the value, or risks, to which such an investment is exposed. This report may provide the addresses of, or contain hyperlinks to, websites. Except to the extent to which the report refers to website material of CS, CS has not reviewed the linked site and takes no responsibility for the content contained therein. Such address or hyperlink (including addresses or hyperlinks to CS’s own website material) is provided solely for your convenience and information and the content of the linked site does not in any way form part of this document. Accessing such website or following such link through this report or CS’s website shall be at your own risk. This report is issued and distributed in Europe (except Switzerland) by Credit Suisse Securities (Europe) Limited, One Cabot Square, London E14 4QJ, England, which is regulated in the United Kingdom by The Financial Services Authority (“FSA”). This report is being distributed in Germany by Credit Suisse Securities (Europe) Limited Niederlassung Frankfurt am Main regulated by the Bundesanstalt fuer Finanzdienstleistungsaufsicht ("BaFin"). This report is being distributed in the United States by Credit Suisse Securities (USA) LLC ; in Switzerland by Credit Suisse AG; in Canada by Credit Suisse Securities (Canada), Inc.; in Brazil by Banco de Investimentos Credit Suisse (Brasil) S.A. or its affiliates; in Mexico by Banco Credit Suisse (México), S.A. (transactions related to the securities mentioned in this report will only be effected in compliance with applicable regulation); in Japan by Credit Suisse Securities (Japan) Limited, Financial Instrument Firm, Director-General of Kanto Local Finance Bureau (Kinsho) No. 66, a member of Japan Securities Dealers Association, The Financial Futures Association of Japan, Japan Securities Investment Advisers Association, Type II Financial Instruments Firms Association; elsewhere in Asia/Pacific by whichever of the following is the appropriately authorised entity in the relevant jurisdiction: Credit Suisse (Hong Kong) Limited, Credit Suisse Equities (Australia) Limited , Credit Suisse Securities (Thailand) Limited, Credit Suisse Securities (Malaysia) Sdn Bhd, Credit Suisse AG, Singapore Branch, Credit Suisse Securities (India) Private Limited regulated by the Securities and Exchange Board of India (registration Nos. INB230970637; INF230970637; INB010970631; INF010970631), having registered address at 9th Floor, Ceejay House,Dr.A.B. Road, Worli, Mumbai - 18, India, T- +91-22 6777 3777, Credit Suisse Securities (Europe) Limited, Seoul Branch, Credit Suisse AG, Taipei Securities Branch, PT Credit Suisse Securities Indonesia, Credit Suisse Securities (Philippines ) Inc., and elsewhere in the world by the relevant authorised affiliate of the above. Research on Taiwanese securities produced by Credit Suisse AG, Taipei Securities Branch has been prepared by a registered Senior Business Person. Research provided to residents of Malaysia is authorised by the Head of Research for Credit Suisse Securities (Malaysia) Sdn. Bhd., to whom they should direct any queries on +603 2723 2020. In jurisdictions where CS is not already registered or licensed to trade in securities, transactions will only be effected in accordance with applicable securities legislation, which will vary from jurisdiction to jurisdiction and may require that the trade be made in accordance with applicable exemptions from registration or licensing requirements. Non-U.S. customers wishing to effect a transaction should contact a CS entity in their local jurisdiction unless governing law permits otherwise. U.S. customers wishing to effect a transaction should do so only by contacting a representative at Credit Suisse Securities (USA) LLC in the U.S. Please note that this report was originally prepared and issued by CS for distribution to their market professional and institutional investor customers. Recipients who are not market professional or institutional investor customers of CS should seek the advice of their independent financial advisor prior to taking any investment decision based on this report or for any necessary explanation of its contents. This research may relate to investments or services of a person outside of the UK or to other matters which are not regulated by the FSA or in respect of which the protections of the FSA for private customers and/or the UK compensation scheme may not be available, and further details as to where this may be the case are available upon request in respect of this report. Any Nielsen Media Research material contained in this report represents Nielsen Media Research's estimates and does not represent facts. NMR has neither reviewed nor approved this report and/or any of the statements made herein. If this report is being distributed by a financial institution other than Credit Suisse AG, or its affiliates, that financial institution is solely responsible for distribution. Clients of that institution should contact that institution to effect a transaction in the securities mentioned in this report or require further information. This report does not constitute investment advice by Credit Suisse to the clients of the distributing financial institution, and neither Credit Suisse AG, its affiliates, and their respective officers, directors and employees accept any liability whatsoever for any direct or consequential loss arising from their use of this report or its content. Copyright 2012 CREDIT SUISSE AG and/or its affiliates. All rights reserved.