31
Jeff Booth, OSPI Financial Analyst Supervisor OSPI Child Nutrition Services Financial Management – Report 1800

Jeff Booth, OSPI Financial Analyst Supervisor
OSPI Child Nutrition Services
Financial Management – Report 1800

Financial Analysis of Food Service Operations
•Report 1800 •Food Service Fund Balance Report
Financial Management Tools

Achieve and maintain break-even point for Food Services Department
(including indirect costs)
Financial Benchmarking Goal

Annual Analysis of Public School Food Service Operations
What is the Report 1800?

USDA Requirement 7 CFR 210.19(a)(2) •File Financial Report with State Annually •No More Than 3 months Operating Funds
Why care about the Report 1800?
Opportunity to evaluate your food service operation
Opportunity to work with Food Service Department
Why care about the Report 1800?

Where do I find the Report 1800?
Yearly Bulletin or Memo

Where do I find the Report 1800? OSPI Child Nutrition
Web page

Where do the numbers come from?
The financial data comes from each school districts’ annual financial report, F-196
• Food Services (Program 98) • Unrestricted Indirect Rates
Meal data comes from the Child Nutrition Database • Total Meals Served
• October Building Data
Form 1505 for districts with Food Service Management Companies or inter-district agreements
Where does data for the Report 1800 come from?

The Report 1800 series provides the following reports:
• 1800 A Revenues and Expenditures (in whole dollars) • 1800 B Expenditures as a Percent of Revenue • 1800 C Expenditures as a Percent of Revenue* • 1800 D Expenditures and Revenues per Equivalent Lunch • 1800 E Expenditures and Revenues per Equivalent Lunch * • 1800 F Percentage of Food And Labor Costs to Total Revenues * • 1800 G Breakfast Participation • 1800 H Lunch Participation • 1800 I Percentage of Student Participation Breakfast and Lunch Programs • 1800 J Percentage of Student Participation in Breakfast Programs* • 1800 K Percentage of Student Participation in Lunch Programs*
*ranked
Report 1800 series

Meal Codes B: Breakfast
L: Lunch S: Snack
C: Food Service Management Company
Report 1800 A Revenues and Expenditures
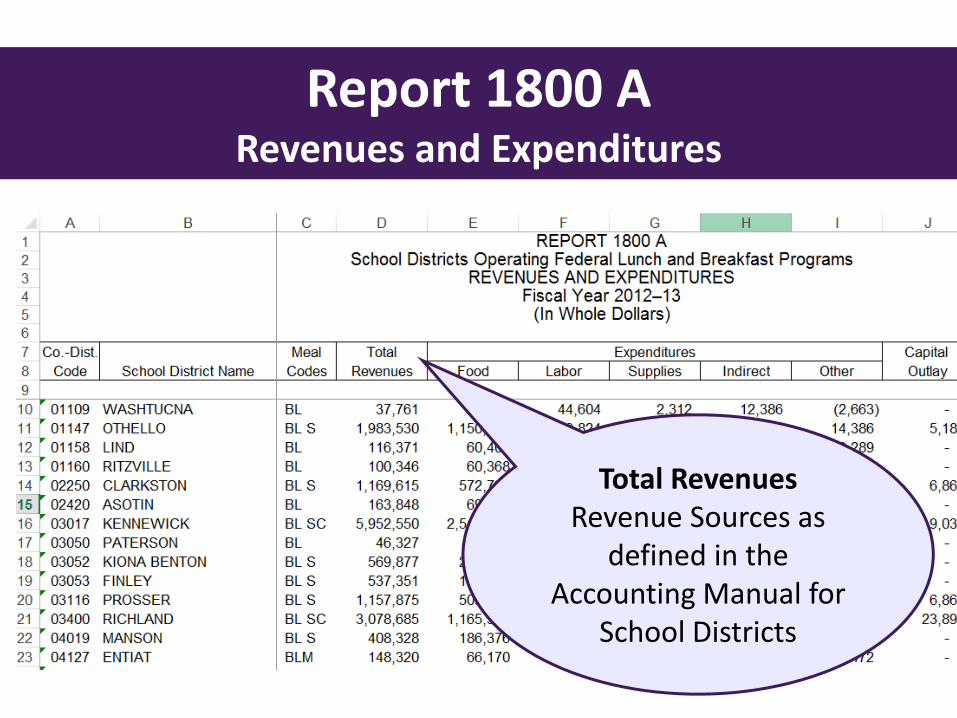
Report 1800 A Revenues and Expenditures
Total Revenues Revenue Sources as
defined in the Accounting Manual for
School Districts
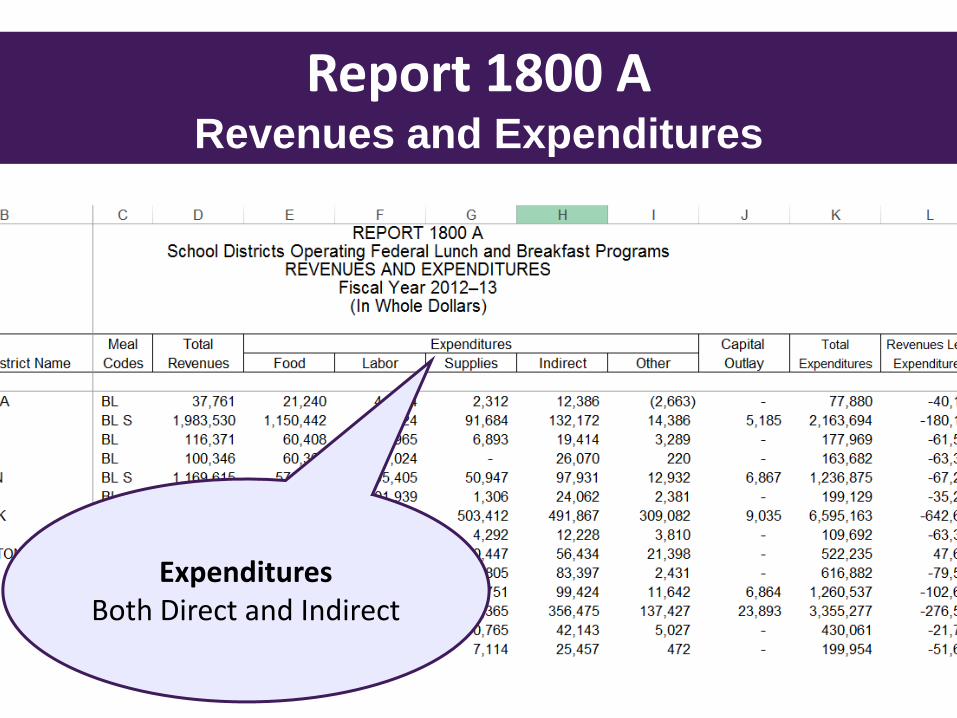
Report 1800 A Revenues and Expenditures
Expenditures Both Direct and Indirect
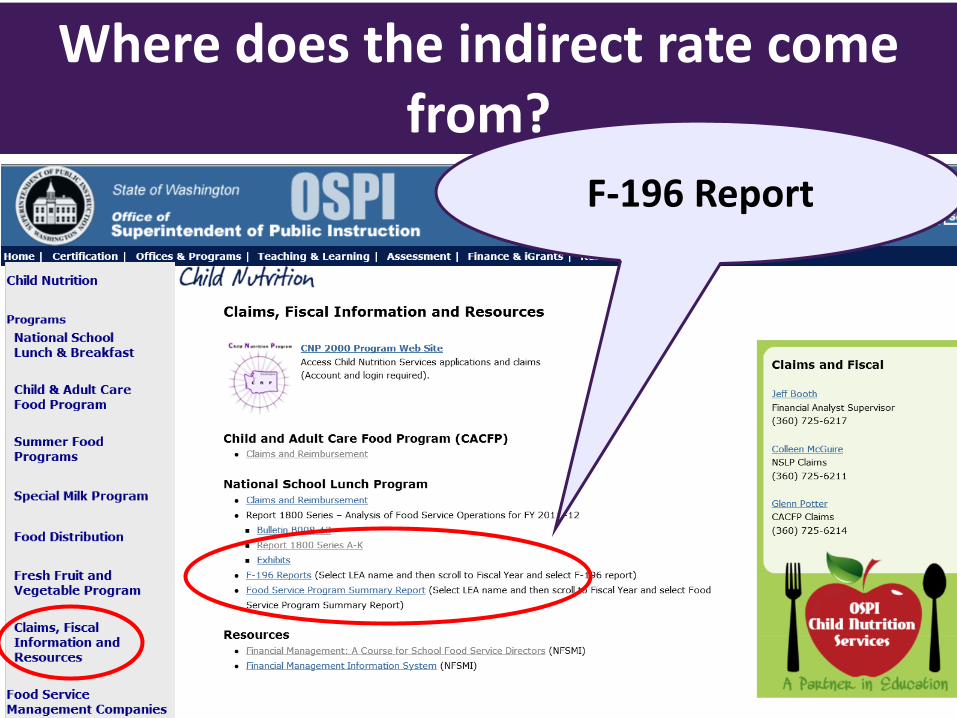
Where does the indirect rate come from?
F-196 Report
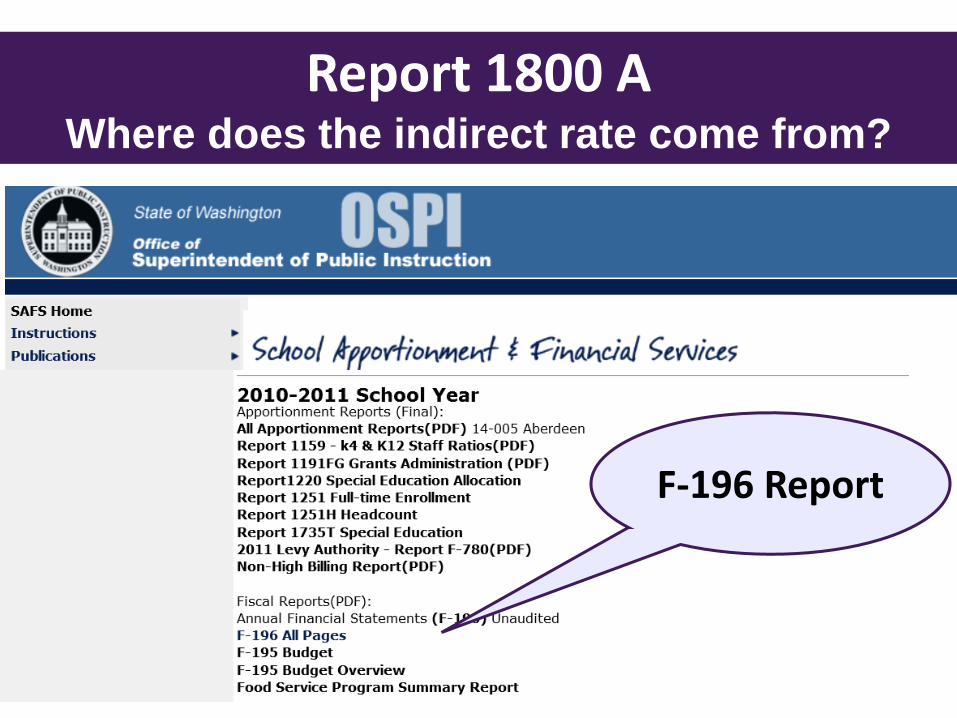
Report 1800 A Where does the indirect rate come from?
F-196 Report

Report 1800 A Where does the indirect rate come from?

Report 1800 A Revenues and Expenditures
Fiscal Year 2012-13 • Total Revenues - $359,155,886
• Total Expenditures - $386,291,869 • Net Loss - $27,135,983
Report 1800 A Revenues and Expenditures
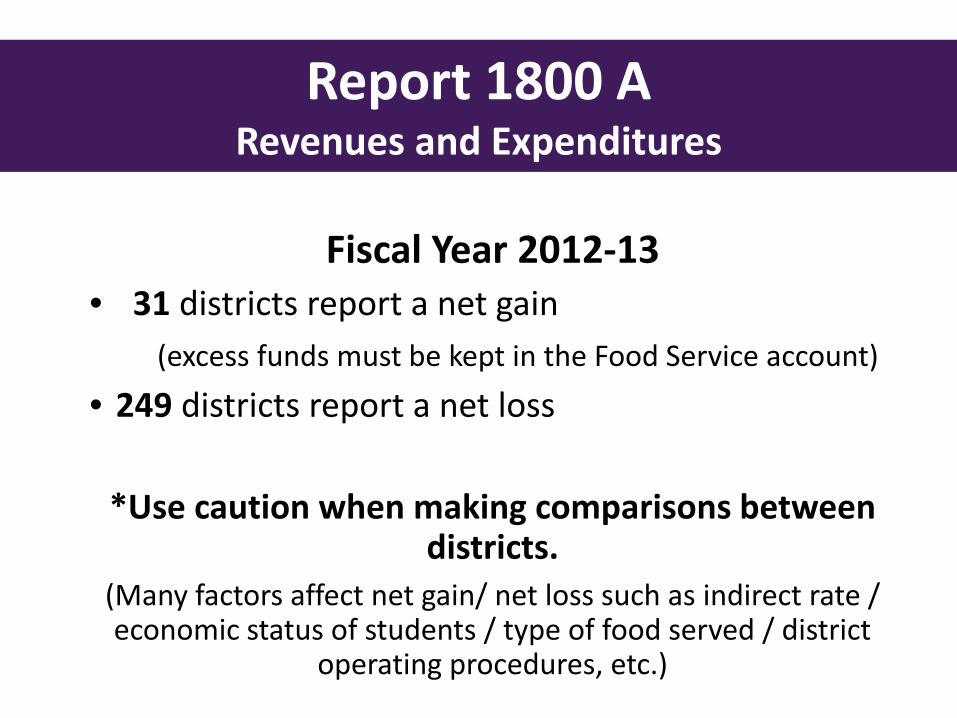
Fiscal Year 2012-13 • 31 districts report a net gain (excess funds must be kept in the Food Service account)
• 249 districts report a net loss
*Use caution when making comparisons between districts.
(Many factors affect net gain/ net loss such as indirect rate / economic status of students / type of food served / district
operating procedures, etc.)
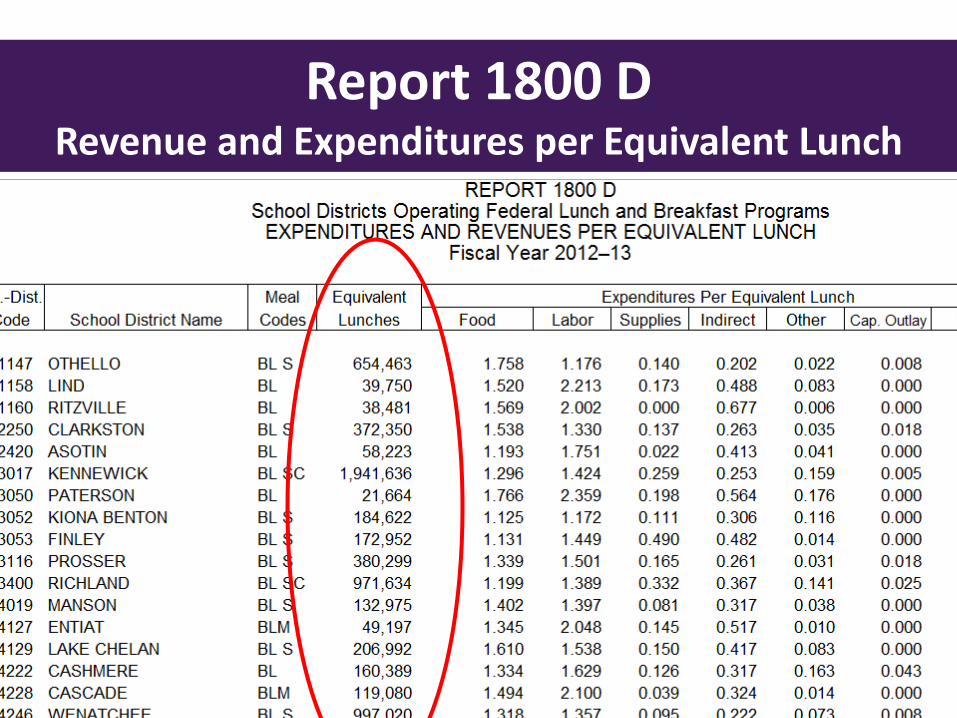
Report 1800 D Report 1800 D Revenue and Expenditures per Equivalent Lunch
Report 1800 D Revenue and Expenditures per Equivalent Lunch
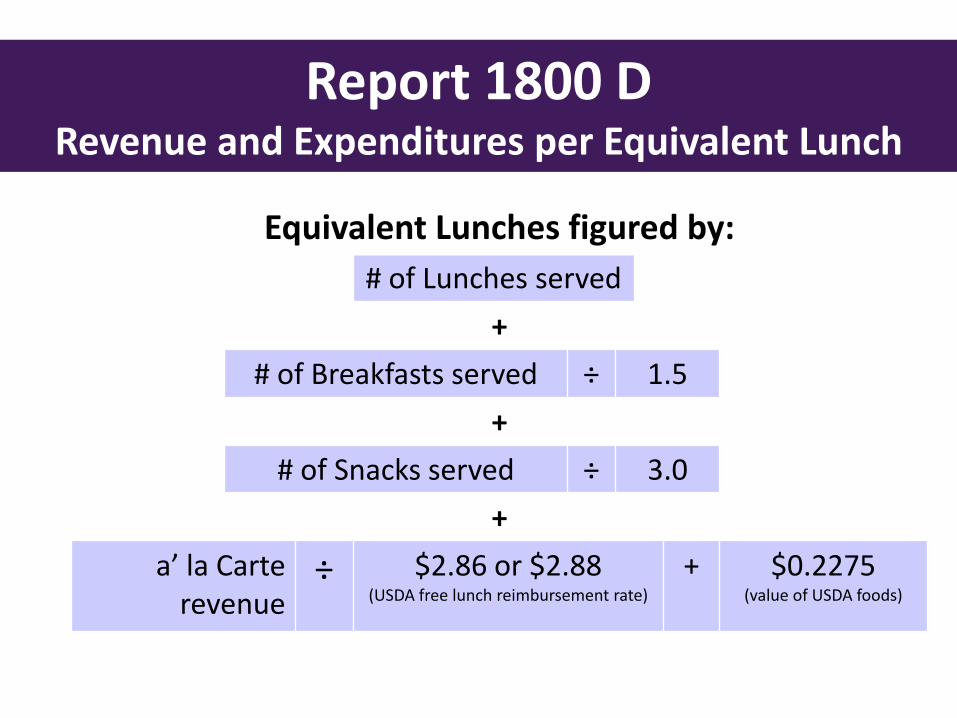
Equivalent Lunches figured by: # of Lunches served
+ # of Breakfasts served ÷ 1.5
+ # of Snacks served ÷ 3.0
+ a’ la Carte
revenue ÷
$2.86 or $2.88 (USDA free lunch reimbursement rate)
+ $0.2275 (value of USDA foods)

Report 1800 D Report 1800 D Revenue and Expenditures per Equivalent Lunch

Report 1800 F Percentage of Food and Labor Costs to Total
Revenues
Benchmark 80% – 85%

Food Service Fund Balance Reporting
USDA Requirement 7 CFR 210.19(a)(2)
•“Excess” program income must be used for the non-profit food service program
•No More Than 3 months Operating Funds
•Carryover of food service losses is allowed

Food Service Fund Balance Reporting
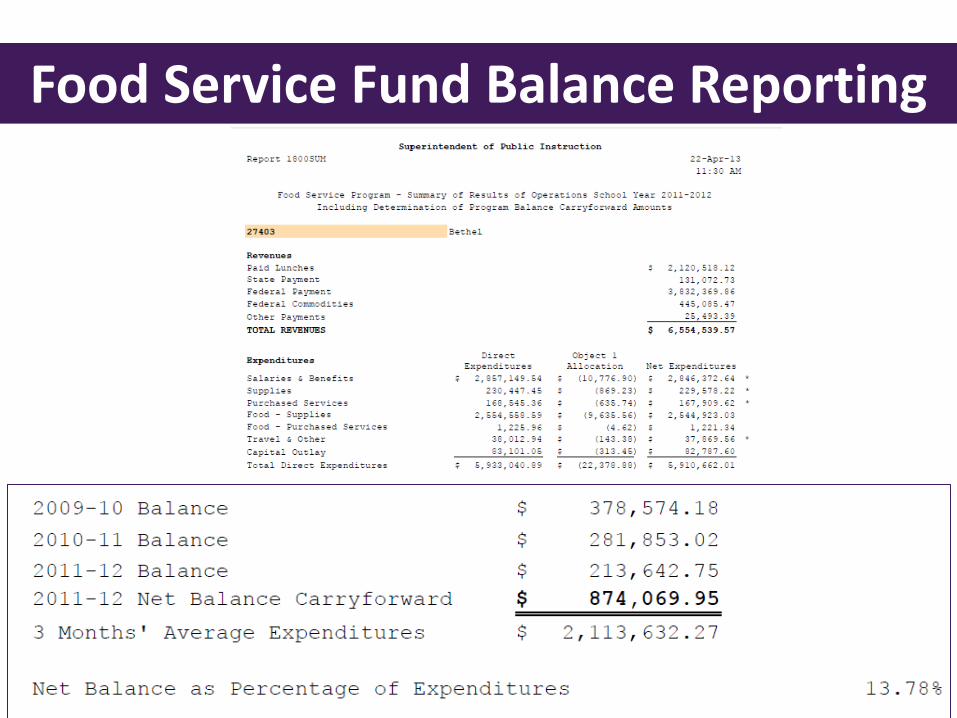
Food Service Program Summary
Report

Food Service Fund Balance Reporting

Food Service Fund Balance Reporting
Food Service Fund Balance Reporting
Food Service Fund Balance Reporting
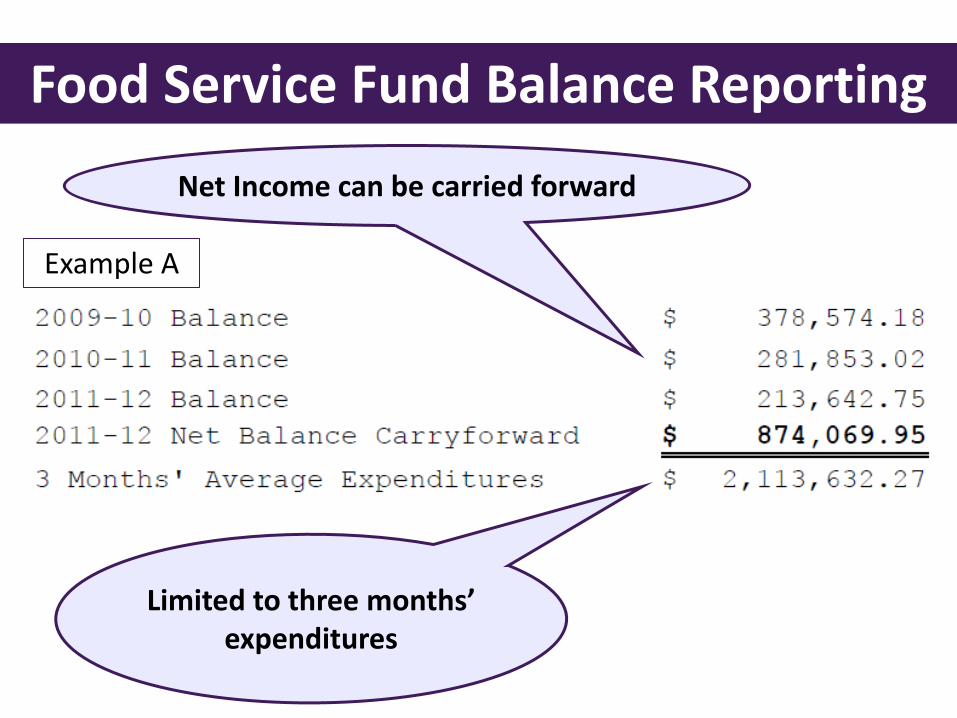
Limited to three months’ expenditures
Net Income can be carried forward
Example A
Food Service Fund Balance Reporting
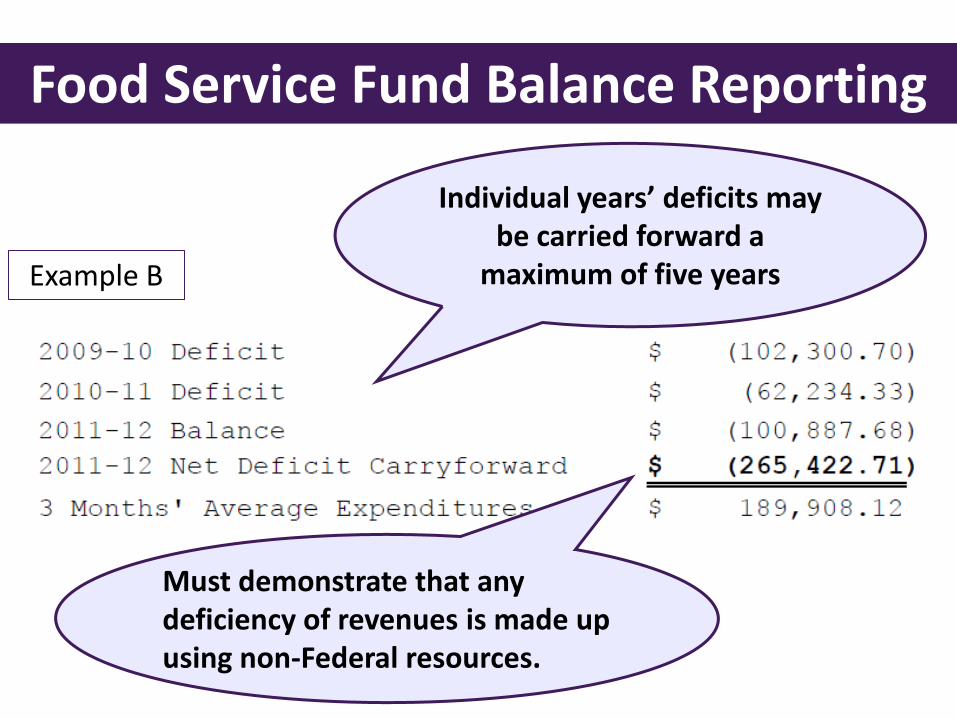
Example B
Individual years’ deficits may be carried forward a
maximum of five years
Must demonstrate that any deficiency of revenues is made up using non-Federal resources.

Food Service Fund Balance Reporting
Offsetting Net Income/Net Deficits
Example C
Jeff Booth (Report 1800) [email protected] 360-725-6217 Paul Stone (Fund Balance Reporting/Accounting) [email protected] 360-725-6303
Questions?


