136
Osprey Acquisitions Limited Annual report and consolidated financial statements for the year ended 31 March 2019 Company number: 05915896

Osprey Acquisitions Limited
Annual report and consolidated financial statements for the year ended 31 March 2019
Company number: 05915896

Osprey Acquisitions Limited
Directors’ report for the year ended 31 March 2019
2
The Directors present their report and the audited consolidated financial statements of Osprey Acquisitions
Limited (the ‘company’) for the year ended 31 March 2019.
Principal activities, business review and future developments
The principal activities of the company and its subsidiaries (together ‘the group’) during the year were water
supply, treatment and distribution; sewage collection and treatment; and retail services to water and water
recycling customers. No changes are envisaged to the group’s principal activities. The group’s principal
business is Anglian Water Services Limited (‘Anglian Water’). The information that fulfils the requirement of
the Strategic Report, including the company’s financial risk management objectives and the disclosure
requirements regarding greenhouse gas emissions, is set out on pages 7 to 50.
Group results and returns to shareholders
The income statement on page 51 shows the group’s results for the year. Dividends of £40.8 million (2018:
£95.0 million) were paid during the year.
Directors
The Directors who held office during the year and to the date of this report, unless otherwise stated, are set
out below.
Stephen Billingham CBE
Scott Longhurst
Peter Simpson
Projesh Banerjea appointed 22 June 2018
John Barry
James Bryce
Cressida Hogg CBE resigned 23 May 2018
Mamoun Jamai appointed 22 June 2018
Manoj Mehta
Niall Mills
Robert Napier
Alexandros Nassuphis resigned 22 June 2018 and was reappointed on 18 July 2018
Batiste Ogier resigned 18 July 2018
Duncan Symonds
Claire Russell continued to serve as Company Secretary throughout the year.
Directors' indemnities
During the 2018/19 financial year and up until the date of the signing of the financial statements, the group
has maintained directors' and officers' liability insurance, which gives appropriate cover for legal action
brought against its Directors. The group has also provided an indemnity for its Directors, which is a
qualifying third-party indemnity provision for the purpose of section 234 ((2) – (6)) of the Companies Act
2006.
Shareholders
The sole shareholder of the company is Osprey Holdco Limited.

Osprey Acquisitions Limited
Directors’ report (continued) for the year ended 31 March 2019
3
Charitable donations
The group continues to provide support to WaterAid, our nominated charity (which transforms lives by
improving access to clean water, decent toilets and good hygiene in the world’s poorest communities), and
does not offer charitable donations or sponsorships to other charities. During the year, the group donated
£40,000 to WaterAid and actively encouraged the participation of its employees in various fundraising
activities through a number of initiatives, including quizzes, cake bakes and the ongoing monthly WaterAid
lottery. Volunteering for WaterAid is a key part of Anglian Water’s Love to Help employee volunteering
programme, which allows employees to take time out of the office in support of various good causes.
With the support of the group, employee volunteers, partners and suppliers across the business, our
WaterAid Volunteers’ Committee successfully fundraised an additional £1,060,927 for WaterAid (2018:
£902,050), the highest amount ever raised by the business.
Political donations
No political donations were made during the year (2018: £nil).
Research and development
The group has a continuing policy of undertaking market-focused research and development on process
plant, biosolids treatment, sewers and water supply networks, and other water and water recycling related
matters.
Financial instruments disclosures
Details are included on page 34 of the Strategic Report and in note 23 of the financial statements.
Customers
The group actively seeks to engage with present and future customers across its region. Future customers
are engaged through school outreach programmes and hosting students at our education centres. A number
of elements of our PR19 customer engagement programme have reached children and young people.
H2OMG was a week-long festival with a fairground theme, based in The Forum, Norwich, which attracted
over 33,000 people in August 2017. The purpose of the event was to gain customers’ views on how we
should deal with the future challenges we face to balancing supply and demand. Also which options we
should pursue, for example, metering, leakage and developing new water resources. The insight gained
directly influenced the development of Anglian Water’s Water Resources Management Plan.
An extensive programme of customer engagement has been developed for this Asset Management Plan
(AMP), with the aim of generating an ongoing dialogue regarding customer priorities and making the best
use of insight from existing contact channels. The programme has been developed in line with the Anglian
Water’s ambition to put customers at the heart of its activities, as well as being updated in response to
Ofwat’s guidance for PR19.
Anglian Water’s business plan for 2015–2020 was informed by the results of its biggest ever, region-wide
consultation on the future of water and water recycling services, and was a step change from the
engagement activity for the previous plan. The customer engagement activity for PR19 is another significant
step forward, to keep pace with technological advances and changing customer expectations. A diverse
range of innovative and traditional techniques have been used to engage with customers and to analyse
results according to customer circumstances, behaviours and attitudes.
As part of business planning activity, Anglian Water established an online community which consists of 500
customers across the East of England. The online community is used to explore customer views on a wide
range of topics. This can involve asking for responses to open ended questions or simply asking people if
they support a specific proposal (or not).
Osprey Acquisitions Limited
Directors’ report (continued) for the year ended 31 March 2019
4
Since 2011, Anglian Water’s independent Customer Engagement Forum (CEF) has been in place to advise
and challenge Anglian Water on how it engages with customers and how customer views are reflected in its
plans. From the start of this AMP, the CEF has also monitored current performance and challenged areas
where Anglian Water has not met targets, or has significantly exceeded them. In particular, it has focused
on Anglian Water’s suite of Outcome Delivery Incentives (ODIs).
The CEF has members from a wide range of backgrounds to represent the interests of household and
business customers, communities, the environment and the economy. Anglian Water has also formed a
Customer Board from a representative selection of members from the online community to provide further
guidance and directly feed in customers’ views, running alongside the CEF and the Anglian Water Services
Management Board. Excellent customer service is a high priority and Anglian Water recognises employees
who provide such service. The Management Board is actively involved in the development of Anglian Water’s
customer service offering, while the Management Board monitors the results of the quarterly Service
Incentive Mechanism (SIM) survey conducted by Ofwat (itself an ODI) and uses Management Board
meetings to discuss performance that has resulted in the SIM score at each quarter.
Employees
Employees are kept informed of changes in the business and general financial and economic factors
influencing the group. This is achieved through a systematic approach to employee communication, which
includes regular briefings, presentations and electronic mailings. The group produces a regular employee
newspaper Anglian Water News, which is sent to employees at home. Phonecasts from senior managers and
the intranet are also widely used as sources of information.
The group values the views of its employees and consults with them and their representatives on a regular
basis about matters that may affect them.
The group recognises three trade unions, with whom management meets regularly for collective bargaining
and consultation purposes. The company has an active network of health and safety committees at which
senior managers meet with trade union representatives to consult on matters affecting health and safety at
work. The group also operates a further elected employee forum Open House, where senior managers and
front-line employees meet regularly to discuss the challenges facing the business and consider suggestions
for change.
The group has a series of policies that both inform and guide all employees on the group’s approach to a
range of ethical issues. Procedures are in place to deal with allegations of misconduct, harassment, bullying
and other inappropriate behaviour. The group also has a whistleblowing policy as well as a series of family-
friendly policies, including such initiatives as flexible working hours, home working, sabbaticals and career
breaks.
Employees can participate in the AWG Loyalty Savings Scheme, which has been offered every year since
2007 and enables employees to potentially benefit from future financial performance.
The group recognises and values the diversity of its people whose backgrounds, experience and identities
broaden and enhance the capability and success of its teams. The group is committed to reflecting the
diversity of its customers in its workforce and with its supply chain partners to bring positive change in this
area, and this inclusion-based approach recognises that individuals who work for the group, or who want to
work for the group will be valued, treated fairly and respected for their individuality.
All job applications are welcomed and selection is based on applicants' relevant skills, experience and
competence for the role. In the event of a candidate or employee having a disability or health condition that
affects the way they might work, we will make every effort to find suitable and appropriate adjustments. Our
aim will always be to enable people to work as effectively as possible and in ways that suit individual needs.
Career development and promotion opportunities for disabled people are identical to those of other
employees.
Osprey Acquisitions Limited
Directors’ report (continued) for the year ended 31 March 2019
5
Events occurring after the reporting period
Details of events occurring after the reporting period are included in note 35 of the financial statements.
Statement of Directors’ responsibilities
The Directors are responsible for preparing the Annual Report and consolidated financial statements in
accordance with applicable law and regulations.
Company law requires the Directors to prepare financial statements for each financial year. Under that law,
the Directors have elected to prepare the group and parent company financial statements in accordance with
International Financial Reporting Standards (IFRSs) as adopted by the European Union and applicable law.
Under company law, the Directors must not approve the financial statements unless they are satisfied that
they give a true and fair view of the state of affairs of the group and the company and of the profit or loss of
the group for that period. In preparing these financial statements, the Directors are required to:
• properly select and apply accounting policies;
• present information, including accounting policies, in a manner that provides relevant, reliable,
comparable and understandable information;
• provide additional disclosures when compliance with the specific requirements in IFRSs are insufficient to
enable users to understand the impact of particular transactions, other events and conditions on the
entity's financial position and financial performance; and
• make an assessment of the company's ability to continue as a going concern.
The Directors are responsible for keeping adequate accounting records that are sufficient to show and
explain the company’s transactions and disclose with reasonable accuracy at any time the financial position
of the group and the company and enable them to ensure that the financial statements comply with the
Companies Act 2006 and, as regards the group financial statements, Article 4 of the IAS Regulation. They
are also responsible for safeguarding the assets of the group and the company and hence for taking
reasonable steps for the prevention and detection of fraud and other irregularities.
The Directors are responsible for the maintenance and integrity of the group’s website. Legislation in the
United Kingdom governing the preparation and dissemination of financial statements may differ from
legislation in other jurisdictions.
Each of the Directors, whose names and functions are listed in the Directors section on page 2 confirm that,
to the best of their knowledge:
• the financial statements, which have been prepared in accordance with IFRSs as adopted by the
European Union, give a true and fair view of the assets, liabilities, financial position and profit or loss of
the group and the company; and
• the Directors’ Report and Strategic Report contained in the Annual Report include a fair review of the
development and performance of the business and the position of the group and the company, together
with a description of the principal risks and uncertainties that it faces.
The Directors consider that the Annual Report and consolidated financial statements, taken as a whole, is
fair, balanced and understandable and provides the information necessary for shareholders to assess the
group and company’s performance, business model and strategy.


Osprey Acquisitions Limited
Strategic report for the year ended 31 March 2019
7
Group overview
Osprey Acquisitions Limited’s principal business is Anglian Water Services Limited (‘Anglian Water’), the
group’s regulated water and sewerage company, which supplies water and water recycling services to more
than six million customers in the east of England and Hartlepool.
During the year we implemented a series of financial and corporate initiatives to improve transparency, trust
and customer confidence. This included removing our Cayman Islands company from the corporate
structure. Although the Cayman Islands company was UK tax resident and never benefited from any tax
advantage, removing it improved the transparency and clarity of our financial structures.
We also changed the composition of the Anglian Water Services Board in the period, ensuring that
Independent Non-Executive Directors comprised the majority, and not just the largest group. In addition,
dividends are being reduced through to 2025, resulting in a significant reduction in the company’s level of
debt and gearing. We already hold ourselves to the highest standards of accountability and transparency,
but we acknowledge the challenges from our economic regulator, Ofwat and the government and together
with our shareholders we were happy to make these changes to help strengthen public trust and confidence
in the sector.
The key performance indicators of the group’s principal businesses is discussed in the Anglian Water section
below. In addition, compliance with the group’s borrowing covenants is an additional key performance
indicator for the group and is discussed on page 34.
Group financial performance
2019 2018
(Restated) (1)
£m £m
Revenue 1,358.4 1,322.7
Operating profit 375.9 384.2
Underlying profit before tax (2) 40.3 22.9
(Loss)/profit before tax (58.3) 146.6
Cash generated from operations 681.9 674.1
(1) The comparatives have been restated to reflect the impact IFRS 15 ‘Revenue from Contracts with Customers’, which
came into effect on 1 April 2018, had on the accounting for grants and contributions. Grants and contributions are
now recognised immediately as revenue rather than being deferred and released to ‘other operating income’ over the
expected useful life of the related assets. This has the effect of increasing revenue in the year to 31 March 2018 by
£63.1 million, and reducing other operating income by £16.1 million to £nil, compared with the previous year’s
published report.
(2) Excludes the fair value losses on derivative financial instruments of £98.4 million (2018: gains of £119.1 million) and
for 2018 the exceptional profit of £4.6 million in 2018 on disposal of Anglian Water’s non-household water and water
recycling retail business to Anglian Water Business (National), a fellow subsidiary of the group’s ultimate parent
undertaking.
On 1 April 2017, Anglian Water sold its non-household water and water recycling retail business to Anglian
Water Business (National) Limited, a fellow subsidiary of the group’s ultimate parent undertaking, resulting
in an exceptional profit of £4.6 million.
Revenue for the year was £1,358.4 million, an increase of £35.7 million from £1,322.7 million in 2018.
Anglian Water’s revenue increased by 3.3% (£42.7 million), reflecting the regulatory tariff increase,
increases in household consumption due to the hot, dry summer and growth in customer numbers. The
increase in demand experienced over the summer months was, as expected, not sustained for the
remainder of the year.

Osprey Acquisitions Limited
Strategic report (continued) for the year ended 31 March 2019
8
Operating profit was £375.9 million, a decrease of £8.3 million from the £384.2 million profit in 2018,
primarily due to a reduction of £6.4 million in Anglian Water’s operating profit where higher operating costs
and depreciation more than offset the effect of the net regulatory price increase and the increase in grants
and contributions income.
Net finance costs for the period, excluding fair value gains/losses on derivative financial instruments,
decreased by £26.0 million to £335.6 million (2018: £361.3 million). This was primarily the result of the
non-cash impact of lower inflation on index-linked debt where the year on year average Retail Price Index
(RPI) fell from 3.7 per cent to 3.2 per cent and the increase in interest capitalised reflecting a higher level of
capital projects in progress.
Resultant underlying profit before tax was £40.3 million (2018: £22.9 million). After fair value (losses)/gains
on derivative financial instruments and the exceptional profit on the transfer of Anglian Water Business
(National) into the Wave joint venture of £4.6 million in 2018, the statutory loss before tax was £58.3
million (2018: profit of £146.6 million).
Taxation
Our underlying effective tax rate is higher than the rate of corporation tax due to restriction on interest
deductibility as a result of new legislation introduced in April 2017. Our low level of cash tax reflects the
fiscal incentives available to all UK companies for sustained high levels of capital investment, the interest we
pay to fund that investment and the availability of surplus ACT (corporation tax paid in advance). We are
one of the largest private investors in infrastructure in our region, investing more than £2 billion over five
years. The Government actively encourages infrastructure investment and grants us capital allowances,
which defer some of our corporation tax liabilities until a later period. Our customers directly benefit from
the deferral as it helps to keep their bills lower.
The total tax credit for the year of £7.7 million (2018: charge of £28.4 million) comprised a current tax
charge of £50.1 million (2018: £34.1 million) and a deferred tax credit of £57.8 million (2018: £5.7 million).
The decrease of £36.1 million in the tax charge is mainly due to the increase in the deferred tax credit due
to the movement in fair value on financial derivatives which changed from a gain of £119.1 million last year
to a loss of £98.4 million this year. This is offset by an increase in the current tax charge because at a group
level the current tax charge equates to the amount of ACT recovered in the year plus the tax paid in Ireland.
Due to the transitional tax adjustment that arises on adoption of IFRS 15 we were able to recover all of the
remaining £43.0 million of ACT.
In addition to the £7.7 million tax credit to the income statement, there is a charge of £1.0 million (2018:
£16.8 million) in the statement of other comprehensive income in relation to tax on actuarial losses (2018:
gains) in the pension schemes and fair value gains on cash flow hedges.
Cash flow
Cash generated from operations by the group was £681.9 million (2018: £674.1 million), an increase of £7.8
million on the prior year. Anglian Water’s operating cash flow was £9.9 million higher than the prior period
at £700.7 million (2018: £690.8 million).
Net cash outflow for capital investment was £470.4 million (2018: £449.8 million), which is net of the
movement in creditors and accruals in the period. The vast majority of capital expenditure relates to the
Anglian Water capital programme where gross regulated capital investment was £440.0 million, broadly in
line with management expectations.
Osprey Acquisitions Limited
Strategic report (continued) for the year ended 31 March 2019
9
Net debt
Net debt increased by £230.3 million to £8,445.6 million in the year to 31 March 2019. During the period
new debt of £450.9 million was raised, of which £297.8 million relates to the Green Bond issuance within
Anglian Water. Debt repaid in the period amounted to £140.0 million.
Pension funding
As previously reported, on 31 March 2018, following a period of consultation with our employee
representatives, employees and pension trustees, the defined benefit pension scheme for Anglian Water
Group and Hartlepool Water was closed to future accruals for existing members.
At 31 March 2019 the net pension deficit for the group was £20.9 million (2018: £6.5 million). The increase
in the deficit reflects a worsening of market conditions in March 2019, asset performance in the year being
below expectations and a reduction in the corporate bond rate used to discount the scheme’s liabilities.
During the year a deficit reduction payment of £12.5 million was made, compared with £10.8 million in the
prior year.
The increase in the deficit also reflects the impact of the minimum funding requirement, £15.6 million, which
(under IFRIC 14) restricts the value of the Morrison Pension & Life Assurance Plan (MPLAP) scheme to
ensure the liability is at least the value of committed payments, £30.7 million.
Dividends
Dividends of £40.8 million (2018: £95.0 million) were paid in the year, reflecting the decision to reduce
gearing within Anglian Water Services over the remainder of AMP6 and into AMP7.
The group’s dividend policy is to identify the cash available for distribution, allowing for the business’
liquidity requirements in respect of funding its operations, the capital programme and servicing its debt for
the next 18 months. The dividend policy is also based on ensuring that there is adequate headroom in
relation to all of its financial covenants. In assessing the dividend payment, the Directors review the
business performance forecasts (currently to the end of the Asset Management Plan period of 31 March
2020) and give consideration to the potential impact of external factors in the economy and regulatory
environment on the group and company’s forecast cash flows. The Directors consider this cash-based
approach provides an acceptable return to the equity investor, while ensuring the liquidity requirements of
the business are met fully.
In October 2018, an equity injection was made down through the group so that Anglian Water received an
equity injection of £22.0 million from the group as part of the planned reduction in gearing.
Osprey Acquisitions Limited
Strategic report (continued) for the year ended 31 March 2019
10
Climate-related disclosures
Anglian Water is one of the biggest energy users in the east of England and operates in a region that is
particularly vulnerable to climate change. This has informed the development of our integrated business and
sustainability strategy, Love Every Drop.
We fully support the Task Force on Climate-related Financial Disclosures (TCFD) and are committed to
ensuring our climate change disclosures align with TCFD recommendations. The maturity of our approach
means that information relating to climate change can be found throughout Anglian Water’s Annual
Integrated Report. For clarity we have summarised our response to the TCFD below and explained where the
reader can go for more detailed information.
The Task Force defines organisations as either financial or non-financial and provides guidance as to the
minimum recommended disclosures for each group. Anglian Water is similar to organisations described in
the non-financial sector. As such, in reporting we have followed both the general guidance and the
supplementary guidance for non-financial groups.
Our full disclosure is available at www.anglianwater.co.uk/climatechange and has been summarised below:
Governance – Our Board has effective oversight of climate-related risks and opportunities. Climate-related
risks are included within the company’s top-tier risk register. This is reviewed regularly in detail by the
Board. Short, medium and long-term targets have been agreed by the Board and members of the Board
chair the groups responsible for reducing carbon emissions and adapting to climate change.
Strategy – In 2016 we committed to become a carbon neutral business by 2050. Our energy and carbon
strategy is reducing transition risk and unlocking financial efficiencies. We have submitted two Adaptation
Reports to the Government and are in the process of drafting our third. Our most significant physical risks
are droughts and flooding. These are being effectively mitigated through collaboration and our long-term
plans, which consider more than one climate change scenario.
Risk management – Climate-related risks are identified and assessed during the preparation of our
Adaptation Reports. Risks are also identified and managed through the preparation of long-term plans and
the delivery of individual investments. The assessment and management of climate-related risks is
consistent with the approach used to manage risk throughout the business.
Metrics and targets – We report Scope 1, 2 and 3 greenhouse gas emissions and have short, medium and
long-term emission reduction targets. Since 2011 our emissions have been measured, managed and
reduced in accordance with ISO 14064. We also have targets to reduce climate-related risks such as drought
and flooding.
Our people: happier, healthier and safer
Our three-year health, safety and wellbeing plan aims to ensure our business has happier, healthier and
safer employees, with five distinct outcomes:
• Healthier and safer work environment.
• Health and safety improved through positive engagement and collaboration.
• High-risk activities managed to reduce significant incidents.
• Hazardous processes understood and controlled.
• Clear and simple safety information.
Our behavioural change programme, LIFE, links health, safety and wellbeing together and is focused on
creating a culture where it is everyone’s responsibility to take care not just of their own wellbeing but also of
their colleagues.
To date over 3,500 of our employees have been through specially designed LIFE workshops. We have also
run a number of health and wellbeing campaigns that have focused on a wide range of areas that can impact
an employee’s wellbeing, including musculoskeletal (MSK) health, mental health and financial health.
Our mission is to make sure that an individual’s wellbeing is at the heart of everything they do. We want to
help everyone become happier, healthier and safer at work and at home.
Osprey Acquisitions Limited
Strategic report (continued) for the year ended 31 March 2019
11
We are taking this holistic approach towards physical, mental, social and financial health to enable our
employees to thrive. This year we have focused on physical health, predominantly MSK, and mental health.
Initiatives have included:
MSK health
• ‘Moving Well Assessments’ for operational staff to assess MSK health and promote wellbeing tools –
targeted specifically at mobility, strength and posture, and desk assessments for office based staff.
• ‘Healthy U’ app – developed by Vitality and Nuffield Health to help employees get healthy, get rewarded
and stay motivated.
Mental health
• Focus on breaking the stigma around mental health, showing support, providing support and self-help
tools, and promotion of the Employee Assistance Programme.
• ‘Mental Health at Work’ training for managers.
• Self-referral for mental health – allowing early access to mental health support/no referral required.
• Financial wellbeing – targeted campaigns with financial specialist Neyber, including 1:1 telephone
consultations, webinars, roadshows.
Diversity and inclusion
A group-wide diversity policy and Diversity Action Plan was agreed in 2014. During the 2017/18 financial
year the group broadened the scope of its ambitions to focus on inclusion as well as diversity and created its
Diversity & Inclusion Strategy. This action plan contains a range of actions and targets around the areas of
inclusion, gender, ethnicity, disability and age. As part of the 2025 People Strategy the group has refreshed
its targets in this area, as detailed below:
• Our employees are as diverse as our customers.
• We understand our race pay gap and are working to reduce it.
• We have no gender pay gap.
• We have more diversity in our leadership groups.
• We have fair reward policies.
• We are good at hiring people who think differently.
• People are accepted for who they are and can contribute to the full.
• The group has reputation for fairness.
In March 2019 a review of the progress against the Diversity & Inclusion Action Plan was undertaken and it
was agreed that the matter would be considered in greater depth May 2019. During the financial year, the
group joined the Energy & Utilities Skills Inclusion Commitment and Principles, maintained its percentage of
female employees at more than 30 per cent, hired more employees from BAME (black, Asian and minority
ethnic) backgrounds and launched the Future Leaders Board. In order to improve diversity and inclusion, the
group continues to take a number of actions, including increasing engagement with schools, sponsoring
LGBT+ events, continuing to use social media and working with the Armed Forces Covenant Employer
Recognition Scheme. The group works hard to achieve a genuine diversity of employees and continues to
focus its efforts accordingly.
At Board level, there has not been a specific female Board member quota set. Further information on gender
diversity can be found on page 17.
The group is similarly committed to appointing the best available person to any role within the group
regardless of gender. Anglian Water employs 99% of the group’s employees and a high-level breakdown of
Anglian Water’s male/female employee split across the business can be found on page 17.
Osprey Acquisitions Limited
Strategic report (continued) for the year ended 31 March 2019
12
An ethical business
We are committed to conducting our business fairly, honestly and openly. We expect all employees,
partners, agents and contractors to adopt a high standard of business ethics.
We have a zero tolerance of bribery and corruption. All Directors and senior managers of Anglian Water are
fully committed to preventing bribery being committed by any employee, person or business that carries out
work or performs services on our behalf (including any subsidiary or associate company within the Anglian
Water Group).
We have policies in place that address the risk of bribery and failure to prevent criminal facilitation of tax
evasion. In addition, we have policies that set out mandatory standards of conduct in relation to the
acceptance of gifts and corporate hospitality as well as political and charitable donations. We also have a
whistleblowing policy in place (see page 4 for further information).
All staff must comply with these policies and with the Bribery Act 2010 at all times. A booklet, entitled
Making the right choices, has been sent to all employees of Anglian Water, setting out the behaviour
expected of them and guidance on making the right choices when faced with decisions that might not be
central to their role. Topics covered include anti-bribery, fraud, modern slavery, protecting personal
information and competition law.
In addition, employees are required to complete online training, including anti-bribery, maintaining a level
playing field (which deals with competition law risk) and data protection law. Our data protection training
has recently been updated in response to the requirements of the General Data Protection Regulation
(GDPR).
The group and company also have a zero tolerance to modern slavery and human trafficking, and have
taken appropriate steps to ensure that it does not take place in our business, or any part of our supply
chain. Details of the procedures that we have put in place can be found in our Slavery and Human
Trafficking Statement, available on the Anglian Water website at www.anglianwater.co.uk/about-
us/governance.
Business review and key risks
The following pages set out a Strategic Report for each of the main reporting segments of the group at 31
March 2019, and the key risks for the group.

Osprey Acquisitions Limited
Strategic report (continued) for the year ended 31 March 2019
ANGLIAN WATER
13
Business overview
Anglian Water Services Limited (‘Anglian Water’) is the largest water and wastewater company in England
and Wales by geographic area.
Anglian Water provides around 1.1 billion litres of drinking water to 4.6 million people every day. The water
comes from a variety of sources: reservoirs, underground reserves (aquifers) and abstraction from rivers.
Anglian Water receives approximately 900 million litres of used water per day from six million people and
businesses, including customers who receive their water from other companies. The used water is treated to
a high standard and returned to the environment via rivers or coastal outlets. The organic waste is treated,
dried and used in agriculture as a natural fertiliser. As well as providing these wholesale services, Anglian
Water provides retail services to household customers within its region.
Our aim, supported by our long-term shareholders, is to enhance and support the communities we operate
in. Every decision we make as a business considers the social and environmental impacts of our activities
and we continuously seek new and innovative ways to improve the prosperity of our region over the longer
term.
What we do
Our raw material is the water we collect from rivers and underground aquifers and store in our reservoirs.
We treat the water and put it into supply.
The water then comes back to us through our sewerage network before we treat and return it to the
environment.
What we have delivered
Reduced leakage by a third since privatisation to reach industry-leading levels, with the water lost per
kilometre of pipe at half the national average.
Reduced average bills by 17% in real terms since 1996 – versus industry average 3% rise.
Kept the amount of water we supply every day at 1989 levels despite supplying an extra 600,000 properties
– the equivalent of saving 170 litres per property.
Increased bills by just 20p for every extra £1 charged by other companies since privatisation. Our bills have
fallen around 10% in the last five years – twice the industry average – in part due to efficiencies we have
shared with customers.
Cut our capital carbon emissions by 58% from 2010 levels and reduced operational carbon emissions by
29% in comparison to the 2015 baseline. This has driven innovation and efficiencies that feed into lower
bills.
How we are addressing opportunities and challenges
We have identified the main factors that affect our business now and in the future.
Common to the whole water industry:
Reaching beyond regulatory compliance and performance targets
We are operating in an environment where complex social, political and environmental challenges are
increasing.
Our customers and stakeholders rightly expect us to deliver an excellent service while also playing a big role
in tackling these wider social and environmental challenges of climate change, growth and resilience.
Company performance reaches far beyond regulatory compliance and meeting targets. We are proud to be a
purpose-led business rooted in long-term sustainable ambitions continually examining our impact on the
communities we serve. This purpose is embedded in everything we do. Anglian Water continues to
demonstrate how a sustainable, purpose-led approach, such as ours, is not only desirable but intrinsically
linked to business performance.
Osprey Acquisitions Limited
Strategic report (continued) for the year ended 31 March 2019
ANGLIAN WATER
14
We have been at the heart of leading this approach across the industry and this year were instrumental in
the creation of the water industry’s Public Interest Commitment, setting new standards for a social contract
with customers and stakeholders. It’s a statement that commits the entire industry to continuing to deliver
wider benefits to society, above and beyond the provision of clean, fresh drinking water.
Affordability and customer expectations
Customer expectations have been transformed in recent years, a change accelerated by social media.
Customers compare our service with that of the top UK brands and they expect us to be as good, if not
better.
They expect us to cope with the challenges listed here, while ensuring that bills remain affordable and that
the costs of increasing our resilience are shared fairly between current and future customers. We will need
to invest in both new supplies and innovative approaches to demand management.
Planning for the long-term
The nature of the water industry requires us to take the long view – planning years, and even decades,
ahead on issues including water resources, the maintenance of assets, advances in technology and closing
the skills gap.
We look to tackle these long-term issues in collaboration with others. That includes delivering our capital
programme through long-term alliances with our contractors and suppliers, and joint research and planning
on issues like drought resilience. Where possible, we look to lead and shape the regional and national
conversation to secure the action and investment needed for a sustainable future.
Especially acute in the east of England:
Climate change, population and housing growth and the need to protect and enhance the natural
environment are all challenges that are particularly acute in our region, where they combine to pose a
unique challenge.
Environmental protection
Our business depends on a healthy environment. The need to protect it, combined with our low rainfall,
means that in many places we will have to take less water from rivers and aquifers to treat and supply. This
could mean a loss of more than 150 Ml/d by 2025.
We are working to ensure that our abstraction from rivers and aquifers is sustainable, investing in river
restoration projects, reducing pollutions through continual investment in our water recycling operation and
protecting raw water quality with our catchment management approach – working in partnership with
agriculture and other land owners.
Climate change
Ours is the driest region in the UK, and particularly vulnerable to climate change - low lying, with a long
coastline and low rainfall. Water resources are already scarce, and climate change could reduce them
further.
Yet at the same time we face the threat of more frequent flooding in this low-lying part of the country due to
more intense rainfall and rising sea levels.
These challenges have been amplified over the last year when we were faced with severe weather during the
‘Beast from the East’, followed by the record-breaking and prolonged hot, dry summer.
We continue to invest in new water resources and to improve the efficiency and connectivity of our network.
We are also investing in flood defences at vulnerable sites, working to reduce our carbon footprint and
increase the amount of renewable energy we generate.
Population and economic growth
We serve three of the five fastest growing cities in the UK and the region’s population could increase by up
to a million in the next 25 years. By 2040, the region's population may grow by a further million people, and
growth is most likely in areas where supplies are most stretched, the environment is under most pressure
and the risk of flooding is greatest. We need to facilitate sustainable growth with timely and efficient delivery
of infrastructure and services.

Osprey Acquisitions Limited
Strategic report (continued) for the year ended 31 March 2019
ANGLIAN WATER
15
These challenges have been amplified over the last year when we were faced with severe weather during the
‘Beast from the East’, followed by the record-breaking and prolonged hot, dry summer.
Our business model - creating value for our communities
We support and promote the wellbeing of communities through our sustainable business model. It is
structured to create long-term value for customers, employees, investors, business partners and the wider
community.
How we take action
Six capital decision making
We are creating a new approach that will ensure we always consider our wider impacts in our decision
making, balancing financial objectives with social and environmental priorities.
Ensuring successful results
What makes us different and helps us to create long-term value is our unique culture, our collaborations,
innovative approach, social focus and robust leadership.
The outcomes we deliver
Our Love Every Drop strategy is guided by the things our customers have told us are important to them.
Our 10 outcomes were developed with customers in 2013 and describe the future we are working towards.
We refreshed them in 2017 to stretch ourselves further and reflect how central our people are to delivering
everything we do.
Smart business:
• Our people: healthier, happier, safer
• Investing for tomorrow
• Fair charges, fair returns
• Resilient business
Smart communities:
• Positive impact on communities
• Safe, clean water
• Delighted customers
Smart environment:
• Supply meet demand
• A flourishing environment
• A smaller footprint
The positive impact we make (our long-term goals)
These are our long-term goals, shaped by what matters most to our customers. For more information see
our Strategic Direction Statement 2020-2045 at https://www.anglianwater.co.uk/about-us/our-strategies-
and-plans/future-challenges/strategic-direction-statement/
• Make the east of England resilient to the risks of drought and flooding.
• Enable sustainable economic and housing growth in the UK’s fastest-growing region.
• Be a carbon neutral business before 2050.
• Work with others to achieve significant improvement in ecological quality across our catchments.
Aligning our goals with the United Nations Sustainable Development Goals (SDGs)
We want to demonstrate how we are contributing to wider societal goals by aligning our activities and the
outcomes we deliver to the UN SDGs. We are working in the spirit of all 17 goals but we have mapped our
work to 10 of the goals where we have the most material impact at the level of the targets. These are
currently being reviewed in line with our next five-year business plan.

Osprey Acquisitions Limited
Strategic report (continued) for the year ended 31 March 2019
ANGLIAN WATER
16
Financing our business
Our corporate structure
When Anglian Water Group was acquired by investors in 2006,
Anglian Water Group Limited became the ultimate parent
company of the group (see note 32 ‘Ultimate parent undertaking
and controlling party’). It is a Jersey registered company, but it is
UK tax resident and, as such, is liable for tax in the UK. Osprey
Holdco Limited has issued debt that is held by our shareholders in
proportion to their respective shareholdings, and they receive an
interest payment on the debt annually. Osprey Acquisitions
Limited has borrowed money from banks and the capital markets
(bonds) for use within the group.
AWG Parent Co Limited, AWG Holdings Limited, AWG (UK)
Holdings Limited and AWG Group Limited are holding companies
that were set up when AWG was a listed group. They are all
100% owned, and currently none of these companies has any
external debt. Three of the companies are UK registered and tax
resident. AWG Holdings Limited is Jersey registered and Irish tax
resident.
Anglian Water Services Holdings Limited was put in place in 2002,
when Anglian Water’s covenanted and ring-fenced debt structure
was established. This group of companies (referred to as the
Anglian Water Services Financing Group, or AWSFG) protects
customers and our bond holders from risk associated with other
non-regulated Anglian Water Group companies outside of the ring
fence. This makes us an attractive investment prospect for bond
holders, which means we are able to keep financing costs lower,
ultimately benefiting our customers in the form of lower bills.
Anglian Water Services UK Parent Co Limited (AWS UK Parent Co)
is a second holding company in the ring-fenced structure, also
providing protection for customers and investors from the risks of
other non-regulated group companies. All companies within the
AWSFG are UK registered and tax resident companies.
Anglian Water Services Limited is the regulated entity that trades
as Anglian Water, managing our water and sewerage network,
serving over six million customers. It is the part of the business
that most people think of as ‘Anglian Water’. Anglian Water
Services Financing Plc is the financing company that raises money
on behalf of Anglian Water Services Limited. We need a Plc
company to raise debt in the UK public bond market. Funds raised
by this company underpin our investment in the region’s water
and water recycling services.
Anglian Water Group Limited
Osprey Holdco Limited
Osprey Acquisitions Limited
AWG Parent Co Limited
AWG Holdings Limited
AWG (UK) Holdings Limited
AWG Group Limited
Anglian Water Services Holdings
Limited (AWSH)
Anglian Water Services UK Parent Co
Limited (AWS UK Parent Co)
Anglian Water Services Limited 1
(AWS)
Anglian Water Services Financing Plc 1
(AWS Finco)
Anglian Water Services Financing
Group (AWSFG)
Direct subsidiary
1 Collectively known as the Anglian Water
Services Group, for which consolidated
financial statements are prepared.
Osprey Acquisitions Limited
Strategic report (continued) for the year ended 31 March 2019
ANGLIAN WATER
17
Our leadership team
The Anglian Water Services Limited Board of Directors consists of:
Two Executive Directors: Peter Simpson and Scott Longhurst.
Six Independent Non-Executive Directors: Stephen Billingham (Chairman of the Board), Natalie Ceeney CBE,
Dame Polly Courtice DBE LVO, John Hirst CBE, Zarin Patel and Paul Whittaker.
Three Non-Executive Directors: James Bryce, Niall Mills and Duncan Symonds.
The Executive Directors also sit on the Anglian Water Management Board. The Management Board oversees
the day-to-day running of the business and develops long-term strategies for approval by the Board of
Directors.
Gender diversity
In 2018 we hired 50% females and 50% males onto our Graduate programme and 48% females and 52%
males onto our paid Internship programme.
In December 2018 we set up a Future Leaders Board made up of a diverse group of individuals from across
the business who will bring new ways of thinking and challenges to our businesses’ decision-making
processes.
Each board committee member will be in post for 18 months, during which time they will consider the
challenges of customer expectation, sustainability, and diversity and inclusion.
Anglian Water’s mean gender pay gap was 6.6% and its median gender pay gap was 11.3%.
This compares with a national mean pay gap of 14.5% and a median figure of 9.7%. This is the average
difference between the pay of men and women working for an organisation. It is not the same as equal pay.
The law says men and women must be paid the same for doing equivalent work. If they are not, then their
employer must justify why not. We pay men and women the same rates for performing the same roles and
roles of equal value.
The primary reason for the gender gap in pay is that, traditionally, the water industry has been a male-
dominated sector and women are under-represented. Many of our employees have been with the company a
long time. This shows we are a good employer with a loyal and knowledgeable workforce.
However, the slow turnover of staff does limit the opportunity for new recruits, including women, to come
into the business and to move into more senior roles. It is something we are looking to address by
continuing to educate and inspire women to consider science, technology, engineering and maths (STEM) as
career options, working to achieve an equal number of men and women across our early careers and trainee
schemes, and by creating a flexible working environment.
The total gender split across Anglian Water is now 31% women and 69% men. At the senior management
level, 37% of our workforce are women, which has increased by 5% from last year, and in all levels of the
organisation, with the exception of Driver and Works Technicians grades, the proportion of women is now
greater than 30%.
We have continued to focus efforts on increasing the number of women in apprenticeship roles to strengthen
our pipeline, by engaging with local schools and colleges, supporting Women in Engineering events and
increasing visibility of women joining the business, through our social media feeds and other publications
and we have continued to promote flexibility across the organisation seeing a further increase in the number
of men taking up part-time working. Of all those working part-time, men now make up 18.5%, compared to
16.3% last year.

Osprey Acquisitions Limited
Strategic report (continued) for the year ended 31 March 2019
ANGLIAN WATER
18
Financial performance
Anglian Water operates on an arm’s length basis from other companies within the group. Its activities are
regulated by the Water Industry Act 1991 (which consolidated that part of the Water Act 1989 relating to
water supply and wastewater) and the conditions of an Instrument of Appointment (the Licence) granted to
Anglian Water by the Secretary of State for the Environment on 1 September 1989.
The financial results of Anglian Water are summarised in the table below:
2019 2018
(Restated)
(1)
£m £m
Revenue 1,354.7 1,312.0
Other operating income 13.6 11.1
Operating costs (630.5) (592.1)
Depreciation and amortisation (348.8) (335.6)
Operating profit 389.0 395.4 Finance income (2) 2.9 1.6
Finance costs (3) (331.4) (344.1)
Underlying profit before tax 60.5 52.9 Profit on disposal of the non-household retail business - 4.6
Finance income - inter-company interest receivable - 191.8
Fair value (losses)/gains on derivative financial instruments (98.4) 117.6
(Loss)/profit before tax (37.9) 366.9
(1) The comparatives have been restated to reflect the impact that IFRS 15 ‘Revenue from Contracts with Customers’,
which came into effect on 1 April 2018, had on the accounting for grants and contributions. Grants and contributions
are now recognised immediately as revenue rather than being deferred and released to ‘other operating income’ over
the expected useful life of the related assets. This has the effect of increasing revenue in the year ended 31 March
2018 by £63.1 million, and reducing other operating income by £16.1 million, compared with the previous year’s
published report. In addition we have reclassified certain income, previously treated as negative expenditure, as other
operating income. This has the effect of increasing other operating income in the prior year by £11.1 million and
increasing operating costs by the same amount, and therefore operating profit is unchanged for this item. Note that
IFRS 9 ‘Financial Instruments’ was not applied retrospectively and therefore the comparatives are not presented on
an IFRS 9 basis.
(2) The comparatives have been adjusted to show finance charges excluding interest receivable on an intragroup loan of
£191.8 million. From 29 March 2018 this group interest income, and the associated round trip dividend, ceased when
the related inter-company loan was settled as part of a simplification of the group structure, therefore no equivalent
adjustment is required in the current period.
(3) In order to show performance on an underlying basis the fair value losses on financial derivatives of £98.4 million
(2018: gains of £117.6 million) have been excluded from the table because these are volatile non-cash annual
movements which distort the actual underlying economic performance.
On 1 April 2018 IFRS 15 ‘Revenue from Contracts with Customers’ came into effect. The principal
consequence of this new standard is that grants and contributions income is recognised as revenue
immediately, whereas in the past it was spread over the life of the related asset and included in other
operating income. Revenue, excluding grants and contributions, for the year was £1,280.3 million (2018:
£1,248.9 million), an increase of £31.4 million (2.5%) on last year. This primarily reflects the regulatory
pricing mechanism, increases in household consumption due to the hot, dry summer and growth in customer
numbers. The increase in demand experienced over the summer months was, as expected, not sustained
for the remainder of the year.

Osprey Acquisitions Limited
Strategic report (continued) for the year ended 31 March 2019
ANGLIAN WATER
19
Grants and contributions represent the cash and asset contributions made principally by property developers
and local authorities for connecting new property developments to the water and sewerage network, and for
diverting existing infrastructure. Over the year these have increased by £11.3 million to £74.4 million,
which reflects an increased level of adopted sewers and pumping stations in relation to new housing
developments, and the significant diversion of existing infrastructure for the Cambridge to Huntingdon A14
road improvement scheme.
Other operating income comprises primarily external income from power generation, bio-solid sales to
farms, rents received and various other non-core activities. During the year other operating income
increased by £2.5 million to £13.6 million, principally due to increased power generation.
Operating costs for the year increased by £38.4 million (6.5%) to £630.5 million. This increase is explained
in the table below:
Increases/(decreases) in operating costs (before depreciation and amortisation) £m
One-off net costs in 2017/18 not repeating (3.5)
General inflationary increases 17.7
Increase in energy prices and costs 10.4
Increase in minor repair activities to maintain water and waste water below ground infrastructure 10.0
Providing more effective solutions through operational maintenance rather than capital investment 9.0 Dealing with the 'Beast from the East' and the exceptional hot, dry summer - proactive leakage management and avoiding interruptions to customer supply 6.5
Operating costs of newly commissioned plant 4.8
Reduction in actuarial pension charge (1.1)
Reduction in bad debt charge (2.4)
Net efficiency savings achieved (13.0)
Net increase in operating costs 38.4
Pension costs were reduced by £4.4 million by closing the defined benefit scheme in March 2018. However,
this was partially offset by a £3.3 million provision recognised in respect of AWS’ obligation under the
principle of guaranteed minimum pension (GMP) equalisation between male and female employees.
The cost and efficiency savings are derived from a range of initiatives including energy conservation and
self-generation, optimising the sourcing of commodities, centralised management of operations,
renegotiating supplier contracts on improved terms, and a number of productivity improvements from
embedding more lean thinking and processes into the business, and more efficient asset maintenance
programmes.
Depreciation and operating profit
Depreciation is up 3.9% compared with last year, consistent with the impact of newly commissioned assets
in the year, and a reduction in the useful life of various operational assets.
Operating profit has decreased by 1.6% to £389.0 million, which is consistent with the effect of the
regulatory price increase, more than offset by the increases in operating costs and depreciation.

Osprey Acquisitions Limited
Strategic report (continued) for the year ended 31 March 2019
ANGLIAN WATER
20
Financing costs and profit before tax
Underlying finance costs (excluding fair value gains and losses) decreased from £344.1 million in 2018 to
£331.4 million in 2019. This was primarily the result of the non-cash impact of lower inflation on index-
linked debt where the year on year average Retail Price Index (RPI) fell from 3.7% to 3.2% and the increase
in interest capitalised reflecting a higher level of capital projects in progress.
There was a fair value loss of £98.4 million on derivative financial instruments in 2019, compared with a
gain of £117.6 million in 2018. This shift was due to movements in market expectations of long-term
interest, inflation and exchange rates. Fair value gains and losses include a charge of £11.7 million relating
to the restructuring of derivatives which were cash settled in the period. The balance of the fair value gains
and losses are non-cash in nature and have no material effect on the underlying commercial operations of
the business. The driving factors for the loss in 2019 compared to the gain in 2018 were a rise in forward
inflation expectations together with a fall in forward interest rates. During the year, forward inflation
increased by circa 12 basis points (2018: 13 basis point fall), and forward interest rates decreased by 16
basis points (2018: 19 basis point increase).
Underlying profit before tax for the year was £60.5 million, compared with £52.9 million in the prior year.
This increase reflects the lower finance costs (excluding fair value gains/losses on derivatives) due
principally to a lower RPI, partially offset by the reduction in operating profit.
Taxation Our underlying effective tax rate is in line with the rate of corporation tax before considering losses
surrendered from other group companies. We are one of the largest private investors in infrastructure in our
region, investing more than £2 billion over five years. The Government actively encourages infrastructure
investment and grants us capital allowances, which defer some of our corporation tax liabilities until a later
period. Our customers directly benefit from the deferral as it helps to keep their bills lower.
Total tax paid or collected in the year to 31 March 2019, other than corporation tax, amounted to £256
million (2018: £227 million), of which £82 million was collected on behalf of the authorities for value added
tax (VAT) and employee payroll taxes. All of our taxes are paid as they become due.
Current tax
The current tax charge for the year was £55.9 million (2018: £44.0 million). The increase was mainly due to
a charge that arises on adoption of IFRS 15 and an increase in profits before taking account of fair value
adjustments on derivative financial instruments, which have no current tax effect. This is offset by the
claiming of capital allowances.
Deferred tax
The deferred tax credit has increased from £9.4 million to £61.0 million. The main reason for this increase
was the movement in fair value on financial derivatives which changed from a gain of £117.6 million last
year to a loss of £98.4 million this year. There was also an increase in the credit in respect of prior years
and the credit due to the reduction in corporation tax rates.
Our relatively low level of cash tax reflects the fiscal incentives available to all UK companies for sustained
high levels of capital investment, the interest we pay to fund that investment and utilisation of surplus
Advance Corporation Tax.

Osprey Acquisitions Limited
Strategic report (continued) for the year ended 31 March 2019
ANGLIAN WATER
21
Successful fourth year of AMP6 investment programme
AMP6 gross capital expenditure1 in the appointed business for the year was £440.0 million (£246.8 million
on capital maintenance, £193.2 million on capital enhancement), compared to £467.2 million in the third
year of AMP6. This level of expenditure is broadly in line with management expectations, and includes £45.2
million of capital maintenance spend in respect of our commitment to reinvest £100 million of efficiencies
over the AMP, as announced in 2017. Good progress is also being made with the £65 million of reinvestment
in resilience announced in March 2018 with capital expenditure in the year of £10.2 million - this will, among
other benefits, improve resilience in some critical parts of our network. In addition, £13.8 million of
reinvestment expenditure in the year was included in operating costs.
We have successfully delivered a number of our obligations for the Environment Agency through some
innovative and lower build approaches which has enabled us to both reduce carbon and deliver best whole-
life cost solutions. These schemes at places such as Ingoldisthorpe, Great Dunmow and Stanbridgeford will
form the basis not only of our Green Bond funded investment plan, but will also serve as a blueprint for the
approach we want to take in the next five year regulatory period.
Over the 2015–2020 five-year period, we are investing well over £2 billion through our capital investment
programme, delivering our business plan in terms of both regulatory outputs and in support of our Outcome
Delivery Incentives (ODIs).
Financial needs and resources
In the year to 31 March 2019, Anglian Water sourced £450 million of funds in term debt (£447.8 million net
of discounts) and made long-term debt and derivative repayments of £119.3 million. The new funds were
the result of a second round of Green Bonds issued in the year, in both the US and UK financial markets, the
proceeds of which will be used to finance our capital expenditure. Debt repayments comprised: a £6.2
million finance lease repayment; the repayment of the JPY 15 billion (£65.9 million) 2.925 per cent bonds
and associated cross currency swap maturing in December 2018 and £35.0 million of amortising
redemptions on EIB loans. In addition, Anglian Water paid £11.7 million to close out pre-hedge positions no
longer required as a result of the commitments made to reduce the leverage of the company.
At 31 March 2019, Anglian Water had borrowings net of cash of £7,159.8 million (£6,380.3 million excluding
derivatives), an increase of £263.4 million (£215.7 million excluding derivatives) over the prior year. Net
borrowings comprised a mixture of fixed, index-linked and variable-rate debt of £6,934.6 million, derivative
financial instruments of £779.5 million (excluding energy derivatives of £1.0 million), and cash and deposits
of £554.3 million. The increased net borrowings primarily reflect the ongoing capital investment programme.
The business generated cash from operations of £700.7 million in the year (2018: £690.8 million). The
increase primarily reflects the increased revenues in the year, partially offset by higher operational costs.
Dividends and equity injections
During the year the company paid dividends of £68.0 million (2018: £86.1 million). The dividend was
substantially lower than the funds available for distribution reflecting the board’s stated intention of reducing
gearing by paying lower dividends through to 2025.
The directors proposed a final dividend which was paid on 30 May 2019 of £67.8 million.
In October 2018 the company received an equity injection of £22.0 million from its group investors as part of the planned reduction in gearing.
1 Stated on an IFRS basis but excluding capitalised interest and adopted assets acquired at nil consideration, and grossed up for diversions and similar income of £10.9 million (2018: £6.3 million) which prior to the adoption of IFRS 15 on 1 April 2018 was netted against capital expenditure.

Osprey Acquisitions Limited
Strategic report (continued) for the year ended 31 March 2019
ANGLIAN WATER
22
Liquidity
Anglian Water’s objective is to maintain flexibility, diversification and continuity of funding through access to
different markets and debt instruments. At 31 March 2019, the Anglian Water Services Group held cash,
deposits and current asset investments of £554.3 million (2018: £287.1 million). The increase in cash held is
the result of Anglian Water raising finance to support anticipated capital and operating expenditure through
to the end of the current AMP, and refinancing of maturing debt early in AMP7. These resources are
maintained to ensure appropriate liquidity and the continuation of Anglian Water’s ongoing capital
investment programme.
Anglian Water has access to £600.0 million of facilities (2018: £600.0 million), which were undrawn at 31
March 2019, to finance capital expenditure and working capital requirements. In addition, Anglian Water has
access to a further £400.0 million of liquidity facilities (2018: £390.0 million), consisting of £279.0 million to
finance debt service costs and £121.0 million to finance operating expenditure and maintenance capital
expenditure in the event that Anglian Water is in default on its debt obligations and has insufficient
alternative sources of liquidity.
All bank facilities and debt capital market issuance are issued pursuant to the Global Secured Medium Term
Note Programme dated 30 July 2002 between Anglian Water Services Limited, Anglian Water Services
Financing Plc (AWSF) and Deutsche Trustee Company Limited (as agent and trustee for itself and each of
the finance parties). This agreement provides that any facilities drawn by AWSF will be passed directly on to
Anglian Water Services Limited upon utilisation of the facility.
Interest rates
Anglian Water’s policy, as agreed by the Board, is to achieve a balanced mix of funding to inflation linked,
fixed and floating rates of interest. At the year end, taking into account interest rate swaps, 58.8% (2018:
58.5%) of Anglian Water’s borrowings were at rates indexed to inflation, 35.1% (2018: 35.0%) were at
fixed rates and 6.1% (2018: 6.5%) were at floating rates. At 31 March 2019, the proportion of inflation debt
to regulated capital value was 50.0%.
Osprey Acquisitions Limited
Strategic report (continued) for the year ended 31 March 2019
ANGLIAN WATER
23
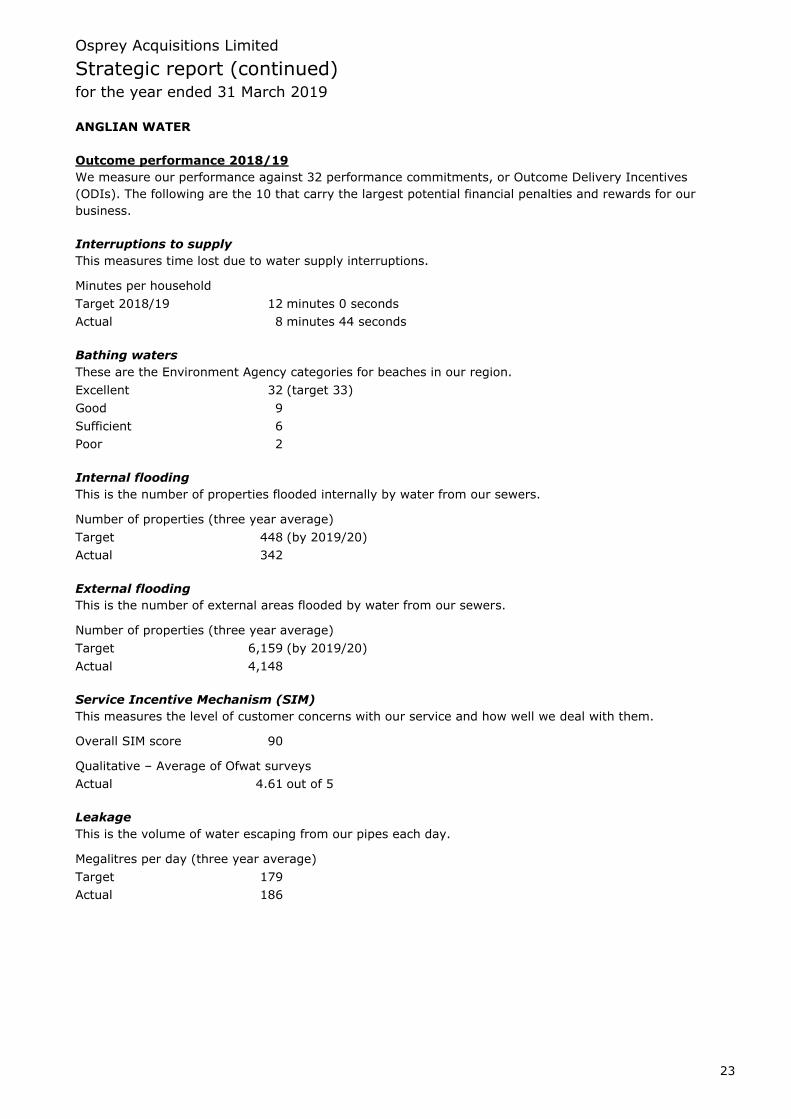
Outcome performance 2018/19
We measure our performance against 32 performance commitments, or Outcome Delivery Incentives
(ODIs). The following are the 10 that carry the largest potential financial penalties and rewards for our
business.
Interruptions to supply
This measures time lost due to water supply interruptions.
Minutes per household
Target 2018/19 12 minutes 0 seconds
Actual 8 minutes 44 seconds
Bathing waters
These are the Environment Agency categories for beaches in our region.
Excellent 32 (target 33)
Good 9
Sufficient 6
Poor 2
Internal flooding
This is the number of properties flooded internally by water from our sewers.
Number of properties (three year average)
Target 448 (by 2019/20)
Actual 342
External flooding
This is the number of external areas flooded by water from our sewers.
Number of properties (three year average)
Target 6,159 (by 2019/20)
Actual 4,148
Service Incentive Mechanism (SIM)
This measures the level of customer concerns with our service and how well we deal with them.
Overall SIM score 90
Qualitative – Average of Ofwat surveys
Actual 4.61 out of 5
Leakage
This is the volume of water escaping from our pipes each day.
Megalitres per day (three year average)
Target 179
Actual 186

Osprey Acquisitions Limited
Strategic report (continued) for the year ended 31 March 2019
ANGLIAN WATER
24
Serviceability
Above ground/non-infrastructure
Water: Water recycling:
Green Turbidity (cloudy water) Green Failing water recycling centres
(by number)
Green Coliforms (at reservoirs) Amber Failing water recycling centres
(by size)
Green Coliforms (at water treatment
works)
Below ground/infrastructure
Water: Water recycling:
Amber Interruptions (>12 hours) Green Sewer collapses
Green Burst mains Green Sewer blockages Green Contacts discolouration Green Pollution incidents
Green Distribution maintenance index Green Internal flooding
Pollution incidents
This is the total number of pollution incidents classed as category 3 by the Environment Agency.
Target 219
Actual 185
Water quality contacts
Taste, odour, appearance per thousand customers.
Target 1.23
Actual 1.18
Low pressure
Number of properties not receiving reference level pressure.
Number of properties
Target 313
Actual 287

Osprey Acquisitions Limited
Strategic report (continued) for the year ended 31 March 2019
ANGLIAN WATER
25
Operational performance
Planning for the future: PR19
In September 2018, we submitted our most ambitious Business Plan yet. It proposes a record £6.5 billion
investment programme which is nearly 30% larger than for the last period. Our plan addresses what our
customers told us matters to them most, as well as addressing the unique challenges we face as a water
company operating in one of the UK’s fastest growing and driest regions.
The £6.5 billion programme of investment includes:
£240 million to drive down consumption, including a further 22% reduction in leakage
£630 million to make the region resilient to the risks of drought and flooding, nearly eight times larger
than the last period
£783 million to support the environment, more than double the last period
£40 million to protect drinking water quality through catchment management
£650 million to enable sustainable growth through improvements to the water and water recycling
networks, backed up by over £3.7 billion of base operating expenditure and maintenance costs
Alongside this, we have mapped out plans to support more than 475,000 customers each year who have
affordability and vulnerability issues - a huge jump in support for customers who may encounter affordability
issues in AMP7.
This 30% increase in investment is being delivered alongside what is now a marginal price reduction over
the period of 0.1%, with average real bills at the end of the period £5 per year lower than at the start (£426
in 2020/21, to £421 in 2025/26).
Ofwat is now reviewing our plan, along with our feedback on the regulator’s initial assessment of it, in which
we reiterated our belief that it is the right plan for our customers and the environment. We will receive our
final determination in December 2019.
Following the proposed metaldehyde ban (announced subsequent to the plan’s initial submission), we have
removed £65 million of associated investment from the plan. This, alongside other minor changes to the
proposals and the inclusion of even more recent figures, has resulted in proposed bills now decreasing
slightly over the five year period to 2025 as mentioned above.
More than half a million customer interactions have shaped the plan – 10 times greater than for Anglian
Water’s last plan in 2014 – with more than 80% supporting it. We are confident it is the right plan for our
customers, and the right plan for the region.
Delivering our AMP6 Business Plan
Alongside planning for the future, we have not lost sight of the importance of delivering our business plan
for AMP6, 2015-2020. This plan was also written following extensive consultation with customers, and was
based around 10 outcomes that address the issues that matter most to our customers, and that deliver for
them, the region and the environment.
Here, we report on progress against these 10 outcomes under the overarching banners of Smart Business,
Smart Communities and Smart Environment. Further detail will be published in our Annual Integrated
Report.
The fundamentals of our business have not changed: the provision of safe, clean drinking water, the
protection of our environment and world-class customer service remain paramount.
Osprey Acquisitions Limited
Strategic report (continued) for the year ended 31 March 2019
ANGLIAN WATER
26
Smart Business
Resilient Business
We must be constantly ready to deal with severe weather events, including flooding, the risk of drought
from too little rainfall or the rapid changes in conditions from a freeze-thaw event. We have been challenged
by all of these in the last 12 months. Our meticulous planning and rapid operational response means
customers saw no impact from the prolonged dry weather of summer 2018, as was the case during the
Beast from the East, earlier in the year. We now have more than 1,000 recruits within the ‘Anglian Water
Force', a team of volunteers from our business and our alliance partners who are ready to respond quickly in
the event of an incident. This approach was shortlisted as a finalist at the 2018 Utility Week Awards.
We continue to achieve certification to ISO 22301, an international standard in business continuity
management, which recognises that we have the plans and systems in place to keep our business running.
This is supported by active engagement with our 13 Local Resilience Forums (LRFs) and the Multi Agency
Support Group for the East of England in planning and risk mitigation.
Our ultimate aim is to increase our resilience as a business so that, no matter what, we keep taps running.
The way in which we deal with leakage is at the heart of this. We continue to lead the industry in leakage
reduction, with around half the national average based on the amount of water lost per kilometre of main.
As part of our drive to improve our resilience to the impacts of drought and climate change we set ourselves
the ambitious target of reducing leakage by 10.4%, or 20Ml/d, to 172Ml/d between 2015 and 2020. Our
results for 2018/19 are slightly up on previous years following the severe weather we have experienced, but
we are nonetheless well within our regulatory target.
This leading leakage performance is the result of many factors, not least the daily deployment of up to 8,000
‘lift and shift’ noise loggers, used by our dedicated leakage detection and repair teams. When this is
combined with intensive leakage detection teams, focused on finding invisible and difficult to locate leaks, an
optimised water network in which pressure is dynamically managed to reduce bursts, and smart sensors that
permanently monitor network performance, we are confident that we will continue to deliver industry leading
performance.
Investing for Tomorrow
Our capital expenditure programme is focused on maintaining and improving our assets and services,
ensuring we can deal with growth, and on meeting water quality and environmental standards. For AMP6,
we have committed to a £2 billion programme of investment, delivered by the five delivery alliances we put
in place at the start of this AMP, alongside our newest alliance that delivers our Information Systems (IS)
programme. Together, these alliances will help provide our services until 2030.
Our alliances operate with an unparalleled degree of integration and alignment, and the opportunity for
longer-term collaboration. As we prepare for AMP7, this will be further enhanced as we embed alliance
partners into our Water and Water Recycling business streams and give our operational teams control of
total expenditure (totex) budgets to further incentivise efficient and sustainable solutions for our assets
throughout their operational lives.
Along with being on target to meet our 15% efficiency savings target (compared to our AMP5 cost base), we
are also outperforming many of our targets and are on track to be in an overall reward position against our
ODIs for AMP6. Our success has allowed us to reinvest efficiency back into new initiatives to get the
business fit for AMP7.
Throughout the year, we have delivered good performance at our water treatment works, water recycling
centres, and across our networks. We continue to see excellent progress in the number of pollution incidents
we are seeing each year, reducing from 218 (2017) to 175 (2018). This included one Category 1 incident
and five Category 2 incidents, which is also an improvement on last year’s performance. We will drive this
number even lower through improved use of analytics to monitor and predict asset failure, along with
increased telemetry monitoring of our water recycling assets. This year sees us record four and a half
successive years without prosecution, and we are ahead of targets for the reduction of internal and external
flooding incidents, including our best year to date.
Osprey Acquisitions Limited
Strategic report (continued) for the year ended 31 March 2019
ANGLIAN WATER
27
Our Keep it Clear programme, which aims to prevent avoidable blockages caused by fats, oils and grease,
reached more than 25,000 people across our communities this year. Alongside this we have visited 2,543
properties in areas identified as ‘high risk’ to offer advice and gather information on individual waste disposal
habits. We have seen a reduction in avoidable blockages of 43% over three years in the 24 hotspot blockage
towns.
Fair Charges, Fair Returns
Anglian Water has always raised its debt through UK registered companies, and its debt is listed on the
London Stock Exchange. In 2017 it became the first European utility company to issue a sterling Green
Bond. Since the successful launch of that debt transaction, the company has raised a further £580 million of
Green Bonds to investors in the UK and US. Crucially, in order to qualify for this green finance, we have not
had to change any day-to-day processes or reporting to qualify. Our strong governance culture ensures we
continuously drive to generate value for customers and society while delivering environmental benefits. This
means that all of Anglian Water’s capital expenditure meets the requirements of the Green Bond principles.
We understand that affordability challenges will vary across time for the same household and can be driven
by different circumstances. We also recognise that Anglian Water alone cannot solve wider affordability
problems, but by linking into and making customers aware of the wider support available, we know we can
play an important role.
In the first instance, we are using data analytics to route any calls from customers identified as those with a
high risk of affordability issues to our ExtraCare team, where we can check to see if they are claiming all the
benefits to which their household is already entitled. We then look to see what help we can provide,
including forgiveness schemes, payment ‘holidays’, leakage allowances, instalment plans and settlement
agreements. We also operate a number of tailored tariffs, including the AquaCare Plus and WaterSure
concessionary tariffs and our social tariff called LITE. Together, these schemes provided assistance to over
259,000 customers during 2018/19.
We believe using a meter to measure the amount of water a customer uses is the fairest way to charge for
water. Use of meters is also known to encourage water saving – typically, customers save over £100 a year
and use up to 15% less water when they switch to metered charging. 82% of our customers already receive
a metered bill.
Last year, our Integrated Metering and Developer Services (IMDS) alliance continued work on our
programme to install 86,000 new meters, upgrade another 412,000 and visit 120,000 customers to offer
efficiency tips and to install water-saving devices. Our Wave programme – where we combine all the
elements of metering and water efficiency in defined geographical areas – has made good progress,
installing 14,000 new meters and proactively replacing 80,000 more across our region. Alongside this
proactive approach, customers can also request a meter. Our target is to have visited 48,000 such
customers over the five years to 2020.
We have successfully completed the installation phase of our second smart meter trial in Norwich, installing
11,000 smart meters. These are in addition to the 7,500 we fitted in our Innovation Shop Window in
Newmarket in 2016/17. The meters remotely collect hourly consumption data, which helps customers
understand their water use, and helps us to better understand how our water network operates. To date we
have helped customers identify and fix 1,470 leaks, reducing the volume of water lost to customer side
leakage and plumbing loss by 90%.
Our online customer portal that lets people view their own consumption data and see where they could save
water is now being used by 2,433 customers. Early signs are that it does help people use less water. All of
this insight helped inform our business plan, providing valuable information on the benefits smart metering
offers our customers.
Our People: Healthier, Happier and Safer
We firmly believe that there is nothing more important than a healthy and safe workforce. That is why, to-
date, more than 3,500 of our employees have been through specially designed LIFE workshops – Living in
an Injury Free Environment. Integrated into this is a significant focus on the mental wellbeing of our
colleagues, recognising the significant impact we can have.
Osprey Acquisitions Limited
Strategic report (continued) for the year ended 31 March 2019
ANGLIAN WATER
28
Technology is assisting in the development of this culture. As well as developing digital training tools we
have also built our own health and safety app, which was nominated for IT Initiative of the Year at the 2018
Utility Week Awards. The app provides a simple way of recording all incidents, with the ability to track and
monitor progress.
External validation suggests we are achieving excellence in relation to Health and Safety. We have, again
been recognised by the Royal Society for the Prevention of Accidents and awarded ’Gold’ for our excellent
health and safety performance and our effective health and safety management system. We were also the
first UK water company to be awarded the ISO 45001 standard for health and safety.
We are also delighted to have been named as the best place to work in the UK, according to Glassdoor. This
is particularly pleasing as it is current and past colleagues who provide the feedback on which this award is
based.
Attracting future talent is as important as developing the skills of those who already work with us. We have
invested in the development of a varied apprenticeship programme, and have fully embraced the
introduction of the Apprenticeship Levy, successfully targeting total recovery of our levy payments. This year
we have announced 64 apprenticeship places. Around a third of Anglian Water’s workforce will retire in the
next decade and the apprenticeship scheme enables us to target budding engineers and technicians from the
next generation and give them the right skills and experience to join the business. It also enables us to up-
skill existing staff.
We now have 18 different programmes ranging from Heavy Goods Vehicle (HGV) drivers to Masters Degree
in Strategic Leadership. Programmes which are largely targeted for the harder to recruit skill areas and new
or growing skill requirements are key including programmes for data analysts, project managers, a range of
digital skills, customer service and role quantity surveyors.
Joining forces with Capgemini, we are also able to offer undergraduate degree apprenticeships in digital
skills which are proving highly successful, and existing employees who are being up-skilled are finding the
new opportunities exciting and motivating. The nine apprentices currently employed on this apprenticeship
study part time at Aston University over 4.5 years, with work experience in both Anglian Water and
Capgemini.
Since 2014 we have recruited 200 apprentices with 93% retention (as of December 2018).
We also continue our commitment to professional skills development through our Licence to Operate
programmes. In January 2019, we became the first water company in the UK to secure the latest Competent
Operator Scheme (COS) certificate from the water industry competency assessment body Energy and Utility
Skills, in close coordination with the Drinking Water Inspectorate (DWI) regulator.
We want to ensure our culture is one where people are able to bring their whole selves to work; we are able
to attract talent that reflects the diverse nature of our community and develop skills for the future of our
industry. To give us a broader perspective we have signed up to the EU Skills Inclusion Commitment
statement, which, among other things, is a commitment to ensure that our workforce reflects the diverse
nature of our communities.
In December 2018 we set up a Future Leaders Board made up of a diverse group of individuals from across
the business who will bring new ways of thinking and challenges to our businesses’ decision-making
processes. Each board committee member will be in post for 18 months, during which time they will
consider the challenges of customer expectation, sustainability, and diversity and inclusion.
Osprey Acquisitions Limited
Strategic report (continued) for the year ended 31 March 2019
ANGLIAN WATER
29
Smart Communities
Positive Impact on Communities
Our year as Business in the Community’s (BITC) Responsible Business of the Year came to an end in July
2018. At BITC’s Awards Gala at the Royal Albert Hall we were able to shine a spotlight on our community
regeneration project in Wisbech, bringing young aspiring presenters from local schools to host the event
alongside Sir Lenny Henry. We used the evening to challenge the UK’s business community to step up and
play a more constructive role in the future of their local community. As a result we have been working with
BITC to develop a new, business-led, place-making strategy. A national Place Leadership team has been
established and, based on our experiences in Wisbech and BITC’s work across the country, a strategy has
been developed that has enabled three businesses to come forward to commit to driving community
regeneration in three new locations.
This includes Lowestoft, where as Chair of BITC’s Regional Advisory Board we are working with partner
companies, in particular Kier, to support the people of the town to realise their vision of regeneration.
Last year saw the development of our Community Ambassador Programme. The programme trains
volunteers from across the company enabling us to get even closer to our customers and discuss the key
issues affecting water, with almost 1,200 customers engaged face to face this year. Together with our online
customer community and our Customer Board, the programme allows us to put customers’ views at the
heart of our thinking.
This outreach builds on our education programme, which saw 31,000 future customers in 2018/19. In total,
since 2007, our education programme has engaged more than 451,000 school children.
Our water parks remain valuable community assets, and attract around two million visitors each year. Each
of our seven parks retained Green Flag status in 2018/19, which recognises well-managed parks and green
spaces, setting the benchmark standard for the management of recreational outdoor spaces across the UK
and around the world. Our team of park volunteers is now delivering an impressive 3,000 hours each year,
helping us deliver fantastic improvements to our parks by fencing, woodland thinning, coppicing and litter
picking, while learning valuable skills and training in park and conservation management.
Safe, Clean Water
Nothing is more important to us than the delivery of safe, clean, high-quality drinking water. It underpins
the public health of our region and is a fundamental expectation of our customers.
The Drinking Water Inspectorate (DWI) measures performance at our water treatment works (WTWs) and
the water travelling through our network supplying homes and businesses. This year we achieved excellent
performance again at our WTWs, with just five coliform failures. Our solid performance continued at our
storage reservoirs, where we achieved a compliance score of 99.98% this year.
We also achieved our target for the quality of water travelling through our network to homes and
businesses. Mean Zonal Compliance (MZC) is the key measure used by the DWI to determine compliance
with the stringent regulatory drinking water standards for England and Wales. This year we achieved
99.95%.
Once again we have seen a reduction in the number of contacts we receive from customers about the taste,
odour and appearance of their water, taking us to the lowest level we have ever recorded. We have dropped
from 1.23 contacts per thousand people in 2017/18, to 1.18 per thousand people 2018/19.
While we are only responsible for the pipework up to a property’s boundary, plumbing fittings on the
customer side can still affect the taste, odour or, in extreme cases, contamination of the water supply. In
2018 we inspected more than 8,500 properties, ranging from hospitals to farms and schools to ports. As
part of our proactive education programme we are now working with eight plumbing training colleges to
educate the plumbers of the future about compliance requirements. We also visited over 1,600 public
buildings, such as smaller schools, village halls and community centres, which are often used by more
vulnerable groups such as young people or the elderly.

Osprey Acquisitions Limited
Strategic report (continued) for the year ended 31 March 2019
ANGLIAN WATER
30
We continue to work with landowners and businesses across the region to address issues such as
agricultural pollution, the impact of plastics, third-party pollutions and trade effluent discharges to protect
water quality. Improving water at source as opposed to being reliant on treatment solutions is more cost-
effective for customers but also can afford wider environmental and social benefits such as improving the
amenity and recreational use or increasing habitat and biodiversity. Better quality raw waters are also able
to be moved between areas of scarcity, improving resilience across our region.
In a bid to help our farm customers we have supported the installation of 15 weather stations across the
region to provide localised weather information, including temperature, evaporation, wind speed, as well as
soil temperature and moisture – all critical data to minimise the loss of any chemicals from the land into raw
waters. The data is then available via an app that predicts suitable pesticide application up to five days in
advance. Currently more than 100 local farmers can receive this data and we are planning a wider roll out in
the future.
Delighted Customers
Providing a great service to our customers is business as usual for us. It is for that reason that we are
delighted to achieve the number one position in Ofwat’s Customer Experience Survey for 2018/19, following
our first place in 2017/18. This builds on almost 20 years of upper-quartile performance across a variety of
customer and service metrics.
However, it is important we continue to adapt and improve our service in line with our customers’ individual
needs. This year we have driven a customer service transformation programme across our business that has
seen us review and redesign our processes and communications to ensure we are delivering the service our
customers want and need.
Outcomes of this review include increasing our use of two-way SMS communication to engage with our
customers and we have further developed our online billing platform, MyAccount. Among many other helpful
improvements, our customers can now update a change of address and switch to a meter at the click of a
button. We have seen the use of this platform increase, with over 30,000 customer interactions every week.
Driving developments in technology is key to delivering an excellent service for our customers, but it is only
part of the story. We have also been working with all our front-line staff on an internal initiative called Make
Today Great, the aim of which is to help make life better for our customers, every single day. We have taken
our front-line staff through challenging customer service training and made changes to our internal
processes with the sole purpose of ensuring everyone at Anglian Water is empowered to do what they can to
make an individual customer’s day better.
This year, following a formal six-day assessment, we have achieved certification to the British Standards
Institutions (BSI) BS 18477 for Inclusion Service Provision - Requirements for Identifying and Responding to
Customer Vulnerability. Achievement of this certification really demonstrates our commitment to continually
improve and ensure our services are inclusive, available and accessible to all our customers equally,
regardless of their personal circumstances. We also successfully gained accreditation from The Institute of
Customer Service – achieving their ServiceMark, a national customer service standard.
We now have more than 120,000 customers benefiting from a reduced tariff, and over the next year we will
be further developing our WaterCare package of support. Where that extra support is needed, with the
customers’ consent, we will work closely with the energy sector to introduce a ‘tell once’ approach. This will
avoid customers having to make multiple contacts to their energy and water companies about the extra
support they may need.
Osprey Acquisitions Limited
Strategic report (continued) for the year ended 31 March 2019
ANGLIAN WATER
31
Smart Environment
Supply Meets Demand
As a region we face a time of great uncertainty and change. Our supply-demand balance is under significant
pressure and we have to act now to ensure there will be enough water available for future generations. Our
region is already one of the driest in the country and climate change projections suggest that in the future
there will be lower summer rainfall and hotter temperatures, reducing the amount of water available. As well
as less rainfall, we are required to abstract less water and we will also have more people to supply – our
region is one of the UK’s fastest growing. A 20% increase in population is predicted over the next 25 years.
This year, we published our 2019 Water Resources Management Plan (WRMP), which sets out how we will
manage the water supplies in our region to meet current and future needs over a minimum of 25 years. We
will focus on the demand side first to reduce the amount of water used, which is our customers’ preferred
priority. Demand-side measures include a proposed leakage reduction of 22% by 2025 (and a 42% decrease
by 2045); the installation of smart meters, with complete coverage across our region by 2030; and
innovative water efficiency schemes built on behavioural change initiatives to help our customers become
even more water efficient.
To complement these demand-side measures, we will also invest in supply-side options to increase future
availability, detailed in our WRMP. This will include a series of interconnecting pipes across our region to
better join up our supply network, moving water from areas of surplus to areas of deficit. We will also
consider additional resources for the medium to long term, such as storage reservoirs, water reuse schemes
and desalination.
This year we have updated and published (in draft) our latest Drought Plan, which sets out how we will
safeguard public water supplies during extended periods of low rainfall when water resources become
depleted, and what we will do to minimise any potential environmental impacts that may arise as a result.
Alongside our WRMP, we have also developed our first Water Recycling Long-Term Plan (WRLTP). This has
been recognised as industry-leading, with endorsement from a wide range of stakeholders, including the
Environmental Agency (EA) and local councils. The plan outlines the investment needed over the next 25
years to balance the supply and demand for water recycling services. The plan promotes sustainable
solutions for maintaining reliable and affordable levels of service, and facilitates working in partnership with
other risk management authorities to mitigate the risk of flood.
Our WRLTP also outlines investment strategies to support sustainable growth. The timing and scale of these
needs are unknown, so our strategies are adaptive to allow us to respond to the key indicators we monitor.
A long-term view enables us to identify solutions that are phased according to our confidence of the need for
investment, and include opportunities to reduce the risk to the services we provide for customers in the long
term.
To support the predicted 20% increase in population over the next 25 years we are working collaboratively
with councils to prepare local plans that outline the scale and distribution of housing and economic
development across our region. In November 2018 we published Local Plans – An Anglian Water
perspective, outlining these objectives, suggested wording for inclusion in local plan policies and how we can
support site selection. The intention is to work increasingly closely with councils on the development of their
local plans at an early stage as well as continuing to comment at formal stages.
Water Resources East (WRE) is a pioneering multi-sector water management programme in eastern
England. WRE is working in partnership to safeguard a sustainable supply of water resilient to future
challenges and enabling the area’s communities, environment and economy to reach their full potential.
Anglian Water has been at the forefront of developing WRE over the last year. With this, Dr Robin Price has
been appointed as interim managing director to develop WRE’s 2019/2020 business plan, establish and
appoint permanent board members, and form a new governance structure. WRE will be officially founded as
an independent not for profit company in 2019, with Anglian Water sitting as a principal board member.
Osprey Acquisitions Limited
Strategic report (continued) for the year ended 31 March 2019
ANGLIAN WATER
32
WRE has this year helped develop a National Planning Framework with the EA. Together with other regional
groups, it aims to develop aligned and cohesive water management and planning strategies that water
companies can unify with when planning for the longer term. WRE has also submitted a number of
Environmental Land Management plans (ELMs) to Defra to develop our catchment management approaches.
A Flourishing Environment
Our region is home to more than 700 Sites of Special Scientific Interest, 49 of which we have a dedicated
responsibility to protect and enhance. Alongside our management of these sites, there are also many other
important sites for wildlife that we care for. This year we have conducted a botanical survey of Whitlingham
Marsh, part of Whitlingham Water Recycling Centre, which resulted in the marsh being designated as an
official Local Wildlife Site. We have also developed a comprehensive botanical investigation and management
plan for Marham Fen, in west Norfolk, to improve the site to become a home for wildlife.
We have also been working with the University of East Anglia to not only understand the biodiversity value
of our operational sites but also how these landholdings connect to other land outside our ownership and
facilitate the movement of wildlife across the wider countryside. Applying this cutting-edge science and
insight will help us target our conservation work to where it will do most good.
We continue to look for innovative ways in which we can both improve the natural capital of our region, and
reduce the amount of carbon and energy required to meet the challenges we face. This approach is
epitomised in the development this year of a treatment wetland at Ingoldisthorpe, Norfolk, in partnership
with the Norfolk Rivers Trust. The wetland is providing additional nutrient treatment for the effluent from our
water recycling centre on the site, as an alternative to using expensive carbon and chemical-intensive
treatment. In addition, it also creates valuable habitat that would not be developed had we simply built an
extension to the works.
Our RiverCare and BeachCare programmes are our long-term partnerships with Keep Britain Tidy to
empower communities to look after their local environments. There are now 45 established volunteer groups
looking after stretches of river and beach across our region. Earlier this year we launched two new kayaks
manufactured from recycled marine plastic litter collected from beach cleans in the south west of England.
They are now used for river-based clean-up operations in the Anglian Water region.
The EA classified 32 bathing waters along the Anglian Water coastline as ‘excellent’ in 2018, with a further
nine classified as ‘good’. Notable success includes the transition of Cleethorpes from ‘Good’ to ‘Excellent’
status, which comes as a result of working closely with the local authority and the EA to continue to improve
bathing water quality.
A Smaller Footprint
Continuing to provide a reliable and affordable service means we must address the impacts of global
challenges, including the effects of climate change, and the need to make the most of finite resources to
provide for a growing population. Our strategy involves cutting our carbon emissions; reducing the energy
and materials used to maintain our infrastructure; generating our own, renewable energy; increasing the
efficiency of our equipment; driving out waste; and finding uses for the by-products of our treatment
processes in pursuit of a truly circular economy. By doing so we also continue to reduce costs, drive
innovation and set a powerful example for others to follow.
For a third consecutive year we have retained our PAS 2080 certification in Carbon Management in
Infrastructure, demonstrating that we have the right leadership and governance in place for effective carbon
management. We were the first organisation in the world to be verified against the standard in 2016.
Collaboration across the supply chain is a critical element in delivering carbon and cost reductions. PAS 2080
provides a consistent framework for organisations to use in measuring, managing and reducing carbon.
Annual gross operational carbon emissions (subject to assurance in June) have decreased by 29% in
2018/19 in comparison to the 2014/15 baseline, reducing from 455,335 t/CO2e to 322,201 t/CO2e.
Greenhouse gas emission data has been measured and reported in line with the environmental reporting
guidelines from the Department for Food and Rural Affairs (Defra). Annual net operational carbon emissions
have decreased by 30% in 2018/19 in comparison to the 2014/15 baseline, reducing from 446,834 t/CO2e
to 314,050 t/CO2e.
Osprey Acquisitions Limited
Strategic report (continued) for the year ended 31 March 2019
ANGLIAN WATER
33
Our design engineers and capital delivery teams have delivered a 58% reduction in capital carbon against
our 2010 baseline, through a focus on design, materials used and installation and commissioning techniques
in construction.
An increasing amount of renewable energy is generated on our sites. This year we expect to generate 107
Gwh from biogas using our fleet of Combined Heat and Power (CHP) engines, which are fuelled by the biogas
produced at our sludge treatment centres. This is an increase on the 90 GWh generated last year. This year
has been one of breaking new ground in CHP performance; outputs have steadily climbed across the year
with the highest-ever daily and monthly outputs recorded in the second half, with a first-ever 10 GWh+
month achieved. This year also saw the CHP outputs going above 100 GWh for the first time.
Osprey Acquisitions Limited
Strategic report (continued) for the year ended 31 March 2019
OTHER BUSINESS ACTIVITIES
34
The ‘Other’ business segment mainly comprises head office and other group functions, including Property.
The operating loss from other operations was £13.1 million compared to £8.0 million in the prior year,
primarily a result of the non-cash book loss on the sale of Celtic Springs. Additionally, in the prior period,
profits of £1.5 million, in respect of the sale of the Hamden House property in Arlesey were recognised.
The operating cash outflow was £2.1 million higher than the prior year at £18.8 million. This was principally
due to the prior period receipt of proceeds from property sales.
Treasury management
Group financing, including debt, interest costs and foreign exchange, is substantially managed by a central
Treasury team reporting to the Managing Director, Finance & Non Regulated Business. Treasury policy
continues to be focused on the efficient and effective management of cash and financial resources within the
group.
The activities of the central Treasury function include the following:
• ensure that lenders’ covenants are met;
• secure funds through a balanced approach to financial markets and maturities;
• manage interest rates to minimise financial exposures and minimise interest costs;
• invest temporary surplus cash to best advantage at minimal financial risk;
• maintain an excellent reputation with providers of finance and rating agencies;
• promote management techniques and systems;
• enhance control of financial resources; and
• monitor counterparty credit exposures.
The group’s Board, through the Finance, Treasury and Energy Policy Group, regularly reviews treasury
policy, organisation and reporting to ensure continued effectiveness and relevance. More information on
treasury management can be found in note 23 of the consolidated financial statements.
Liquidity
The group’s objective is to maintain flexibility and continuity of funding through access to different markets
and debt instruments. At 31 March 2019 the group held cash, deposits and current asset investments of
£616.3 million (2018: £331.0 million) and had undrawn committed facilities of £1,125.0 million (2018:
£1,115.0 million). These resources are maintained to ensure liquidity and the continuation of the group’s
investment programme. The maturity profile of the group’s borrowings is set out in note 23 of the
consolidated financial statements.
Capital structure
The group’s capital structure is largely driven by the requirements of Anglian Water’s capital expenditure
programme, which is met by a combination of cash flow and debt issuance with covenant tests at the
Anglian Water and Osprey Acquisitions Limited levels. At 31 March 2019 Anglian Water’s and Osprey
Acquisitions’ net debt to capital value ratio (net debt as defined in the Common Terms Agreement expressed
as a percentage of Anglian Water’s regulated capital value) was 78.1% (2018: 78.1%) and 83.1% (2018:
83.4%) respectively.
Borrowing covenants
The financing within Anglian Water is secured under a common terms agreement with investors. All other
group borrowings are raised or guaranteed by the company, Anglian Water (Osprey) Financing Plc, AWG
Parent Co Limited, AWG Group Limited and, in certain instances, subsidiary companies. The central Treasury
function is responsible for monitoring ongoing compliance with the group’s financial covenants, which
principally relate to Anglian Water’s ratio of net debt to Regulatory Capital Value and interest coverage. At
31 March 2019, all group companies were compliant with all covenants.

Osprey Acquisitions Limited
Strategic report (continued) for the year ended 31 March 2019
OTHER BUSINESS ACTIVITIES
35
Interest rates
The group’s policy, as agreed by the Board, is to achieve an efficient mix of funding at fixed rates of interest,
floating rates of interest and rates indexed to retail prices. This mix also reflects utilisation of interest rate
swaps so as to manage the group’s net exposure to interest rate and retail price variations.

Osprey Acquisitions Limited
Strategic report (continued) for the year ended 31 March 2019
RISK MANAGEMENT
36
Customers expect us to provide a reliable, high-quality service, whatever happens. So resilience has been an
important part of our planning and operations for a long time.
‘Resilient Business’ is one of the ten core outcomes we agreed with customers in 2013 and we have set
ourselves the long-term ambition to make the east of England resilient to the risks of drought and flooding.
Resilience
Ofwat’s definition of resilience is “the ability to cope with, and recover from, disruption and anticipate trends
and variability in order to maintain services for people and protect the natural environment now and in the
future” (Ofwat, 2017, Resilience in the Round).
Resilience reflects the overall “capacity of individuals, communities, institutions, businesses and systems to
survive, adapt and thrive no matter what kinds of chronic stresses or acute shocks they experience”
(adapted from Rockefeller Foundation, 2013).
Risk assessments and mitigation continue to play an important role in responding to business challenges.
However, in order to create truly resilient organisations in the face of growing uncertainty, this needs to be
supplemented with a broader consideration of resilient systems.
So, we have developed a framework, adopted by many others in the industry, to help us think about how we
manage risks over the short-term alongside longer-term trends and lower-likelihood risks. The framework
builds on Ofwat’s approach to ‘Resilience in the Round’ and best practice resilience frameworks, for example,
the City Resilience Index – CRI (Arup for the Rockefeller Foundation 2016) and the Cabinet Office’s definition
of resilience.
Ofwat has published guidance on resilience in its PR19 consultation document (Ofwat, Delivering Water
2020: Consulting on our methodology for the 2019 price review). This includes the concept of ‘Resilience in
the Round’ which recommends that customers should be the focus of the business and three themes of
resilience should be considered:
• Corporate resilience: the ability of an organisation’s governance, accountability and assurance processes to
help avoid, cope with, and recover from, disruption; and to anticipate trends and variability in its business
operations.
• Financial resilience: an organisation’s ability to avoid, cope with, and recover from, disruption to its
finances.
• Operational resilience: the ability of an organisation’s infrastructure, and the skills to run that
infrastructure, to avoid, cope with, and recover from, disruption in its ability to provide critical services to
customers.
We are constantly developing our resilience approach to ensure robust systems thinking and have
incorporated our Resilience Systems Thinking into our AMP7 Business Plan.
Risk management
Risk management is a key part of our resilience thinking and central to the achievement of our strategic
priorities, and we approach this in several ways:
• at a global level, what are the potential mega trends and have we ensured these are on our horizon when
planning for future resilience?
• the National Risk Register also plays a key part in our resilience thinking and helps us prioritise both in
terms of likelihood of occurrence and scale of impact
• we use an all-hazards approach and challenge ourselves to ensure we look at an end-to-end systems
approach to the current risks and ensure preparedness for the shocks and stresses we may face
• we seek to engage with customers to help their understanding of the challenges we face and their
priorities.

Osprey Acquisitions Limited
Strategic report (continued) for the year ended 31 March 2019
RISK MANAGEMENT
37
We manage risk across our business through a number of formal and informal processes. These risk
management processes sit within our overall governance framework, which includes clear accountabilities,
delegated authority limits and well-defined policies and procedures that govern employee conduct.
There are a number of external risks and uncertainties that could have a significant impact on our
operations, financial health, customers, environment or reputation. We invest substantial resources to
identify, analyse and, where possible, manage these challenges.
Our risk management system ensures processes are in place for the identification and management of risks
measured on both a top-down and bottom-up basis.
We track identified risks using a comprehensive system of risk registers, which operate at a number of levels
across the business. These registers are used to assess the risks; to document the existing controls in place
to manage these risks; to ensure mitigation and assurance plans are established and embedded within our
business operations; and to establish clear ownership and accountability for each of the risks. An IT system
is used to record and monitor these risks across the business, which helps ensure a consistent approach to
risk management.
The most significant or principal risks are escalated from the business unit risk registers to be recorded in
our top-tier risk register, which is regularly reviewed in detail by the Board. During the course of the past
year, the Management Board has also reviewed the top-tier risks and has considered the effectiveness of our
embedded processes in the approach to the management of risk that are designed to further integrate risk
management within the business.
To provide the Management Board with an overview of the risk landscape, we have mapped the top-tier
risks onto a Strategic Business Risk Map. The Risk Map also includes business-wide risks that, although not
so significant as to be top-tier risks, the Management Board wishes to keep ‘on the radar’.
This overview is reviewed on a monthly basis by management to ensure we have identified and created
coverage of all significant risks in the business and can readily identify new risks, see any changes in risks,
review our progress in delivering mitigation actions and maintain relevant business controls. This Map will
remain dynamic as new risks emerge or there are significant changes to our mitigation actions or controls.
Risk appetite
Osprey Acquisitions Limited is exposed to a variety of uncertainties that could have a material adverse effect
or impact on the group’s financial condition, our operational performance, our business resilience and our
reputation.
The group has a structured approach to risk assessment with the Board reviewing and challenging
management’s assessment of risk together with the mitigation measures in place to manage principal risks
in the context of our obligations to keep its employees safe and provide an essential and efficient service to
customers. The Board’s assessment of risk helps senior management to determine the mitigating activities
required to control risk likelihood and impact to acceptable levels.
For principal risks, we review our current risk level and how our controls provide confidence and assurance
around our management of that risk. Where a gap exists between our current position and our mitigated
aspiration we instigate new or revised actions to close any risk gap.
Peer review and discussion at the Board or Anglian Water Management Board form the basis for establishing
our overall principal risk status. There may be occasions when a higher level of risk is acceptable, but this is
only in cases where the risks are well understood and can be demonstrably managed. The Board regularly
reviews the group’s internal controls and risk management processes to support its decision making.
Risk management process
Our risk management process identifies, assesses and manages our risks. These risks are broadly
categorised as safety, operational, financial, regulatory, and compliance with current regulations and law.
Risks are formally identified and mapped to ensure consistency and completeness.
Osprey Acquisitions Limited
Strategic report (continued) for the year ended 31 March 2019
RISK MANAGEMENT
38
We analyse the potential causes and impacts of risk using a range of governance, compliance and audit
activities. The business unit and top-tier risk registers remain key tools that help management to monitor
risks and evaluate the impact of individual risks on the business, and also to evaluate risks in the ‘aggregate’
across a broad spectrum of threats to overall business performance. In addition, this process facilitates the
identification of those risks that are determined to be the business’ ‘principal risks’, as defined in the revised
Code.
The Board has met regularly during the year and has assessed the level of risk that it is willing to accept in
respect of Anglian Water’s strategic priorities for customers and the environment. For each strategic
outcome we have identified the principal threats that might put the achievement of those outcomes at risk.
Management also considers new, changing or emerging risks. Through a process of review and discussion
we have developed a methodology for setting an appropriate target position for each principal risk. Where
the existing level of risk is assessed as not meeting the target, additional controls or mitigating measures
are identified in order to reduce the risk to the target level. This is formally recorded in the top-tier risk
register referred to above. In addition, we link the principal risks to our assurance plan to ensure our focus
is on the most significant risks.
The Board has requested assurance that the controls implemented are tested and, where required are
externally tested. This assurance is delivered through business resilience planning and scenario testing,
health and safety audits and compliance, internal and external audit activities, external certification,
governance and compliance activities.
Principal risks
In this section we describe the group’s principal risks:
• Political, regulatory and legislative changes
• Financing our business
• Pensions
• Brexit
• Regional growth
• Long-term supply and demand resilience
• Pollutions
• Failure to deliver our AMP6 plan
• Preparing for ODI changes in AMP7
• Customer
• Health and safety
• Talent and succession
• Cyber security
• Water quality.
We present each risk with an overview of the risk status:
• An indication of the direction of the inherent risk – i.e. worsening/improving over the past year.
• Status of the actions to controlling the risks.
• Status of current risk position.
We will highlight the Board comfort around the current position of the risk. We report this as:
• RED: any mitigating action(s) and any business controls are found to require significant improvements to
manage the risk.
• AMBER: the risk is emerging or changing and action is in place to develop the mitigation actions and/or
through review any business controls are found to be not fully effective.
• GREEN: any mitigating action(s) are on course, and the business controls are in place and effective.
Only risks with a ‘red’ indicator will be reported as being representative of significant failings and areas of
concerns.
Osprey Acquisitions Limited
Strategic report (continued) for the year ended 31 March 2019
RISK MANAGEMENT
39
Political, regulatory and legislative changes
Unmitigated risk description (Amber)
We stay abreast of current political, regulatory and legislative matters that may affect our industry or
company.
Water companies have continued to be under the national spotlight in an environment where a set of
complex social, political and environmental challenges are moving higher up the political agenda.
The level of political and regulatory uncertainty means we see this range of risks, if unmitigated, as Amber.
Controls and mitigation (Green)
At the heart of our mitigation of these risks, is our delivering a strong business performance; complying with
our obligations; focusing on long-term planning; and enhancing resilience to protect our environment and
our services to our customers in the future.
We have also developed, at a sector-wide level, a ‘Public Interest Commitment’ that commits the entire
industry to deliver wider benefits to society and the environment, above and beyond the provision of clean,
fresh drinking water and effective treatment of recycled water.
There is an ongoing debate around public ownership of water companies. We are actively participating in
this, highlighting the achievements of the privatised companies, and the improvements the industry has
made, including through the Public Interest Commitment. We have also pointed out the risks to future
investment that public ownership could bring, and the potential harm to pension funds and pensioners if the
sector’s assets were acquired by the Government at below market value. We argue that the focus should be
on how the sector can urgently respond to the meta-challenges of climate change and growth and ensuring
that resilience is enhanced, rather than focus on ownership issues.
We also ensure compliance with current legislation, influence the shape of new policy and forthcoming
legislation, and monitor the potential impacts of new legislation.
To manage compliance we have numerous business controls and processes, including a legal risk register, as
well as our online training system, which we have used to ensure adequate awareness across the business
of the risks associated with breaches of legislation such as the Competition Act, Data Protection Act and
Bribery Act.
We are embedding improvements in our policies, processes and systems which are designed to ensure that
we comply with the requirements of the General Data Protection Regulation (GDPR). In the course of the
past 12 months we have updated our privacy notices, improved our processes for dealing with Subject
Access Requests and raised awareness of the potential impact of data breaches. The business routinely
undertakes Privacy Impact Assessments to ensure our processes and systems are compliant.
The Company’s employees also maintain Level Playing Field training so they understand how to behave and
operate in the non-household retail market to minimise the risk of anticompetitive behaviour and ensure
compliance with competition law and regulatory requirements.
Anglian Water’s anti-bribery strategy is supported by the ISO 37001 Anti Bribery Management System, with
processes aligned with the Integrated Management System (IMS) framework. This system, externally
certificated by Lloyds Register, helps to ensure processes and controls are effective in ensuring ongoing
compliance with antibribery legislation.
All senior managers are required to confirm that employees within their business unit have taken
appropriate steps to comply with the policies that deal with the legislative risks set out above, including
completing training where required to do so and, in the case of our anti-bribery strategy, complying with our
gifts and corporate hospitality policy.
Current risk assessment (Green/Amber)
We assess our current risk position in relation to the threat of nationalisation as Amber, notwithstanding the
strength of our controls and mitigation and the enhanced level of influencing that we have delivered at a
national policy level and with regulators.
Osprey Acquisitions Limited
Strategic report (continued) for the year ended 31 March 2019
RISK MANAGEMENT
40
On all other areas, our risk assessment is green, as we have confidence in the relevant business controls to
ensure legislative compliance and manage regulatory risk.
We will continue to monitor, test and audit compliance with legislation to maintain a high level of assurance
and to highlight any areas requiring action.
Financing our business
Unmitigated risk description (Amber)
We are funding a totex programme of £5 billion in AMP6 and have gross debt within Anglian Water of £6.8
billion to manage and service. Recognising recent challenges from the Government and our economic
regulator, we are showing this risk as increasing; however we have responded to these challenges with a
commitment to reduce shareholder dividends and gearing and have improved the transparency and clarity of
our financial structure. The volatility in the financial markets and the continued uncertainty around the
Brexit process and other world events lead us to continue to maintain a strong focus on this risk, hence an
Amber status.
Controls and mitigation (Green)
It is critical that we have robust financing and liquidity management arrangements in place. Revenue from
our customers, together with the proceeds of new debt raised, will finance the totex programme. Our debt
comprises long-term public and private bonds and other debt instruments, with equity (shares) financing the
remainder of our Regulatory Capital Value (RCV). We ensure access to a diversified source of debt across a
range of maturities to minimise the refinancing risk, and interest rates are linked to Inflation (the Retail
Price Index (RPI) and Consumer Price Index (CPI)), fixed nominal levels or variable nominal rates in
accordance with the Board approved Treasury Policy.
Net debt accounts for approximately 78.1% of Anglian Water’s regulatory capital value as at 31 March 2019,
as measured in our financial covenants agreed with our debt providers. The debt-funding structure was
established in 2002 and has resulted in our cost of capital being consistently lower than the industry
average, producing lower bills for our customers. Our focus is on maintaining stable credit ratings and a
strong liquidity and cash position, which we manage through cash and investments, together with available
banking facilities and having a diverse debt portfolio in terms of source and maturity. We manage our
financing risks through regular senior level meetings held with banks, ratings agencies and bond holders,
along with internal monitoring of our treasury strategy and liquidity, energy and covenant policies through
our Finance, Treasury and Energy Policy Group. We also work closely with the regulator and undertake a
number of sensitivity scenarios, as we agree our business plan for the next five years. This is to ensure that
our future funding reflects a level that is financeable in the long-run.
Current risk assessment (Green/Amber)
The decisive Board and shareholder action has enhanced our financial robustness through significantly
reducing dividends and by reducing gearing. We will continue to monitor external factors that may impact
the business, and will also test and audit compliance with legislation as well as our finance contracts to
maintain a strong level of assurance and to highlight any areas requiring action.
Pensions
Unmitigated risk description (Amber)
The risk is that the funding levels in the Anglian Water Group Pension Scheme (AWGPS) deteriorate,
requiring the group to inject additional funds. The last triennial valuation was on 31 March 2017 and we
have since agreed a revised funding plan with the Trustees that will continue through to 2026. Due to
continuing low interest rates and gilt returns, the deficit remains at risk, particularly with the volatility in the
financial markets being caused by Brexit. However, the risk has been mitigated as the pension scheme is no
longer open to future accrual and the company is supporting a members’ independent advisory proposal that
supports employees in deciding whether it is in their best interests to remain a member of the Scheme. No
additional years of service are now being added to the pension liability. The liability continues to be subject
to risks such as lower investment returns, high inflation, low discount rates and longevity.

Osprey Acquisitions Limited
Strategic report (continued) for the year ended 31 March 2019
RISK MANAGEMENT
41
Controls and mitigation (Green)
Following an extensive consultation with our employees, employee representatives and Trustees, the AWGPS
was closed to future accrual from 1 April 2018. A deficit recovery plan was agreed with the Trustees and
work is under way to mitigate risks further, such as volatility caused by higher levels of inflation and lower
levels of interest rates. Further interest rate and inflation hedging and de-risking of return-seeking assets
through equity sales were undertaken prior to March 2019, and quarterly increases over the next five years
have been agreed together with ‘calls to action’ in the event of market movements, causing a significant
change to the recovery plan.
The Strategic Pensions Group has been established to agree and monitor an investment strategy between
the group and Trustees. The long-term aspiration is for the pension scheme to have a portfolio of assets that
can fully match future cash flows with an acceptable level of risk and return, at an affordable cost. The aim
is for the scheme to be self-sufficient by 2026.
Current risk assessment (Green/Amber)
Over the past year this risk has stabilised, due to actions taken. We continue to monitor market conditions.
Regional growth
Unmitigated risk description (Amber)
As one of the fastest-growing areas in the UK, managing the forecast rise in population in our region is one
of our most significant long-term challenges.
As economic conditions in the UK improve, the number of new developments is increasing, and meeting the
growth in demand for new services remains a key area of focus for the business.
Controls and mitigation (Green)
We invest considerable effort in forecasting our supply and demand requirements at a local and a regional
level for the next 25 years. We continually assess our investment options to identify the most cost-effective
combination of new water resources, network enhancements and demand management measures to meet
this challenge. We are also championing the use of sustainable drainage techniques in place of piped
systems, as a more environmentally sound way of managing surface water in our growing region. We are
also working as part of the Water Resources East initiative and National Water Resources Long-Term
Planning Framework to develop long-term solutions to water resources, and our draft Water Resources
Management Plan (WRMP) outlines an ambitious, cost beneficial, demand management strategy that is
forecast to offset the impacts of growth in our region.
Current risk assessment (Green)
Current growth in our region is in line with our AMP6 and AMP7 plans. We have not seen an increase in this
risk over the past year, although the longer term is more uncertain.
Long-term supply climate change
Unmitigated risk description (Amber)
Ensuring our business is resilient to long-term supply and demand requirements is a stretching target but
critical to fulfil our customers’ needs. Climate change is a major challenge to our business that can impact
our assets and service to our customers. We operate in the driest region of the UK, classed as ‘water
stressed’ by the Environment Agency, and our low-lying region makes us particularly vulnerable to localised
flooding during severe weather events. We see the inherent risk continuing to increase for the business, with
the effects of climate change, customer demand and environmental challenges, hence an Amber status.
Controls and mitigation (Amber)
We have been active in the past year, working at a national level on the Long-Term Water Resources
Strategy, complemented by the Water Resources East initiative and our Water Resources Management Plan
(WRMP).

Osprey Acquisitions Limited
Strategic report (continued) for the year ended 31 March 2019
RISK MANAGEMENT
42
We published our first Water Recycling Long-Term Plan (WRLTP) in September 2018, framed by our
Strategic Direction Statement and supporting our AMP7 Business Plan. Our first WRMP equivalent for water
recycling is industry leading. It provides transparency of our business planning processes for managing the
supply of water recycling services to meet the demands of a growing population, and allows us to respond to
and influence the external market. The WRLTP considers risk from growth, climate change, urban creep,
severe drought and customer behaviours. It promotes sustainable solutions for maintaining reliable and
affordable levels of service and facilitates working in partnership to mitigate flood risk.
Leadership on climate change adaptation continues to be provided by our Climate Change Steering Group
working alongside our Resilience Steering Group. Adapting to a changing climate remains at the heart of our
updated Strategic Direction Statement 2020–2045, and this year we have developed a Framework for
Resilience that will allow us to test our current and future plans to ensure we become increasingly resilient
to climate change.
More than 20 years ago, we started incorporating climate change in our WRMPs, and in March 2018 we
published, for consultation, a draft of our latest WRMP. The plan ensures we are resilient against the median
climate change scenario and severe drought. Through the consultation we are also seeking support from our
customers for £500 million of investment, which would further mitigate the impact of climate change,
drought and future environmental challenges.
We believe that climate change is increasing the risk of flooding of our sites and from our sewers. Therefore,
we are continuing to collaborate with other stakeholders to understand the impact of climate change and
mitigate these risks. For example, the AMP6 Business Plan included an £8.4 million Partnership Funding
programme to reduce the risk of surface water, fluvial or coastal flooding and the impact of coastal erosion
across 52 sites, to protect our assets and/or our customers. We have also spent just over £1.1 million on
flood resilience schemes protecting our high-risk sites across water and water recycling, a total of 36 sites.
It remains vital that we prepare for severe weather, both today and in the future. Our Resilience Steering
Group takes an overview of activities to manage resilience risks, while our Flood Emergency Response Plans
(FERPs) are in place and are regularly reviewed for both water and water recycling higher risk sites. In
addition, we work with other agencies, including the Environment Agency, to understand and use flood risk
warning technology.
We continue to invest to deliver our leakage targets, which helps mitigate the impact of extended dry
periods. Our WRMP outlines our ambitious future demand management strategy, including significant
investment in AMP7 to continue to drive down leakage, install smart meters across our region and roll out
our water saving measures.
The level of risk associated with climate change and drought in the long term is material and hence our
assessment of this risk is Amber.
Current risk assessment (Amber)
We are seeing changing and severe weather patterns result in greater challenges to our continued service to
customers. Our operational incident room has been open more often in the last year than ever before to
manage these events and ensure customer impact is minimal. We are investing to ensure resilience in our
supply system and will continue to prepare to mitigate risks from severe weather events. Long-term supply
demand issues will also be high on the radar, and planning will continue to ensure we are well prepared and
have adopted a series of measures to reduce the potential impact.

Osprey Acquisitions Limited
Strategic report (continued) for the year ended 31 March 2019
RISK MANAGEMENT
43
Pollutions
Unmitigated risk description (Amber)
Leaks, spills and escapes from our network, combined with the overall serviceability of the infrastructure,
have the potential to cause pollution, damaging or endangering the natural environment.
Such incidents are classified by the Environment Agency (EA) and, depending on their severity, can lead to
prosecutions and financial penalties. While such events are rare, their potential to cause environmental harm
and reputational damage to the group, and the fines they attract, make them a significant risk. We have
seen this unmitigated risk to the business increase due to the scale of fines that are being imposed by the
EA, increased scrutiny from our customers and the reputational impact associated with pollution events,
hence an Amber status.
Controls and mitigation (Green)
Anglian Water has set a goal of no pollutions. All incidents, the associated response, mitigation and
preventative actions are reported to and monitored by senior management. We have a wide programme of
activities to reduce pollution incidents and improve our understanding of their causes. This includes:
• Investment on planned preventative maintenance to reduce blockages and consequent pollutions.
• A priority, ‘blue light’ or fast response for areas with historical pollution risk and/or significant
environmental sensitivity.
• Investment in new technology for remote monitoring of discharges. This has been installed at key points
on the network, both inland and coastal.
• Continuing to enhance our systems to achieve real-time monitoring and reporting of pollution incidents,
to provide a one-stop shop for pollution information and analytics to support targeted investment.
• Aligning our internal processes and procedures to meet changes to Environment Agency guidance.
• Extension of our Pollution Watch campaign targeted at the public and river users to encourage earlier
engagement with resolution of any potential incident.
• Making a step change in pollution management by attempting to predict where incidents could occur in
our network, with proactive inspections of high-risk assets.
• Investment in flow monitoring on rising mains and smart pump control across 250 high-priority pumping
stations.
• Continuing to work on improving our self-reporting of potential pollution events to the Environment
Agency by getting the right information from the field quickly, utilising our telemetry systems to make an
assessment of probability and working to improve our monitoring and handling of events.
Current risk assessment (Green)
We made good progress over the past year in reducing pollutions, and will continue to look to improve our
performance for both our water and water recycling assets.
Failure to deliver our AMP6 plan
Unmitigated risk description (Green)
The delivery of our AMP6 plan, our commitments to our customers and the quality and efficiency of our
operations are vital to our success – keeping our costs under control helps to minimise our customers’ bills
and is an important measure of our performance within the regulatory structure.
Our performance is linked to significant penalties or rewards under the system of Outcome Delivery
Incentives (ODIs). This represents a significant financial risk to the business if we fail to meet the required
standard in a number of areas.
Controls and mitigation (Green)
Delivery of our outcomes (and delivery of the ODIs) has required us to adapt our business strategies. We
have a detailed programme of investment and improvements to processes, assets and infrastructure to fulfil
our customer requirements and improve their experience. We are moving to ever more proactive, targeted
and efficient ways of working, and better, smarter use of systems and data. We are increasing collaboration
across the business, with key stakeholders and with customers. We aim to continuously monitor and
improve our performance to achieve and exceed the measures set.
Osprey Acquisitions Limited
Strategic report (continued) for the year ended 31 March 2019
RISK MANAGEMENT
44
We have delivered significant cost efficiencies across our capital and operating costs in the past, and will
continue to drive out costs in AMP6 while refocusing expenditure to adapt to regulatory changes and ODI
performance.
Examples of projects we have implemented include the following:
• Integrating our supply chain into the business; for example, through four main delivery alliances.
• Developing our strategies to reduce costs across our supply chain, refining our procurement and sourcing
strategy.
• Pursuing energy efficiency and energy optimisation of our treatment and distribution systems,
implementing new and leading monitoring systems to improve energy consumption.
• Encouraging business units to implement smaller, locally driven initiatives, drawing on our Love Every
Minute programme (based on Lean and Six Sigma methodologies).
• Carrying out rigorous root cause analysis early on in our capital delivery process to ensure we provide the
right whole-life cost solutions.
• Focusing on both cost and carbon, and the relationship between them, to find innovative ways of
providing sustainable solutions.
• Developing a range of initiatives to ensure that we maximise our use of standard products and build off-
site options to reduce both cost and time on site.
• Investment in the delivery of our ODIs to maximise success for our customers. For example,
Interruptions to Supply, Leakage, Catchment and Coastal Management and Pollutions.
• Further developing our Shop Window to innovate and drive investment for an improved customer
experience and to meet our goals for water efficiency in the future.
Current risk assessment (Green)
We continue to make good progress. Our efficiency in delivery has been essential to mitigate the impact of
additional costs that were not included in prices. Being successful in AMP6 has required Innovation,
Collaboration and Transformation to continue delivering cost efficiencies while ensuring strong performance
on our ODIs.
Preparing for ODI changes in AMP7
Ofwat’s final methodology for PR19 was published in December 2017. It sets out a very challenging
framework for companies during AMP7, with an indicative weighted average cost of capital (WACC) of 2.4%,
and very stretching expectations of performance. In April 2018, Ofwat published a further consultation,
‘Putting the Sector Back in Balance’, which proposed a number of changes to the final methodology,
including proposals to share financing outperformance. Together, these changes saw ratings agency Moody’s
move Anglian Water and a number of other companies to a ‘negative outlook’ rating in May 2018. Ahead of
its final determination in December 2019, Ofwat published in January 2019 its initial assessment of business
plans, which reaffirmed Ofwat’s position on increasing the challenge in AMP7.

Osprey Acquisitions Limited
Strategic report (continued) for the year ended 31 March 2019
RISK MANAGEMENT
45
Unmitigated risk description (Amber)
Ofwat’s final methodology sets out the regulatory expectations for companies’ ODIs for AMP7.
These include:
• The expectation that a higher percentage of return of regulatory equity (RORE) should be associated with
ODI performance in AMP7 compared to AMP6.
• Conversely, companies failing to achieve their ODI targets should expect to receive higher
underperformance payments (penalties).
• The likelihood of an increase in the incentives around Asset Health measures (formerly Serviceability).
• Expectations that companies’ proposed performance commitments levels for ODIs in AMP7 should be
considered stretching, influenced both by heightened expectations and reflecting on rewards paid out to
some companies in AMP6.
• Expectations for some core common measures on interruptions to supply, pollution incidents and internal
sewer flooding to be set at the forecast future upper-quartile level.
• Rewards and penalties for ODIs should by default be financial in nature and be paid ‘in-period’ rather
than at the end of the AMP.
• The likelihood of ‘enhanced’ rewards and penalties for either exceptional frontier shifting performance or,
conversely, very poor service.
While there is the opportunity to earn higher rewards for exceptional performance, AMP7 will see an
increased challenge around ODI targets.
Controls and mitigation (Amber)
The central core mitigation is the development of the PR19 Business Plan submission. The production of a
high-quality, well-evidenced and assured submission provides confidence to Ofwat that our proposals are
robust and align with regulatory expectations.
In setting our outcomes, we have implemented a dedicated workstream as part of the PR19 programme.
The workstream is responsible for the development of our outcomes to ensure they reflect customer
priorities, are based on high-quality valuation and cost evidence, and also that they reflect the current and
future business focuses – for example, linking back to our long-term ambitions as set out in our 2017
Strategic Direction Statement. A key part of our ODI strategy is to target a net reward in AMP7, including
targeting enhanced rewards on leakage, reflecting our sector-leading performance.
Current risk assessment (Amber)
We are confident in the PR19 business delivering a suite of robust proposals, recognising that Ofwat has a
significant role in finalising the final shape of our ODI levels and incentives.
Brexit
Unmitigated risk description (Amber)
The UK’s withdrawal from the European Union is the single biggest constitutional and legal exercise in
decades. Unmitigated, there is potential for far-reaching implications for the business, including:
• Implications for the supply chain, including increased costs if there are new tariffs on goods (like
chemicals, parts and materials), and delays from customs checks and duties.
Restricted access to finance from the European Investment Bank, as the UK has signalled it no longer
wishes to be a member but wishes to explore a future relationship.
Restricted access to EU labour markets. At present, Anglian Water’s exposure to this risk is low in terms
of the number of our directly employed workforce originating from the EU. The skills shortage facing
Anglian Water owes more to an ageing workforce rather than a migrant workforce. However, there will
likely be restrictions on future labour market access when freedom of movement ends and this will
further exacerbate an industry-wide challenge.
Risk that some domestic policy issues may not be addressed until after Brexit negotiations have
concluded, given the resources being dedicated to Brexit.
Political instability linked to Brexit, such as an early general election, and the threat of renationalisation.
Osprey Acquisitions Limited
Strategic report (continued) for the year ended 31 March 2019
RISK MANAGEMENT
46
Controls and mitigation (Amber)
Continual high-level assessment of the risks and opportunities from Brexit has been undertaken at
Management Board meetings since the 2016 referendum. This has been complemented by an increased
focus on engaging with politicians and policymakers to ensure we establish Anglian Water as an influential
stakeholder and that our messaging and priorities are being received. This includes a much more proactive
participation in the parliamentary and governmental policymaking process through submissions to more
Government consultations, parliamentary select committee inquiries and face-to-face engagements with
senior figures. This approach has been successful as we have seen our submissions having real influence in
the recommendations of parliamentary committee reports, repeated invitations to give oral evidence and an
increasing parliamentary profile. Additionally, an organisational restructure has created the Public Policy and
Regional Engagement teams, with extra resources being allocated to enhance the group’s reputation and
engagement with elected officials.
Practically speaking, we are using Brexit as an opportunity to innovate and explore alternative solutions to
the risks. Examples of this include:
• Becoming the first public utility to issue Green Bonds to finance our portfolio of capital projects. This
offers a new avenue of finance on terms not dissimilar to those offered by the European Investment
Bank.
• Our involvement in the regional skills agenda continues to grow, through the Greater Peterborough
University Technical College, College of West Anglia and our own Community Education team, as we seek
to address the skills gap with home-grown talent. Additionally, our graduate and apprenticeship
programmes are expanding to meet the skills challenge.
• We continue to demonstrate Anglian Water’s leadership as a responsible business. In addition to recent
accolades, Anglian Water is at the heart of industrywide efforts to improve public perceptions of the water
sector, to ensure that it operates in the public interest.
Elsewhere, we have established a Brexit sub-group that brings together business leaders to coordinate the
Brexit preparations, particularly for a no-deal scenario. Preparations taken have included increasing baseline
stocks of key parts and materials, diversifying our supply chain, altering operational practices where
possible, and increasing storage space and security. This group meets on a weekly basis and feeds into the
Water UK-led group that is working with Defra to ensure business continuity.
Current risk assessment (Amber)
This risk remains Amber as we continue to plan for the possibility of a No Deal Brexit on 31 October 2019
and the associated implications.
Customer satisfaction
Unmitigated risk description (Green)
The customer measure of experience (C-MeX) is a mechanism to incentivise water companies to provide an
excellent customer experience for residential customers, across both the retail and wholesale parts of the
value chain. The Service Incentive Mechanism (SIM) will be replaced by this alternative incentive
mechanism, C-MeX. 2019/20 will be a ‘shadow year’ as the new methodology is finalised, with only the
reputational incentives applied. C-MeX comprises two survey elements:
Customer Experience survey – a customer satisfaction survey among a random sample of the water
company’s customers; and
Customer Service survey – a customer satisfaction survey among a random sample of those who have
contacted their water company.
Our success depends on customers and stakeholders thinking highly of us following any interaction and of
those customers who have not contacted us but have an impression of Anglian Water as their service
provider. Our brand and marketing campaigns such as Keep it Clear, Water Efficiency and proactive service
notifications are some of the areas that we rely on to help improve our overall reputation. Unwanted media
attention – from print, broadcast or social media – has the potential to damage our reputation and erode
that trust.
Osprey Acquisitions Limited
Strategic report (continued) for the year ended 31 March 2019
RISK MANAGEMENT
47
At the same time, we will also be judged by our customers, who compare our service with that of the top UK
brands. They expect us to be as good, if not better. So there is also a reputational risk in failing to keep
pace with growing customer expectations, hence our continued and extensive investment to ensure a good
customer experience.
Controls and mitigation (Green)
Delivery of our AMP6 plan and customer outcomes has been critical in maintaining our reputation and our
performance over recent years has helped minimise the impact of this risk, avoiding poor publicity and
building on the positive work we carry out across communities and the environment.
It is important that our senior managers and others in key roles around the business are confident and well
informed when speaking to the media and in getting our messages across. We have a media training
programme in place for executive directors and others responsible for the day-today operation of the
business.
We carry out daily monitoring of both traditional and social media to identify corporate, industry and brand-
related issues of interest. This includes issues of wider interest to the business in broader areas of public
policy. Press cuttings are circulated under licence to selected directors and senior managers, and we work
more generally to raise awareness of the impact media coverage can have, and of the need for early alerts
to highlight sensitive or high-risk issues.
Daily monitoring of individual customer interactions with us is also undertaken in order to understand
emerging themes and issues and take mitigating actions.
We will undertake ‘mirror’ weekly customer satisfaction and monthly experience surveys to gather and
closely understand our customers’ thoughts and feedback. This will feed into our service design reviews and
process improvements.
We are also continuing to invest in new IT systems and training to ensure customers only need to contact us
once to resolve a problem, and that we respond ever more quickly to meet their needs.
Current risk assessment (Green)
We are satisfied with our current risk position, with necessary actions and controls in place.
Many elements will build on the plans we have this year; putting the customer at the heart of what we do
and building a strong and efficient business where our people feel empowered and inspired by where they
work.
We are undertaking an operating model review in order to set ourselves up for the next AMP from 2020 and
beyond, including new challenges and opportunities such as our customer affordability and vulnerability
strategies and smart metering.
Health and safety
Unmitigated risk description (Amber)
Maintaining the welfare of our employees and customers is paramount. Failing to understand and interpret
health and safety legislation, or to communicate and implement policies, procedures and instructions to
ensure safe working practices are understood and followed by all employees, could result in unnecessary
accidents and injuries to employees, contractors and customers. This could lead to Anglian Water being
prosecuted and, if found guilty, suffering reputational damage and significant fines. The inherent health and
safety risk has not changed over the past year; however, the potential impact of fines on the business has
increased with changes to the sentencing guidelines.
Osprey Acquisitions Limited
Strategic report (continued) for the year ended 31 March 2019
RISK MANAGEMENT
48
Controls and mitigation (Green)
The health and safety of our workforce, partners and the general public is a key priority. We are committed
to looking after our employees’ safety and believe that work should have a positive impact on their health
and wellbeing. The Management Board reviews health and safety performance and associated actions
monthly, including thoroughly reviewing all significant incidents as well as reporting them to the Board. An
in-depth into health and safety performance is also carried out on a quarterly basis. Performance is also
monitored through our OHSAS 18001 Certificated Safe and Well Management System, with six monthly
external reviews by LRQA as well as through our internal audit programme.
Our management systems track near-misses and actions from audits, inspections and accident/incident
investigations, as well as providing access to current policies and procedures and safe systems of work.
Throughout the business we have a series of health, safety and wellbeing networks that report to our
internal and external stakeholdrs so that best practice is shared and any issues or concerns can be
effectively managed. We also have a central Health & Safety Hub where we ensure all areas of the business
are consulted and engaged in any potential health and safety issues or changes.
Underpinning our approach is LIFE, a philosophy that focuses on health, safety and wellbeing and reflects
our vision of happier, healthier and safer employees. LIFE is about moving from a traditional compliance-
based approach to a culture where we take responsibility for our health, safety and wellbeing and that of our
colleagues. It will create a culture of care and concern where we look out for each other and make the right
choices. This is a long-term commitment – to date, we have run numerous health and wellbeing campaigns
focusing on the happier and healthier pillars of LIFE, which includes mental and physical health. We have
also held LIFE sessions where over 3,000 people, including personnel from our alliance partners, have
attended focusing on the safer element.
Our three-year health, safety and wellbeing plan ensures we are focusing on current and relevant areas and
potential high risks and that there are consistent standards across the company and our partner
organisations. The plan has five key outcomes – A healthier and safer work environment, positive
engagement and collaboration, high-risk activities managed, hazardous processes understood, and clear and
simple safety information. Progress on the plan is reviewed, giving assurance we are managing our potential
risks. One of the key focuses for the plan was to digitalise health and safety and to date we have seen IT
developed for incident reporting, for capturing active management, and also for health and safety training
using virtual reality and online learning tools.
Current risk assessment (Green)
We will always remain vigilant to maintain the highest health and safety behaviour in the business, looking
for improvements and learning from others. With current mitigations and initiatives, this risk is stable.
Talent and succession
Unmitigated risk description (Green)
The performance of our business could be adversely affected by the loss of key talent and by ineffective
succession planning for key positions. At Board level, we need to plan effectively for a smooth succession for
the Chairman, individual Non-Executive Directors, the CEO and CFO. Substantial change in the composition
of the Board could destabilise its effective functioning and the relationships between Executive Management,
Non-Executive Directors and shareholders.
Controls and mitigation (Green)
Our succession-planning processes are fully embedded, with rigorous analysis to check the quality and depth
of succession pipelines for key posts. We look 10 years ahead, identifying and developing candidates for
these posts, with external market mapping used where appropriate.
Extensive development programmes are in place, building future talent at graduate middle and senior
management levels, and we continue to invest in career development support for graduates and apprentices
to maximise retention and progression. There is also a Diversity Action Plan in place to keep the promotion
and retention rate of talented female managers under review.

Osprey Acquisitions Limited
Strategic report (continued) for the year ended 31 March 2019
RISK MANAGEMENT
49
Pension freedoms and the publicity around them may mean that more experienced members of staff with
specialist knowledge may consider early or partial retirement. A proactive approach to identifying those staff
has been undertaken, and succession plans are well advanced to mitigate any impact that this may have.
Senior managers, key skills and talent are covered by Long-Term Incentive Plan (LTIP) schemes, retention
bonuses and non-financial retention arrangements, including active development plans. Executive
management carries out regular and formal reviews of our succession-planning process and talent pipelines,
using external advisors where appropriate.
Current risk assessment (Green)
There has not been a change in this risk status over the past year, with the Board reviewing our succession
plans annually.
Cyber security
Unmitigated risk description (Amber)
Cyber risk is a high priority for the business; over the last year the volume and complexity of threats
targeting companies in our sector have continued to increase with publicly acknowledged nation state actors
operating in the utilities sector in both the UK and US. We have responded accordingly to protect our data
and information; hence this risk is Amber.
Controls and mitigation (Amber)
We seek to mitigate this risk with a clear cyber strategy and continual improvements to critical governance
and technical controls. This approach allows us to identify threats and introduce countermeasures to defend
our assets from attack, damage and loss. With the support of regular reviews by external experts who
assess both the suitability and effectiveness of these controls, this provides assurance that we have the right
measures in place to counter the threats we face.
In addition to enhancing technical controls, an ongoing awareness and education campaign continues to
modify employees’ behaviours towards cyber risk, with regular checks to test people’s understanding.
Additional vetting of new employees and an extension to our supplier risk assessment have been
implemented to support our security improvements.
Current risk assessment (Amber)
With cyber risk increasing, we are mitigating this risk with further training along with cultural and system
changes within the business. We are keeping abreast of the ever-shifting cyber landscape and actively
adapting our controls to minimise risk. However the overall and increasing risk is at Amber.
Water quality
Unmitigated risk description (Green)
The supply of safe, clean, high quality water is central to our business and underpins public health. Failure to
uphold the required standards in this most fundamental of services would have serious consequences for our
business and for our customers.
Controls and mitigation (Green)
We have a mature Drinking Water Safety Planning approach that meets regulatory requirements,
underpinned by our extremely robust Policies and Standards for Water Supply Hygiene (POSWSH). These
ensure that we manage water quality from source – through our water treatment works and water storage
points – and in our network of pipes into customers’ premises. We have a significant AMP6 capital
maintenance and quality enhancement programme to ensure that we maintain and improve our drinking
water quality and have recently received full support from the DWI for our PR19 quality enhancement
programme.
Regular audits are carried out both internally and externally. Water Services processes are externally
assessed annually by LRQA to ISO 9001 quality management and ISO 22301 business continuity
management system standards.
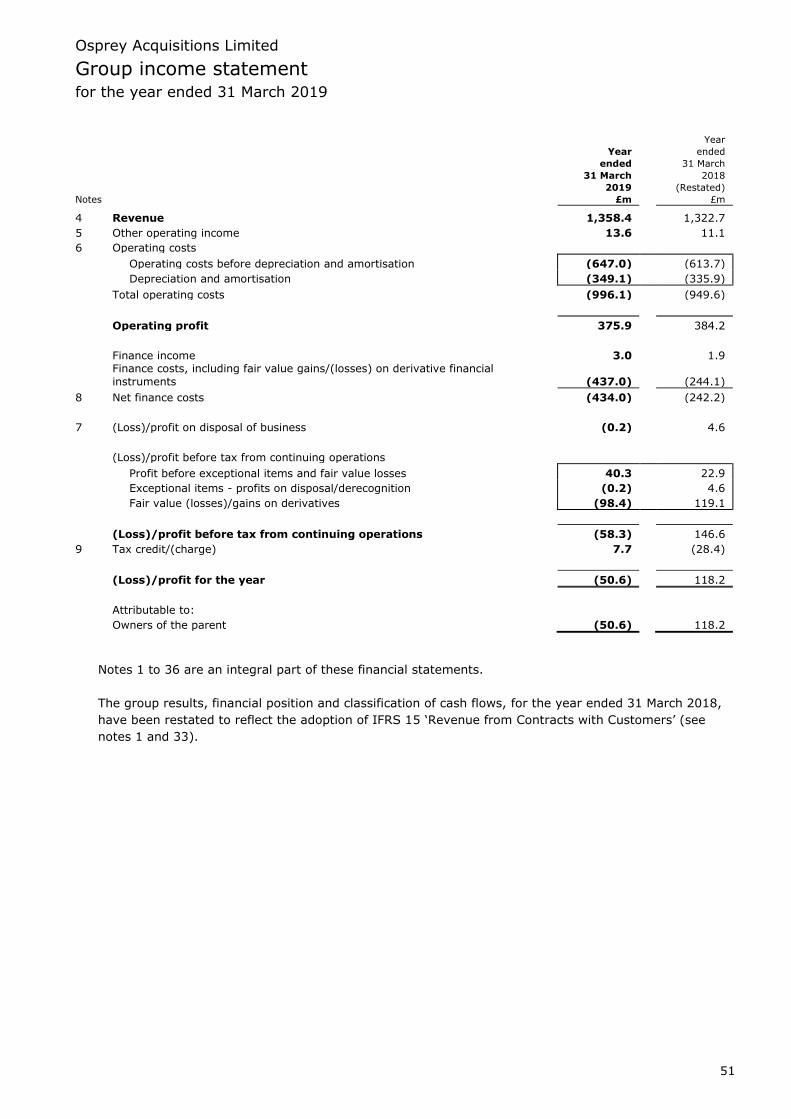
Osprey Acquisitions Limited
Group income statement for the year ended 31 March 2019
51
Year
Year ended
ended 31 March
31 March 2018
2019 (Restated)
Notes £m £m
4 Revenue 1,358.4 1,322.7
5 Other operating income 13.6 11.1
6 Operating costs
Operating costs before depreciation and amortisation (647.0) (613.7)
Depreciation and amortisation (349.1) (335.9)
Total operating costs (996.1) (949.6)
Operating profit 375.9 384.2
Finance income 3.0 1.9
Finance costs, including fair value gains/(losses) on derivative financial
instruments (437.0) (244.1)
8 Net finance costs (434.0) (242.2)
7 (Loss)/profit on disposal of business (0.2) 4.6
(Loss)/profit before tax from continuing operations
Profit before exceptional items and fair value losses 40.3 22.9
Exceptional items - profits on disposal/derecognition (0.2) 4.6
Fair value (losses)/gains on derivatives (98.4) 119.1
(Loss)/profit before tax from continuing operations (58.3) 146.6
9 Tax credit/(charge) 7.7 (28.4)
(Loss)/profit for the year (50.6) 118.2
Attributable to:
Owners of the parent (50.6) 118.2
Notes 1 to 36 are an integral part of these financial statements.
The group results, financial position and classification of cash flows, for the year ended 31 March 2018,
have been restated to reflect the adoption of IFRS 15 ‘Revenue from Contracts with Customers’ (see
notes 1 and 33).
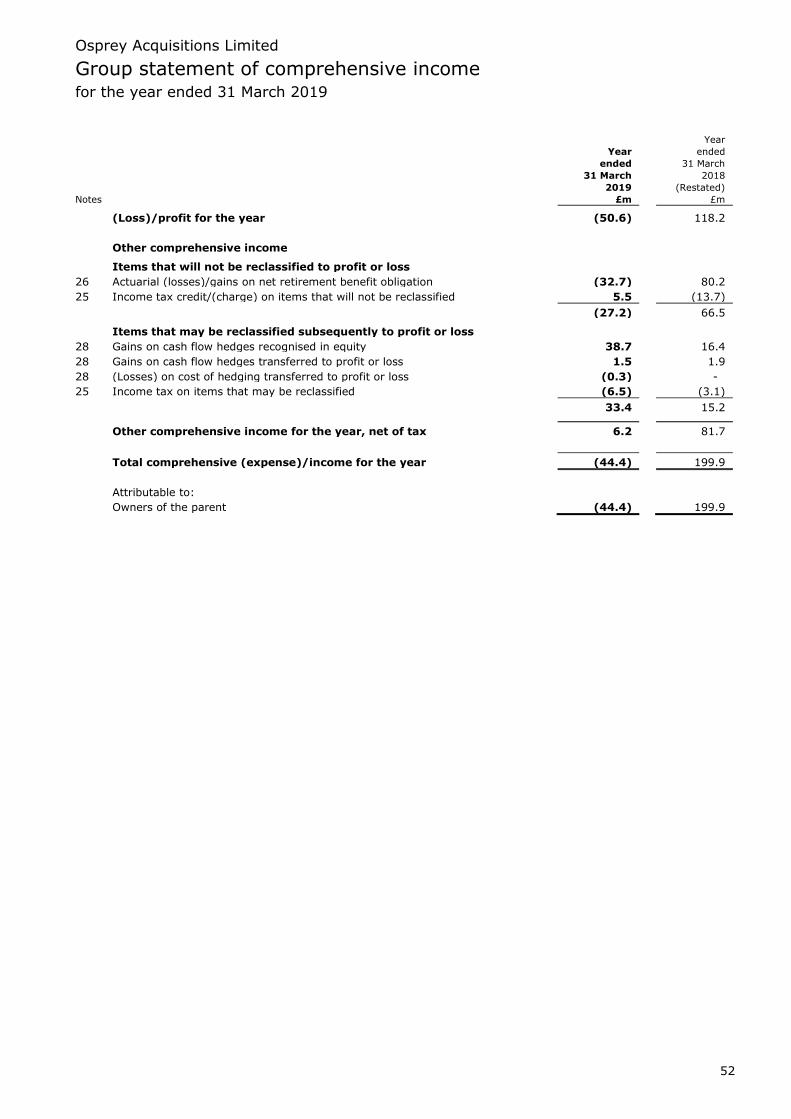
Osprey Acquisitions Limited
Group statement of comprehensive income for the year ended 31 March 2019
52
Year
Year ended
ended 31 March
31 March 2018
2019 (Restated)
Notes £m £m
(Loss)/profit for the year (50.6) 118.2
Other comprehensive income Items that will not be reclassified to profit or loss
26 Actuarial (losses)/gains on net retirement benefit obligation (32.7) 80.2
25 Income tax credit/(charge) on items that will not be reclassified 5.5 (13.7)
(27.2) 66.5 Items that may be reclassified subsequently to profit or loss
28 Gains on cash flow hedges recognised in equity 38.7 16.4
28 Gains on cash flow hedges transferred to profit or loss 1.5 1.9
28 (Losses) on cost of hedging transferred to profit or loss (0.3) -
25 Income tax on items that may be reclassified (6.5) (3.1)
33.4 15.2 Other comprehensive income for the year, net of tax 6.2 81.7
Total comprehensive (expense)/income for the year (44.4) 199.9
Attributable to:
Owners of the parent (44.4) 199.9
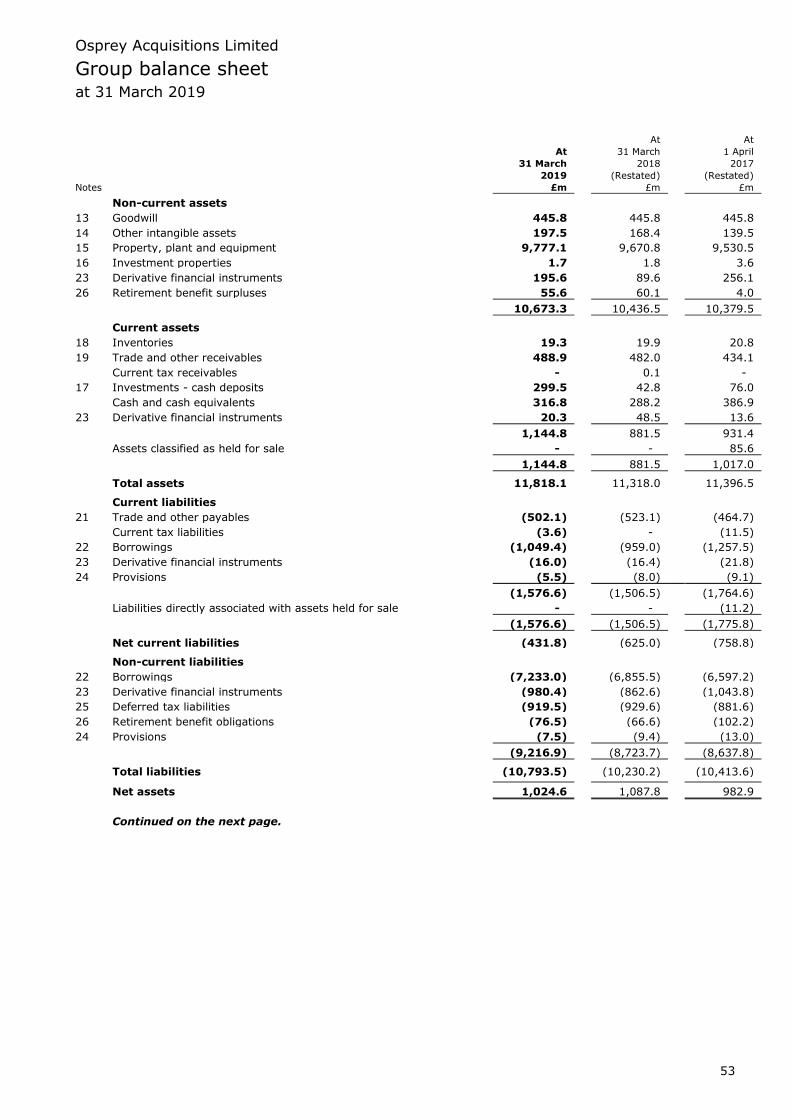
Osprey Acquisitions Limited
Group balance sheet at 31 March 2019
53
At At
At 31 March 1 April
31 March 2018 2017
2019 (Restated) (Restated)
Notes £m £m £m
Non-current assets
13 Goodwill 445.8 445.8 445.8
14 Other intangible assets 197.5 168.4 139.5
15 Property, plant and equipment 9,777.1 9,670.8 9,530.5
16 Investment properties 1.7 1.8 3.6
23 Derivative financial instruments 195.6 89.6 256.1
26 Retirement benefit surpluses 55.6 60.1 4.0
10,673.3 10,436.5 10,379.5
Current assets
18 Inventories 19.3 19.9 20.8
19 Trade and other receivables 488.9 482.0 434.1
Current tax receivables - 0.1 -
17 Investments - cash deposits 299.5 42.8 76.0
Cash and cash equivalents 316.8 288.2 386.9
23 Derivative financial instruments 20.3 48.5 13.6
1,144.8 881.5 931.4
Assets classified as held for sale - - 85.6
1,144.8 881.5 1,017.0
Total assets 11,818.1 11,318.0 11,396.5 Current liabilities
21 Trade and other payables (502.1) (523.1) (464.7)
Current tax liabilities (3.6) - (11.5)
22 Borrowings (1,049.4) (959.0) (1,257.5)
23 Derivative financial instruments (16.0) (16.4) (21.8)
24 Provisions (5.5) (8.0) (9.1)
(1,576.6) (1,506.5) (1,764.6)
Liabilities directly associated with assets held for sale - - (11.2)
(1,576.6) (1,506.5) (1,775.8)
Net current liabilities (431.8) (625.0) (758.8) Non-current liabilities
22 Borrowings (7,233.0) (6,855.5) (6,597.2)
23 Derivative financial instruments (980.4) (862.6) (1,043.8)
25 Deferred tax liabilities (919.5) (929.6) (881.6)
26 Retirement benefit obligations (76.5) (66.6) (102.2)
24 Provisions (7.5) (9.4) (13.0)
(9,216.9) (8,723.7) (8,637.8)
Total liabilities (10,793.5) (10,230.2) (10,413.6) Net assets 1,024.6 1,087.8 982.9
Continued on the next page.

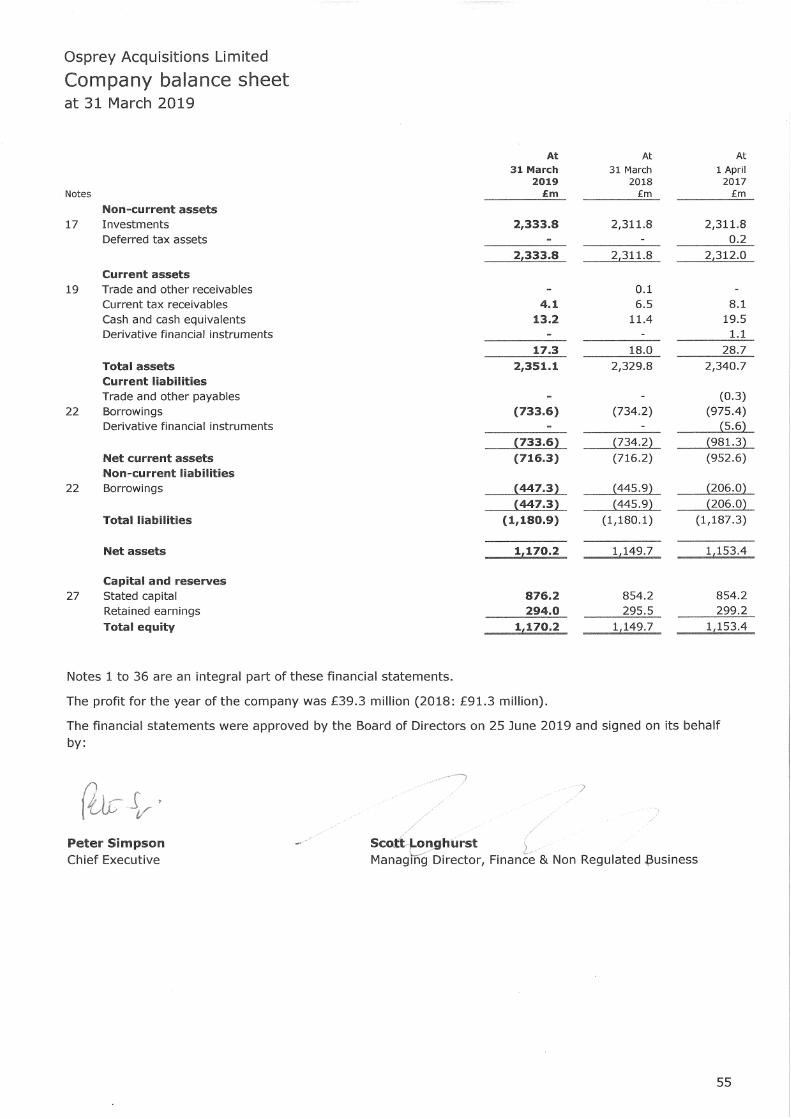

Osprey Acquisitions Limited
Group statement of changes in equity for the year ended 31 March 2019
56
(Accumulated
losses)/ Cost of
Stated retained Hedging hedging Total
capital earnings reserve reserve equity
£m £m £m £m £m
Year ended 31 March 2019
At 1 April 2018 (as previously reported) 854.2 (118.3) (105.3) - 630.6
Change in accounting policy
IFRS 9 - 2.0 (3.8) 1.8 -
IFRS 15 - 457.2 - - 457.2 At 1 April 2018 (restated) 854.2 340.9 (109.1) 1.8 1,087.8 Loss for the year - (50.6) - - (50.6)
Other comprehensive (expense)/income for the year - (27.2) 33.2 0.2 6.2
Total comprehensive (expense)/income - (77.8) 33.2 0.2 (44.4) Share issue 22.0 - - - 22.0
Dividends (see note 12) - (40.8) - - (40.8)
At 31 March 2019 876.2 222.3 (75.9) 2.0 1,024.6
Year ended 31 March 2018 (restated)
At 1 April 2017 (as previously reported) 854.2 (168.0) (120.5) - 565.7
Change in accounting policy - IFRS 15 - 417.2 - - 417.2 At 1 April 2017 (restated) 854.2 249.2 (120.5) - 982.9 Profit for the year - 118.2 - - 118.2
Other comprehensive income for the year - 66.5 15.2 - 81.7
Total comprehensive income - 184.7 15.2 199.9 Dividends (see note 12) - (95.0) - - (95.0)
At 31 March 2018 (restated) 854.2 338.9 (105.3) - 1,087.8
The hedging reserve represents the cumulative effective portion of gains and losses arising on the change in
fair value of hedging instruments excluding those fair value movements identified as costs of hedging within
the specific hedge relationship. The cost of hedging reserve captures the movement in the fair value of the
cost of hedging component (see note 28).
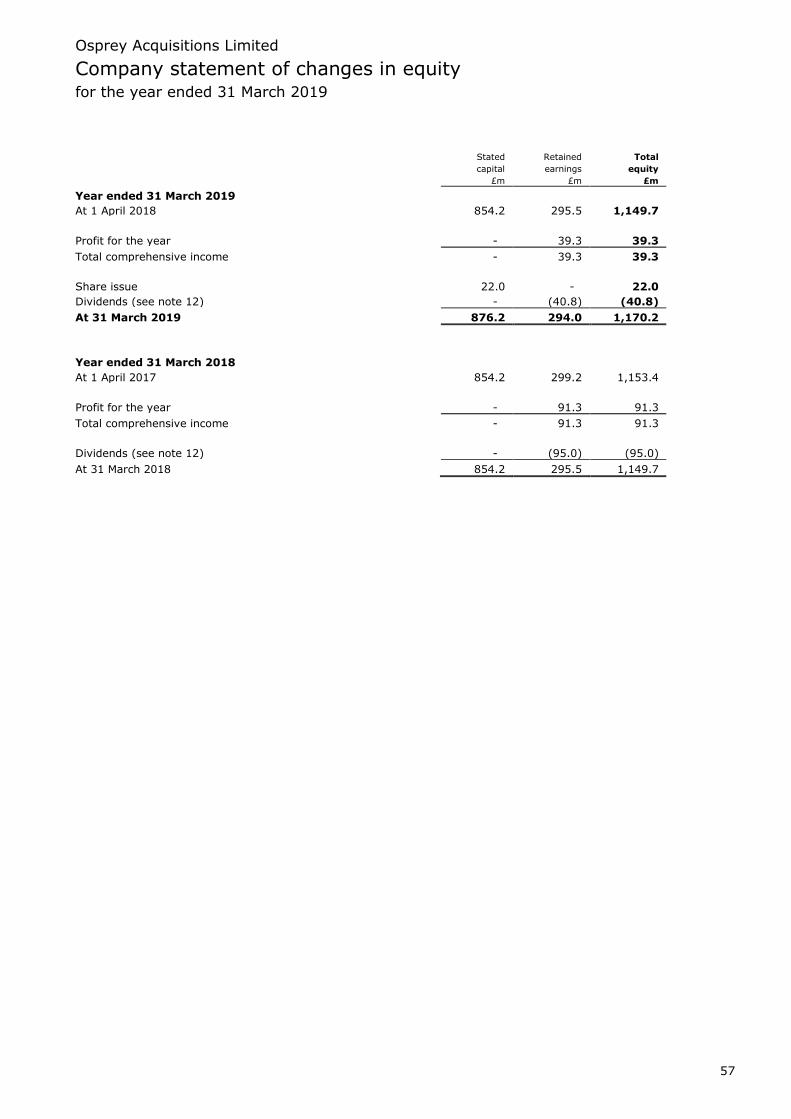
Osprey Acquisitions Limited
Company statement of changes in equity for the year ended 31 March 2019
57
Stated Retained Total
capital earnings equity
£m £m £m
Year ended 31 March 2019
At 1 April 2018 854.2 295.5 1,149.7
Profit for the year - 39.3 39.3
Total comprehensive income - 39.3 39.3
Share issue 22.0 - 22.0
Dividends (see note 12) - (40.8) (40.8)
At 31 March 2019 876.2 294.0 1,170.2
Year ended 31 March 2018
At 1 April 2017 854.2 299.2 1,153.4
Profit for the year - 91.3 91.3
Total comprehensive income - 91.3 91.3
Dividends (see note 12) - (95.0) (95.0)
At 31 March 2018 854.2 295.5 1,149.7

Osprey Acquisitions Limited
Group and company cash flow statements for the year ended 31 March 2019
58
Group Company
Year
Year ended Year Year
ended 31 March ended ended
31 March 2018 31 March 31 March
2019 (Restated) 2019 2018
Notes £m £m £m £m
Operating activities
Operating profit 375.9 384.2 (0.2) (0.1) Adjustments for:
Depreciation and amortisation 349.1 335.9 - -
Assets adopted for £nil consideration (22.0) (20.9) - -
Loss on disposal of property, plant and equipment (1.2) (0.9) - -
Disposal of investment properties - 1.8 - -
Difference between pension charge and cash contributions (18.0) (13.8) - -
Net decrease in provisions (4.6) (4.9) - -
Working capital:
Decrease in inventories 0.6 0.9 - -
(Increase)/decrease in trade and other receivables (7.0) (47.9) 0.1 (0.1)
Increase/(decrease) in trade and other payables 9.1 39.7 - (0.3)
Cash generated from operations 681.9 674.1 (0.1) (0.5)
Income taxes received/(paid) 0.3 (8.8) 6.5 8.1
Net cash flows from operating activities 682.2 665.3 6.4 7.6
Investing activities
Disposal of business, net of cash disposed (see note 7) (0.2) 79.0 - -
Increase in investment in/loans to subsidiaries - - (22.0) -
Purchase of property, plant and equipment (405.6) (385.4) - -
Purchase of intangible assets (64.8) (64.4) - -
Proceeds from disposal of property, plant and equipment 1.6 1.6 - -
Interest received 3.6 1.9 - 0.2
Dividends received from subsidiaries - - 57.5 117.6
Net cash (used in)/from investing activities (465.4) (367.3) 35.5 117.8
Financing activities
Interest paid (236.6) (252.8) (21.3) (36.7)
Debt issue costs paid (3.3) (3.7) - (2.0)
Interest element of finance lease rental payments (0.6) (0.8) - -
Proceeds from the issue of shares 22.0 - 22.0 -
Increase in amounts borrowed 447.0 489.5 - 240.0
Repayment of amounts borrowed (140.0) (487.5) - (239.8)
Repayment of principal and accumulated interest on derivatives 27.0 (73.9) - -
Capital element of finance lease rental payments (6.2) (5.7) - -
(Increase)/decrease in short-term bank deposits (256.7) 33.2 - -
Dividends paid (see note 12) (40.8) (95.0) (40.8) (95.0)
Net cash used in financing activities (188.2) (396.7) (40.1) (133.5)
Net increase/(decrease) in cash and cash equivalents 28.6 (98.7) 1.8 (8.1)
Cash and cash equivalents at the beginning of the year 288.2 386.9 11.4 19.5
20 Cash and cash equivalents at 31 March 316.8 288.2 13.2 11.4
Osprey Acquisitions Limited
Notes to the financial statements for the year ended 31 March 2019
59
1. Accounting policies
The principal accounting policies applied in the preparation of these financial statements are set out
below. Unless otherwise stated, these policies have been consistently applied to all of the years
presented.
a) Basis of accounting
The financial statements have been prepared in accordance with International Financial Reporting
Standards (IFRSs) and interpretations issued by the IFRS Interpretations Committee (IFRICs), as
adopted by the European Union and with those parts of the Companies Act 2006 applicable to
companies reporting under IFRS.
The financial statements have been prepared under the historical cost convention, as modified by the
revaluation of property, plant and equipment and financial assets and financial liabilities (including
derivative instruments) at fair value through profit and loss.
b) Basis of preparation
The group financial statements comprise a consolidation of the financial statements of the company
and all its subsidiary undertakings at 31 March. The results of companies acquired or disposed of are
consolidated from the effective date of acquisition or to the effective date of disposal. Inter-company
sales and profit are eliminated fully on consolidation.
Acquisitions of subsidiaries and businesses are accounted for using the acquisition method. The
consideration transferred in a business combination is measured at fair value, which is calculated as
the sum of the fair values, as at the acquisition date, of assets transferred by the group and liabilities
incurred by the group to the former owners of the acquiree in exchange for control of the acquiree.
Acquisition-related costs are recognised in profit or loss as incurred.
When the consideration transferred by the group in a business combination includes assets or
liabilities resulting from a contingent consideration arrangement, the contingent consideration is
measured at its fair value, as at the acquisition date, and included as part of the consideration
transferred in a business combination. Changes in fair value of the contingent consideration that
qualify as measurement period adjustments are adjusted retrospectively, with corresponding
adjustments against goodwill. Measurement period adjustments are adjustments that arise from
additional information obtained during the ‘measurement period’ (which cannot exceed one year from
the acquisition date) about facts and circumstances that existed at the acquisition date.
When a business combination is achieved in stages, the group’s previously-held interests in the
acquired entity is remeasured to its acquisition date fair value and the resulting gain or loss, if any, is
recognised in profit or loss. Amounts arising from interests in the acquiree prior to the acquisition date
that have previously been recognised in other comprehensive income are reclassified to profit or loss,
where such treatment would be appropriate if that interest were disposed of.
Osprey Acquisitions Limited
Notes to the financial statements (continued) for the year ended 31 March 2019
60
1. Accounting policies (continued)
b) Basis of preparation (continued)
The Directors have undertaken a detailed review to assess the liquidity requirements of the group
compared against the cash and facilities available to the group, and have a reasonable expectation
that the group and company have adequate resources to continue in operational existence for the
foreseeable future. For this reason, they continue to adopt the going concern basis in preparing the
financial statements.
New standards adopted in the period
The group has adopted the following new accounting standards that became applicable for the current
reporting period:
• IFRS 9 ‘Financial Instruments’, and
• IFRS 15 ‘Revenue from Contracts with Customers’.
The relevant new accounting policies are set out below (sections c, e, n, p and t), with the financial
impact of adopting these new accounting standards set out in note 33.
c) Foreign currencies
Individual transactions denominated in foreign currencies are translated into local currency at the
actual exchange rates ruling at the dates of the transactions. Monetary assets and liabilities
denominated in foreign currencies are translated into local currency at the rates ruling at the balance
sheet date. Profits and losses on both individual foreign currency transactions during the period and
monetary assets and liabilities are dealt with in the income statement except for transactions where
hedge accounting has been applied in accordance with IFRS 9 ‘Financial Instruments’.
On consolidation, the income statements of overseas subsidiaries are translated at the average
exchange rates for the period and the balance sheets at the exchange rates at the balance sheet date.
The exchange differences arising as a result of translating income statements at average rates and
restating opening net assets at closing rates are taken to the translation reserve.
On disposal of a foreign operation, the deferred cumulative amount of exchange differences
recognised in equity relating to that particular foreign operation shall be recognised in the income
statement.
d) Segmental reporting
Operating segments are reported in a manner consistent with the internal reporting provided to the
chief operating decision maker. The chief operating decision maker, who is responsible for allocating
resources and assessing performance of the operating segments, has been identified as the Board of
Directors.
Osprey Acquisitions Limited
Notes to the financial statements (continued) for the year ended 31 March 2019
61
1. Accounting policies (continued)
e) Revenue recognition
Revenue is recognised to reflect the transfer of goods or services to customers at an amount that
reflects the consideration to which the group expects to be entitled to in exchange for those goods or
services.
Principal source of income
The group’s principal source of income is from customers in respect of the provision of water and
water recycling services within Anglian Water, the group’s regulated water and sewerage company, at
a price determined annually by its regulatory tariffs.
The majority of Anglian Water’s household customers have meters, but there are a significant number
who are not metered. This is relevant to how the group recognises the income over the year, since the
unmeasured customers are billed at a flat rate based on the rateable value of the property which
reflects their right to an ongoing supply of water, while measured customers are billed in line with
their usage, which tends to be seasonal.
Under IFRS 15, the performance obligation for measured customers has been assessed as the
provision of water and sewerage services, and the performance obligation is met as water is supplied
to the property. Accordingly for the variable element, revenue is recognised as water is supplied,
based on volumes supplied at the relevant reporting date.
Related non-volumetric, or standing, charges reflect our obligation to stand-ready to deliver water as
is the case with unmeasured supply (see below), and is accounted for accordingly.
In respect of unmeasured customers, the performance obligation has been assessed as standing ready
to provide water and sewerage services when required by our customers, and accordingly revenue is
recognised under IFRS 15 as the stand-ready obligation is fulfilled over time. Accordingly, revenue
from unmeasured customers is recognised on a time basis under IFRS 15.
Non-household revenue is charged and recognised on the basis of volumes supplied, based on data
submitted by the market operator.
Grants and contributions
A secondary source of income for Anglian Water is from grants and contributions in respect of new
connections for water and/or sewerage services. The significant components of grants and
contributions, and their treatment, are as follows:
i New connection charges
The group considers that the developer requesting the connection is the customer, and that the
group’s performance obligation is satisfied by making the connection. On this basis it is
appropriate to recognise the income as the connection is completed.
ii Self-lay, requisitions and adoption fees
The group has reached the same conclusion as for new connection charges (see (i) above).
iii Fair value of assets adopted for £nil consideration
These are principally sewers and pumping stations that a developer has constructed and then
contributed to the group, on a £nil consideration basis, in exchange for being relieved of any
future liability. As the group does not have any performance obligation to the developer post
adoption, the group has concluded that immediate recognition based on the fair value of the asset
adopted is appropriate.
iv Infrastructure charges
Infrastructure charges are a developer’s contribution to fund network reinforcement by the group.
While these charges are a contribution to reinforcement of the network, they have to be paid by
the developer as a condition of obtaining connection to the network and, as such, the group has
concluded that the developer is the customer, and that the group’s performance obligation is
satisfied by making the connection. As such, the income is recognised as the connection is made.
Osprey Acquisitions Limited
Notes to the financial statements (continued) for the year ended 31 March 2019
62
1. Accounting policies (continued)
Grants and contributions (continued)
v Diversions
Diversions arise where a highways agency, or other authority, reimburses the group for the
majority of the costs incurred in diverting assets that represent an obstruction to the construction
or upgrade of roads and railway lines. Under IFRS 15, the group has concluded that the
contributions should be recognised immediately as revenue since there is no performance
obligation to the agency/authority beyond completing the diversion.
Other sources of revenue
i Other operating income
The principal sources of other operating income are from the generation of power, the sale of
biosolids to farms, rents received and other minor income associated with operating activities.
ii Service contracts
Revenue from service contracts is recognised by reference to the stage of completion, as
measured by reference to services performed to date as a percentage of total services to be
performed.
iii Property development
Revenue from sale of development properties, which are not held for the long-term, is recorded
when a legally binding contract for the sale of the development has been entered into and legal
completion has taken place before the period-end. Revenue includes sales of directly held work in
progress and interests in special purpose subsidiaries and joint ventures if the substance of the
transaction is the sale of the underlying property.
f) Research and development
Research expenditure is charged to profit and loss in the period in which it is incurred. Expenditure
relating to development projects is capitalised as equipment or intangible assets and is written off
over the expected useful life of the asset.
g) Exceptional items
Exceptional items are one-off items which individually or, if of a similar type, in aggregate need to be
disclosed by virtue of their size or nature to enable a reader of the financial statements to understand
the results for a particular period.
h) Taxation
Current income tax, including UK corporation tax and foreign tax, is provided at amounts expected to
be paid (or recovered) using tax rates and laws that have been enacted or substantively enacted by
the balance sheet date.
Deferred income tax is provided in full, using the liability method, on temporary differences arising
between the tax bases of assets and liabilities and their carrying amounts in the consolidated financial
statements. The deferred income tax is not accounted for if it arises from initial recognition of an asset
or liability in a transaction, other than a business combination, that at the time of the transaction
affects neither accounting nor taxable profit or loss. Deferred income tax is determined using tax rates
enacted or substantially enacted by the balance sheet date and which are expected to apply when the
related deferred income tax asset is realised or the deferred income tax liability is settled.
Deferred income tax assets and surplus Advance Corporation Tax are recognised only to the extent
that it is probable that future taxable profit will be available against which the temporary differences
can be utilised.
i) Dividends
Dividends are recognised as a liability in the period in which they are approved or committed. Interim
dividends are recognised in the period in which they are paid or when the company has a constructive
or legal commitment to pay the dividend.
Osprey Acquisitions Limited
Notes to the financial statements (continued) for the year ended 31 March 2019
63
1. Accounting policies (continued)
j) Intangible assets
i Goodwill
On the acquisition of a subsidiary undertaking, or business combination, fair values are attributed
to the net identifiable assets or liabilities acquired. Goodwill represents the difference between the
fair value of the purchase consideration and the fair value of the net assets acquired. Goodwill is
tested annually for impairment.
ii Right to operate intangible assets
The ‘right to operate’ intangible assets arose on acquisition of a subsidiary undertaking,
representing the fair value of the contracts acquired, and are shown at cost less subsequent
amortisation and any impairment. Amortisation is calculated on a straight line basis over the
length of the individual contracts to which the intangible assets relate.
iii Other intangible assets
Other intangible assets are shown at cost less subsequent amortisation and any impairment.
Amortisation of intangible assets is calculated on a straight line basis over their estimated useful
lives, which are primarily three to 10 years.
k) Property, plant and equipment
Property, plant and equipment comprises:
• Land and buildings – comprising land and non-operational buildings.
• Infrastructure assets – comprising a network of systems consisting of mains and sewers,
impounding and pumped raw water storage reservoirs, sludge pipelines and sea outfalls.
• Operational assets – comprising structures at sites used for water and wastewater treatment,
pumping or storage, where not classed as infrastructure, along with associated fixed plant.
• Vehicles, mobile plant and equipment.
• Assets under construction.
All property, plant and equipment is shown at cost less subsequent depreciation and any impairment.
Cost includes expenditure directly attributable to the acquisition or construction of the items.
Borrowing costs incurred for the construction of qualifying assets are capitalised during the period of
time that is required to complete and prepare the asset for its intended use. Other borrowing costs are
expensed.
Subsequent costs are included in the asset’s carrying amount or recognised as a separate asset, as
appropriate, only when it is probable that future economic benefits associated with the item will flow
to the group and the cost of the item can be measured reliably. All other repairs and maintenance
costs are charged to the income statement as incurred.
Freehold land is not depreciated, nor are assets in the course of construction until commissioned.
Depreciation of other assets is calculated at rates expected to write off the cost less the estimated
residual value of the relevant assets on a straight line basis over their estimated useful lives, which
are primarily as follows:
Non-operational buildings 30 – 60 years
Infrastructure assets – Water 50 – 120 years
Infrastructure assets – Water Recycling 50 – 160 years
Operational assets 30 – 80 years
Fixed plant, including meters 12 – 40 years
Vehicles, mobile plant and equipment 3 – 10 years
Osprey Acquisitions Limited
Notes to the financial statements (continued) for the year ended 31 March 2019
64
1. Accounting policies (continued)
k) Property, plant and equipment (continued)
Items of property, plant and equipment that have no further operational use are treated as having
been decommissioned and are written off immediately to profit or loss. In addition, property, plant
and equipment is assessed for impairment, in accordance with IAS 36 ‘Impairment of Assets’, if
events or changes in circumstances indicate that the carrying value may not be recoverable.
l) Investment properties
Investment properties are initially recognised at cost. Subsequently, buildings are depreciated over
their useful life and land is held at cost and not depreciated.
m) Leased assets
Leases of property, plant and equipment which transfer substantially all the risks and rewards of
ownership are classified as finance leases. Finance leases are capitalised at the lease’s inception at the
lower of the fair value of the leased asset and the present value of the minimum lease payments, with
the corresponding rental obligations, net of finance charges, shown as an obligation to the lessor.
Lease payments are treated as consisting of a capital element and a finance charge; the capital
element reducing the obligation to the lessor and the interest element being charged to the income
statement over the lease period so as to produce a constant periodic rate of interest on the remaining
balance of the liability for each period. Property, plant and equipment acquired under finance leases is
depreciated over the shorter of the asset’s useful life and the lease term.
Leases where the lessor retains substantially all the risks and rewards of ownership are classified as
operating leases. Rental costs arising under operating leases, net of any incentives received from the
lessor, are charged to the income statement on a straight-line basis over the period of the lease.
For the purpose of lease classification, the land and buildings elements of a lease are considered
separately.
n) Investments
Joint ventures
Joint ventures are those entities over whose activities the group has the ability to exercise joint
control, established by contractual agreement. The group’s interests in jointly controlled enterprises
are accounted for by the equity method of accounting and are initially recognised at cost.
The consolidated financial statements include the group's share of the total recognised income and
expense of the jointly controlled enterprises on an equity accounting basis, from the date that joint
control commences until the date that joint control ceases.
To the extent that joint ventures have net liabilities and a contractual commitment exists for the
group to settle those net liabilities, the aggregate amount is added back to investments and offset
firstly against loans and trading balances with the joint venture, with any excess transferred to
provisions.
Osprey Acquisitions Limited
Notes to the financial statements (continued) for the year ended 31 March 2019
65
1. Accounting policies (continued)
n) Investments (continued)
Investments – cash deposits
After initial recognition at fair value, financial investments are held at amortised cost. This is based on
the business’ practice of acquiring financial assets to collect their contractual cash flows and the
simple nature of the investments made, which consist solely of principle payments and interest on the
principle outstanding.
The Expected Credit Loss (ECL) model requires the group to account for expected credit losses and
changes in those expected credit losses at each reporting date to reflect changes in credit risk since
initial recognition of the financial assets, therefore this is no longer dependent on the group first
identifying a credit loss event. This requires consideration of a broader range of information when
assessing credit risk and measuring expected credit losses, including past events, current conditions,
reasonable and supportable forecasts that affect the expected collectability of the future cash flows of
the instrument.
In applying this forward-looking approach, a distinction is made between:
• where credit risk is low or has not increased significantly since recognition (‘Stage 1’) and
• where credit risk is not low or has increase significantly since initial recognition (‘Stage 2’).
• where the financial asset is credit impaired (Stage 3).
‘12-month expected credit losses’ are recognised for Stage 1 while ‘lifetime expected credit losses’ are
recognised for Stage 2.
Expected credit losses are defined as the weighted average of credit losses with the respective risk of
default occurring as the weights.
A loss allowance for full lifetime ECL is required for a financial instrument if the credit risk on that
financial instrument has increased significantly since initial recognition. For all other financial
instruments, ECLs are measured at an amount equal to the 12-month ECL.
The group manages credit risk exposures through a comprehensive counterparty credit risk policy.
See the financial instruments disclosures for further details.
o) Inventories
Raw materials are stated at cost less any provision necessary to recognise damage and obsolescence.
Work in progress is valued at the lower of cost and net realisable value. Net realisable value is the
estimated selling price in the ordinary course of business, less the estimated costs of completion and
selling expenses.
Osprey Acquisitions Limited
Notes to the financial statements (continued) for the year ended 31 March 2019
66
1. Accounting policies (continued)
p) Trade receivables
Trade receivables are measured at fair value on initial recognition. If there is objective evidence that
the amount receivable is impaired it is written down to its recoverable amount, with the irrecoverable
amount being recognised as an expense in operating costs.
The group makes use of a simplified approach in accounting for trade and other receivables and
records the loss allowance as lifetime expected credit losses. These are the expected shortfalls in
contractual cash flows, considering the potential for default at any point during the life of the trade
receivable.
In calculating the expected loss, the group applies expected recovery rates, based on actual historical
cash performance and forward looking information.
The group assesses impairment of trade receivables on a collective basis where they possess shared
credit risk characteristics they have been grouped, these are residential, non-household and developer
services and other customers.
Trade receivables are considered to be credit impaired where no payment has been received within
180 days past due and we believe there is no realistic prospect of recovery or it is uneconomic to
pursue.
q) Cash and cash equivalents
In the statement of cash flows, cash and cash equivalents comprise cash in hand, deposits held at call
with banks, other short-term highly liquid investments with original maturity dates of three months or
less, and outstanding bank overdrafts.

Osprey Acquisitions Limited
Notes to the financial statements (continued) for the year ended 31 March 2019
67
r) Assets held for sale
Where an asset or group of assets (a disposal group) is available for immediate sale and the sale is
highly probable and expected to occur within one year, the disposal group is deemed held for sale. At
this point the gross assets and gross liabilities of the disposal group are shown separately as held for
sale. The value of the disposal group is measured at the lower of the carrying amount and fair value
less costs to sell.
s) Borrowings
Borrowings are recognised initially at fair value, net of transaction costs incurred. Borrowings are
subsequently stated at amortised cost; any difference between the proceeds (net of transaction costs)
and the redemption value is recognised in the income statement over the period of the borrowings
using the effective interest method.

Osprey Acquisitions Limited
Notes to the financial statements (continued) for the year ended 31 March 2019
68
1. Accounting policies (continued)
t) Derivative financial instruments
Derivative instruments are used for hedging purposes in line with the group’s risk management policy
and no speculative trading in financial instruments is undertaken.
Derivatives are initially recognised at fair value and subsequently re-measured at fair value. The
method of recognising the resulting gain or loss depends on whether the derivative is designated as a
hedging instrument, and if so, the nature of the item being hedged. The group designates certain
derivatives as either a fair value or cash flow hedge in accordance with IFRS 9 ‘Financial Instruments’.
At the inception of the hedge relationship, the group documents the relationship between the hedging
instrument and the hedged item, along with how the hedge aligns with the group’s risk management
strategy. Furthermore, at the inception of the hedge and on an ongoing basis, the group documents
whether the hedging instrument is effective in offsetting changes in the fair values or cash flows of the
hedged item attributable to the hedged risk, which is when the hedging relationships meet all of the
following hedge effectiveness requirements:
• there is an economic relationship between the hedged item and the hedging instrument;
• the effect of credit risk does not dominate the value changes that result from that economic
relationship; and
• the hedge ratio of the hedging relationship is the same as that resulting from the quantity of the
hedged item that the group actually hedges and the quantity of the hedging instrument that the
group actually uses to hedge that quantity of hedged item.
The group rebalances a hedging relationship in order to comply with the hedge ratio requirements
when necessary. In such cases discontinuation may apply to only part of the hedging relationship. For
example, the hedge ratio might be adjusted in such a way that some of the volume of the hedged
item is no longer part of a hedging relationship, hence hedge accounting is discontinued only for the
volume of the hedged item that is no longer part of the hedging relationship.
In some hedge relationships the group excludes, from the designation, the currency basis spread of
cross currency hedging instruments. In this case the fair value change of the currency basis element
of the cross currency interest rate swap is deferred in other comprehensive income, over the term of
the hedge and is reclassified from equity to profit or loss on a straight-line basis over the term of the
hedging relationship. The treatment for the currency basis element is optional and the option is
applied on a hedge by hedge basis.
Osprey Acquisitions Limited
Notes to the financial statements (continued) for the year ended 31 March 2019
69
1. Accounting policies (continued)
t) Derivative financial instruments (continued)
The group discontinues hedge accounting only when the hedging relationship (or a part thereof)
ceases to meet the qualifying criteria (after rebalancing, if applicable). This includes instances when
the hedging instrument expires or is sold, terminated or exercised. The discontinuation is accounted
for prospectively.
i Fair value hedge
Changes in the fair value of derivatives designated and qualifying as fair value hedges are
recorded in the income statement within ‘fair value gains/(losses) on derivative financial
instruments’, together with changes in the fair value of the hedged asset or liability attributable to
the hedged risk.
If a fair value hedge is discontinued, the hedged item is not adjusted for any subsequent
movements in the hedged risk. The amount that the hedged item was adjusted by will be
amortised to profit or loss over the remaining life of the original hedge based on a recalculated
effective interest rate.
ii Cash flow hedge
The effective portion of changes in the fair value of derivatives designated and qualifying as cash
flow hedges is recognised in equity. The gain or loss relating to the ineffective portion is
recognised immediately in the income statement within ‘fair value gains/(losses) on derivative
financial instruments’.
Amounts accumulated in equity are recycled in the income statement in the periods when the
hedged item will affect profit or loss (for example, in the periods when interest income or expense
is recognised, or when the forecast sale that is hedged takes place).
When a cash flow hedge is discontinued, any cumulative gain or loss existing in equity at that time
remains in equity and is recognised when the forecast transaction is ultimately recognised in the
income statement. When a forecast transaction is no longer expected to occur, the cumulative
gain or loss that was reported in equity is immediately transferred to the income statement.
iii Derivatives that do not qualify for hedge accounting
Certain derivative instruments, principally index-linked swaps, do not qualify for hedge accounting.
Such derivatives are classified at fair value through profit or loss, and changes in fair value are
recognised immediately in the income statement.
Osprey Acquisitions Limited
Notes to the financial statements (continued) for the year ended 31 March 2019
70
1. Accounting policies (continued)
u) Provisions
A provision is recognised when the group has a present legal or constructive obligation as a result of a
past event for which it is probable that an outflow of resources will be required to settle the obligation
and the amount can be reliably estimated. If the effect is material, provisions are determined by
discounting the expected future cash flows at a pre-tax rate that reflects the current market
assessments of the time value of money and the risks specific to the liability. The group’s policy on
specific areas is as follows:
i Onerous lease costs
Provision is made for the expected future costs of property and other leases to the extent that
these costs are not expected to be of future benefit to the business, net of any recoveries from
sub-leases.
v) Retirement benefit obligations
i Defined benefit schemes
For defined benefit schemes, pension scheme assets are measured at fair value and liabilities are
measured on an actuarial basis using the projected unit credit method and are discounted at the
current rate of return on a high quality corporate bond of equivalent term and currency to the
liabilities. The current service cost, which is the increase in the present value of the liabilities of
the group’s defined benefit pension schemes expected to arise from employee service in the
period, is charged to operating costs. The net interest on the schemes’ net assets/(liabilities) is
included in other finance charges. Actuarial gains and losses are recognised in the statement of
comprehensive income.
Pension schemes’ surpluses, to the extent that they are considered recoverable, or deficits, are
recognised in full and presented on the face of the balance sheet.
ii Defined contribution schemes
The cost of defined contribution schemes is charged to the income statement in the period in
which the contributions become payable.
w) New standards, amendments and interpretations not yet adopted
IFRS 16 ‘Leases’
This standard is mandatory for the group’s financial statements from 1 April 2019, the impact on the
group is described below.
IFRS 16 will replace the current guidance in IAS 17 and IFRIC 4. IFRS 16 requires lessees to recognise
on the balance sheet a lease liability, reflecting future lease payments, and a ‘right-of-use asset’ for
the majority of leases, thereby removing the distinction currently made between finance and
operating leases under IAS 17. As a result, the group will bring substantially all leases previously
treated as operating leases on to the balance sheet.
On the balance sheet, property, plant and equipment will increase by the value of the right-of-use
asset, with an increase in borrowings reflecting the future lease payments. In the income statement
the group will record an interest expense on the lease liability and depreciation on the right-of-use
asset. In comparison with operating leases under IAS 17, this has changed not only the allocation of
expenses but also the total amount of expenses recognised for each period of the lease term. The
combination of a straight-line depreciation of the right-of-use asset and the effective interest rate
method applied to the lease liability, results in a higher total charge to the income statement in the
initial years of the lease, and decreasing expense during the latter part of the lease term. IFRS 16 also
impacts the cash flow statement because operating lease payments, previously included within cash
generated from operations, are included within financing activities, split between interest paid and the
capital element of lease rental payments.

Osprey Acquisitions Limited
Notes to the financial statements (continued) for the year ended 31 March 2019
71
1. Accounting policies (continued)
w) New standards, amendments and interpretations not yet adopted (continued)
At 31 March 2019, the group’s future minimum lease payments under non-cancellable operating
leases were £36.5 million in respect of properties, mainly office buildings, and £1.3 million in respect
of plant and equipment, primarily vehicles.
Discounting using the group’s incremental borrowing rate will result in additional assets and
corresponding liabilities to be recognised on transition. Additional debt as a result of IFRS 16 amounts
to £32.5 million in respect of property leases and £1.3 million in respect of vehicle, plant and
equipment leases. The comparable right of use assets on transition are £31.9 million and £1.3 million
respectively.
IFRS 16 allows lessees to apply the standard either retrospectively in accordance with IAS 8
‘Accounting Policies, Changes in Accounting Estimates and Errors’, or using a modified retrospective
approach where the cumulative effect of adoption is recognised at the date of initial application. The
group has chosen to apply the modified retrospective approach as well as the following practical
expedients:
- When defining a lease ‘an entity is not required to reassess whether a contract is, or contains, a
lease at the date of initial application’. This applies to both contracts that were not previously
identified as containing a lease applying IAS 17/IFRIC 4 and those that were previously identified as
leases in IAS 17/IFRIC 4. If an entity chooses this expedient it shall be applied to all of its contracts.
As a result, where we currently report leases as operating leases, from 1 April 2019 these will be
reported ‘on balance sheet’. We will not be reviewing contracts where we have previously determined
them to not contain as lease under IAS 17/IFRIC 4.
- Rely on our assessment of whether leases are onerous applying IAS 37 Provisions, Contingent
Liabilities and Contingent Assets immediately before the date of initial application as an alternative to
performing an impairment review.
- Leases ending within 12 months of implementation to be accounted for in the same way as short-
term leases.

Osprey Acquisitions Limited
Notes to the financial statements (continued) for the year ended 31 March 2019
72
2. Key assumptions and significant judgements
In preparing these consolidated financial statements, the Directors have made judgements, estimates
and assumptions that affect the application of the group’s accounting policies, which are described in
note 1, and the reported amounts of assets, liabilities, income and expenses. Actual results may differ
from these estimates.
The estimates and underlying assumptions are reviewed on an ongoing basis. Revisions to estimates
are recognised in the period in which the estimate is revised if the revision only affects that period, or
in the period of the revision and future periods if the revision affects both the current and future
periods.
a) Significant judgements
The areas where the most critical judgements have been applied are as follows:
i Capitalised expenditure
Additions to intangible assets, and to property, plant and equipment, include £66.2 million (2018:
£66.8 million) of own work capitalised. Judgement is made to ensure these costs relate to relevant
assets and that future economic benefit will flow to the group. Judgement is also made as to
whether certain costs constitute repairs and maintenance or the enhancement of assets.
ii Depreciation
The property, plant and equipment used in the group is primarily the infrastructure and
operational assets of the regulated water business. Infrastructure and operational assets have
estimated useful lives of between 30 and 160 years and the depreciation charge is clearly sensitive
to the lives allocated to the various types of asset. Asset lives are reviewed regularly and changed
where necessary to reflect the current view on their remaining lives in light of technological
change, prospective economic utilisation and the physical condition of the assets.
iii Recognition of grants and contributions
Under IFRS 15, revenue is recognised when the performance obligations in a contract are met. For
grants and contributions in respect of new housing developments our obligation to the developer is
met when properties are connected to the network, and therefore this is considered the relevant
trigger for income recognition. We believe the ongoing obligation to maintain the connection to the
property is a separate contract with the property owner (in most cases the household customer)
and separate from the contract with the developer.
This is a change from our revenue recognition approach prior to the introduction of IFRS 15, when
we considered connection and the ongoing supply of water and/or wastewater services to be a
combined obligation which existed over the life of the property, and hence the income was
recognised over the estimated life of the assets enabling the provision of the ongoing service. In
our view, combining the obligations to two different customers, the developer and the property
owner, is not consistent with the requirements of IFRS 15.
A similar revenue recognition approach is taken with diversions. The obligation here is that we
divert the sewer or water main at the request of the relevant authority or agency, and our
obligation is fully met once the diversion is completed, and therefore the contribution is fully
recognised as revenue at that point in time.

Osprey Acquisitions Limited
Notes to the financial statements (continued) for the year ended 31 March 2019
73
2. Key assumptions and significant judgements (continued)
b) Areas involving estimation
The key areas involving estimation are discussed below.
i Measured income accrual
For Anglian Water the measured income accrual is an estimation of the amount of main water and
wastewater charges unbilled at the year end. The accrual is estimated using a defined
methodology based upon weighted average water consumption by tariff, which is calculated based
upon historical billing information. The calculation is sensitive to estimated consumption for
measured domestic customers (a fall of one cubic metre in average annual consumption will
reduce revenue by approximately £5.5 million).
ii Bad debts
The group evaluates the estimated recoverability of trade receivables and records a provision for
doubtful receivables based on experience. Estimates associated with these provisions are based
on, amongst other things, a consideration of actual collection history and adjusted for other factors
such as whether charging orders apply to the customer group. The actual level of receivables
collected may differ from the estimated levels of recovery, which could impact operating results
positively or negatively. At 31 March 2019, the provision for doubtful receivables of £193.4 million
was supported by nine years of cash collection history, adjusted for other factors. If we based the
provision on a shorter collection history of two years the provision would have been £0.9 million
lower. However, the directors take the view that using a longer history of debt recoverability
removes the potential volatility of changing rates on a more frequent basis, and hence provides a
more consistent basis for accounting.
The uncertainty around Brexit, its impact on the wider economy and customers’ ability to pay their
water bills is of course very difficult to predict with any confidence. The last significant shock to
the UK economy was the financial crash in 2008 and we have reviewed the subsequent trend in
bad debt charge. Our debt is very short term in its nature with over 75% of debt collected within
three months of being raised and as the effect of any economic change is likely to be felt over
several months, if not years, the collectability of our customer balances held at the end of March
would see a minimal impact in the short term. As a result of our findings, we have not modified
the bad debt provision rates for Brexit, nor any other macro-economic metrics, but we will
continue to closely monitor any changes in the economic outlook and its potential impact.
iii Retirement benefit actuarial assumptions
The group operates a number of defined benefit schemes (which are closed to new members and
future accruals) as well as a defined contribution scheme. Under IAS 19 ‘Employee Benefits’ the
group has recognised an actuarial loss of £58.0 million (2018: gain of £30.7 million) in respect of
the defined benefit schemes which affects other comprehensive income and net assets. The
actuarial valuation of the scheme liabilities is reliant on key assumptions which include: the
discount rate, salary inflation and life expectancy. The main assumptions and associated
sensitivities are set out in note 26 of the financial statements.

Osprey Acquisitions Limited
Notes to the financial statements (continued) for the year ended 31 March 2019
74
3. Segmental information
By class of business for the year ended 31 March 2019
At 31 March 2019 the group was organised into the following main businesses:
• Anglian Water; regulated water and water recycling services provider to customers in the east of
England and Hartlepool.
• Head Office and Other; comprises head office and other group functions, including Property.
There has been no change in the basis of segmentation or in the measurement of segmental profit or
loss in the year.
No operating segments have been aggregated to form the above reportable operating segments.
The Directors consider the Board to be the group’s chief operating decision maker in relation to
segment reporting in accordance with IFRS 8 ‘Operating Segments’. Segmental performance is
evaluated based on both profit and loss and cash flows, see tables below. Segmental assets and
liabilities do not form part of the Board’s performance assessment and, as such, are not included in
the segmental information.
Inter-segment revenues and profits are fully eliminated on consolidation and are shown separately in
the following tables. The segment result comprises operating profit plus share of joint ventures
operating profit.
Inter-
Anglian Head Office segment
Water and Other eliminations Total
£m £m £m £m
Revenue
External 1,354.7 3.7 - 1,358.4
Inter segment - 0.4 (0.4) -
1,354.7 4.1 (0.4) 1,358.4
Segment result
EBITDA (earnings before interest, tax, depreciation and amortisation) 724.2 (12.8) - 711.4
Other operating income 13.6 - - 13.6
Depreciation and amortisation (348.8) (0.3) - (349.1)
389.0 (13.1) - 375.9
Cash flows
Operating cash flow 700.7 (18.8) - 681.9
Capital expenditure net of grants received (469.1) 0.3 - (468.8)
Net debt excluding derivative financial instruments (6,380.3) (1,285.8) - (7,666.1)
See page 76 for reconciliation of segmental information.
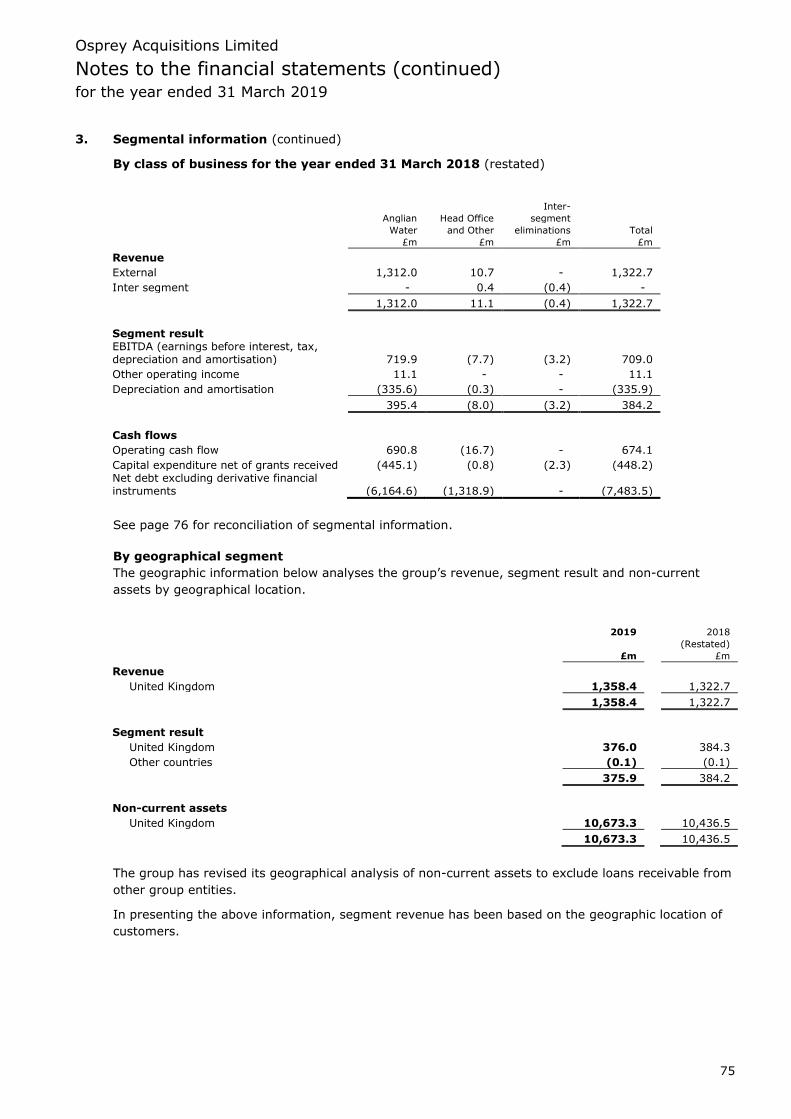
Osprey Acquisitions Limited
Notes to the financial statements (continued) for the year ended 31 March 2019
75
3. Segmental information (continued)
By class of business for the year ended 31 March 2018 (restated)
Inter-
Anglian Head Office segment
Water and Other eliminations Total
£m £m £m £m
Revenue
External 1,312.0 10.7 - 1,322.7
Inter segment - 0.4 (0.4) -
1,312.0 11.1 (0.4) 1,322.7
Segment result
EBITDA (earnings before interest, tax, depreciation and amortisation) 719.9 (7.7) (3.2) 709.0
Other operating income 11.1 - - 11.1
Depreciation and amortisation (335.6) (0.3) - (335.9)
395.4 (8.0) (3.2) 384.2
Cash flows
Operating cash flow 690.8 (16.7) - 674.1
Capital expenditure net of grants received (445.1) (0.8) (2.3) (448.2)
Net debt excluding derivative financial instruments (6,164.6) (1,318.9) - (7,483.5)
See page 76 for reconciliation of segmental information.
By geographical segment
The geographic information below analyses the group’s revenue, segment result and non-current
assets by geographical location.
2019 2018
(Restated)
£m £m
Revenue
United Kingdom 1,358.4 1,322.7
1,358.4 1,322.7
Segment result
United Kingdom 376.0 384.3
Other countries (0.1) (0.1)
375.9 384.2
Non-current assets
United Kingdom 10,673.3 10,436.5
10,673.3 10,436.5
The group has revised its geographical analysis of non-current assets to exclude loans receivable from
other group entities.
In presenting the above information, segment revenue has been based on the geographic location of
customers.
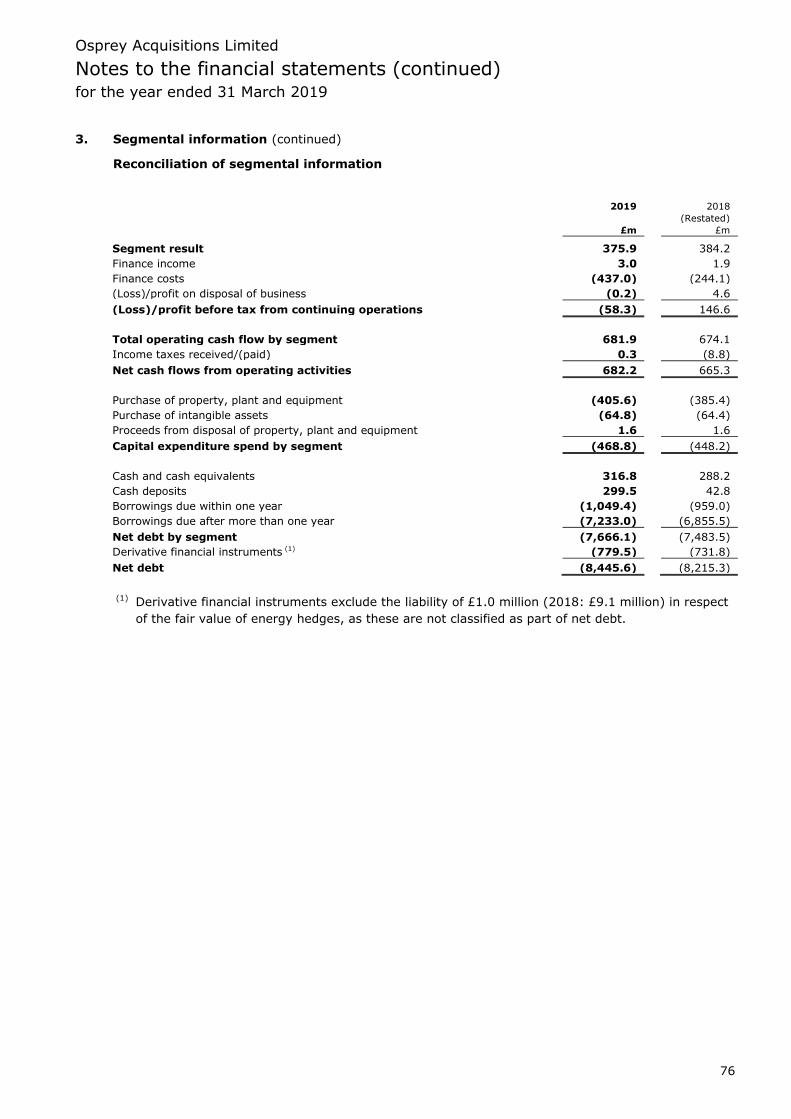
Osprey Acquisitions Limited
Notes to the financial statements (continued) for the year ended 31 March 2019
76
3. Segmental information (continued)
Reconciliation of segmental information
2019 2018
(Restated)
£m £m
Segment result 375.9 384.2
Finance income 3.0 1.9
Finance costs (437.0) (244.1)
(Loss)/profit on disposal of business (0.2) 4.6
(Loss)/profit before tax from continuing operations (58.3) 146.6
Total operating cash flow by segment 681.9 674.1
Income taxes received/(paid) 0.3 (8.8)
Net cash flows from operating activities 682.2 665.3
Purchase of property, plant and equipment (405.6) (385.4)
Purchase of intangible assets (64.8) (64.4)
Proceeds from disposal of property, plant and equipment 1.6 1.6
Capital expenditure spend by segment (468.8) (448.2)
Cash and cash equivalents 316.8 288.2
Cash deposits 299.5 42.8
Borrowings due within one year (1,049.4) (959.0)
Borrowings due after more than one year (7,233.0) (6,855.5)
Net debt by segment (7,666.1) (7,483.5)
Derivative financial instruments (1) (779.5) (731.8)
Net debt (8,445.6) (8,215.3)
(1) Derivative financial instruments exclude the liability of £1.0 million (2018: £9.1 million) in respect
of the fair value of energy hedges, as these are not classified as part of net debt.
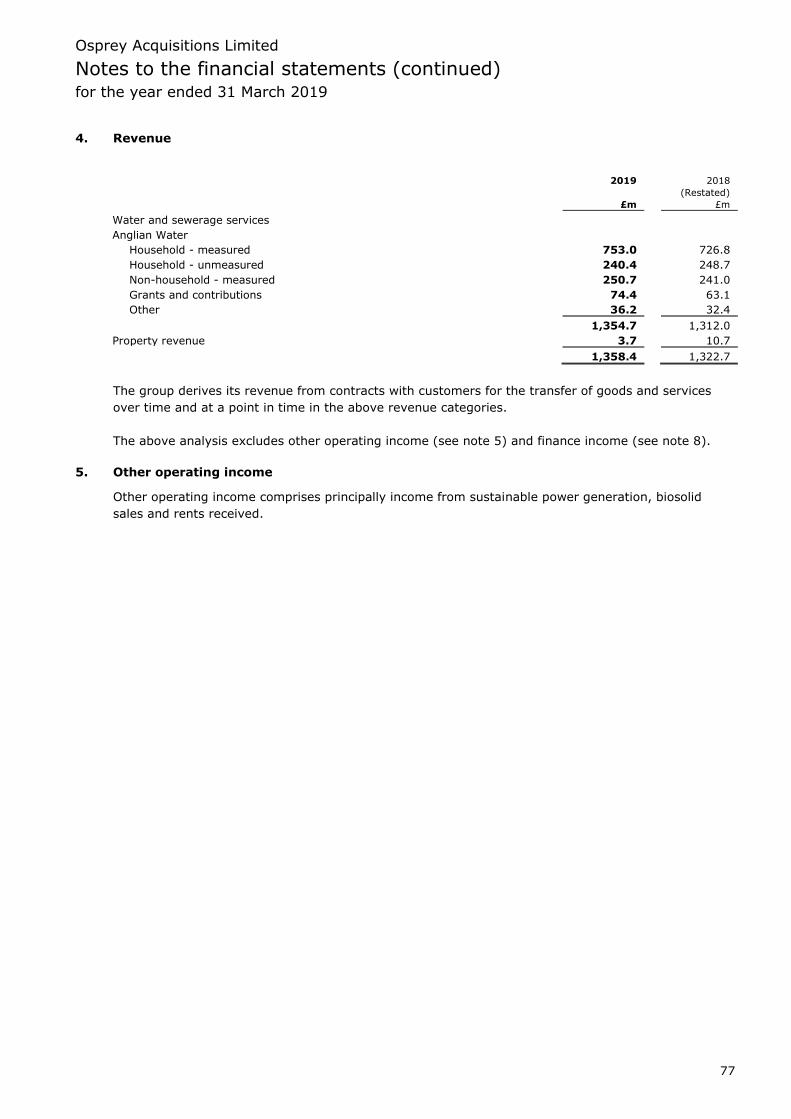
Osprey Acquisitions Limited
Notes to the financial statements (continued) for the year ended 31 March 2019
77
4. Revenue
2019 2018
(Restated)
£m £m
Water and sewerage services
Anglian Water
Household - measured 753.0 726.8
Household - unmeasured 240.4 248.7
Non-household - measured 250.7 241.0
Grants and contributions 74.4 63.1
Other 36.2 32.4
1,354.7 1,312.0
Property revenue 3.7 10.7
1,358.4 1,322.7
The group derives its revenue from contracts with customers for the transfer of goods and services
over time and at a point in time in the above revenue categories.
The above analysis excludes other operating income (see note 5) and finance income (see note 8).
5. Other operating income
Other operating income comprises principally income from sustainable power generation, biosolid
sales and rents received.
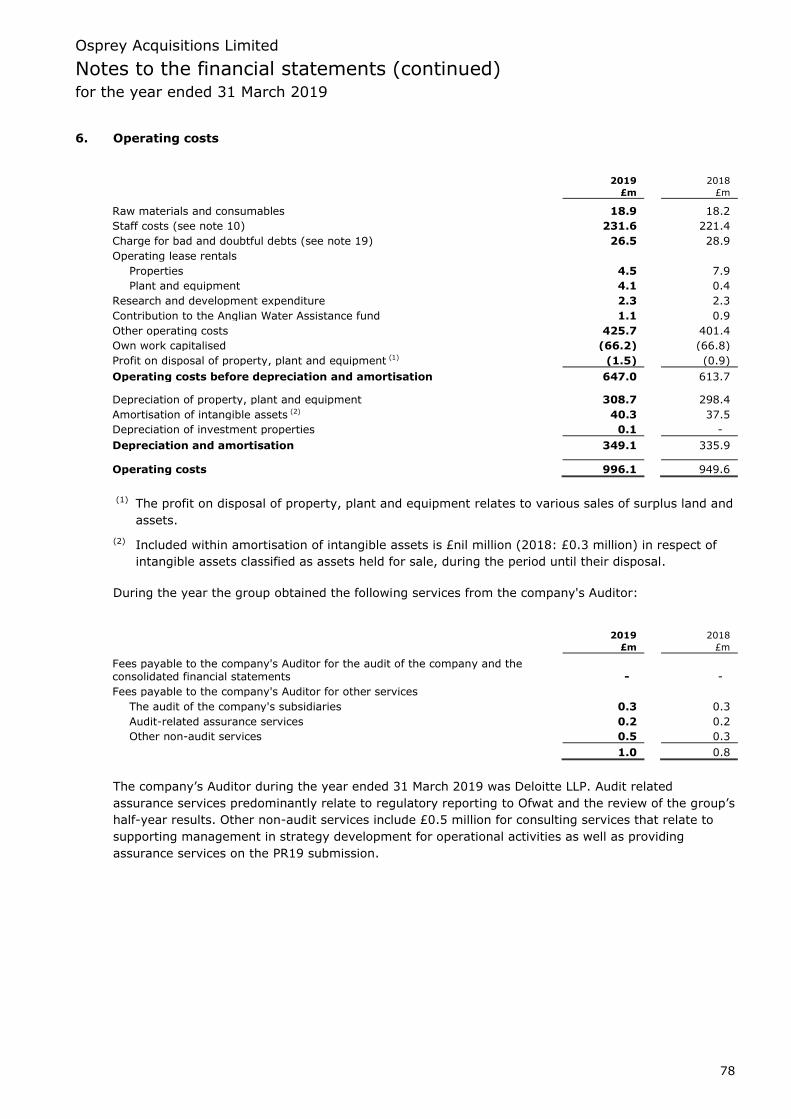
Osprey Acquisitions Limited
Notes to the financial statements (continued) for the year ended 31 March 2019
78
6. Operating costs
2019 2018
£m £m
Raw materials and consumables 18.9 18.2
Staff costs (see note 10) 231.6 221.4
Charge for bad and doubtful debts (see note 19) 26.5 28.9
Operating lease rentals
Properties 4.5 7.9
Plant and equipment 4.1 0.4
Research and development expenditure 2.3 2.3
Contribution to the Anglian Water Assistance fund 1.1 0.9
Other operating costs 425.7 401.4
Own work capitalised (66.2) (66.8)
Profit on disposal of property, plant and equipment (1) (1.5) (0.9)
Operating costs before depreciation and amortisation 647.0 613.7 Depreciation of property, plant and equipment 308.7 298.4
Amortisation of intangible assets (2) 40.3 37.5
Depreciation of investment properties 0.1 -
Depreciation and amortisation 349.1 335.9 Operating costs 996.1 949.6
(1) The profit on disposal of property, plant and equipment relates to various sales of surplus land and
assets.
(2) Included within amortisation of intangible assets is £nil million (2018: £0.3 million) in respect of
intangible assets classified as assets held for sale, during the period until their disposal.
During the year the group obtained the following services from the company's Auditor:
2019 2018
£m £m
Fees payable to the company's Auditor for the audit of the company and the consolidated financial statements - -
Fees payable to the company's Auditor for other services
The audit of the company's subsidiaries 0.3 0.3
Audit-related assurance services 0.2 0.2
Other non-audit services 0.5 0.3
1.0 0.8
The company’s Auditor during the year ended 31 March 2019 was Deloitte LLP. Audit related
assurance services predominantly relate to regulatory reporting to Ofwat and the review of the group’s
half-year results. Other non-audit services include £0.5 million for consulting services that relate to
supporting management in strategy development for operational activities as well as providing
assurance services on the PR19 submission.
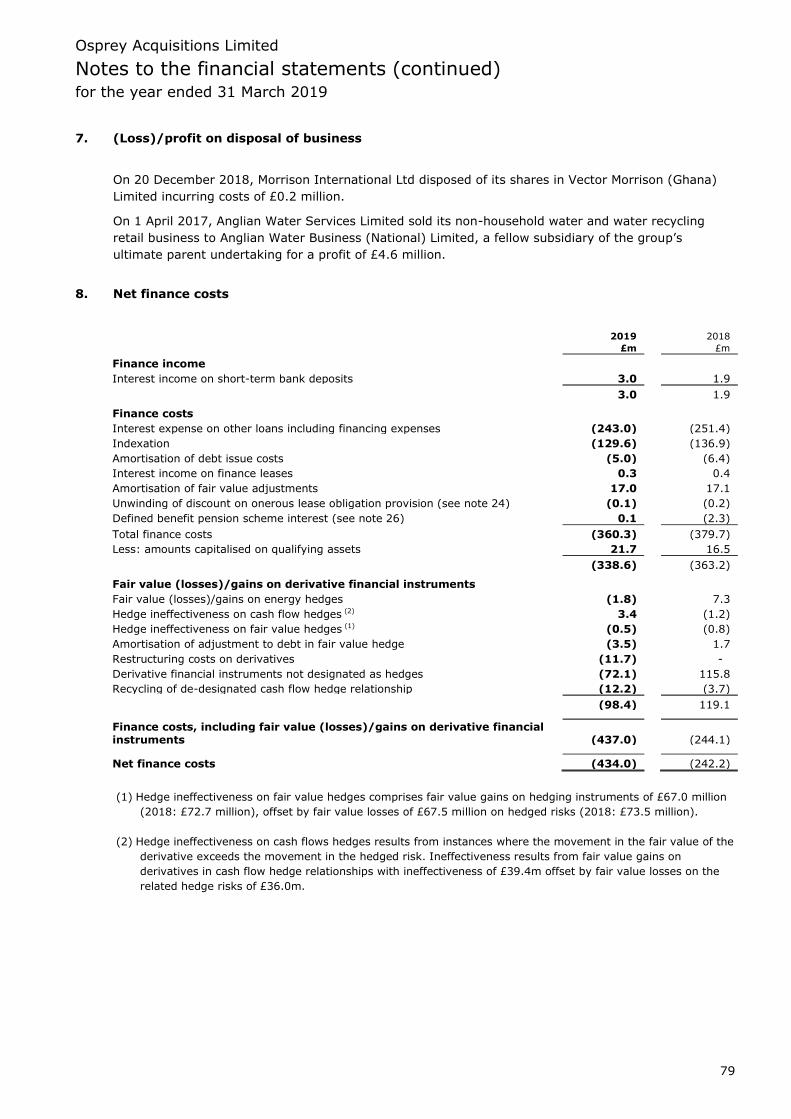
Osprey Acquisitions Limited
Notes to the financial statements (continued) for the year ended 31 March 2019
79
7. (Loss)/profit on disposal of business
On 20 December 2018, Morrison International Ltd disposed of its shares in Vector Morrison (Ghana)
Limited incurring costs of £0.2 million.
On 1 April 2017, Anglian Water Services Limited sold its non-household water and water recycling
retail business to Anglian Water Business (National) Limited, a fellow subsidiary of the group’s
ultimate parent undertaking for a profit of £4.6 million.
8. Net finance costs
2019 2018
£m £m
Finance income
Interest income on short-term bank deposits 3.0 1.9
3.0 1.9 Finance costs
Interest expense on other loans including financing expenses (243.0) (251.4)
Indexation (129.6) (136.9)
Amortisation of debt issue costs (5.0) (6.4)
Interest income on finance leases 0.3 0.4
Amortisation of fair value adjustments 17.0 17.1
Unwinding of discount on onerous lease obligation provision (see note 24) (0.1) (0.2)
Defined benefit pension scheme interest (see note 26) 0.1 (2.3)
Total finance costs (360.3) (379.7)
Less: amounts capitalised on qualifying assets 21.7 16.5
(338.6) (363.2) Fair value (losses)/gains on derivative financial instruments
Fair value (losses)/gains on energy hedges (1.8) 7.3
Hedge ineffectiveness on cash flow hedges (2) 3.4 (1.2)
Hedge ineffectiveness on fair value hedges (1) (0.5) (0.8)
Amortisation of adjustment to debt in fair value hedge (3.5) 1.7
Restructuring costs on derivatives (11.7) -
Derivative financial instruments not designated as hedges (72.1) 115.8
Recycling of de-designated cash flow hedge relationship (12.2) (3.7)
(98.4) 119.1
Finance costs, including fair value (losses)/gains on derivative financial instruments (437.0) (244.1)
Net finance costs (434.0) (242.2)
(1) Hedge ineffectiveness on fair value hedges comprises fair value gains on hedging instruments of £67.0 million
(2018: £72.7 million), offset by fair value losses of £67.5 million on hedged risks (2018: £73.5 million).
(2) Hedge ineffectiveness on cash flows hedges results from instances where the movement in the fair value of the
derivative exceeds the movement in the hedged risk. Ineffectiveness results from fair value gains on
derivatives in cash flow hedge relationships with ineffectiveness of £39.4m offset by fair value losses on the
related hedge risks of £36.0m.
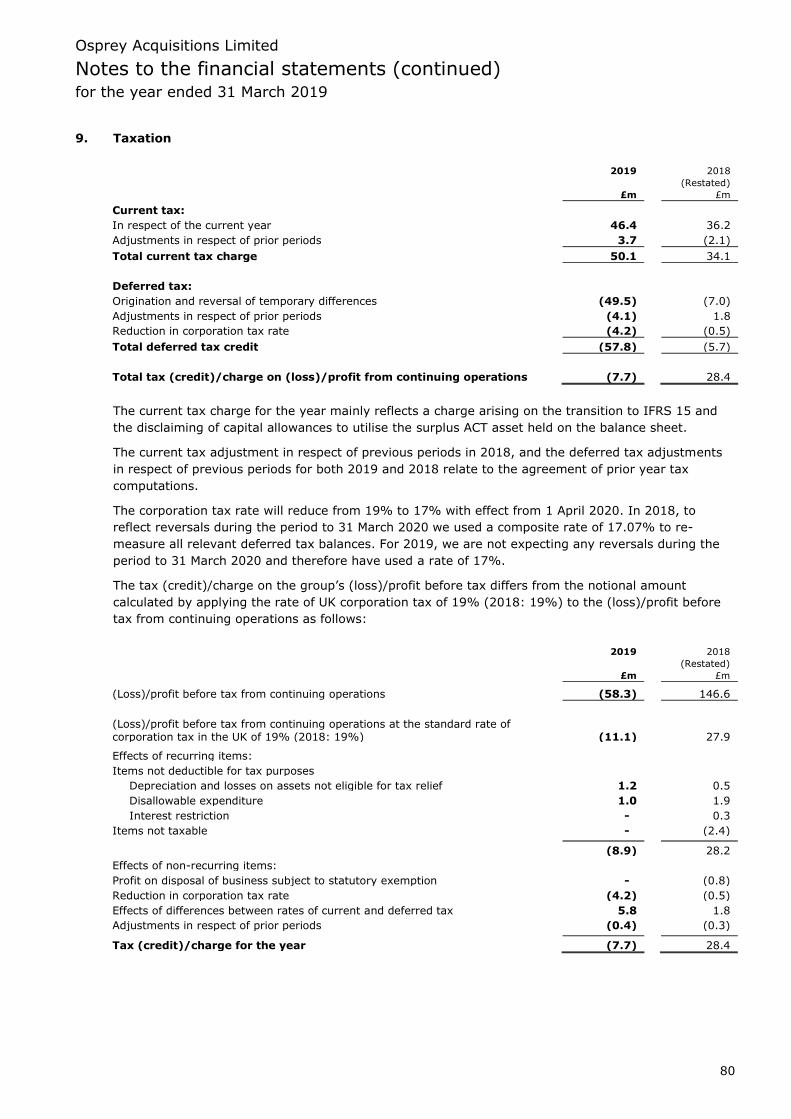
Osprey Acquisitions Limited
Notes to the financial statements (continued) for the year ended 31 March 2019
80
9. Taxation
2019 2018
(Restated)
£m £m
Current tax:
In respect of the current year 46.4 36.2
Adjustments in respect of prior periods 3.7 (2.1)
Total current tax charge 50.1 34.1
Deferred tax:
Origination and reversal of temporary differences (49.5) (7.0)
Adjustments in respect of prior periods (4.1) 1.8
Reduction in corporation tax rate (4.2) (0.5)
Total deferred tax credit (57.8) (5.7)
Total tax (credit)/charge on (loss)/profit from continuing operations (7.7) 28.4
The current tax charge for the year mainly reflects a charge arising on the transition to IFRS 15 and
the disclaiming of capital allowances to utilise the surplus ACT asset held on the balance sheet.
The current tax adjustment in respect of previous periods in 2018, and the deferred tax adjustments
in respect of previous periods for both 2019 and 2018 relate to the agreement of prior year tax
computations.
The corporation tax rate will reduce from 19% to 17% with effect from 1 April 2020. In 2018, to
reflect reversals during the period to 31 March 2020 we used a composite rate of 17.07% to re-
measure all relevant deferred tax balances. For 2019, we are not expecting any reversals during the
period to 31 March 2020 and therefore have used a rate of 17%.
The tax (credit)/charge on the group’s (loss)/profit before tax differs from the notional amount
calculated by applying the rate of UK corporation tax of 19% (2018: 19%) to the (loss)/profit before
tax from continuing operations as follows:
2019 2018
(Restated)
£m £m
(Loss)/profit before tax from continuing operations (58.3) 146.6
(Loss)/profit before tax from continuing operations at the standard rate of corporation tax in the UK of 19% (2018: 19%) (11.1) 27.9
Effects of recurring items:
Items not deductible for tax purposes
Depreciation and losses on assets not eligible for tax relief 1.2 0.5
Disallowable expenditure 1.0 1.9
Interest restriction - 0.3
Items not taxable - (2.4) (8.9) 28.2
Effects of non-recurring items:
Profit on disposal of business subject to statutory exemption - (0.8)
Reduction in corporation tax rate (4.2) (0.5)
Effects of differences between rates of current and deferred tax 5.8 1.8
Adjustments in respect of prior periods (0.4) (0.3) Tax (credit)/charge for the year (7.7) 28.4
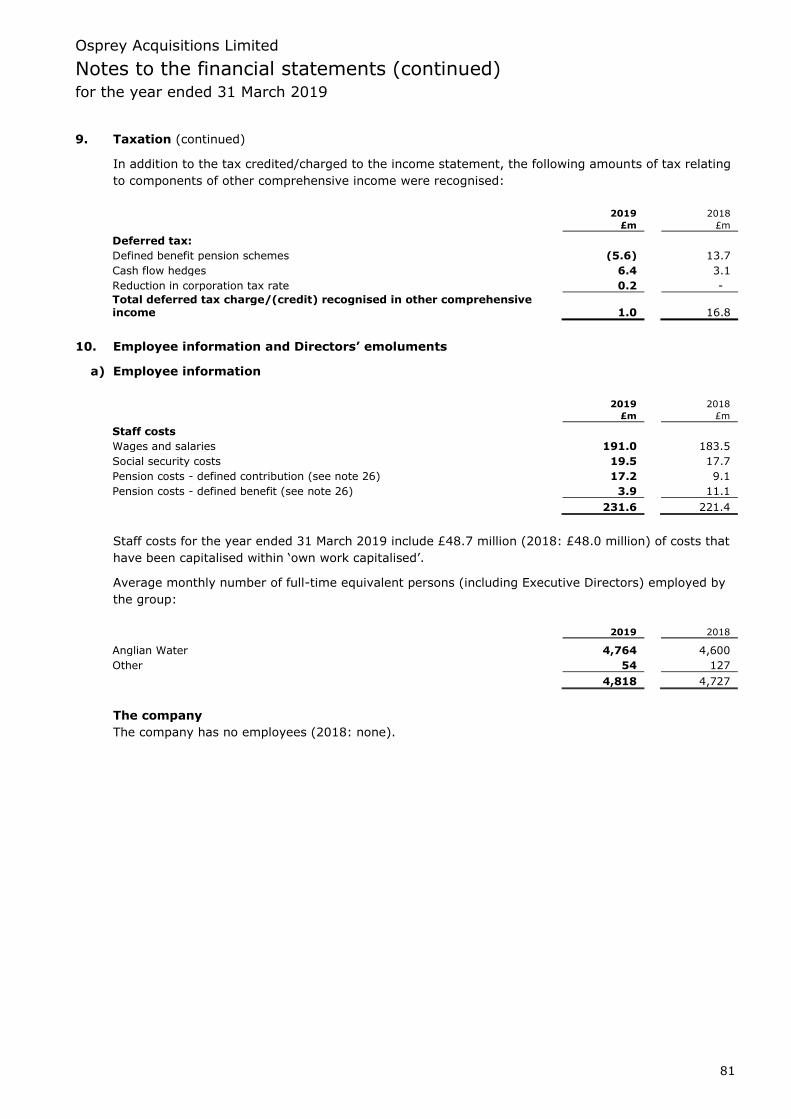
Osprey Acquisitions Limited
Notes to the financial statements (continued) for the year ended 31 March 2019
81
9. Taxation (continued)
In addition to the tax credited/charged to the income statement, the following amounts of tax relating
to components of other comprehensive income were recognised:
2019 2018
£m £m
Deferred tax:
Defined benefit pension schemes (5.6) 13.7
Cash flow hedges 6.4 3.1
Reduction in corporation tax rate 0.2 -
Total deferred tax charge/(credit) recognised in other comprehensive income 1.0 16.8
10. Employee information and Directors’ emoluments
a) Employee information
2019 2018
£m £m
Staff costs
Wages and salaries 191.0 183.5
Social security costs 19.5 17.7
Pension costs - defined contribution (see note 26) 17.2 9.1
Pension costs - defined benefit (see note 26) 3.9 11.1
231.6 221.4
Staff costs for the year ended 31 March 2019 include £48.7 million (2018: £48.0 million) of costs that
have been capitalised within ‘own work capitalised’.
Average monthly number of full-time equivalent persons (including Executive Directors) employed by
the group:
2019 2018
Anglian Water 4,764 4,600
Other 54 127
4,818 4,727
The company
The company has no employees (2018: none).
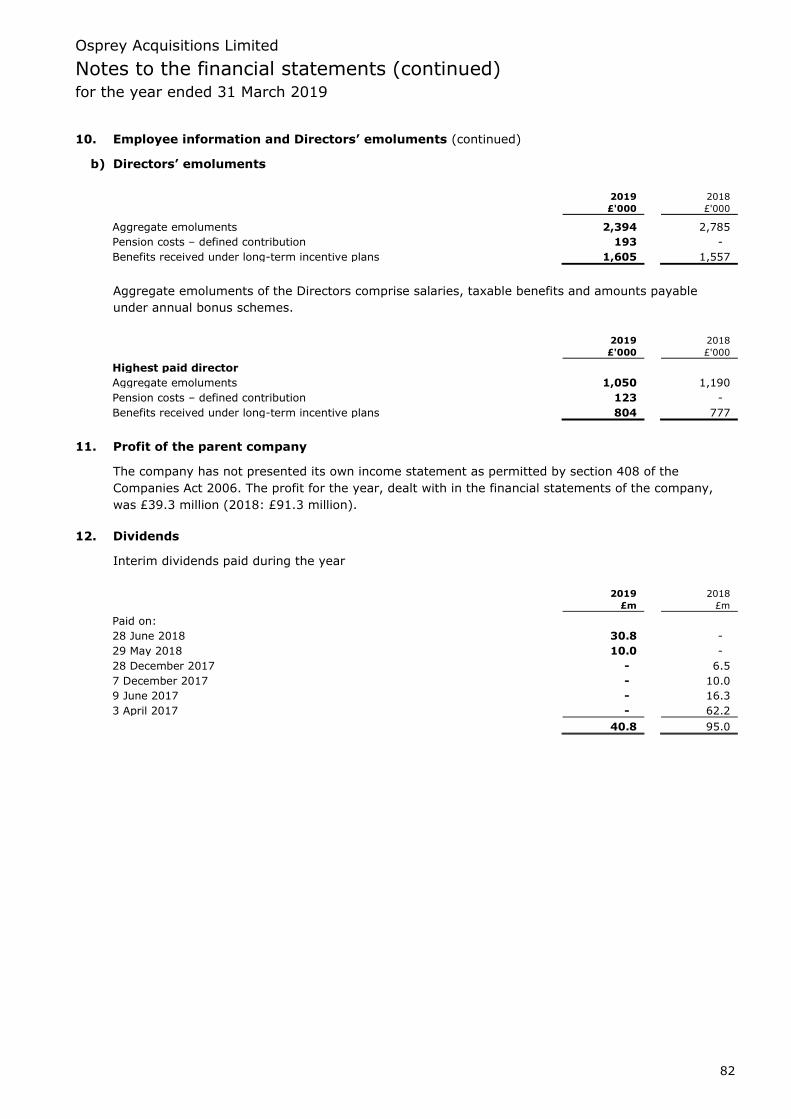
Osprey Acquisitions Limited
Notes to the financial statements (continued) for the year ended 31 March 2019
82
10. Employee information and Directors’ emoluments (continued)
b) Directors’ emoluments
2019 2018
£'000 £'000
Aggregate emoluments 2,394 2,785
Pension costs – defined contribution 193 -
Benefits received under long-term incentive plans 1,605 1,557
Aggregate emoluments of the Directors comprise salaries, taxable benefits and amounts payable
under annual bonus schemes.
2019 2018
£'000 £'000
Highest paid director
Aggregate emoluments 1,050 1,190
Pension costs – defined contribution 123 -
Benefits received under long-term incentive plans 804 777
11. Profit of the parent company
The company has not presented its own income statement as permitted by section 408 of the
Companies Act 2006. The profit for the year, dealt with in the financial statements of the company,
was £39.3 million (2018: £91.3 million).
12. Dividends
Interim dividends paid during the year
2019 2018
£m £m
Paid on:
28 June 2018 30.8 -
29 May 2018 10.0 -
28 December 2017 - 6.5
7 December 2017 - 10.0
9 June 2017 - 16.3
3 April 2017 - 62.2
40.8 95.0
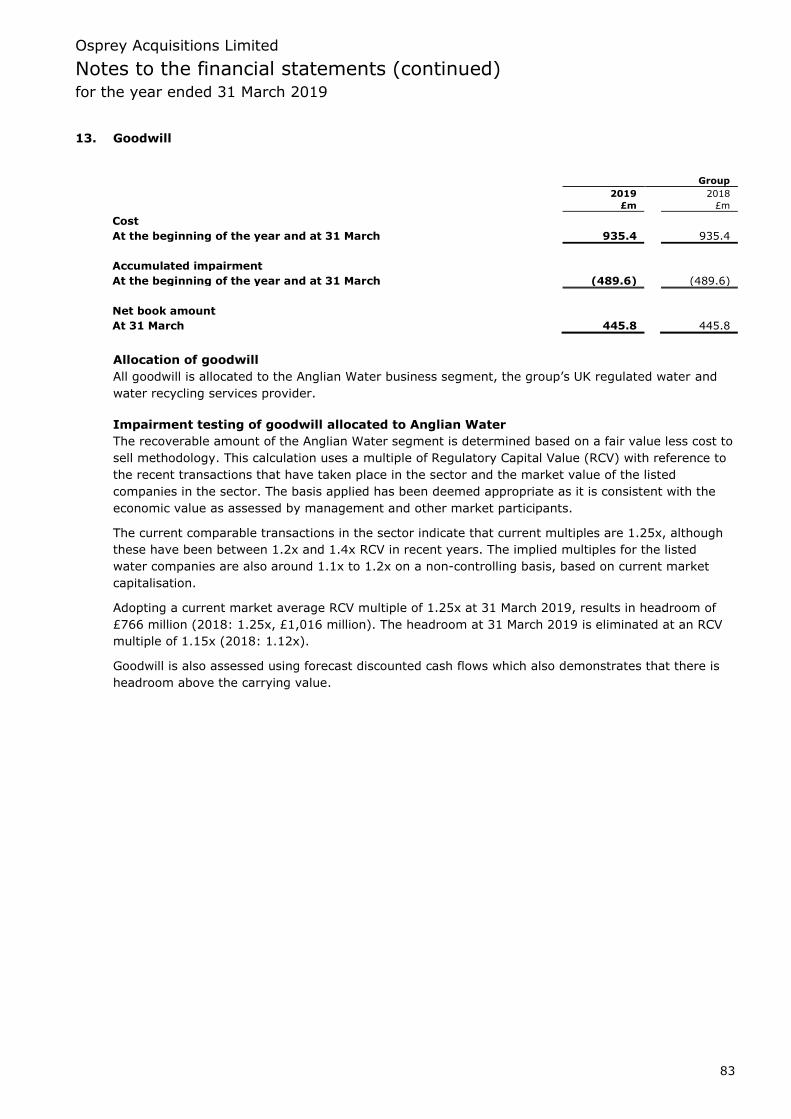
Osprey Acquisitions Limited
Notes to the financial statements (continued) for the year ended 31 March 2019
83
13. Goodwill
Group
2019 2018
£m £m
Cost
At the beginning of the year and at 31 March 935.4 935.4
Accumulated impairment
At the beginning of the year and at 31 March (489.6) (489.6)
Net book amount
At 31 March 445.8 445.8
Allocation of goodwill
All goodwill is allocated to the Anglian Water business segment, the group’s UK regulated water and
water recycling services provider.
Impairment testing of goodwill allocated to Anglian Water
The recoverable amount of the Anglian Water segment is determined based on a fair value less cost to
sell methodology. This calculation uses a multiple of Regulatory Capital Value (RCV) with reference to
the recent transactions that have taken place in the sector and the market value of the listed
companies in the sector. The basis applied has been deemed appropriate as it is consistent with the
economic value as assessed by management and other market participants.
The current comparable transactions in the sector indicate that current multiples are 1.25x, although
these have been between 1.2x and 1.4x RCV in recent years. The implied multiples for the listed
water companies are also around 1.1x to 1.2x on a non-controlling basis, based on current market
capitalisation.
Adopting a current market average RCV multiple of 1.25x at 31 March 2019, results in headroom of
£766 million (2018: 1.25x, £1,016 million). The headroom at 31 March 2019 is eliminated at an RCV
multiple of 1.15x (2018: 1.12x).
Goodwill is also assessed using forecast discounted cash flows which also demonstrates that there is
headroom above the carrying value.

Osprey Acquisitions Limited
Notes to the financial statements (continued) for the year ended 31 March 2019
84
14. Other intangible assets
Right to
Computer operate Internally
software asset generated Total
£m £m £m £m
The group
Cost
At 1 April 2017 397.1 - 72.5 469.6
Additions 45.7 - 20.7 66.4
Disposals (101.8) - - (101.8)
At 31 March 2018 341.0 - 93.2 434.2
Additions 49.5 - 19.9 69.4
Disposals (0.9) - - (0.9)
At 31 March 2019 389.6 - 113.1 502.7
Accumulated amortisation
At 1 April 2017 (298.3) - (31.8) (330.1)
Charge for the year (23.5) - (14.0) (37.5)
Disposals 101.8 - - 101.8
At 31 March 2018 (220.0) - (45.8) (265.8)
Charge for the year (23.0) - (17.3) (40.3)
Disposals 0.9 - - 0.9
At 31 March 2019 (242.1) - (63.1) (305.2)
Net book amount
At 31 March 2019 147.5 - 50.0 197.5
At 31 March 2018 121.0 - 47.4 168.4
The internally generated intangible assets mainly comprise capitalised development expenditure.
Included within additions above is £3.6 million (2018: £2.0 million) of interest that has been
capitalised on qualifying assets, at an average rate of 5.5% (2018: 5.0%).
The continual development of our IT infrastructure and software resulted in the disposal during the
year of intangible assets with an original cost, and accumulated amortisation, of £0.5 million (2018:
£101.8 million) (£nil net book value).
Included within intangible assets above are assets under construction of £89.0 million (2018: £64.1
million) which are not yet subject to amortisation.
The company
The company has no intangible assets (2018: none).

Osprey Acquisitions Limited
Notes to the financial statements (continued) for the year ended 31 March 2019
85
15. Property, plant and equipment
Vehicles,
Infra- mobile Assets
Land and structure Operational plant and under
buildings assets assets equipment construction Total
£m £m £m £m £m £m
The group
Cost
At 1 April 2017 (as previously reported) 55.1 6,566.4 5,698.7 826.3 319.0 13,465.5
Change in accounting policy - IFRS 15 - 5.5 - - - 5.5
At 1 April 2017 (restated) 55.1 6,571.9 5,698.7 826.3 319.0 13,471.0
Additions (restated) - 6.4 - 0.1 432.9 439.4
Transfers on commissioning 0.1 130.2 130.9 45.1 (306.3) -
Disposals (0.1) (2.7) (31.9) (67.5) - (102.2)
At 31 March 2018 (restated) 55.1 6,705.8 5,797.7 804.0 445.6 13,808.2
Additions - - - 0.1 415.2 415.3
Transfers on commissioning 3.1 154.5 247.8 51.5 (456.9) -
Disposals (0.1) - (11.2) (12.8) - (24.1)
At 31 March 2019 58.1 6,860.3 6,034.3 842.8 403.9 14,199.4
Accumulated depreciation
At 1 April 2017 (as previously reported) (7.7) (616.2) (2,753.4) (563.1) - (3,940.4)
Change in accounting policy - IFRS 15 - (0.1) - - - (0.1)
At 1 April 2017 (restated) (7.7) (616.3) (2,753.4) (563.1) - (3,940.5)
Charge for the year (restated) (1) (0.7) (56.4) (192.1) (49.2) - (298.4)
Disposals - 2.7 31.9 66.9 - 101.5
At 31 March 2018 (restated) (8.4) (670.0) (2,913.6) (545.4) - (4,137.4)
Charge for the year (1) (0.7) (55.6) (202.5) (49.9) - (308.7)
Disposals 0.1 - 11.1 12.6 - 23.8
At 31 March 2019 (9.0) (725.6) (3,105.0) (582.7) - (4,422.3)
Net book amount
At 31 March 2019 49.1 6,134.7 2,929.3 260.1 403.9 9,777.1
At 31 March 2018 46.7 6,035.8 2,884.1 258.6 445.6 9,670.8
(1) The depreciation charge for 2019 includes £0.5 million (2018: £10.7 million) in respect of the write-off of
redundant plant and equipment.
Property, plant and equipment at 31 March 2019 includes land of £31.0 million (2018: £28.8 million)
which is not subject to depreciation.
Included within additions above is £18.0 million (2018: £14.5 million) of interest that has been
capitalised on qualifying assets, at an average rate of 5.5% (2018: 5.0%).
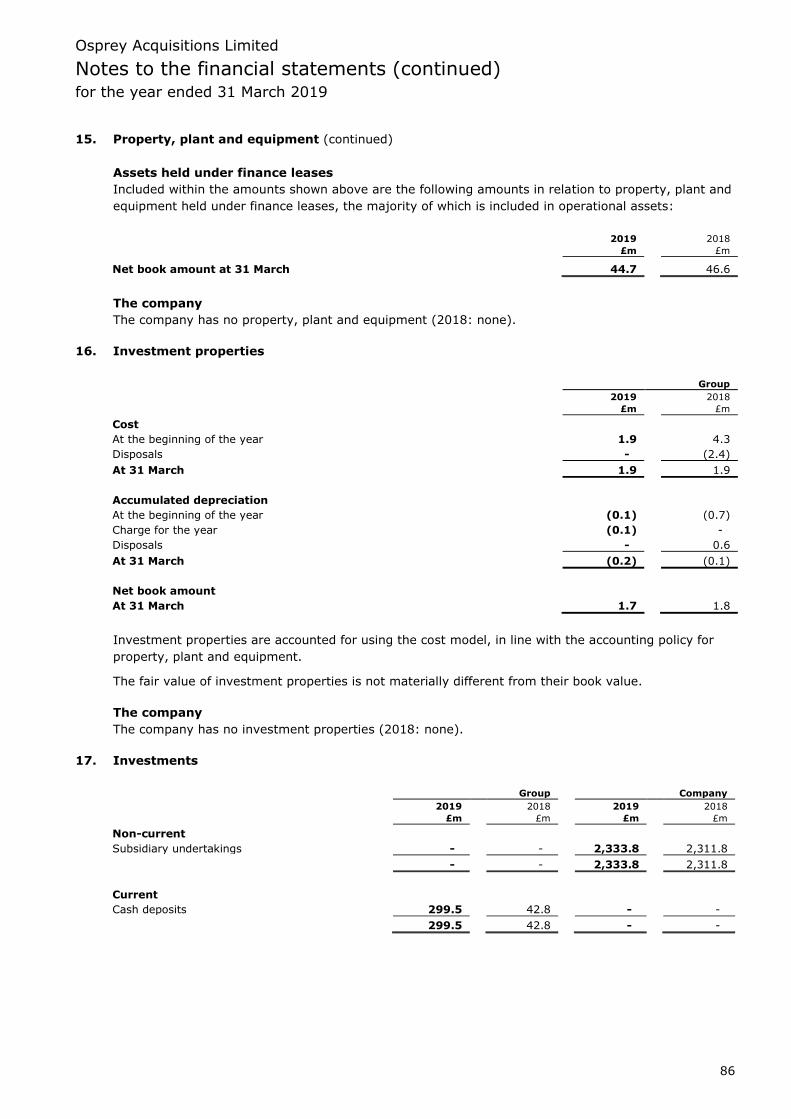
Osprey Acquisitions Limited
Notes to the financial statements (continued) for the year ended 31 March 2019
86
15. Property, plant and equipment (continued)
Assets held under finance leases
Included within the amounts shown above are the following amounts in relation to property, plant and
equipment held under finance leases, the majority of which is included in operational assets:
2019 2018
£m £m
Net book amount at 31 March 44.7 46.6
The company
The company has no property, plant and equipment (2018: none).
16. Investment properties
Group
2019 2018
£m £m
Cost
At the beginning of the year 1.9 4.3
Disposals - (2.4)
At 31 March 1.9 1.9
Accumulated depreciation
At the beginning of the year (0.1) (0.7)
Charge for the year (0.1) -
Disposals - 0.6
At 31 March (0.2) (0.1)
Net book amount
At 31 March 1.7 1.8
Investment properties are accounted for using the cost model, in line with the accounting policy for
property, plant and equipment.
The fair value of investment properties is not materially different from their book value.
The company
The company has no investment properties (2018: none).
17. Investments
Group Company 2019 2018 2019 2018
£m £m £m £m
Non-current
Subsidiary undertakings - - 2,333.8 2,311.8
- - 2,333.8 2,311.8
Current
Cash deposits 299.5 42.8 - -
299.5 42.8 - -

Osprey Acquisitions Limited
Notes to the financial statements (continued) for the year ended 31 March 2019
87
17. Investments (continued)
a) Joint ventures
A full listing of group’s joint ventures can be found in note 36, none of which are material to the
group.
The joint ventures have no significant contingent liabilities to which the group is exposed.
b) Subsidiary undertakings
Shares in
subsidiary
undertakings
£m
The company
Cost
At 1 April 2017 and 31 March 2018 2,311.8
Additions 22.0
At 31 March 2019 2,333.8
The Directors are of the opinion that the value of the investments is supported by the underlying
assets.
Subsidiary undertakings are listed in note 36.
18. Inventories
Group
2019 2018
£m £m
Raw materials and consumables 11.6 10.0
Work in progress 7.7 9.9
19.3 19.9
Work in progress comprises the cost of properties held for development.
The company
The company has no inventories (2018: none).
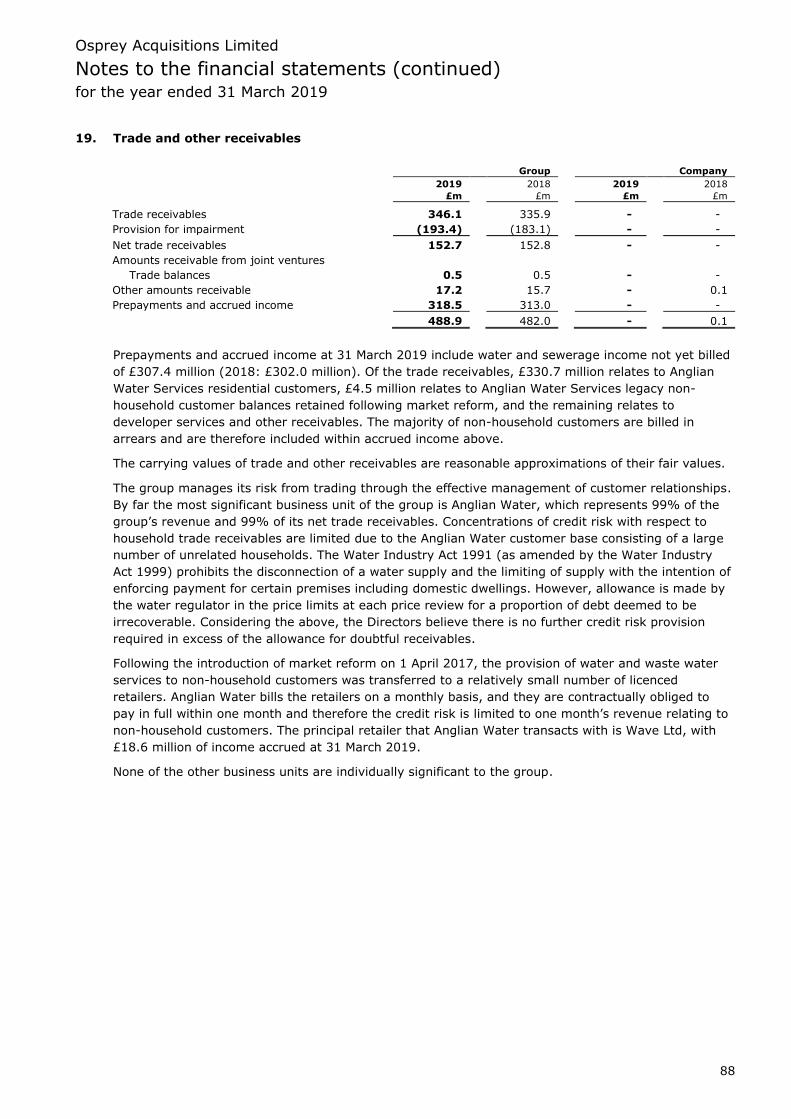
Osprey Acquisitions Limited
Notes to the financial statements (continued) for the year ended 31 March 2019
88
19. Trade and other receivables
Group Company
2019 2018 2019 2018
£m £m £m £m
Trade receivables 346.1 335.9 - -
Provision for impairment (193.4) (183.1) - -
Net trade receivables 152.7 152.8 - -
Amounts receivable from joint ventures
Trade balances 0.5 0.5 - -
Other amounts receivable 17.2 15.7 - 0.1
Prepayments and accrued income 318.5 313.0 - -
488.9 482.0 - 0.1
Prepayments and accrued income at 31 March 2019 include water and sewerage income not yet billed
of £307.4 million (2018: £302.0 million). Of the trade receivables, £330.7 million relates to Anglian
Water Services residential customers, £4.5 million relates to Anglian Water Services legacy non-
household customer balances retained following market reform, and the remaining relates to
developer services and other receivables. The majority of non-household customers are billed in
arrears and are therefore included within accrued income above.
The carrying values of trade and other receivables are reasonable approximations of their fair values.
The group manages its risk from trading through the effective management of customer relationships.
By far the most significant business unit of the group is Anglian Water, which represents 99% of the
group’s revenue and 99% of its net trade receivables. Concentrations of credit risk with respect to
household trade receivables are limited due to the Anglian Water customer base consisting of a large
number of unrelated households. The Water Industry Act 1991 (as amended by the Water Industry
Act 1999) prohibits the disconnection of a water supply and the limiting of supply with the intention of
enforcing payment for certain premises including domestic dwellings. However, allowance is made by
the water regulator in the price limits at each price review for a proportion of debt deemed to be
irrecoverable. Considering the above, the Directors believe there is no further credit risk provision
required in excess of the allowance for doubtful receivables.
Following the introduction of market reform on 1 April 2017, the provision of water and waste water
services to non-household customers was transferred to a relatively small number of licenced
retailers. Anglian Water bills the retailers on a monthly basis, and they are contractually obliged to
pay in full within one month and therefore the credit risk is limited to one month’s revenue relating to
non-household customers. The principal retailer that Anglian Water transacts with is Wave Ltd, with
£18.6 million of income accrued at 31 March 2019.
None of the other business units are individually significant to the group.
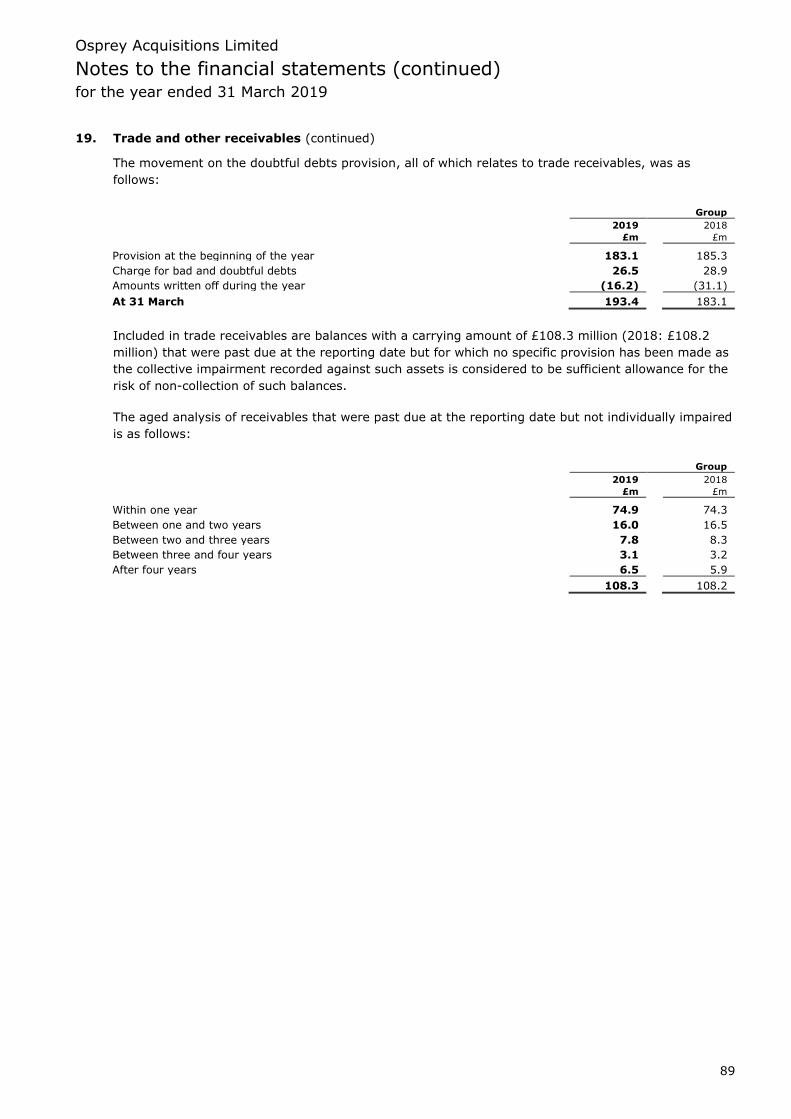
Osprey Acquisitions Limited
Notes to the financial statements (continued) for the year ended 31 March 2019
89
19. Trade and other receivables (continued)
The movement on the doubtful debts provision, all of which relates to trade receivables, was as
follows:
Group
2019 2018
£m £m
Provision at the beginning of the year 183.1 185.3
Charge for bad and doubtful debts 26.5 28.9
Amounts written off during the year (16.2) (31.1)
At 31 March 193.4 183.1
Included in trade receivables are balances with a carrying amount of £108.3 million (2018: £108.2
million) that were past due at the reporting date but for which no specific provision has been made as
the collective impairment recorded against such assets is considered to be sufficient allowance for the
risk of non-collection of such balances.
The aged analysis of receivables that were past due at the reporting date but not individually impaired
is as follows:
Group
2019 2018
£m £m
Within one year 74.9 74.3
Between one and two years 16.0 16.5
Between two and three years 7.8 8.3
Between three and four years 3.1 3.2
After four years 6.5 5.9
108.3 108.2
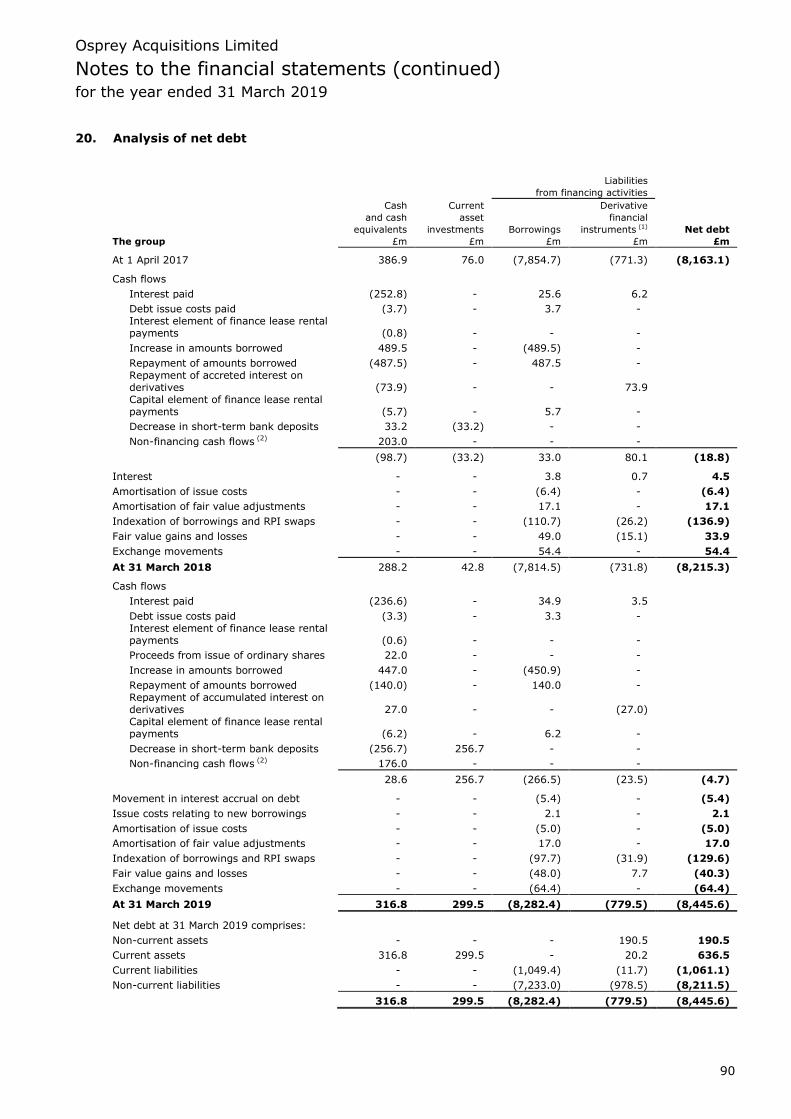
Osprey Acquisitions Limited
Notes to the financial statements (continued) for the year ended 31 March 2019
90
20. Analysis of net debt
Liabilities
from financing activities
Cash Current Derivative
and cash asset financial
equivalents investments Borrowings instruments (1) Net debt
The group £m £m £m £m £m
At 1 April 2017 386.9 76.0 (7,854.7) (771.3) (8,163.1)
Cash flows
Interest paid (252.8) - 25.6 6.2
Debt issue costs paid (3.7) - 3.7 -
Interest element of finance lease rental payments (0.8) - - -
Increase in amounts borrowed 489.5 - (489.5) -
Repayment of amounts borrowed (487.5) - 487.5 -
Repayment of accreted interest on derivatives (73.9) - - 73.9
Capital element of finance lease rental payments (5.7) - 5.7 -
Decrease in short-term bank deposits 33.2 (33.2) - -
Non-financing cash flows (2) 203.0 - - -
(98.7) (33.2) 33.0 80.1 (18.8)
Interest - - 3.8 0.7 4.5
Amortisation of issue costs - - (6.4) - (6.4)
Amortisation of fair value adjustments - - 17.1 - 17.1
Indexation of borrowings and RPI swaps - - (110.7) (26.2) (136.9)
Fair value gains and losses - - 49.0 (15.1) 33.9
Exchange movements - - 54.4 - 54.4
At 31 March 2018 288.2 42.8 (7,814.5) (731.8) (8,215.3)
Cash flows
Interest paid (236.6) - 34.9 3.5
Debt issue costs paid (3.3) - 3.3 -
Interest element of finance lease rental payments (0.6) - - -
Proceeds from issue of ordinary shares 22.0 - - -
Increase in amounts borrowed 447.0 - (450.9) -
Repayment of amounts borrowed (140.0) - 140.0 -
Repayment of accumulated interest on derivatives 27.0 - - (27.0)
Capital element of finance lease rental payments (6.2) - 6.2 -
Decrease in short-term bank deposits (256.7) 256.7 - -
Non-financing cash flows (2) 176.0 - - -
28.6 256.7 (266.5) (23.5) (4.7)
Movement in interest accrual on debt - - (5.4) - (5.4)
Issue costs relating to new borrowings - - 2.1 - 2.1
Amortisation of issue costs - - (5.0) - (5.0)
Amortisation of fair value adjustments - - 17.0 - 17.0
Indexation of borrowings and RPI swaps - - (97.7) (31.9) (129.6)
Fair value gains and losses - - (48.0) 7.7 (40.3)
Exchange movements - - (64.4) - (64.4)
At 31 March 2019 316.8 299.5 (8,282.4) (779.5) (8,445.6)
Net debt at 31 March 2019 comprises:
Non-current assets - - - 190.5 190.5
Current assets 316.8 299.5 - 20.2 636.5
Current liabilities - - (1,049.4) (11.7) (1,061.1)
Non-current liabilities - - (7,233.0) (978.5) (8,211.5)
316.8 299.5 (8,282.4) (779.5) (8,445.6)

Osprey Acquisitions Limited
Notes to the financial statements (continued) for the year ended 31 March 2019
91
20. Analysis of net debt (continued)
(1) Derivative financial instruments exclude the liability of £1.0 million (2018: £9.1 million) in respect
of the fair value of energy hedges, as these are not classified as part of net debt.
(2) Non-financing cash flows comprise: net cash flows from operating activities of £682.2 million
(2018: £665.3 million), less net cash used in investing activities of £465.4 million (2018: £367.3
million) and dividends paid of £40.8 (2018: £95.0 million).
Energy hedges, excluded from net debt, are included within derivative financial instruments as
follows:
2019 2018
£m £m
Non-current assets 5.1 0.8
Current assets 0.1 0.7
Current liabilities (4.3) (3.9)
Non-current liabilities (1.9) (6.7)
(1.0) (9.1)
Current asset investments above comprise £299.5 million (2018: £42.8 million) of short-term cash
deposits with an original maturity of more than three months.
At 31 March 2019, £257.3 million (2018: £247.1 million) of the group’s cash and cash equivalents and
£297.0 million (2018: £40.0 million) of the short-term deposits were held in the Anglian Water
Services Holdings Limited group. In order for these amounts to be made available to the rest of the
group, Anglian Water Services Limited must satisfy certain covenants, which were put in place on 30
July 2002 following a financial restructuring, prior to declaring dividends. A further £0.2 million (2018:
£0.3 million) of the group’s cash and cash equivalents was held as collateral for outstanding loan
notes. In addition, £1.8 million (2018: £1.4 million) of the group’s cash and cash equivalents and £2.5
million (2018: £2.8 million) of the short-term deposits were held by Rutland Insurance Limited (the
group’s insurance captive) in order to maintain its required solvency ratio.

Osprey Acquisitions Limited
Notes to the financial statements (continued) for the year ended 31 March 2019
92
20. Analysis of net debt (continued)
Liabilities
from financing activities
Cash Derivative
and cash financial
equivalents Borrowings instruments Net debt
£m £m £m £m
The company
At 1 April 2017 19.5 (1,181.4) (4.5) (1,166.4) Cash flows - - - -
Interest paid (36.7) - 4.4 (32.3)
Issue costs paid (2.0) 2.0 - -
Increase in amounts borrowed 240.0 (240.0) - -
Repayment of amounts borrowed (239.8) 239.8 - -
Other cash flows 30.4 - - 30.4
(8.1) 1.8 4.4 (1.9)
Movement in interest accrual on debt - 2.2 3.0 5.2
Amortisation of debt issue costs - (2.7) - (2.7)
Fair value gains and losses - - (2.9) (2.9)
At 31 March 2018 11.4 (1,180.1) - (1,168.7)
Cash flows
Interest paid (21.3) - - (21.3)
Proceeds from issue of ordinary shares 22.0 - - 22.0
Other cash flows 1.1 - - 1.1
1.8 - - 1.8
Amortisation of debt issue costs - (0.8) - (0.8)
At 31 March 2019 13.2 (1,180.9) - (1,167.7)
At 31 March 2018
Current assets 13.2 - - 13.2
Current liabilities - (733.6) - (733.6)
Non-current liabilities - (447.3) - (447.3)
13.2 (1,180.9) - (1,167.7)

Osprey Acquisitions Limited
Notes to the financial statements (continued) for the year ended 31 March 2019
93
21. Trade and other payables
Group
2019 2018
(Restated)
£m £m
Current
Trade payables 29.9 29.8
Capital creditors and accruals 87.9 115.6
Receipts in advance 299.8 292.9
Other taxes and social security 4.9 5.5
Accruals and deferred income 68.3 69.7
Other payables 11.3 9.6
502.1 523.1
Receipts in advance includes £254.2 million (2018: £252.9 million) relating to amounts received from
customers for water and sewerage charges in respect of bills that fall due in the following year.
Amounts relating to capital creditors and accruals have been separately presented in the above table
to aid consistency with the presentation required by Ofwat in the Annual Performance Report of
Anglian Water Services Limited.
The Directors consider that the carrying values of trade and other payables is not materially different
from their fair values.
The company
The company had no trade and other payables (2018: none).
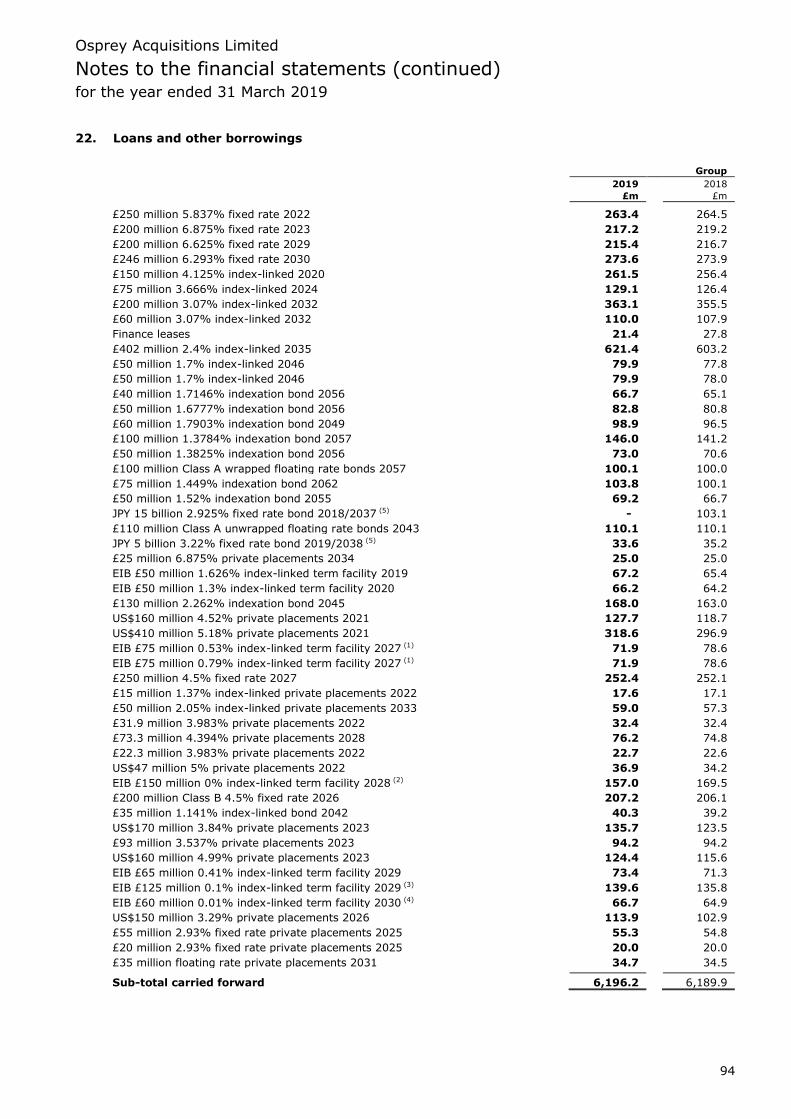
Osprey Acquisitions Limited
Notes to the financial statements (continued) for the year ended 31 March 2019
94
22. Loans and other borrowings
Group
2019 2018
£m £m
£250 million 5.837% fixed rate 2022 263.4 264.5
£200 million 6.875% fixed rate 2023 217.2 219.2
£200 million 6.625% fixed rate 2029 215.4 216.7
£246 million 6.293% fixed rate 2030 273.6 273.9
£150 million 4.125% index-linked 2020 261.5 256.4
£75 million 3.666% index-linked 2024 129.1 126.4
£200 million 3.07% index-linked 2032 363.1 355.5
£60 million 3.07% index-linked 2032 110.0 107.9
Finance leases 21.4 27.8
£402 million 2.4% index-linked 2035 621.4 603.2
£50 million 1.7% index-linked 2046 79.9 77.8
£50 million 1.7% index-linked 2046 79.9 78.0
£40 million 1.7146% indexation bond 2056 66.7 65.1
£50 million 1.6777% indexation bond 2056 82.8 80.8
£60 million 1.7903% indexation bond 2049 98.9 96.5
£100 million 1.3784% indexation bond 2057 146.0 141.2
£50 million 1.3825% indexation bond 2056 73.0 70.6
£100 million Class A wrapped floating rate bonds 2057 100.1 100.0
£75 million 1.449% indexation bond 2062 103.8 100.1
£50 million 1.52% indexation bond 2055 69.2 66.7
JPY 15 billion 2.925% fixed rate bond 2018/2037 (5) - 103.1
£110 million Class A unwrapped floating rate bonds 2043 110.1 110.1
JPY 5 billion 3.22% fixed rate bond 2019/2038 (5) 33.6 35.2
£25 million 6.875% private placements 2034 25.0 25.0
EIB £50 million 1.626% index-linked term facility 2019 67.2 65.4
EIB £50 million 1.3% index-linked term facility 2020 66.2 64.2
£130 million 2.262% indexation bond 2045 168.0 163.0
US$160 million 4.52% private placements 2021 127.7 118.7
US$410 million 5.18% private placements 2021 318.6 296.9
EIB £75 million 0.53% index-linked term facility 2027 (1) 71.9 78.6
EIB £75 million 0.79% index-linked term facility 2027 (1) 71.9 78.6
£250 million 4.5% fixed rate 2027 252.4 252.1
£15 million 1.37% index-linked private placements 2022 17.6 17.1
£50 million 2.05% index-linked private placements 2033 59.0 57.3
£31.9 million 3.983% private placements 2022 32.4 32.4
£73.3 million 4.394% private placements 2028 76.2 74.8
£22.3 million 3.983% private placements 2022 22.7 22.6
US$47 million 5% private placements 2022 36.9 34.2
EIB £150 million 0% index-linked term facility 2028 (2) 157.0 169.5
£200 million Class B 4.5% fixed rate 2026 207.2 206.1
£35 million 1.141% index-linked bond 2042 40.3 39.2
US$170 million 3.84% private placements 2023 135.7 123.5
£93 million 3.537% private placements 2023 94.2 94.2
US$160 million 4.99% private placements 2023 124.4 115.6
EIB £65 million 0.41% index-linked term facility 2029 73.4 71.3
EIB £125 million 0.1% index-linked term facility 2029 (3) 139.6 135.8
EIB £60 million 0.01% index-linked term facility 2030 (4) 66.7 64.9
US$150 million 3.29% private placements 2026 113.9 102.9
£55 million 2.93% fixed rate private placements 2025 55.3 54.8
£20 million 2.93% fixed rate private placements 2025 20.0 20.0
£35 million floating rate private placements 2031 34.7 34.5
Sub-total carried forward 6,196.2 6,189.9

Osprey Acquisitions Limited
Notes to the financial statements (continued) for the year ended 31 March 2019
95
22. Loans and other borrowings (continued)
Group
2019 2018
£m £m
Sub-total brought forward 6,196.2 6,189.9
£200 million Class B 2.6225% fixed rate 2027 199.9 197.3
£250 million Green Bond 1.625% fixed rate 2025 250.6 244.4
£300 million Green bond 2.75% 2029 299.4 -
£25 million 3.0% fixed rate 2031 25.0 -
US$53 million 3.053% fixed rate 2029 40.8 -
£85 million 2.88% fixed rate 2029 85.0 -
£65 million 2.87% fixed rate 2029 (0.3) -
£65 million CPI 0.835% 2040 (0.4) -
Liquidity facilities 0.4 -
£210 million Class B 5.0% fixed rate bond 2023 213.1 212.8
£240 million Class B 4.0% fixed rate bond 2026 238.9 238.7
Loan notes 0.3 0.3
£729 million interest free loan 728.8 728.8
Unamortised issue costs relating to undrawn facilities (1.1) (2.4)
Other loans 5.8 4.7
Total loans and other borrowings 8,282.4 7,814.5
Included in:
Current liabilities 1,049.4 959.0
Non-current liabilities 7,233.0 6,855.5
Company
2019 2018
£m £m
£210 million Class B 5.0% fixed rate bond 2023 213.1 212.8
£240 million Class B 4.0% fixed rate bond 2026 238.9 238.7
Loan notes 0.3 0.3
£729 million interest free loan 728.8 728.8
Unamortised issue costs relating to undrawn facilities (0.2) (0.5)
Total loans and other borrowings 1,180.9 1,180.1
Included in:
Current liabilities 733.6 734.2
Non-current liabilities 447.3 445.9
(1) These instruments are amortising from 2017 until the date of maturity shown.
(2) This instrument is amortising from 2018 until the date of maturity shown.
(3) This instrument is amortising from 2019 until the date of maturity shown.
(4) This instrument is amortising from 2020 until the date of maturity shown.
(5) Legal maturity of these instruments is the second of the two years quoted. Coupon ‘step-up’ is in
the first of the years quoted in accordance with the pricing terms agreed at issue. These notes
have been called in line with the terms at issue and therefore have already redeemed or will
redeem at the earlier date quoted.
(6) This loan is due to the immediate parent undertaking.
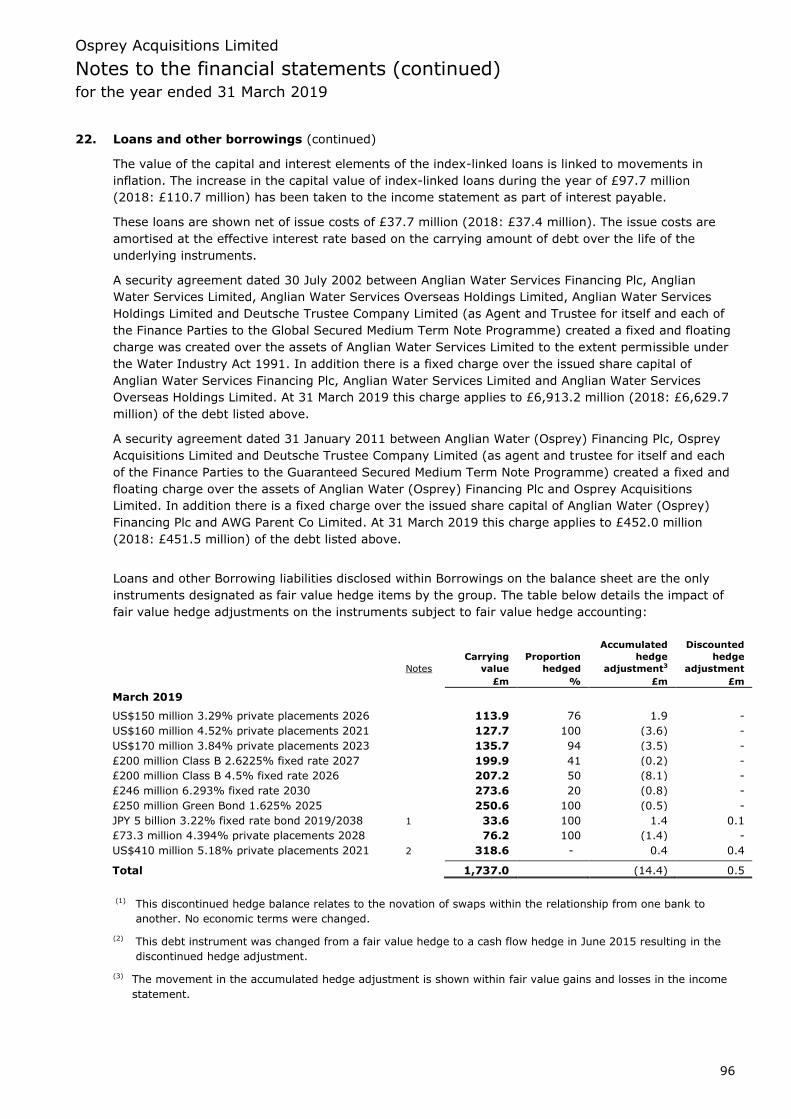
Osprey Acquisitions Limited
Notes to the financial statements (continued) for the year ended 31 March 2019
96
22. Loans and other borrowings (continued)
The value of the capital and interest elements of the index-linked loans is linked to movements in
inflation. The increase in the capital value of index-linked loans during the year of £97.7 million
(2018: £110.7 million) has been taken to the income statement as part of interest payable.
These loans are shown net of issue costs of £37.7 million (2018: £37.4 million). The issue costs are
amortised at the effective interest rate based on the carrying amount of debt over the life of the
underlying instruments.
A security agreement dated 30 July 2002 between Anglian Water Services Financing Plc, Anglian
Water Services Limited, Anglian Water Services Overseas Holdings Limited, Anglian Water Services
Holdings Limited and Deutsche Trustee Company Limited (as Agent and Trustee for itself and each of
the Finance Parties to the Global Secured Medium Term Note Programme) created a fixed and floating
charge was created over the assets of Anglian Water Services Limited to the extent permissible under
the Water Industry Act 1991. In addition there is a fixed charge over the issued share capital of
Anglian Water Services Financing Plc, Anglian Water Services Limited and Anglian Water Services
Overseas Holdings Limited. At 31 March 2019 this charge applies to £6,913.2 million (2018: £6,629.7
million) of the debt listed above.
A security agreement dated 31 January 2011 between Anglian Water (Osprey) Financing Plc, Osprey
Acquisitions Limited and Deutsche Trustee Company Limited (as agent and trustee for itself and each
of the Finance Parties to the Guaranteed Secured Medium Term Note Programme) created a fixed and
floating charge over the assets of Anglian Water (Osprey) Financing Plc and Osprey Acquisitions
Limited. In addition there is a fixed charge over the issued share capital of Anglian Water (Osprey)
Financing Plc and AWG Parent Co Limited. At 31 March 2019 this charge applies to £452.0 million
(2018: £451.5 million) of the debt listed above.
Loans and other Borrowing liabilities disclosed within Borrowings on the balance sheet are the only
instruments designated as fair value hedge items by the group. The table below details the impact of
fair value hedge adjustments on the instruments subject to fair value hedge accounting:
Accumulated Discounted
Carrying Proportion hedge hedge
Notes value hedged adjustment3 adjustment
£m % £m £m
March 2019
US$150 million 3.29% private placements 2026 113.9 76 1.9 -
US$160 million 4.52% private placements 2021 127.7 100 (3.6) -
US$170 million 3.84% private placements 2023 135.7 94 (3.5) -
£200 million Class B 2.6225% fixed rate 2027 199.9 41 (0.2) -
£200 million Class B 4.5% fixed rate 2026 207.2 50 (8.1) -
£246 million 6.293% fixed rate 2030 273.6 20 (0.8) -
£250 million Green Bond 1.625% 2025 250.6 100 (0.5) -
JPY 5 billion 3.22% fixed rate bond 2019/2038 1 33.6 100 1.4 0.1
£73.3 million 4.394% private placements 2028 76.2 100 (1.4) -
US$410 million 5.18% private placements 2021 2 318.6 - 0.4 0.4
Total 1,737.0 (14.4) 0.5
(1) This discontinued hedge balance relates to the novation of swaps within the relationship from one bank to
another. No economic terms were changed.
(2) This debt instrument was changed from a fair value hedge to a cash flow hedge in June 2015 resulting in the
discontinued hedge adjustment.
(3) The movement in the accumulated hedge adjustment is shown within fair value gains and losses in the income
statement.
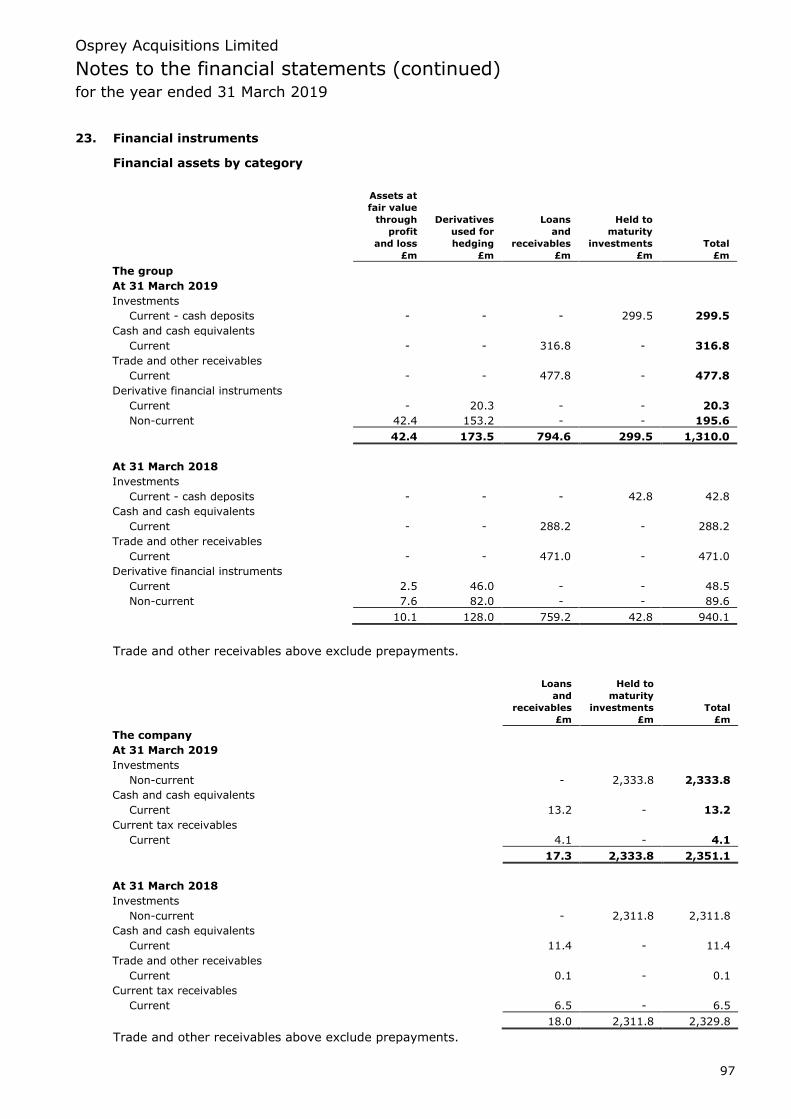
Osprey Acquisitions Limited
Notes to the financial statements (continued) for the year ended 31 March 2019
97
23. Financial instruments
Financial assets by category
Assets at
fair value
through Derivatives Loans Held to
profit used for and maturity
and loss hedging receivables investments Total
£m £m £m £m £m
The group
At 31 March 2019
Investments
Current - cash deposits - - - 299.5 299.5
Cash and cash equivalents
Current - - 316.8 - 316.8
Trade and other receivables
Current - - 477.8 - 477.8
Derivative financial instruments
Current - 20.3 - - 20.3
Non-current 42.4 153.2 - - 195.6
42.4 173.5 794.6 299.5 1,310.0
At 31 March 2018
Investments
Current - cash deposits - - - 42.8 42.8
Cash and cash equivalents
Current - - 288.2 - 288.2
Trade and other receivables
Current - - 471.0 - 471.0
Derivative financial instruments
Current 2.5 46.0 - - 48.5
Non-current 7.6 82.0 - - 89.6
10.1 128.0 759.2 42.8 940.1
Trade and other receivables above exclude prepayments.
Loans Held to
and maturity
receivables investments Total
£m £m £m
The company
At 31 March 2019
Investments
Non-current - 2,333.8 2,333.8
Cash and cash equivalents
Current 13.2 - 13.2
Current tax receivables
Current 4.1 - 4.1
17.3 2,333.8 2,351.1
At 31 March 2018
Investments
Non-current - 2,311.8 2,311.8
Cash and cash equivalents
Current 11.4 - 11.4
Trade and other receivables
Current 0.1 - 0.1
Current tax receivables
Current 6.5 - 6.5
18.0 2,311.8 2,329.8
Trade and other receivables above exclude prepayments.

Osprey Acquisitions Limited
Notes to the financial statements (continued) for the year ended 31 March 2019
98
23. Financial instruments (continued)
Financial liabilities by category
Liabilities at Other
fair value liabilities
through Derivatives held at
profit used for amortised
and loss hedging cost Total
£m £m £m £m
The group
At 31 March 2019
Borrowings
Current - - 1,049.4 1,049.4
Non-current - - 7,233.0 7,233.0
Trade and other payables
Current - - 202.3 202.3
Derivative financial instruments
Current 12.5 3.5 - 16.0
Non-current 960.7 19.7 - 980.4
973.2 23.2 8,484.7 9,481.1
At 31 March 2018
Borrowings
Current - - 959.0 959.0
Non-current - - 6,855.5 6,855.5
Trade and other payables
Current - - 230.2 230.2
Derivative financial instruments
Current 14.7 1.7 - 16.4
Non-current 755.9 106.7 - 862.6
770.6 108.4 8,044.7 8,923.7
Trade and other payables above exclude receipts in advance.
Liabilities at Other
fair value liabilities
through Derivatives held at
profit used for amortised
and loss hedging cost Total
£m £m £m £m
The company
At 31 March 2019
Borrowings
Current - - 733.6 733.6
Non-current - - 447.3 447.3
- - 1,180.9 1,180.9
At 31 March 2018
Borrowings
Current - - 734.2 734.2
Non-current - - 445.9 445.9
- - 1,180.1 1,180.1
Trade and other payables above exclude receipts in advance.

Osprey Acquisitions Limited
Notes to the financial statements (continued) for the year ended 31 March 2019
99
23. Financial instruments (continued)
Derivative financial instruments
2019 2018
Assets Liabilities Assets Liabilities
£m £m £m £m
The group
Designated as cash flow hedges
Interest rate swaps - (17.0) - (96.7)
Cross-currency interest rate swaps 85.0 - 38.9 (1.3)
Energy swaps 5.2 (6.2) - -
90.2 (23.2) 38.9 (98.0)
Designated as fair value hedges
Interest rate swaps 13.1 - 8.9 (7.7)
Cross-currency interest rate swaps 70.2 - 80.2 (2.7)
83.3 - 89.1 (10.4)
Derivative financial instruments designated as hedges 173.5 (23.2) 128.0 (108.4)
Derivative financial instruments not designated as hedges:
Interest rate swaps and swaptions 11.7 (225.1) 8.6 (221.4)
RPI swaps - (607.0) - (538.6)
CPI swaps 30.7 (141.1) - -
Energy swaps - - 1.5 (10.6) Total derivative financial instruments 215.9 (996.4) 138.1 (879.0)
Derivative financial instruments can be analysed as follows:
Current 20.3 (16.0) 48.5 (16.4)
Non-current 195.6 (980.4) 89.6 (862.6)
215.9 (996.4) 138.1 (879.0)
The company
The company has no derivative financial instruments (2018: none).

Osprey Acquisitions Limited
Notes to the financial statements (continued) for the year ended 31 March 2019
100
23. Financial instruments (continued)
Derivative financial instruments (continued)
At 31 March 2019 the fixed interest rates vary from 2.84% to 5.99%, floating rates vary from 0.85%
(LIBOR plus 0.0 bps) to 3.94% (LIBOR plus 298.70 bps), RPI-linked interest rates vary from 0.81%
to 2.97% plus RPI and CPI-linked interest rates vary from (0.90)% plus CPI to 1.69% plus CPI. Gains
and losses recognised in the hedging reserve in equity on interest rate and cross-currency interest
rate swap contracts will be continuously released to the income statement within finance costs in line
with the repayment of the related borrowings, or in the case of highly probable forecast transactions
the release from the reserve will occur over the period during which the hedged forecast transaction
affects the income statement. Gains and losses recognised in the hedging reserve in equity on energy
hedges will be released to the income statement within finance costs in line with the expiry of the
power season to which the gains and losses relate.
In accordance with IFRS 9 the group has reviewed all contracts for embedded derivatives that are
required to be separately accounted for if they do not meet certain requirements set out in the
standard. There were no amounts recorded in the income statement for gains or losses on embedded
derivatives for the year ended 31 March 2019 (2018: £nil).
Finance leases
The minimum lease payments under finance leases fall due as follows:
Group
2019 2018
£m £m
Within one year 6.7 6.5
Between two and five years 15.0 22.1
After five years - 0.4
21.7 29.0
Future finance charges on finance leases (0.3) (1.2)
Present value of finance lease liabilities 21.4 27.8
Fair value of financial assets and liabilities
2019 2018
Book Fair Book Fair
value value value value
£m £m £m £m
The group
Cash and cash equivalents 316.8 316.8 288.2 288.2
Current asset investments - cash deposits 299.5 299.5 42.8 42.8
Borrowings
Current (1,049.4) (1,049.7) (959.0) (961.5)
Non-current (7,233.0) (8,116.8) (6,855.5) (8,188.0)
Derivative financial instruments, excluding RPI swaps and energy hedging
Current 16.6 16.6 43.7 43.7
Non-current (78.7) (78.7) (236.9) (236.9)
RPI swaps
Current (8.1) (8.1) (8.4) (8.4)
Non-current (598.9) (598.9) (530.2) (530.2)
CPI swaps
Non-current (110.4) (110.4) - -
Net debt (8,445.6) (9,329.7) (8,215.3) (9,550.3) Energy hedging derivatives (1.0) (1.0) (9.1) (9.1)
(8,446.6) (9,330.7) (8,224.4) (9,559.4)

Osprey Acquisitions Limited
Notes to the financial statements (continued) for the year ended 31 March 2019
101
23. Financial instruments (continued)
Fair value of financial assets and liabilities (continued)
The fair value of loans and other borrowings represents the market value of publicly traded debt
instruments or, if in respect of debt not publicly traded, the cost which the group would incur if it
elected to repay these borrowings before their maturity dates, calculated by discounting future cash
flows at prevailing rates including credit spreads experienced on publicly traded debt instruments.
The fair value of interest rate derivative financial instruments is determined by calculating the net
realisable value that would have arisen if these contracts terminated at 31 March with reference to
estimated future cash flows and observable yield curves. The fair value of cross-currency interest rate
derivatives is determined using discounted cash flow analysis, with the foreign currency legs
calculated with reference to observable foreign interest rate yield curves and the observable foreign
exchange rate as at 31 March. The fair value of the group’s energy derivatives is calculated using
discounted cash flow analysis, with reference to observable market prices at 31 March.
Fair values of other non-current investments, non-current trade and other receivables, provisions and
non-current trade and other payables have been estimated as not materially different from book
value.
Derivative transactions expose the group to credit risk against the counterparties concerned. Anglian
Water has credit protection measures in place within agreements which provide protection in the
event of counterparty rating downgrade or default. The group only enters into derivative transactions
with banks of high credit standing (as measured by reputable rating agencies) and also seeks to
diversify exposure such that concentration with individual banks is avoided.
In accordance with IFRS 13 ‘Fair Value Measurement’ the financial instruments carried at fair value on
the balance sheet have been classified as either level 2 or level 3 for fair valuation purposes. Both
classifications are valued by reference to valuation techniques using observable inputs other than
quoted prices in active markets. Level 2 instruments are valued using inputs that are observable for
the asset or liability either directly or indirectly. The Level 3 instrument valuation relates to CPI linked
swaps where inputs are obtained from a liquid market. In both cases the estimated future cash flows
have been discounted at a rate that reflects credit risk.
Level 3 derivative financial instruments
Level 3 derivative financial instruments comprise CPI linked inflation swaps which are traded based on
a spread to liquid RPI inflation markets often referred to as 'the wedge'. As the market for CPI swaps
is still developing the wedge is not currently observable in a liquid market and as such these swaps
have been classified at level 3 instruments.
Movements in the year to 31 March for assets and liabilities measured at fair value using level 3
valuation inputs are presented below.
2019
£m
At the beginning of the year -
Net loss for the year (110.3)
Settlements -
At the end of the year (110.3)

Osprey Acquisitions Limited
Notes to the financial statements (continued) for the year ended 31 March 2019
102
23. Financial instruments (continued)
Fair value of financial assets and liabilities (continued)
Level 3 derivative financial instruments (continued)
The impact on a post tax basis of reasonably possible changes in the significant assumptions used in
valuing liabilities classified as level 3 within the fair value hierarchy are as follows:
2019
£m
Gain/(loss)
1% increase in interest rates 47.6
1% decrease in interest rates (60.3)
1% increase in inflation rates (152.4)
1% decrease in inflation rates 126.0
One per cent has been used for sensitivity analysis as this represents a reasonable alternative market
movement, as well as a useful benchmark change.
Control of treasury
The Treasury team, which reports directly to the Managing Director, Finance & Non Regulated
Business, substantially manages the financing, including debt, interest costs and foreign exchange for
the group. Treasury policy continues to be focused on the efficient and effective management of cash
and financial resources within the group. The activities of the Treasury function include the following:
• ensure that lenders’ covenants are met;
• secure funds through a balanced approach to financial markets and maturities;
• manage interest rates to minimise financial exposures and minimise interest costs;
• invest temporary surplus cash to best advantage at minimal financial risk;
• maintain an excellent reputation with providers of finance and rating agencies;
• promote management techniques and systems;
• enhance control of financial resources; and
• monitor counterparty credit exposure.
Osprey Acquisitions Limited
Notes to the financial statements (continued) for the year ended 31 March 2019
103
23. Financial instruments (continued)
Financing structure
The group’s regulated water and water recycling business, Anglian Water Services Limited, is funded
predominately by debt in the form of long-term bonds and other debt instruments through its
financing subsidiary Anglian Water Services Financing Plc. At 31 March 2019 Anglian Water’s net debt
to capital value ratio (net debt as defined in the Common Terms Agreement expressed as a
percentage of Anglian Water’s regulated capital value) was 78.1% (2018: 78.1%).
The group has also raised finance within the company through its financing subsidiary Anglian Water
(Osprey) Financing Plc.
Borrowing covenants
With the exception of asset-based funding, the group’s borrowings are raised by the company, Anglian
Water (Osprey) Financing Plc and Anglian Water Services Financing Plc. The Treasury function
monitors compliance against all financial obligations and it is the group’s policy to manage the balance
sheet so as to ensure operation within covenant restrictions.
Management of financial risk
Financial risks faced by the group include funding, interest rate, contractual, currency, liquidity and
credit risks. The group regularly reviews these risks and has approved written policies covering
treasury strategy and the use of financial instruments to manage risks. The last review was in October
2018 and treasury matters are reported to the Board each month.
A Finance, Treasury and Energy Policy Group, including the Managing Director, Finance & Non
Regulated Business and the Group Treasurer, meets monthly with the specific remit of reviewing
treasury matters.
The group aims to meet its funding requirements primarily through accessing a range of financial
markets such as public bond markets, private placements, bank loans and finance leases. Surplus
cash is invested in short-term bank deposits, commercial paper, certificates of deposit, treasury bills
and AAA rated money funds.
The group also enters into derivative transactions (comprising currency, index-linked, interest rate
and energy swaps) to manage the interest rate and currency risks arising from the treasury policy.
These transactions hedge risks to which the group is exposed.
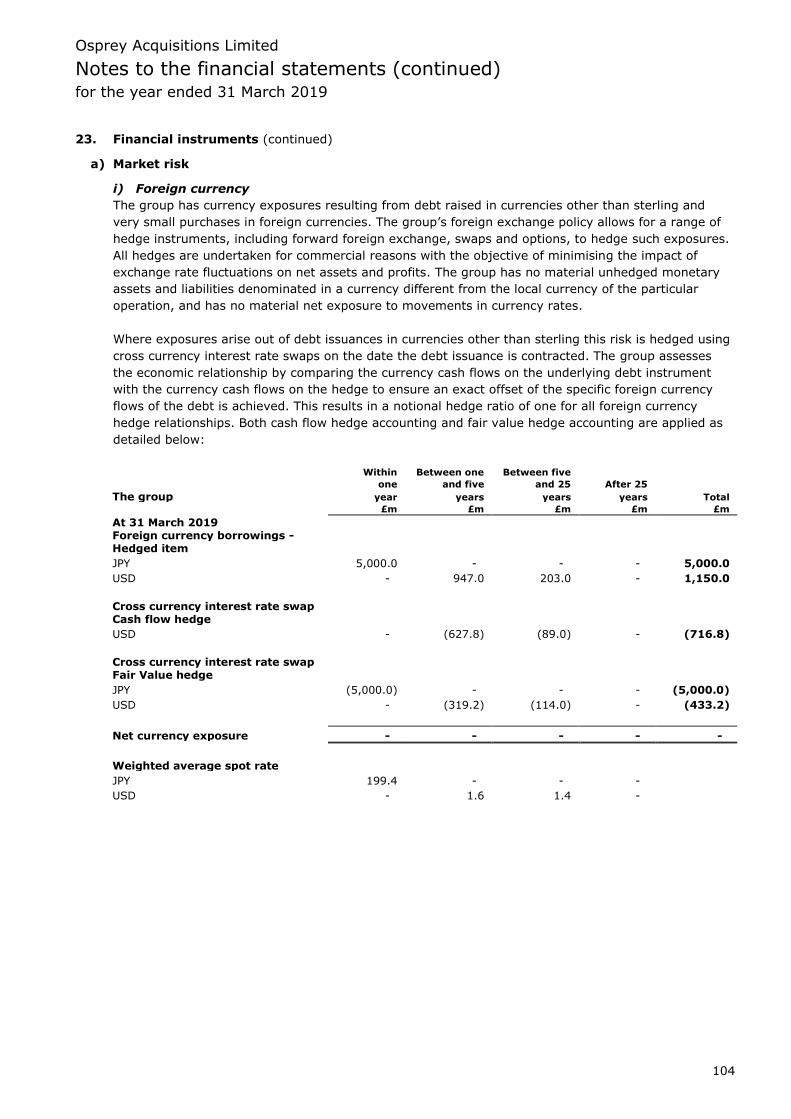
Osprey Acquisitions Limited
Notes to the financial statements (continued) for the year ended 31 March 2019
104
23. Financial instruments (continued)
a) Market risk
i) Foreign currency
The group has currency exposures resulting from debt raised in currencies other than sterling and
very small purchases in foreign currencies. The group’s foreign exchange policy allows for a range of
hedge instruments, including forward foreign exchange, swaps and options, to hedge such exposures.
All hedges are undertaken for commercial reasons with the objective of minimising the impact of
exchange rate fluctuations on net assets and profits. The group has no material unhedged monetary
assets and liabilities denominated in a currency different from the local currency of the particular
operation, and has no material net exposure to movements in currency rates.
Where exposures arise out of debt issuances in currencies other than sterling this risk is hedged using
cross currency interest rate swaps on the date the debt issuance is contracted. The group assesses
the economic relationship by comparing the currency cash flows on the underlying debt instrument
with the currency cash flows on the hedge to ensure an exact offset of the specific foreign currency
flows of the debt is achieved. This results in a notional hedge ratio of one for all foreign currency
hedge relationships. Both cash flow hedge accounting and fair value hedge accounting are applied as
detailed below:
Within Between one Between five
one and five and 25 After 25
The group year years years years Total
£m £m £m £m £m
At 31 March 2019
Foreign currency borrowings - Hedged item
JPY 5,000.0 - - - 5,000.0
USD - 947.0 203.0 - 1,150.0
Cross currency interest rate swap Cash flow hedge
USD - (627.8) (89.0) - (716.8)
Cross currency interest rate swap Fair Value hedge
JPY (5,000.0) - - - (5,000.0)
USD - (319.2) (114.0) - (433.2)
Net currency exposure - - - - -
Weighted average spot rate
JPY 199.4 - - -
USD - 1.6 1.4 -
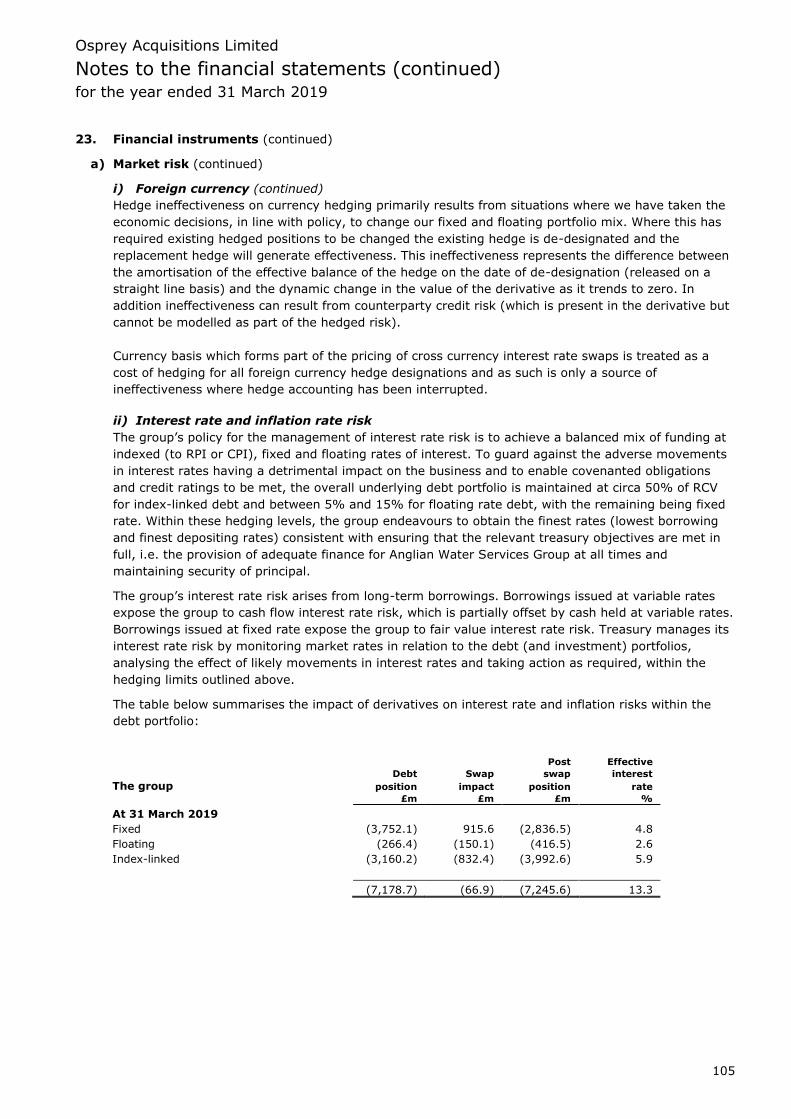
Osprey Acquisitions Limited
Notes to the financial statements (continued) for the year ended 31 March 2019
105
23. Financial instruments (continued)
a) Market risk (continued)
i) Foreign currency (continued)
Hedge ineffectiveness on currency hedging primarily results from situations where we have taken the
economic decisions, in line with policy, to change our fixed and floating portfolio mix. Where this has
required existing hedged positions to be changed the existing hedge is de-designated and the
replacement hedge will generate effectiveness. This ineffectiveness represents the difference between
the amortisation of the effective balance of the hedge on the date of de-designation (released on a
straight line basis) and the dynamic change in the value of the derivative as it trends to zero. In
addition ineffectiveness can result from counterparty credit risk (which is present in the derivative but
cannot be modelled as part of the hedged risk).
Currency basis which forms part of the pricing of cross currency interest rate swaps is treated as a
cost of hedging for all foreign currency hedge designations and as such is only a source of
ineffectiveness where hedge accounting has been interrupted.
ii) Interest rate and inflation rate risk
The group’s policy for the management of interest rate risk is to achieve a balanced mix of funding at
indexed (to RPI or CPI), fixed and floating rates of interest. To guard against the adverse movements
in interest rates having a detrimental impact on the business and to enable covenanted obligations
and credit ratings to be met, the overall underlying debt portfolio is maintained at circa 50% of RCV
for index-linked debt and between 5% and 15% for floating rate debt, with the remaining being fixed
rate. Within these hedging levels, the group endeavours to obtain the finest rates (lowest borrowing
and finest depositing rates) consistent with ensuring that the relevant treasury objectives are met in
full, i.e. the provision of adequate finance for Anglian Water Services Group at all times and
maintaining security of principal.
The group’s interest rate risk arises from long-term borrowings. Borrowings issued at variable rates
expose the group to cash flow interest rate risk, which is partially offset by cash held at variable rates.
Borrowings issued at fixed rate expose the group to fair value interest rate risk. Treasury manages its
interest rate risk by monitoring market rates in relation to the debt (and investment) portfolios,
analysing the effect of likely movements in interest rates and taking action as required, within the
hedging limits outlined above.
The table below summarises the impact of derivatives on interest rate and inflation risks within the
debt portfolio:
Post Effective
Debt Swap swap interest
The group position impact position rate
£m £m £m %
At 31 March 2019
Fixed (3,752.1) 915.6 (2,836.5) 4.8
Floating (266.4) (150.1) (416.5) 2.6
Index-linked (3,160.2) (832.4) (3,992.6) 5.9
(7,178.7) (66.9) (7,245.6) 13.3
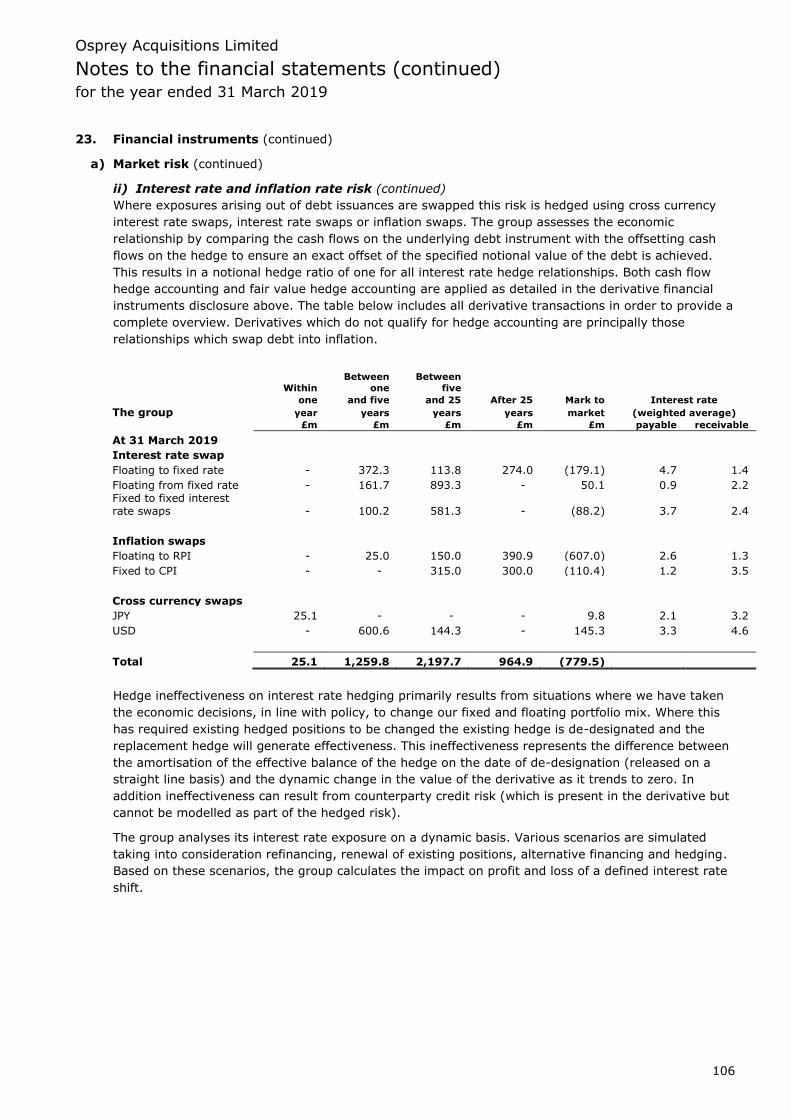
Osprey Acquisitions Limited
Notes to the financial statements (continued) for the year ended 31 March 2019
106
23. Financial instruments (continued)
a) Market risk (continued)
ii) Interest rate and inflation rate risk (continued)
Where exposures arising out of debt issuances are swapped this risk is hedged using cross currency
interest rate swaps, interest rate swaps or inflation swaps. The group assesses the economic
relationship by comparing the cash flows on the underlying debt instrument with the offsetting cash
flows on the hedge to ensure an exact offset of the specified notional value of the debt is achieved.
This results in a notional hedge ratio of one for all interest rate hedge relationships. Both cash flow
hedge accounting and fair value hedge accounting are applied as detailed in the derivative financial
instruments disclosure above. The table below includes all derivative transactions in order to provide a
complete overview. Derivatives which do not qualify for hedge accounting are principally those
relationships which swap debt into inflation.
Within
Between
one
Between
five
one and five and 25 After 25 Mark to Interest rate
The group year years years years market (weighted average)
£m £m £m £m £m payable receivable
At 31 March 2019
Interest rate swap
Floating to fixed rate - 372.3 113.8 274.0 (179.1) 4.7 1.4
Floating from fixed rate - 161.7 893.3 - 50.1 0.9 2.2
Fixed to fixed interest rate swaps - 100.2 581.3 - (88.2) 3.7 2.4
Inflation swaps
Floating to RPI - 25.0 150.0 390.9 (607.0) 2.6 1.3
Fixed to CPI - - 315.0 300.0 (110.4) 1.2 3.5
Cross currency swaps
JPY 25.1 - - - 9.8 2.1 3.2
USD - 600.6 144.3 - 145.3 3.3 4.6
Total 25.1 1,259.8 2,197.7 964.9 (779.5)
Hedge ineffectiveness on interest rate hedging primarily results from situations where we have taken
the economic decisions, in line with policy, to change our fixed and floating portfolio mix. Where this
has required existing hedged positions to be changed the existing hedge is de-designated and the
replacement hedge will generate effectiveness. This ineffectiveness represents the difference between
the amortisation of the effective balance of the hedge on the date of de-designation (released on a
straight line basis) and the dynamic change in the value of the derivative as it trends to zero. In
addition ineffectiveness can result from counterparty credit risk (which is present in the derivative but
cannot be modelled as part of the hedged risk).
The group analyses its interest rate exposure on a dynamic basis. Various scenarios are simulated
taking into consideration refinancing, renewal of existing positions, alternative financing and hedging.
Based on these scenarios, the group calculates the impact on profit and loss of a defined interest rate
shift.
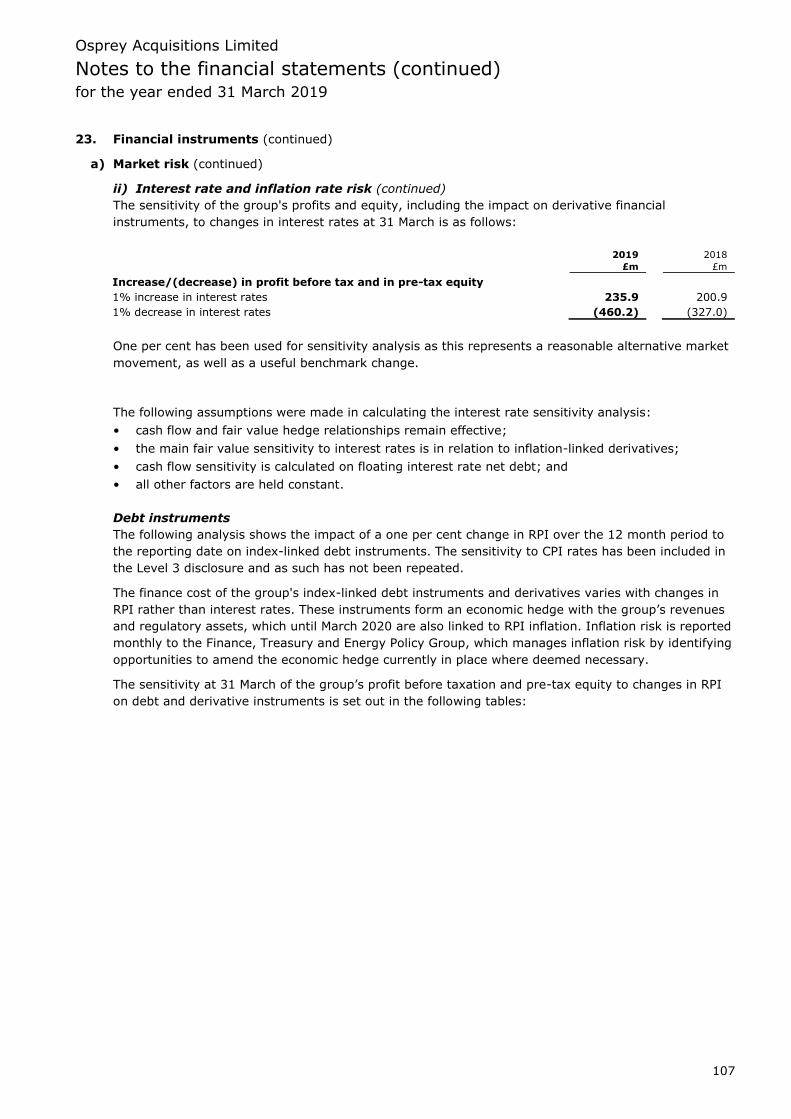
Osprey Acquisitions Limited
Notes to the financial statements (continued) for the year ended 31 March 2019
107
23. Financial instruments (continued)
a) Market risk (continued)
ii) Interest rate and inflation rate risk (continued)
The sensitivity of the group's profits and equity, including the impact on derivative financial
instruments, to changes in interest rates at 31 March is as follows:
2019 2018
£m £m
Increase/(decrease) in profit before tax and in pre-tax equity
1% increase in interest rates 235.9 200.9
1% decrease in interest rates (460.2) (327.0)
One per cent has been used for sensitivity analysis as this represents a reasonable alternative market
movement, as well as a useful benchmark change.
The following assumptions were made in calculating the interest rate sensitivity analysis:
• cash flow and fair value hedge relationships remain effective;
• the main fair value sensitivity to interest rates is in relation to inflation-linked derivatives;
• cash flow sensitivity is calculated on floating interest rate net debt; and
• all other factors are held constant.
Debt instruments
The following analysis shows the impact of a one per cent change in RPI over the 12 month period to
the reporting date on index-linked debt instruments. The sensitivity to CPI rates has been included in
the Level 3 disclosure and as such has not been repeated.
The finance cost of the group's index-linked debt instruments and derivatives varies with changes in
RPI rather than interest rates. These instruments form an economic hedge with the group’s revenues
and regulatory assets, which until March 2020 are also linked to RPI inflation. Inflation risk is reported
monthly to the Finance, Treasury and Energy Policy Group, which manages inflation risk by identifying
opportunities to amend the economic hedge currently in place where deemed necessary.
The sensitivity at 31 March of the group’s profit before taxation and pre-tax equity to changes in RPI
on debt and derivative instruments is set out in the following tables:
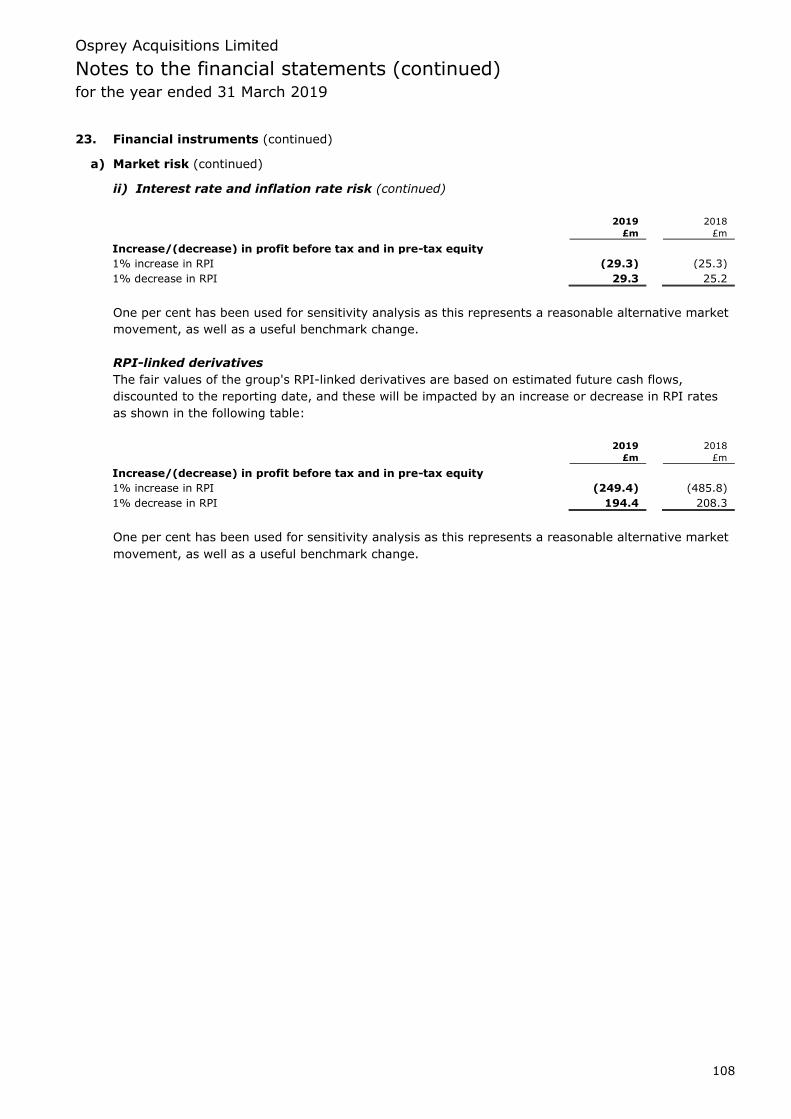
Osprey Acquisitions Limited
Notes to the financial statements (continued) for the year ended 31 March 2019
108
23. Financial instruments (continued)
a) Market risk (continued)
ii) Interest rate and inflation rate risk (continued)
2019 2018
£m £m
Increase/(decrease) in profit before tax and in pre-tax equity
1% increase in RPI (29.3) (25.3)
1% decrease in RPI 29.3 25.2
One per cent has been used for sensitivity analysis as this represents a reasonable alternative market
movement, as well as a useful benchmark change.
RPI-linked derivatives
The fair values of the group's RPI-linked derivatives are based on estimated future cash flows,
discounted to the reporting date, and these will be impacted by an increase or decrease in RPI rates
as shown in the following table:
2019 2018
£m £m
Increase/(decrease) in profit before tax and in pre-tax equity
1% increase in RPI (249.4) (485.8)
1% decrease in RPI 194.4 208.3
One per cent has been used for sensitivity analysis as this represents a reasonable alternative market
movement, as well as a useful benchmark change.
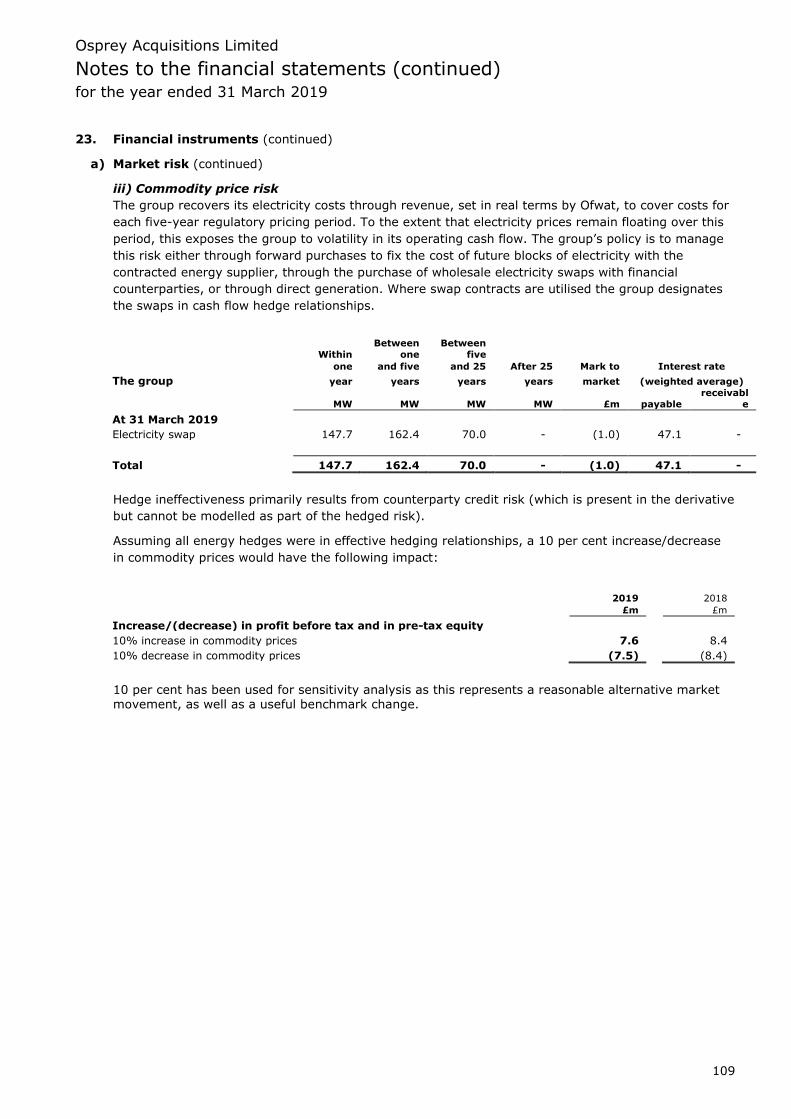
Osprey Acquisitions Limited
Notes to the financial statements (continued) for the year ended 31 March 2019
109
23. Financial instruments (continued)
a) Market risk (continued)
iii) Commodity price risk
The group recovers its electricity costs through revenue, set in real terms by Ofwat, to cover costs for
each five-year regulatory pricing period. To the extent that electricity prices remain floating over this
period, this exposes the group to volatility in its operating cash flow. The group’s policy is to manage
this risk either through forward purchases to fix the cost of future blocks of electricity with the
contracted energy supplier, through the purchase of wholesale electricity swaps with financial
counterparties, or through direct generation. Where swap contracts are utilised the group designates
the swaps in cash flow hedge relationships.
Within
Between
one
Between
five
one and five and 25 After 25 Mark to Interest rate
The group year years years years market (weighted average)
MW MW MW MW £m payable
receivabl
e
At 31 March 2019
Electricity swap 147.7 162.4 70.0 - (1.0) 47.1 -
Total 147.7 162.4 70.0 - (1.0) 47.1 -
Hedge ineffectiveness primarily results from counterparty credit risk (which is present in the derivative
but cannot be modelled as part of the hedged risk).
Assuming all energy hedges were in effective hedging relationships, a 10 per cent increase/decrease
in commodity prices would have the following impact:
2019 2018
£m £m
Increase/(decrease) in profit before tax and in pre-tax equity
10% increase in commodity prices 7.6 8.4
10% decrease in commodity prices (7.5) (8.4)
10 per cent has been used for sensitivity analysis as this represents a reasonable alternative market movement, as well as a useful benchmark change.
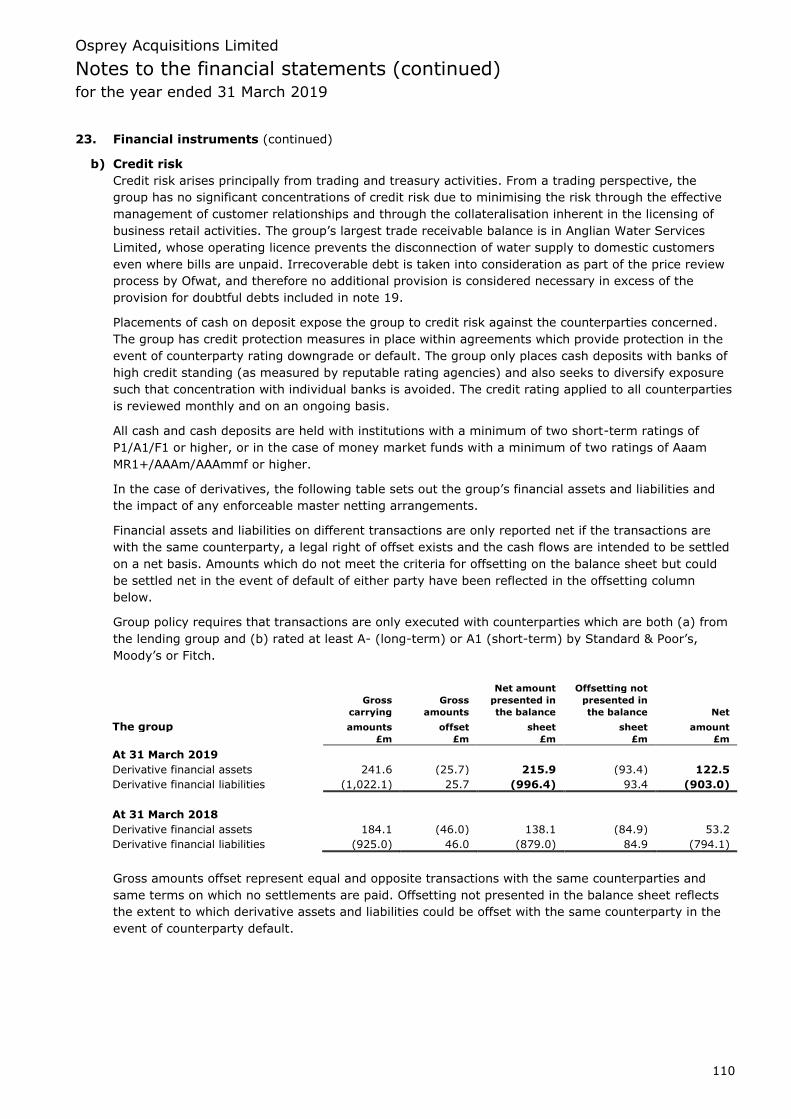
Osprey Acquisitions Limited
Notes to the financial statements (continued) for the year ended 31 March 2019
110
23. Financial instruments (continued)
b) Credit risk
Credit risk arises principally from trading and treasury activities. From a trading perspective, the
group has no significant concentrations of credit risk due to minimising the risk through the effective
management of customer relationships and through the collateralisation inherent in the licensing of
business retail activities. The group’s largest trade receivable balance is in Anglian Water Services
Limited, whose operating licence prevents the disconnection of water supply to domestic customers
even where bills are unpaid. Irrecoverable debt is taken into consideration as part of the price review
process by Ofwat, and therefore no additional provision is considered necessary in excess of the
provision for doubtful debts included in note 19.
Placements of cash on deposit expose the group to credit risk against the counterparties concerned.
The group has credit protection measures in place within agreements which provide protection in the
event of counterparty rating downgrade or default. The group only places cash deposits with banks of
high credit standing (as measured by reputable rating agencies) and also seeks to diversify exposure
such that concentration with individual banks is avoided. The credit rating applied to all counterparties
is reviewed monthly and on an ongoing basis.
All cash and cash deposits are held with institutions with a minimum of two short-term ratings of
P1/A1/F1 or higher, or in the case of money market funds with a minimum of two ratings of Aaam
MR1+/AAAm/AAAmmf or higher.
In the case of derivatives, the following table sets out the group’s financial assets and liabilities and
the impact of any enforceable master netting arrangements.
Financial assets and liabilities on different transactions are only reported net if the transactions are
with the same counterparty, a legal right of offset exists and the cash flows are intended to be settled
on a net basis. Amounts which do not meet the criteria for offsetting on the balance sheet but could
be settled net in the event of default of either party have been reflected in the offsetting column
below.
Group policy requires that transactions are only executed with counterparties which are both (a) from
the lending group and (b) rated at least A- (long-term) or A1 (short-term) by Standard & Poor’s,
Moody’s or Fitch.
Net amount Offsetting not
Gross Gross presented in presented in
carrying amounts the balance the balance Net
The group amounts offset sheet sheet amount
£m £m £m £m £m
At 31 March 2019
Derivative financial assets 241.6 (25.7) 215.9 (93.4) 122.5
Derivative financial liabilities (1,022.1) 25.7 (996.4) 93.4 (903.0)
At 31 March 2018
Derivative financial assets 184.1 (46.0) 138.1 (84.9) 53.2
Derivative financial liabilities (925.0) 46.0 (879.0) 84.9 (794.1)
Gross amounts offset represent equal and opposite transactions with the same counterparties and
same terms on which no settlements are paid. Offsetting not presented in the balance sheet reflects
the extent to which derivative assets and liabilities could be offset with the same counterparty in the
event of counterparty default.

Osprey Acquisitions Limited
Notes to the financial statements (continued) for the year ended 31 March 2019
111
23. Financial instruments (continued)
b) Credit risk (continued)
At 31 March 2019 the maximum exposure to credit risk for the group is represented by the carrying
amount of each financial asset in the group balance sheet including, for the prior year, amounts
shown within assets classified as held for sale:
2019 2018
£m £m
Cash and cash equivalents 316.8 288.2
Trade and other receivables 477.8 471.0
Investments - cash deposits 299.5 42.8
Derivative financial assets 215.9 138.1
c) Capital risk management
The prime responsibility of the group’s Treasury function is the efficient and effective management of
financial resources within the group, i.e. the provision of adequate finance and liquidity at all times
while maintaining security of principal. This involves focus on efficiency, quality and effective control
to improve cash flow and profitability. The Treasury function will actively seek opportunities to raise
debt, to reduce the cost of funding and the cost of hedging interest rate and foreign exchange risk
while maintaining a risk-averse position in its liquidity management and in its control of currency and
interest rate exposures.
Recognising the level of gearing in the group, and the long-term nature of the group’s asset base, the
group is primarily funded from the debt capital markets. It is the group’s policy to maintain sufficient
cash and/or borrowing facilities to meet short-term commitments and to provide working capital
support/flexibility in treasury operations in the event of short-term difficulties in the capital markets.
The Treasury team actively maintain a good financial reputation with rating agencies, investors,
lenders and other creditors, and aims to maintain the relevant key financial ratios used by the credit
rating agencies to determine the respective credit ratings.
d) Liquidity risk
The group’s objective is to maintain flexibility, diversification and continuity of funding through access
to different markets and debt instruments. Daily cash management is undertaken to calculate cash
position and dealing requirements, and weekly and monthly cash forecasts are prepared to
demonstrate short/medium-term liquidity, covenant compliance and to inform investment strategy.
Regular meetings are held with cash forecasters to understand cash variances and challenge latest
forecasts. Consolidated cash forecasts are presented to the Finance, Treasury and Energy Policy Group
on a monthly basis.
The group maintains sufficient liquidity to cover 12 months working capital requirements, and the
non-regulated businesses are run on a cash-positive basis. Internal policy is to maintain 18 months
liquidity in terms of capital expenditure and operating costs in Anglian Water Services Limited, and to
refinance maturing debt at least three months in advance, to ensure covenant compliance.
The group has the following undrawn committed borrowing facilities available at 31 March 2019 in
respect of which all conditions precedent had been met at that date:
Group
2019 2018
£m £m
Within one year 525.0 390.0
Between one and two years 100.0 125.0
Between two and five years 500.0 600.0
1,125.0 1,115.0
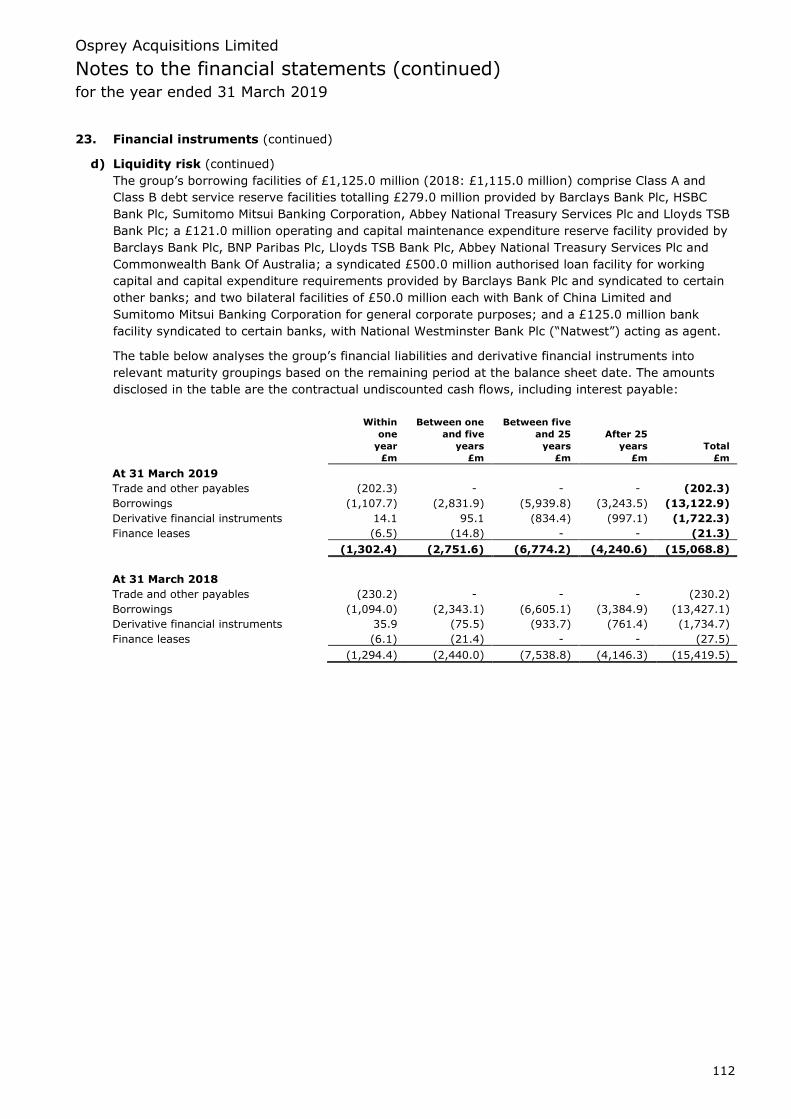
Osprey Acquisitions Limited
Notes to the financial statements (continued) for the year ended 31 March 2019
112
23. Financial instruments (continued)
d) Liquidity risk (continued)
The group’s borrowing facilities of £1,125.0 million (2018: £1,115.0 million) comprise Class A and
Class B debt service reserve facilities totalling £279.0 million provided by Barclays Bank Plc, HSBC
Bank Plc, Sumitomo Mitsui Banking Corporation, Abbey National Treasury Services Plc and Lloyds TSB
Bank Plc; a £121.0 million operating and capital maintenance expenditure reserve facility provided by
Barclays Bank Plc, BNP Paribas Plc, Lloyds TSB Bank Plc, Abbey National Treasury Services Plc and
Commonwealth Bank Of Australia; a syndicated £500.0 million authorised loan facility for working
capital and capital expenditure requirements provided by Barclays Bank Plc and syndicated to certain
other banks; and two bilateral facilities of £50.0 million each with Bank of China Limited and
Sumitomo Mitsui Banking Corporation for general corporate purposes; and a £125.0 million bank
facility syndicated to certain banks, with National Westminster Bank Plc (“Natwest”) acting as agent.
The table below analyses the group’s financial liabilities and derivative financial instruments into
relevant maturity groupings based on the remaining period at the balance sheet date. The amounts
disclosed in the table are the contractual undiscounted cash flows, including interest payable:
Within Between one Between five
one and five and 25 After 25
year years years years Total
£m £m £m £m £m
At 31 March 2019
Trade and other payables (202.3) - - - (202.3)
Borrowings (1,107.7) (2,831.9) (5,939.8) (3,243.5) (13,122.9)
Derivative financial instruments 14.1 95.1 (834.4) (997.1) (1,722.3)
Finance leases (6.5) (14.8) - - (21.3)
(1,302.4) (2,751.6) (6,774.2) (4,240.6) (15,068.8)
At 31 March 2018
Trade and other payables (230.2) - - - (230.2)
Borrowings (1,094.0) (2,343.1) (6,605.1) (3,384.9) (13,427.1)
Derivative financial instruments 35.9 (75.5) (933.7) (761.4) (1,734.7)
Finance leases (6.1) (21.4) - - (27.5)
(1,294.4) (2,440.0) (7,538.8) (4,146.3) (15,419.5)
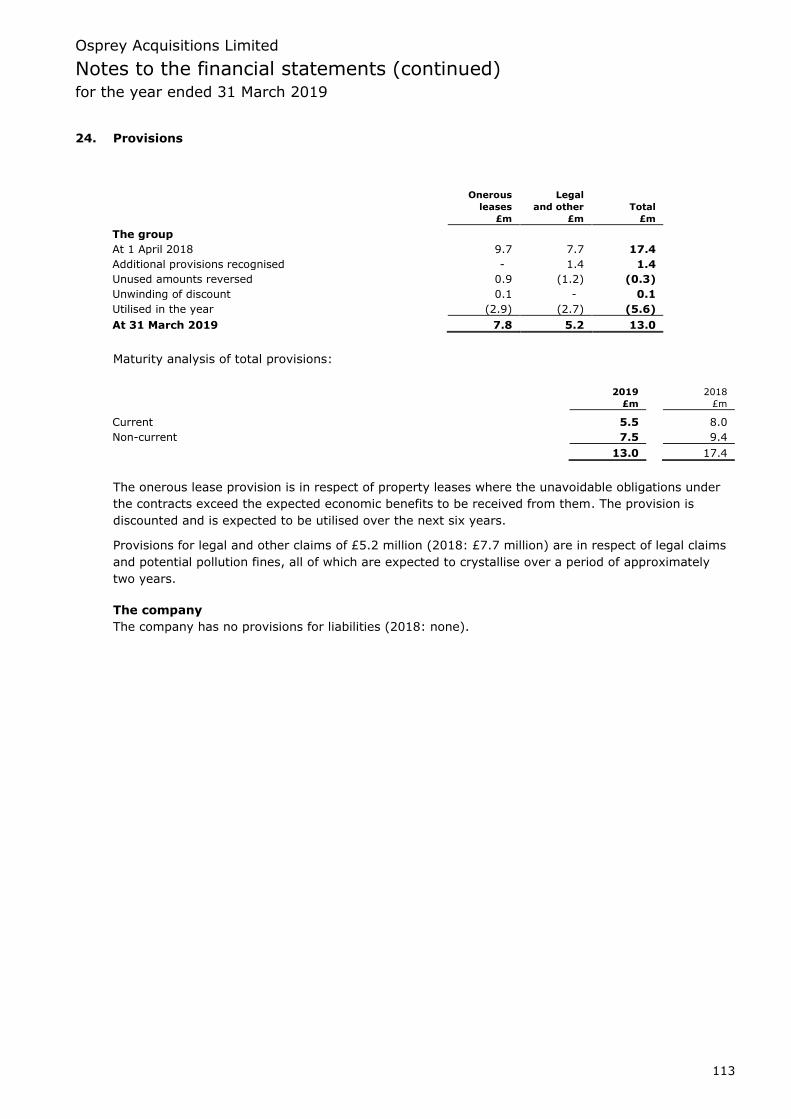
Osprey Acquisitions Limited
Notes to the financial statements (continued) for the year ended 31 March 2019
113
24. Provisions
Onerous Legal
leases and other Total
£m £m £m
The group
At 1 April 2018 9.7 7.7 17.4
Additional provisions recognised - 1.4 1.4
Unused amounts reversed 0.9 (1.2) (0.3)
Unwinding of discount 0.1 - 0.1
Utilised in the year (2.9) (2.7) (5.6)
At 31 March 2019 7.8 5.2 13.0
Maturity analysis of total provisions:
2019 2018
£m £m
Current 5.5 8.0
Non-current 7.5 9.4
13.0 17.4
The onerous lease provision is in respect of property leases where the unavoidable obligations under
the contracts exceed the expected economic benefits to be received from them. The provision is
discounted and is expected to be utilised over the next six years.
Provisions for legal and other claims of £5.2 million (2018: £7.7 million) are in respect of legal claims
and potential pollution fines, all of which are expected to crystallise over a period of approximately
two years.
The company
The company has no provisions for liabilities (2018: none).

Osprey Acquisitions Limited
Notes to the financial statements (continued) for the year ended 31 March 2019
114
25. Deferred tax
Accelerated Retirement Surplus
tax Financial benefit ACT
depreciation instruments obligation asset Other Total
£m £m £m £m £m £m
The group
At 1 April 2017 1,093.4 (194.5) (16.8) (83.6) (4.0) 794.5
IFRS 15 restatement 57.7 - - - 29.4 87.1
31 March 2017 (restated) 1,151.1 (194.5) (16.8) (83.6) 25.4 881.6
(Credited)/charged directly to the income statement (35.4) 23.4 2.1 - 4.2 (5.7)
Credited directly to other comprehensive income - 3.1 13.7 - - 16.8
Offset against corporation tax liability - - - 36.9 - 36.9
At 31 March 2018 (restated) 1,115.7 (168.0) (1.0) (46.7) 29.6 929.6
(Credited)/charged directly to the income statement (13.7) (13.5) 2.9 - (33.5) (57.8)
Charged directly to other comprehensive income - 6.5 (5.5) - - 1.0
Offset against corporation tax liability - - - 46.7 - 46.7
At 31 March 2019 1,102.0 (175.0) (3.6) - (3.9) 919.5
Deferred tax assets and liabilities have been offset in accordance with IAS 12 ‘Income Taxes’.
The group has the following deferred tax assets that are not recognised in the financial statements:
Group
2019 2018
£m £m
Corporate interest restrictions 11.9 8.2
Tax losses carried forward 0.8 0.8
12.7 9.0
New legislation was introduced from April 2017, restricting the amount of interest that a company can
offset against its tax liabilities in any year. Any amounts restricted are available to carry forward
against future tax liabilities, so long as the company has the capacity to do so. The Directors believe it
is uncertain that the group will have the capacity to utilise this disallowed interest, and therefore the
group has not recognised a deferred tax asset in respect of these restrictions.
The tax losses carried forward relate to losses which are not eligible for group relief. As they exist in
companies where future profits are uncertain and no deferred tax liabilities exist, no asset has been
recognised.
The company
The company has no deferred tax (2018: none).

Osprey Acquisitions Limited
Notes to the financial statements (continued) for the year ended 31 March 2019
115
26. Net retirement benefit obligation
Prior to the closure to accrual on 31 March 2018 pension arrangements for approximately 25% of the
group’s employees were of the funded defined benefit type, through the Anglian Water Group Pension
Scheme (‘AWGPS’). On 31 March 2017, the assets and liabilities relating to the defined benefit scheme
for the employees of the former Hartlepool Water Limited, which was acquired in July 1997, trade and
assets transferred to Anglian Water on 1 April 2000, were transferred into a segregated section of the
AWGPS. However, as the Trustees assess the funding requirements of the Hartlepool section
separately from the rest of AWGPS, the Hartlepool section has been separately disclosed in the tables
below.
Within these schemes, employees are entitled to retirement benefits based on their final salary and
length of service at the time of leaving, or closure of, the schemes, payable on attainment of
retirement age (or earlier death).
On 31 March 2018, following a period of consultation with representatives of all employees, the
defined benefit sections of the AWGPS (including the Hartlepool section) were closed for future
accruals. From 1 April 2018 all employees now have the option to participate in a new high quality
defined contribution scheme which offers an equitable scheme with more flexible benefits.
The group also has pension obligations to former employees through the Morrison Pension & Life
Assurance Plan (‘MPLAP’). In addition, pensions in payment to a number of former employees are
unfunded.
The administration and investment of the pension funds are maintained separately from the finances
of the group.
Full valuations as at 31 March 2017 have been completed for the AWGPS (including the Hartlepool
section) scheme, and as at 1 April 2017 for MPLAP, the results of which have been used as a basis for
the IAS 19 ‘Employee Benefits’ disclosures as at 31 March 2019.
The group has a plan in place with the scheme’s trustees to address the funding deficit for the Main
Section of the AWGPS by 2026, through a series of annual deficit recovery contributions.
With effect from 1 April 2018 future service contributions for both the Main Section (2018: 12.8% of
pensionable pay) and Hartlepool Section (2018: 36.1% of pensionable pay) of the AWGPS ceased as
there was no future accrual of benefits. During the year the group contributed £13.3 million of which
£12.5 million related to deficit reduction payments. There were no deficit reduction payment for the
Hartlepool Section due to the funding position on the funding basis at the 31 March 2017 valuation
(2018: £41.6k per month until February 2018).
Contributions to MPLAP, including an allowance for expenses, were £6.0 million (2018: £5.5 million)
during the year.
In the year to 31 March 2020 employers’ contributions are expected to be £20.6 million.
The weighted average duration of the defined benefit obligation for AWGPS (excluding Hartlepool) is
22 years, for the Hartlepool section of AWGPS is 18 years, for MPLAP is 24 years, and for the
unfunded scheme is 12 years.
The pension deficit at 31 March 2019 has been updated to include a £3.3 million provision for the
accounting impact of guaranteed minimum pension equalisation. This is disclosed as a past service
cost in part of this note.
The group also operates a number of defined contribution schemes in the UK, and contributions to
these schemes amounted to £17.2 million (2018: £9.1 million).

Osprey Acquisitions Limited
Notes to the financial statements (continued) for the year ended 31 March 2019
116
26. Net retirement benefit obligation (continued)
a) Principal actuarial assumptions
The liabilities of the pension schemes have been valued using the projected unit method and using the
following assumptions:
2019 2018
% pa % pa
Discount rate 2.4 2.6
Inflation rate
RPI 3.3 3.3
CPI 2.3 2.3
Increase to deferred benefits during deferment
RPI 3.3 3.3
CPI 2.3 2.3
Increases to inflation related pensions in payment (1)
RPI 3.2 3.2
CPI 2.3 2.3
2019 2018
years years
Longevity at age 65 for current pensioners
Men 22.4 22.5
Women 22.5 24.6
Longevity at age 65 for future pensioners (2)
Men 23.7 23.9
Women 25.7 25.9
(1) For RPI pension increases capped at 5% per annum.
(2) The life expectancy shown for future pensioners is for those reaching 65 in 2039.
b) Sensitivity analysis
The following table sets out the sensitivity of the liabilities within the schemes to changes in the
financial and demographic assumptions.
Unfunded
Change in AWGPS Hartlepool MPLAP pensions Total
assumption £m £m £m £m £m
Discount rate
Discount rate +/- 0.5% pa -154/+178 -2/+2 -28/+32 -3/+3 -187/+215
Rate of RPI inflation +/- 0.5% pa +121/-108 +1/-1 +7/-6 +3/-3 +132/-118
Life expectancy +/- 1 year +55/-54 +1/-1 +9/-9 +2/-2 +67/-66

Osprey Acquisitions Limited
Notes to the financial statements (continued) for the year ended 31 March 2019
117
26. Net retirement benefit obligation (continued)
b) Sensitivity analysis (continued)
Changes to market conditions that influence the assumptions above may also have an impact on the
value of the schemes’ investment holdings. The extent to which these are managed is discussed in
section (c) below. The sensitivities in the table above have been calculated by changing the key
assumption and leaving all others fixed, with the exception of the RPI inflation assumption, which has
a corresponding impact on Consumer Prices Index (‘CPI’) inflation, pension increases and salary
increases due to the way the assumptions are derived.
c) Risk and risk management
The group’s defined benefit pension schemes, in common with the majority of such schemes in the
UK, have a number of areas of risk. These areas of risk, and the ways in which the group manages
them, are set out below.
The risks are considered below from both a funding perspective (which drives the cash commitments
of the group) and from an accounting perspective, i.e. the extent to which such risks affect the
amounts recorded in the group’s financial statements.
Asset volatility
For the purpose of setting the contribution requirements, the calculation of the value of the liabilities
uses a discount rate set with reference to government bond yields, with allowance for additional
return to be generated from the investment portfolio. Under IAS 19, the defined benefit obligation is
calculated using a discount rate set with reference to corporate bond yields.
The schemes hold a proportion of their assets in return-seeking funds. The return on these assets may
be volatile and are not correlated to the value of the liabilities. This means that the deficit may be
volatile in the shorter term, which may lead to an increase in the contribution requirements and an
increase in the net defined benefit liability recorded on the balance sheet.
The group believes that return-seeking assets offer an appropriate level of return over the long-term
for the level of risk that is taken. The schemes’ other assets are well diversified by investing in a range
of asset classes including government bonds and corporate bonds. The allocation to growth assets is
monitored to ensure it remains appropriate given the schemes’ long-term objectives.
Change in bond yields
A fall in bond yields increases the value placed on the liabilities for reporting purposes and for setting
the group’s contribution requirements. However, in this scenario the schemes’ investment in corporate
and government bonds and liability-driven investments is expected to increase and therefore offset
some of the increase in the value placed on the liabilities.
Price inflation
The majority of the schemes’ benefit obligations are linked to inflation and higher out-turn inflation
will lead to a higher benefit obligation (although in most cases caps on the level of inflationary
increases are in place to protect the plan against extreme inflation). A significant proportion of the
schemes’ assets do not provide a direct hedge against changes in inflation as they are either fixed-
interest in nature (corporate bonds and government bonds), or have an indirect link to inflation
(equities).
Life expectancy
The majority of the schemes’ obligations are to provide benefits for the life of the member and, as
such, the schemes’ liabilities are sensitive to these assumptions. This is particularly significant where
the longer duration and inflation-linked nature of the payments result in higher sensitivity to changes
in life expectancy. The schemes do not contain a hedge against increases in future life expectancy.

Osprey Acquisitions Limited
Notes to the financial statements (continued) for the year ended 31 March 2019
118
26. Net retirement benefit obligation (continued)
d) Amounts recognised in comprehensive income
Unfunded
AWGPS Hartlepool MPLAP pensions Total
£m £m £m £m £m
2019
Amount charged to staff costs within operating profit:
Past service cost (3.5) - - - (3.5)
Administration expenses - - (0.4) - (0.4)
Total operating charge (see note 10) (3.5) - (0.4) - (3.9)
Amount credited/(expensed) to finance costs:
Interest income on scheme assets 41.4 0.6 6.0 - 48.0
Interest cost on scheme liabilities (39.8) (0.5) (6.4) (1.2) (47.9)
Net interest income/(expense) (see note 8) 1.6 0.1 (0.4) (1.2) 0.1
Amounts (charged)/credited to the
income statement (1.9) 0.1 (0.8) (1.2) (3.8)
Amounts (charged)/credited to other comprehensive income
Return on plan assets (excluding amounts included in net interest) 29.3 0.5 11.1 - 40.9
Actuarial losses arising from:
Changes in financial assumptions (40.7) (0.3) (11.6) - (52.6)
Experience adjustments (4.7) - (0.5) (0.2) (5.4)
Change arising from minimum funding requirement - - (15.6) - (15.6)
Net (charge)/credit to other comprehensive income (16.1) 0.2 (16.6) (0.2) (32.7)
2018
Amount charged to staff costs within operating profit:
Current service cost (9.1) (0.3) - - (9.4)
Administration expenses - (0.1) (0.9) - (1.0)
Loss on settlement (2.5) 1.8 - - (0.7)
Total operating charge (see note 10) (11.6) 1.4 (0.9) - (11.1) Amount credited/(expensed) to finance costs:
Interest income on scheme assets 40.5 0.8 6.2 - 47.5
Interest cost on scheme liabilities (41.2) (0.7) (6.7) (1.2) (49.8)
Net interest (expense)/income (see note 8) (0.7) 0.1 (0.5) (1.2) (2.3)
Amounts (charged)/credited to the income statement (12.3) 1.5 (1.4) (1.2) (13.4)
Amounts credited/(charged) to other comprehensive income:
Return on plan assets (excluding amounts included in net interest) 53.9 (0.3) (4.1) - 49.5
Actuarial (losses)/gains arising from:
Changes in financial assumptions 21.4 0.3 3.5 0.7 25.9
Experience adjustments 5.8 0.1 (0.8) (0.3) 4.8
Net credit/(charge) to other comprehensive income 81.1 0.1 (1.4) 0.4 80.2
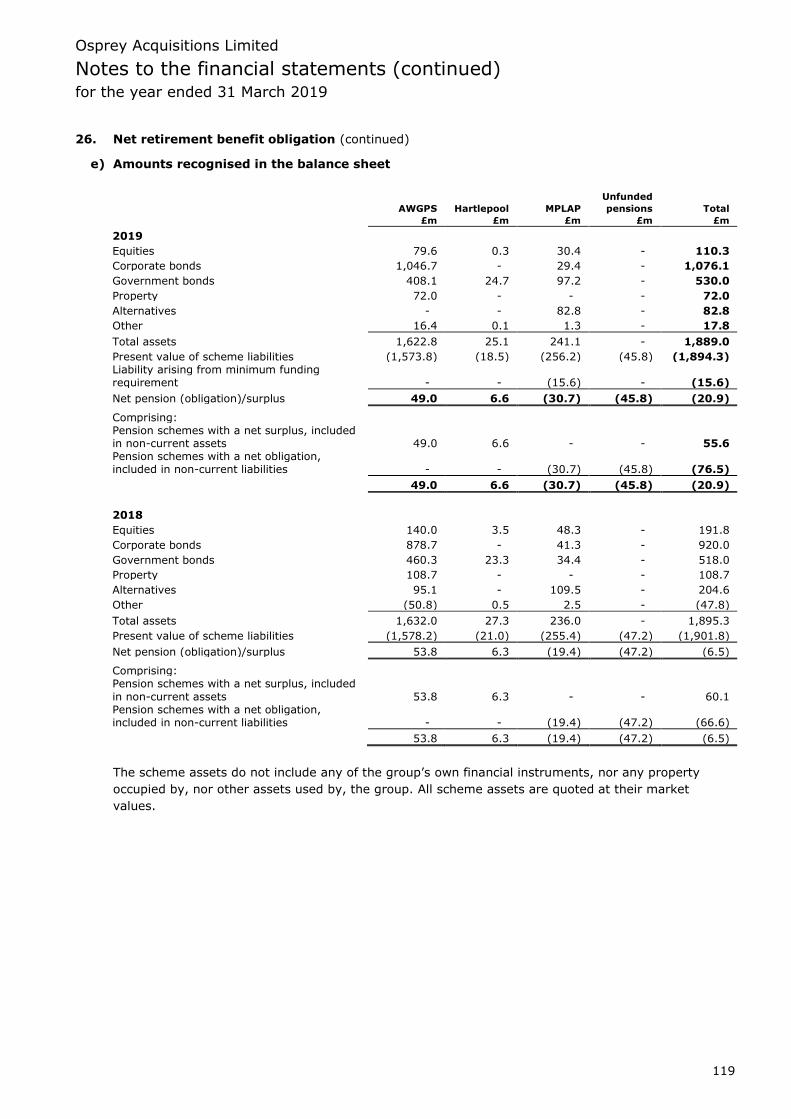
Osprey Acquisitions Limited
Notes to the financial statements (continued) for the year ended 31 March 2019
119
26. Net retirement benefit obligation (continued)
e) Amounts recognised in the balance sheet
Unfunded
AWGPS Hartlepool MPLAP pensions Total
£m £m £m £m £m
2019
Equities 79.6 0.3 30.4 - 110.3
Corporate bonds 1,046.7 - 29.4 - 1,076.1
Government bonds 408.1 24.7 97.2 - 530.0
Property 72.0 - - - 72.0
Alternatives - - 82.8 - 82.8
Other 16.4 0.1 1.3 - 17.8
Total assets 1,622.8 25.1 241.1 - 1,889.0
Present value of scheme liabilities (1,573.8) (18.5) (256.2) (45.8) (1,894.3)
Liability arising from minimum funding requirement - - (15.6) - (15.6)
Net pension (obligation)/surplus 49.0 6.6 (30.7) (45.8) (20.9)
Comprising:
Pension schemes with a net surplus, included in non-current assets 49.0 6.6 - - 55.6
Pension schemes with a net obligation, included in non-current liabilities - - (30.7) (45.8) (76.5)
49.0 6.6 (30.7) (45.8) (20.9)
2018
Equities 140.0 3.5 48.3 - 191.8
Corporate bonds 878.7 - 41.3 - 920.0
Government bonds 460.3 23.3 34.4 - 518.0
Property 108.7 - - - 108.7
Alternatives 95.1 - 109.5 - 204.6
Other (50.8) 0.5 2.5 - (47.8)
Total assets 1,632.0 27.3 236.0 - 1,895.3
Present value of scheme liabilities (1,578.2) (21.0) (255.4) (47.2) (1,901.8)
Net pension (obligation)/surplus 53.8 6.3 (19.4) (47.2) (6.5)
Comprising:
Pension schemes with a net surplus, included
in non-current assets 53.8 6.3 - - 60.1
Pension schemes with a net obligation, included in non-current liabilities - - (19.4) (47.2) (66.6)
53.8 6.3 (19.4) (47.2) (6.5)
The scheme assets do not include any of the group’s own financial instruments, nor any property
occupied by, nor other assets used by, the group. All scheme assets are quoted at their market
values.
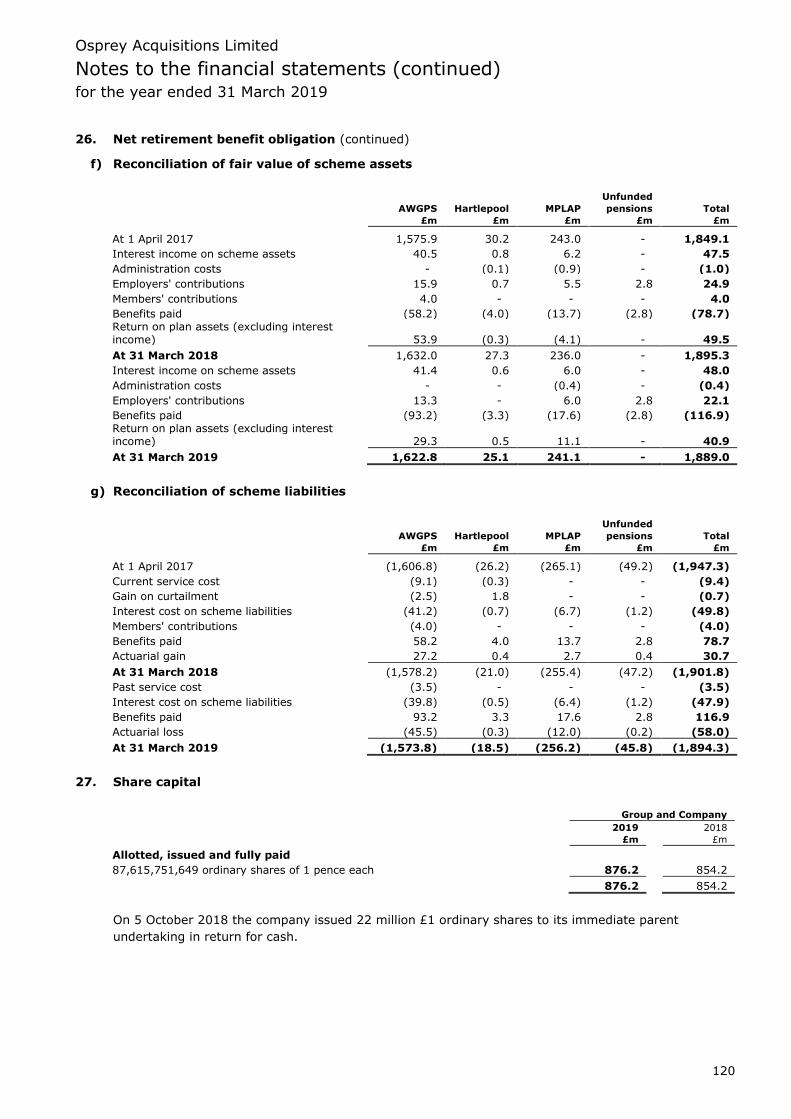
Osprey Acquisitions Limited
Notes to the financial statements (continued) for the year ended 31 March 2019
120
26. Net retirement benefit obligation (continued)
f) Reconciliation of fair value of scheme assets
Unfunded
AWGPS Hartlepool MPLAP pensions Total
£m £m £m £m £m
At 1 April 2017 1,575.9 30.2 243.0 - 1,849.1
Interest income on scheme assets 40.5 0.8 6.2 - 47.5
Administration costs - (0.1) (0.9) - (1.0)
Employers' contributions 15.9 0.7 5.5 2.8 24.9
Members' contributions 4.0 - - - 4.0
Benefits paid (58.2) (4.0) (13.7) (2.8) (78.7)
Return on plan assets (excluding interest income) 53.9 (0.3) (4.1) - 49.5
At 31 March 2018 1,632.0 27.3 236.0 - 1,895.3
Interest income on scheme assets 41.4 0.6 6.0 - 48.0
Administration costs - - (0.4) - (0.4)
Employers' contributions 13.3 - 6.0 2.8 22.1
Benefits paid (93.2) (3.3) (17.6) (2.8) (116.9)
Return on plan assets (excluding interest income) 29.3 0.5 11.1 - 40.9
At 31 March 2019 1,622.8 25.1 241.1 - 1,889.0
g) Reconciliation of scheme liabilities
Unfunded
AWGPS Hartlepool MPLAP pensions Total
£m £m £m £m £m
At 1 April 2017 (1,606.8) (26.2) (265.1) (49.2) (1,947.3)
Current service cost (9.1) (0.3) - - (9.4)
Gain on curtailment (2.5) 1.8 - - (0.7)
Interest cost on scheme liabilities (41.2) (0.7) (6.7) (1.2) (49.8)
Members' contributions (4.0) - - - (4.0)
Benefits paid 58.2 4.0 13.7 2.8 78.7
Actuarial gain 27.2 0.4 2.7 0.4 30.7
At 31 March 2018 (1,578.2) (21.0) (255.4) (47.2) (1,901.8)
Past service cost (3.5) - - - (3.5)
Interest cost on scheme liabilities (39.8) (0.5) (6.4) (1.2) (47.9)
Benefits paid 93.2 3.3 17.6 2.8 116.9
Actuarial loss (45.5) (0.3) (12.0) (0.2) (58.0)
At 31 March 2019 (1,573.8) (18.5) (256.2) (45.8) (1,894.3)
27. Share capital
Group and Company
2019 2018
£m £m
Allotted, issued and fully paid
87,615,751,649 ordinary shares of 1 pence each 876.2 854.2
876.2 854.2
On 5 October 2018 the company issued 22 million £1 ordinary shares to its immediate parent
undertaking in return for cash.

Osprey Acquisitions Limited
Notes to the financial statements (continued) for the year ended 31 March 2019
121
28. Hedging reserve
Group
2019 2018
£m £m
At the beginning of the year (as previously reported) (105.3) (120.5)
Change in accounting policy - IFRS 9 (3.8) -
At the beginning of the year (restated) (109.1) (120.5)
Gains on cash flow energy hedges 9.8 8.3
Amounts transferred to the income statement (3.2) (1.8)
Losses on cash flow hedges (10.8) (46.3)
Amounts transferred to the income statement from discontinuation of cash flow hedges 4.7 3.7
Exchange movement on hedging instruments related to debt in cash flow hedges 38.8 54.4
Deferred tax movement on cash flow hedges (6.1) (3.1)
At 31 March (75.9) (105.3)
Cost of hedging reserve
2019
£m
At the beginning of the period (as previously reported) -
Change in accounting policy - IFRS 9 1.8
At the beginning of the period (restated) 1.8 Amounts transferred to the income statement (0.3)
Losses on cash flow hedges (excluding energy hedges) 0.9
Deferred tax movement (0.4)
At the end of the period 2.0
The hedging reserve represents the cumulative effective portion of gains and losses arising on the
change in fair value of hedging instruments excluding those fair value movements identified as costs
of hedging within the specific hedge relationship. The cost of hedging reserve captures the movement
in the fair value of the cost of hedging component.
See notes 1 and 33 for the impact of adopting IFRS 15.
The company
The company has no hedging reserve (2018: none).
The table below provides additional information in relation to the annual movements and cumulative closing positions on the cash flow hedge reserves.
Annual movements Cumulative reserves
Hedge Total hedge Total hedge Deferred tax
Hedged item ineffectiveness reserves reserves on hedge Total hedge
gain/(loss) gain/(loss) continuing discontinued reserves reserves
£m £m £m £m £m £m
Cash flow hedge of interest rate risk
84.6 3.4 (7.5) (81.5) 15.1 (73.9)
84.6 3.4 (7.5) (81.5) 15.1 (73.9)

Osprey Acquisitions Limited
Notes to the financial statements (continued) for the year ended 31 March 2019
122
29. Capital commitments
The group has a substantial long-term investment programme within Anglian Water, which includes
expenditure to meet regulatory requirements, shortfalls in performance and condition, and to provide
for new demand and growth. The commitments shown below reflect the value outstanding of orders
placed at 31 March 2019.
Group
2019 2018
£m £m
Property, plant and equipment 67.3 76.1
Intangible assets 26.6 32.7
93.9 108.8
There were no capital commitments relating to the group’s share of joint ventures.
The company
The company has no such commitments (2018: none).
30. Lease commitments
a) Operating lease commitments
The group leases certain properties and various items of plant and equipment, as well as vehicles,
under operating leases. In addition the group sub-lets a number of leased properties.
At 31 March 2019 the group had the following outstanding commitments in respect of future minimum
lease payments under non-cancellable operating leases:
Group
2019 2018
£m £m
Within one year 3.8 7.0
Between one and five years 13.3 16.2
After five years 20.7 8.3
37.8 31.5
The total future minimum sublease payments expected to be received under non-cancellable operating
leases were:
Group
2019 2018
£m £m
The group
Within one year 0.4 0.8
Between one and five years 1.1 1.8
1.5 2.6
On adoption of IFRS 16 the group expects to bring substantially all leases currently treated as
operating leases on to the balance sheet.
The company
The company has no such commitments (2018: none).
b) Leases as lessor
The group leases out its investment properties. During the year to 31 March 2019 rental income of
£0.8 million (2018: £0.9 million) was included within revenue.
Osprey Acquisitions Limited
Notes to the financial statements (continued) for the year ended 31 March 2019
123
31. Contingencies
The group has entered into a number of performance bonds and guarantee arrangements in the
normal course of business. Provision is made for any amounts that the Directors consider may become
payable under such arrangements.
The group has entered into a variety of restructuring and re-financing initiatives over time to optimise
the efficiency of its balance sheet and organisation in order to create value for customers and
shareholders. Extensive professional advice has been taken which supports the view that all group
restructurings have been correctly treated for accounting and tax purposes and therefore, since any
risk here is very low, no provisions for tax liabilities are considered to be necessary. At 31 March
2019, the group had £nil (2018: £46.7 million) of recoverable ACT recorded in the balance sheet as
the balance of £46.7 million was recovered in the year.
Anglian Water received indications of claims from two groups of property search companies in 2016
and a further two in 2018. The four company groups, pursuant to the Environmental Information
Regulations, assert that certain information that we provided to them should have been provided free
of charge. Of the four groups two are still in correspondence with Anglian Water Services Limited. This
is an industry-wide issue and at this stage the Directors consider the amount to be uncertain, but not
to be material to the financial standing of the group.
As is normal for a company of this size and nature it is subject to a number of other claims, disputes
and litigation. The Directors consider an appropriate position has been taken in reflecting such items
in these financial statements.
32. Ultimate parent undertaking and controlling party
Osprey Acquisitions Limited is a limited liability company incorporated and domiciled in England and
Wales.
The Directors consider Anglian Water Group Limited, a company registered in Jersey, to be the
ultimate parent undertaking. Anglian Water Group Limited is itself owned and ultimately controlled by
a consortium of investors consisting of the Canada Pension Plan Investment Board, Colonial First State
Global Asset Management (‘Colonial First State’), IFM Investors, Camulodunum Investments Ltd
(‘CIL’), and Infinity Investments S.A. (‘Infinity’). 3i sold its holding in Anglian Water Group Limited to
CIL on 21 February 2018 and Colonial First State sold part of its holding to Infinity on 22 June 2018.
Osprey Holdco Limited is the parent company of the smallest group to consolidate the financial
statements of the company, and Anglian Water Group Limited is the parent company of the largest
group to consolidate the financial statements of the company. Copies of the Anglian Water Group
Limited financial statements can be obtained from the Company Secretary, Lancaster House,
Lancaster Way, Ermine Business Park, Huntingdon, Cambridgeshire PE29 6XU.

Osprey Acquisitions Limited
Notes to the financial statements (continued) for the year ended 31 March 2019
124
33. Impact of changes to accounting policies
As set out in note 1, the group has adopted IFRS 9 ‘Financial Instruments’ and IFRS 15 ‘Revenue from
Contracts with Customers’ with effect from 1 April 2018. The impact of adopting these standards on
the group’s financial statements is set out below.
IFRS 9 ‘Financial Instruments’
Within the statement of changes in equity, a distinction has been made between the change in value
of fair value hedging instruments and the fair value movements identified as costs of hedging, the
latter being presented in the cost of hedging reserve. The adjustment recorded relates to the
treatment of currency basis as a cost of hedging in relation to the cross currency interest rate swaps
transacted in order to swap foreign currency debt issuances into Sterling.
In accordance with IFRS 9, paragraphs 7.2.1 and 7.2.15, the group has applied this standard
retrospectively but has elected not to restate prior periods.
IFRS 15 ‘Revenue from Contracts with Customers’
Within the income statement, revenue of £63.1 million for the year ended 31 March 2018 has been
recognised, being the value of grants and contributions received. Other income, reflecting
amortisation of previously deferred grants and contributions, has been reversed resulting in a net
increase in operating profit of £46.9 million for the year ended 31 March 2018.
On adoption of IFRS 15, previously deferred grants and contributions of £498.9 million have been
recognised in equity as at 1 April 2017. After reflecting the above adjustments to operating profit,
deferred grants and contributions of £539.5 million at 31 March 2018 have been derecognised.
Deferred tax of £87.1 million at 1 April 2017, and £94.0 million at 31 March 2018, has been
recognised on the above restatements in accordance with IAS 12 ‘Income Taxes’.
The cash flow statement for the year ended 31 March 2018 has been restated to reflect the cash flow
impact of grants and contributions received as cash generated from operations, rather than being
included in investing activities.
The only other IFRS restatement is for the reclassification of certain types of income, which for
regulatory reporting is offset against operating costs, as revenue. In the year ended 31 March 2018
this income amounted to £11.1 million, and relates principally to rent receivables, electricity
generated from Combined Heat and Power engines, and sludge sales. This reclassification has no
effect on operating profit or operating cash flow.
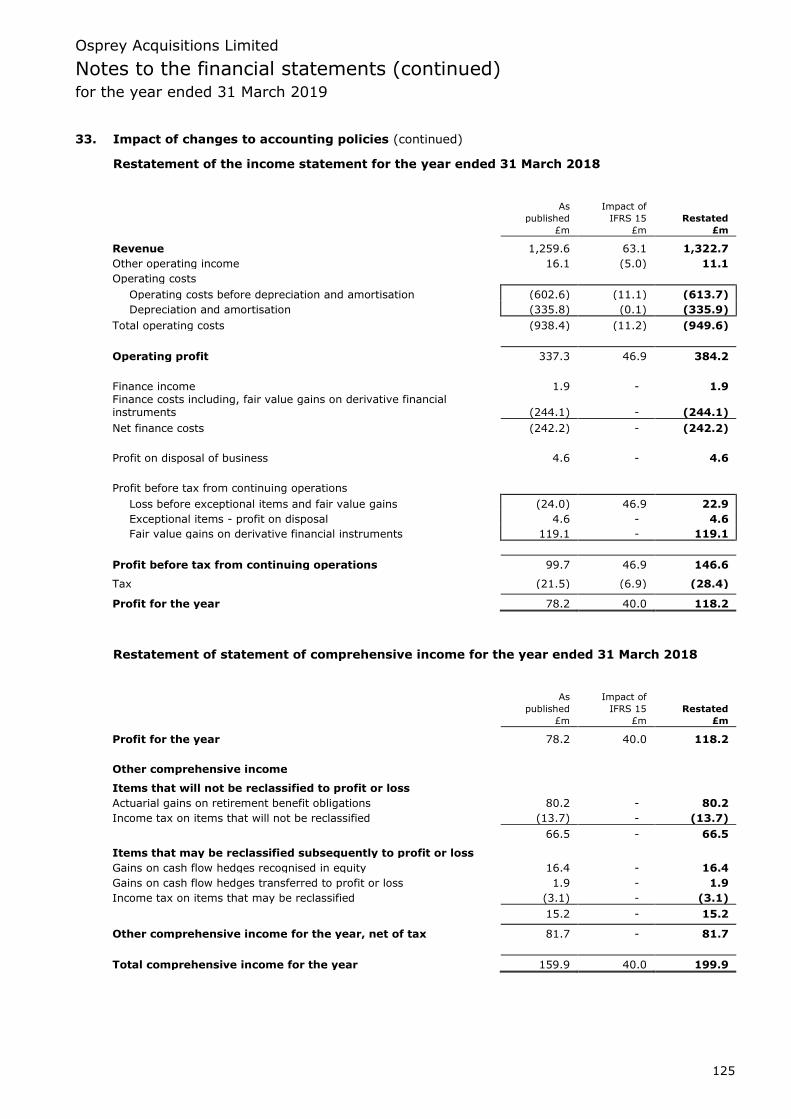
Osprey Acquisitions Limited
Notes to the financial statements (continued) for the year ended 31 March 2019
125
33. Impact of changes to accounting policies (continued)
Restatement of the income statement for the year ended 31 March 2018
As Impact of
published IFRS 15 Restated
£m £m £m
Revenue 1,259.6 63.1 1,322.7
Other operating income 16.1 (5.0) 11.1
Operating costs
Operating costs before depreciation and amortisation (602.6) (11.1) (613.7)
Depreciation and amortisation (335.8) (0.1) (335.9)
Total operating costs (938.4) (11.2) (949.6)
Operating profit 337.3 46.9 384.2
Finance income 1.9 - 1.9
Finance costs including, fair value gains on derivative financial instruments (244.1) - (244.1)
Net finance costs (242.2) - (242.2)
Profit on disposal of business 4.6 - 4.6
Profit before tax from continuing operations
Loss before exceptional items and fair value gains (24.0) 46.9 22.9
Exceptional items - profit on disposal 4.6 - 4.6
Fair value gains on derivative financial instruments 119.1 - 119.1
Profit before tax from continuing operations 99.7 46.9 146.6 Tax (21.5) (6.9) (28.4) Profit for the year 78.2 40.0 118.2
Restatement of statement of comprehensive income for the year ended 31 March 2018
As Impact of
published IFRS 15 Restated
£m £m £m
Profit for the year 78.2 40.0 118.2
Other comprehensive income Items that will not be reclassified to profit or loss
Actuarial gains on retirement benefit obligations 80.2 - 80.2
Income tax on items that will not be reclassified (13.7) - (13.7)
66.5 - 66.5 Items that may be reclassified subsequently to profit or loss
Gains on cash flow hedges recognised in equity 16.4 - 16.4
Gains on cash flow hedges transferred to profit or loss 1.9 - 1.9
Income tax on items that may be reclassified (3.1) - (3.1)
15.2 - 15.2 Other comprehensive income for the year, net of tax 81.7 - 81.7
Total comprehensive income for the year 159.9 40.0 199.9
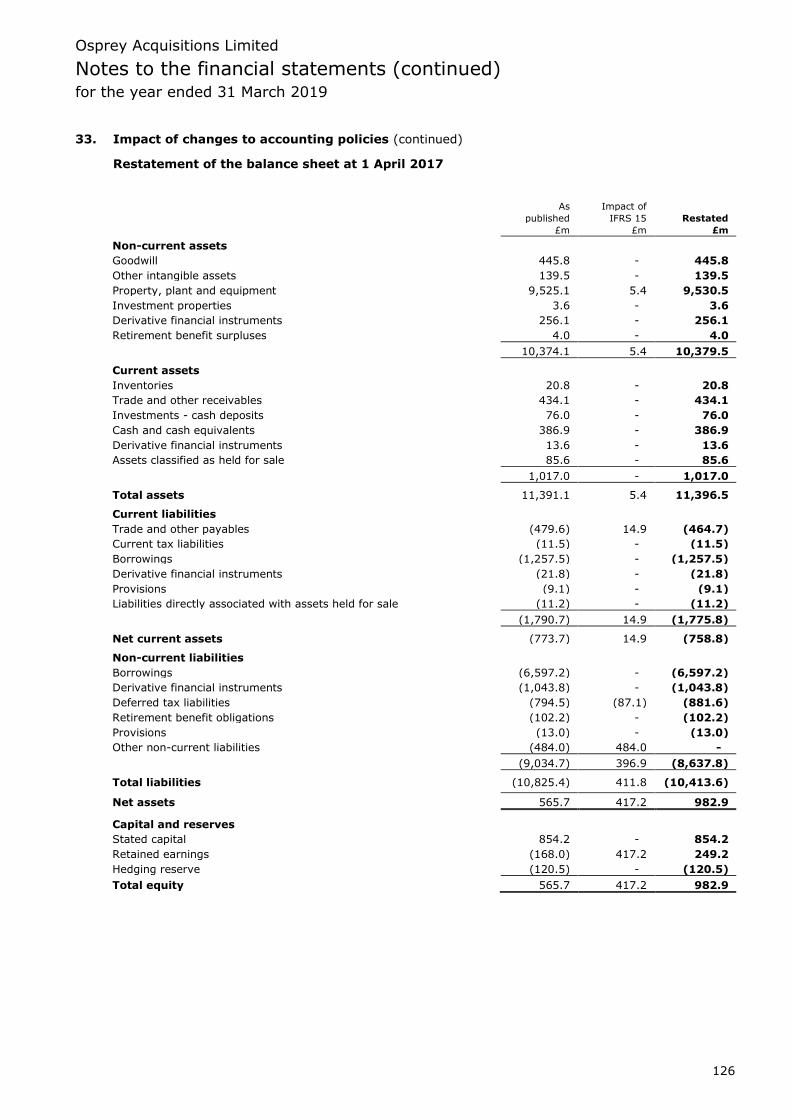
Osprey Acquisitions Limited
Notes to the financial statements (continued) for the year ended 31 March 2019
126
33. Impact of changes to accounting policies (continued)
Restatement of the balance sheet at 1 April 2017
As Impact of
published IFRS 15 Restated
£m £m £m
Non-current assets
Goodwill 445.8 - 445.8
Other intangible assets 139.5 - 139.5
Property, plant and equipment 9,525.1 5.4 9,530.5
Investment properties 3.6 - 3.6
Derivative financial instruments 256.1 - 256.1
Retirement benefit surpluses 4.0 - 4.0
10,374.1 5.4 10,379.5
Current assets
Inventories 20.8 - 20.8
Trade and other receivables 434.1 - 434.1
Investments - cash deposits 76.0 - 76.0
Cash and cash equivalents 386.9 - 386.9
Derivative financial instruments 13.6 - 13.6
Assets classified as held for sale 85.6 - 85.6
1,017.0 - 1,017.0
Total assets 11,391.1 5.4 11,396.5 Current liabilities
Trade and other payables (479.6) 14.9 (464.7)
Current tax liabilities (11.5) - (11.5)
Borrowings (1,257.5) - (1,257.5)
Derivative financial instruments (21.8) - (21.8)
Provisions (9.1) - (9.1)
Liabilities directly associated with assets held for sale (11.2) - (11.2)
(1,790.7) 14.9 (1,775.8)
Net current assets (773.7) 14.9 (758.8) Non-current liabilities
Borrowings (6,597.2) - (6,597.2)
Derivative financial instruments (1,043.8) - (1,043.8)
Deferred tax liabilities (794.5) (87.1) (881.6)
Retirement benefit obligations (102.2) - (102.2)
Provisions (13.0) - (13.0)
Other non-current liabilities (484.0) 484.0 -
(9,034.7) 396.9 (8,637.8)
Total liabilities (10,825.4) 411.8 (10,413.6) Net assets 565.7 417.2 982.9
Capital and reserves
Stated capital 854.2 - 854.2
Retained earnings (168.0) 417.2 249.2
Hedging reserve (120.5) - (120.5)
Total equity 565.7 417.2 982.9
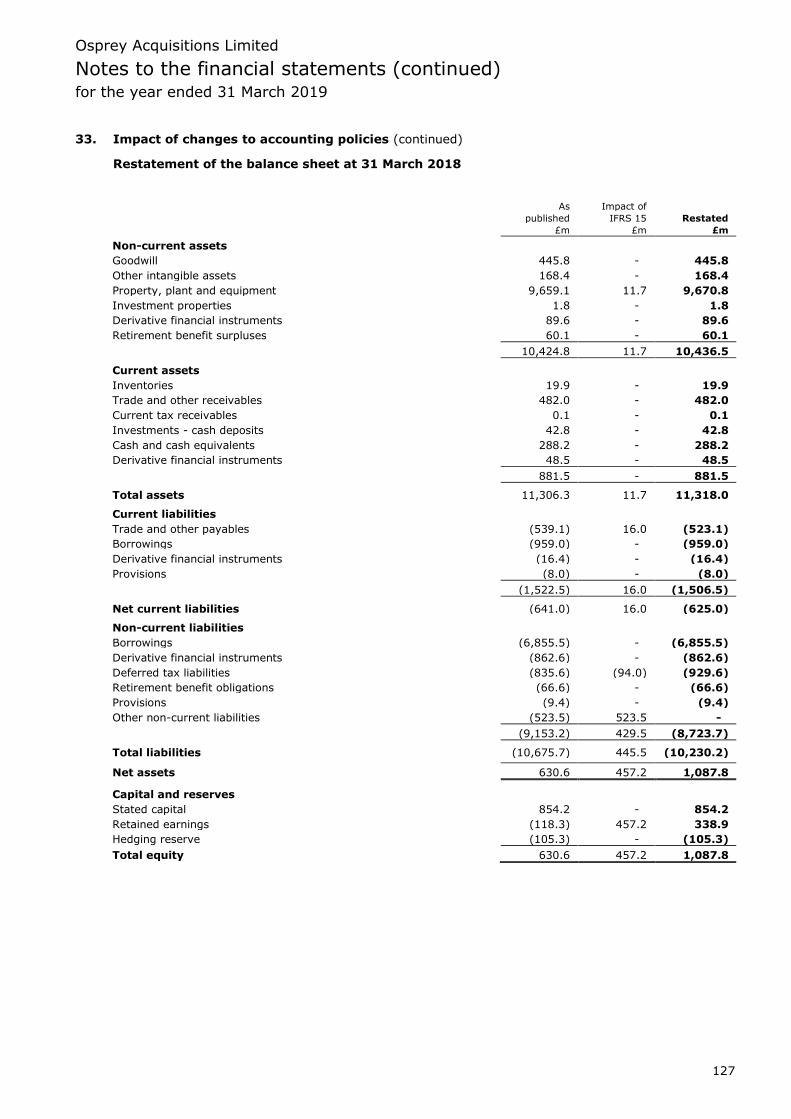
Osprey Acquisitions Limited
Notes to the financial statements (continued) for the year ended 31 March 2019
127
33. Impact of changes to accounting policies (continued)
Restatement of the balance sheet at 31 March 2018
As Impact of
published IFRS 15 Restated
£m £m £m
Non-current assets
Goodwill 445.8 - 445.8
Other intangible assets 168.4 - 168.4
Property, plant and equipment 9,659.1 11.7 9,670.8
Investment properties 1.8 - 1.8
Derivative financial instruments 89.6 - 89.6
Retirement benefit surpluses 60.1 - 60.1
10,424.8 11.7 10,436.5
Current assets
Inventories 19.9 - 19.9
Trade and other receivables 482.0 - 482.0
Current tax receivables 0.1 - 0.1
Investments - cash deposits 42.8 - 42.8
Cash and cash equivalents 288.2 - 288.2
Derivative financial instruments 48.5 - 48.5
881.5 - 881.5
Total assets 11,306.3 11.7 11,318.0 Current liabilities
Trade and other payables (539.1) 16.0 (523.1)
Borrowings (959.0) - (959.0)
Derivative financial instruments (16.4) - (16.4)
Provisions (8.0) - (8.0)
(1,522.5) 16.0 (1,506.5)
Net current liabilities (641.0) 16.0 (625.0) Non-current liabilities
Borrowings (6,855.5) - (6,855.5)
Derivative financial instruments (862.6) - (862.6)
Deferred tax liabilities (835.6) (94.0) (929.6)
Retirement benefit obligations (66.6) - (66.6)
Provisions (9.4) - (9.4)
Other non-current liabilities (523.5) 523.5 -
(9,153.2) 429.5 (8,723.7)
Total liabilities (10,675.7) 445.5 (10,230.2) Net assets 630.6 457.2 1,087.8
Capital and reserves
Stated capital 854.2 - 854.2
Retained earnings (118.3) 457.2 338.9
Hedging reserve (105.3) - (105.3)
Total equity 630.6 457.2 1,087.8
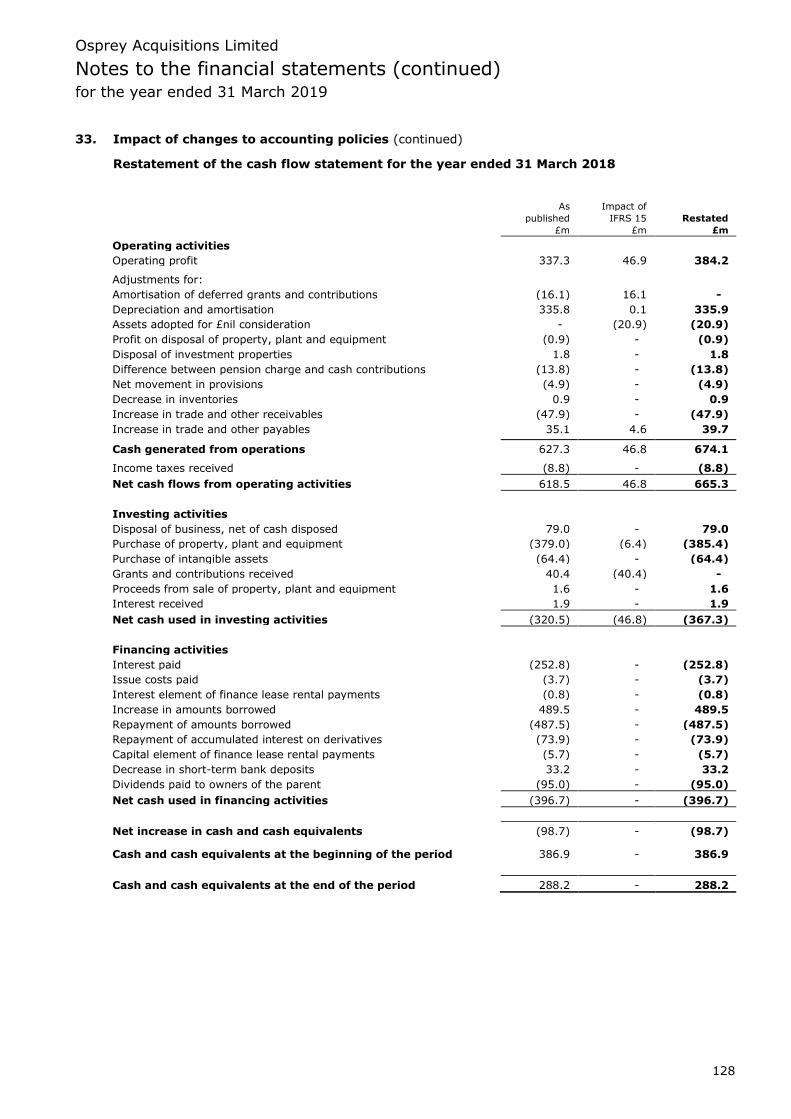
Osprey Acquisitions Limited
Notes to the financial statements (continued) for the year ended 31 March 2019
128
33. Impact of changes to accounting policies (continued)
Restatement of the cash flow statement for the year ended 31 March 2018
As Impact of
published IFRS 15 Restated
£m £m £m
Operating activities
Operating profit 337.3 46.9 384.2 Adjustments for:
Amortisation of deferred grants and contributions (16.1) 16.1 -
Depreciation and amortisation 335.8 0.1 335.9
Assets adopted for £nil consideration - (20.9) (20.9)
Profit on disposal of property, plant and equipment (0.9) - (0.9)
Disposal of investment properties 1.8 - 1.8
Difference between pension charge and cash contributions (13.8) - (13.8)
Net movement in provisions (4.9) - (4.9)
Decrease in inventories 0.9 - 0.9
Increase in trade and other receivables (47.9) - (47.9)
Increase in trade and other payables 35.1 4.6 39.7 Cash generated from operations 627.3 46.8 674.1 Income taxes received (8.8) - (8.8)
Net cash flows from operating activities 618.5 46.8 665.3
Investing activities
Disposal of business, net of cash disposed 79.0 - 79.0
Purchase of property, plant and equipment (379.0) (6.4) (385.4)
Purchase of intangible assets (64.4) - (64.4)
Grants and contributions received 40.4 (40.4) -
Proceeds from sale of property, plant and equipment 1.6 - 1.6
Interest received 1.9 - 1.9
Net cash used in investing activities (320.5) (46.8) (367.3)
Financing activities
Interest paid (252.8) - (252.8)
Issue costs paid (3.7) - (3.7)
Interest element of finance lease rental payments (0.8) - (0.8)
Increase in amounts borrowed 489.5 - 489.5
Repayment of amounts borrowed (487.5) - (487.5)
Repayment of accumulated interest on derivatives (73.9) - (73.9)
Capital element of finance lease rental payments (5.7) - (5.7)
Decrease in short-term bank deposits 33.2 - 33.2
Dividends paid to owners of the parent (95.0) - (95.0)
Net cash used in financing activities (396.7) - (396.7)
Net increase in cash and cash equivalents (98.7) - (98.7) Cash and cash equivalents at the beginning of the period 386.9 - 386.9
Cash and cash equivalents at the end of the period 288.2 - 288.2
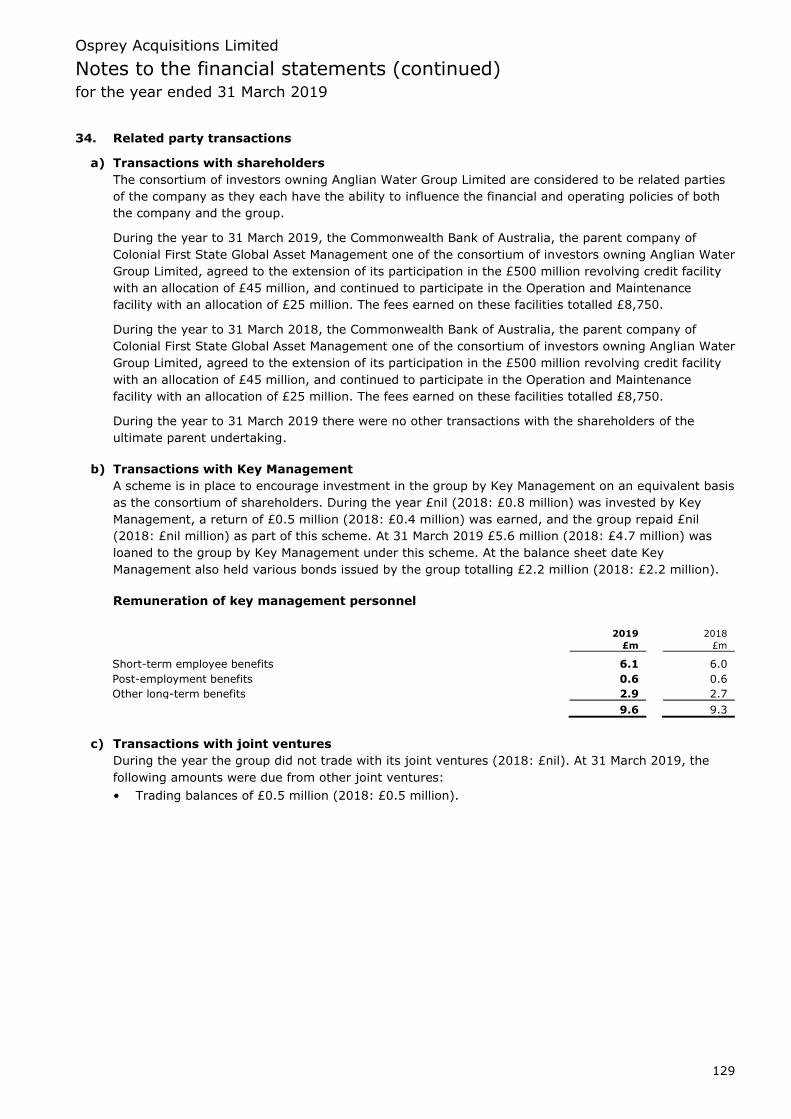
Osprey Acquisitions Limited
Notes to the financial statements (continued) for the year ended 31 March 2019
129
34. Related party transactions
a) Transactions with shareholders
The consortium of investors owning Anglian Water Group Limited are considered to be related parties
of the company as they each have the ability to influence the financial and operating policies of both
the company and the group.
During the year to 31 March 2019, the Commonwealth Bank of Australia, the parent company of
Colonial First State Global Asset Management one of the consortium of investors owning Anglian Water
Group Limited, agreed to the extension of its participation in the £500 million revolving credit facility
with an allocation of £45 million, and continued to participate in the Operation and Maintenance
facility with an allocation of £25 million. The fees earned on these facilities totalled £8,750.
During the year to 31 March 2018, the Commonwealth Bank of Australia, the parent company of
Colonial First State Global Asset Management one of the consortium of investors owning Anglian Water
Group Limited, agreed to the extension of its participation in the £500 million revolving credit facility
with an allocation of £45 million, and continued to participate in the Operation and Maintenance
facility with an allocation of £25 million. The fees earned on these facilities totalled £8,750.
During the year to 31 March 2019 there were no other transactions with the shareholders of the
ultimate parent undertaking.
b) Transactions with Key Management
A scheme is in place to encourage investment in the group by Key Management on an equivalent basis
as the consortium of shareholders. During the year £nil (2018: £0.8 million) was invested by Key
Management, a return of £0.5 million (2018: £0.4 million) was earned, and the group repaid £nil
(2018: £nil million) as part of this scheme. At 31 March 2019 £5.6 million (2018: £4.7 million) was
loaned to the group by Key Management under this scheme. At the balance sheet date Key
Management also held various bonds issued by the group totalling £2.2 million (2018: £2.2 million).
Remuneration of key management personnel
2019 2018
£m £m
Short-term employee benefits 6.1 6.0
Post-employment benefits 0.6 0.6
Other long-term benefits 2.9 2.7
9.6 9.3
c) Transactions with joint ventures
During the year the group did not trade with its joint ventures (2018: £nil). At 31 March 2019, the
following amounts were due from other joint ventures:
• Trading balances of £0.5 million (2018: £0.5 million).

Osprey Acquisitions Limited
Notes to the financial statements (continued) for the year ended 31 March 2019
130
34. Related party transactions (continued)
d) Parent company
The company’s related party transactions are summarised below:
2019 2018
£m £m
Management fees paid to
Subsidiaries (0.1) (0.1)
Interest paid to
Subsidiaries (21.3) (27.4)
Dividends received from
Subsidiaries 57.5 117.6
Dividends paid to
Shareholders (40.8) (95.0)
2019 2018
£m £m
Current tax receivables due from
Subsidiaries 4.1 6.5
Loans and other borrowings due from
Parent company (728.8) (728.8)
Subsidiaries (452.3) (451.5)
35. Events after the balance sheet date
There have been no events between the balance sheet date, and the date on which the financial
statements were approved by the Board, which would require adjustment to the financial statements
or any additional disclosures.
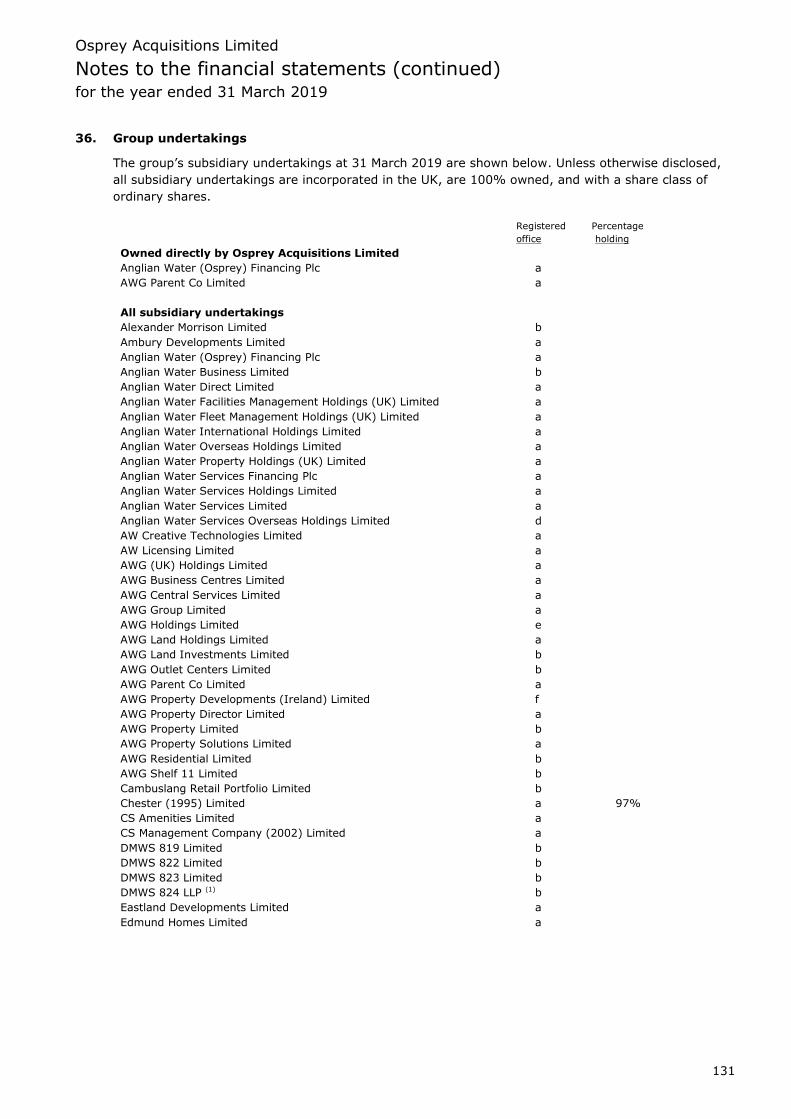
Osprey Acquisitions Limited
Notes to the financial statements (continued) for the year ended 31 March 2019
131
36. Group undertakings
The group’s subsidiary undertakings at 31 March 2019 are shown below. Unless otherwise disclosed,
all subsidiary undertakings are incorporated in the UK, are 100% owned, and with a share class of
ordinary shares.
Registered
office
Percentage
holding
Owned directly by Osprey Acquisitions Limited
Anglian Water (Osprey) Financing Plc a
AWG Parent Co Limited a
All subsidiary undertakings
Alexander Morrison Limited b
Ambury Developments Limited a
Anglian Water (Osprey) Financing Plc a
Anglian Water Business Limited b
Anglian Water Direct Limited a
Anglian Water Facilities Management Holdings (UK) Limited a
Anglian Water Fleet Management Holdings (UK) Limited a
Anglian Water International Holdings Limited a
Anglian Water Overseas Holdings Limited a
Anglian Water Property Holdings (UK) Limited a
Anglian Water Services Financing Plc a
Anglian Water Services Holdings Limited a
Anglian Water Services Limited a
Anglian Water Services Overseas Holdings Limited d
AW Creative Technologies Limited a
AW Licensing Limited a
AWG (UK) Holdings Limited a
AWG Business Centres Limited a
AWG Central Services Limited a
AWG Group Limited a
AWG Holdings Limited e
AWG Land Holdings Limited a
AWG Land Investments Limited b
AWG Outlet Centers Limited b
AWG Parent Co Limited a
AWG Property Developments (Ireland) Limited f
AWG Property Director Limited a
AWG Property Limited b
AWG Property Solutions Limited a
AWG Residential Limited b
AWG Shelf 11 Limited b
Cambuslang Retail Portfolio Limited b
Chester (1995) Limited a 97%
CS Amenities Limited a
CS Management Company (2002) Limited a
DMWS 819 Limited b
DMWS 822 Limited b
DMWS 823 Limited b
DMWS 824 LLP (1) b
Eastland Developments Limited a
Edmund Homes Limited a
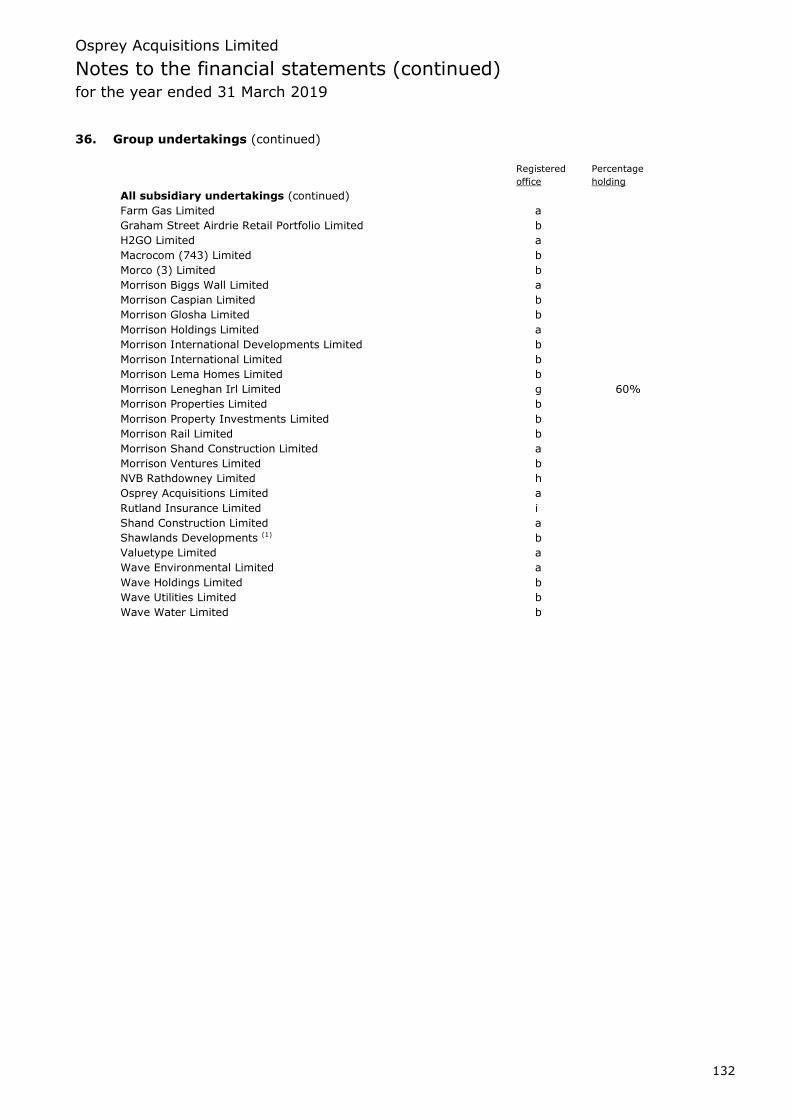
Osprey Acquisitions Limited
Notes to the financial statements (continued) for the year ended 31 March 2019
132
36. Group undertakings (continued)
Registered
office
Percentage
holding
All subsidiary undertakings (continued)
Farm Gas Limited a
Graham Street Airdrie Retail Portfolio Limited b
H2GO Limited a
Macrocom (743) Limited b
Morco (3) Limited b
Morrison Biggs Wall Limited a
Morrison Caspian Limited b
Morrison Glosha Limited b
Morrison Holdings Limited a
Morrison International Developments Limited b
Morrison International Limited b
Morrison Lema Homes Limited b
Morrison Leneghan Irl Limited g 60%
Morrison Properties Limited b
Morrison Property Investments Limited b
Morrison Rail Limited b
Morrison Shand Construction Limited a
Morrison Ventures Limited b
NVB Rathdowney Limited h
Osprey Acquisitions Limited a
Rutland Insurance Limited i
Shand Construction Limited a
Shawlands Developments (1) b
Valuetype Limited a
Wave Environmental Limited a
Wave Holdings Limited b
Wave Utilities Limited b
Wave Water Limited b
Osprey Acquisitions Limited
Notes to the financial statements (continued) for the year ended 31 March 2019
133
36. Group undertakings (continued)
Registered
office
Percentage
holding
Joint ventures
124 St Vincent Street (Glasgow) LLP (1) (2) i 50%
AWG Mitchell Investments (Tannochside) Limited (3) b 50%
AWG Outlets (Rathdowney) Limited e 50%
Castlemilk Retail LLP (1) (2) i 50%
City Road Properties (Chester) Limited a 50%
Crowwood Grange Estates Limited b 50%
Excel Centre Aberdeen Limited (2) i 50%
Gwent Euro Park Management Company Limited a 42%
Hollowstone Limited a 50%
Kings Waterfront Properties Limited a 50%
Leith Walk Properties Limited (2) i 50%
Morrison Gwent Limited a 50%
Morrison Residential Properties Limited b 50%
Ocean Point Developments Limited (2) i 50%
Palacecraig Street Coatbridge Limited (2) i 50%
Rathdowney Shopping Centre Management Company Limited e 50%
Spreevale Limited j 50%
(1) The principal place of business of these companies is the same as the registered office address.
(2) In administration.
(3) This company was dissolved on 8 May 2018.
Registered offices
a) Lancaster House, Lancaster Way, Ermine Business Park, Huntingdon, Cambridgeshire, PE29 6XU,
United Kingdom.
b) Ocean Point, 1st Floor, 94 Ocean Drive, Edinburgh, EH6 6JH, United Kingdom.
c) Suite 8, Northwood House, Northwood Business Campus, Santry, Dublin 9, Ireland.
d) Queensway House, Hilgrove Street, St Helier, JE1 1ES, Jersey, Channel Islands.
e) 1 Stokes Place, St Stephens Green, Dublin 2, Ireland.
f) 6th Floor, Southbank House, Barrow Street, Dublin 4, Ireland.
g) Rathdowney Shopping Outlet, Johnston Road, Rathdowney, Co Laois, Ireland.
h) PO Box 33, Dorey Court, Admiral Park, St Peter Port, GY1 4AT, Guernsey, Channel Islands.
i) Moorfields, 101 Rose Street, South Lane, Edinburgh, EH2 3JG, United Kingdom.
j) 15 Clanwilliam Terrace, Dublin 2, Ireland.
For all companies, the registered office is located in the country of incorporation.
Independent auditor’s report to the members of Osprey Acquisitions
Limited
134
Report on the audit of the financial statements
Opinion
In our opinion:
the financial statements of Osprey Holdco Limited (the ‘parent company’) and its subsidiaries (the
‘group’) give a true and fair view of the state of the group’s and of the parent company’s affairs as
at 31 March 2019 and of the group’s loss for the year then ended;
the group financial statements have been properly prepared in accordance with International
Financial Reporting Standards (IFRSs) as adopted by the European Union and IFRSs as issued by the
International Accounting Standards Board (IASB);
the parent company financial statements have been properly prepared in accordance with IFRSs as
adopted by the European Union and as applied in accordance with the provisions of the Companies
Act 2006; and
the financial statements have been prepared in accordance with the requirements of the Companies
Act 2006.
We have audited the financial statements which comprise:
the consolidated income statement;
the consolidated statement of comprehensive income;
the consolidated and parent company balance sheets;
the consolidated and parent company statements of changes in equity;
the consolidated and parent company cash flow statements; and
the related notes 1 to 36.
The financial reporting framework that has been applied in their preparation is applicable law and
International Financial Reporting Standards (IFRSs) as adopted by the European Union and, as regards the
parent company financial statements, as applied in accordance with the provisions of the Companies Act
2006.
Basis for opinion
We conducted our audit in accordance with International Standards on Auditing (UK) (ISAs(UK)) and
applicable law. Our responsibilities under those standards are further described in the auditor's
responsibilities for the audit of the financial statements section of our report.
We are independent of the group and parent company in accordance with the ethical requirements that are
relevant to our audit of the financial statements in the UK, including the FRC’s Ethical Standard, and we
have fulfilled our other ethical responsibilities in accordance with these requirements. We believe that the
audit evidence we have obtained is sufficient and appropriate to provide a basis for our opinion.
Conclusions relating to going concern
We are required by ISAs (UK) to report in respect of the following matters where:
the directors’ use of the going concern basis of accounting in preparation of the financial statements
is not appropriate; or
the directors have not disclosed in the financial statements any identified material uncertainties that
may cast significant doubt about the group’s or parent company’s ability to continue to adopt the
going concern basis of accounting for a period of at least twelve months from the date when the
financial statements are authorised for issue.
We have nothing to report in respect of these matters.
Other information
The directors are responsible for the other information. The other information comprises the information
included in the annual report, other than the financial statements and our auditor’s report thereon. Our
opinion on the financial statements does not cover the other information and, except to the extent otherwise
explicitly stated in our report, we do not express any form of assurance conclusion thereon.

Independent auditor’s report to the members of Osprey Acquisitions
Limited (continued)
135
In connection with our audit of the financial statements, our responsibility is to read the other information
and, in doing so, consider whether the other information is materially inconsistent with the financial
statements or our knowledge obtained in the audit or otherwise appears to be materially misstated. If we
identify such material inconsistencies or apparent material misstatements, we are required to determine
whether there is a material misstatement in the financial statements or a material misstatement of the other
information. If, based on the work we have performed, we conclude that there is a material misstatement of
this other information, we are required to report that fact.
We have nothing to report in respect of these matters.
Responsibilities of directors
As explained more fully in the directors’ responsibilities statement, the directors are responsible for the
preparation of the financial statements and for being satisfied that they give a true and fair view, and for
such internal control as the directors determine is necessary to enable the preparation of financial
statements that are free from material misstatement, whether due to fraud or error.
In preparing the financial statements, the directors are responsible for assessing the group’s and the parent
company’s ability to continue as a going concern, disclosing, as applicable, matters related to going concern
and using the going concern basis of accounting unless the directors either intend to liquidate the group or
the parent company or to cease operations, or have no realistic alternative but to do so.
Auditor’s responsibilities for the audit of the financial statements
Our objectives are to obtain reasonable assurance about whether the financial statements as a whole are
free from material misstatement, whether due to fraud or error, and to issue an auditor's report that
includes our opinion. Reasonable assurance is a high level of assurance, but is not a guarantee that an audit
conducted in accordance with ISAs (UK) will always detect a material misstatement when it exists.
Misstatements can arise from fraud or error and are considered material if, individually or in the aggregate,
they could reasonably be expected to influence the economic decisions of users taken on the basis of these
financial statements.
A further description of our responsibilities for the audit of the financial statements is located on the
Financial Reporting Council’s website at: www.frc.org.uk/auditorsresponsibilities. This description forms part
of our auditor’s report.
Report on other legal and regulatory requirements
Opinions on other matters prescribed by the Companies Act 2006
In our opinion, based on the work undertaken in the course of the audit:
the information given in the strategic report and the directors’ report for the financial year for which
the financial statements are prepared is consistent with the financial statements; and
the strategic report and the directors’ report have been prepared in accordance with applicable legal
requirements.
In the light of the knowledge and understanding of the group and of the parent company and its
environment obtained in the course of the audit, we have not identified any material misstatements in the
strategic report or the directors’ report.


![Osprey - Colour Series - Sky Truck 2 [Osprey Color]](https://static.documents.pub/doc/80x56/545d6543b0af9fb32c8b5093/osprey-colour-series-sky-truck-2-osprey-color.jpg)


