Page 1
General rights Copyright and moral rights for the publications made accessible in the public portal are retained by the authors and/or other copyright owners and it is a condition of accessing publications that users recognise and abide by the legal requirements associated with these rights.
Users may download and print one copy of any publication from the public portal for the purpose of private study or research.
You may not further distribute the material or use it for any profit-making activity or commercial gain
You may freely distribute the URL identifying the publication in the public portal If you believe that this document breaches copyright please contact us providing details, and we will remove access to the work immediately and investigate your claim.
Downloaded from orbit.dtu.dk on: Jan 20, 2020
Ostwald ripening in a Pt/SiO2 model catalyst studied by in situ TEM
Simonsen, Søren Bredmose; Chorkendorff, Ib; Dahl, Søren; Skoglundh, Magnus; Sehested, Jens;Helveg, StigPublished in:Journal of Catalysis
Link to article, DOI:10.1016/j.jcat.2011.04.011
Publication date:2011
Document VersionPeer reviewed version
Link back to DTU Orbit
Citation (APA):Simonsen, S. B., Chorkendorff, I., Dahl, S., Skoglundh, M., Sehested, J., & Helveg, S. (2011). Ostwald ripeningin a Pt/SiO2 model catalyst studied by in situ TEM. Journal of Catalysis, 281(1), 147-155.https://doi.org/10.1016/j.jcat.2011.04.011
Page 2
1
Ostwald ripening in a Pt/SiO2 model catalyst studied by in situ TEM Søren Bredmose Simonsen1,2, Ib Chorkendorff2, Søren Dahl2, Magnus Skoglundh3, Jens Sehested1 and Stig Helveg1
1Haldor Topsøe A/S, Nymøllevej 55, DK-2800 Kgs. Lyngby, Denmark, 2CINF, Department of Physics, Technical University of Denmark, DK-2800 Kgs. Lyngby, Denmark 3Competence Centre for Catalysis (KCK), Chalmers University of Technology, SE-41296, Göteborg, Sweden ABSTRACT: Sintering of Pt nanoparticles dispersed on a planar SiO2 support was studied by in situ
transmission electron microscopy (TEM). A time-lapsed TEM image series of the Pt nanoparticles,
acquired during the exposure to 10 mbar synthetic air at 650 ºC, reveal that the sintering is governed by
the Ostwald ripening mechanism. The in situ TEM images also provide information about the temporal
evolution of the Pt particle size distribution and of the individual nanoparticle’s growth or decay. The
observed Pt nanoparticle changes compare well with predictions made by mean-field kinetic models for
ripening, but deviations are revealed for the time-evolution for the individual nanoparticles. A better
description of the individual nanoparticle ripening is obtained by kinetic models that include local
correlations between neighboring nanoparticles in the atom-exchange process.
KEYWORDS: Catalyst deactivation, sintering, Ostwald ripening, nanoparticles, Pt, in situ TEM.
1. Introduction
Metal nanoparticles dispersed on a porous support material are used as efficient heterogeneous catalysts
for diverse applications in energy conversion, chemical supply and environmental protection [1,2].
However, the high-surface area of the nanoparticles is associated with an excess surface energy, so the
nanoparticles represent a meta-stable solid state. Given sufficient thermal activation, the nanoparticles
will therefore sinter into larger particles and consequently cause an unwanted reduction of the metal
surface area which may affect the catalyst performance [3-5]. At the microscopic level, the sintering is
attributed to the transport of atomic species (metal atoms or complexes consisting of metal atoms and
gas derivatives) at the surface of the nanoparticle or the support material [4]. The specific transport
pathways for the atomic species are often considered to reflect the following generic sintering
mechanisms [4,6]: (i) particle migration, in which the nanoparticles diffuse over the support and
eventually coalesce with other nanoparticles, and (ii) atom migration, in which atomic species are
emitted from one nanoparticle, diffuse over the support and attach to another nanoparticle. The latter
mechanism is often referred to as Ostwald ripening.
Page 3
2
In Ostwald ripening, the transport of atomic species is explained by the Gibbs-Thomson relation [4,7],
which describes the surface concentration of the diffusing species at support sites adjacent to the edge of
a nanoparticle, ρr , by
(1)
kTrr
2exp
where r is the radius of the nanoparticle, ρ∞ the surface concentration of atomic species in equilibrium
with an infinitely large particle, γ the surface energy, Ω the atomic volume, k Boltzmann’s constant and
T the temperature. According to eq. 1, the concentration of atomic species is higher near small particles
than near larger particles. As a result of the gradient in concentration, a net flux will proceed where
atomic species diffuse from smaller to larger particles, so the larger particles eventually grow at the
expense of the smaller ones. The growth or decay of the nanoparticles is often described by kinetic
models relying on the mean-field assumption of the concentration of atomic species. That is, the
concentration of atomic species is constant on the support beyond the screening distance, L, from the
edge of the particle and this mean-field concentration is governing the atom-exchange for each particle
in the ripening process [4,7]. Combined with the assumption of a flat and homogeneous catalyst support,
expressions for the rate of particle size change can be derived. For an interface-controlled ripening
process, in which the diffusion over the support is fast and the flux away from the particle edge limits
the sintering rate, the rate by which the radius changes, dr/dt, can be expressed by [4]:
(2)
1
*2 r
r
rdt
dr
For a diffusion-controlled ripening process, in which the diffusion on the support limits the sintering
rate, the rate by which the radius changes can be expressed by [4]:
(3)
1
*ln
'3 r
r
rLrdt
dr
In eqs. 2 and 3, α and α’ are system specific parameters, r the particle radius and r* the critical radius.
At a given time in the sintering process, the critical radius corresponds to the particle size, which is in
equilibrium with the mean-field concentration, and therefore does not change. Moreover, eqs. 2 and 3
are based on a first order Taylor expansion of eq. 1. In this approximation r* equals the mean arithmetic
Page 4
3
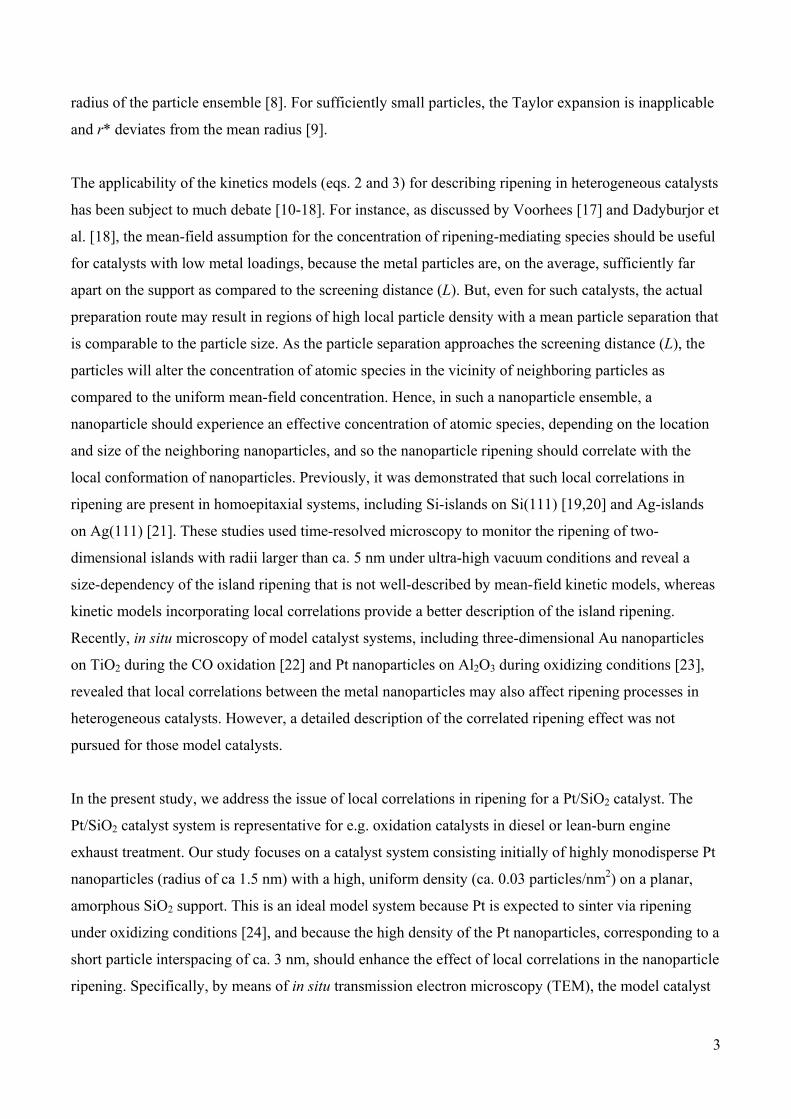
radius of the particle ensemble [8]. For sufficiently small particles, the Taylor expansion is inapplicable
and r* deviates from the mean radius [9].
The applicability of the kinetics models (eqs. 2 and 3) for describing ripening in heterogeneous catalysts
has been subject to much debate [10-18]. For instance, as discussed by Voorhees [17] and Dadyburjor et
al. [18], the mean-field assumption for the concentration of ripening-mediating species should be useful
for catalysts with low metal loadings, because the metal particles are, on the average, sufficiently far
apart on the support as compared to the screening distance (L). But, even for such catalysts, the actual
preparation route may result in regions of high local particle density with a mean particle separation that
is comparable to the particle size. As the particle separation approaches the screening distance (L), the
particles will alter the concentration of atomic species in the vicinity of neighboring particles as
compared to the uniform mean-field concentration. Hence, in such a nanoparticle ensemble, a
nanoparticle should experience an effective concentration of atomic species, depending on the location
and size of the neighboring nanoparticles, and so the nanoparticle ripening should correlate with the
local conformation of nanoparticles. Previously, it was demonstrated that such local correlations in
ripening are present in homoepitaxial systems, including Si-islands on Si(111) [19,20] and Ag-islands
on Ag(111) [21]. These studies used time-resolved microscopy to monitor the ripening of two-
dimensional islands with radii larger than ca. 5 nm under ultra-high vacuum conditions and reveal a
size-dependency of the island ripening that is not well-described by mean-field kinetic models, whereas
kinetic models incorporating local correlations provide a better description of the island ripening.
Recently, in situ microscopy of model catalyst systems, including three-dimensional Au nanoparticles
on TiO2 during the CO oxidation [22] and Pt nanoparticles on Al2O3 during oxidizing conditions [23],
revealed that local correlations between the metal nanoparticles may also affect ripening processes in
heterogeneous catalysts. However, a detailed description of the correlated ripening effect was not
pursued for those model catalysts.
In the present study, we address the issue of local correlations in ripening for a Pt/SiO2 catalyst. The
Pt/SiO2 catalyst system is representative for e.g. oxidation catalysts in diesel or lean-burn engine
exhaust treatment. Our study focuses on a catalyst system consisting initially of highly monodisperse Pt
nanoparticles (radius of ca 1.5 nm) with a high, uniform density (ca. 0.03 particles/nm2) on a planar,
amorphous SiO2 support. This is an ideal model system because Pt is expected to sinter via ripening
under oxidizing conditions [24], and because the high density of the Pt nanoparticles, corresponding to a
short particle interspacing of ca. 3 nm, should enhance the effect of local correlations in the nanoparticle
ripening. Specifically, by means of in situ transmission electron microscopy (TEM), the model catalyst
Page 5
4
was monitored during exposure of the sample for 10 mbar of 21 % O2 in N2 and at 650 °C. Time-
resolved TEM images of the model catalyst confirm unambiguously that Pt sintering was mediated by
Ostwald ripening. The first quantitative analysis of the growth and decay of the Pt nanoparticles is
systematically compared to the predictions of the interface-controlled and diffusion-controlled ripening
models including (i) a mean-field assumption and (ii) local correlations for the atom-exchange process,
as described in the framework of [19,20,25]. The analysis shows that Pt nanoparticle ripening is well-
described by both interface- and diffusion-controlled ripening models under the present experimental
conditions and that a kinetic description, including information of the local particle conformation, gives
a better description of the temporal evolution of the individual nanoparticle sizes.
2. Materials and Methods
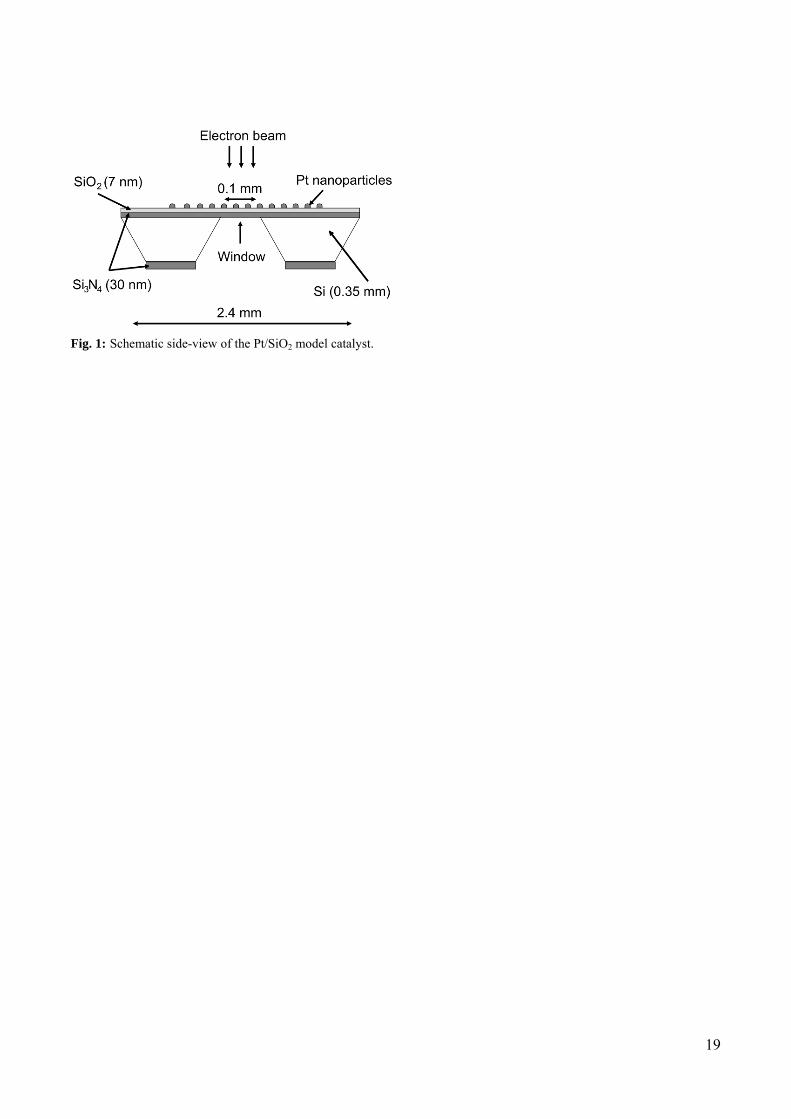
The Pt/SiO2 model catalyst was formed on a Si wafer with a 30 nm thick, amorphous and electron-
transparent Si3N4 window (fig. 1). Following the Si3N4 window preparation [26], a flat and amorphous
SiO2 support layer was formed by oxidizing the Si3N4 surface using a microwave plasma processor
(TePla 300PC) operated at 1 kW with 1 mbar O2 for 40 min. The resulting SiO2 layer had a thickness of
ca. 7 nm, measured by ellipsometry, and a root-mean-square roughness below 0.6 nm over a 100 μm2
area, determined by atomic force microscopy. X-ray photoelectron spectroscopy (XPS) reveals a
characteristic peak at 103.5 eV, corresponding to the reference value for the Si 2p3/2 peak in SiO2 [27].
Diffraction patterns of the Si3N4-supported SiO2 layer, obtained using a Titan 80-300 transmission
electron microscope (FEI Company), demonstrate only broad and diffuse bands of diffracted electrons
consistent with an amorphous structure. Thus, the SiO2 support matched closely a homogeneous
medium. Platinum was deposited onto the SiO2 support using an electron-beam evaporator (AVAC
HVC600) with a base vacuum pressure of 4 • 10-6 mbar. The evaporator was operated with a Pt target of
99.99 % nominal purity (Nordic High Vacuum AB) and with a deposition rate of 0.05 nm/s, to form a Pt
film with a nominal thickness of 0.5 nm. The as-deposited Pt was present as irregularly shaped particles
with a mean radius of ca. 1.5 nm. The irregular, projected shapes transformed into a circular, projected
shape of the Pt particles during the establishment of the ageing conditions, in accordance with [23.
Moreover, XPS reveals a surface carbon contamination on the as-prepared samples of ca. 8 at.-%. The
carbon will most likely react off or desorb prior to the in situ TEM observations 23.
In situ TEM was performed using a CM300 FEG-ST (Philips/FEI Company) transmission electron
microscope equipped with a differentially pumped environmental cell [28]. This microscope permits the
acquisition of TEM images or time-lapsed image series of samples during the exposure to reactive gases
(up to ca. 15 mbar) and elevated temperatures (up to ca. 900 C). Specifically, the microscope was
Page 6
5
operated with a primary electron energy of 300 keV and an ultimate information limit of ca. 0.14 nm
depending on the in situ conditions. For the present experiments, the specimen was imaged during the
exposure to 10 mbar technical air composed of 21 % O2 and 79 % N2 (class 2 from Air Liquide). For
heating, the specimen was mounted with the Pt/oxide side facing the bottom of the Inconel furnace of a
Gatan single-tilt heating holder (model 628). The specimen was heated in the gas environment at a rate
of 30°C/min from room temperature up to 650 °C. The temperature was measured by a PtRh
thermocouple spot welded on the furnace. After the establishment of the isothermal conditions at 650 °C
(corresponding to time t = 0 min.), the temperature was kept constant within ca. 3 °C. The TEM
imaging was performed after drift stabilization of the sample holder.
The in situ TEM imaging was performed using a 1k x 1k Tietz Fastscan F-114 CCD camera, with an
objective aperture (scattering semi-angle of 7.5 mrad) inserted and at a fixed magnification
corresponding to an image pixel size of 0.13 nm. Moreover, the effective information limit was 0.21 nm
as confirmed by a Young fringe test performed with a separate sample in 10 mbar air at 500 °C. The in
situ imaging of the supported Pt nanoparticles was carried out in two different modes: (i) A dynamic
mode was applied in which a time-lapsed image series was acquired at the same area of the specimen.
The image series consist of images, which were acquired at times relative to t = 0 min. at intervals of 30
min. and averaged over six consecutive, aligned TEM frames of 0.5 sec. exposure. The image averaging
was adopted to improve the signal-to-noise ratio in the images and to reduce the effect of residual
thermal drift [23]. (ii) A static mode in which additional TEM images were acquired within 5 min. of
the time corresponding to each of the images of the time-lapsed image series. The static TEM images
were acquired by shifting the beam to a distant area which was prior unexposed to the electron beam.
The static images were also averaged of six consecutive, aligned TEM frames of 0.5 sec. exposure.
Subsequently, the beam was blanked until acquisition of the following image in the image series.
To ensure a negligible effect of the electron-beam on the present observations, the electron-illumination
conditions were examined prior to the actual experiment, following the procedure in [23]. The present
Pt/SiO2 system was imaged during the exposure to 10 mbar technical air at 200 – 600 ºC under varying
electron-beam current densities. The TEM images show that a minor fraction of ca. 1 % of the particles
coalesced with close neighbor particles and that the main effect of the electron-beam was an induced Pt
particle decay. The particle decay rate depended linearly on the beam-current density and was higher
than for the Pt/Al2O3 system in [23]. Consequently, in the present experiments, imaging was performed
using a lower electron beam current density of 0.03 A/cm2, corresponding to a particle radius decay rate
of 0.01 nm/min. For the total exposure time of ca 9 min. for the specific area in the time-lapsed image
Page 7
6
series, the beam-induced mean Pt particle radius decay is thus estimated to ca. 0.09 nm, which is
negligible, compared to the Pt particle sizes and the estimated measuring error.
From the TEM images, Pt particle sizes (radii) were measured using a circular approximation to their
projected area. The projected areas were measured manually or automatically, as described in [23].
Images from the static imaging mode were analyzed automatically for generating particle size
distributions (PSD’s) with a large dataset. For these measurements, the estimated error is 0.5 nm.
Images from the dynamic imaging mode were analyzed manually for examining individual
nanoparticles more precisely. For the manual measurements, the estimated error equals the effective
information limit of 0.21 nm.
3. Results
3.1 Sintering mechanism
To directly visualize structural transformations of the supported Pt nanoparticles, the time-lapsed TEM
images were acquired of a specific specimen area in situ during exposure to the oxidizing gas
environment (Fig. 2, Supplementary Materials). Figure 2 reveals that the Pt particles remained immobile
and that the projected areas of the Pt particles either increased or decreased. Overall, the mean Pt
particle size increased as the shrinking particles eventually disappeared. Hence, the observations
unequivocally demonstrate that the Pt nanoparticles sintered and that the sintering was governed by the
Ostwald ripening process. The finding is in accord with the previous work by Chen and Schmidt, who
used ex situ TEM to monitor a specific area on a similar model catalyst after several ageing treatments
at temperatures from 600 ºC to 685 ºC in 1 atm. air [24]. Also, ripening-mediated sintering of Pt
nanoparticles was reported in experiments with Pt/Al2O3 model catalysts [23,29. In comparison, the
relative importance of the atom and particle migration mechanisms for industrial Pt/SiO2 catalysts has
been debated [30-33]. The debate reflects in part that these studies are based on indirect and/or post-
mortem examinations which may hamper an unambiguous determination of the prevailing sintering
mechanism [10]. Previously, it was proposed that oxygen accelerates sintering of Pt nanoparticles
through the formation of volatile Pt-oxide species 4,24,34-36. It is possible that such species also
mediated sintering in the present in situ TEM experiments.
3.2 Particle size distributions
To complement the dynamic observations with more extended statistical information about the
ensemble of Pt nanoparticles, TEM images in the static mode were acquired at independent and distant
areas of the specimen during exposure to the oxidizing gas environment and analyzed automatically.
Page 8
7
The additional images allow the Pt particle size distribution (PSD) to be extracted as a function of time.
Figure 3 shows that the PSDs have a main peak which gradually shifts towards larger particle size over
time, consistent with the dynamic observations (Fig. 2). The initial mean particle radius was 1.5 nm with
a standard deviation of 0.3 nm and the mean radius was 2.1 nm with a standard deviation of 0.4 nm at
the end of the experiment (t = 330 min.).
The observed time-evolution of the PSD can be compared with that predicted by the mean-field
interface- and diffusion-controlled ripening models, as in other ripening studies [4,10,11,14,16,17,36].
By using eqs. 2 and 3 the time-evolution of the PSD was calculated numerically following the procedure
described by De Smet et al. [36]. Specifically, the PSD in fig. 3a was used as the initial PSD and a
discrete time step of 0.5 min was chosen. The simulations were performed iteratively by systematically
varying the constants α and α’/ln(L/r) in eqs. 2 and 3 respectively, until the mean particle radii of the
calculated and measured PSD matched at the end of the experiment (t = 330 min). The iterative
procedure resulted in α = 0.035 nm-1 · min-1 and α’/ ln(L/r) = 0.067 nm-1 · min-1 for the interface- and
diffusion-controlled ripening models respectively. In the present PSD simulations, the term ln(L/r) is
considered constant for the following reasons: (a) the relation between r and L is not a priori known (b)
using a constant L for all particles sizes, depend on the assumption that L > r at all times, for all
particles, or else dr/dt → ±∞ for r → L (eq. 3). This leads to an inconsistency with the mean-field
assumption, since the size of the largest particles (r ≈ 2.5 nm at t = 0) exceeds the mean distance
between the edges of the neighboring particles (ca. 1.5 nm at t = 0).
Figure 3 includes the simulated PSDs for interface-controlled (solid line) and the diffusion-controlled
(dotted line) ripening. The PSDs, based on the diffusion-controlled ripening model, seem slightly
narrower than the PSDs, based on the interface-controlled model, as suggested in [4,20], but the
difference is not significant. Thus, the comparison in fig. 3 shows that the mean-field models describe
the observed PSDs well. At first glance, an agreement is expected because the mean-field models are
based on the assumption of a homogeneous support which is approached by the planar and amorphous
SiO2 support in the present model catalyst. Moreover, the comparison shows that both the diffusion and
the interface-controlled process may contribute to the ripening in the present experiments. However, the
interface-controlled ripening would have been expected to dominate due to the relatively high metal
loading and thus small diffusion distances between the nanoparticles in the present model catalysts [37].
The lack of a pronounced difference between the models may be due to the short ageing times resulting
only in a slight change of mean radius from 1.5 nm to 2.1 nm in the present experiments (fig. 3).
Page 9
8
3.2. Nanoparticle growth and decay rates
Although, the previous analysis shows that the mean-field models describe the observed PSDs well, it is
noteworthy that the analysis is based on an ensemble of nanoparticles, which may tend to average out
any effect of interactions between the nanoparticles. To address the possibility of such local
dependencies, the dynamic changes of the individual nanoparticles may on the contrary be examined.
Specifically, the growth or decay rate of individual nanoparticles was obtained from the time-lapsed
image series (Fig. 2, Supplementary Information) by manually measuring the change in radius over the
time interval, t = 60 - 120 min, for each individual particle in the image. For normalization, the mean
radius, rmean, was calculated from the particle radii measured at t = 60 min. Fig. 4a shows the measured
dr/dt as a function of the normalized radius, r/rmean. For the majority of the nanoparticles, the growth or
decay rates belong to the first or third quadrant respectively, corresponding to a positive dr/dt for r/rmean
> 1 or a negative dr/dt for r/rmean < 1. Thus, particles larger or smaller than the average particle size
grew or shrank respectively, as predicted by the mean-field ripening models. However, a minor fraction
of the nanoparticles is associated with a rate of radius change in the second and fourth quadrant. As
these rates are not accounted for by the estimated measurement error (indicated by the error bars), it
seems that the mean-field models are not sufficient to fully account for the observed ripening.
To further elaborate on deviations from the mean-field models, the rates in fig. 4a are replotted in fig. 4b
as a function of 1/r2 · (r/rmean – 1). For interface-controlled ripening, eq. 2 predicts a linear relationship
for fig. 4b with a slope corresponding to α, and an offset dr/dt = 0 at r = rmean. Fig. 4b includes the best
linear fit to the rates, which was obtained for α = 0.025 nm-1 · min-1, in agreement with the α-value for
the PSD simulations, and with an offset of 0.0005 nm/min. very close to the origin. Apparently, Fig. 4b
shows an overall linear trend of the data, but the data spread further emphasizes deviations from the
mean-field model. A similar analysis based on the diffusion-controlled ripening model, eq. 3, is
included in fig. 4c. That is, fig. 4c shows the rates in fig. 4a replotted as a function of 1/r3 · (r/rmean – 1).
Assuming the term ln(L/r) in eq. 3 is constant, the best linear fit to the data in fig. 4c has a slope
α’/ln(L/r) = 0.027 nm-1 · min-1, which is in reasonable agreement to α’/ln(L/r) = 0.067 nm-1 · min-1 from
the PSD simulations, and an offset of 0.0002 nm/min. which is close to the origin. The mean-field
model for diffusion-controlled ripening also captures an overall linear trend of the observations, but a
significant data spread beyond the mean-field model expectation is apparent.
3.3 Temporal evolution of the nanoparticle sizes
To further examine the apparent discrepancies between the observed dynamic changes of the individual
Pt nanoparticles and the mean-field models, a selection of Pt nanoparticles was examined through the
Page 10
9
entire time-lapsed image series. Figure 5a shows the selected particles in the TEM frame from fig. 2a.
For each particle, the projected radius, r, of these particles as well as the mean radius for the entire TEM
image, rmean, was measured manually as a function of time. Figure 5b shows that for the dynamic mode
the mean particle radius increased as a function of time and that nanoparticles with r > rmean grew and
nanoparticles with r < rmean decayed. These general trends are overall consistent with the mean-field
models. However, discrepancies are also apparent from a comparison of the observed particle radii of
particles 1-9 with the calculated radii. Specifically, the time-dependency of the particle radii was
calculated using the interface-controlled mean-field model (eq. 2) with the observed radii of particles 1-
9 at t = 0 (fig. 5b) as initial radii and α = 0.03 nm-1 · min-1. Figure 5c shows the calculated time-
dependency of the particle radii and demonstrates that the growth or decay rates are directly related to
the particle size. However, the pattern differs from the observations: Despite comparable initial radii,
the particles 4-6 decayed significantly slower than particles 7-9. Moreover, the observed order by which
particles 4-9 decay also differs from the calculated order.
3.4 Ripening models including local correlations
As discussed above, a possible cause for the discrepancy between the observations and the mean-field
model predictions could be that the particle ripening is not governed by a mean-field concentration of
diffusing species, but by the local concentration of diffusing species provided by the neighboring
nanoparticles due to the close proximity of the Pt nanoparticles in the present model system [17,18]. To
address the influence of the local nanoparticle configuration on the particle ripening, the observations in
fig. 5 will in the following be compared to predictions of ripening models incorporating local
correlations in the atom-exchange process [19,20,25]. Specifically, Bartelt et al. established a local
correlation framework for interface-controlled ripening [19,20] and Zheng and Bigot developed a
framework for diffusion-controlled ripening [25]. Both frameworks are considered because interface- or
diffusion-controlled ripening described the previous observations well.
For both models, the size-evolution of a particle, i, is calculated on the basis of the contribution to the
concentration of atomic species from i’s nearest neighbor particles. Here we adopt the approach used by
Bartelt et al. and define the nearest neighbors by the Voronoi construction [19,20]. In the Voronoi
construction, the support plane is decomposed into cells in such a way that the Voronoi cell of particle i
is obtained as the inner envelope of all line segments of points being equidistantly located between the
centers of i and any other particle [38]. Figure 6 illustrates the Voronoi construction for an area of the
present sample. The nearest neighbors of a particle i are those particles j with a Voronoi cell which have
Page 11
10
a segment in common with the cell of i. Moreover, the Voronoi construction has a time-dependency,
because cells vanish as the immobile, decaying particles eventually disappear (fig. 6).
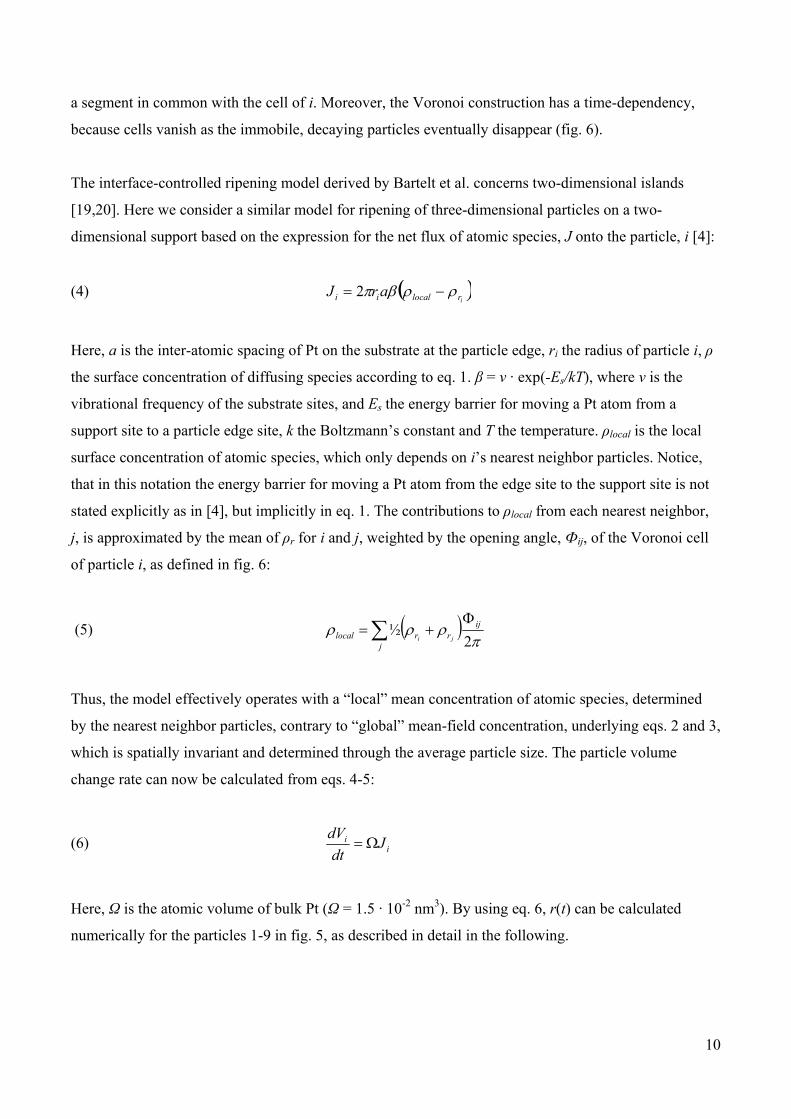
The interface-controlled ripening model derived by Bartelt et al. concerns two-dimensional islands
[19,20]. Here we consider a similar model for ripening of three-dimensional particles on a two-
dimensional support based on the expression for the net flux of atomic species, J onto the particle, i [4]:
(4) irlocalii arJ 2
Here, a is the inter-atomic spacing of Pt on the substrate at the particle edge, ri the radius of particle i, ρ
the surface concentration of diffusing species according to eq. 1. β = v · exp(-Es/kT), where v is the
vibrational frequency of the substrate sites, and Es the energy barrier for moving a Pt atom from a
support site to a particle edge site, k the Boltzmann’s constant and T the temperature. ρlocal is the local
surface concentration of atomic species, which only depends on i’s nearest neighbor particles. Notice,
that in this notation the energy barrier for moving a Pt atom from the edge site to the support site is not
stated explicitly as in [4], but implicitly in eq. 1. The contributions to ρlocal from each nearest neighbor,
j, is approximated by the mean of ρr for i and j, weighted by the opening angle, Фij, of the Voronoi cell
of particle i, as defined in fig. 6:
(5)
j
ijrrlocal ji
2
½
Thus, the model effectively operates with a “local” mean concentration of atomic species, determined
by the nearest neighbor particles, contrary to “global” mean-field concentration, underlying eqs. 2 and 3,
which is spatially invariant and determined through the average particle size. The particle volume
change rate can now be calculated from eqs. 4-5:
(6) ii J
dt
dV
Here, Ω is the atomic volume of bulk Pt (Ω = 1.5 · 10-2 nm3). By using eq. 6, r(t) can be calculated
numerically for the particles 1-9 in fig. 5, as described in detail in the following.
Page 12
11
The diffusion-controlled ripening model developed by Zheng and Bigot is based on the following
expression for the diffusion-limited flux from a particle i to a neighbor particle j [25]:
(7) ji rr
jiijij rrl
DJ
/ln
22
Where D is the surface diffusion constant for diffusion of Pt on SiO2 and lij the distance between the
island centers. Thus, this model operates with a pair-wise atom-exchange from a particle, i, to its
neighbors, j, instead of describing the particle ripening as a result of the interaction with a local mean
concentration of atomic species established by the neighbors. Here we adopt the model by Zheng and
Bigot and include the detailed neighborhood of nanoparticles by weighting the flux contribution by
means of the Voronoi geometry. Thus, the change in volume of a given particle, i can be described as:
(8) 2
ij
jiji
i JJdt
dV
Here, Ω is the atomic volume of Pt and Φij is the opening angle of the Voronoi cell of particle i. As for
eq. 6, eq. 8 allows r(t) to be calculated numerically for the nine particles of fig. 5 under the assumption
of hemispherical shaped particles.
The two ripening models presented here include correlations between neighboring particles with a
weighting scheme based on the Voronoi construction. The Voronoi construction treats the particles as
point sources or sinks for atomic species, so only the distances between the particle centers play a role.
However, for the present model catalyst, the distances between the particles were comparable to their
sizes. As the exchange of Pt is considered to occur at the particle edges, the correlated ripening of
particle i may therefore be expected to depend on both the separation and the size of the neighboring
particles, j. Specifically, for a pair of neighboring particles of radii, ri and rj, and a center separation, lij,
the inter-particle distance may be better represented by the distance between the edges, lij-ri-rj, than lij.
Moreover, for the exchange of atomic species, the particle i effectively interacts with sites at the j‘s
edge; the number of which scales with the j’s circumference 2rj. Based on these considerations, an
alternative weighting scheme is proposed in which the contributions to the correlated ripening of i is
weighted by the ratio of the circumference of the neighbor particle j to the distance between the edges of
the particles i and j. In the following, this scheme is referred to as the “size-dependent” weighting
method and it is included in eqs. 6 and 8 by the transformation:
Page 13
12
(9)
' ''
'2
2
2
j jiij
j
jiij
j
ij
rrlr
rrlr
Where both j and j’ denote the nearest neighbors to a particle, i as defined by the Voronoi construction
and the sum in the denominator normalizes the weights.
Based on eqs. 6, 8 and 9, the time-evolution of the radii of particles 1-9 (fig. 5) can be calculated with
four schemes based on the interface- or diffusion-controlled ripening models including local correlations
based on the Voronoi or size-dependent weighting methods. Specifically, for each scheme, the r(t) is
calculated using the rate for volume change, dVi/dt, an assumption of hemispherically shaped particles,
and with initial radii corresponding to the measured radii at t = 0 (fig. 5b). The calculations progressed
with time-steps of 30 min. corresponding to the time-steps in the time-lapsed image series. The
calculations rely on a determination of the surface energy γ and the parameters β · ρ∞ (interface-
controlled schemes) or D · ρ∞ (diffusion–controlled schemes). Clearly, the models are more sensitive to
changes of γ, due to the exponential dependency (eq. 1), than to the proportional dependency of β · ρ∞ or
D · ρ∞. Therefore, to estimate these parameters for the four schemes, an iterative process was applied in
which r(t) is calculated for varying values of β · ρ∞ or D · ρ∞ for a fixed value of γ. The calculations
were repeated with other values of γ, close to the surface energy of Pt (γ = 2.1 J/m2 [39]), until the best
fit to the data in fig. 5b was obtained. The calculations show that the models are indeed very sensitive to
γ and that the models only come close to the observations in fig. 5b for γ = 0.5-0.6 J/m2. The lower
surface energy of the Pt nanoparticles compared to metallic Pt is expected as the Pt nanoparticles should
be covered with oxygen [40-42]. DFT calculations suggest that the surface O-terminated Pt sites is ca.
0.4-1.2 J/m2 [43]. Moreover, the best fit to the radii of particles 1-9 is obtained with the following
parameters: For interface-controlled ripening model (a) γ = 0.5 J/m2, β · ρ∞ = 2.7 s-1·nm-2 with Voronoi
weighting and (b) γ = 0.6 J/m2, β · ρ∞ = 4.1 s-1·nm-2 with size dependent weighting. For diffusion-
controlled ripening model (c) γ = 0.5 J/m2, D · ρ∞ = 1.4 s-1 with Voronoi weighting and (d) γ = 0.55 J/m2,
D · ρ∞ = 1.6 s-1 size-dependent weighting. Figure 7a-d presents the calculated time-evolution of the
particle radii for particles 1-9 of fig. 5. The model parameters were found to give a good description of
the growth and decay trends of 9 additional particles at a different area of the model catalyst, which
confirms the robustness of the fitting procedure.
Page 14
13
Figure 7 shows that all four schemes for correlated ripening capture the growth of the particles 1-3 as
depicted in fig. 5b. However, the schemes differ in the description of the decay and disappearance of
particles 4-9. For the interface-controlled model weighted by the Voronoi opening angle, fig. 7a shows
that only particles 5 and 7 disappear whereas particles 4, 6, 8 and 9 remain without significant change
during the observation period. The interface-controlled model weighted by the size-dependent weighting
method instead predicts that all particles decay and vanish (fig. 7b), as observed (fig. 5b). In fact, the
calculated decay for the particles 4, 6, 7 and 8 match the observations quantitatively well. However,
some deviation is also apparent: Particle 9 decayed faster in the experiment than according to the
calculations and the decay of particle 5 is better described by the Voronoi weighting scheme. For the
diffusion-controlled model, as calculated using the Voronoi opening angle or the size dependent
weighting method, the trends for the decaying particles in figs. 7c and 7d are similar to the calculated
decay using the interface-controlled model in fig. 7a and 7b respectively.
For the present experimental conditions, the description of the time-evolution of the individual particles
by the interface- and the diffusion-controlled ripening models, including either weighting scheme, are
similar and can thus not be distinguished. However, the local correlations are shown to strongly affect
the particle decay and the decay is strongly dependent on the weighting method. Specifically, the
models, including the proposed size-dependent weighting method, match better most of the observed
particle decays in fig. 5b than the mean-field models, although deviations are apparent for the particles 5
and 9: A close inspection of the TEM images reveals that particle 5 was more distantly situated from
smaller neighbor particles, which may explain why the Voronoi scheme gives a better description, and
that particle 9 had one close and larger neighbor particle, which may explain why the size dependent
weighting method described the decay of this particle better. These considerations may suggest that the
optimal weighting method for the describing local correlation effects depends on the detailed size and
location of neighboring particles. Modeling the particle growth or decay may therefore intimately
depend on the local conformation of the particle ensemble and the lack of a generally applicable
weighting scheme thus seems to complicate the detailed description of local correlation effects in
ripening.
Discussion
The present in situ TEM observations of a Pt/SiO2 model catalyst provide unique mechanistic and
kinetic information on Pt nanoparticle ripening. This information enables a detailed comparison of the
temporal evolution of the nanoparticle sizes with predictions made from different ripening models.
Page 15
14
Although the time-dependency of the nanoparticle sizes (fig. 3-5) overall is well-described by kinetic
models based on the mean-field assumption, deviations are revealed at the individual nanoparticle level.
The deviations were proposed to reflect that the atom-exchange in the growth or decay of the individual
nanoparticles was influenced by the size and location of the neighboring nanoparticles due to the high
particle density in the present model catalyst. Including such local correlations between the neighboring
particles in the kinetic models gives a more satisfactory description of the individual nanoparticle sizes
(figs. 5,7). The effect of such local correlations is expected to also affect ripening in industrial catalysts
with high particle density. Highly dense particle ensembles may result from the synthesis of catalysts
with a high or inhomogeneous metal loading.
Although the kinetic behavior of the individual nanoparticles exposed a deviation from the mean-field
ripening model, an ensemble property such as the particle size distribution is well described in that
framework (fig. 3). Due to the initial uniform particle density and highly monodispersed size of the Pt
nanoparticles, it is possible that the ensemble properties average over a sufficiently large ensemble of
different local configurations of nanoparticles to blur the distinct effect of the local correlations. Thus,
for catalysts containing a more inhomogeneous nanoparticle ensemble, local correlations in ripening
may be speculated to have a more distinct effect on the time-dependency of ensemble properties. The
detailed relationship between the individual nanoparticle behavior and the ensemble properties could in
principle be examined for the present model catalyst by integrating the results of an extended analysis
similar to that presented in fig. 5. Here, we limit the discussion to a basic description of local correlation
effects in interface and diffusion controlled ripening.
The present work focuses on the mean-field assumption underlying the ripening models eqs. 2-3 and has
not addressed other assumptions of the models that could also be of importance for the observations.
Common for the ripening models is the assumption of a homogeneous metal-support adhesion energy
and a hemispherical nanoparticle shape. Although the flat and amorphous SiO2 approaches a
homogeneous support, surface inhomogeneities or defects cannot be excluded and may result in an
inhomogeneous metal adhesion with an impact on the concentration or diffusion of atomic species as
well as on the shape and orientation of the metal nanoparticles [44-48]. These detailed structural
features may also be important for determining the rates of nanoparticle growth or decay in the presence
of a reactive gas environment [4,6,35]. The TEM images generally show a similar contrast level of
particles with similar size as well as a uniform contrast over the support. A detailed interpretation of the
image contrast is, however, complicated by the projection geometry and the convolution of mass-
Page 16
15
thickness and diffraction contrast phenomena. The present TEM images are therefore likely insensitive
to surface inhomogeneities at the atomic-level.
Furthermore, the ripening models were applied irrespective of the nanoparticle sizes in the present
analysis. As Pt nanoparticles with a radius below 0.5 nm contain less than 30 atoms, the geometrical
surface curvature is not a well-defined parameter. In this size-regime, the Gibbs-Thomson relation (eq.
1), being a continuum model, breaks down per definition. Thus, although the size-dependency reflected
by eq. 1 is generally accepted to be valid for larger particles, it is likely insufficient for the smallest
particle sizes [9,13,22,49]. The size-dependent ripening of the smallest particles has been subject to
debate: Datye et al. emphasized that, even within the Gibbs-Thomson model, eqs. 2 and 3 are imprecise
for small particles because the equations rely on a first order Taylor expansion of eq. 1 [9]. The models,
expressed by eqs. 4 and 7, apply eq. 1 directly and should thus better describe the smaller particles. For
a particle sufficiently smaller than r*, Yang et al. suggested that dr/dt is determined by the particle’s
own chemical potential and is thus less dependent on the neighbor particle configuration resulting in an
accelerated decay trend of the smallest particles described by the exponential Gibbs-Thomson relation
(eq. 1) [22]. A faster decay of small particles will also happen if the surface energy increases with
decreasing particle size as suggested by Campbell et al. [13]. For the present study, a part of the smallest
particles revealed in fact an almost linear decay of the particle radius with time, e.g. particle 7 and 9 in
fig. 5b, contrary to the accelerated decay rate predicted by ripening models due to the exponential term
in eq. 1 (fig. 5c and fig. 8a-d). For 50 additional particles with a radius below ca. 1 nm, a similar linear
decay was observed for about half of these particles in the present experiment. It remains to be
addressed if this observed linear particle decay can be accounted for by a size-dependent surface energy
of the nanoparticles. Modeling the surface energy is further complicated by the size-dependent surface
oxidation of the Pt nanoparticles [40-42].
Conclusions
By means of in situ TEM, the sintering of Pt nanoparticles dispersed on a planar SiO2 support was
monitored during the exposure to 10 mbar synthetic air at 650 ºC. A time-lapsed image series shows that
the nanoparticle sintering is dominated by Ostwald ripening and provides detailed information about the
nanoparticle growth or decay. Specifically, the time-dependent particle size distributions, the
nanoparticle growth rates and the time-evolution in nanoparticle sizes are found to be overall well-
described by kinetic models based on a mean-field assumption for the atomic species mediating
diffusion-controlled or interface-controlled ripening. However, for the individual nanoparticles
deviations are observed from the mean-field model predictions. Due to the high particle density, it is
Page 17
16
suggested that the nanoparticle ripening is influenced by the size and location of the neighbor particles.
Ripening models including such local correlations in the so-called Voronoi and size-dependent
weighting schemes are established and shown to describe well the observed time-evolution of individual
nanoparticle sizes.
Acknowledgements
We gratefully acknowledge Bengt Kasemo, Jonas Andersson, Elin Larsson and Laurent Feuz (Chemical
Physics Group) as well as Eva Olsson (Microscopy and Microanalysis Group) at Chalmers University of
Technology for contributing to sample preparations. We thank the MC2-Access project for financial
support. We acknowledge Lone Beck and John Larson (CINF) at Technical University of Denmark for
help with the XPS analysis. We acknowledge the participation of the CTCI Foundation, Taiwan, in the
establishment of the in situ TEM facility at Haldor Topsøe A/S. CINF is funded by The Danish National
Research Foundation.
References
[1] A.T. Bell, Science, 299 (2003) 1688.
[2] Y. Li, G. Somorjai, Nanolett. 10 (2010) 2289.
[3] J.A. Moulijn, A.E.v. Diepen, F. Kapteijn, in: G. Ertl, H. Knözinger, F. Schüth, J.
Weitkamp (Eds.), Handbook of Heterogeneous Catalysis, 2nd Ed., Vol. 4, Wiley-VCH Verlag GmbH &
Co KGaA, Weinheim, 2008, Chap. 7.
[4] P. Wynblatt, N.A. Gjostein, Prog. Solid. State. Ch. 9 (1976) 21.
[5] C.H. Bartholomew, Appl. Catal. A 212 (2001) 17.
[6] S.E. Wanke, P.C. Flynn, Catal. Rev. Sci. Eng. 12 (1975) 93.
[7] B.K. Chakraverty, J. Phys. Chem. Solids. 28 (1967) 2401.
[8] R. Finsy, Langmuir 20 (2004) 2975.
[9] L.R. Houk, S.R. Challa, B. Grayson, P. Fanson, A.K. Datye, Langmuir 25 (2009) 11225.
[10] A.K. Datye, Q. Xu, K.C. Kharas, J.M. McCarty, Catal. Today 111 (2006) 59.
[11] C.G. Grandqvist, R.A. Burhman J. Catal. 42 (1976) 477.
[12] C.T. Campbell, S.C. Parker, D.E. Starr, Science 298 (2002) 811.
Page 18
17
[13] S.E. Wanke, J. Catal 40 (1977) 234.
[14] E. Ruckenstein, D.B. Dadyburjor, J. Catal 48 (1977) 73.
[15] S.D. Coughlan, M.A. Fortes, Scr. Metall. Mater. 28 (1993) 1471.
[16] G.A. Fuentes, E. Salinas-Rodríguez, in: J.J. Spivey, G.W. Roberts, B.H. Davis, (Eds.),
Studies in Surface Science and Catalysis, Vol. 139, Elsevier, Amsterdam, p. 503.
[17] P. W. Voorhees, J. Stat. Phys. 38 (1985) 231.
[18] D.B. Dadyburjor, S.P. Marsh, M.E. Glicksman, J. Catal. 99 (1986) 358.
[19] W. Theis, N.C. Bartelt, R.M. Tromp, Phys. Rev. Lett. 75 (1995) 3328.
[20] N.C. Bartelt, W. Theis, R.M. Tromp, Phys. Rev. B 54 (1996) 11741.
[21] K. Morgenstern, G. Rosenfeld, G. Comsa, Surf. Sci. 441 (1999) 289.
[22] F. Yang, M.S. Chen, D.W. Goodman, J. Phys. Chem. C 113 (2009) 254.
[23] S.B. Simonsen, I. Chorkendorff, S. Dahl, M. Skoglundh, J. Sehested, S. Helveg, J. Am.
Chem. Soc. 132 (2010) 7968.
[24] M. Chen, L.D. Schmidt, J. Catal. 55 (1978) 348.
[25] X. Zheng, B. Bigot, J. Phys. II France 4 (1994) 743.
[26] A.W. Grant, Q.-H. Hu, B. Kasemo, Nanotechnology 15 (2004) 1175.
[27] C.D. Wagner, W.N. Riggs, L.E. Davis, J.F. Moulder, in: G.E. Muilenberg (Ed.),
Handbook of X-ray Photoelectron Spectroscopy, Perkin-Elmer Corporation, Minnesota, 1979. p. 52.
[28] P.L. Hansen, A.K. Datye, S. Helveg, Adv. Catal. 50 (2006) 77.
[29] R. T. K. Baker, C. Thomas, R. B. Thomas, J. Catal. 38 (1975) 510.
[30] T.A. Dorling, R.L. Moss, J. Catal. 5 (1966) 111.
[31] T.A. Dorling, B.W.J. Lynch, R.L. Moss, J. Catal. 20 (1971) 190.
[32] T.J. Lee, Y.G. Kim, J. Catal. 90 (1984) 279.
[33] W. Zou, R.D. Gonzalez, Appl. Catal. A, 102 (1993) 181.
[34] P. Lööf, B. Stenbom, H. Nordén, B. Kasemo, J. Catal. 144 (1993) 60.
Page 19
18
[35] C.H. Bartholemew, in: J.J. Spivey, S.K. Argarwal, (Eds.), Catalysis – A Specialist
Periodical Report, Vol. 10, Athenaeum Press Ltd, Newcastle upon Tyne, 1993, Chap. 2.
[36] Y.D. Smet, L. Deriemaeker, R. Finsy, Langmuir 13 (1997) 6884.
[37] P.C. Flynn, S.E. Wanke, J. Catal. 34 (1974) 400.
[38] G. Voronoi, J. Reine, Angew. Math. 134 (1908) 556.
[39] M. McLean, E.D. Hondros, J. Mater. Sci. 6 (1971) 19.
[40] P. Lööf, B. Kasemo, L. Björnkvist, S. Andersson, A. Frestad, in: A. Crucq (Ed.), Studies
in Surface Science and Catalysis, Vol. 71, Elsevier, Amsterdam, 1991, p. 253.
[41] C.-B. Wang, H.-K. Lin, S.-N. Hsu, T.-H. Huang, H.-Chi. Chiu, J. Mol. Catal. A 188
(2002) 201.
[42] R.W. McCabe, C. Wong, H.S. Woo, J. Catal. 114 (1988) 354.
[43] N. Seriani, W. Pompe, L.C. Ciacchi, J. Phys. Chem. B 110 (2006) 14860.
[44] R. Hardeveld, F. Hartog, Surf. Sci. 15 (1969) 189.
[45] L. Wand, A. Roudgar, M. Eikerling, J. Phys. Chem. C 113 (2009) 17989
[46] Z. Sljivancanin, B. Hammer, Surf. Sci. 515 (2002) 235.
[47] J.H. Kwak, J. Hu, D. Mei, C.-W. Yi, D.H. Kim, C.H.F Peden, L.F. Allard, J. Szanyi,
Science 325 (2009) 1670.
[48] P.L. Hansen, J.B. Wagner, S. Helveg, J. Rostrup-Nielsen, B.S. Clausen, H. Topsøe,
Science 295 (2002) 2053.
[49] S. C. Parker, C. T. Campbell, Phys. Rev. B 75 (2007) 035430.
Page 20
19
Fig. 1: Schematic side-view of the Pt/SiO2 model catalyst.
Page 21
20
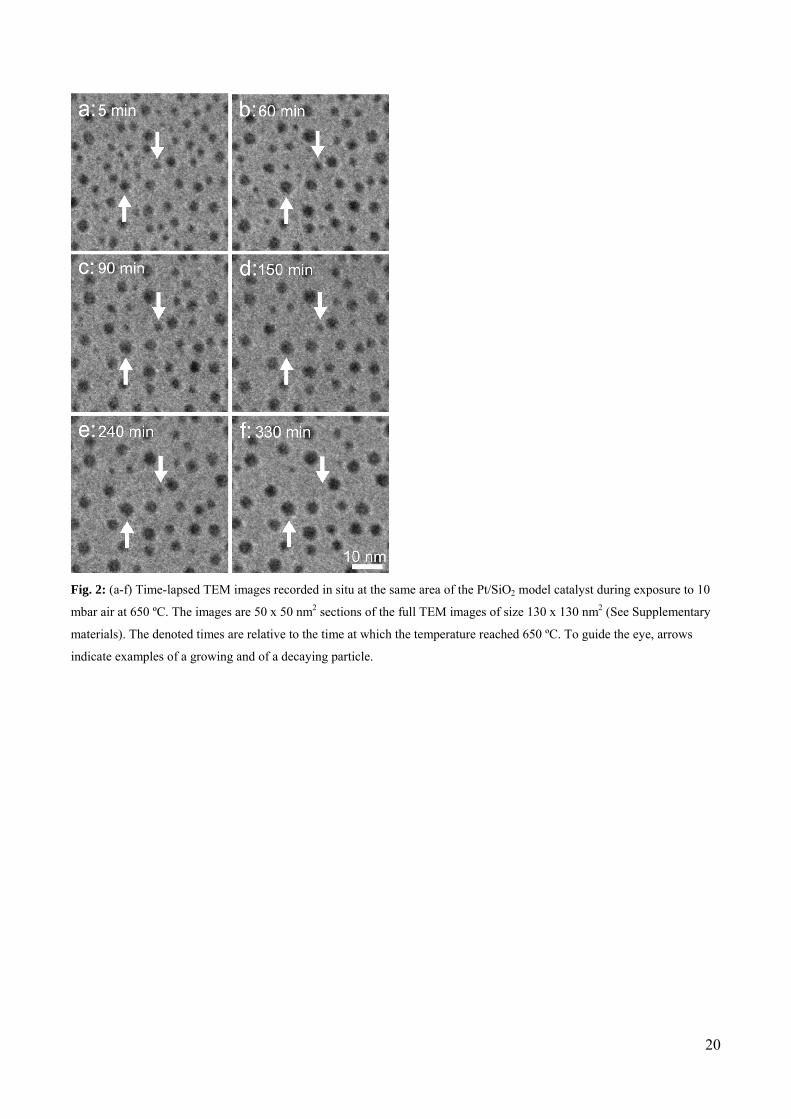
Fig. 2: (a-f) Time-lapsed TEM images recorded in situ at the same area of the Pt/SiO2 model catalyst during exposure to 10
mbar air at 650 ºC. The images are 50 x 50 nm2 sections of the full TEM images of size 130 x 130 nm2 (See Supplementary
materials). The denoted times are relative to the time at which the temperature reached 650 ºC. To guide the eye, arrows
indicate examples of a growing and of a decaying particle.
Page 22
21
Fig. 3: (a-f) Time-lapsed particle size distributions obtained from the static TEM images. The static TEM images were
recorded in situ of different areas of the Pt/SiO2 model catalyst during the exposure to 10 mbar air at 650 ºC. Prior to the
static TEM image acquisition, the areas were unexposed to the electron beam. The number of measured particles included in
each distribution is (a) 1593, (b) 2059, (c) 1101, (d) 1225, (e) 1095 and (f) 1134. The lines indicate histograms simulated
based on the interface-controlled (solid) and diffusion-controlled (dotted) ripening models in eqs. 2 and 3 with (a) as the
initial distribution. The number of particles drops throughout the simulation to (b) 1224, (c) 1079, (d) 891, (e) 699, and (f)
573 for the interface-controlled model and (b) 1065, (c) 926, (d) 725, (e) 566, and (f) 463 for the diffusion-controlled model.
Page 23
22
Fig. 4: The growth and decay rate, dr/dt, for individual Pt nanoparticles presented as a function of (a) normalized radius,
r/rmean, (b) 1/r2(r/rmean – 1), corresponding to eq. 2, and (c) 1/r3(r/rmean – 1), corresponding to eq. 3. The rates are obtained
from the measurement of the radius at t = 60 and 120 min for 185 particles. The error bars indicate the estimated
measurement error. For the best fitted line included in (b) and (c), the R2-value is 0.42 and 0.39 respectively.
Page 24
23
Fig. 5: (a) An outline of the nine selected particles in fig. 2a (white circles). (b) The measured particle radii for the particles
1-9 (a) as a function of time. The error bars indicate the estimated measurement errors. The mean radius for the whole TEM
image (stars) is also presented. (c) Calculated time-dependent particle radii for the particles 1-9. The calculations used the
interface-controlled ripening model based on the mean-field assumption (eq. 2).
Page 25
24
Fig. 6: The Voronoi construction (black lines) superimposed on a close-up on fig. 2. For the Voronoi cell of particle i, the
opening angle Фij (indicated by white lines) with respect to the neighbor particle j is defined by the common line of the two
adjacent cells with respect to the center of mass of particle i. i corresponds to particle no. 5 in fig. 5.
Page 26
25
Fig. 7a-d Calculated particle radii as a function of time. The calculations are based on (a-b) the interface-controlled and (c-d)
the diffusion-controlled ripening model including local correlations in the atom-exchange process. The local correlations are
included by (a,c) the Voronoi and (b,d) the size-dependent weighting methods.