Copyright 2007, Offshore Technology Conference This paper was prepared for presentation at the 2007 Offshore Technology Conference held in Houston, Texas, U.S.A., 30 April–3 May 2007. This paper was selected for presentation by an OTC Program Committee following review of information contained in an abstract submitted by the author(s). Contents of the paper, as presented, have not been reviewed by the Offshore Technology Conference and are subject to correction by the author(s). The material, as presented, does not necessarily reflect any position of the Offshore Technology Conference, its officers, or members. Papers presented at OTC are subject to publication review by Sponsor Society Committees of the Offshore Technology Conference. Electronic reproduction, distribution, or storage of any part of this paper for commercial purposes without the written consent of the Offshore Technology Conference is prohibited. Permission to reproduce in print is restricted to an abstract of not more than 300 words; illustrations may not be copied. The abstract must contain conspicuous acknowledgment of where and by whom the paper was presented. Write Librarian, OTC, P.O. Box 833836, Richardson, TX 75083-3836, U.S.A., fax 01-972-952-9435. Abstract Large diameter pipes manufactured by UOE SAW process utilizing heavy plates are generally used for onshore and offshore applications. The heavy plate is pressed along its edges, formed into a U-shape and then pressed into an O- shape between two semicircular dies. The pipe is welded by SAW process and then expanded to obtain a circular shape. A 2-D finite element model can be used to numerically model the UOE forming process. The model can simulate the effects of process parameters of each forming step on the final geometry and mechanical properties of the pipe. The FEA method is an adequate and reliable tool for the above mentioned studies. By using Finite Element Models, our purpose in this paper is to model the UOE process and analyze its influence on the collapse behavior of the pipes, study how the process and material model affects to collapse behaviour. Introduction The UOE process is characterized by a forming stage, SAW welding and expansion. During the forming stage, the plates are bent into a circular shape by an Edge press, and then deformed with the “U” press, and afterwards with the “O” press. Then the formed plate is welded to produce the pipe. Finally this welded pipe is expanded with a mechanical expander. This manufacturing process introduces plastic deformations and residual stresses in the initial unstrained plate material. A bi-dimensional finite element model is developed to describe the UOE process, following CONFAB specifications (process and tooling), in order to analyze the influence of each stage of the process on the material plastic deformations and residual stresses and the structural behavior of the pipes. The manufacture process of a 12.75” OD 0.5” WT X60 and a 18.0” OD 1.0” WT X60 UOE welded pipes are modeled. A kinematic hardening model is considered in order to incorporate a description of the Bauschinger effect on the final pipe collapse pressures. A sensitivity analysis aimed at the investigation of the effect, on the UOE pipe properties, of the steel strain hardening, is performed using the developed finite element model. Finite element model For the numerical simulation of the UOE process, a finite element model using the Q1-P0 plane strain element, in the ADINA general-purpose code [1-2] was developed. The numerical model was developed using a material and geometrical nonlinear formulation, taking into account large displacements/rotations but small strains [2]. Regarding the material, we use an elasto-plastic bi-linear material model and von Mises associated plasticity with kinematic hardening. The main characteristics of the material model are Young’s modulus: 206010 MPa; Poisson coefficient: 0.3; yield stress: 522.7 MPa, assumed isotropic in the unstrained material; several hardening modulus values are considered for the strain hardening: 0.2 %, 0.3 %, 0.4 %, 0.5 % and 1.0 % of the Young’s modulus for the 12.75” OD pipe and 0.2 %, 0.5 % and 1.0 % of the Young’s modulus for the 18.0” OD pipe. During the collapse tests performed at C-FER Technologies (Edmonton, Alberta, Canada) the tensile / compressive hoop yield stress was determined for fibers located close to the OD and ID respectively. Hence, we use as the yield stress of the unstrained material: ( 4 1 = y σ y + σ ˆ + y + σ ( - y - σ ˆ - y - σ ( ) Where y + σ ˆ is the internal diameter sample, tensil test; y - σ ˆ the internal diameter sample, compressive test; y + σ ( the external diameter sample, tensil test and y - σ ( the external diameter sample, compressive test (Fig.1). The forming tools are modeled as rigid bodies and we use a sliding nodes contact algorithm to simulate the contact between the tools and the plates [1, 2]. Symmetry conditions are considered for the model. The plate is modeled with 4 elements through the thickness and 100 elements along the width, for the 12.75” OD pipe, while for the 18” OD pipe the amount of elements along the length is 155 (Fig. 2). Since the objective of our model is to determine the effect of the forming process on the external collapse pressure of the pipes, we determined the mesh to be used using the simple test reported in Fig.3. OTC 18978 On the influence of the UOE process on collapse and collapse propagation pressure of steel deep-water pipelines under external pressure R. Toscano, J.L. Raffo and L. Mantovano, Center of Industrial Research, Tenaris, M. Fritz and R.C. Silva, TenarisConfab.
Transcript
Copyright 2007, Offshore Technology Conference This paper was prepared for presentation at the 2007 Offshore Technology Conference held in Houston, Texas, U.S.A., 30 April–3 May 2007. This paper was selected for presentation by an OTC Program Committee following review of information contained in an abstract submitted by the author(s). Contents of the paper, as presented, have not been reviewed by the Offshore Technology Conference and are subject to correction by the author(s). The material, as presented, does not necessarily reflect any position of the Offshore Technology Conference, its officers, or members. Papers presented at OTC are subject to publication review by Sponsor Society Committees of the Offshore Technology Conference. Electronic reproduction, distribution, or storage of any part of this paper for commercial purposes without the written consent of the Offshore Technology Conference is prohibited. Permission to reproduce in print is restricted to an abstract of not more than 300 words; illustrations may not be copied. The abstract must contain conspicuous acknowledgment of where and by whom the paper was presented. Write Librarian, OTC, P.O. Box 833836, Richardson, TX 75083-3836, U.S.A., fax 01-972-952-9435. Abstract Large diameter pipes manufactured by UOE SAW process utilizing heavy plates are generally used for onshore and offshore applications. The heavy plate is pressed along its edges, formed into a U-shape and then pressed into an O-shape between two semicircular dies. The pipe is welded by SAW process and then expanded to obtain a circular shape. A 2-D finite element model can be used to numerically model the UOE forming process. The model can simulate the effects of process parameters of each forming step on the final geometry and mechanical properties of the pipe. The FEA method is an adequate and reliable tool for the above mentioned studies. By using Finite Element Models, our purpose in this paper is to model the UOE process and analyze its influence on the collapse behavior of the pipes, study how the process and material model affects to collapse behaviour. Introduction The UOE process is characterized by a forming stage, SAW welding and expansion. During the forming stage, the plates are bent into a circular shape by an Edge press, and then deformed with the “U” press, and afterwards with the “O” press. Then the formed plate is welded to produce the pipe. Finally this welded pipe is expanded with a mechanical expander. This manufacturing process introduces plastic deformations and residual stresses in the initial unstrained plate material. A bi-dimensional finite element model is developed to describe the UOE process, following CONFAB specifications (process and tooling), in order to analyze the influence of each stage of the process on the material plastic deformations and residual stresses and the structural behavior of the pipes. The manufacture process of a 12.75” OD 0.5” WT X60 and a 18.0” OD 1.0” WT X60 UOE welded pipes are modeled. A kinematic hardening model is considered in order to incorporate a description of the Bauschinger effect on the
final pipe collapse pressures. A sensitivity analysis aimed at the investigation of the effect, on the UOE pipe properties, of the steel strain hardening, is performed using the developed finite element model. Finite element model For the numerical simulation of the UOE process, a finite element model using the Q1-P0 plane strain element, in the ADINA general-purpose code [1-2] was developed. The numerical model was developed using a material and geometrical nonlinear formulation, taking into account large displacements/rotations but small strains [2]. Regarding the material, we use an elasto-plastic bi-linear material model and von Mises associated plasticity with kinematic hardening. The main characteristics of the material model are Young’s modulus: 206010 MPa; Poisson coefficient: 0.3; yield stress: 522.7 MPa, assumed isotropic in the unstrained material; several hardening modulus values are considered for the strain hardening: 0.2 %, 0.3 %, 0.4 %, 0.5 % and 1.0 % of the Young’s modulus for the 12.75” OD pipe and 0.2 %, 0.5 % and 1.0 % of the Young’s modulus for the 18.0” OD pipe. During the collapse tests performed at C-FER Technologies (Edmonton, Alberta, Canada) the tensile / compressive hoop yield stress was determined for fibers located close to the OD and ID respectively. Hence, we use as the yield stress of the unstrained material:
(4
1=yσ y+σ̂ + y
+σ( - y−σ̂ - y
−σ( )
Where y+σ̂ is the internal diameter sample, tensil test; y
−σ̂
the internal diameter sample, compressive test; y+σ( the
external diameter sample, tensil test and y−σ( the external
diameter sample, compressive test (Fig.1). The forming tools are modeled as rigid bodies and we use a sliding nodes contact algorithm to simulate the contact between the tools and the plates [1, 2]. Symmetry conditions are considered for the model. The plate is modeled with 4 elements through the thickness and 100 elements along the width, for the 12.75” OD pipe, while for the 18” OD pipe the amount of elements along the length is 155 (Fig. 2). Since the objective of our model is to determine the effect of the forming process on the external collapse pressure of the pipes, we determined the mesh to be used using the simple test reported in Fig.3.
OTC 18978
On the influence of the UOE process on collapse and collapse propagation pressure of steel deep-water pipelines under external pressure R. Toscano, J.L. Raffo and L. Mantovano, Center of Industrial Research, Tenaris, M. Fritz and R.C. Silva, TenarisConfab.
2 OTC 18978
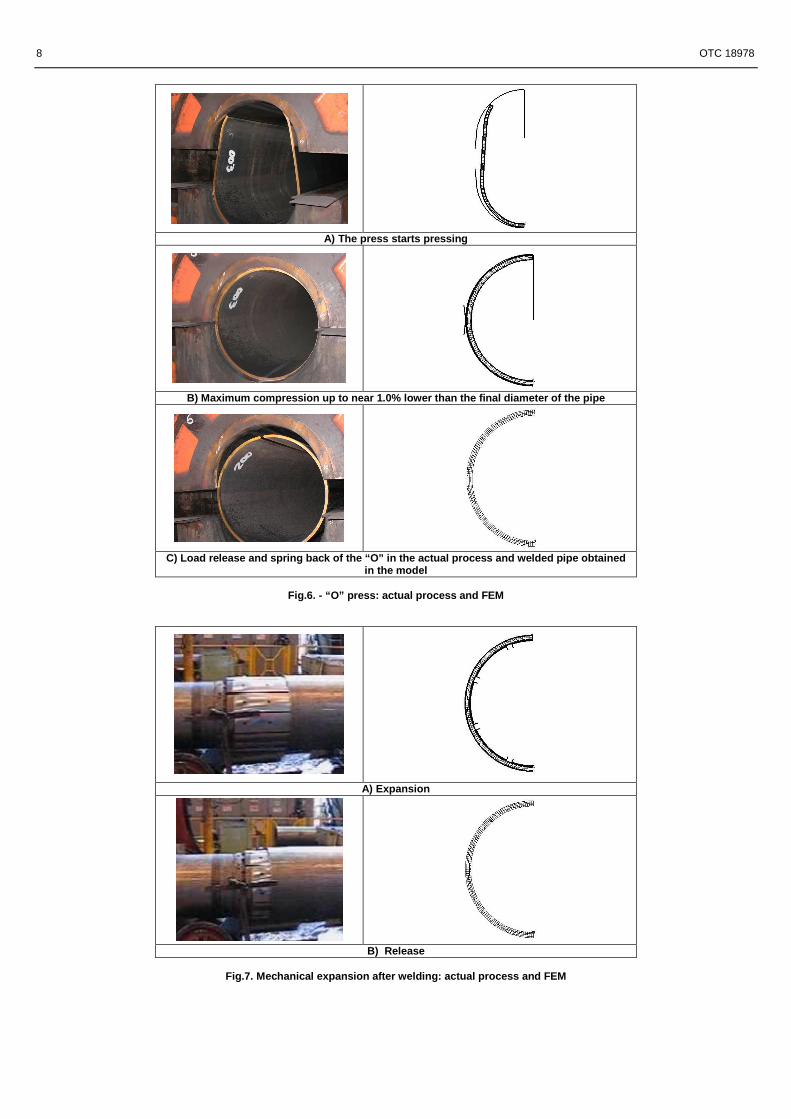
Tooling The first step of the manufacturing process is the Edge press, during this process, the upper tool is fixed and the lower tool is moved in the Z direction. Fig. 4 shows a representation of the real process and the finite element model. Then it continues with the U press process, where the plate is turned into an “U”, see Fig.5. After that, the “O” process which consists in applying a circumferential compression to form an “O” from the “U” obtained in the previous stage. To achieve this, two semi-cylindrical dies press the “U”. Fig.6 compares the actual process with the FE model. At the point of maximum compression, the pipe is fixed at the symmetry axis to simulate the welding process. Finally, a radial expansion is applied in order to obtain the final shape of the pipe. An internal mandrel with eight expansion segments is simulated for the OD 12.75” – WT 0.5” pipe (in the half model: three expansion segments and two halves) and ten expansion segments for the OD 18” – WT 1” pipe, as in the actual process. The segments move in radial direction, and expand so as to obtain the nominal perimeter when the load is released. Fig.7 compares the actual process with the FE model. Numerical results: Geometrical results Fourier Analysis of the Resulting OD Shapes. An analysis of the OD shape obtained with the numerical simulation of the forming process is performed by using Fourier decomposition, as described in [3]. The position of the nodes on the outer surface is used as initial data.
1
( ) cos( ) sin( )N
o j jj
r R a j b jθ θ θ=
= + + ∑
Where Ro is the best-fit circle and the amplitude of mode j is:
22 )()( jjj baA +=
Being aj and bj the coefficients of Fourier decomposition. Fig.8 compares mode 2 amplitude after the “O” press and after the expansion for all cases under analysis, while Fig.9 shows the sum of the amplitudes of the first 28 modes. Fig.10 shows the modal distribution for both pipes, with strain hardening 0.5 %. It is interesting to observe the relative larger amplitude of the modes corresponding to the number of segments in the expander. The ovality is calculated with the formula,
[%][%] minmax
Daverage
DD
Daverage
OOROv
−==
Fig.11 show the ovality after “O” and “E” processes, considering only mode 2 amplitude (OvM2) and considering all the modes (Ovx). The later represents the ovality value measured with ovalimeter. Finally, Fig.12 shows the variation of the external radius along the circumference, after the expansion, for both pipes. For the first pipe the nominal radius values is 161.9 mm while for the second one is 228.6 mm. In the graphs position 0 corresponds to the welded region. The external radius obtained is slightly higher than the nominal one, but the average difference is low enough to consider that
the UOE simulation met the manufacture requirement, that is, the final radius is the nominal radius. Summarizing we can observe, • The ovality is much lower after the expansion than after the O pressing, and it diminishes as the hardening increases. • As it was shown in [4], the value of the second mode is quite different (lower) from the ovality measured with a standard API ovalimeter. The imperfection that controls the value of the collapse pressure is the second mode [3]. • After the “O” press, the variation of the ovality with the hardening is different for both pipes (different OD and different D/t ratio). We can justify this observation by taking into account that for the larger D/t ratios the spring back effect is larger. • The modal distribution changes after expansion not only in amplitude but also in the relative importance among the modes. • The modal distribution is different for both pipes. • It can be observed that the external radius variation diminishes as the hardening modulus increases. Therefore, it can be drawn that the imperfections of the final shape of the pipes (deviation from the perfect circular shape) depend on their dimensions (OD, D/t) as well as on the material properties, such as the strain hardening modulus. Strains. The geometry of the formed pipe and the mean circumferential deformation are calculated taking into account the final node locations. A manufacturing requirement is that the external perimeter at the end of the process must be the nominal perimeter; therefore, after the “O” press, it is necessary to apply an expansion high enough to meet this requirement. To calculate the mean circumferential compression and expansion strains, mid-surface perimeters are considered.
[%]P
POC P
PP −−=ε ; [%]O
OEE P
PP −=ε
Where PP is the initial plate length, PO is the mid-surface perimeter after press O, and PE is the mid-surface perimeter after press E. Fig.13 presents the strains values mentioned above. It can be observed that the average expansion strain is close to 1.0 % for the 12.75” OD pipe while it is close to 1.3 % for the second pipe, 18” OD 1” WT. Both, compression and expansion strains present some variation with the strain hardening modulus, finding the lowest values for the highest hardening value. The thickness variations of the pipe after the UOE process for each hardening are described in Fig.14, where it can be observed that the thickness circumferential distribution is more uniform when the hardening value increases. Meanwhile Fig.15 shows the evolution of the thickness all along the UOE process for 0.5 % and 1.0 % of hardening modulus. It is observed that the thickness circumferential distribution becomes more uniform after the expansion process. Therefore, the compression and expansion strains necessary to meet the process requirements, such as the nominal perimeter and nominal thickness, depend on pipe dimensions and on the material properties, such as the strain hardening.
OTC 18978 3
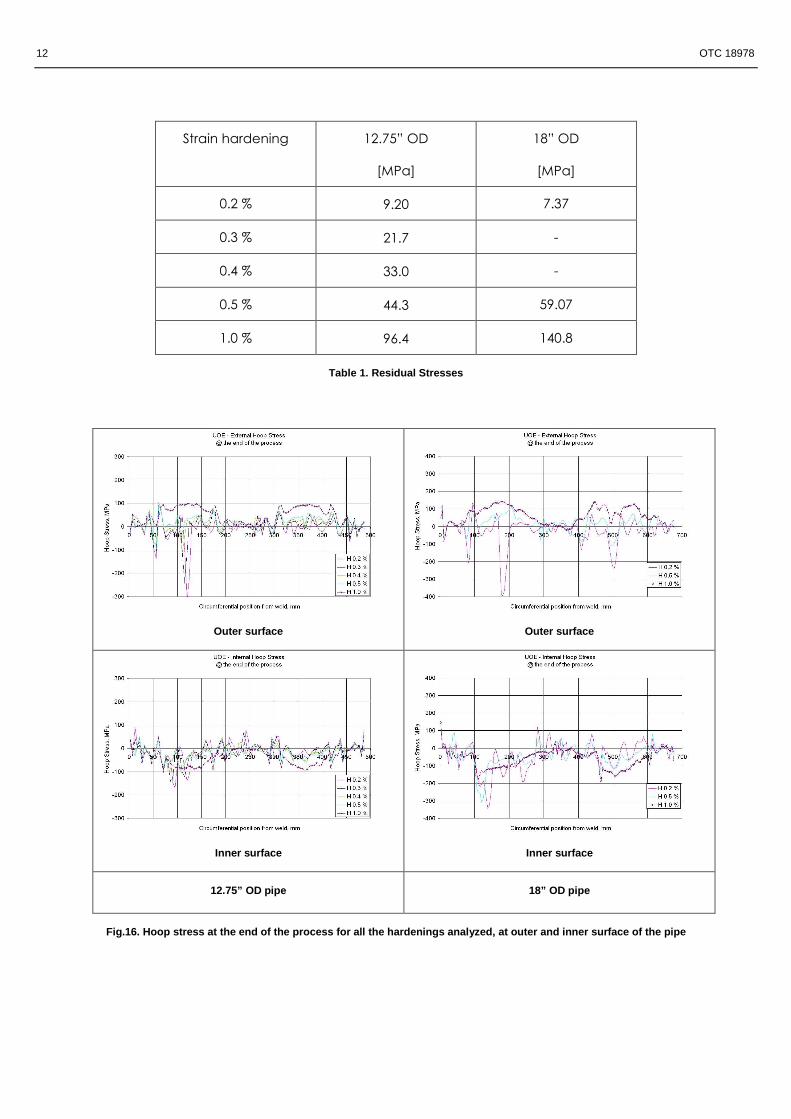
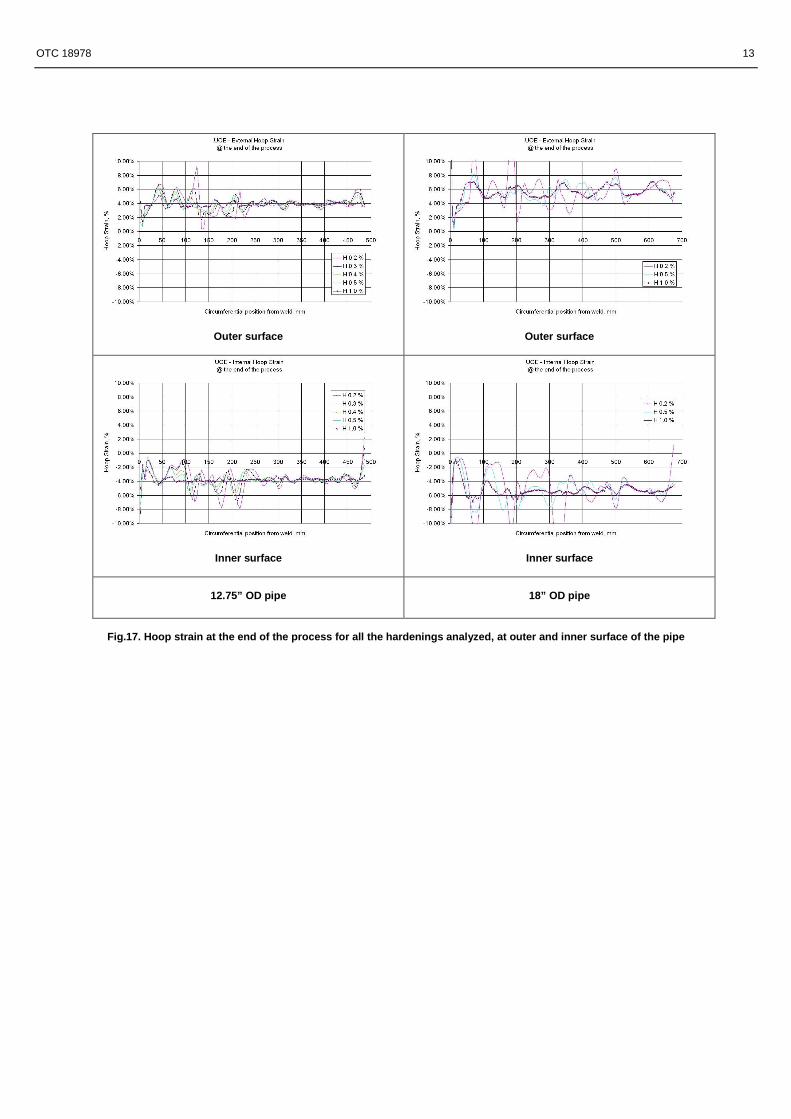
Numerical results: Residual Stresses and Plastic Strains Residual stresses. A slit ring test [3] is simulated after the forming process simulation to determine the residual stresses; the measured openings are post-processed using the formula:
( ) ( )22 1
)(
υ−⋅−⋅⋅−
tD
EtDD
E
Ec
Where, DE is the average outside diameter before the cut (the one obtained after the expansion); Dc is the average outside diameter after the cut; t is the average thickness of the sample; ν, Poisson ratio and E, Young’s modulus. The results of this analysis are listed in Table 1, These results show that the residual stresses increase with both, D/t ratio and strain hardening value. Stress – strain distributions. Hoop stresses and strains after the expansion for each hardening in the outer and inner surface are obtained in Fig.16 and 17. Fig.18 shows the behaviour of the hoop stress and strain during the forming process in the outer and inner surface for 0.5 % hardening modulus. It can be observed that hoop strains are higher for 18” OD 1” in WT pipe than for 12.75” OD 0.5” WT, and the same happens with the hoop stresses, in accordance with the results presented above. Stresses as well as strains present a variation along the circumference (0 corresponds to the welded area); the strain variation is more notorious between 0° and 90° from the weld and is more uniform for higher strain hardening. It is clearly seen in the strains distribution that for the smaller hardening modulus there are important strain localizations during the forming process. Fig.19 to 22 show stress and strain maps for both, the 12.75” OD pipe and the 18” OD pipe, these results correspond to strain hardening 0.5%. The Hoop Stress vs. Hoop strain curve of the entire process was obtained from the 0.5% hardening models. It was performed at 180° from the weld, at the integration points in the inner and outer surface of the plate. The results are in fig.23. The von Mises vs. accumulated effective plastic strain curve of the entire process was obtained from the 0.5% hardening models. It was performed at 90° and 180° from the weld, at the integration points in the inner and outer surface of the plate. The results are in Fig.24. Collapse. After simulating the forming of the pipes we continue with the simulation of their behavior under external pressure, to determine the external collapse pressure. The external collapse pressure values are compared with those obtained from pipes with same geometry but without any residual deformation or residual stresses; that comparison is aimed to evaluate the degradation of the external collapse pressure induced by the UOE process. Table 2 and 3 summarizes the results of this analysis. For the first pipe, with D/t ratio 25.5, it can be observed that UOE process degrades the collapse pressure of UOE pipe only for the two lowest strain hardening values. For the second pipe, with D/t ratio 18, this effect can be observed for the three
cases analyzed, being lowest the effect of the highest hardening value. To understand the above results we should take into account the following points: • For the larger D/t ratio the plasticity has less effect on the collapse pressure; hence the deterioration induced by residual stresses and Bauschinger effect is low and the deterioration is mostly induced by the geometry imperfections derived from the strain localizations during the forming process is lower, which are smaller for larger hardening modulus. • For the lower D/t ratio the residual stresses and Bauschinger effect grow with the hardening, and this tends to deteriorate the external collapse pressure but the OD shape is also smoother when the hardening increases and this is beneficial for the external collapse pressure. Conclusions The FEM simulation of the UOE forming process and of the a posteriori external pressure test provided the following information: Pipes geometry • The resulting ovality is much lower after the expansion than after the “O” pressing, and it diminishes as the hardening increases. • The value of the second mode is quite different (lower) from the ovality measured with a standard API ovalimeter (see Figures 18 and 19). The imperfection that controls the value of the collapse pressure is the second mode. • After the “O” press, the variation of the ovality with the hardening is different for pipes with different OD and different D/t ratio. We can justify this observation by taking into account that for the larger D/t ratios the spring back effect is larger. • In the Fourier decomposition of the external surface, the modal distribution changes after expansion not only in amplitude but also in the relative importance among the modes. • It can be observed that the external radius variation diminishes as the hardening modulus increases. Therefore, it can be drawn that the imperfections of the final shape of the pipes (deviation from the perfect circular shape) depend on their dimensions (OD, D/t) as well as on the material properties, such as the strain hardening modulus. Hence, the compression and expansion strains necessary to meet the process requirements, such as the nominal external diameter and nominal thickness, depend on pipe dimensions and on the material properties, such as the strain hardening. • It is clearly seen in the strains distribution that for the smaller hardening modulus there are important strain localizations during the forming process. • The numerical results show that the residual stresses increase with both, D/t ratio and strain hardening value. Collapse resistance We analyzed two pipes with D/t= 25.5 and 18. For both of them the deterioration in the collapse pressure was less than 5% and 10% respectively; numbers much smaller than the ones usually reported in the literature ([6], [7]). Possibly the
4 OTC 18978
reason lies in the high compression that TenarisConfab uses in the “O” press. For the first pipe, with D/t ratio 25.5, it can be observed that UOE process degrades the collapse pressure of UOE pipe only for the two lowest strain hardening values. For the second pipe, with D/t ratio 18, this effect can be observed for the three cases analyzed, being lowest the effect of the highest hardening value. To try to understand the above results we should take into account the following points: • For the larger D/t ratio the plasticity has less effect on the collapse pressure; hence the deterioration induced by residual stresses and Bauschinger effect is low and the deterioration is mostly induced by the geometry imperfections derived from the strain localizations during the forming process is lower, which are smaller for larger hardening modulus. • For the lower D/t ratio the residual stresses and Bauschinger effect grow with the hardening, and this tends to deteriorate the external collapse pressure but the OD shape is also smoother when the hardening increases and this is beneficial for the external collapse pressure. References 1. The ADINA SYSTEM, Adina R&D, Watertown, MA, U.S.A. 2. K.J. Bathe, Finite Element Procedures, Prentice Hall, NJ, 1996. 3. A.P. Assanelli, R.G. Toscano, D.H. Johnson and E.N. Dvorkin,
“Experimental/ numerical analysis of the collapse behavior of steel pipes”, Engng. Computations, 17, pp.459-486, 2000.
4. A.P. Assanelli and G. López Turconi, “Effect of measurement procedures on estimating geometrical parameters of pipes”, 2001 Offshore Technology Conference, Paper OTC 13051, Houston, Texas, 2001.
5. K.J. Bathe and E.N. Dvorkin, "On the automatic solution of nonlinear finite element equations", Computers & Structures, 17, pp. 871-879, 1983.
6. Kyriakides S, Herynk M D, Yun H. Optimization of UOE pipe manufacturing process for improved collapse performance under external pressure. In: Proceedings of International Pipeline Conference, September 25-29, 2006, Calgary, Alberta, Canada.
7. Fryer M, Tait P, Kyriakides S, Timms C, DeGeer D. The prediction and enhancement of UOE-DSAW collapse resistance for deepwater pipelines. In: Proceedings of the fifth biennial International Pipeline Conference, October 4–8, 2004, Calgary, Alberta, Canada, vol. 3, p. 1961–6.
OTC 18978 5
CFER hoop tests- 12.75” OD 0.5” WT X60
CONFAB-UOE pipe Material model used in the numerical simulations
Fig. 1. Material model
PIPE Width [mm]
Wt [mm]
12.75” OD 0.5” WT X60 488.75 12.7 18” OD 1” WT X60 678.27 25.4
Fig 2. Plate dimensions
12.75” OD pipe
18” OD pipe
Fig. 3. Effect of the finite element discretization on the external collapse pressure of a pipe
Wt
Width
6 OTC 18978
Fig.4. - Edge press: real process and FEM model
Y
Z
Y
Z
OTC 18978 7
A) The pear goes down in the middle of the plate an d pushes it up to contact the roller
B) The pear continues going down up to a distance from the base that equals the
plate thickness
C) The pear and the base go down together, keeping a distance of one plate thickness
between them. So the roller starts moving to the sy mmetry axis
D) The pear moves to its limit and the load is rele ased; then the plate is formed into
an “U” shape
Fig.5. - “U” Press: actual process and FEM
8 OTC 18978
A) The press starts pressing
B) Maximum compression up to near 1.0% lower than t he final diameter of the pipe
C) Load release and spring back of the “O” in the a ctual process and welded pipe obtained in the model
Fig.6. - “O” press: actual process and FEM
A) Expansion
B) Release
Fig.7. Mechanical expansion after welding: actual p rocess and FEM
OTC 18978 9
12.75” OD pipe
18” OD pipe
Fig.8. Mode 2 amplitude for each hardening modulus after “O” pressing and after the expansion
12.75” OD pipe
18” OD pipe
Fig.9. Sum of the amplitudes of the first 28 modes for each hardening after “O” pressing and after the expansion
12.75” OD pipe 18” OD pipe
Fig. 10. Modal analysis. Mode amplitude distributio n after “O” pressing and after the expansion - Stra in Hardening 0.5 %
10 OTC 18978
Ovality after O pressing and after the expansion
Hardening Ovx [%] OvM2 [%]
0.2 % 0.307 0.051
0.3 % 0.200 0.002 0.4 % 0.153 0.027
0.5 % 0.129 0.020
1.0 % 0.085 0.000
Hardening Ovx [%] OvM2 [%]
0.2 % 0.625 0.030
0.5 % 0.319 0.020
1.0 % 0.209 0.001
Ovality, after expansion
12.75” OD pipe 18” OD pipe
Fig. 11. Ovality comparison for each hardening, con sidering mode 2 contribution only (OvM2) and ovalit y measured with ovalimeter (Ovx) After O pressing and after the expansion
12.75” OD pipe
18” OD pipe
Fig.12. External radius variation along circumferen ce for each hardening after expansion
OTC 18978 11
12.75” OD pipe
18” OD pipe
Fig.13. Mean mid-surface circumferential strain ε [%]
12.75” OD pipe
18” OD pipe
Fig.14. Thickness circumferential distribution at t he end of the UOE process for all analyzed hardenin gs
12.75” OD pipe 18” OD pipe
Fig.15. Thickness map during the forming process of the tube - Strain Hardening 0.5 % and 1.0 %
12 OTC 18978
Strain hardening 12.75” OD
[MPa]
18” OD
[MPa]
0.2 % 9.20 7.37
0.3 % 21.7 -
0.4 % 33.0 -
0.5 % 44.3 59.07
1.0 % 96.4 140.8
Table 1. Residual Stresses
Outer surface
Outer surface
Inner surface
Inner surface
12.75” OD pipe
18” OD pipe
Fig.16. Hoop stress at the end of the process for a ll the hardenings analyzed, at outer and inner surf ace of the pipe
OTC 18978 13
Outer surface
Outer surface
Inner surface
Inner surface
12.75” OD pipe
18” OD pipe
Fig.17. Hoop strain at the end of the process for a ll the hardenings analyzed, at outer and inner surf ace of the pipe
14 OTC 18978
Outer surface
Outer surface
Inner surface
Inner surface
Hoop stress
Outer surface
Outer surface
Inner surface
Inner surface
Hoop strain
12.75” OD pipe
18” OD pipe
Fig.18. Hoop results at the end of each process for 0.5 % hardening modulus, at outer and inner surfac e of the pipe
OTC 18978 15
12.75” OD 0.5” WT 18” OD 1” WT
Figure 19. - Effective stress [MPa] of the model af ter each process. Hardening: 0.5 %
16 OTC 18978
12.75” OD 0.5” WT 18” OD 1” WT
Figure 20. - Accumulated effective plastic strains [%] of the model after each process
Hardening: 0.5 %
OTC 18978 17
12.75” OD 0.5” WT 18” OD 1” WT
Figure 21. - Hoop stress [MPa] of the model after e ach process. Hardening: 0.5 %
18 OTC 18978
12.75” OD 0.5” WT 18” OD 1” WT
Figure 22. - Hoop strain [MPa] of the model after e ach process. Hardening: 0.5 %
OTC 18978 19
Outer surface
Outer surface
Inner surface
Inner surface
12.75” OD pipe
18” OD pipe
Fig.23. Hoop stress-strain curve during the process at 180° from the weld in the outer and inner surfa ce of the tube Strain Hardening 0.5 %
20 OTC 18978
Outer surface
Outer surface
Inner surface
Inner surface
At 90° from weld
Outer surface
Outer surface
Inner surface
Inner surface
At 180° from weld
12.75” OD pipe
18” OD pipe
Fig.24. Hoop results at the end of each process for 0.5 % hardening modulus, at outer and inner surfac e of the pipe