OTC-28885-MS Risk Based, Statistical Approach to Assessment of Corrosion Anomalies in Pipelines Derek Scales and Rex Hubbard, Atteris Pty Ltd; Chris Merrick, PTTEP Australasia Copyright 2018, Offshore Technology Conference This paper was prepared for presentation at the Offshore Technology Conference held in Houston, Texas, USA, 30 April–3 May 2018. This paper was selected for presentation by an OTC program committee following review of information contained in an abstract submitted by the author(s). Contents of the paper have not been reviewed by the Offshore Technology Conference and are subject to correction by the author(s). The material does not necessarily reflect any position of the Offshore Technology Conference, its officers, or members. Electronic reproduction, distribution, or storage of any part of this paper without the written consent of the Offshore Technology Conference is prohibited. Permission to reproduce in print is restricted to an abstract of not more than 300 words; illustrations may not be copied. The abstract must contain conspicuous acknowledgment of OTC copyright. Abstract In-line inspection of subsea pipelines is a common method to detect anomalies within carbon steel pipelines however the cost of an intelligent pigging campaign is sometimes not economically viable, particularly for situations requiring subsea to subsea pigging. DNVGL-ST-F101 is a risk based offshore standard which requires that the probability of failure be lower than pre-determined levels depending on the safety class of the Pipeline system. As a consequence a risk based assessment methodology has been developed and utilized to ensure code compliance. This paper presents a methodology and a supporting case study for the use of an externally mounted inspection tool to undertake spot checks of the pipe wall to determine an overall statistical corrosion model of the pipeline in lieu of more costly in-line deterministic inspection methods. This inspection was required to support a pipeline's commissioning process after wet parking of the pipeline for an extended period. The methodology presented utilizes the results from a spot inspection tool that can report wall thickness for discrete elements of the pipe wall (for example 1 mm 2 or 1 cm 2 ) with each scan encompassing a short length of the pipeline (for example a 1 m length) resulting in a large number of data points. The data points are samples from the overall pipe population and as such can be used to infer the overall pipe wall element population's statistical parameters. To provide confidence that the data points are representative of the overall population it is important to understand the credible corrosion mechanisms within the pipeline and ensure that sampling locations are chosen accordingly to capture areas in which high corrosion may occur. Sub-populations may also be identified based on key locations (e.g. girth welds) and assessed separately to provide a refined assessment of the overall corrosion mechanisms. Statistical boot-strapping is performed on the data points to provide confidence bands around the sampled data with the most conservative extreme probability curve being utilized in the final assessment. The case study provides details on potential pipe wall sub-populations and the corresponding corrosion mechanisms for a wet parked pipeline within PTTEP's Montara field offshore north-western Australia based on data from a spot inspection campaign that was undertaken. The Montara Production Flowline 1 was wet parked for operational reasons during commissioning of the field in 2012 and remained isolated while corrective work was undertaken on Oil Separation train A. The purpose of the analytical work detailed within this paper was to facilitate a fitness-for-purpose assessment of the flowline, integrating the inspection
Transcript
OTC-28885-MS
Risk Based, Statistical Approach to Assessment of Corrosion Anomalies inPipelines
Derek Scales and Rex Hubbard, Atteris Pty Ltd; Chris Merrick, PTTEP Australasia
Copyright 2018, Offshore Technology Conference
This paper was prepared for presentation at the Offshore Technology Conference held in Houston, Texas, USA, 30 April–3 May 2018.
This paper was selected for presentation by an OTC program committee following review of information contained in an abstract submitted by the author(s). Contents ofthe paper have not been reviewed by the Offshore Technology Conference and are subject to correction by the author(s). The material does not necessarily reflect anyposition of the Offshore Technology Conference, its officers, or members. Electronic reproduction, distribution, or storage of any part of this paper without the writtenconsent of the Offshore Technology Conference is prohibited. Permission to reproduce in print is restricted to an abstract of not more than 300 words; illustrations maynot be copied. The abstract must contain conspicuous acknowledgment of OTC copyright.
AbstractIn-line inspection of subsea pipelines is a common method to detect anomalies within carbon steel pipelineshowever the cost of an intelligent pigging campaign is sometimes not economically viable, particularly forsituations requiring subsea to subsea pigging. DNVGL-ST-F101 is a risk based offshore standard whichrequires that the probability of failure be lower than pre-determined levels depending on the safety classof the Pipeline system. As a consequence a risk based assessment methodology has been developed andutilized to ensure code compliance.
This paper presents a methodology and a supporting case study for the use of an externally mountedinspection tool to undertake spot checks of the pipe wall to determine an overall statistical corrosion modelof the pipeline in lieu of more costly in-line deterministic inspection methods. This inspection was requiredto support a pipeline's commissioning process after wet parking of the pipeline for an extended period.
The methodology presented utilizes the results from a spot inspection tool that can report wall thicknessfor discrete elements of the pipe wall (for example 1 mm2 or 1 cm2) with each scan encompassing a shortlength of the pipeline (for example a 1 m length) resulting in a large number of data points. The data pointsare samples from the overall pipe population and as such can be used to infer the overall pipe wall elementpopulation's statistical parameters. To provide confidence that the data points are representative of theoverall population it is important to understand the credible corrosion mechanisms within the pipeline andensure that sampling locations are chosen accordingly to capture areas in which high corrosion may occur.Sub-populations may also be identified based on key locations (e.g. girth welds) and assessed separately toprovide a refined assessment of the overall corrosion mechanisms. Statistical boot-strapping is performedon the data points to provide confidence bands around the sampled data with the most conservative extremeprobability curve being utilized in the final assessment.
The case study provides details on potential pipe wall sub-populations and the corresponding corrosionmechanisms for a wet parked pipeline within PTTEP's Montara field offshore north-western Australia basedon data from a spot inspection campaign that was undertaken. The Montara Production Flowline 1 waswet parked for operational reasons during commissioning of the field in 2012 and remained isolated whilecorrective work was undertaken on Oil Separation train A. The purpose of the analytical work detailedwithin this paper was to facilitate a fitness-for-purpose assessment of the flowline, integrating the inspection
2 OTC-28885-MS
results gained from externally applied ART provided by HalfWave, the external inspection history andthe as-built commissioning records from 2012. By returning the flowline to service, a newly drilled andcompleted platform well was able to be flowed through a quarantined separation train without the clean-upfluids interfering with a working production train. Commissioning of this flowline restored the flexibilityfor production operations contemplated in the facility design and will improve the availability of productiongoing forward.
Application of the statistical assessment methodology to the pipeline inspection data detailed within thecase study resulted in a cost reduction of up to AU$15M compared to in-line inspection.
IntroductionIn-line inspection of subsea pipelines is a common method to detect anomalies within carbon steel pipelineshowever the cost of an intelligent pigging campaign is sometimes not economically viable, particularly forsituations requiring an installation vessel to facilitate subsea launch and/or receipt. Alternative inspectiontechnologies combined with risk-based engineering assessments may present a more attractive and viableopportunity to meet inspection requirements.
DNVGL-ST-F101 (Ref. 1) is a risk based offshore pipeline standard which requires that the probabilityof failure be lower than pre-determined levels depending on the safety class of the pipeline, therefore a riskbased assessment methodology is an integral component of code compliance. Through use of a suitableinspection tool a probabilistic assessment of the corrosion anomalies within an entire carbon steel pipelinecan be undertaken using minimal inspection data obtained at discrete points whilst demonstrating reliabilityrequirements defined by code. The likelihood of a corrosion anomaly exceeding the acceptance criteria canbe estimated with high confidence.
This paper will present a methodology and a supporting case study for use of an externally mountedinspection tool to undertake spot checks of a pipeline to determine its probable corrosion status after wetparking for an extended period.
Pipeline CorrosionSubsea oil and gas pipelines are subject to a number of internal and external corrosion mechanisms.Typically external corrosion is mitigated through the use of suitable external coatings as well as sacrificialanode cathodic protection systems. The condition of these systems can be monitored through external ROVinspection methods combined with routine general visual inspections.
Typically internal corrosion is mitigated through material selection or managed through inclusion of acorrosion allowance within design, often in combination with the use of corrosion inhibitors. Monitoring canbe performed on corrosion inhibitor availability and fluid samples which are then subsequently supportedthrough the periodic measurement of pipeline wall thickness to verify the pipeline's corrosion behavior.Wall thickness measurement of a subsea pipeline and assessment of the risk of excessive wall thickness lossare the focus areas of this paper.
Internal Corrosion MechanismsInternal corrosion in pipelines is influenced by a number of factors including temperature, CO2 and H2Scontent, water chemistry, microbiological factors, fluid velocity, oil or water wetting (including watercondensation) and surface condition of the steel.
Due to the large range of corrosion mechanisms it is important to engage suitable corrosion engineeringexpertise to define the expected corrosion behaviors for different locations and production scenarios in thepipeline system. Furthermore the operating parameters and type of corrosion may impact the position within
OTC-28885-MS 3
the pipeline in which corrosion is located (top of line condensation corrosion, bottom of line corrosion, girthweld heat affected zone corrosion, etc.).
Traditional Inspection MethodologyAssessment of internal corrosion and other internal pipeline anomalies for subsea pipelines is typicallyundertaken through inline inspection (ILI) campaigns utilizing intelligent pigs. An ILI campaign can be anexpensive exercise, particularly for situations requiring an installation vessel to facilitate subsea launch and/or receipt, as the campaign will usually comprise of a number of pigging stages including:
1. Cleaning pig runs – Depending on pipeline operating contents this could be a single run or multipleruns to ensure that any debris has been removed from the pipeline
2. Gauge pig run (if required) – A gauge pig will confirm whether the internal diameter of the pipelineis acceptable for the intelligent pig. This can be combined with a cleaning pig run
3. Intelligent pig run – Data collection from multiple modules within the same pig.
As such it is necessary to undertake a number of pigging operations prior to data collection. Figure 1presents an overview of the types of pigs that are used as part of a typical ILI campaign.
Figure 1—Various Pigs a) Foam Pig (Ref. 6) b) Gauge Pig (Ref. 7) c) Intelligent Pig (Ref. 8)
Output from the intelligent pig typically provides a large amount of data and information on the pipelineinternal condition including details on anomalies associated with:
1. Internal corrosion2. External corrosion3. Weld and other feature (inline tees, bends etc.) locations4. Manufacturing anomalies5. Other anomalies (dents, gouges etc.).
If multiple ILI runs are performed over time it is possible to relate the data sets and determine growthrates for corrosion anomalies (Figure 2), although once inspection tool tolerances are considered there canbe a potentially large uncertainty in the estimated corrosion anomaly growth rate.
4 OTC-28885-MS
Figure 2—Corrosion Anomaly Matching and Growth Prediction
For systems which have been designed with pigging operations in mind and with ease of access topig launchers and receivers then ILI campaigns can add a considerable amount of value and assuranceto operations for a moderate cost. However, there are a number of pipeline system configurations whichescalate the cost of ILI rendering it an unfavorable option:
1. Pipeline requires subsea launching2. Pipeline requires subsea receiver3. ILI is not possible due to design limitations:
a. No ability to launch or receive pigs at pipeline end pointsb. Bend radii within the pipeline system are too tight – a typical lower limit bend radius for ILI
pigs is 3D.
For systems which exhibit either categories 1 or 2 (or both) it is still possible to undertake an ILI campaignhowever the cost of the ILI campaign will increase significantly due to the requirement to utilize an offshoresupport vessel to either load or retrieve the pigs. If multiple cleaning runs are required then this can increasethe campaign length with a significant OPEX impact. Furthermore for long pipelines there may be a delaybetween launching the cleaning and gauging pigs and receiving them during which time the offshore supportvessel may have to wait in the field incurring further costs for the operator.
For pipeline systems in category 3 above ILI is not practical and external non-intrusive inspectionmethodologies are required. There are a number of suitable methodologies, however there are a number oflimitations associated with them including:
1. Local (spot) inspection tools are typically clamped to the external surface of the pipeline to takemeasurements. Extending this method to the entire pipeline length would impractical
2. External surface preparation is important to ensure that good quality data is achieved from the scan.Removal of hard marine growth whilst maintaining the integrity of coatings is a common issue (inparticular wrap based field joint coatings).
3. Only certain types of external coatings allow external inspection.4. Partially (or fully) buried pipelines require excavation to allow inspection of the full circumference.
OTC-28885-MS 5
These technologies are typically utilized to augment data from an ILI campaign when particular featuresrequire a higher level of detail within sizing of the feature of interest.
For cases in which an ILI campaign is not practical then spot inspection data can build up knowledgeon the corrosion behavior within the pipeline. When combined with a statistical corrosion assessmentmethodology the engineer can determine the pipeline's overall corrosion condition with a high level ofconfidence. Furthermore, repeated applications of the assessment methodology will provide guidance onthe corrosion growth rate for the pipeline population.
Statistical Corrosion Risk Assessment MethodologyThe statistical corrosion risk assessment utilizes a limited number of spot inspection data and determinesan overall corrosion risk in lieu of an ILI campaign. By ensuring that all of the corrosion mechanisms’sub-populations are accounted for within the assessment the overall pipeline can be assessed against thereliability requirements specified within DNVGL-ST-F101 without the requirement to undertake a full ILIcampaign.
A statistical corrosion risk assessment methodology is outlined in Figure 3.
Potential Corrosion MechanismsIt is important to determine the potential corrosion mechanisms that could have occurred within the pipelineunder consideration as this will affect selection of the initial set of inspection locations and how thesupplementary inspection locations will be defined (supplementary inspection locations may be requireddepending on the results from the initial set of inspections).
It is important to engage the relevant corrosion engineering expertise to ensure that all corrosionmechanisms are considered. This process should include engagement with the Production team to determinerelevant inspection results that have been previously acquired and analyzed, and to gather operating datafor the pipeline including pressure, temperature and fluid composition. This information should then beassessed by a corrosion engineer such that the most likely corrosion mechanisms are determined and anypotential corrosion hotspots within the system are highlighted.
6 OTC-28885-MS
The predicted at-risk corrosion mechanisms and hotspot locations will influence both the inspectionlocation selection and the sub-populations utilized within the final statistical assessment. Both of these arediscussed in more detail in the following Sections.
Define Inspection LocationsInspection locations along the pipeline are then defined based on the identified possible corrosionmechanisms such that a representative sample of the corrosion populations will be obtained. Care shouldbe taken in the distribution of inspection locations to ensure sufficient inspection locations for the statisticalassessment to be valid.
It is beneficial if the inspection campaign is split into an initial set of inspection locations and optionalsupplementary inspection locations. Assessment of the initial set of inspection data should occur as it is beingproduced by the inspection contractor. If there is insufficient confidence in the pipeline's condition then anever-increasing number of supplementary inspections may be required until there is sufficient confidencein the pipeline's condition at which point the inspection campaign can be stopped.
Undertake InspectionSpot inspections are undertaken by the inspection contractor in accordance with the base inspection scope.After each inspection has been undertaken it is necessary for QA/QC checks to be undertaken on the datasetsbefore they are released by the inspection contractor for use within the statistical assessment. It is importantthat data is relayed promptly to allow any supplementary inspection scopes to be determined to ensureminimal downtime whilst offshore.
Split Datasets into Sub-PopulationsSub-populations should be defined based on the predicted corrosion mechanisms and the overall inspectiondataset split accordingly. Typical sub-populations are:
• TOL (10 – 2 o'clock position)
• BOL (4 – 8 o'clock position)
• Girth weld and heat affected zone
• Location along the pipeline (Upstream end / downstream end / adjacent inline tees, etc.).
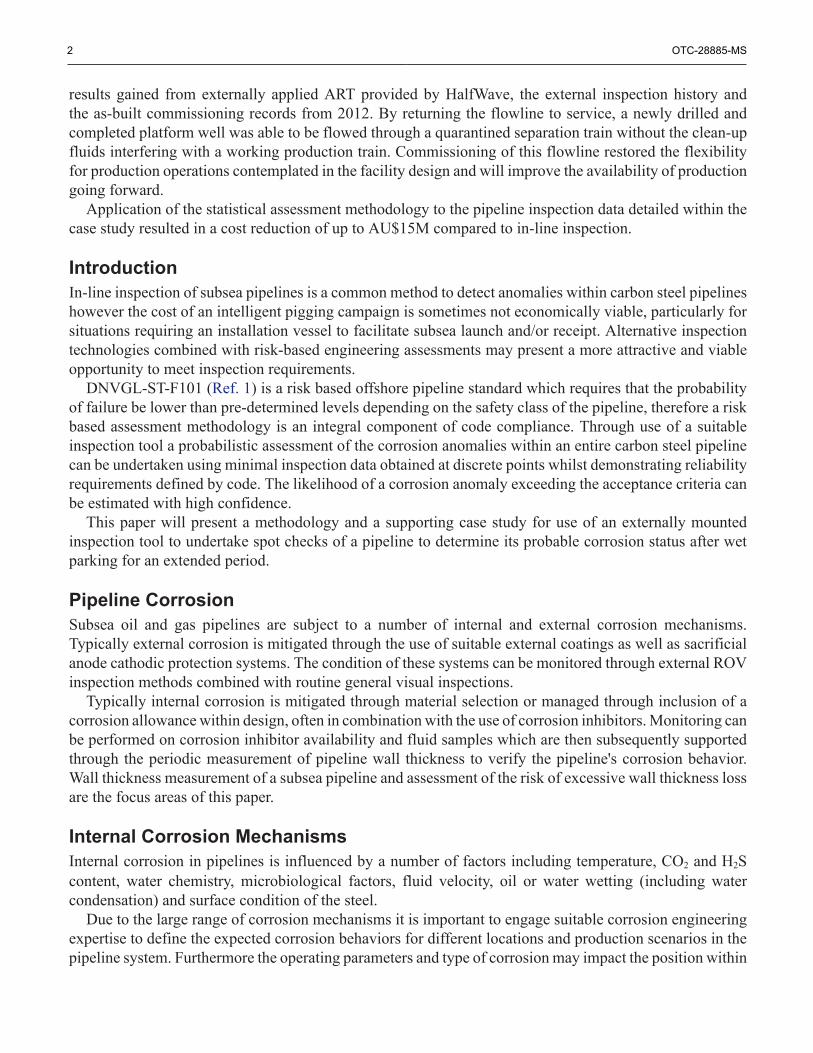
Some of these sub-populations will overlap (for instance TOL and location long the pipeline, Figure 4)and as such the total number of combinations of sub-population can increase dramatically. It is importantto pre-determine the combinations such that automated software tools can be utilized to minimize dataprocessing prior to the statistical assessment being undertaken. If sub-populations are not identifiedsufficiently then this will normally present itself through a double peak within the dataset's histogram.
OTC-28885-MS 7
Figure 4—Example of Sub-Population Regions within an Inspection Dataset
For example consider the following simplified scenario (utilizing example data with no measurementnoise) of a corrosion dataset for which:
• The main pipeline has a low corrosion rate and
• The girth weld heat affected zone has a high corrosion rate.
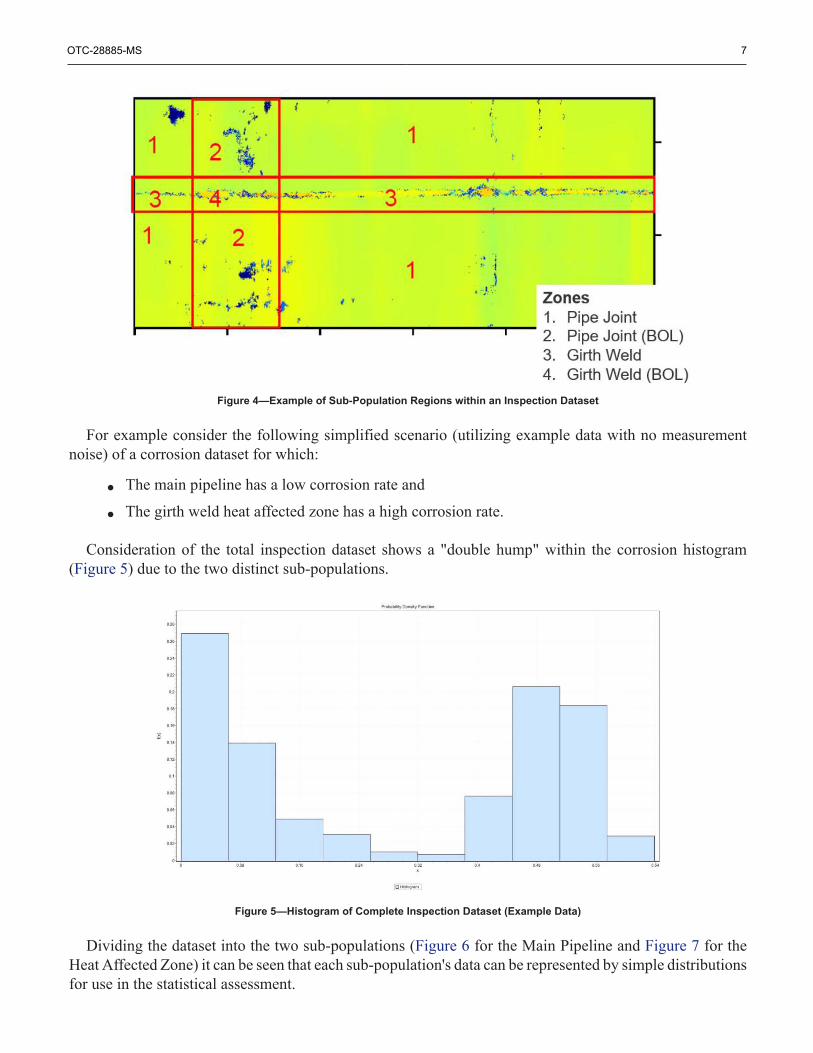
Consideration of the total inspection dataset shows a "double hump" within the corrosion histogram(Figure 5) due to the two distinct sub-populations.
Figure 5—Histogram of Complete Inspection Dataset (Example Data)
Dividing the dataset into the two sub-populations (Figure 6 for the Main Pipeline and Figure 7 for theHeat Affected Zone) it can be seen that each sub-population's data can be represented by simple distributionsfor use in the statistical assessment.
8 OTC-28885-MS
Figure 6—Histogram of Main Pipeline Sub-Population (Example Data)
Figure 7—Histogram of Heat Affected Zone Sub-Population (Example Data)
Once each sub-population has been defined a histogram of the dataset is produced to confirm theacceptability of the dataset with particular attention to secondary or tertiary corrosion hotspots within thesub-population (indicating that further sub-populations may exist within the dataset).
Define Corrosion Distribution for Sub-PopulationFor each sub-population it is necessary to fit a probability distribution to the dataset and to determine thegoodness of fit for each distribution (Figure 8). Typical distributions could include:
• Standard Distribution
• Beta Distribution
• Weibull Distribution
OTC-28885-MS 9
• Log Normal Distribution
• Gamma distribution.
Figure 8—Histogram of Heat Affected Zone Sub-Population (Example Data)
To determine the goodness of fit the following measures are computed for each sub-population to ensurethe most representative fit is utilized within the overall assessment:
• Kolmogorov-Smirnov statistic
• Cramer-von Mises statistic
• Anderson-Darling statistic.
Undertake Bootstrapping to Provide Confidence LimitsThe aim of inferential statistics is to determine the characteristic factors associated with the entire pipelinepopulation of corrosion anomalies. One way would be to merely sample the entire pipeline (as is the casewith an ILI campaign – ignoring any data loss within the intelligent pig run) however, as noted previously, forsome pipelines this is not possible. Hence data has been sampled at points along the pipeline and distributionsthat represent the entire population produced. As the entire pipeline population was not sampled there may besome variation from the entire population distribution to the measured dataset's distributions. To determineconfidence intervals on the fitted distributions bootstrapping can be utilized.
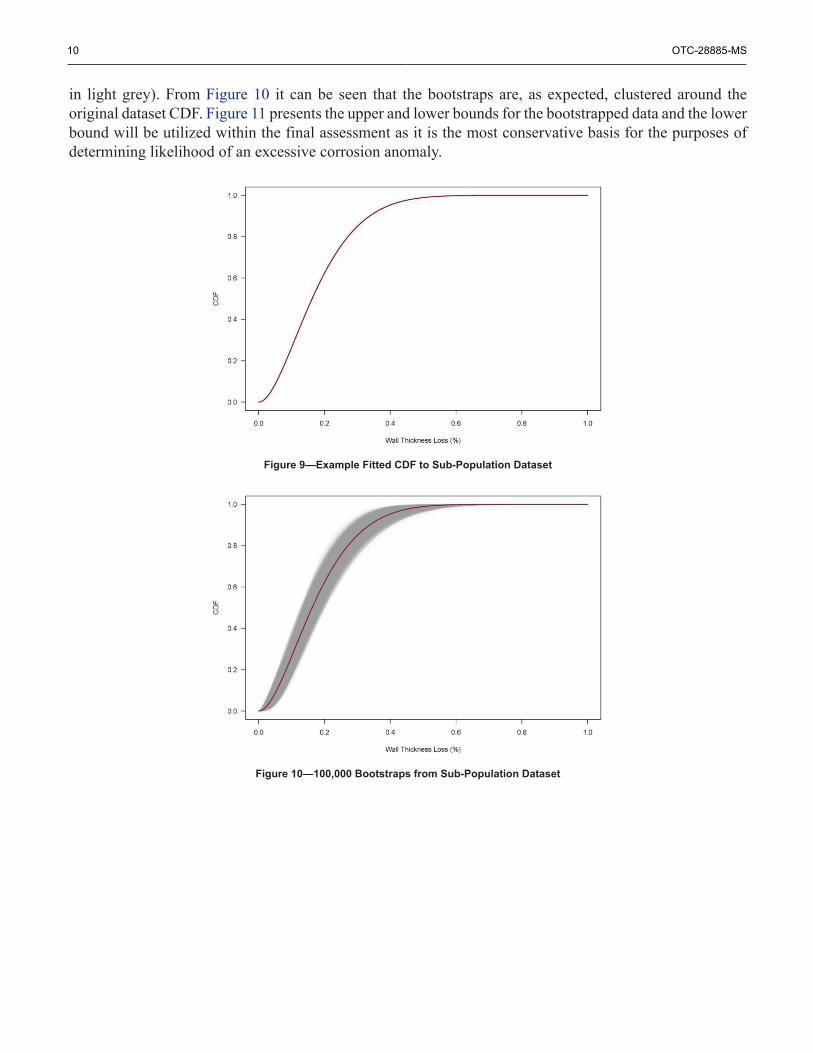
Bootstrapping is a statistical technique that falls under the broader level topic of resampling (Ref. 5).Bootstrapping utilizes the original sampled dataset (for example the CDF presented in Figure 9) fromwhich a bootstrap sub-sample is taken with replacement. Sampling with replacement requires that aftereach individual data point is sampled it is returned to the population allowing it to be selected multipletimes, this results in the bootstrap sub-population elements being independent. As a consequence it is highlyunlikely that the bootstrap sample's CDF will precisely match the original sample's CDF. However it willstill be representative of the original sampled dataset which itself was representative of the entire pipelinepopulation. By taking a large number of bootstrap samples it is possible to determine confidence intervalsaround the original dataset (Figure 10 presents the original dataset CDF in red with bootstraps presented
10 OTC-28885-MS
in light grey). From Figure 10 it can be seen that the bootstraps are, as expected, clustered around theoriginal dataset CDF. Figure 11 presents the upper and lower bounds for the bootstrapped data and the lowerbound will be utilized within the final assessment as it is the most conservative basis for the purposes ofdetermining likelihood of an excessive corrosion anomaly.
Figure 9—Example Fitted CDF to Sub-Population Dataset
Figure 10—100,000 Bootstraps from Sub-Population Dataset
OTC-28885-MS 11
Figure 11—Upper and Lower Bounds for 100,000 Bootstraps from Sub-Population Dataset
Determine the Probability of an Unacceptable DefectFor the purposes of this assessment an unacceptable corrosion anomaly is assumed to be one with morethan 85% wall thickness loss – this assumption is based on DNVGL-RP-F101 (Corroded Pipelines - Ref. 2)which states defect depths up to 85% of wall thickness may, subject to defect length/width considerations,be tolerable and the pipeline system may remain in service.
In accordance with DNVGL-ST-F101 (Ref. 1) it is necessary to satisfy the Serviceability Limit State(SLS) criteria – i.e. that the probability of a corrosion anomaly exceeding 85% wall thickness is less than10-3. The probability of a single randomly selected inspection data point exceeding 85% wall thickness isdetermined by consideration of the lower bound bootstrapped CDF (Figure 12).
Figure 12—85% Wall Thickness Loss from Lower Bound of 100,000 Bootstraps
From Figure 12 it can be determined that the probability of a single data point exceeding 85% wallthickness is given by:
12 OTC-28885-MS
However it is necessary to determine the probability of any section of the pipeline having a wall thicknessloss that exceeds 85%. The probability of any single data point within the pipeline exceeding 85% is givenby taking the inverse probability that none of the data points exceed 85% wall thickness loss.
Where n is the number of data points across the entire pipeline.
Statistical Assessment Methodology ImplementationThe statistical assessment methodology is implemented within the R software environment (Ref. 3) andutilizes a number of packages including:
1. Fitdistrplus (Ref. 4)2. Parallel (Ref. 3).
The "parallel" package is utilized due to the large size of the datasets being assessed and the largenumber of bootstraps required for which a random sample (with replacement) is required of the originalsub-population dataset. For typical datasets (such as those utilized within the Case Study) the processingtime when utilizing 8 cores on a standard configuration Windows computer took approximately 2 – 4 hoursper 5,000 bootstraps.
Case StudyThe Statistical Assessment Methodology detailed within this paper was developed to support the PTTEPMontara development. The development is located approximately 690 km west of Darwin, in the TimorSea, offshore north-western Australia. The Montara development comprises of production of crude oil fromfour fields: Montara, Skua, Swallow and Swift. The water depth at the location is in the range of 76 to 80 mwith the Swift and Skua fields being 18 km and 25 km respectively north-northwest from the Montara field.
The field assets at Montara comprise the subsea system, an unmanned four-legged well-head platform(WHP) and the "Montara Venture" Floating Production Storage and Offloading (FPSO). The WHP supportsfour production wells with dry trees and a single gas re-injection well with a dry tree. Production from thesubsea productions system and the platform wells are comingled at the WHP and exported to the FPSO viatwo 14-inch flowlines, coupled to two 10-inch flexible risers.
The Case Study features a hydrocarbon pipeline that runs from the WHP to the "Montara Venture" FPSO(Figure 13). The pipeline had been installed a number of years previously and had been wet parked inthe intervening period. The initial wet parking design had assumed a wet parking period of approximatelytwo years which, due to operational requirements, had been exceeded. PTTEP wanted to commission thewet parked pipeline and bring it into production. PTTEP had investigated an ILI campaign but due to theinstalled offshore facilities this would have required subsea to subsea pigging resulting in an estimated costof AU$20M (~US$15.7M). Furthermore there was a vessel of opportunity with inspection tooling availablefor spot-inspections which, if suitable, presented a significant cost saving opportunity.
OTC-28885-MS 13
Figure 13—Case Study Field Layout (courtesy of PTTEP)
As the pipeline had been wet parked there were two main corrosion mechanisms identified by theCorrosion Engineer:
If oxidation corrosion was occurring then it is expected that a large number of relatively small corrosionanomalies would occur throughout the pipeline. However if MIC was occurring then a smaller numberof deeper corrosion anomalies could have occurred in various locations. Various MIC corrosion scenariosinclude:
1. The pipeline may have been perfectly sterilized during precommissioning, with no MIC2. Bacteria may have entered the North end of the pipeline during metrology spool tie-in, with MIC
predominantly at the North end of pipeline3. Bacteria may have entered the South end of the pipeline during metrology spool tie-in, with MIC
predominantly at the South end of pipeline4. Combinations of the above resulting in MIC throughout pipeline.
Based on the above corrosion mechanisms and MIC scenarios an inspection strategy was defined wherea number of girth weld locations would be inspected (Figure 14).
14 OTC-28885-MS
Figure 14—Typical Field Joint During Halfwave Inspection (courtesy of PTTEP)
Supplementary inspection locations were defined with the number of inspections and their order beingdependent on the outcome of the first batch of inspection data. This strategy ensured that the overall datasetwould be representative of the pipeline system corrosion behavior, whilst minimizing inspection cost if thepipeline was found to be in excellent condition.
The inspection contractor undertook the scans on the initial batch of locations and the inspection data wasprovisionally post-processed and quality-checked on the vessel prior to transmittal to shore for the statisticalassessment. During the quality checks some data that was erroneous was removed by the inspectioncontractor reducing the overall size of the datasets available for assessment.
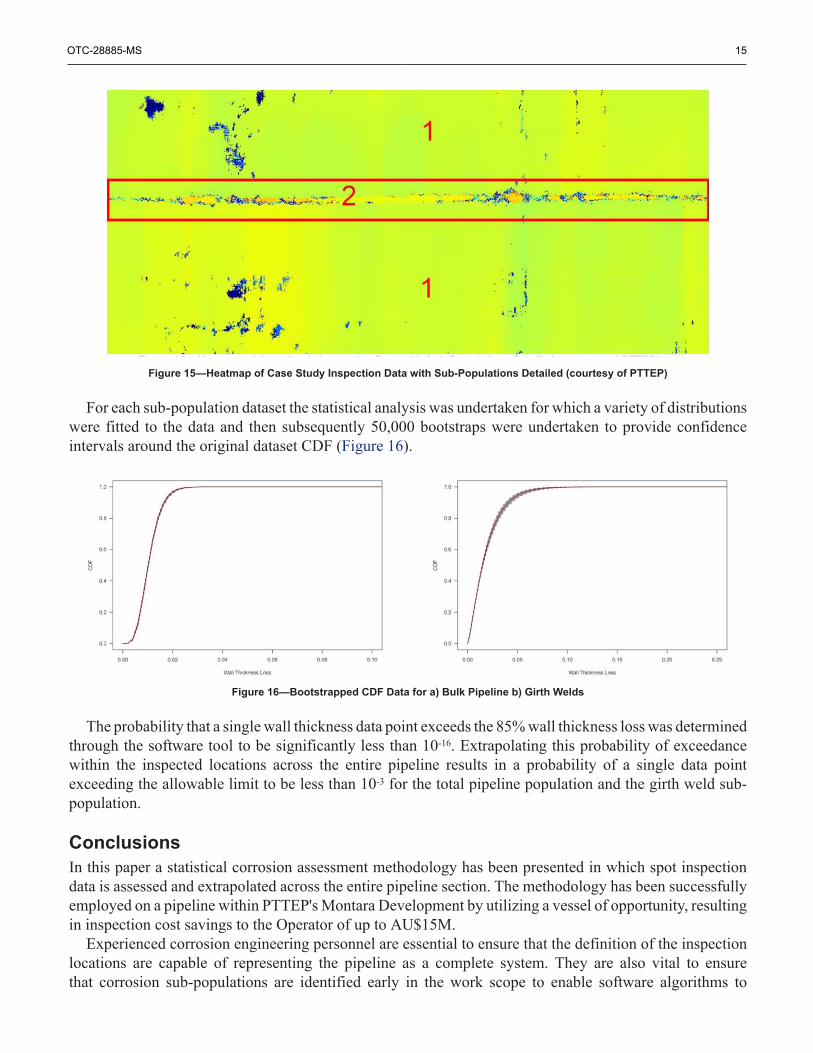
The inspection data was provided as measured wall thickness in 1 mm by 1 mm bins for the completepipe circumference. Each inspection covered an approximately 700 mm long section of the pipeline andresulted in approximately 700,000 to 800,000 data points for use within the corrosion assessment prior tosplitting into sub-populations. Each dataset was split into pre-defined sub-populations (Figure 15 wherezone 1 is the main pipe wall and zone 2 is the girth weld heat affected zone).
OTC-28885-MS 15
Figure 15—Heatmap of Case Study Inspection Data with Sub-Populations Detailed (courtesy of PTTEP)
For each sub-population dataset the statistical analysis was undertaken for which a variety of distributionswere fitted to the data and then subsequently 50,000 bootstraps were undertaken to provide confidenceintervals around the original dataset CDF (Figure 16).
Figure 16—Bootstrapped CDF Data for a) Bulk Pipeline b) Girth Welds
The probability that a single wall thickness data point exceeds the 85% wall thickness loss was determinedthrough the software tool to be significantly less than 10-16. Extrapolating this probability of exceedancewithin the inspected locations across the entire pipeline results in a probability of a single data pointexceeding the allowable limit to be less than 10-3 for the total pipeline population and the girth weld sub-population.
ConclusionsIn this paper a statistical corrosion assessment methodology has been presented in which spot inspectiondata is assessed and extrapolated across the entire pipeline section. The methodology has been successfullyemployed on a pipeline within PTTEP's Montara Development by utilizing a vessel of opportunity, resultingin inspection cost savings to the Operator of up to AU$15M.
Experienced corrosion engineering personnel are essential to ensure that the definition of the inspectionlocations are capable of representing the pipeline as a complete system. They are also vital to ensurethat corrosion sub-populations are identified early in the work scope to enable software algorithms to
16 OTC-28885-MS
accelerate the data processing and statistical assessment so that results can be determined during the offshoreworkscope. This provides the opportunity for the offshore inspection program to be curtailed once sufficientconfidence in the pipeline's condition can be achieved.
References1. Det Norske Veritas, Submarine Pipeline Systems, DNVGL-ST-F101, December 2017.2. Det Norske Veritas, Corroded Pipelines, DNVGL-RP-F101, May 2017.3. R Development Core Team (2008), R: A language and environment for statistical computing,
R Foundation for Statistical Computing, Vienna, Austria. ISBN 3-900051-07-0, URL http://www.R-project.org.
4. Marie Laure Delignette-Muller, Christophe Dutang (2015). fitdistrplus: An R Package for FittingDistributions. Journal of Statistical Software, 64(4), 1-34. URL http://www.jstatsoft.org/v64/i04/.
5. J. A. Rice, Mathematical Statistics and Data Analysis, 2nd Edition, Duxbury Press, 1995.6. Retrieved from http://www.pollypig.com/Images/Foam/Polly%20Pig/Max%20Clean%20Series/
RCC-WB-1.png7. Retrieved from https://www.nord-stream.com/press-info/images/flooding-cleaning-and-gauging-
pig-2998/8. Retrieved from https://www.nord-stream.com/press-info/images/intelligent-pig-3488/