18


Our Business
2
DODO Station
Jobber Independent Station
Industrial Consumer
Wholesale Trade
Wholesale Trade
Retail Trade
accounting for ~ 99% of total sales and service income
COCO Station
Fuel Trading Business
Note: the remaining revenue from sales and services, accounting for 1%, is from 1) fuel transportation service 2) convenience store and coffee shop in PT petro stations and 3) other sales and services
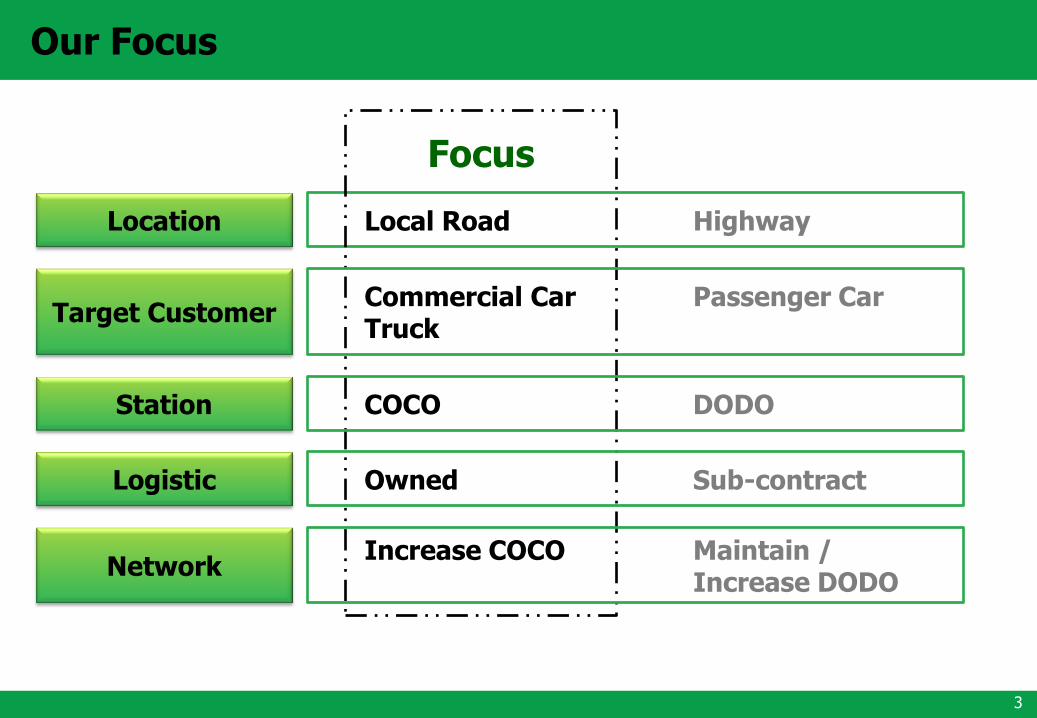
Our Focus
3
Location Local Road Highway
Focus
Target Customer Commercial Car Passenger Car Truck
Station COCO DODO
Logistic Owned Sub-contract
Network Increase COCO Maintain / Increase DODO

Key Success Factors
Large Number of
COCO Stations
Tank Farm in All
Regions
Large Truck Fleet
• Tank farm is used as distribution center (DC)
in each region
Focus on
• daily used consumers
• local road (close to the community)
• leasehold petro stations (lower
investment cost, reduce
construction period, able to operate
sooner)
• Large Number of Semi-trailers
• Efficient Transportation and
Distribution
• Manageable Logistic Schedule
4

Transportation Cost Saving
5
One-round Transportation Cost
Semi-trailer 10-wheel Truck PT’s Tank Farm
COCO Station Refinery at Sriracha
Transportation Distribution
0.09 0.17
0.26
0.35
0.44
0.53
0.10 0.13 0.17 0.23 0.29 0.35 0
0.1
0.2
0.3
0.4
0.5
0.6
50 Km 100 Km 150 Km 200 Km 250 Km 300 Km
10-wheel Truck
Semi-trailer Ba
ht
pe
r Lit
er
Long Distance Short Distance
Transportation Cost Saving (0.01) 0.04 0.09 0.12 0.15 0.18
PT’s Tank Farm
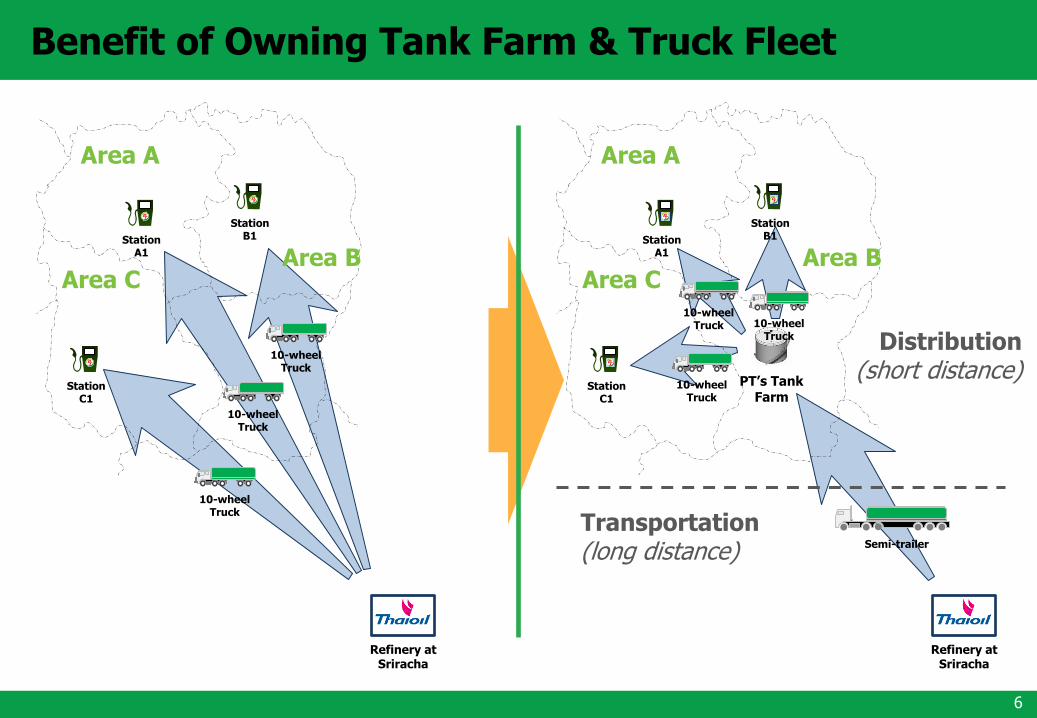
Benefit of Owning Tank Farm & Truck Fleet
6
10-wheel Truck
Refinery at Sriracha
Refinery at Sriracha
Transportation (long distance)
Distribution (short distance)
Station C1
Station A1
Area A
Area B Area C
Station B1
10-wheel Truck
10-wheel Truck
10-wheel Truck
Semi-trailer
Station C1
Station A1
Area A
Area B Area C
Station B1
10-wheel Truck
10-wheel Truck

Service Area of Tank Farm
7
Location
Capacity (Million Liters)
Lampang 3.98
Konkaen 5.03
Saraburi 5.30
Pak Thong Chai 12.0
Samut Songkram 113.69
Chumporn 26.20
Nakornsrithammarat 19.80
Total 186.00
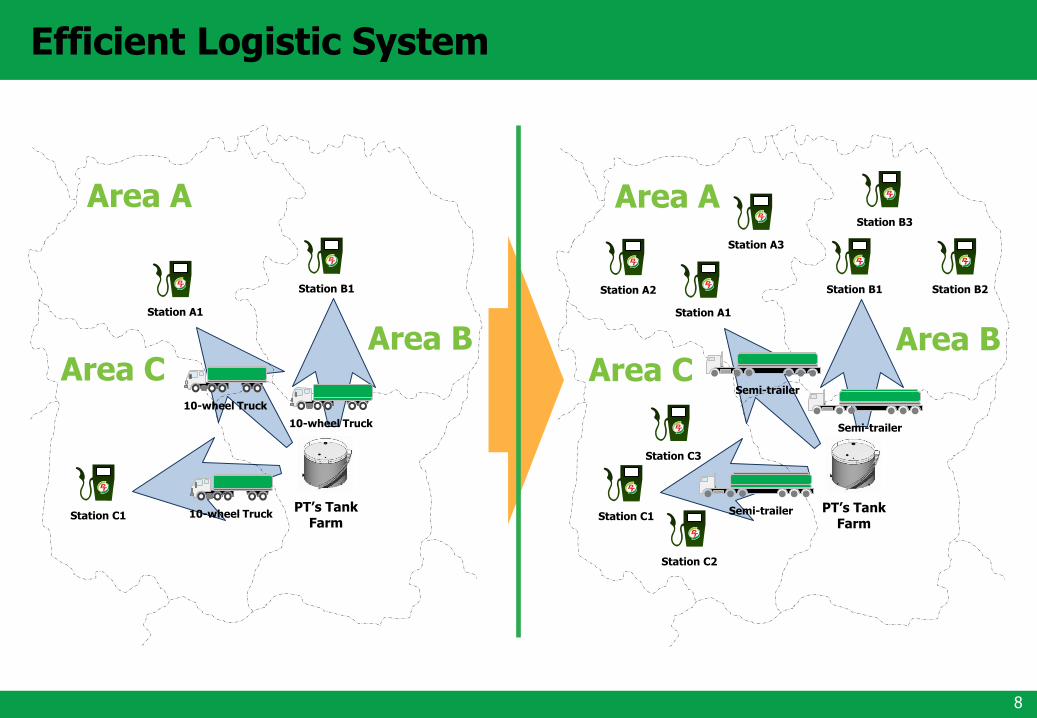
Efficient Logistic System
8
Station C2
Station C3
PT’s Tank Farm
Station C1
Station A1
Station B2
Area A
Area B Area C
Station A2
Station A3
Station B1
Station B3
PT’s Tank Farm
Station C1
Station A1
Area A
Area B Area C
Station B1
10-wheel Truck
10-wheel Truck
10-wheel Truck
Semi-trailer
Semi-trailer
Semi-trailer

Our COCO Station Growth
9
COCO: 85 DODO: 28
COCO: 39 DODO: 23
COCO: 46 DODO: 12
COCO: 18 DODO: 22
COCO: 38 DODO: 10
COCO: 36 DODO: 14
COCO: 164 DODO: 71
CAGR of All Stations = 32% CAGR of COCO Stations = 58% (calculated based on number of stations at the end of 2009 and 2012)
147 154 165 177 180
101
184
272
397 426
0
100
200
300
400
500
600
700
2009 2010 2011 2012 Mar-13
DODO COCO
Sta
tio
ns
248
338
437
574 606

Our Sale Volume Growth
10
119 122 133
170
100
110
120
130
140
150
160
170
180
2010 2011 2012 Q1 2013
Th
ou
sa
nd
Lit
ers
Sale Volume per Month per Station
Jan-12 Feb-12 Mar-12 Apr-12 May-12 Jun-12 Jul-12 Aug-12 Sep-12 Oct-12 Nov-12 Dec-12 Jan-13 Feb-13 Mar-13 Apr-13 May-13 Jun-13
IPO and Listing
Launch Commercial
AD#2
Launch Commercial
AD#1
Renovate Bang Pahun
Launch Max Card Renovate
Pak Chong
Soft Launch IPO Campaign
1st Pan Thai Branch Appoint
Leo Burnett
Rent Pak Thong Chai Tank Farm
Reach 600 Stations

Station Renovation
11
Before After
PT Station, Bang Pahan (Full Function Station)
0
100
200
300
400
500
600
700
800
900
Ja
n-1
2
Feb
-12
Mar-
12
Ap
r-1
2
May-1
2
Ju
n-1
2
Ju
l-1
2
Au
g-1
2
Se
p-1
2
Oct-
12
No
v-1
2
Dec-1
2
Ja
n-1
3
Feb
-13
Mar-
13
Ap
r-1
3
May-1
3
Th
ou
sa
nd
Lit
ers
Sale Volume per Month
Before After
PT Station, Nakhon Nayok (New C.I. Change)
0
100
200
300
400
500
600
700
800
Ja
n-1
2
Feb
-12
Mar-
12
Ap
r-1
2
May-1
2
Ju
n-1
2
Ju
l-1
2
Au
g-1
2
Se
p-1
2
Oct-
12
No
v-1
2
Dec-1
2
Ja
n-1
3
Feb
-13
Mar-
13
Ap
r-1
3
May-1
3
Th
ou
sa
nd
Lit
ers
Sale Volume per Month
Renovation Period
Renovation Period

2012
Impressive Outcomes
12
COCO Stations
Large Truck Fleet
Tank Farm
2011
Net Income
2010

58 89
226
360
125
4.93% 4.53%
3.86% 4.15%
4.78%
0.59% 0.57% 0.81% 0.86%
1.05%
0.00%
2.00%
4.00%
6.00%
-
100.00
200.00
300.00
400.00
2009 2010 2011 2012 Mar-13
Mil
lio
n B
ah
t
Net Income % Gross Profit % Net Income
9,677
15,681
27,817
41,724
11,878
- - - - - 0
500
1,000
1,500
2,000
0
10,000
20,000
30,000
40,000
2009 2010 2011 2012 Q1-13
Mil
lio
ns
Mil
lio
n B
ah
t
Total Revenue from Sale Total Sale Volume
391 558
948
1,373
394
02004006008001,0001,2001,4001,6001,8002,000
2009 2010 2011 2012 Q1-13
Mil
lio
n B
ah
t
2009 2010 2011 2012 Mar-13
Financial Performance
13
Note: Net income in 2009 has been deducted gain from debt restructuring of Baht 32.69 million
CAGR of Total Revenue from Sale = 63% CAGR of Total Sale Volume = 52% (calculated based on total revenue from sale and total volume sale in 2009 and 2012)

Highlighted Financial Ratio
14
17.66
11.87
8.17 6.80 6.26
-
5
10
15
20
2009 2010 2011 2012 Q1 2013
Da
ys
Days in Inventory
9.99
6.12
1.67 0.02 (0.99)
(5)
-
5
10
15
2009 2010 2011 2012 Q1 2013
Da
ys
Cash Cycle
13.51% 11.47%
24.49% 29.85%
34.83%
5.36% 4.54%
9.05% 10.64% 12.69%
0%
10%
20%
30%
40%
2009 2010 2011 2012 Q1 2013
ROA
ROE Return
4.70
3.92
2.08
1.20 1.05 -
1
2
3
4
5
2009 2010 2011 2012 Q1 2013
Da
ys
Average Collection Period
12.37
9.67 8.58 7.98 8.30
-
2
4
6
8
10
12
14
2009 2010 2011 2012 Q1 2013
Da
ys
Average Payment Period

Our 5-year Plan
15
147 154 165 177 202 227 252 277 302 101 184 272 397
527 627
727 827
927
0
200
400
600
800
1000
1200
1400
2009 2010 2011 2012 2013 2014 2015 2016 2017
DODO COCO
248 338 437
574
729 854
979 1,104
1,229
-
200
400
600
800
1,000
1,200
1,400
1,600
1,800
2009 2010 2011 2012 Mar-13
Sta
tio
ns
Independent Station 16,642 stations
Note: Information as at March 31, 2013 Source: Department of Energy Business
Number of petro stations classified by brand
1,565 stations
1,072 stations
603 stations
533 stations
512 stations
366 stations 228 stations
67 stations
2

Our 5-year Plan
16
109 127 154
236
316
396
476
556
636
-
5.0
10.0
15.0
20.0
25.0
0
100
200
300
400
500
600
700
2009 2010 2011 2012 2013 2014 2015 2016 2017
Mil
lio
n L
ite
rs
Number of Trucks Total Capacity
Tru
ck
s

17

Disclaimer
• This presentation contains some information from several sources and PTG does not make any representations regarding the use, validity, accuracy, or reliability of, or the results of the use of information, data but not limited to, all text, and images on this presentation.
• In addition, any forward looking statements are subject to change as a result of market conditions and the final result may be different to that indicated. PTG makes no representation or warranty of any type whatsoever on the accuracy or completion of the information contained herein.
• PTG undertakes no responsibility on the change after that date stated herein.
18


