167

2
Our report With our 15 years of local market knowledge, our African footprint and over 150 years of banking experience, we offer the best banking solutions to grow your business effectively in, for and across Africa. From Mauritius to continent, we will continue to move Africa forward.

Standard Bank (Mauritius) Limited annual report 2016 3
ContentsBusiness review6 Financial highlights
8 Non-financial performance
11 Chairman and chief executive’s review
12 Macroeconomic review
14 Management discussion and analysis
Ensuring our sustainability45 Corporate governance report
72 Sustainability report
75 Statement of compliance
Annual financial statements77 Statement of management‘s
responsibility for financial reporting
78 Statement of directors’ responsibilities in respect of the financial statements
79 Secretary’s certificate
80 Independent auditors’ report
83 Statement of financial position
84 Statement of profit or loss and other comprehensive income
85 Statement of cash flows
86 Statement of changes in equity
87 Notes to and forming part of the financial statements
4
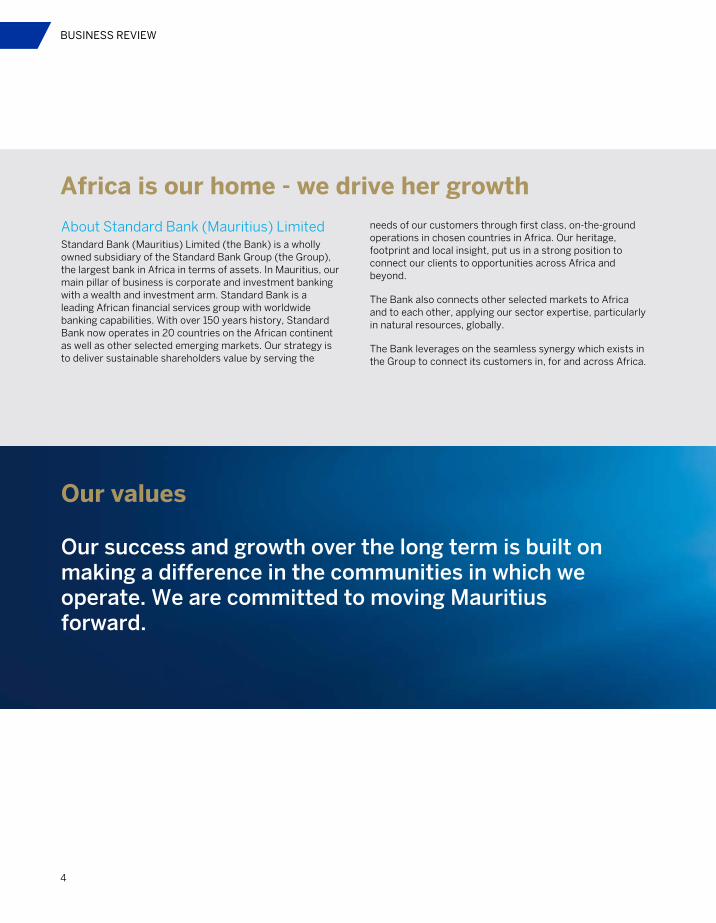
Our values Our success and growth over the long term is built on making a difference in the communities in which we operate. We are committed to moving Mauritius forward.
BUSINESS REVIEW
About Standard Bank (Mauritius) LimitedStandard Bank (Mauritius) Limited (the Bank) is a wholly owned subsidiary of the Standard Bank Group (the Group), the largest bank in Africa in terms of assets. In Mauritius, our main pillar of business is corporate and investment banking with a wealth and investment arm. Standard Bank is a leading African financial services group with worldwide banking capabilities. With over 150 years history, Standard Bank now operates in 20 countries on the African continent as well as other selected emerging markets. Our strategy is to deliver sustainable shareholders value by serving the
needs of our customers through first class, on-the-ground operations in chosen countries in Africa. Our heritage, footprint and local insight, put us in a strong position to connect our clients to opportunities across Africa and beyond.
The Bank also connects other selected markets to Africa and to each other, applying our sector expertise, particularly in natural resources, globally.
The Bank leverages on the seamless synergy which exists in the Group to connect its customers in, for and across Africa.
Africa is our home - we drive her growth
Standard Bank (Mauritius) Limited annual report 2016 5
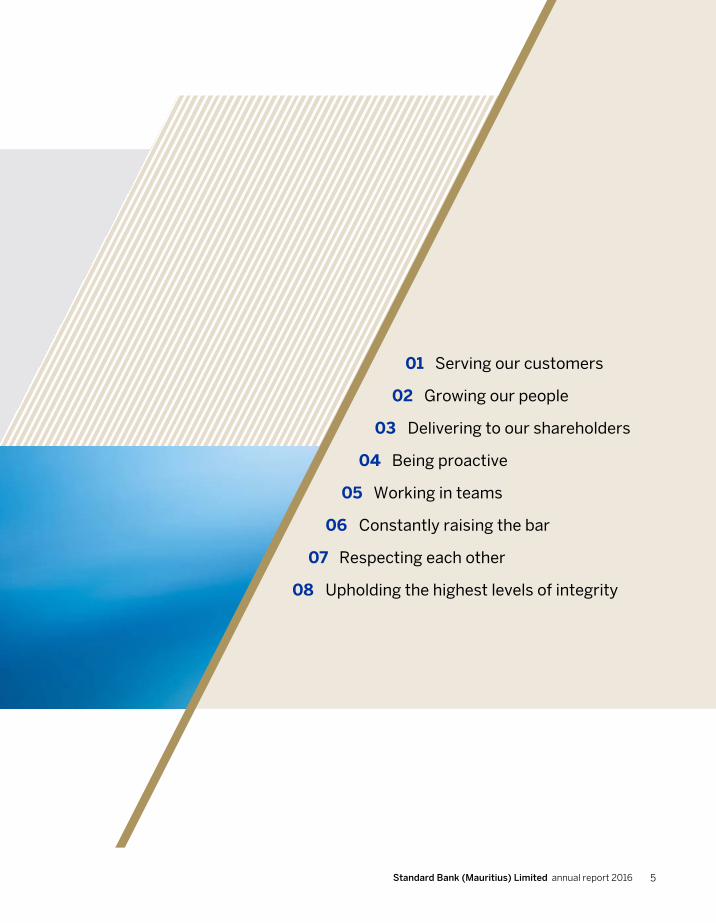
01 Serving our customers
02 Growing our people
03 Delivering to our shareholders
04 Being proactive
05 Working in teams
06 Constantly raising the bar
07 Respecting each other
08 Upholding the highest levels of integrity

BUSINESS REVIEW Financial highlights
6
Financial highlights
USD12,9 millionEarnings attributable to shareholders2015: USD21,6 million
USD1,5 billionTotal assets2015: USD1,4 billion
15.1%Return on average equity2015: 25.5%
50%Cost to income ratio2015: 43.3%
CORPORATE AND INVESTMENT BANKING
We provide services to larger domestic corporates, multinationals, management companies, governments, parastatals and financial institutions. Standard Bank combines the advantages of the business friendly environment of Mauritius, the expertise of a rich in-country talent base and the synergy within our global distribution network to provide tailor-made corporate and investment banking solutions to our clients.
WHAT WE OFFER
DEPARTMENTS
These include the support and back office functions facilitating the smooth and effective running of the Bank.
ENABLING FUNCTIONS
Global markets
Risk Compliance
Finance Legal
Information technology Group real estate services
Operations Marketing and communication
Internal auditHuman capital
Transactional products and services
Investment banking
International wealth and investment
Our business structure
Standard Bank (Mauritius) Limited annual report 2016 7
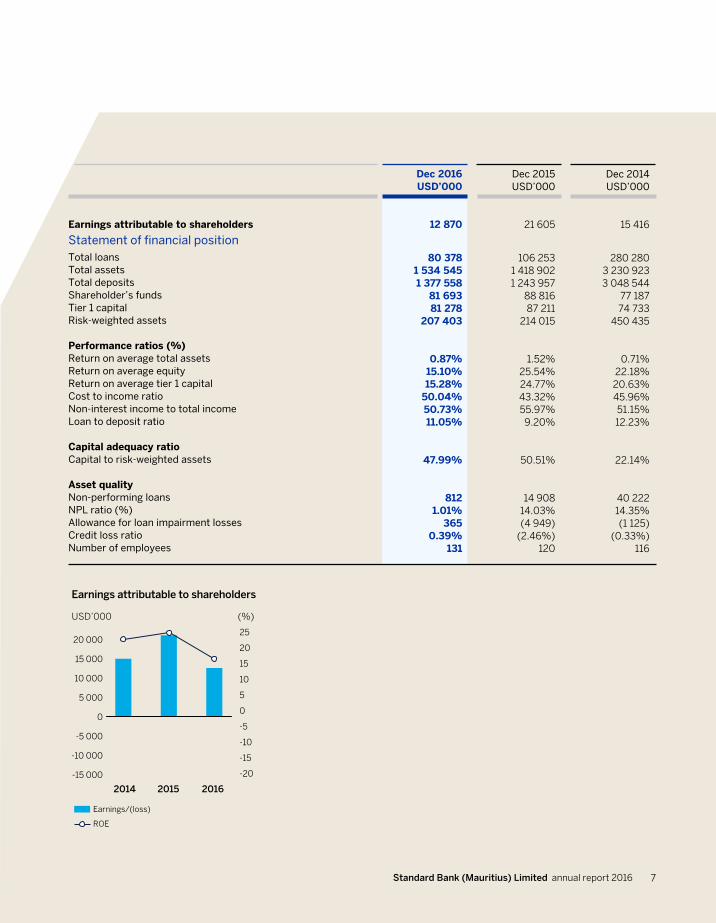
Earnings attributable to shareholders
Statement of financial positionTotal loansTotal assetsTotal depositsShareholder’s fundsTier 1 capitalRisk-weighted assets
Performance ratios (%)Return on average total assetsReturn on average equityReturn on average tier 1 capitalCost to income ratioNon-interest income to total incomeLoan to deposit ratio
Capital adequacy ratioCapital to risk-weighted assets
Asset qualityNon-performing loansNPL ratio (%)Allowance for loan impairment lossesCredit loss ratioNumber of employees
Dec 2016USD’000
12 870
80 3781 534 5451 377 558
81 69381 278
207 403
0.87%15.10%15.28%
50.04%50.73%11.05%
47.99%
8121.01%
3650.39%
131
Dec 2015USD’000
21 605
106 2531 418 9021 243 957
88 81687 211
214 015
1.52%25.54%24.77%43.32%55.97%
9.20%
50.51%
14 90814.03%(4 949)
(2.46%)120
Dec 2014USD’000
15 416
280 2803 230 9233 048 544
77 18774 733
450 435
0.71%22.18%
20.63%45.96%51.15%12.23%
22.14%
40 222 14.35% (1 125)
(0.33%) 116
Earnings attributable to shareholders
20 000
15 000
10 000
5 000
0
-5 000
-10 000
-15 000
25
20
15
10
5
0
-5
-10
-15
-20
2014 20162015
(%)USD’000
Earnings/(loss)
ROE
8
BUSINESS REVIEW Non-financial performance
StrategyStandard Bank (Mauritius) Limited’s (the Bank) shares the Standard Bank Group’s (the Group) aspiration to be the leading financial service institution, in, for and across Africa, delivering exceptional client experiences and superior value. This remained a key driver in 2016 and sets the primary goals and standard of excellence the Bank intends to achieve in the medium term. Earlier in the year, the Bank refined its strategy and revalidated its assumptions, in terms of building up its core markets. This process has enabled a better integration between business units and key enabling functions, such as risk and compliance, among others. Our strategy to place our clients at the centre of everything we do, is aimed at improving client’s experiences and as such, the Bank has made good progress against its goals and objectives supporting its strategy. Client centricity and consistent service delivery remained the two main pillars upon which the Bank is focused to reinforce and enhance its clients’ experience and therefore optimise value to stakeholders.
Client CentricityRealising our strategy depends on placing our clients as our central organising principle. To achieve this objective, begins with developing a precise understanding of their needs and what matters to them, offering them the products, services and solutions to achieve their goals. How the Bank achieves this is important and we are focused on making the necessary changes to serve our clients quickly, efficiently, reliably and respectfully. We create value to clients by partnering with them, forming long term, well-coordinated relationships that help them achieve their strategic objectives.
Consistent Service DeliveryThe Bank is committed to deliver a high quality and consistent service to our clients, by implementing initiatives that
differentiate us from the service rendered by others. We aim to promote a proactive, client focused and confident culture. By creating a significant difference in our efficiency to respond to client needs and consistently exploring possibilities to grow their business in Africa, we optimise value to our shareholders, employees and society at large.
Other highlightsMarketing and communication focuses on enhancing the brand image and visibility of the Bank, supporting business growth by raising awareness and stature on the Bank’s capabilities. It also drives a culture of pride and excellence to build an agile organisation and committed workforce.
The marketing and communication initiatives developed in 2016 were focused on growing our brand equity, promoting a client centric culture, building relationship with clients and stakeholders and promoting the Standard Bank culture, values and principles.
AdvertisingOur strategy was supported by the brand awareness campaign highlighting the role of the Bank in Mauritius being the gateway to Africa and how the Bank can be used as a financial platform to invest in the continent. The campaign showcasing Ebene Cybercity by night and Port-Louis harbour, reinforced the message that we leverage on our African footprint, local market knowledge and strong focus on natural resources to provide tailor-made and key solutions to make businesses grow in Africa. The Bank is positioned as the partner for growth on the continent we call home.
SponsorshipsSponsorships are an integral part of the Bank’s social responsibility and communication strategies. Sponsorships are essential in building
our brand and creating relevance in the markets in which we operate by providing the right platform to engage with our stakeholders. The promotion of arts and culture has been one of the priorities of Standard Bank’s sponsorship strategy for several years. In line with our brand, our culture and our values, this strategy is characterised by consistency and continuity in artistic and cultural commitments.
Artist-in-residence The Bank supported the initiative of ‘Institut Français’ in Mauritius to launch a program of artist-in-residence in the field of visual arts. Renowned artists were invited for a time and space away from their usual environment to reflect, research and produce an exhibition inspired from Mauritius’ life and culture. Artists as Jerome Zonder, Barthelemy Toguo, Firoz Ghanty and Jacques Desire Wong So participated in this program.
Trait d’Union The Bank also supported ‘Institut Français’ in cross-cultural exchanges through a series of conferences with prestigious guests speaking on several insightful cultural themes. Amongst others, Jean-Christophe Victor, Etienne Klein, Jean-Pierre Luminet and Charles Rojzman responded positively to the Trait d’Union initiative and enabled Mauritians at large to benefit from their knowledge and expert views.
Standard Bank & IFM Jazz Series – ‘Blues dan Jazz’The Bank is regarded in the music industry as the leading supporter of jazz, having made a major contribution in providing this formerly neglected genre with a needed boost through annual showcases, music development programmes and workshops. In Mauritius, the Bank is the title sponsor of the ‘Blues dan Jazz’ – Standard Bank & IFM Jazz Series. South African talent Siya Makuzeni, winner of the Standard Bank 2016 Young Artist Award performed with French Jazzman Jacky Terrasson and two local jazz geniuses Philippe Thomas and Kersley Pytambar.
Non-financial perfomance

Standard Bank (Mauritius) Limited annual report 2016 9
Standard Bank Indian Ocean TriathlonThe Bank was the title sponsor of the 8th edition of the Indian Ocean Triathlon in 2016. This sponsorship secured the sustainability of one of the country’s premier endurance events while at the same time enabling the Bank to extend its brand reach to the fast-growing sport of triathlon. Triathlon exemplifies all the qualities that the Bank stands for: hard work, dedication, endurance and commitment. The introduction of the corporate triathlon challenge and the aspirational nature of the sport, which promotes a healthy, positive lifestyle, were also major points of attraction for the Bank.
YPO Pan Africa and Mauritius Chapter African Summit The Bank sponsored in 2016 the YPO Pan Africa and Mauritius Chapter African Summit event which was held in
November. The conference addressed, amongst others, opportunities of ‘Doing Business in Africa’ with specific reference given to global business opportunities available in Mauritius.
South African Heritage DayThe Bank collaborated with the South African High Commission in Mauritius to organise an Heritage Day event on 24 September, encouraging South Africans living in Mauritius to come together to celebrate the rich cultural heritage and the diversity of their nation. This day included the promotion of small and medium enterprises from both Mauritius and South Africa involved in cultural related businesses. A variety of participants were invited, from the South African expatriates and Mauritian communities to showcase music, culture, food, crafts and traditional clothes, amongst other activities.

10
Events The Bank carried out a number of hospitality and business events during the year. These events support business by delivering to clients, consistent world class experiences and growing relationships.
BUSINESS REVIEW Non-financial performance continued
Standard Bank (Mauritius) Limited annual report 2016 11
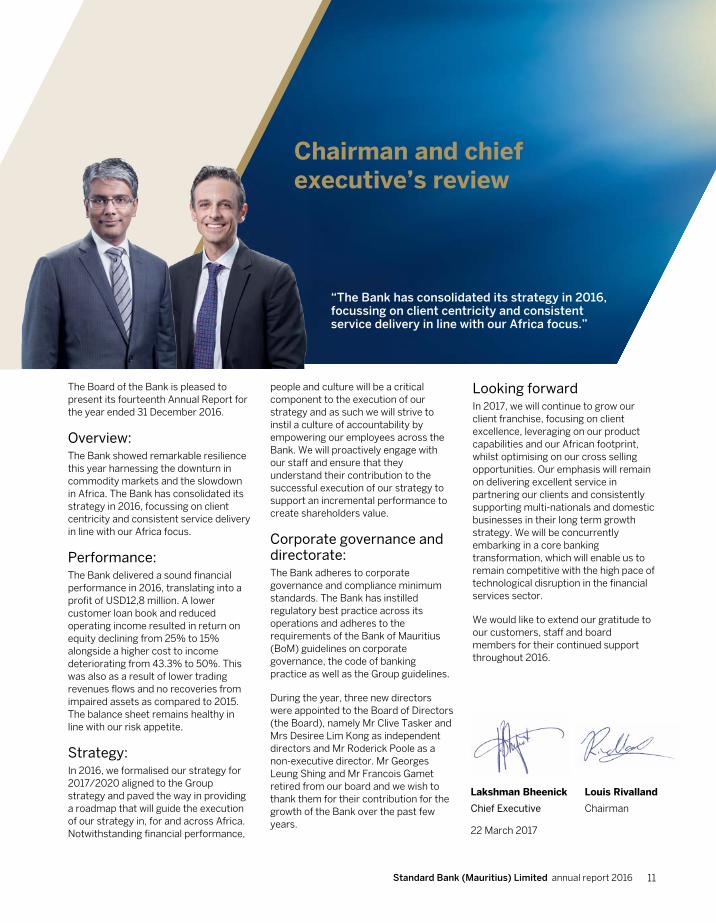
The Board of the Bank is pleased to present its fourteenth Annual Report for the year ended 31 December 2016.
Overview: The Bank showed remarkable resilience this year harnessing the downturn in commodity markets and the slowdown in Africa. The Bank has consolidated its strategy in 2016, focussing on client centricity and consistent service delivery in line with our Africa focus.
Performance: The Bank delivered a sound financial performance in 2016, translating into a profit of USD12,8 million. A lower customer loan book and reduced operating income resulted in return on equity declining from 25% to 15% alongside a higher cost to income deteriorating from 43.3% to 50%. This was also as a result of lower trading revenues flows and no recoveries from impaired assets as compared to 2015. The balance sheet remains healthy in line with our risk appetite.
Strategy: In 2016, we formalised our strategy for 2017/2020 aligned to the Group strategy and paved the way in providing a roadmap that will guide the execution of our strategy in, for and across Africa. Notwithstanding financial performance,
people and culture will be a critical component to the execution of our strategy and as such we will strive to instil a culture of accountability by empowering our employees across the Bank. We will proactively engage with our staff and ensure that they understand their contribution to the successful execution of our strategy to support an incremental performance to create shareholders value.
Corporate governance and directorate: The Bank adheres to corporate governance and compliance minimum standards. The Bank has instilled regulatory best practice across its operations and adheres to the requirements of the Bank of Mauritius (BoM) guidelines on corporate governance, the code of banking practice as well as the Group guidelines.
During the year, three new directors were appointed to the Board of Directors (the Board), namely Mr Clive Tasker and Mrs Desiree Lim Kong as independent directors and Mr Roderick Poole as a non-executive director. Mr Georges Leung Shing and Mr Francois Gamet retired from our board and we wish to thank them for their contribution for the growth of the Bank over the past few years.
Looking forwardIn 2017, we will continue to grow our client franchise, focusing on client excellence, leveraging on our product capabilities and our African footprint, whilst optimising on our cross selling opportunities. Our emphasis will remain on delivering excellent service in partnering our clients and consistently supporting multi-nationals and domestic businesses in their long term growth strategy. We will be concurrently embarking in a core banking transformation, which will enable us to remain competitive with the high pace of technological disruption in the financial services sector.
We would like to extend our gratitude to our customers, staff and board members for their continued support throughout 2016.
“The Bank has consolidated its strategy in 2016, focussing on client centricity and consistent service delivery in line with our Africa focus.”
Louis Rivalland
Chairman
Lakshman Bheenick
Chief Executive
Chairman and chief executive’s review
22 March 2017
12
Mauritius, being a small and open economy, is heavily dependent on global economic trends, typically those in Europe and China. Challenging global economic conditions persisted in 2016, leading to systematic downward revisions of global growth projections. However the domestic economy fared well, a low inflation, a narrowing of the current account deficit and contained fiscal deficit were the key factors in maintaining macroeconomic stability.
On 10 May 2016, Mauritius signed a protocol with India to amend the Double Tax Avoidance Agreement (DTAA) between the two countries. There were serious concerns about the impact of the double tax avoidance treaty amendment to the financial industry; however these concerns have subsided to some extent. Still, there is a need for concrete actions to be taken to minimise the impact on companies whose business models are dependent on DTAA.
The economy grew by 3.6% in 2016, benefiting partly from an improved performance of the tourism sector and strong domestic consumption. On the other hand, the economy was adversely impacted by a contraction of the private investment sector. The budget 2016-17 announced a number of socio-economic measures and public investment programs which are expected to reinvigorate the economy and move it to a higher growth trajectory. Additionally, the government is actively undertaking diversification measures directed towards Africa and Asia, although Mauritius’ economic performance will remain largely interlinked with Europe for the foreseeable future.
The central forecast for GDP is that growth will gradually slip from 3.6% in 2016 to an estimated 3.1% in 2019, before recovering to 3.7% in 2021, in line with a more supportive external environment. It is expected that activity will be supported in the short term by the recent monetary easing by the BoM, which will lift private consumption, as well as relatively firm government consumption growth, as the
government pushes ahead with its ambitious public investment programs.
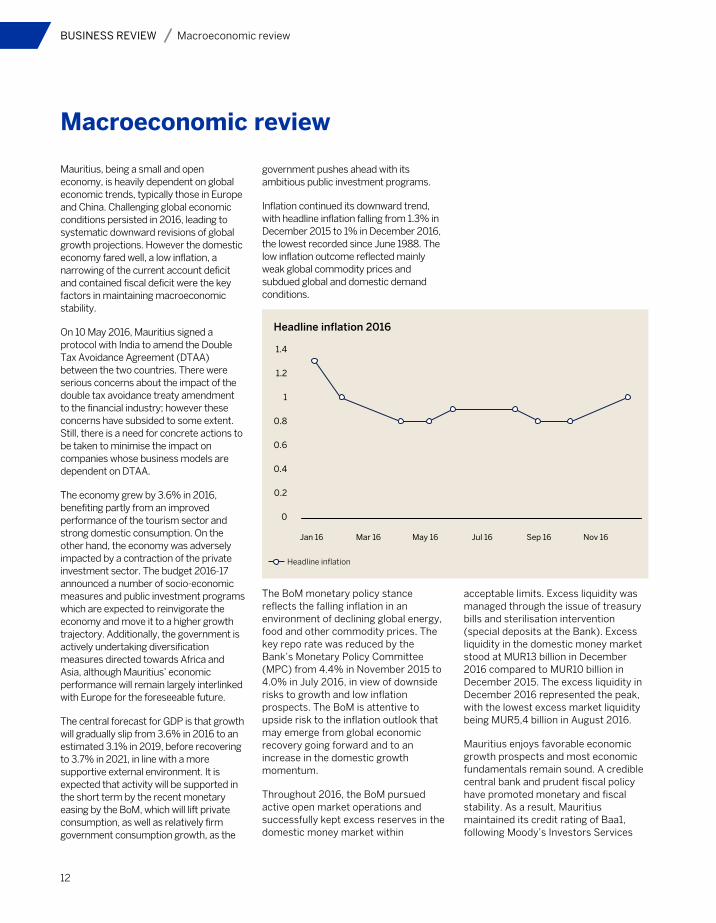
Inflation continued its downward trend, with headline inflation falling from 1.3% in December 2015 to 1% in December 2016, the lowest recorded since June 1988. The low inflation outcome reflected mainly weak global commodity prices and subdued global and domestic demand conditions.
The BoM monetary policy stance reflects the falling inflation in an environment of declining global energy, food and other commodity prices. The key repo rate was reduced by the Bank’s Monetary Policy Committee (MPC) from 4.4% in November 2015 to 4.0% in July 2016, in view of downside risks to growth and low inflation prospects. The BoM is attentive to upside risk to the inflation outlook that may emerge from global economic recovery going forward and to an increase in the domestic growth momentum.
Throughout 2016, the BoM pursued active open market operations and successfully kept excess reserves in the domestic money market within
acceptable limits. Excess liquidity was managed through the issue of treasury bills and sterilisation intervention (special deposits at the Bank). Excess liquidity in the domestic money market stood at MUR13 billion in December 2016 compared to MUR10 billion in December 2015. The excess liquidity in December 2016 represented the peak, with the lowest excess market liquidity being MUR5,4 billion in August 2016.
Mauritius enjoys favorable economic growth prospects and most economic fundamentals remain sound. A credible central bank and prudent fiscal policy have promoted monetary and fiscal stability. As a result, Mauritius maintained its credit rating of Baa1, following Moody’s Investors Services
Headline inflation 2016
1.4
1.2
1
0.8
0.6
0.4
0.2
0
Jan 16 Mar 16 May 16 Jul 16 Sep 16 Nov 16
Headline inflation
BUSINESS REVIEW Macroeconomic review
Macroeconomic review
Standard Bank (Mauritius) Limited annual report 2016 13
latest country-wide evaluation report. The ‘resilience and diversification of the local economy and robust institutional capacity’ were cited as reasons for maintaining its stable outlook on the island economy.
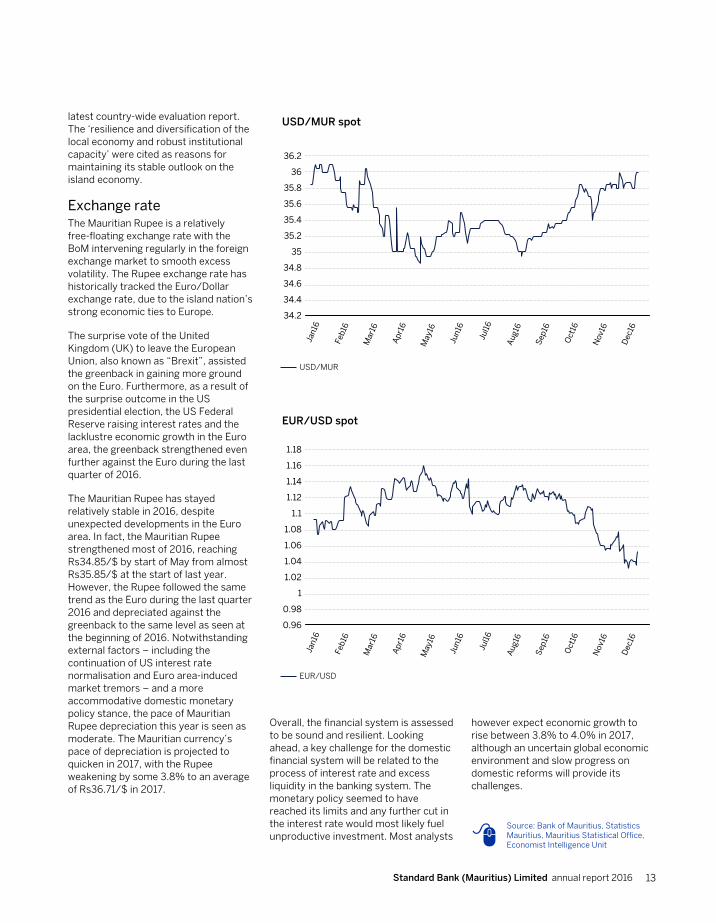
Exchange rate The Mauritian Rupee is a relatively free-floating exchange rate with the BoM intervening regularly in the foreign exchange market to smooth excess volatility. The Rupee exchange rate has historically tracked the Euro/Dollar exchange rate, due to the island nation’s strong economic ties to Europe.
The surprise vote of the United Kingdom (UK) to leave the European Union, also known as “Brexit”, assisted the greenback in gaining more ground on the Euro. Furthermore, as a result of the surprise outcome in the US presidential election, the US Federal Reserve raising interest rates and the lacklustre economic growth in the Euro area, the greenback strengthened even further against the Euro during the last quarter of 2016.
The Mauritian Rupee has stayed relatively stable in 2016, despite unexpected developments in the Euro area. In fact, the Mauritian Rupee strengthened most of 2016, reaching Rs34.85/$ by start of May from almost Rs35.85/$ at the start of last year. However, the Rupee followed the same trend as the Euro during the last quarter 2016 and depreciated against the greenback to the same level as seen at the beginning of 2016. Notwithstanding external factors – including the continuation of US interest rate normalisation and Euro area-induced market tremors – and a more accommodative domestic monetary policy stance, the pace of Mauritian Rupee depreciation this year is seen as moderate. The Mauritian currency’s pace of depreciation is projected to quicken in 2017, with the Rupee weakening by some 3.8% to an average of Rs36.71/$ in 2017.
Overall, the financial system is assessed to be sound and resilient. Looking ahead, a key challenge for the domestic financial system will be related to the process of interest rate and excess liquidity in the banking system. The monetary policy seemed to have reached its limits and any further cut in the interest rate would most likely fuel unproductive investment. Most analysts
however expect economic growth to rise between 3.8% to 4.0% in 2017, although an uncertain global economic environment and slow progress on domestic reforms will provide its challenges.
USD/MUR spot
USD/MUR
36.2
36
35.8
35.6
35.4
35.2
35
34.8
34.6
34.4
34.2Ja
n16
Feb
16
Mar
16
Apr
16
May
16
Jun
16
Jul
16
Aug
16
Sep
16
Oct
16
Nov
16
Dec
16
EUR/USD spot
EUR/USD
1.18
1.16
1.14
1.12
1.1
1.08
1.06
1.04
1.02
1
0.98
0.96
Jan1
6
Feb
16
Mar
16
Apr
16
May
16
Jun
16
Jul
16
Aug
16
Sep
16
Oct
16
Nov
16
Dec
16
Source: Bank of Mauritius, Statistics Mauritius, Mauritius Statistical Office, Economist Intelligence Unit
14
BUSINESS REVIEW Management discussion and analysis
The resultsThe Bank showed remarkable resilience in 2016, despite delivering a slower growth than in the last few years. The Bank withstood significant headwinds during the year, notably the slowdown in Africa and the downturn in commodities and a more cautious approach to client risk, which interrupted growth momentum. We have leveraged our competitive advantage to ensure that we remain resilient in spite of these challenging conditions. Against this backdrop, the Bank delivered a sound financial performance in 2016, which demonstrated the benefits of the Bank’s diverse portfolios of operations, underpinned by the three pillars of our business: transactional products and services, investment banking and global markets business.
Review by business linesCorporate and investment bankingDuring the year, the Bank underwent a review of the strategic objectives for these three pillars, to enhance revenue streams through the diverse range of financial products and ensure sustained growth for the years to come. The Bank’s focus remained Corporate and Investment Banking (CIB), with a wealth and investment arm. Our client coverage model is a cornerstone of our strategy and defines how we offer value to our clients. It has strengthened our focus on clients, whose business strategies align with our African strategy. By coordinating how we engage with our clients and promoting a deeper understanding of their needs and objectives, we are able to provide them with the solutions they require.
Transactional products and servicesTransactional Products and Services (TPS) witnessed a slowdown in activities for a few of the Bank’s clients operating on the African continent this year, as the latter continued to experience sluggish
growth as a result of depressed commodity prices. TPS delivered a reasonable growth of 4% in revenues, despite the slowdown and some discontinued business activities, on the back of a balance sheet re-structuring exercise initiated during the year. The bulk of the revenue is interest driven and sourced from the liabilities book, whilst fees and commissions are driven mostly by remittances and trade finance activities.
In 2016, the advances book grew by 27% to reach USD59 million. Average liabilities reached USD1,1 billion, representing a 43% decrease compared to prior year as some significant deposits were withdrawn on the back of restructuration following the rapid decline in commodity prices. The current level of liabilities is stable and is expected to grow moderately during 2017, as the trend is expected to be sustainable. Some notable client acquisitions were achieved in 2016, which should also reflect positively in the 2017 performance.
The Bank’s internet banking platform, business online, is continuously being upgraded to incorporate additional features, to provide clients with an improved experience.
Global marketsGlobal markets provides a risk warehouse for managing and repackaging risk exposures in foreign exchange, interest rates and money markets, to deliver products and services that meet the investment and hedging needs of our clients. With an extensive African footprint, our experience in emerging markets and our presence in all major financial centres enabled the Bank to deliver a service that is sensitive to regulatory and risk factors in emerging markets globally. We aspire to be the ‘go to’ bank for African market products and services, working as a trusted partner with our clients to realise their growth ambitions in Africa.
Revenues were 6% down on last year, on the back of lower trading income, translating into a drop of 10% in headline earnings compared to prior year. Trading Income was adversely impacted by lower client flows driven by lower commodity prices and was 26% down on the previous year. Lower volatility in USD/MUR and lesser demand for foreign exchange on the local market also dented income generated by the FX flow trading and money markets trading desks.
Investment bankingInvestment banking was mainly impacted by the change in strategy implemented in 2013 with the exit of the remaining cross border facilities originated through the Bank’s African franchise and partly by a few early term loans prepayments. This translated into revenues dropping by 54% year on year, attributable to a reduction of 55% in the loan portfolio from prior year to close at USD31 million.
The bulk of 2016 was geared towards setting up a refreshed strategy, put in place in the third quarter of 2016, with the aim to broaden Investment Banking’s asset book. Successful implementation of this revised strategy is being evidenced with a strong pipeline of assets currently underway. The first quarter of 2017 looks promising with the build-up of new structured debt facilities. The Bank’s focus is to continue to pursue investment banking opportunities in the pan-African market as well as in Mauritius.
International wealth and investment The CIB wealth initiative launched last year continued to deliver a high quality pipeline of eligible clients. An initiative taken during the year was the targeting of wealth and investment regional franchise, which resulted in a few key clients wins from East Africa.
Operating income for the year stood at USD823 000 and was 49% higher than prior year. This performance was recorded on net interest income which grew by 98% to close at USD636 000 for 2016, attributable to higher funding income on deposits base during the year. A drop of 18% in non-interest revenue to reach USD187 000 was witnessed, on account of the re-organisation of the
Management discussion and analysis
Standard Bank (Mauritius) Limited annual report 2016 15
clients’ book away from transaction banking customers to a more steady deposit and long term investment-orientated client base. The wealth and investment business is still in building phase and as such generated a net loss of USD454 000. Deposit as at year end was USD130 million.
EnablersHuman capitalHuman Capital (HC) covers a wide-ranging of functions such as resourcing, learning & development, talent management, succession planning, amongst others. The highlight of the year was the continued implementation of various HC projects to ensure alignment with best practices. The HC transformation project was implemented to ensure that HC is aligned to the business and enabling more capacity of the HC business partners and effectively partnering business. A comprehensive plan was implemented since last year up to 2017 with deliverables to be tracked and ensuring alignment with the business strategy.
There was further implementation of the talent management process by introducing a focused assessment and development plan for management and identification of talent.
OperationsOperations covers a wide range of enablement functions including payments, client services, trade services, global market operations, operations processing centre, know your customer, reconciliations, facilities management and procurement. These functions exist to facilitate the needs and requirements of their customers i.e. the internal business partners and external customers. In 2016, alignment and understanding the needs of these customers were deemed to be of strategic importance and the resulting strategy for operations was defined along the three pillars below.
(1) Enable growth and client centricity: streamline processes and procedures in order to have a better understanding of the customer’s experience. Qualitative
MIS from Salesforce Service Cloud was a critical enabler and facilitated our monthly engagement with business partners with a view to improve on service.
(2) Brilliant basics: much effort was made in achieving the brilliant basics, where all key high impact clients and control processes have been reviewed together to ensure we operate in a mature control environment. We have created a culture of discipline to prevent re-work and reduce errors. We also worked towards an environment that maximised on positive relationships with external stakeholders built on trust, understanding and cooperation through regular engagements with our IT team, the outsourced Group functions and our matrices to address the stability of our operating systems and channels. Successful roll out of some projects have also contributed in achieving the goal of brilliant basics namely:
•• the successful implementation of Vulindlela: the objective of this project was to replace Meridian and Swift Alliance Access (SAA) applications with a new and more stable SWIFT application – Alliance Messaging Hub (AMH);
•• the successful deployment of the EFAX solution to the entire bank. This project has been executed to digitise fax messages. It allowed a reduction in the paper footprint with regards to fax printing and time saving, given that the digitised fax messages are delivered much more rapidly;
•• the implementation of an imaging and workflow system improved operational efficiency (workflow) and introduced digitisation (imaging) for two operational processes. It allowed for a paperless environment and time saving by removing manual handovers of documents. It also facilitated for traceability and easy retrieval of information/documents for regulatory investigations; and
•• the cheque clearing process has been reviewed by the BoM and new measures put in place to facilitate the efficiency of the payment and settlement systems in the country. We have successfully migrated to the new
clearing modes which will benefit client and the banking industry at large.
(3) Culture of high performance: we ensured that team members were continuously upskilled and trained namely on FATCA and CRS which are essential to maintain regulatory requirements. Job rotations in and outside operations were organised to allow staff to develop new skills and improve on client’s centricity.
External forces review Legal and institutional environmentThe Finance (miscellaneous provisions) Act 2016 has brought amendments to various legislations namely the Banking Act, the Income Tax Act, the Financial Services Act, the Companies Act amongst others, thereby impacting on the legislative landscape of the financial Industry. This has resulted in the Bank reviewing its processes where necessary. The main highlights are as follows:
•• financial institutions are now allowed to make disclosures to its parent company or head office with regard to its affairs and client portfolio subject however to the recipients being similarly bound by confidentiality undertakings. This amendment is welcomed as the Bank, being a subsidiary within an international group, is required to provide information or produce reports to its head office as part of its day-to-day operations;
•• another important amendment to the Banking Act pertains to the mandatory requirement for all banks to rotate audit firms every five years. PricewaterhouseCoopers (PwC) has been appointed as external auditor of the Bank for the financial year ended 2016. Appointment of external auditor is subject to the shareholder’s approval on an annual basis. In line with the new requirement, the Bank will recommend a change in the audit firm, should PwC have been re-conducted over the next five years;
16
•• a companies special deposit account vested in the Registrar of Companies has been created. Funds sitting on bank accounts of companies which are struck off from the company’s registry shall now be transferred to this special account following a court order upon application by the Bank; and
•• the national Corporate Social Responsibility (CSR) framework has been revised. For the calendar year 2017, the Bank is required to either remit 50% of its CSR fund (segment A) to the director-general of the Mauritius Revenue Authority (MRA) or spend that sum towards an approved CSR program within the set priority areas. The Bank retains discretion to spend the remaining 50% in its own CSR initiatives.
The Financial Services Act has introduced an umbrella Investment Banking License which covers various financial services: investment dealer (full service dealer including underwriting); investment adviser (unrestricted); investment adviser (corporate finance advisory); asset management and distribution of financial services. In this regard, the Income Tax Act has been amended to provide for a tax holiday of five years on the income derived from the activities covered under the Investment Banking License for any new licensee (on or after 1 September 2016).
Currently the Bank is the holder of an Investment Adviser (unrestricted) License and a Distribution of Financial Products License. Whilst the Bank is allowed to pursue its activities conducted under these existing licenses, the Bank may decide to apply for this new umbrella license should it wish to enlarge its financial services offerings in the future. It must also be highlighted that, in accordance with the Financial Services (investment Banking) Rules 2016, this new license does not affect the lending activities of the Bank.
Regulatory developments impacting the BankThe BoM has issued the following guidelines in draft form during the year, namely:-
i) the Draft National Payment System Bill
The object of the National Payment System bill is to provide for:
(a) regulation and oversight of the national payment system;
(b) regulation and supervision of payment systems operating in Mauritius and to designate the BoM as the authority for that purpose and for related matters.
ii) the Deposit Insurance Scheme Bill.
The object of the Deposit Insurance Scheme Bill is to establish a deposit insurance system to protect depositors and guarantee the repayment of their deposits to such extent as may be feasible, in the case a bank or non-bank deposit taking institution licensed by the BoM fails. The Deposit insurance scheme will be established through a wholly owned subsidiary of the Bank. The system is designed to act as a safety net. It aims at minimising the risk of loss of depositors’ funds with financial institutions.
iii) In October 2016, the BoM has revised its draft guideline on IT risk management which sets out the regulatory framework for the management of risk that emanates from the use of IT systems. The draft guideline is still subject to discussion among the regulators and internal stakeholders within the banking industry.
In addition to the above, the guideline on liquidity risk management has been revamped to take into account the recommendations of Basel III.
Reviewed and new guidelines issuedIn light of the BIS paper entitled ‘Sound management of risks related to money laundering and financing of terrorism guidelines’ and the annex on general guide to account opening for comments. The BoM has proposed some amendments to the guidance notes on anti-money laundering and combating the financing of terrorism.
The guideline on credit impairment measurement and income recognition was reviewed to align closer to international accounting standards.
The BoM has revised its guidelines on corporate governance in June 2016. Some key changes have been brought to the guideline such as the independence and reporting line of the compliance function, appointment of a chief risk officer, self-assessment of board of directors, assessment of performance of top management and senior officers.
The BoM has issued new regulations on the Banking (Compoundable offences) (Amendment) Regulations 2016. Section 97- offences and penalties of the Bank of Mauritius Act, Sub Section 21 have been added. The director, chief executive officer, manager, officer, employee or agents of a financial institution are now subject to compoundable offences.
The Republic of Mauritius signed the OECD convention on mutual administrative assistance in tax matters in June 2015. As a member of the Early Adopters Group, the country had initially planned to implement the Common Reporting Standard (CRS) early. The effective date of 1 January 2016 was subsequently deferred to 1 January 2017 and the first reporting will now start from 31 July 2018.
BUSINESS REVIEW Management discussion and analysis continued

Standard Bank (Mauritius) Limited annual report 2016 17
The MRA has issued its guideline on CRS, which is broader in scope as compared with FATCA, since it includes more information on a wider range of clients and reported to a greater number of revenue authorities. The MRA has authority to require banks to establish and maintain appropriate due diligence procedures. Failure to abide to CRS obligation will entail an offence and financial institution may be liable to a fine not exceeding MUR5 000 and an imprisonment for a term not exceeding 6 months.
Looking aheadIn 2017, we will be focusing on the new core banking transformation from BankMaster to Finacle. This will enable us to strengthen our customer data and analytics capabilities. This will underpin our ability to provide relevant solutions, informed deep insights to what matters most to our customers. To achieve this, our people management culture will continue to focus on client centricity, by maintaining our top quality services supporting both our internal and external clients. We will continue to operate in a well-controlled environment and will apply more proactive processes that will comply with our internal and external requirements while ensuring cost discipline.
Client centricity is an ongoing journey at the Bank. It is an
honour to continue our path and vision of placing our clients at the
centre of everything we do. We are committed to consistently deliver
service excellence which delights and exceeds customers’ expectation. As a
trusted partner, we create value to clients by listening and understanding their needs
and offering them an exceptional client experience.
Sheetal KumarRelationship Manager
Best Emerging Markets Bank in Mauritius, 2016
Global Finance Magazine
AWARD
18
BUSINESS REVIEW Management discussion and analysis continued
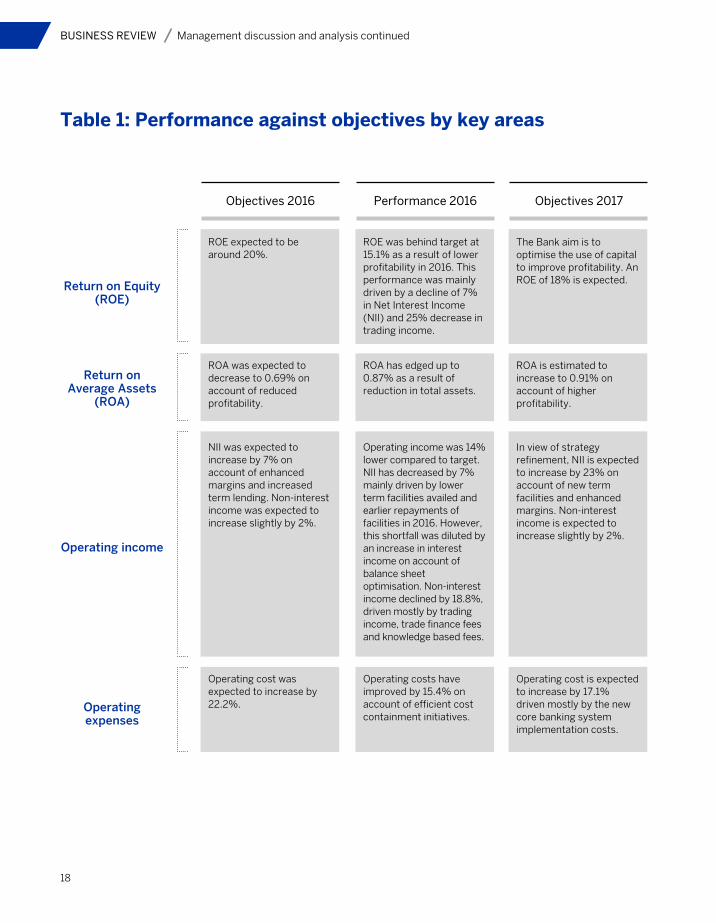
Table 1: Performance against objectives by key areas
ROE expected to be around 20%.
ROA was expected to decrease to 0.69% on account of reduced profitability.
NII was expected to increase by 7% on account of enhanced margins and increased term lending. Non-interest income was expected to increase slightly by 2%.
Operating cost was expected to increase by 22.2%.
Return on Equity (ROE)
Return on Average Assets
(ROA)
Operating income
Operating expenses
ROE was behind target at 15.1% as a result of lower profitability in 2016. This performance was mainly driven by a decline of 7% in Net Interest Income (NII) and 25% decrease in trading income.
ROA has edged up to 0.87% as a result of reduction in total assets.
Operating income was 14% lower compared to target. NII has decreased by 7% mainly driven by lower term facilities availed and earlier repayments of facilities in 2016. However, this shortfall was diluted by an increase in interest income on account of balance sheet optimisation. Non-interest income declined by 18.8%, driven mostly by trading income, trade finance fees and knowledge based fees.
Operating costs have improved by 15.4% on account of efficient cost containment initiatives.
The Bank aim is to optimise the use of capital to improve profitability. An ROE of 18% is expected.
ROA is estimated to increase to 0.91% on account of higher profitability.
In view of strategy refinement, NII is expected to increase by 23% on account of new term facilities and enhanced margins. Non-interest income is expected to increase slightly by 2%.
Operating cost is expected to increase by 17.1% driven mostly by the new core banking system implementation costs.
Objectives 2017Performance 2016Objectives 2016

Standard Bank (Mauritius) Limited annual report 2016 19
Additional IT support and systems costs were expected to increase the cost to income ratio to 51%.
The loan book was expected to grow by 99.4% driven by both short term and medium term assets.
Deposits were expected to increase by 57% from new business.
Capital management was targeted to be maintained at 22% to support the Bank’s risk appetite.
Non-Performing Loans (NPL) ratio was expected to improve further, following potential recovery.
Cost to income
Loans & advances growth
Deposit growth
Portfolio quality
Capital management
Cost to income ratio was 50%, due to lower trading revenues and net interest income resulting from the delays in materialising term assets.
Loan and advances to customers were 61% behind budget, driven by delays in translating new term assets as planned. In addition, lower utilisation of overdraft facilities, call loans and import loans were reported.
Customer deposits were behind budget by 30% as a result of lower deposits based from various clients.
The capital adequacy ratio stood at 48%, with tier 1 ratio closing at 39%.
The ratio of NPL to gross loans has significantly improved from 14% to 1%. Recovery of one NPL and write off of unrecovered amount for the fully impaired asset has contributed to improve the ratio to 1%.
The cost to income ratio is expected to be at 52% as the Bank is projecting an increase in operating costs with the new core banking transformation planned for 2017.
The loan book is expected to increase by around 117.5% following the refinement of the Bank’s strategy.
Deposits are expected to increase by 9.7% from existing and new business.
Capital adequacy ratio is expected to close around 30%.
NPL ratio is expected to improve further as a result of better risk graded customers.
Objectives 2017Performance 2016Objectives 2016
20
BUSINESS REVIEW Management discussion and analysis continued
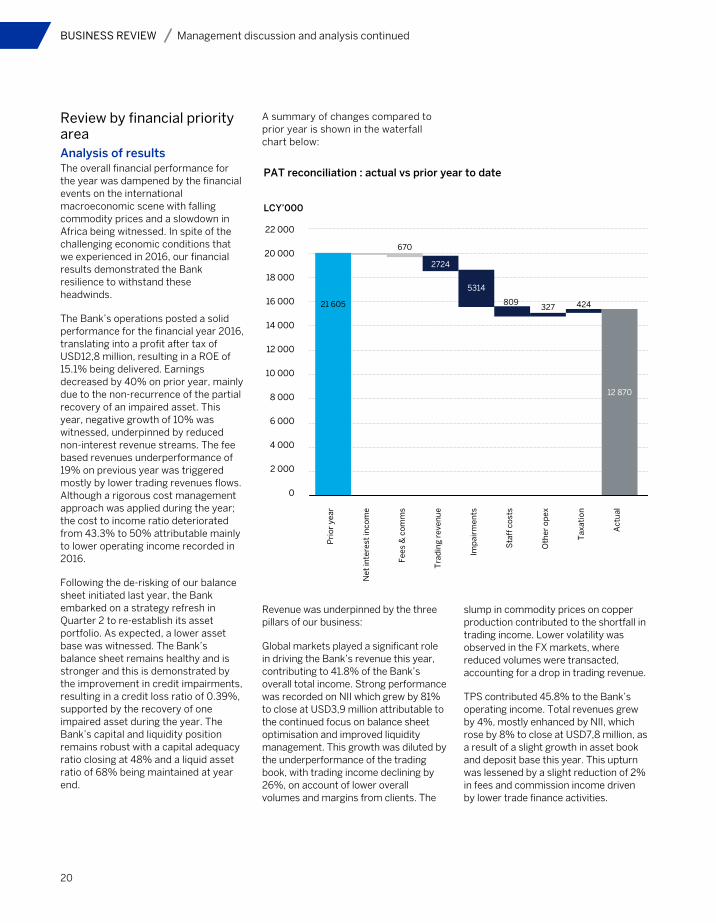
Review by financial priority areaAnalysis of resultsThe overall financial performance for the year was dampened by the financial events on the international macroeconomic scene with falling commodity prices and a slowdown in Africa being witnessed. In spite of the challenging economic conditions that we experienced in 2016, our financial results demonstrated the Bank resilience to withstand these headwinds.
The Bank’s operations posted a solid performance for the financial year 2016, translating into a profit after tax of USD12,8 million, resulting in a ROE of 15.1% being delivered. Earnings decreased by 40% on prior year, mainly due to the non-recurrence of the partial recovery of an impaired asset. This year, negative growth of 10% was witnessed, underpinned by reduced non-interest revenue streams. The fee based revenues underperformance of 19% on previous year was triggered mostly by lower trading revenues flows. Although a rigorous cost management approach was applied during the year; the cost to income ratio deteriorated from 43.3% to 50% attributable mainly to lower operating income recorded in 2016.
Following the de-risking of our balance sheet initiated last year, the Bank embarked on a strategy refresh in Quarter 2 to re-establish its asset portfolio. As expected, a lower asset base was witnessed. The Bank’s balance sheet remains healthy and is stronger and this is demonstrated by the improvement in credit impairments, resulting in a credit loss ratio of 0.39%, supported by the recovery of one impaired asset during the year. The Bank’s capital and liquidity position remains robust with a capital adequacy ratio closing at 48% and a liquid asset ratio of 68% being maintained at year end.
A summary of changes compared to prior year is shown in the waterfall chart below:
Revenue was underpinned by the three pillars of our business:
Global markets played a significant role in driving the Bank’s revenue this year, contributing to 41.8% of the Bank’s overall total income. Strong performance was recorded on NII which grew by 81% to close at USD3,9 million attributable to the continued focus on balance sheet optimisation and improved liquidity management. This growth was diluted by the underperformance of the trading book, with trading income declining by 26%, on account of lower overall volumes and margins from clients. The
slump in commodity prices on copper production contributed to the shortfall in trading income. Lower volatility was observed in the FX markets, where reduced volumes were transacted, accounting for a drop in trading revenue.
TPS contributed 45.8% to the Bank’s operating income. Total revenues grew by 4%, mostly enhanced by NII, which rose by 8% to close at USD7,8 million, as a result of a slight growth in asset book and deposit base this year. This upturn was lessened by a slight reduction of 2% in fees and commission income driven by lower trade finance activities.
PAT reconciliation : actual vs prior year to date
LCY’000
22 000
20 000
18 000
16 000
14 000
12 000
10 000
8 000
6 000
4 000
2 000
0
Pri
or
year
Net
inte
rest
inco
me
Fee
s &
co
mm
s
Tra
din
g re
ven
ue
Imp
airm
ents
Sta
ff c
ost
s
Oth
er o
pex
Tax
atio
n
Act
ual
21 605
670
2724
5314
809327 424
12 870
Standard Bank (Mauritius) Limited annual report 2016 21
2016 was a challenging year for Investment Banking (IB), with total revenues, comprising of net interest income and fee based income dropping by 54% to reach USD2,8 million. IB contributed to only 9.7% to the Bank’s operating income. NII fell significantly year on year, attributable to the IB revised strategy being embedded late in the year, coupled with the exit of a few remaining cross border assets, as well as some early settlement of term facilities. Fees and commission income declined by 42% from prior year on account of non-recurrence fees, owing to early settlement of some cross-border assets in 2015.
Wealth and investment contributed 2.7% to total operating income, with NII growing by 98% to close at USD636 000, attributable to higher funding income on the deposit base in 2016. Fees and commission dropped by 18% to reach USD187 000 on account of lower transactional fees.
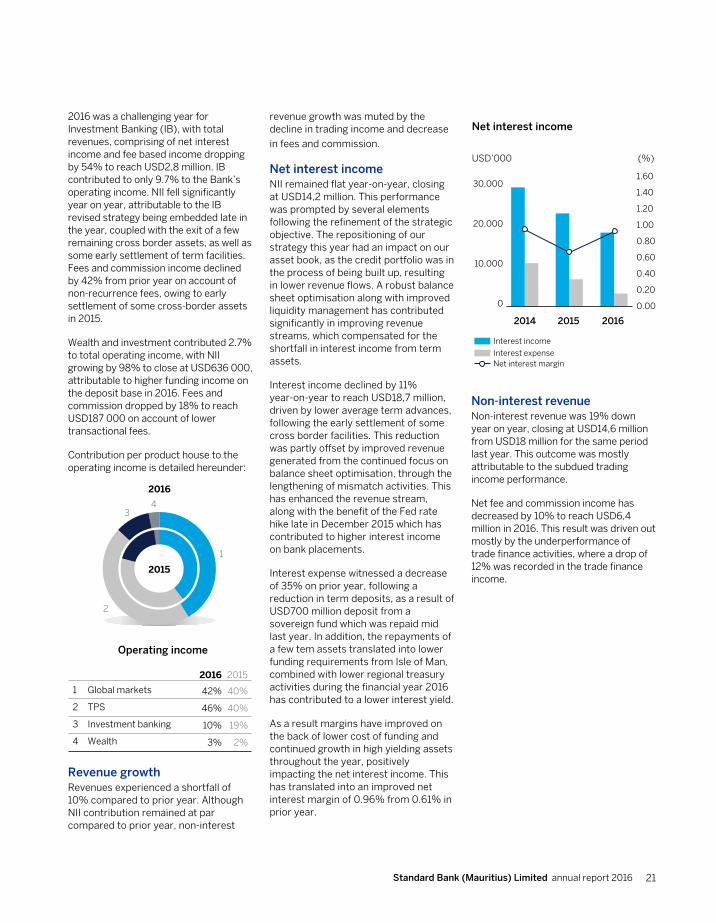
Contribution per product house to the operating income is detailed hereunder:
Non-interest revenueNon-interest revenue was 19% down year on year, closing at USD14,6 million from USD18 million for the same period last year. This outcome was mostly attributable to the subdued trading income performance.
Net fee and commission income has decreased by 10% to reach USD6,4 million in 2016. This result was driven out mostly by the underperformance of trade finance activities, where a drop of 12% was recorded in the trade finance income.
revenue growth was muted by the decline in trading income and decrease
in fees and commission.
Net interest incomeNII remained flat year-on-year, closing at USD14,2 million. This performance was prompted by several elements following the refinement of the strategic objective. The repositioning of our strategy this year had an impact on our asset book, as the credit portfolio was in the process of being built up, resulting in lower revenue flows. A robust balance sheet optimisation along with improved liquidity management has contributed significantly in improving revenue streams, which compensated for the shortfall in interest income from term assets.
Interest income declined by 11% year-on-year to reach USD18,7 million, driven by lower average term advances, following the early settlement of some cross border facilities. This reduction was partly offset by improved revenue generated from the continued focus on balance sheet optimisation, through the lengthening of mismatch activities. This has enhanced the revenue stream, along with the benefit of the Fed rate hike late in December 2015 which has contributed to higher interest income on bank placements.
Interest expense witnessed a decrease of 35% on prior year, following a reduction in term deposits, as a result of USD700 million deposit from a sovereign fund which was repaid mid last year. In addition, the repayments of a few tem assets translated into lower funding requirements from Isle of Man, combined with lower regional treasury activities during the financial year 2016 has contributed to a lower interest yield.
As a result margins have improved on the back of lower cost of funding and continued growth in high yielding assets throughout the year, positively impacting the net interest income. This has translated into an improved net interest margin of 0.96% from 0.61% in prior year.
Operating income
42%
46%
10%
3%
40%
40%
19%
2%
2016 2015
1 Global markets
2 TPS
3 Investment banking
4 Wealth
1
2
34
2016
2015
Net interest income
30,000
20,000
10,000
0
1.60
1.40
1.20
1.00
0.80
0.60
0.40
0.20
0.00
2014 20162015
(%)USD’000
Interest income
Interest expenseNet interest margin
Revenue growthRevenues experienced a shortfall of 10% compared to prior year. Although NII contribution remained at par compared to prior year, non-interest
22
BUSINESS REVIEW Management discussion and analysis continued
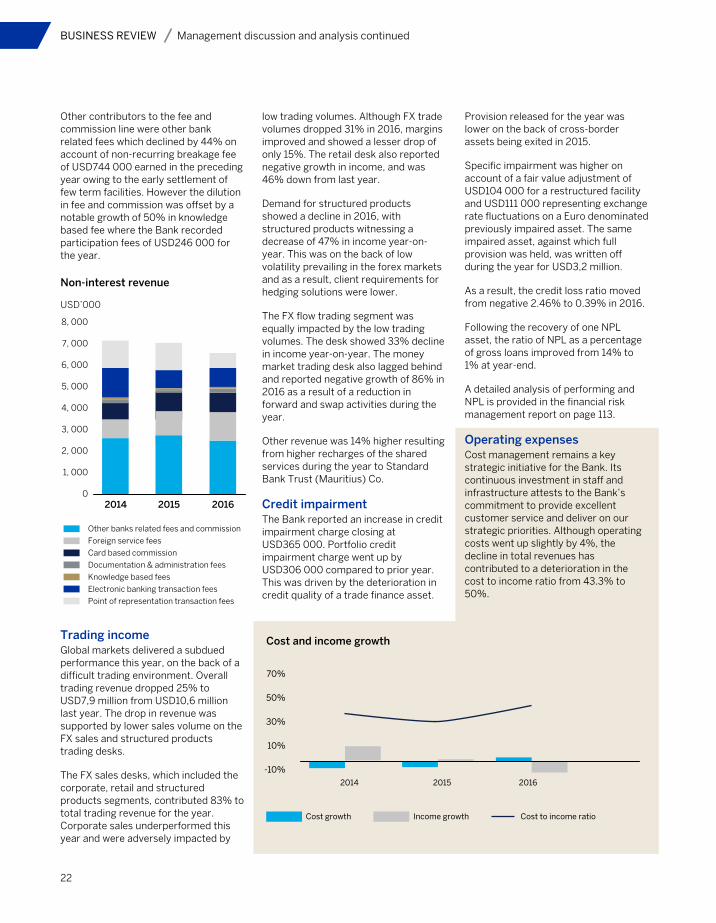
Other contributors to the fee and commission line were other bank related fees which declined by 44% on account of non-recurring breakage fee of USD744 000 earned in the preceding year owing to the early settlement of few term facilities. However the dilution in fee and commission was offset by a notable growth of 50% in knowledge based fee where the Bank recorded participation fees of USD246 000 for the year.
Trading incomeGlobal markets delivered a subdued performance this year, on the back of a difficult trading environment. Overall trading revenue dropped 25% to USD7,9 million from USD10,6 million last year. The drop in revenue was supported by lower sales volume on the FX sales and structured products trading desks.
The FX sales desks, which included the corporate, retail and structured products segments, contributed 83% to total trading revenue for the year. Corporate sales underperformed this year and were adversely impacted by
low trading volumes. Although FX trade volumes dropped 31% in 2016, margins improved and showed a lesser drop of only 15%. The retail desk also reported negative growth in income, and was 46% down from last year.
Demand for structured products showed a decline in 2016, with structured products witnessing a decrease of 47% in income year-on-year. This was on the back of low volatility prevailing in the forex markets and as a result, client requirements for hedging solutions were lower.
The FX flow trading segment was equally impacted by the low trading volumes. The desk showed 33% decline in income year-on-year. The money market trading desk also lagged behind and reported negative growth of 86% in 2016 as a result of a reduction in forward and swap activities during the year.
Other revenue was 14% higher resulting from higher recharges of the shared services during the year to Standard Bank Trust (Mauritius) Co.
Credit impairmentThe Bank reported an increase in credit impairment charge closing at USD365 000. Portfolio credit impairment charge went up by USD306 000 compared to prior year. This was driven by the deterioration in credit quality of a trade finance asset.
Provision released for the year was lower on the back of cross-border assets being exited in 2015.
Specific impairment was higher on account of a fair value adjustment of USD104 000 for a restructured facility and USD111 000 representing exchange rate fluctuations on a Euro denominated previously impaired asset. The same impaired asset, against which full provision was held, was written off during the year for USD3,2 million.
As a result, the credit loss ratio moved from negative 2.46% to 0.39% in 2016.
Following the recovery of one NPL asset, the ratio of NPL as a percentage of gross loans improved from 14% to 1% at year-end.
A detailed analysis of performing and NPL is provided in the financial risk management report on page 113.
Operating expensesCost management remains a key strategic initiative for the Bank. Its continuous investment in staff and infrastructure attests to the Bank’s commitment to provide excellent customer service and deliver on our strategic priorities. Although operating costs went up slightly by 4%, the decline in total revenues has contributed to a deterioration in the cost to income ratio from 43.3% to 50%.
2015 20162014
Non-interest revenue
USD’000
8, 000
7, 000
6, 000
5, 000
4, 000
3, 000
2, 000
1, 000
0
Other banks related fees and commission
Foreign service fees
Card based commission
Documentation & administration fees
Knowledge based fees
Electronic banking transaction fees
Point of representation transaction fees
Cost and income growth
70%
50%
30%
10%
-10%
201620152014
Cost growth Income growth Cost to income ratio

Standard Bank (Mauritius) Limited annual report 2016 23
Staff costs grew by 7% in 20161. Fixed remuneration was up by 6% due on the back of increased headcount moving from 120 to 131. Variable costs rose by 9% due to higher non-permanent headcount to support the Bank’s various initiatives.
TaxFor most of 2016, the Bank benefited from a reduced corporate tax charge as a result of tax losses brought forward from the previous year. An additional write off of USD3,2 million, relating to one previously impaired facility, further increased the tax loss during the year. At year-end, the Bank had fully utilised its tax losses.
As a result, the corporate tax charge for 2016 was mainly driven by the special levy. Deferred tax movements, originated by the full utilisation of the brought forward tax loss, also contributed to a significant part of the total tax charge for 2016.
The effective tax rate of the Bank as a percentage of the total tax charge to the profit before tax moved from 7% to 8% in 2016.
DividendsDividends of USD20 million were paid to Stanbic Africa Holdings Ltd, the Bank’s shareholder during the year.
Statement of financial positionTotal assets increased by 8% to USD1.5 billion compared to prior year, as a result of an increase in bank placements, driven by higher customer deposits. Deposits from banks increased as a result of higher balances on operational accounts in December 2016. Borrowing from Standard Bank Isle of Man was down as repayment of term assets translated into lower funding requirements.
Cash and cash equivalentsCash and balances with banks increased by 11% to reach USD955 million as a result of higher placements with group banks, on the back of a higher customer deposit base at year-end.
Carving out for the staff cost recharges refund of USD370 000 mentioned previously, other operating expenses have remained flat year-on-year. An increase of 15% in other controllable costs was witnessed, owing to costs associated with team building and recognition awards. Additional intercompany costs now recharged to the Bank also lead to the increase in other controllable cost. IT support cost, professional fees and premises costs have decreased due to operational efficiencies across the Bank.
Staff cost expensesStaff cost
Fixed remuneration
Variable remuneration and other costs
Total staff costs
Operating expensesOther operating expenses
IT support costsDepreciation and amortisationProfessional feesFixed assets written offPremisesOther
Total other operating costs
Total operating costs
Cost to income ratio
Dec 2014USD’000
4 239
3 015
7 254
Dec 2014USD’000
353903
1 362-
1 0933 841
7 552
14 806
45.96%
Dec 2015USD’000
3 996
2 533
6 529
Dec 2015USD’000
874795
1 541-
9073 302
7 419
13 948
43.32%
Dec 2016USD’000
4 220
2 755
6 975
Dec 2016USD’000
833852
1 082-
8994 263
7 929
14 905
50.04%
1regional staff costs recharges of USD370 000 were reallocated from staff costs to operating expenses in 2016.
24
BUSINESS REVIEW Management discussion and analysis continued
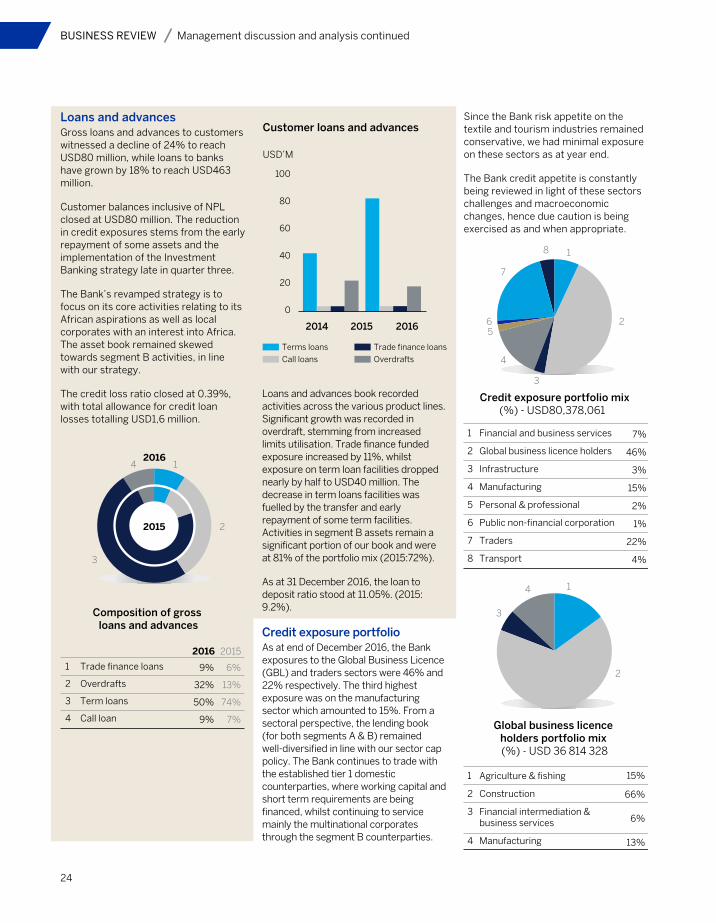
Loans and advancesGross loans and advances to customers witnessed a decline of 24% to reach USD80 million, while loans to banks have grown by 18% to reach USD463 million.
Customer balances inclusive of NPL closed at USD80 million. The reduction in credit exposures stems from the early repayment of some assets and the implementation of the Investment Banking strategy late in quarter three.
The Bank’s revamped strategy is to focus on its core activities relating to its African aspirations as well as local corporates with an interest into Africa. The asset book remained skewed towards segment B activities, in line with our strategy.
The credit loss ratio closed at 0.39%, with total allowance for credit loan losses totalling USD1,6 million.
Since the Bank risk appetite on the textile and tourism industries remained conservative, we had minimal exposure on these sectors as at year end.
The Bank credit appetite is constantly being reviewed in light of these sectors challenges and macroeconomic changes, hence due caution is being exercised as and when appropriate.
Loans and advances book recorded activities across the various product lines. Significant growth was recorded in overdraft, stemming from increased limits utilisation. Trade finance funded exposure increased by 11%, whilst exposure on term loan facilities dropped nearly by half to USD40 million. The decrease in term loans facilities was fuelled by the transfer and early repayment of some term facilities. Activities in segment B assets remain a significant portion of our book and were at 81% of the portfolio mix (2015:72%).
As at 31 December 2016, the loan to deposit ratio stood at 11.05%. (2015: 9.2%).
Credit exposure portfolioAs at end of December 2016, the Bank exposures to the Global Business Licence (GBL) and traders sectors were 46% and 22% respectively. The third highest exposure was on the manufacturing sector which amounted to 15%. From a sectoral perspective, the lending book (for both segments A & B) remained well-diversified in line with our sector cap policy. The Bank continues to trade with the established tier 1 domestic counterparties, where working capital and short term requirements are being financed, whilst continuing to service mainly the multinational corporates through the segment B counterparties.
Composition of gross loans and advances
9%
32%
50%
9%
6%
13%
74%
7%
2016 2015
1 Trade finance loans
2 Overdrafts
3 Term loans
4 Call loan
1
2
3
42016
2015
Customer loans and advances
100
80
60
40
20
0
2014 20162015
USD’M
Terms loans
Call loans
Trade finance loans
Overdrafts
7%
46%
3%
15%
2%
1%
22%
4%
1 Financial and business services
2 Global business licence holders
3 Infrastructure
4 Manufacturing
5 Personal & professional
6 Public non-financial corporation
7 Traders
8 Transport
1
2
3
4
56
7
8
Credit exposure portfolio mix (%) - USD80,378,061
15%
66%
6%
13%
1 Agriculture & fishing
2 Construction
3 Financial intermediation & business services
4 Manufacturing
1
2
3
4
Global business licence holders portfolio mix (%) - USD 36 814 328
Standard Bank (Mauritius) Limited annual report 2016 25
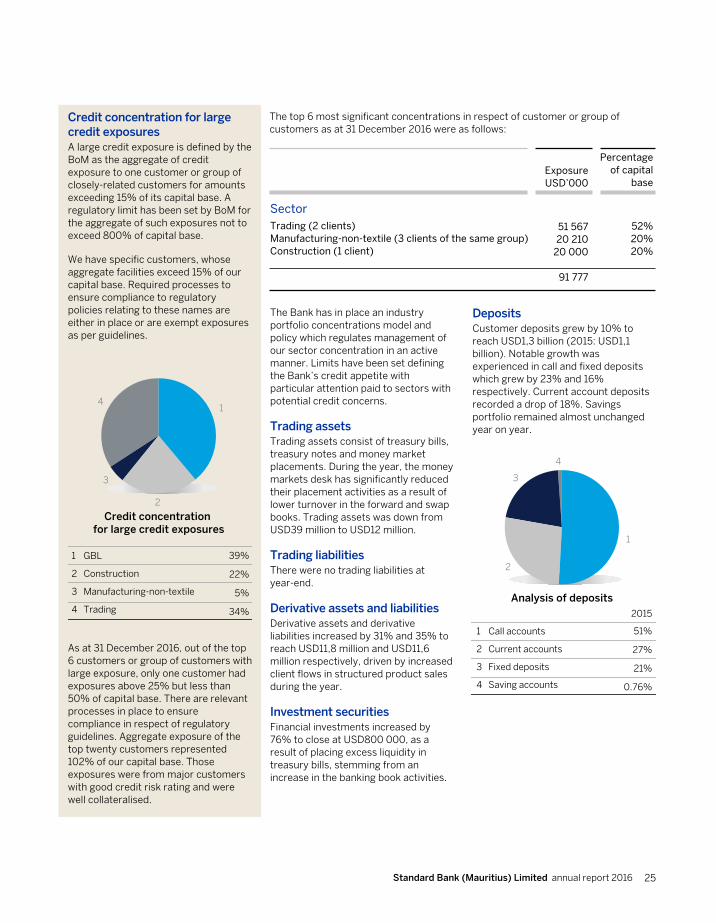
Credit concentration for large credit exposuresA large credit exposure is defined by the BoM as the aggregate of credit exposure to one customer or group of closely-related customers for amounts exceeding 15% of its capital base. A regulatory limit has been set by BoM for the aggregate of such exposures not to exceed 800% of capital base.
We have specific customers, whose aggregate facilities exceed 15% of our capital base. Required processes to ensure compliance to regulatory policies relating to these names are either in place or are exempt exposures as per guidelines.
The Bank has in place an industry portfolio concentrations model and policy which regulates management of our sector concentration in an active manner. Limits have been set defining the Bank’s credit appetite with particular attention paid to sectors with potential credit concerns.
Trading assetsTrading assets consist of treasury bills, treasury notes and money market placements. During the year, the money markets desk has significantly reduced their placement activities as a result of lower turnover in the forward and swap books. Trading assets was down from USD39 million to USD12 million.
Trading liabilitiesThere were no trading liabilities at year-end.
Derivative assets and liabilitiesDerivative assets and derivative liabilities increased by 31% and 35% to reach USD11,8 million and USD11,6 million respectively, driven by increased client flows in structured product sales during the year.
Investment securitiesFinancial investments increased by 76% to close at USD800 000, as a result of placing excess liquidity in treasury bills, stemming from an increase in the banking book activities.
DepositsCustomer deposits grew by 10% to reach USD1,3 billion (2015: USD1,1 billion). Notable growth was experienced in call and fixed deposits which grew by 23% and 16% respectively. Current account deposits recorded a drop of 18%. Savings portfolio remained almost unchanged year on year.
As at 31 December 2016, out of the top 6 customers or group of customers with large exposure, only one customer had exposures above 25% but less than 50% of capital base. There are relevant processes in place to ensure compliance in respect of regulatory guidelines. Aggregate exposure of the top twenty customers represented 102% of our capital base. Those exposures were from major customers with good credit risk rating and were well collateralised.
The top 6 most significant concentrations in respect of customer or group of customers as at 31 December 2016 were as follows:
39%
22%
5%
34%
1 GBL
2 Construction
3 Manufacturing-non-textile
4 Trading
1
2
3
4
Credit concentration for large credit exposures
SectorTrading (2 clients)Manufacturing-non-textile (3 clients of the same group)Construction (1 client)
ExposureUSD’000
51 56720 210
20 000
91 777
Percentage of capital
base
52%20%20%
51%
27%
21%
0.76%
1 Call accounts
2 Current accounts
3 Fixed deposits
4 Saving accounts
1
2
3
4
Analysis of deposits2015
26
BUSINESS REVIEW Management discussion and analysis continued
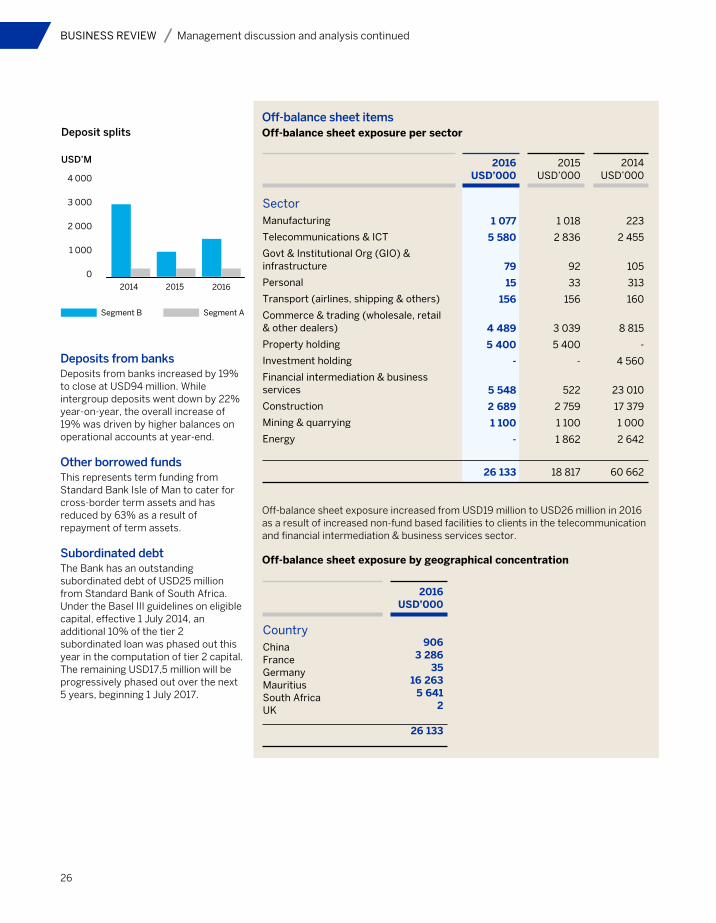
Deposits from banksDeposits from banks increased by 19% to close at USD94 million. While intergroup deposits went down by 22% year-on-year, the overall increase of 19% was driven by higher balances on operational accounts at year-end.
Other borrowed fundsThis represents term funding from Standard Bank Isle of Man to cater for cross-border term assets and has reduced by 63% as a result of repayment of term assets.
Subordinated debtThe Bank has an outstanding subordinated debt of USD25 million from Standard Bank of South Africa. Under the Basel III guidelines on eligible capital, effective 1 July 2014, an additional 10% of the tier 2 subordinated loan was phased out this year in the computation of tier 2 capital. The remaining USD17,5 million will be progressively phased out over the next 5 years, beginning 1 July 2017.
Off-balance sheet exposure increased from USD19 million to USD26 million in 2016 as a result of increased non-fund based facilities to clients in the telecommunication and financial intermediation & business services sector.
Off-balance sheet exposure by geographical concentration
Deposit splits
USD’M
4 000
3 000
2 000
1 000
02014 2015 2016
Segment B Segment A
SectorManufacturing
Telecommunications & ICT
Govt & Institutional Org (GIO) & infrastructure
Personal
Transport (airlines, shipping & others)
Commerce & trading (wholesale, retail & other dealers)
Property holding
Investment holding
Financial intermediation & business services
Construction
Mining & quarrying
Energy
2014USD’000
223
2 455
105
313
160
8 815
-
4 560
23 010
17 379
1 000
2 642
60 662
2015USD’000
1 018
2 836
92
33
156
3 039
5 400
-
522
2 759
1 100
1 862
18 817
2016USD’000
1 077
5 580
79
15
156
4 489
5 400
-
5 548
2 689
1 100
-
26 133
Off-balance sheet itemsOff-balance sheet exposure per sector
CountryChinaFranceGermanyMauritiusSouth AfricaUK
2016USD’000
9063 286
3516 263
5 6412
26 133

Standard Bank (Mauritius) Limited annual report 2016 27
Credit qualityThe NPLs ratio to total loans fell from 14% to 1% as at end of December 2016. The Bank recovered on one NPL asset and no new account was classified during the year. The Bank proceeded with the write-off of the remaining balance of one recovered facility which was fully provisioned.
Credit impairment provision stood at USD1,6 million at the end of the financial year. USD695 000 was raised under the Performing Portfolio Provisioning (PPP) together with an additional USD68 000 to align to the regulatory rate of 1% charged on the Bank’s loan portfolio. To maintain the 1% provision, in line with the BoM guidelines, the difference is being appropriated from retained earnings to a statutory credit risk reserve.
The Bank also raised additional portfolio provisioning of 1% representing USD8 000 on exposures in the personal sector, in line with the macro prudential policy measures guideline. A detailed analysis of performing and non-performing loans is provided in the financial risk management section on pages 113-114.
The quality of the lending book remains healthy with only one asset classified as impaired, duly provisioned for. The Bank nevertheless has managed to complete the recovery on an NPL asset within the property sector. Legal action is still in progress on the other NPL names. Our credit appetite on sector exposure is being managed within the Bank’s approved framework to ensure acceptable level of concentration of risk and cross-border activities are managed under our country risk management policy. This policy is in line with regulatory requirement and our business strategic deliverables as far as asset build up is concerned.
Sectors which are still under close watch remain the textile, property sector, construction and recently the Global Business Licence sector with cross-border trade financing. The Bank has adopted a conservative approach vis-a-vis these sectors and exposures are being managed rigorously.
Renegotiated loans and advances are exposures, which have been refinanced, rescheduled or otherwise modified, following weaknesses in the counterparty’s financial position. Loan renegotiated in 2016 that would otherwise be past due was USD7,3 million, relating to a trade finance facility. In line with central bank requirement following the implementation of the revised guideline on credit impairment measurement and income recognition, a fair value adjustment of USD104 000 was raised at year-end.
Provisioning and asset qualityProvisions at beginning of the year
Provisions made during the year
Provisions released during the year
Amounts written off
Bad debts recovered
Transfer to other liabilities2
Provisions at end of the year
Key ratios (%)
Income statement charge to total loans
Total provisioning to non-performing loans
Specific provisions to impaired credits
Total provisions to total loans
2014USD
58 880 650
1 782 619
(2 580 110)
(27 311 533)
(328 000)
-
30 443 626
-0.33
75.69
0.44
10.86
2015USD
30 443 626
596 382
(2 641 397)
(19 993 815)
(2 904 451)
-
5 500 345
2.46
36.89
20.28
28.65
2016USD
5 500 345
685 165
(325 705)
(3 222 809)
-
(1 000 000)
1 636 996
0.45
201.60
115.98
2.04
2Relates to reclassification of land transfer tax provision incurred on account of impaired facility from specific provisioning to other liabilities.

28
BUSINESS REVIEW Management discussion and analysis continued
Risk managementIntroductionEffective risk management is fundamental to the successful execution of the Bank’s strategy, as it pursues its vision to build the leading financial organisation in, for and across Africa. The role of the risk management function is to ensure that the full spectrum of risks faced by the Bank are properly identified, assessed, measured and managed in the pursuit of its goals.
The Bank’s approach to managing risk is to adopt a risk and governance framework that enables management to maximise risk adjusted returns while remaining within the board-approved risk appetite and risk tolerance levels. This approach ultimately ensures the protection of the Bank’s reputation and is consistent with our objective of increasing shareholder value. The material types of risks the Bank’s faces are as per below.
Risk management frameworkThe Bank‘s philosophy is that responsibility for risk management resides at all levels within the Bank and therefore uses the three lines of defence model which promotes transparency, accountability and consistency through clear identification and segregation of risks.
The first line of defence has the responsibility to identify and manage risks on a day-to-day basis at an operational level in accordance with agreed appetite, policies and controls.
Effective first line of defence includes:
•• the proactive self-identification of issues and risks including emerging risks across every business unit;
•• the design, implementation and ownership of appropriate controls;
•• the associated operational control remediation; and
•• a strong culture of transparent and effective risk partnership.
The second line of defence functions provides independent oversight and assurance and ensure that specific risks are managed effectively as close to the source as possible. It sets the frameworks within the parameters set by the Board and reports to management and board governance committees.
The third line of defence is Internal Audit who provide an independent and objective assurance to the Board and senior management on the effectiveness of the first and second lines of defence.
Credit risk
Market risk
Liquidity risk
Compliance risk
Operational risk
Country risk
Types of risk
Control or mitigate
Measure and monitor
Structure
Governance
Management information and reporting
Risk appetite
Assess
Identify
Risk management
process
Risk management framework

Standard Bank (Mauritius) Limited annual report 2016 29
GovernanceGovernance documents comprise standards, frameworks and policies which set out the requirements for effective oversight of risks. These governance documentations are approved by the relevant board or management committees and are aligned to the Group’s standards and frameworks.
Risk governance standards have been developed for all major risk types that the Bank’s is exposed to and ensures that all material risks to the Bank’s strategic and
financial objectives are identified and managed proactively. The risk governance standards are part of the Group’s governance infrastructure, reflecting the expectations and requirements of the Board and its committees in respect of key risk areas. The standards set out minimum control requirements and ensure alignment and consistency in the manner in which the major risk types and capital management metrics across the Bank are dealt with, from identification to reporting. These standards are localised to recognise in-country laws and regulations.
Policies are developed where required on specific items as stated within the standards and are reviewed every two years or earlier if required. Details with regards to the implementation of these policies within each particular business unit are set out in the processes and procedures manual. Compliance with the standards, policies and procedures is controlled by the risk management team through annual self-assessments by business units and independent reviews by the third line of defence functions.
Board
Board sub-committees
Conduct review and risk committee
Asset and liability management
committee
Management and oversight of
Interest rate riskLiquidity riskMarket risk
Management and oversight of
Compliance riskLegal risk
Operational riskReputational risk
Management and oversight of
Credit risk
Management and oversight of
New/amendedproducts,services,
business process
Management and oversight of
Procurementstrategies &
recommendations
Operational risk and compliance
committee
Credit risk management
committee
New products committee
Procurement committee
Credit committeeAudit committee
Executive Committee (EXCO)
Group internal audit
Chief executive
Structure
30
BUSINESS REVIEW Management discussion and analysis continued
Board and sub-committeesThe Board of the Bank has ultimate responsibility for the oversight of risk. The Bank’s approach to managing risk is to adopt a risk and governance framework that enables management to maximise risk adjusted returns while remaining within the Board-approved risk appetite and risk tolerance levels. As at 31 December 2016, the Board is satisfied that:
•• the Bank’s risk management controls and processes generally operated effectively;
•• the Banks activities have been managed within the Banks’ risk appetite and strategy; and
•• the Bank is adequately capitalised to execute its strategy.
In instances where the Bank breached risk appetite the Board is satisfied that management have taken appropriate remedial action.
Management committeesDetails of the management committees such as Executive Committee (EXCO), Asset and Liability Management Committee (ALCO), Operational Risk and Compliance Committee (OPCO) and Credit Risk Management Committee (CRMC) are provided in the corporate governance report section of this annual report starting from page 49. Other committees of the Bank are:
New products committeeThe purpose of the New Products Committee (NPC) is to facilitate the introduction of new products, services, businesses, legal entities systems or processes in a coordinated and effective manner which is consistent with our overall strategic, business and risk management focus.
The objectives of the NPC are:
•• to ensure that any significant risks that could arise from the introduction or amendment of businesses, products or services, systems and processes are properly identified and appropriately addressed by the relevant parties;
•• to achieve greater consistency in decision-making through standardising the requirements for the approval process of new products;
•• to ensure that feasible and viable support and control processes and systems are in place to support the deployment of new products;
•• to ensure that risks from interdependencies associated with the roll out of CIB products across multiple African countries are properly identified and mitigated in a coherent manner; and
•• to ensure adequate control and effective maintenance of the NPC process itself.
The NPC is a sub-committee of EXCO, chaired by chief finance officer and consists of a minimum of five EXCO members depending on the type of product/service being introduced. The NPC meets as and when required.
Procurement committeeThe procurement committee meets on a monthly basis, is comprised of permanent members being the chief finance officer (chairperson), head: risk, head: legal and procurement manager.
The purpose of the procurement committee is to ensure that the procurement strategies and recommendations are viewed in a systematic and consistent manner, according to our business priorities, commercial standards and ethical principles before making commitments to suppliers.
Risk management The risk management team provides the day-to-day oversight on management of risk and promotes the risk culture across the Bank. It is responsible to create and maintain the risk practices across the Bank as defined by group risk and to ensure that controls are in place for all risk categories.
The risk management team maintains its objectivity by being independent of operations. The head: risk has a direct reporting line into the country chief executive and to the regional head: risk, East Africa.
The risk function is subject to internal audits from group internal audit on an annual basis where it is assessed by specialised teams for each of the different types of risk. Internal audit provides an annual assessment on the adequacy and effectiveness of the Bank’s processes for controlling its activities, managing its risks and ensuring good governance. It reports and provides recommendations on significant issues related to the risk management, control and governance processes within the Bank.
For the past five years, the risk function has been awarded clean internal audit reports with no significant findings which can be translated in a control environment that is well managed, strong and mature in its approach.
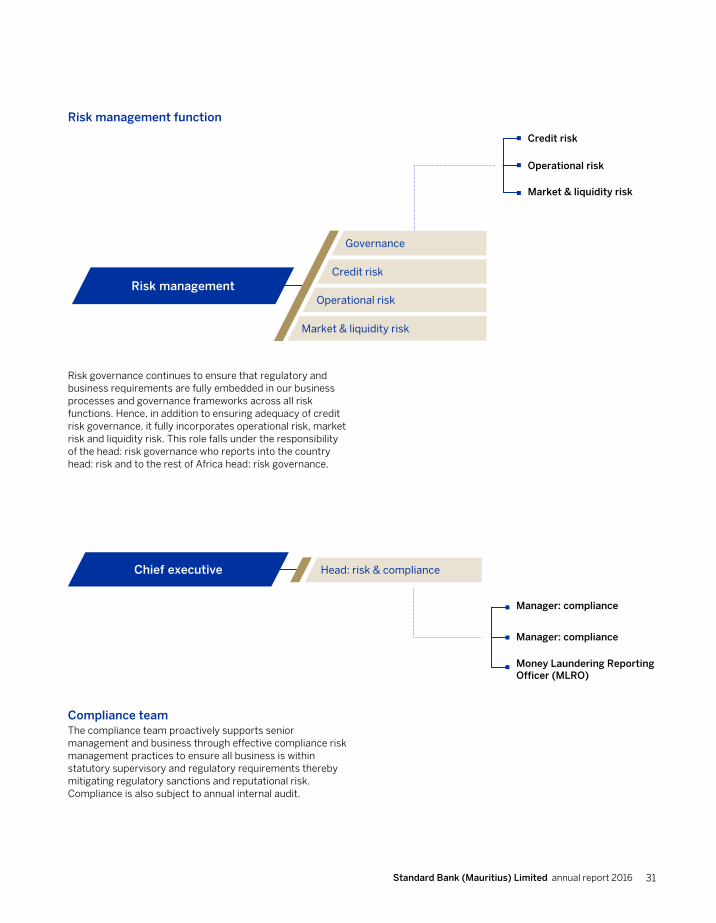
Standard Bank (Mauritius) Limited annual report 2016 31
Risk governance continues to ensure that regulatory and business requirements are fully embedded in our business processes and governance frameworks across all risk functions. Hence, in addition to ensuring adequacy of credit risk governance, it fully incorporates operational risk, market risk and liquidity risk. This role falls under the responsibility of the head: risk governance who reports into the country head: risk and to the rest of Africa head: risk governance.
Risk management function
Credit risk
Operational risk
Market & liquidity risk
Risk managementCredit risk
Governance
Operational risk
Market & liquidity risk
Manager: compliance
Manager: compliance
Money Laundering Reporting Officer (MLRO)
Chief executive Head: risk & compliance
Compliance teamThe compliance team proactively supports senior management and business through effective compliance risk management practices to ensure all business is within statutory supervisory and regulatory requirements thereby mitigating regulatory sanctions and reputational risk. Compliance is also subject to annual internal audit.
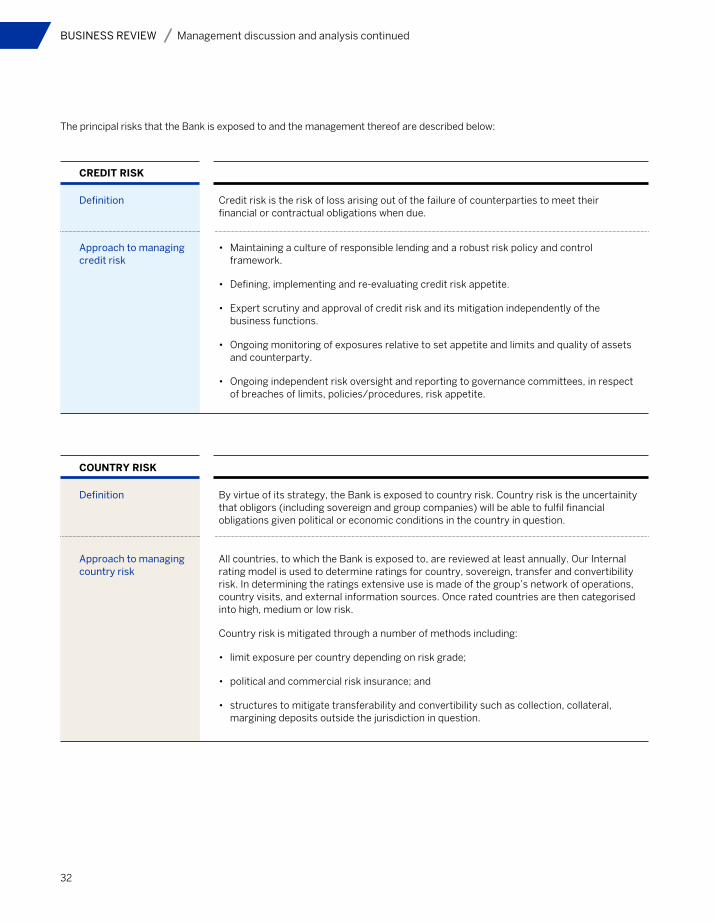
32
BUSINESS REVIEW Management discussion and analysis continued
The principal risks that the Bank is exposed to and the management thereof are described below:
CREDIT RISK
COUNTRY RISK
Definition
Definition
Approach to managing credit risk
Approach to managing country risk
Credit risk is the risk of loss arising out of the failure of counterparties to meet their financial or contractual obligations when due.
By virtue of its strategy, the Bank is exposed to country risk. Country risk is the uncertainity that obligors (including sovereign and group companies) will be able to fulfil financial obligations given political or economic conditions in the country in question.
• Maintaining a culture of responsible lending and a robust risk policy and control framework.
• Defining, implementing and re-evaluating credit risk appetite.
• Expert scrutiny and approval of credit risk and its mitigation independently of the business functions.
• Ongoing monitoring of exposures relative to set appetite and limits and quality of assets and counterparty.
• Ongoing independent risk oversight and reporting to governance committees, in respect of breaches of limits, policies/procedures, risk appetite.
All countries, to which the Bank is exposed to, are reviewed at least annually. Our Internal rating model is used to determine ratings for country, sovereign, transfer and convertibility risk. In determining the ratings extensive use is made of the group’s network of operations, country visits, and external information sources. Once rated countries are then categorised into high, medium or low risk.
Country risk is mitigated through a number of methods including:
• limit exposure per country depending on risk grade;
• political and commercial risk insurance; and
• structures to mitigate transferability and convertibility such as collection, collateral, margining deposits outside the jurisdiction in question.
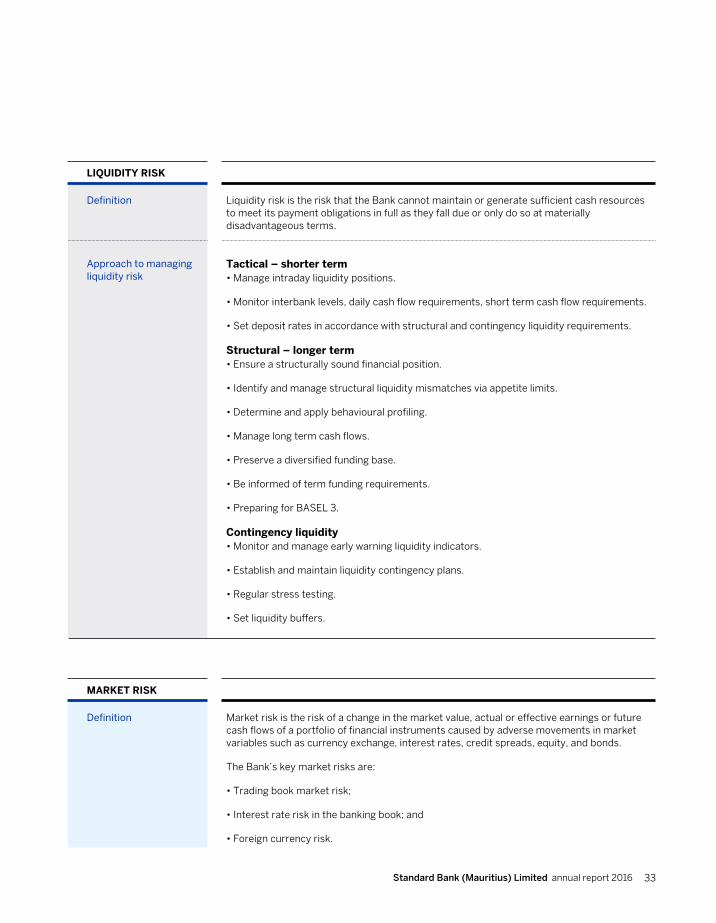
Standard Bank (Mauritius) Limited annual report 2016 33
LIQUIDITY RISK
MARKET RISK
Definition
Definition
Approach to managing liquidity risk
Liquidity risk is the risk that the Bank cannot maintain or generate sufficient cash resources to meet its payment obligations in full as they fall due or only do so at materially disadvantageous terms.
Market risk is the risk of a change in the market value, actual or effective earnings or future cash flows of a portfolio of financial instruments caused by adverse movements in market variables such as currency exchange, interest rates, credit spreads, equity, and bonds.
The Bank’s key market risks are:
• Trading book market risk;
• Interest rate risk in the banking book; and
• Foreign currency risk.
Tactical – shorter term• Manage intraday liquidity positions.
• Monitor interbank levels, daily cash flow requirements, short term cash flow requirements.
• Set deposit rates in accordance with structural and contingency liquidity requirements.
Structural – longer term• Ensure a structurally sound financial position.
• Identify and manage structural liquidity mismatches via appetite limits.
• Determine and apply behavioural profiling.
• Manage long term cash flows.
• Preserve a diversified funding base.
• Be informed of term funding requirements.
• Preparing for BASEL 3.
Contingency liquidity• Monitor and manage early warning liquidity indicators.
• Establish and maintain liquidity contingency plans.
• Regular stress testing.
• Set liquidity buffers.
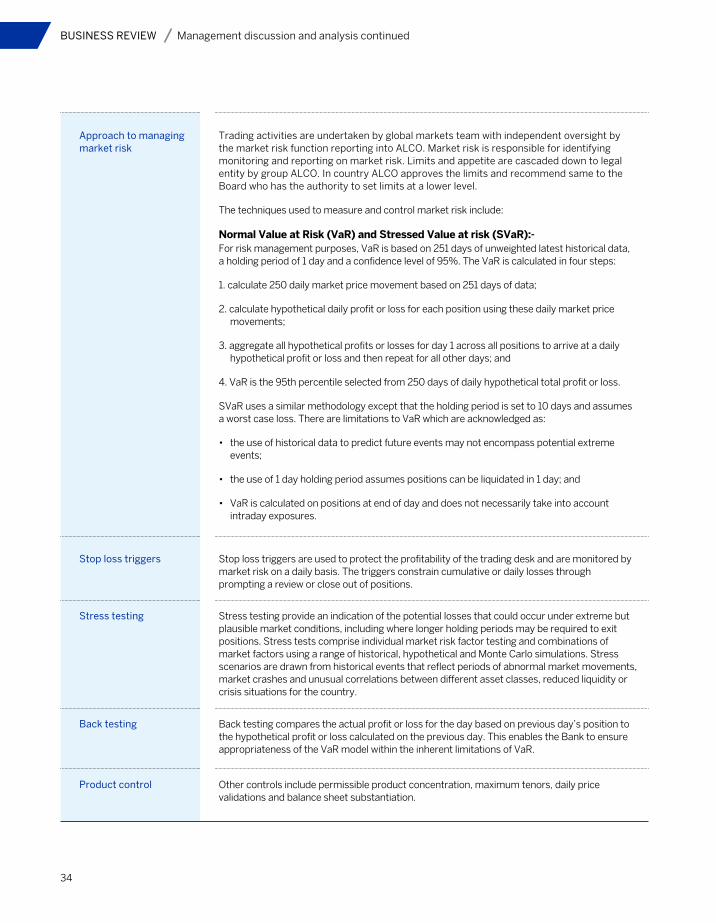
34
BUSINESS REVIEW Management discussion and analysis continued
Approach to managing market risk
Stop loss triggers
Stress testing
Back testing
Product control
Trading activities are undertaken by global markets team with independent oversight by the market risk function reporting into ALCO. Market risk is responsible for identifying monitoring and reporting on market risk. Limits and appetite are cascaded down to legal entity by group ALCO. In country ALCO approves the limits and recommend same to the Board who has the authority to set limits at a lower level.
The techniques used to measure and control market risk include:
Normal Value at Risk (VaR) and Stressed Value at risk (SVaR):-For risk management purposes, VaR is based on 251 days of unweighted latest historical data, a holding period of 1 day and a confidence level of 95%. The VaR is calculated in four steps:
1. calculate 250 daily market price movement based on 251 days of data;
2. calculate hypothetical daily profit or loss for each position using these daily market price movements;
3. aggregate all hypothetical profits or losses for day 1 across all positions to arrive at a daily hypothetical profit or loss and then repeat for all other days; and
4. VaR is the 95th percentile selected from 250 days of daily hypothetical total profit or loss.
SVaR uses a similar methodology except that the holding period is set to 10 days and assumes a worst case loss. There are limitations to VaR which are acknowledged as:
• the use of historical data to predict future events may not encompass potential extreme events;
• the use of 1 day holding period assumes positions can be liquidated in 1 day; and
• VaR is calculated on positions at end of day and does not necessarily take into account intraday exposures.
Stop loss triggers are used to protect the profitability of the trading desk and are monitored by market risk on a daily basis. The triggers constrain cumulative or daily losses through prompting a review or close out of positions.
Back testing compares the actual profit or loss for the day based on previous day’s position to the hypothetical profit or loss calculated on the previous day. This enables the Bank to ensure appropriateness of the VaR model within the inherent limitations of VaR.
Other controls include permissible product concentration, maximum tenors, daily price validations and balance sheet substantiation.
Stress testing provide an indication of the potential losses that could occur under extreme but plausible market conditions, including where longer holding periods may be required to exit positions. Stress tests comprise individual market risk factor testing and combinations of market factors using a range of historical, hypothetical and Monte Carlo simulations. Stress scenarios are drawn from historical events that reflect periods of abnormal market movements, market crashes and unusual correlations between different asset classes, reduced liquidity or crisis situations for the country.
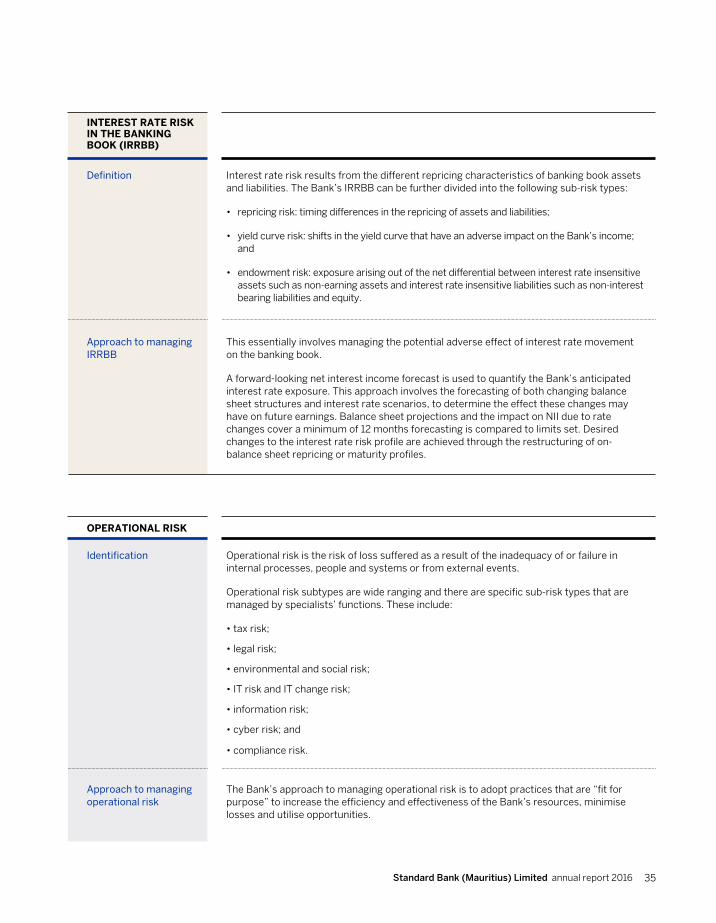
Standard Bank (Mauritius) Limited annual report 2016 35
INTEREST RATE RISK IN THE BANKING BOOK (IRRBB)
Definition
Approach to managing IRRBB
Approach to managing operational risk
Interest rate risk results from the different repricing characteristics of banking book assets and liabilities. The Bank’s IRRBB can be further divided into the following sub-risk types:
• repricing risk: timing differences in the repricing of assets and liabilities;
• yield curve risk: shifts in the yield curve that have an adverse impact on the Bank’s income; and
• endowment risk: exposure arising out of the net differential between interest rate insensitive assets such as non-earning assets and interest rate insensitive liabilities such as non-interest bearing liabilities and equity.
This essentially involves managing the potential adverse effect of interest rate movement on the banking book.
A forward-looking net interest income forecast is used to quantify the Bank’s anticipated interest rate exposure. This approach involves the forecasting of both changing balance sheet structures and interest rate scenarios, to determine the effect these changes may have on future earnings. Balance sheet projections and the impact on NII due to rate changes cover a minimum of 12 months forecasting is compared to limits set. Desired changes to the interest rate risk profile are achieved through the restructuring of on-balance sheet repricing or maturity profiles.
The Bank’s approach to managing operational risk is to adopt practices that are “fit for purpose” to increase the efficiency and effectiveness of the Bank’s resources, minimise losses and utilise opportunities.
OPERATIONAL RISK
Identification Operational risk is the risk of loss suffered as a result of the inadequacy of or failure in internal processes, people and systems or from external events.
Operational risk subtypes are wide ranging and there are specific sub-risk types that are managed by specialists’ functions. These include:
• tax risk;
• legal risk;
• environmental and social risk;
• IT risk and IT change risk;
• information risk;
• cyber risk; and
• compliance risk.
36
BUSINESS REVIEW Management discussion and analysis continued
The primary responsibility for managing operational risk forms part of the day-to-day responsibilities of management and employees at all levels. Business line management is ultimately responsible as the first line of defence for owning and managing risks resulting from their activities.
The well embedded operational risk framework sets out a structured, consistent approach for managing operational risk across the Bank and is based on the following core components:
Risk Controls Self-Assessment (RCSA)
Key risk Indicators (KRIs)
Incident management & reporting
Business Continuity Management (BCM)
The Bank inculcates the culture of self-assessment where each business unit/enabling function is required to analyse its business activities and critical processes to identify the key operational risks to which it is exposed, and assess the adequacy and effectiveness of its controls. For any area where management concludes that the level of residual risk is beyond an acceptable level, it is required to define action plans to reduce the level of risk. These assessments are facilitated, monitored and challenged by the operational risk team at least annually.
Indicators are used across the Bank to monitor the relevant risks and controls highlighted in the RCSA process.
The implementation of the KRI process is an integral element in providing an early warning indicator through trigger thresholds of a potential increase in risk exposure and/or a potential breakdown of controls. KRIs are reported on a monthly basis by business units to the operational risk team.
All operational risk incidents are recorded and reported. The definition of operational risk incidents includes not only events resulting in actual loss, but those resulting in non-financial impacts and near misses. This process is intended to enable the root cause of individual incidents, or trends of incidents, to be analysed and actions taken to reduce the risk of recurrence and enhance controls.
The Bank’s business continuity framework encompasses emergency response preparedness and crisis management capabilities to manage the business through a crisis to full recovery. Each business unit is responsible for their own BCM, closely supported by risk, who will provide the governance, steer, oversight and reporting of BCM status of readiness. There is a BCM Forum which meets on a half-yearly basis and is used to make tactical decisions around BCM. It is chaired by head: risk and attended by all business areas coordinators to discuss BCM activities such as recovery facilities, testing, awareness and simulations among others. Contingency and recovery plans for core services, key systems and priority business activities have been developed and are revisited annually as part of existing management processes to ensure that continuity strategies and plans remain relevant. The Bank has a fully equipped disaster recovery site which is also tested twice a year.
A monthly BCM management information report card provides the minimum standard of what needs to be in place with regards to business continuity, tracks progress and highlights gaps in the BCM programme. This report card is submitted on a monthly basis to head office and also tabled at the relevant governance committees.

Standard Bank (Mauritius) Limited annual report 2016 37
Risk appetite and stress testingThe risk appetite framework provides guidance on the following:
•• setting and cascading of risk appetite by the Group to the various legal entities;
•• measurements and methodology
•• governance;
•• monitoring and reporting of the risk profile; and
•• escalation and resolution.
Risk appetite is an expression of the amount or type of risk the Bank is willing to take to meet our financial and strategic objectives. It reflects the Bank’s capacity to sustain losses while continuing to meet obligations as they fall due under both normal and a range of stressed conditions. The metric is referred to as ‘risk appetite trigger’.
Risk tolerance is the maximum amount of risk that the Bank is prepared to tolerate above its risk appetite. The metric is referred to as ‘risk tolerance limit’.
Risk capacity is the maximum amount of risk the Bank is able to support within its available financial resources.
Risk Appetite Statement (RAS) is the documented expression of risk appetite and tolerance which has been approved by the Board. There are three levels of risk appetite.
Level 1 Risk appetite dimensions
Available financial resources and earnings volatility
Regulatory capital Economic capital
Stressed earnings Liquidity
Level 2 capital utilisation by risk type
Utilisation of available financial resources by different risk types
Credit risk Liquidity risk Operational risk
Market risk Interest rate risk
IT risk management IT risk encompasses IT risk and IT change risk. IT risk refers to the risks associated with the use, and adoption of IT within the Bank while IT change risk refers to risks arising from changes, updates made to IT infrastructure which if not properly managed could affect service reliability and availability. As technology becomes increasingly important and integrated into business processes, the need for effective management of IT risks becomes imperative.
The Bank’s main IT risks include the failure or interruption of critical systems leading to inability to service customers in a timely manner, cybercrime, unauthorised access to systems. Information risk management has become a key risk in banking that needs to be properly managed with the growing popularity of new generation infrastructure which is cloud-enabled. Cyber risks which may arise due to the disclosure, modification, destruction or theft of information, thus exposing the Bank to financial loss and reputation impact. These risks are mitigated through various controls which are implemented group-wide and closely monitored by management.
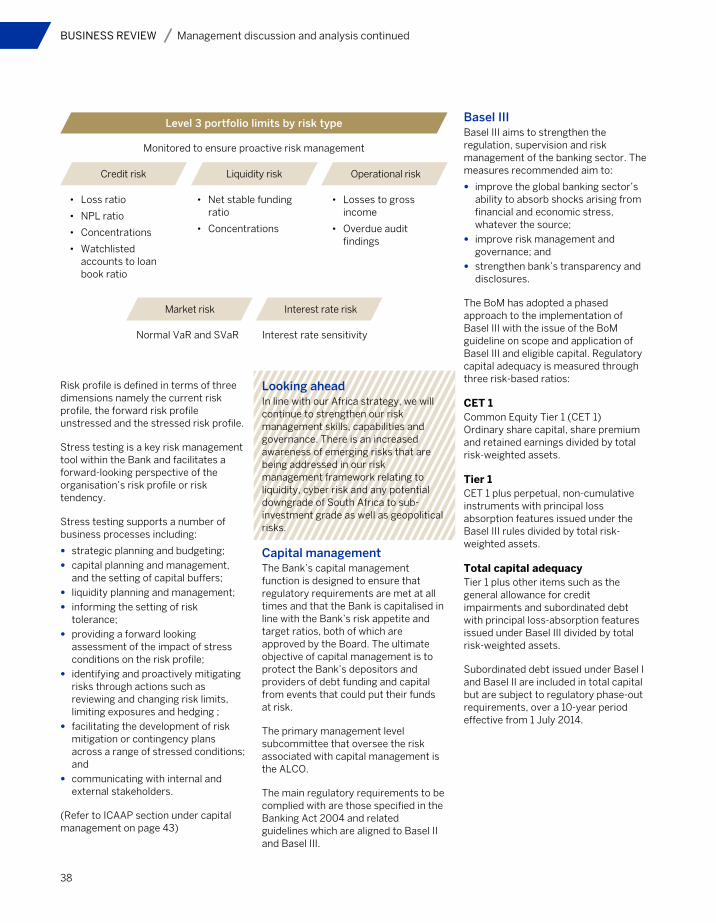
38
BUSINESS REVIEW Management discussion and analysis continued
Credit risk Liquidity risk
Level 3 portfolio limits by risk type
Monitored to ensure proactive risk management
• Loss ratio
• NPL ratio
• Concentrations
• Watchlisted accounts to loan book ratio
Normal VaR and SVaR Interest rate sensitivity
• Net stable funding ratio
• Concentrations
• Losses to gross income
• Overdue audit findings
Operational risk
Market risk Interest rate risk
Risk profile is defined in terms of three dimensions namely the current risk profile, the forward risk profile unstressed and the stressed risk profile.
Stress testing is a key risk management tool within the Bank and facilitates a forward-looking perspective of the organisation’s risk profile or risk tendency.
Stress testing supports a number of business processes including:
•• strategic planning and budgeting;
•• capital planning and management, and the setting of capital buffers;
•• liquidity planning and management;
•• informing the setting of risk tolerance;
•• providing a forward looking assessment of the impact of stress conditions on the risk profile;
•• identifying and proactively mitigating risks through actions such as reviewing and changing risk limits, limiting exposures and hedging ;
•• facilitating the development of risk mitigation or contingency plans across a range of stressed conditions; and
•• communicating with internal and external stakeholders.
(Refer to ICAAP section under capital management on page 43)
Looking aheadIn line with our Africa strategy, we will continue to strengthen our risk management skills, capabilities and governance. There is an increased awareness of emerging risks that are being addressed in our risk management framework relating to liquidity, cyber risk and any potential downgrade of South Africa to sub-investment grade as well as geopolitical risks.
Capital managementThe Bank’s capital management function is designed to ensure that regulatory requirements are met at all times and that the Bank is capitalised in line with the Bank’s risk appetite and target ratios, both of which are approved by the Board. The ultimate objective of capital management is to protect the Bank’s depositors and providers of debt funding and capital from events that could put their funds at risk.
The primary management level subcommittee that oversee the risk associated with capital management is the ALCO.
The main regulatory requirements to be complied with are those specified in the Banking Act 2004 and related guidelines which are aligned to Basel II and Basel III.
Basel IIIBasel III aims to strengthen the regulation, supervision and risk management of the banking sector. The measures recommended aim to:
•• improve the global banking sector’s ability to absorb shocks arising from financial and economic stress, whatever the source;
•• improve risk management and governance; and
•• strengthen bank’s transparency and disclosures.
The BoM has adopted a phased approach to the implementation of Basel III with the issue of the BoM guideline on scope and application of Basel III and eligible capital. Regulatory capital adequacy is measured through three risk-based ratios:
CET 1Common Equity Tier 1 (CET 1) Ordinary share capital, share premium and retained earnings divided by total risk-weighted assets.
Tier 1CET 1 plus perpetual, non-cumulative instruments with principal loss absorption features issued under the Basel III rules divided by total risk-weighted assets.
Total capital adequacyTier 1 plus other items such as the general allowance for credit impairments and subordinated debt with principal loss-absorption features issued under Basel III divided by total risk-weighted assets.
Subordinated debt issued under Basel I and Basel II are included in total capital but are subject to regulatory phase-out requirements, over a 10-year period effective from 1 July 2014.
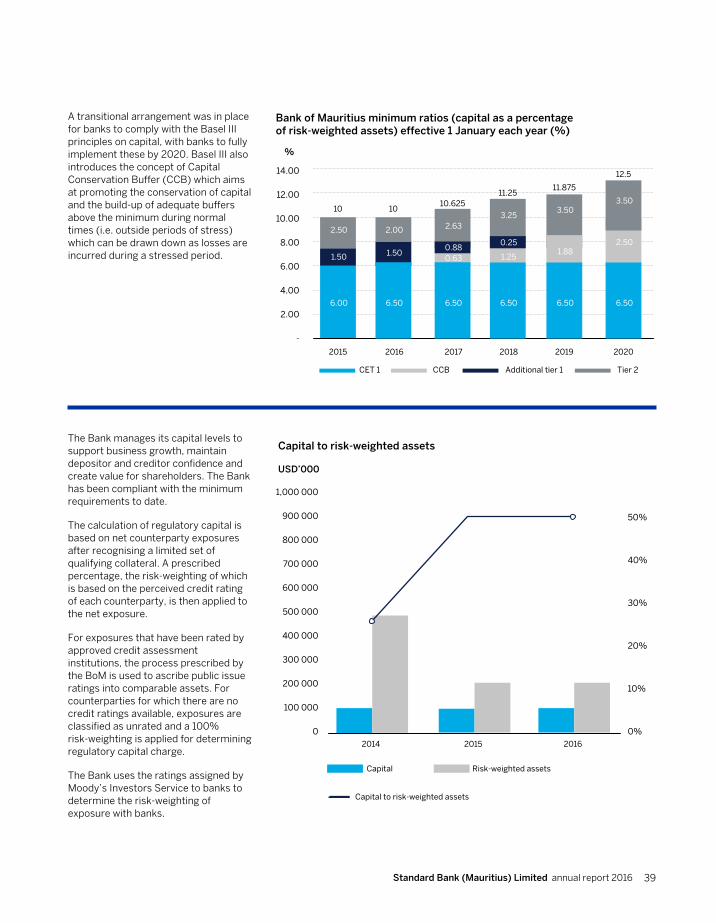
Standard Bank (Mauritius) Limited annual report 2016 39
A transitional arrangement was in place for banks to comply with the Basel III principles on capital, with banks to fully implement these by 2020. Basel III also introduces the concept of Capital Conservation Buffer (CCB) which aims at promoting the conservation of capital and the build-up of adequate buffers above the minimum during normal times (i.e. outside periods of stress) which can be drawn down as losses are incurred during a stressed period.
The Bank manages its capital levels to support business growth, maintain depositor and creditor confidence and create value for shareholders. The Bank has been compliant with the minimum requirements to date.
The calculation of regulatory capital is based on net counterparty exposures after recognising a limited set of qualifying collateral. A prescribed percentage, the risk-weighting of which is based on the perceived credit rating of each counterparty, is then applied to the net exposure.
For exposures that have been rated by approved credit assessment institutions, the process prescribed by the BoM is used to ascribe public issue ratings into comparable assets. For counterparties for which there are no credit ratings available, exposures are classified as unrated and a 100% risk-weighting is applied for determining regulatory capital charge.
The Bank uses the ratings assigned by Moody’s Investors Service to banks to determine the risk-weighting of exposure with banks.
Bank of Mauritius minimum ratios (capital as a percentage of risk-weighted assets) effective 1 January each year (%)
%
14.00
12.00
10.00
8.00
6.00
4.00
2.00
-
10
CET 1 CCB Additional tier 1 Tier 2
2.50
1.50
6.00
10
2.00
1.50
10.625
2.63
11.25
3.25
1.25
11.875
3.50
12.5
3.50
2.500.880.63
6.50
0.25
2015 2016 2017 2018 2019 2020
6.50 6.50 6.50
1.88
6.50
Capital to risk-weighted assets
USD’000
1,000 000
900 000
800 000
700 000
600 000
500 000
400 000
300 000
200 000
100 000
0
50%
40%
30%
20%
10%
0%2014 2015 2016
Capital Risk-weighted assets
Capital to risk-weighted assets
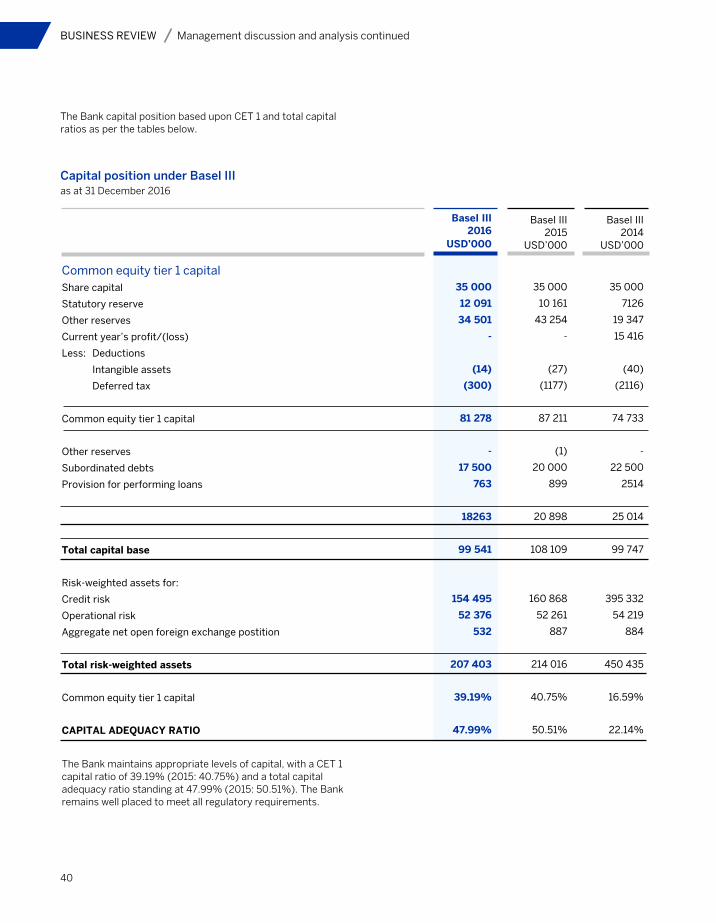
40
BUSINESS REVIEW Management discussion and analysis continued
The Bank capital position based upon CET 1 and total capital ratios as per the tables below.
The Bank maintains appropriate levels of capital, with a CET 1 capital ratio of 39.19% (2015: 40.75%) and a total capital adequacy ratio standing at 47.99% (2015: 50.51%). The Bank remains well placed to meet all regulatory requirements.
Capital position under Basel III as at 31 December 2016
Common equity tier 1 capitalShare capital
Statutory reserve
Other reserves
Current year’s profit/(loss)
Less: Deductions
Intangible assets
Deferred tax
Common equity tier 1 capital
Other reserves
Subordinated debts
Provision for performing loans
Total capital base
Risk-weighted assets for:
Credit risk
Operational risk
Aggregate net open foreign exchange postition
Total risk-weighted assets
Common equity tier 1 capital
CAPITAL ADEQUACY RATIO
BaseI III 2016
USD’000
35 000
12 091
34 501
-
(14)
(300)
81 278
-
17 500
763
18263
99 541
154 495
52 376
532
207 403
39.19%
47.99%
BaseI III 2015
USD’000
35 000
10 161
43 254
-
(27)
(1177)
87 211
(1)
20 000
899
20 898
108 109
160 868
52 261
887
214 016
40.75%
50.51%
BaseI III 2014
USD’000
35 000
7126
19 347
15 416
(40)
(2116)
74 733
-
22 500
2514
25 014
99 747
395 332
54 219
884
450 435
16.59%
22.14%
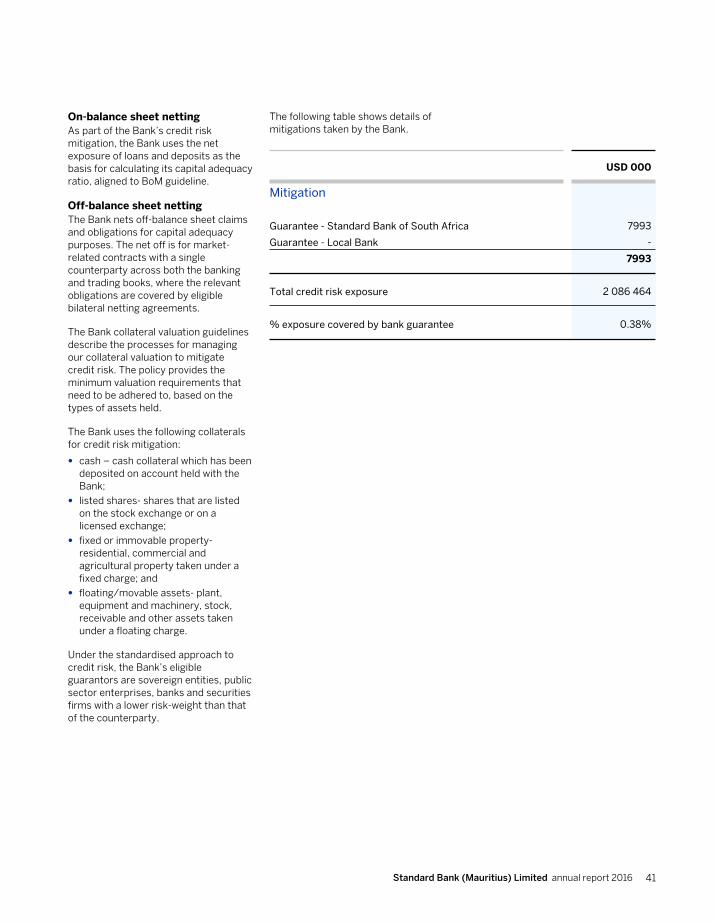
Standard Bank (Mauritius) Limited annual report 2016 41
On-balance sheet nettingAs part of the Bank’s credit risk mitigation, the Bank uses the net exposure of loans and deposits as the basis for calculating its capital adequacy ratio, aligned to BoM guideline.
Off-balance sheet netting The Bank nets off-balance sheet claims and obligations for capital adequacy purposes. The net off is for market-related contracts with a single counterparty across both the banking and trading books, where the relevant obligations are covered by eligible bilateral netting agreements.
The Bank collateral valuation guidelines describe the processes for managing our collateral valuation to mitigate credit risk. The policy provides the minimum valuation requirements that need to be adhered to, based on the types of assets held.
The Bank uses the following collaterals for credit risk mitigation:
•• cash – cash collateral which has been deposited on account held with the Bank;
•• listed shares- shares that are listed on the stock exchange or on a licensed exchange;
•• fixed or immovable property-residential, commercial and agricultural property taken under a fixed charge; and
•• floating/movable assets- plant, equipment and machinery, stock, receivable and other assets taken under a floating charge.
Under the standardised approach to credit risk, the Bank’s eligible guarantors are sovereign entities, public sector enterprises, banks and securities firms with a lower risk-weight than that of the counterparty.
The following table shows details of mitigations taken by the Bank.
Mitigation
Guarantee - Standard Bank of South Africa
Guarantee - Local Bank
Total credit risk exposure
% exposure covered by bank guarantee
USD 000
7993
-
7993
2 086 464
0.38%

42
BUSINESS REVIEW Management discussion and analysis continued
Exposures subject to the standardised approach per risk-weighting as at 31 December 2016
On-balance sheet assets
Cash Items
Claims on sovereigns
Claims on banks
Claims on central banks
Claims on PSE
Claims on corporates
Past due claims
Other assets/fixed assets
Total
Non-market related off-balance sheet
risk-weighted assets
Direct credit substitute
Transaction-related contingent items
Trade related contingencies
Other commitments
Total
Market related off-balance sheet risk
weighted assets
Interest rate contracts
Foreign exchange contracts
Total
Total credit risk
Operational risk
Aggregate net open foreign exchange position
Total risk-weighted assets
Nominalamount
USD 000
154
4945
1 386 090
26 724
-
79 524
837
6073
1 504 347
16 841
10 693
2800
-
30 334
-
551 783
551 783
2 086 464
2 086 464
-
-
46 745
-
-
71 751
419
6073
124 988
9938
1658
560
-
12 156
-
17 351
17 351
154 495
52 376
532
207 403
-
-
29 989
-
-
89 297
11 262
9758
140 306
8558
349
760
4181
13 848
5
6708
6713
160 867
52 261
887
214 015
-
-
42 046
-
-
251 833
16 722
15 226
325 827
57 926
1017
2068
3092
64 103
164
5238
5402
395 332
54 219
884
450 435
Mitigation
7993
7993
6904
7378
14 282
22 275
22 275
RiskWeight
%
0-20
0-100
20-100
0-150
20-150
20-150
50-150
100
20-100
20-100
20-100
20-100
USD 000
USD 000
USD 000CREDIT RISK
2016 2015 2014
Risk-weighted assets
Standard Bank (Mauritius) Limited annual report 2016 43
Internal Capital Adequacy Assessment Process (ICAAP)ICAAP considers the qualitative capital management processes within the organisation and includes the organisation’s governance, risk management, capital management and financial planning standards and frameworks. Furthermore, the quantitative internal assessments of the organisation’s business models are used to assess capital requirements to be held against all risks the Bank is or may become exposed to, in order to meet current and future needs as well as to assess the Bank’s resilience under stressed conditions.
The Group has embedded sound internal capital adequacy assessment processes throughout the Group in all its subsidiaries. The Bank is aligned to the Group and has implemented the BoM guideline on supervisory review process since 2011. The ICAAP document is reviewed on an annual basis and is approved by the Board. Periodic reviews are made to ensure that the Bank remains well capitalised after considering
all material risks.
The Bank consciously maintains a risk management culture and practices that are conservative and rigorous and considers that risk appetite is an integral part of the Bank’s strategy and business plans. As a result all material risks are appropriately managed and mitigated, with back-up action plans identified for execution should the capital levels of the Bank ever fall below levels deemed acceptable by the Board, management, or BoM.
Credit risk consumes approximately 74% of total regulatory capital usage and as such represents the largest source of risk that the Bank is exposed to. Such risk therefore attracts a high degree of management focus, with sufficient resources assigned to ensure that the risk is mitigated.
Year under reviewStress scenarios Economic headwinds, volatility in markets and competitive pressures accelerate the need to continuously assess the Bank’s forward looking risk profile under normal and stress conditions against the stated risk appetite. The appropriateness of the macroeconomic stress scenarios and the severity of the relevant scenarios are approved by the Board and senior management on semi-annual basis.
Stress testing is conducted using macroeconomic stress scenarios as well as bank specific scenarios based on the composition of the loan book and liquidity profile. Stress testing is performed annually as part of the Bank’s ICAAP process and is updated semi-annually.
The Bank’s sets its risk appetite to ensure that it achieves its strategic objectives without taking on levels of risk that are too high when considering all its stakeholders’ interests. It reflects the capacity to sustain losses and continue to meets its obligations as they fall due, under a range of stress conditions. The Bank’s risk appetite statement is made up of five dimensions:
•• regulatory total capital adequacy ratio;
•• economic capital;
•• stressed earnings;
•• liquidity; and
•• unacceptable risk.
Stress results are analysed and any departure from our risk appetite statement will trigger mitigating actions.
During 2016, the Bank ran several stress tests to understand the impact that potential stress events would have on its profitability and capital position on a forward looking basis. These events included amongst others the slowdown in China’s economic growth, the African aversion as interest rates start to normalise in the US, the falling price of commodities and the potential downgrade of South Africa.
Capital buffers were considered adequate. While stress results for capital adequacy are within requirements, the Bank will nonetheless remain alert to possible deterioration of economic conditions to trigger a re-assessment of capital levels and initiate early remedial action should circumstances dictate.
In instances where the results of the stress tests breached risk appetite or tolerance, the Board ensured that management has mitigating actions in place to minimise the impact.
For the purposes of ICAAP, the Bank maintains a capital buffer of 2% above the regulatory requirement.
Related party transactionsAll exposures to related parties are reported at the risk management/conduct review committee. As per BoM guideline on related party transactions, a “related party” means:
•• a person who has significant interest in the financial institution or the financial institution has significant interest in the person;
•• a director or senior officer of the financial institution;
•• close family members of the above;
•• an entity that is controlled by a person described above; and
•• a person or class of persons who has been designated by the BoM as a related party.
The Bank adheres to the BoM guideline on related party transactions as well as group policy with regards to related party.
The Bank did not have any non-exempt related party exposure as at 31 December 2016.
The Bank has exempt related party exposure with members of the SBSA group as part of interbank transactions in relations to its treasury operations.
A detailed analysis of related party transactions in the notes to the accounts is available on page 163 to 165.
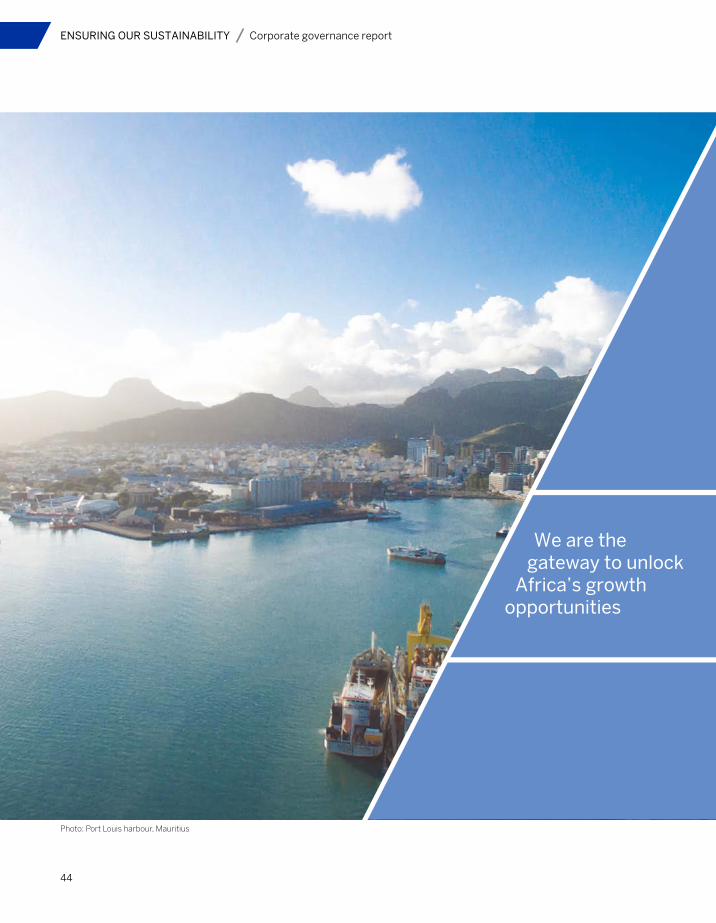
44
ENSURING OUR SUSTAINABILITY Corporate governance report
We are the gateway to unlock
Africa’s growth opportunities
Photo: Port Louis harbour, Mauritius
Standard Bank (Mauritius) Limited annual report 2016 45
ENSURING OUR SUSTAINABILITY Corporate governance report
HOLDING STRUCTURE
Standard Bank Group
Standard Bank (Mauritius) Limited
Stanbic Africa Holdings Ltd
Primary listing on the JSE Securities Exchange South Africa
Secondary listing on the Namibian Stock Exchange
Holder of:
� Banking licence (from the Bank of Mauritius)
� Custodian services licence
� Distribution of financial products licence
� Investment advisor licence
Company incorporated in the United Kingdom
Introduction Robust and sound corporate governance practice is the way to win and maintain the public’s trust and confidence in our financial system.
The Standard Bank (Mauritius) Limited (the Bank) strives to raise and preserve the standard of corporate governance to the highest level which is only attainable through ensuring the implementation and practice of proper business integrity, transparency, professionalism, discipline, independence, responsibility, fairness, social responsibility and accountability of directors to all stakeholders.
The ultimate holding company of the Bank is the Standard Bank Group Limited (the Group), who applies local and international best practice in corporate governance. The Group and its subsidiaries adhere to the principles of the Code of Corporate Practices and Conduct (King Code) whilst at the same time ensuring adherence to the legal and regulatory requirements on corporate governance under the local jurisdiction. This framework assists the Board of Directors (the Board) in performing its role of providing risk oversight and strategic counsel and at the same time ensuring compliance to evolving regulatory requirements.
The Bank is directly held by Stanbic Africa Holdings Limited (SAHL), a company incorporated in the United Kingdom. At the end of year 2016 with a view to simplify the shareholding structure, an internal reorganisation of the shareholding of SAHL has been implemented. Prior to the reorganisation, SAHL was controlled directly by the Group with minority shareholdings held by two other wholly owned group subsidiaries, Standard Bank Group International Limited and SML Limited, both registered in the Isle of Man. Subsequent to the reorganisation, SAHL is now wholly owned by the Group. This reorganisation was undertaken after obtaining necessary approvals, including that of the South African Reserve Bank.
The Board of the Bank ensure that the principles of governance and codes of best practices are in place and adhered to. The Bank subscribes to and is fully compliant with the following guidelines on corporate governance in all material aspects:
•• The Bank of Mauritius (BoM) guidelines on corporate governance, 2016; and
•• the Financial Reporting Council (FRC) (Compliance with the Code of Corporate Governance) guidelines, 2013.
The Board has ultimate responsibility for the affairs of the Bank.
•• It is the link between the Bank and its shareholder;
•• mandated on behalf of the shareholder to oversee the affairs of the Bank;
•• decision makers-setting and monitoring strategic direction and key policies;
•• responsible for governance;
•• chairman of the Board is the spokesperson for the Board;
•• chief executive is the spokesperson for the Bank;
•• empowering executive management to take actions to drive the Bank towards the set strategies;
•• approving the Bank’s corporate plan covering short term and long term business objectives, strategy including those relating to risk management, capital adequacy, liquidity, and risk appetite amongst others;
•• responsible for the appointment and monitoring of senior management, question and scrutinise performance of senior management in the achievement of corporate objectives;
•• responsible for the appointment of the CEO and other senior officers; and
•• ultimately accountable to the shareholder.
Corporate governance report
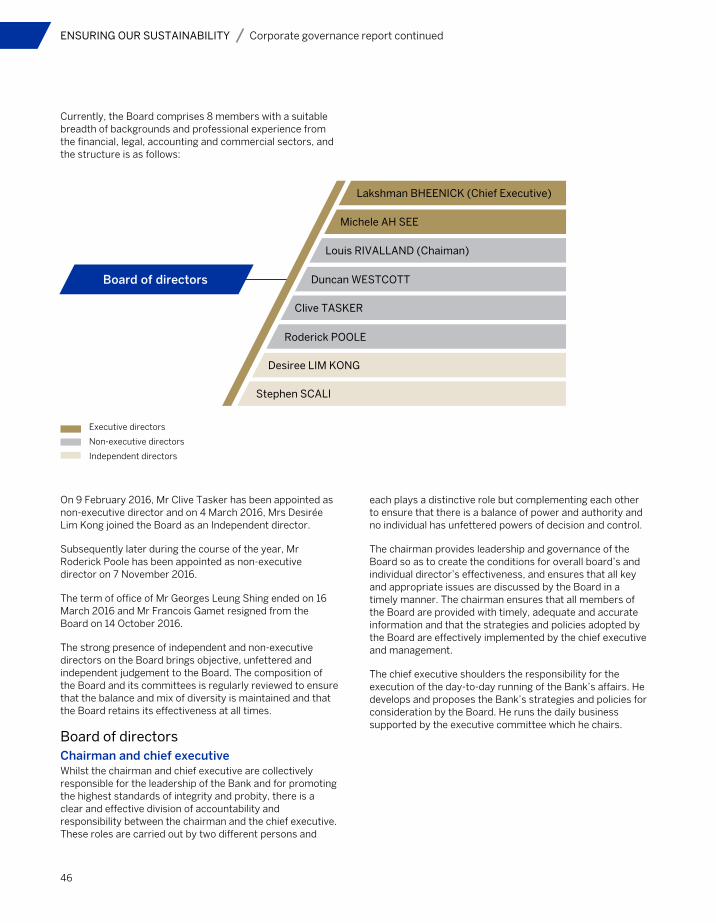
46
ENSURING OUR SUSTAINABILITY Corporate governance report continued
Board of directors Duncan WESTCOTT
Roderick POOLE
Louis RIVALLAND (Chaiman)
Michele AH SEE
Lakshman BHEENICK (Chief Executive)
Clive TASKER
Desiree LIM KONG
Executive directors
Non-executive directors
Independent directors
Stephen SCALI
Currently, the Board comprises 8 members with a suitable breadth of backgrounds and professional experience from the financial, legal, accounting and commercial sectors, and the structure is as follows:
On 9 February 2016, Mr Clive Tasker has been appointed as non-executive director and on 4 March 2016, Mrs Desirée Lim Kong joined the Board as an Independent director.
Subsequently later during the course of the year, Mr Roderick Poole has been appointed as non-executive director on 7 November 2016.
The term of office of Mr Georges Leung Shing ended on 16 March 2016 and Mr Francois Gamet resigned from the Board on 14 October 2016.
The strong presence of independent and non-executive directors on the Board brings objective, unfettered and independent judgement to the Board. The composition of the Board and its committees is regularly reviewed to ensure that the balance and mix of diversity is maintained and that the Board retains its effectiveness at all times.
Board of directorsChairman and chief executive Whilst the chairman and chief executive are collectively responsible for the leadership of the Bank and for promoting the highest standards of integrity and probity, there is a clear and effective division of accountability and responsibility between the chairman and the chief executive. These roles are carried out by two different persons and
each plays a distinctive role but complementing each other to ensure that there is a balance of power and authority and no individual has unfettered powers of decision and control.
The chairman provides leadership and governance of the Board so as to create the conditions for overall board’s and individual director’s effectiveness, and ensures that all key and appropriate issues are discussed by the Board in a timely manner. The chairman ensures that all members of the Board are provided with timely, adequate and accurate information and that the strategies and policies adopted by the Board are effectively implemented by the chief executive and management.
The chief executive shoulders the responsibility for the execution of the day-to-day running of the Bank’s affairs. He develops and proposes the Bank’s strategies and policies for consideration by the Board. He runs the daily business supported by the executive committee which he chairs.

Standard Bank (Mauritius) Limited annual report 2016 47
ENSURING OUR SUSTAINABILITY Corporate governance report continued
Executive directorsThe executive directors are members of the Board who are also in full time employment with the Bank.
Lakshman BHEENICK
Michele AH SEE
•• Aged 50
•• Holder of a MA (ord) from University of Aberdeen (Scotland)
•• Member of the Institute of Chartered Accountants of England and Wales
•• Occupies the post of head: risk and compliance in the Bank
•• Worked 10 years for the State Bank of Mauritius. Headed the value management office, the credit underwriting division and the corporate banking division
•• Worked for Somers Baker in UK and Pricewaterhouse coopers Mauritius in audit
•• Appointed as executive Director on 17 February 2014
•• Joined Standard Bank (Mauritius) Limited in February 2009
Personal profile
Personal profile
Current
Current
Previous
Previous
•• Aged 44
•• Holder of a BA (Hons) In Economics from University of Manchester (England) in 1995
•• Worked for Barclays Bank Plc where he successfully lead the debt capital issuance in Mauritius and Botswana
•• Appointed executive director on 18 May 2010
•• Chief executive of Standard Bank (Mauritius) Limited
•• Joined Standard Bank(Mauritius) Limited in June 2006 as head: global markets
•• Also assumes the role of head: corporate and investment banking in the Bank
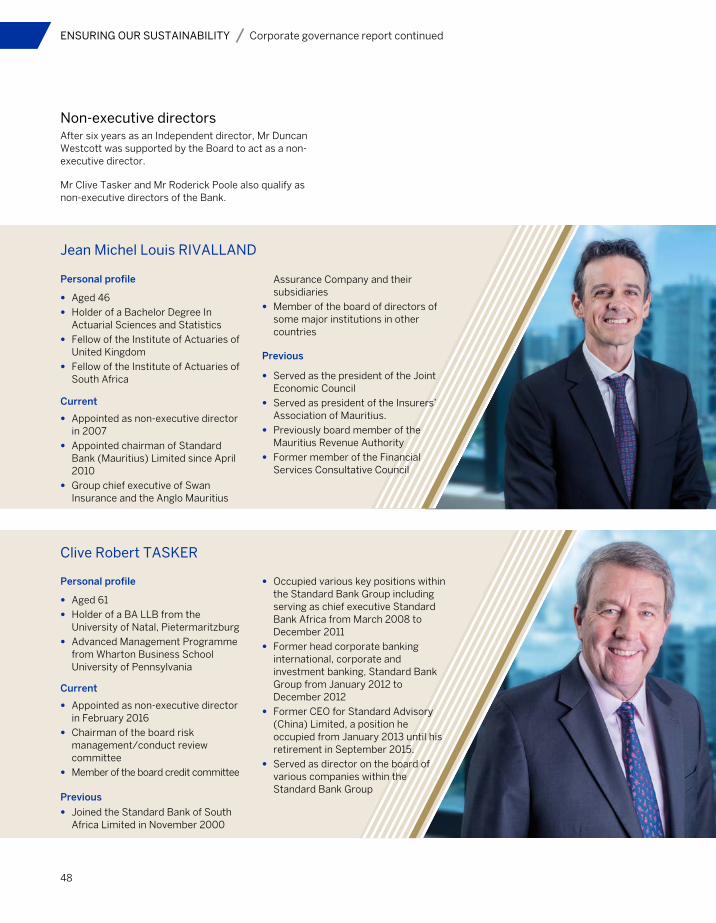
48
ENSURING OUR SUSTAINABILITY Corporate governance report continued
Non-executive directorsAfter six years as an Independent director, Mr Duncan Westcott was supported by the Board to act as a non-executive director.
Mr Clive Tasker and Mr Roderick Poole also qualify as non-executive directors of the Bank.
Jean Michel Louis RIVALLAND
Clive Robert TASKER
•• Aged 46
•• Holder of a Bachelor Degree In Actuarial Sciences and Statistics
•• Fellow of the Institute of Actuaries of United Kingdom
•• Fellow of the Institute of Actuaries of South Africa
•• Aged 61
•• Holder of a BA LLB from the University of Natal, Pietermaritzburg
•• Advanced Management Programme from Wharton Business School University of Pennsylvania
•• Appointed as non-executive director in 2007
•• Appointed chairman of Standard Bank (Mauritius) Limited since April 2010
•• Group chief executive of Swan Insurance and the Anglo Mauritius
•• Appointed as non-executive director in February 2016
•• Chairman of the board risk management/conduct review committee
•• Member of the board credit committee
Assurance Company and their subsidiaries
•• Member of the board of directors of some major institutions in other countries
•• Served as the president of the Joint Economic Council
•• Served as president of the Insurers’ Association of Mauritius.
•• Previously board member of the Mauritius Revenue Authority
•• Former member of the Financial Services Consultative Council
•• Occupied various key positions within the Standard Bank Group including serving as chief executive Standard Bank Africa from March 2008 to December 2011
•• Former head corporate banking international, corporate and investment banking, Standard Bank Group from January 2012 to December 2012
•• Former CEO for Standard Advisory (China) Limited, a position he occupied from January 2013 until his retirement in September 2015.
•• Served as director on the board of various companies within the Standard Bank Group
•• Joined the Standard Bank of South Africa Limited in November 2000
Personal profile
Personal profile
Current
Current
Previous
Previous

Standard Bank (Mauritius) Limited annual report 2016 49
ENSURING OUR SUSTAINABILITY Corporate governance report continued
Duncan James WESTCOTT
Roderick Terner Forbes POOLE
•• Aged 67
•• Holder of a BSc Economics from the University of Wales
•• Fellow of the Institute of Chartered Accountants in England and Wales
•• Aged 55
•• Holder of a Bachelor of Commerce
•• Appointed independent director in September 2010
•• Chairman of the board audit committee
•• Member of the risk management/conduct review committee and board credit committee
•• Appointed non-executive director on 7 November 2016
•• Currently group head: change in business transformation
•• Currently presides as the CFO of Shout it Now (an aids awareness NGO based in Cape Town, South Africa)
•• Previously a partner of Pricewaterhouse Coopers in South Africa
•• Occupied various key positions in finance, IT and HR within the Standard Bank Group as from 1984 to 1991
•• Former head: human resources corporate and investment banking at Standard Bank Plc, London, in 2007
•• Former head : human resources CIB, South Africa in 2008
•• Former head: human capital, marketing and communications CIB in 2012
•• Former chief of staff, corporate and investment banking until November 2016
Personal profile
Personal profile
Current
Current
Previous
Previous
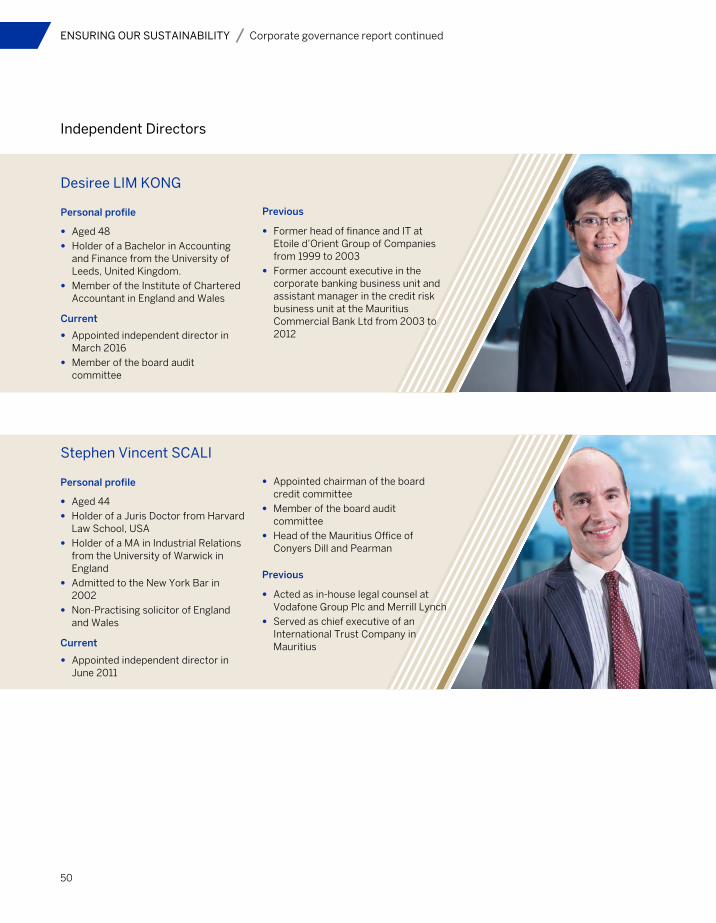
50
ENSURING OUR SUSTAINABILITY Corporate governance report continued
Desiree LIM KONG
Stephen Vincent SCALI
Independent Directors
•• Aged 48
•• Holder of a Bachelor in Accounting and Finance from the University of Leeds, United Kingdom.
•• Member of the Institute of Chartered Accountant in England and Wales
•• Former head of finance and IT at Etoile d’Orient Group of Companies from 1999 to 2003
•• Former account executive in the corporate banking business unit and assistant manager in the credit risk business unit at the Mauritius Commercial Bank Ltd from 2003 to 2012•• Appointed independent director in
March 2016
•• Member of the board audit committee
Personal profile
Current
Previous
•• Aged 44
•• Holder of a Juris Doctor from Harvard Law School, USA
•• Holder of a MA in Industrial Relations from the University of Warwick in England
•• Admitted to the New York Bar in 2002
•• Non-Practising solicitor of England and Wales
•• Appointed chairman of the board credit committee
•• Member of the board audit committee
•• Head of the Mauritius Office of Conyers Dill and Pearman
•• Appointed independent director in June 2011
•• Acted as in-house legal counsel at Vodafone Group Plc and Merrill Lynch
•• Served as chief executive of an International Trust Company in Mauritius
Personal profile
Current
Previous
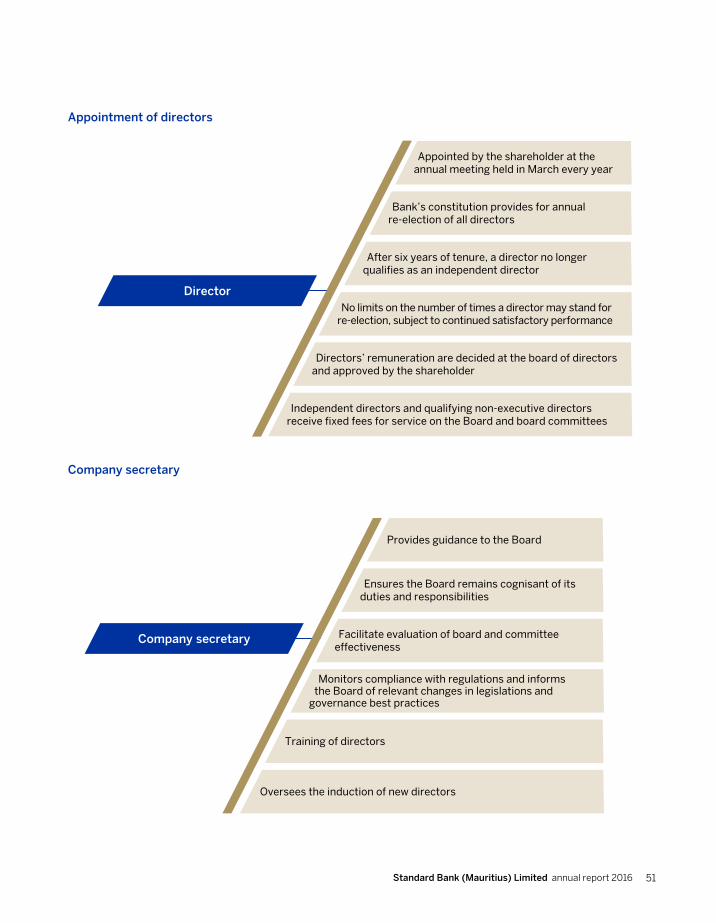
Standard Bank (Mauritius) Limited annual report 2016 51
ENSURING OUR SUSTAINABILITY Corporate governance report continued
Appointment of directors
Company secretary
Director
Appointed by the shareholder at the annual meeting held in March every year
Bank’s constitution provides for annual re-election of all directors
After six years of tenure, a director no longer qualifies as an independent director
No limits on the number of times a director may stand for re-election, subject to continued satisfactory performance
Directors’ remuneration are decided at the board of directors and approved by the shareholder
Independent directors and qualifying non-executive directors receive fixed fees for service on the Board and board committees
Company secretary
Provides guidance to the Board
Ensures the Board remains cognisant of its duties and responsibilities
Facilitate evaluation of board and committee effectiveness
Monitors compliance with regulations and informs the Board of relevant changes in legislations and
governance best practices
Training of directors
Oversees the induction of new directors
52
ENSURING OUR SUSTAINABILITY Corporate governance report continued
Role and duties of the BoardIn order for the Board to effectively oversee the affairs of a financial institution, it must possess the necessary balance of expertise, skills, adequate knowledge of its business, and the structure and strengths of the industry it is engaged in, as well as the legal requirements impinging on the industry. The Board members shall collectively possess appropriate qualifications and background for proper governance of the Bank.
The Board must oversee the Bank’s business strategy, internal organisation and governance structure, its risk
management and compliance practices, and key personnel decisions. It is essential that there is a clear demarcation of responsibilities and obligations between the Board and management. The Board should be independent from management.
The Board is collectively and ultimately responsible for the safety, soundness and long-term success of the Bank and delivery of sustainable shareholder value. Its role is to provide leadership of the Bank within a framework of prudent and effective controls which enables risks to be assessed and managed.
1. Access to information and resources
2. Training
3. Board members’ appointment, and overall effectiveness and evaluation of the Board
• Regular interaction between the Board and executive management.
• Senior executive committee members are requested to make presentations as required.
• Directors have free and unrestricted access to management team and to Bank’s information.
• Directors are provided with the services of external legal advisers when required.
• Ongoing board education remains a focus: directors are kept abreast of all applicable legislations and regulations, changes to rules, standards and codes, as well as relevant sector developments that could affect the Bank and its operations.
• In the course of 2016, all directors attended a workshop on International Financial Reporting Standards (IFRS) 9. Similarly, some directors have also been given a compliance training as well as a training on group IT governance standard and group IT security during the course of the year. All trainings were given and delivered by the Group trainers, including the head of group compliance and head of IT governance and risk respectively.
• Annual assessment of the Board is conducted against the objectives set.
• Board assessment is made to review and further the Board’s effectiveness.
• New points for implementation are recorded.
• Performances of the chairman, chief executive, independent directors and company secretary are assessed annually.
• Assessment of the Board and its committees are also carried out annually in terms of structure, process and effectiveness.
• In 2016, individual questionnaires were completed, the consolidated feedback tabulated and discussed at the board meeting in November 2016. No major concern has been highlighted.
• An overall positive collective performance has been noted.
• The Board shall also approve composition of the Board and committees as well as the appointment of the chairperson and members of all board committees (including the removal, resignation and retirement of such directors or members).
Standard Bank (Mauritius) Limited annual report 2016 53
ENSURING OUR SUSTAINABILITY Corporate governance report continued
4. Ethics and organisational integrity
5. Succession planning
6. Strategy
7. Risk and compliance
• The Group has its own set of values and code of ethics (the code).
• The Board strives to ensure effective management in line with the code.
• The code seeks to empower employees and support responsible decision making at all levels.
• The aim is to adhere to the highest set of standards for responsible business practice.
• The code details acceptable and unacceptable practices.
• Ethical incident reporting is encouraged and supported.
• The Bank adhered to the code in conjunction with the 2013 Code of Ethics of the Mauritius Bankers Association.
• The Board shall ensure that the Bank is compliant with all relevant laws and regulations.
• The Board shall also ensure the integrity of the annual financial report.
• Succession planning is an integral part of ensuring effective management.
• There is an ongoing requirement to strengthen the talent pool to ensure adequate succession in the short or long term.
• Map out the Bank’s goals and plans for achieving those goals.
• Ensures that any action is aligned to the Bank’s values, performance and sustainability.
• Continuously monitor financial performance.
• Annually review and approve major changes to relevant bank’s policies.
• Ensure that an adequate budget and planning process exists.
• Approve budgets.
• Ensure proper and effective risk management procedures are adhered to.
• Responsible for financial, operational and internal control systems.
• Ensure proper adherence to compliance policies and procedures.
• Provide adequate reporting to stakeholders on bank’s compliance status.
• The Board should establish a risk management committee with responsibility for advising the Board on the Bank’s overall current and future risk appetite, overseeing senior management’s implementation of the risk appetite framework and reporting on the state of the risk culture in the Bank.
• Ensure processes are in place to provide complete, timely, relevant and accurate information in the disclosure of risks reported to stakeholders.
• The Board shall implement policies and procedures to identify conflict of interest situations and steps to redress such situations.
54
ENSURING OUR SUSTAINABILITY Corporate governance report continued
8. Corporate, and IT governance
9. Dividend policy, finance and capital funding
• Annual review of corporate governance procedures.
• Annual assessment of achievements against set objectives.
• Review its mandate at least annually and approve recommended changes.
• Delegate power, authorities and discretions to the chief executive and sub-committees for efficient decision making process.
• Define terms of reference and procedures to be followed by all board sub-committees.
• Assess performance of chief executive and management team.
• Assess and considers reports from management team.
• Propose to shareholder for approval, the remuneration of independent and qualifying non-executive directors.
• Approve external auditor’s fees following recommendation from board audit committee.
• Review matters such as code of ethics, environmental and social issues.
• Ensure disputes are resolved effectively and as efficiently as possible.
• Ensure that information is secure from a confidentiality perspective.
• Ensure that policies and systems are in place to achieve a prudential balance between risks and returns to shareholders.
• The Board will also specifically agree from time to time matters that are reserved for its decision retaining the right to delegate any of these matters to any committee, in accordance with the constitution.
• The Board shall be responsible for the governance of IT and ensure that significant IT investments and expenditure are monitored.
• Dividends paid by the Bank are an integral part of the capital management process. Capital that is surplus to business operational requirements must be declared and paid as dividend.
• Approve capital funding for the Bank and the terms and conditions of rights or other issues in connection therewith.
• Approve corporate structuring by the Bank and disclose all material interests in such proposed corporate activity.
• Consider and approve capital expenditure recommended by the Bank’s executive committee.
• Ensure an adequate budget and planning process exists, and that performance is measured against budgets and plans.
The year ahead• Continue to implement board succession plans
• Consider the impact of regulatory changes
• Measure progress against strategic objectives
• Continue to monitor the Bank’s operational and financial performance
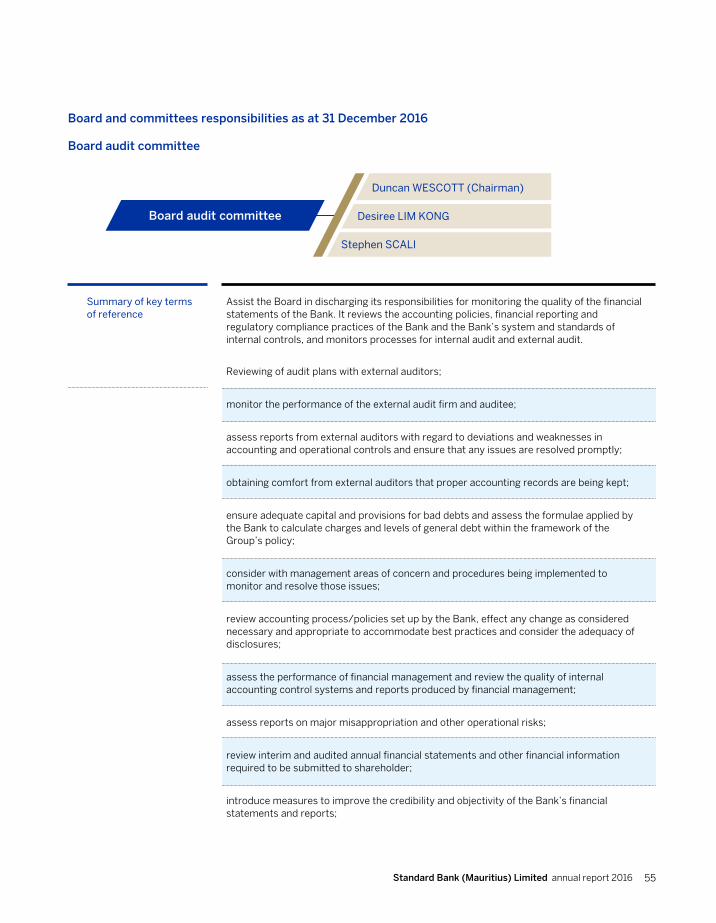
Standard Bank (Mauritius) Limited annual report 2016 55
ENSURING OUR SUSTAINABILITY Corporate governance report continued
Board audit committee Desiree LIM KONG
Duncan WESCOTT (Chairman)
Stephen SCALI
Board audit committee
Board and committees responsibilities as at 31 December 2016
Summary of key terms of reference
Assist the Board in discharging its responsibilities for monitoring the quality of the financial statements of the Bank. It reviews the accounting policies, financial reporting and regulatory compliance practices of the Bank and the Bank’s system and standards of internal controls, and monitors processes for internal audit and external audit.
Reviewing of audit plans with external auditors;
monitor the performance of the external audit firm and auditee;
assess reports from external auditors with regard to deviations and weaknesses in accounting and operational controls and ensure that any issues are resolved promptly;
obtaining comfort from external auditors that proper accounting records are being kept;
ensure adequate capital and provisions for bad debts and assess the formulae applied by the Bank to calculate charges and levels of general debt within the framework of the Group’s policy;
consider with management areas of concern and procedures being implemented to monitor and resolve those issues;
review accounting process/policies set up by the Bank, effect any change as considered necessary and appropriate to accommodate best practices and consider the adequacy of disclosures;
assess the performance of financial management and review the quality of internal accounting control systems and reports produced by financial management;
assess reports on major misappropriation and other operational risks;
review interim and audited annual financial statements and other financial information required to be submitted to shareholder;
introduce measures to improve the credibility and objectivity of the Bank’s financial statements and reports;
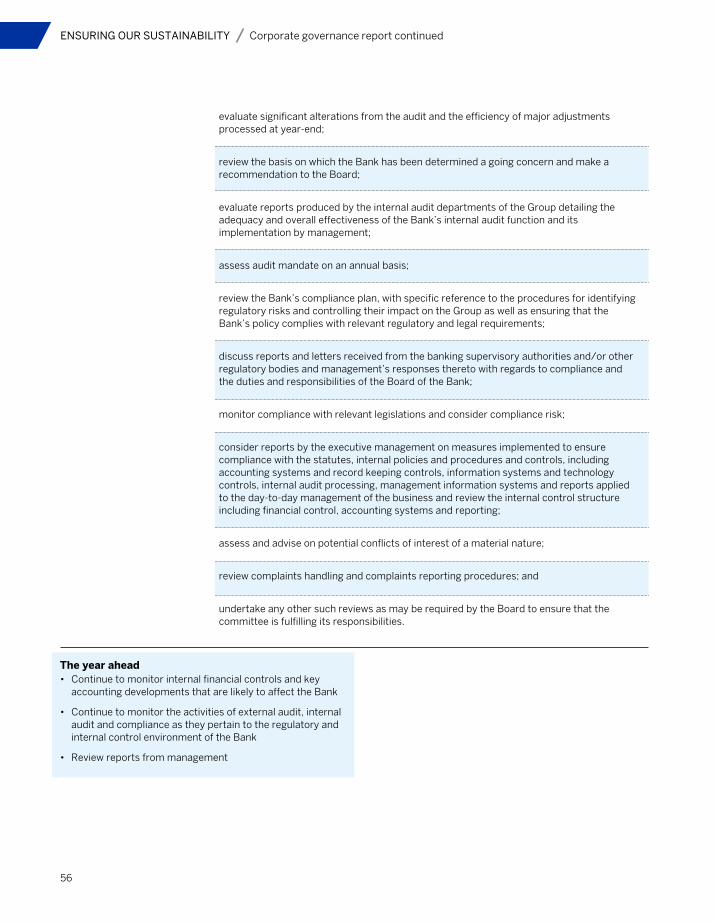
56
ENSURING OUR SUSTAINABILITY Corporate governance report continued
evaluate significant alterations from the audit and the efficiency of major adjustments processed at year-end;
review the basis on which the Bank has been determined a going concern and make a recommendation to the Board;
evaluate reports produced by the internal audit departments of the Group detailing the adequacy and overall effectiveness of the Bank’s internal audit function and its implementation by management;
assess audit mandate on an annual basis;
review the Bank’s compliance plan, with specific reference to the procedures for identifying regulatory risks and controlling their impact on the Group as well as ensuring that the Bank’s policy complies with relevant regulatory and legal requirements;
discuss reports and letters received from the banking supervisory authorities and/or other regulatory bodies and management’s responses thereto with regards to compliance and the duties and responsibilities of the Board of the Bank;
monitor compliance with relevant legislations and consider compliance risk;
consider reports by the executive management on measures implemented to ensure compliance with the statutes, internal policies and procedures and controls, including accounting systems and record keeping controls, information systems and technology controls, internal audit processing, management information systems and reports applied to the day-to-day management of the business and review the internal control structure including financial control, accounting systems and reporting;
assess and advise on potential conflicts of interest of a material nature;
review complaints handling and complaints reporting procedures; and
undertake any other such reviews as may be required by the Board to ensure that the committee is fulfilling its responsibilities.
The year ahead• Continue to monitor internal financial controls and key
accounting developments that are likely to affect the Bank
• Continue to monitor the activities of external audit, internal audit and compliance as they pertain to the regulatory and internal control environment of the Bank
• Review reports from management
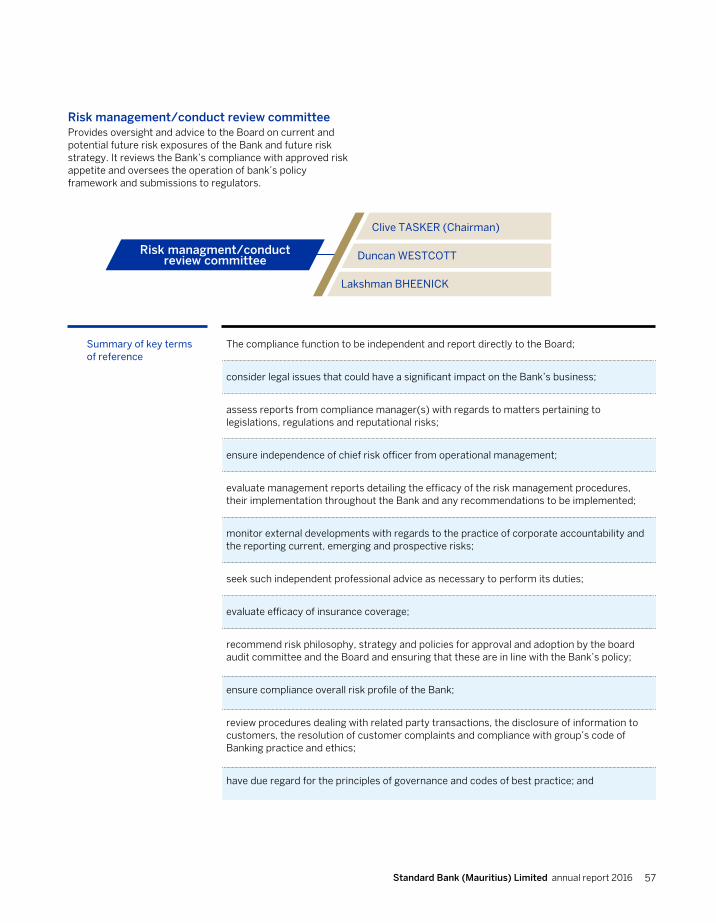
Standard Bank (Mauritius) Limited annual report 2016 57
ENSURING OUR SUSTAINABILITY Corporate governance report continued
Risk managment/conduct review committee Duncan WESTCOTT
Clive TASKER (Chairman)
Lakshman BHEENICK
Risk management/conduct review committeeProvides oversight and advice to the Board on current and potential future risk exposures of the Bank and future risk strategy. It reviews the Bank’s compliance with approved risk appetite and oversees the operation of bank’s policy framework and submissions to regulators.
Summary of key terms of reference
The compliance function to be independent and report directly to the Board;
consider legal issues that could have a significant impact on the Bank’s business;
assess reports from compliance manager(s) with regards to matters pertaining to legislations, regulations and reputational risks;
ensure independence of chief risk officer from operational management;
evaluate management reports detailing the efficacy of the risk management procedures, their implementation throughout the Bank and any recommendations to be implemented;
monitor external developments with regards to the practice of corporate accountability and the reporting current, emerging and prospective risks;
seek such independent professional advice as necessary to perform its duties;
evaluate efficacy of insurance coverage;
recommend risk philosophy, strategy and policies for approval and adoption by the board audit committee and the Board and ensuring that these are in line with the Bank’s policy;
ensure compliance overall risk profile of the Bank;
review procedures dealing with related party transactions, the disclosure of information to customers, the resolution of customer complaints and compliance with group’s code of Banking practice and ethics;
have due regard for the principles of governance and codes of best practice; and
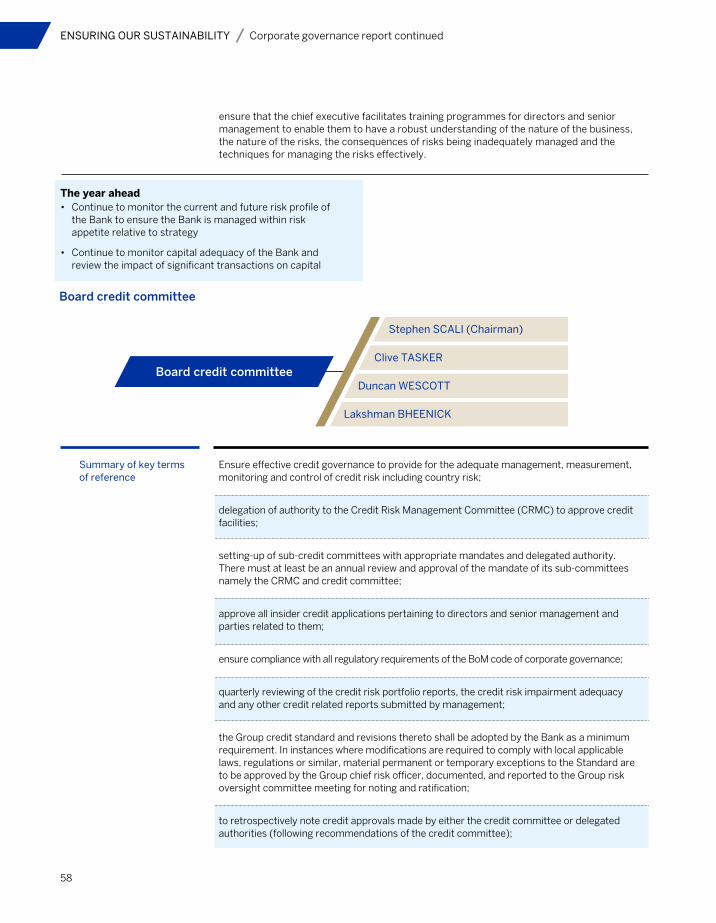
58
ENSURING OUR SUSTAINABILITY Corporate governance report continued
ensure that the chief executive facilitates training programmes for directors and senior management to enable them to have a robust understanding of the nature of the business, the nature of the risks, the consequences of risks being inadequately managed and the techniques for managing the risks effectively.
The year ahead• Continue to monitor the current and future risk profile of
the Bank to ensure the Bank is managed within risk appetite relative to strategy
• Continue to monitor capital adequacy of the Bank and review the impact of significant transactions on capital
Board credit committeeClive TASKER
Stephen SCALI (Chairman)
Duncan WESCOTT
Lakshman BHEENICK
Board credit committee
Summary of key terms of reference
Ensure effective credit governance to provide for the adequate management, measurement, monitoring and control of credit risk including country risk;
delegation of authority to the Credit Risk Management Committee (CRMC) to approve credit facilities;
setting-up of sub-credit committees with appropriate mandates and delegated authority. There must at least be an annual review and approval of the mandate of its sub-committees namely the CRMC and credit committee;
approve all insider credit applications pertaining to directors and senior management and parties related to them;
ensure compliance with all regulatory requirements of the BoM code of corporate governance;
quarterly reviewing of the credit risk portfolio reports, the credit risk impairment adequacy and any other credit related reports submitted by management;
the Group credit standard and revisions thereto shall be adopted by the Bank as a minimum requirement. In instances where modifications are required to comply with local applicable laws, regulations or similar, material permanent or temporary exceptions to the Standard are to be approved by the Group chief risk officer, documented, and reported to the Group risk oversight committee meeting for noting and ratification;
to retrospectively note credit approvals made by either the credit committee or delegated authorities (following recommendations of the credit committee);
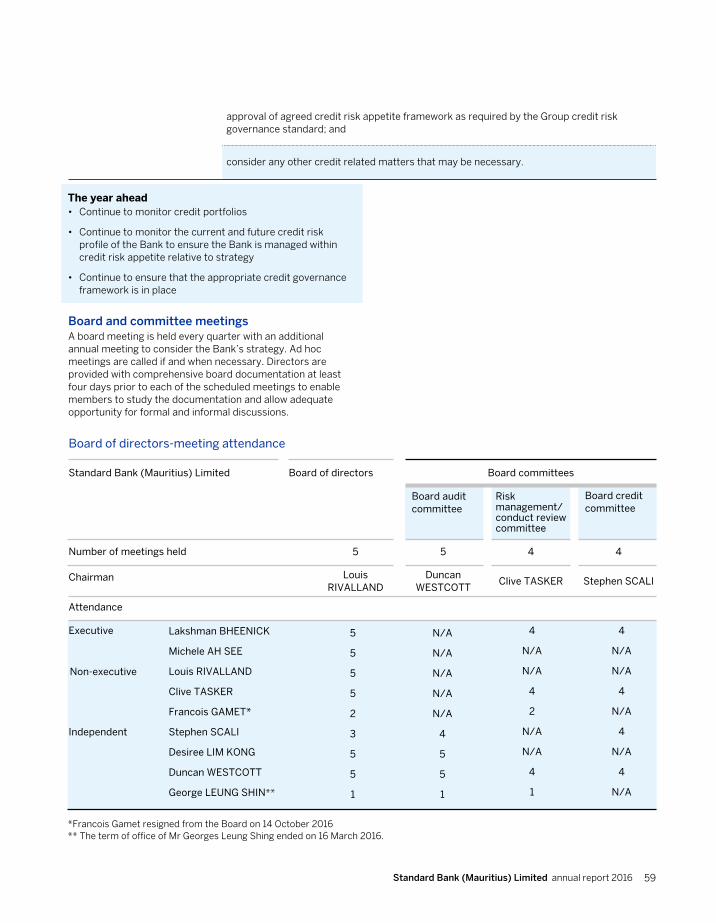
Standard Bank (Mauritius) Limited annual report 2016 59
ENSURING OUR SUSTAINABILITY Corporate governance report continued
The year ahead• Continue to monitor credit portfolios
• Continue to monitor the current and future credit risk profile of the Bank to ensure the Bank is managed within credit risk appetite relative to strategy
• Continue to ensure that the appropriate credit governance framework is in place
approval of agreed credit risk appetite framework as required by the Group credit risk governance standard; and
consider any other credit related matters that may be necessary.
Board and committee meetingsA board meeting is held every quarter with an additional annual meeting to consider the Bank’s strategy. Ad hoc meetings are called if and when necessary. Directors are provided with comprehensive board documentation at least four days prior to each of the scheduled meetings to enable members to study the documentation and allow adequate opportunity for formal and informal discussions.
Standard Bank (Mauritius) Limited Board committees
Board audit committee
Risk management/ conduct review committee
Board credit committee
Board of directors
Board of directors-meeting attendance
Number of meetings held
Chairman
Executive
Independent
Non-executive
Lakshman BHEENICK
Michele AH SEE
Louis RIVALLAND
Clive TASKER
Francois GAMET*
Stephen SCALI
Desiree LIM KONG
Duncan WESTCOTT
George LEUNG SHIN**
5
5
5
5
2
3
5
5
1
N/A
N/A
N/A
N/A
N/A
4
5
5
1
4
N/A
N/A
4
2
N/A
N/A
4
1
4
N/A
N/A
4
N/A
4
N/A
4
N/A
Louis RIVALLAND
5
Duncan WESTCOTT
5
Clive TASKER
4
Stephen SCALI
4
Attendance
*Francois Gamet resigned from the Board on 14 October 2016** The term of office of Mr Georges Leung Shing ended on 16 March 2016.

60
ENSURING OUR SUSTAINABILITY Corporate governance report continued
Codes, regulations and complianceOne fundamental principle of the Bank is to comply with all legislations, regulations and codes in its journey to achieve its goals. Compliance is assessed via management reports.
The Bank networks with regulators and other stakeholders when applying legislative and regulatory controls. The Bank aims to ensure that regulatory requirements are embedded in the Bank’s operations in a way that drives long term business value.
Dealing in securities, conflicts of interests and related party transactionsIn its quest to ensure that business is conducted professionally and in an ethical manner, the Group has implemented guidelines to restrict directors and embargoed employees from dealing in its securities.
A personal account trading policy was introduced to prevent directors and employees from trading in securities during closed periods. Continuous compliance with the policy is ensured and any breaches of policy are dealt with in line with the provisions of the policy and JSE listings requirements.
A further conflict of interest policy has been implemented requiring directors and employees to disclose any conflict of interest situation including disclosure of any directorships held in any other legal entity.
All transactions with a related party are carried out on terms and conditions that are at least favourable to the Bank at market terms and conditions. The risk management/conduct review committee is responsible to monitor and review related party transactions.
Given the awareness across the globe regarding the importance of protecting privacy and data of persons, the Bank has introduced and implemented a data privacy policy.
The data privacy policy is to ensure that the Bank manages data privacy risk, maintains and continuously improves its data privacy culture and promotes the safeguarding of personal information. The data privacy policy also aims to guarantee that the Bank processes personal information in a lawful and reasonable manner, thus ensuring that the Bank is protected from criminal sanction, reputational damage, fines and penalties.
Directorship held in listed companies is as follows:
Relationships with shareholdersThe Board has the important role of overseeing management performance on behalf of shareholders. Shareholders necessarily have little voice in the day-to-day management of corporate operations, but have the right to elect representatives (directors) to look out for their interests and to receive the information they need to make investment and voting decisions.
Connecting with our stakeholdersOur relevance to the markets and societies in which we operate depends on continued and meaningful engagement with all our stakeholders. The Bank’s stakeholder management approach involves the application of the Bank’s resources to build and maintain good relationships with stakeholders. This helps the Bank to understand the expectations of society, minimising reputational risk and form strong partnerships all of which support commercial sustainability.
Shareholder feedback and concernsIn order to receive feedback from shareholders and to deal with any concern that they might have the Bank has set up specific procedures.
Louis RIVALLAND
Clive TASKER
Duncan WESTCOTT
Stephen SCALI
Lakshman BHEENICK
Michele AH SEE
Desiree LIM KONG
Rod POOLE
Air Mauritius Limited, New Mauritius Hotels Ltd, Swan General Ltd
Stanbic Bank Uganda
Nil
Nil
Nil
Nil
Nil
Nil
Names of companiesNames of directors

Standard Bank (Mauritius) Limited annual report 2016 61
ENSURING OUR SUSTAINABILITY Corporate governance report continued
SustainabilityManagement of the Group’s economic, social and environmental impacts and responsibilities most effectively is being systematically entrenched in group culture through the emphasis placed on the application of the group’s vision and values in all its operations. The monitoring and reporting of sustainability issues is an evolving discipline within the group. The Group’s annual sustainability report provides comprehensive commentary on the group’s sustainability and transformation efforts, as well as key non-financial performance indicators. The report aims to present a balanced view and disclose relevant and material information to the Group’s stakeholders. The Group’s sustainability report is guided by the Global Reporting Initiative’s (GRI) G3 sustainability reporting guidelines and the Group reports against the indicators in the GRI financial services sector supplement.
Going concernOn the recommendation of the board audit committee, the Board annually considers and assesses the going concern basis for the preparation of financial statements at the year-end. At the interim reporting period, a similar process is followed to enable the Board to consider whether or not there is sufficient reason for this conclusion to be affirmed.
Shareholders’ calendar
Financial year end
Annual general meeting of shareholders
Publication of financial statements
Annual report
Quarterly unaudited financial statements
31 March
30 June
30 September
December
March
March
June
September
December
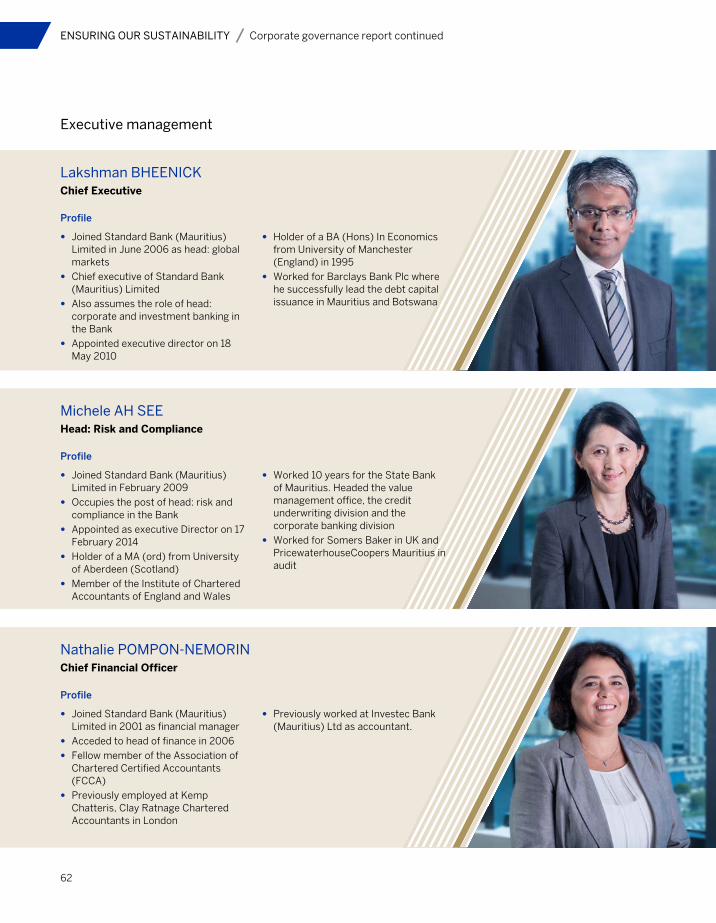
62
ENSURING OUR SUSTAINABILITY Corporate governance report continued
Executive management
Lakshman BHEENICKChief Executive
Michele AH SEEHead: Risk and Compliance
Nathalie POMPON-NEMORINChief Financial Officer
•• Joined Standard Bank (Mauritius) Limited in June 2006 as head: global markets
•• Chief executive of Standard Bank (Mauritius) Limited
•• Also assumes the role of head: corporate and investment banking in the Bank
•• Appointed executive director on 18 May 2010
•• Joined Standard Bank (Mauritius) Limited in February 2009
•• Occupies the post of head: risk and compliance in the Bank
•• Appointed as executive Director on 17 February 2014
•• Holder of a MA (ord) from University of Aberdeen (Scotland)
•• Member of the Institute of Chartered Accountants of England and Wales
•• Joined Standard Bank (Mauritius) Limited in 2001 as financial manager
•• Acceded to head of finance in 2006
•• Fellow member of the Association of Chartered Certified Accountants (FCCA)
•• Previously employed at Kemp Chatteris, Clay Ratnage Chartered Accountants in London
•• Holder of a BA (Hons) In Economics from University of Manchester (England) in 1995
•• Worked for Barclays Bank Plc where he successfully lead the debt capital issuance in Mauritius and Botswana
•• Worked 10 years for the State Bank of Mauritius. Headed the value management office, the credit underwriting division and the corporate banking division
•• Worked for Somers Baker in UK and PricewaterhouseCoopers Mauritius in audit
•• Previously worked at Investec Bank (Mauritius) Ltd as accountant.
Profile
Profile
Profile

Standard Bank (Mauritius) Limited annual report 2016 63
ENSURING OUR SUSTAINABILITY Corporate governance report continued
Robin VEERAPENHead: Operations
Reshmee A KISTNAMAHHead: Legal and Company Secretary
Meenakshi SANDRASAGRENHead: Global Markets
•• Joined Standard Bank (Mauritius) Limited in April 2005
•• Appointed regional CIB head of operations: West Africa and Francophone Region
•• Holder of a BSc (Hons) in Information Technology from the British Computer Society
•• Joined Standard Bank (Mauritius) Limited in 2010 as corporate lawyer
•• Holder of an LLB (Hons) from the University of Mauritius, an LLM in Commercial and Corporate Law from the University of London and a diploma in French Law from the Universite de Droit, d’Economie et des Sciences D’Aix en Provence
•• Joined Standard Bank (Mauritius) Ltd in 2011 as head global markets
•• Holder of an MBA from the City University Business School (UK) and a Master in International Economics and Finance from Brandeis University (USA)
•• Fellow member of the Association of Chartered Certified Accountants (FCCA)
•• Previously worked at the State Bank of Mauritius and Hong Kong and Shanghai Banking Corporation (HSBC) for 14 years
•• Previously worked at Harel Mallac Group in charge of the legal and corporate secretarial department
•• Previously employed at Air Mauritius as head of treasury for a period of thirteen years
•• Worked for MEDIA as financial controller
•• Work for De Chazal Du Mée and Philips ELL & Gross
Profile
Profile
Profile
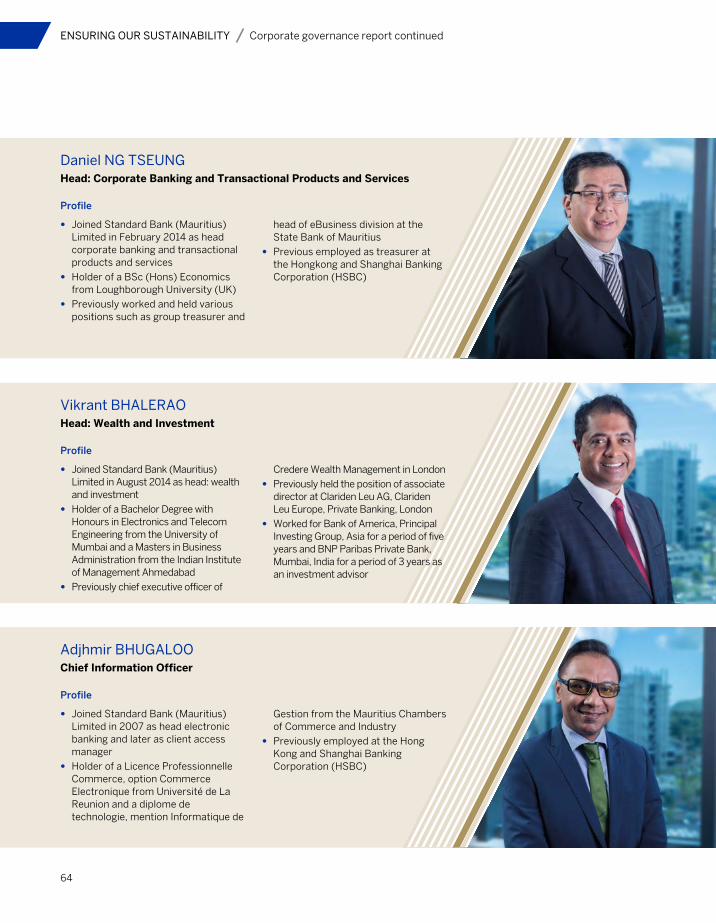
64
ENSURING OUR SUSTAINABILITY Corporate governance report continued
Daniel NG TSEUNG Head: Corporate Banking and Transactional Products and Services
Vikrant BHALERAOHead: Wealth and Investment
Adjhmir BHUGALOOChief Information Officer
•• Joined Standard Bank (Mauritius) Limited in February 2014 as head corporate banking and transactional products and services
•• Holder of a BSc (Hons) Economics from Loughborough University (UK)
•• Previously worked and held various positions such as group treasurer and
•• Joined Standard Bank (Mauritius) Limited in August 2014 as head: wealth and investment
•• Holder of a Bachelor Degree with Honours in Electronics and Telecom Engineering from the University of Mumbai and a Masters in Business Administration from the Indian Institute of Management Ahmedabad
•• Previously chief executive officer of
•• Joined Standard Bank (Mauritius) Limited in 2007 as head electronic banking and later as client access manager
•• Holder of a Licence Professionnelle Commerce, option Commerce Electronique from Université de La Reunion and a diplome de technologie, mention Informatique de
head of eBusiness division at the State Bank of Mauritius
•• Previous employed as treasurer at the Hongkong and Shanghai Banking Corporation (HSBC)
Credere Wealth Management in London
•• Previously held the position of associate director at Clariden Leu AG, Clariden Leu Europe, Private Banking, London
•• Worked for Bank of America, Principal Investing Group, Asia for a period of five years and BNP Paribas Private Bank, Mumbai, India for a period of 3 years as an investment advisor
Gestion from the Mauritius Chambers of Commerce and Industry
•• Previously employed at the Hong Kong and Shanghai Banking Corporation (HSBC)
Profile
Profile
Profile

Standard Bank (Mauritius) Limited annual report 2016 65
ENSURING OUR SUSTAINABILITY Corporate governance report continued
Aelander MOOTOOSAMYHead: Human Capital
•• Appointed head: human capital in November 2015 with Standard Bank (Mauritius) Limited
•• Holder of a Bachelor of Commerce, Honours in Human Resource Management and Masters in Social Sciences all from the University of Natal in Durban, South Africa. Also holder of a Masters in Organisational
Psychology from the University of Cape Town
•• Previously employed as the Country head HR of Deutsche Bank, Mauritius
•• Registered Psychologist with the Health Professional Council of South Africa
Profile
Departures: Neekeea RamenHead: Credit
Appointed head of credit in 2006. Employment with Standard Bank (Mauritius) Limited ended in December 2016.
Daniel LAI CHOOHead: Marketing and Communication
•• Joined Standard Bank (Mauritius) Limited in 2011
•• Appointed head: marketing and communication in 2015
•• Holder of a Bachelor of Commerce and a Bachelor of Commerce (Hons) from the University of the Witwatersrand
•• Holder of a Master of Business Administration from the University of Surrey
•• Previously worked at Barclays Mauritius for 15 years
Profile
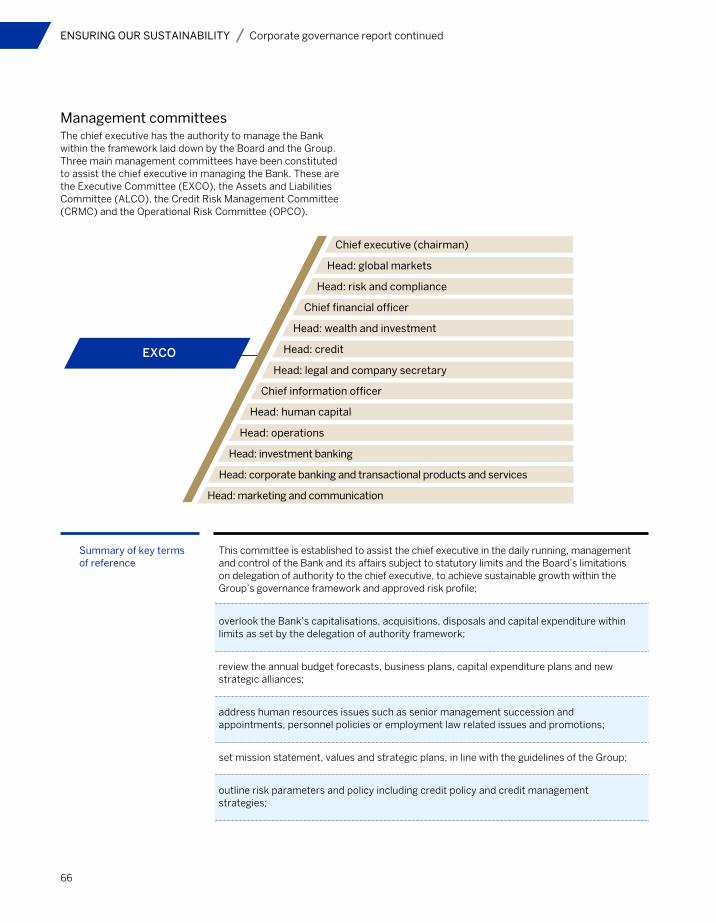
66
ENSURING OUR SUSTAINABILITY Corporate governance report continued
Management committeesThe chief executive has the authority to manage the Bank within the framework laid down by the Board and the Group. Three main management committees have been constituted to assist the chief executive in managing the Bank. These are the Executive Committee (EXCO), the Assets and Liabilities Committee (ALCO), the Credit Risk Management Committee (CRMC) and the Operational Risk Committee (OPCO).
EXCO
Chief executive (chairman)
Head: wealth and investment
Head: corporate banking and transactional products and services
Head: marketing and communication
Head: human capital
Head: credit
Head: global markets
Head: risk and compliance
Head: legal and company secretary
Head: investment banking
Head: operations
Chief information officer
Chief financial officer
Summary of key terms of reference
This committee is established to assist the chief executive in the daily running, management and control of the Bank and its affairs subject to statutory limits and the Board’s limitations on delegation of authority to the chief executive, to achieve sustainable growth within the Group’s governance framework and approved risk profile;
overlook the Bank’s capitalisations, acquisitions, disposals and capital expenditure within limits as set by the delegation of authority framework;
review the annual budget forecasts, business plans, capital expenditure plans and new strategic alliances;
address human resources issues such as senior management succession and appointments, personnel policies or employment law related issues and promotions;
set mission statement, values and strategic plans, in line with the guidelines of the Group;
outline risk parameters and policy including credit policy and credit management strategies;
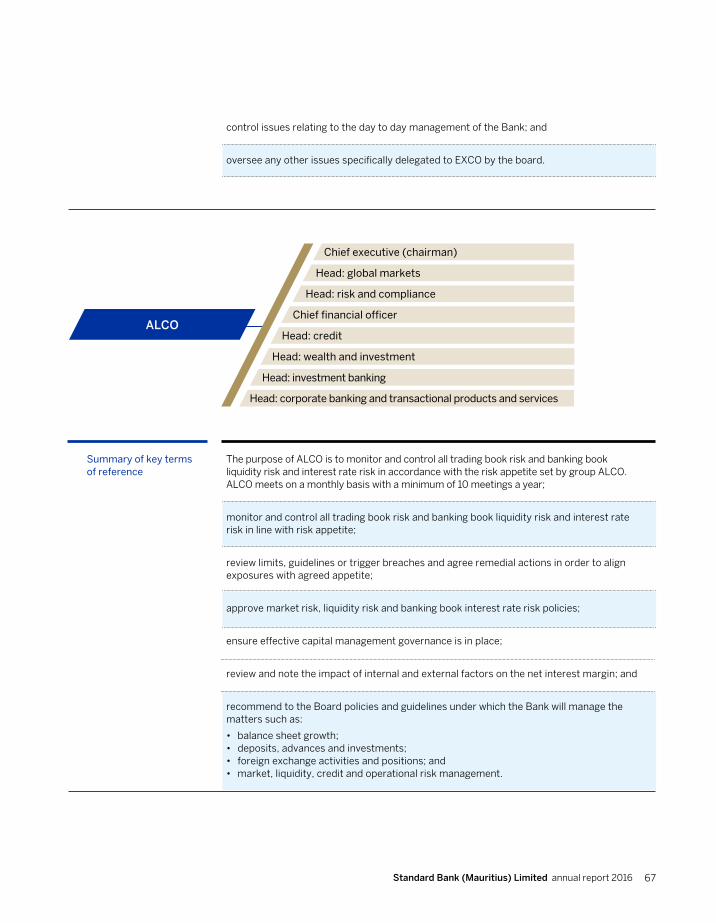
Standard Bank (Mauritius) Limited annual report 2016 67
ENSURING OUR SUSTAINABILITY Corporate governance report continued
Summary of key terms of reference
The purpose of ALCO is to monitor and control all trading book risk and banking book liquidity risk and interest rate risk in accordance with the risk appetite set by group ALCO. ALCO meets on a monthly basis with a minimum of 10 meetings a year;
monitor and control all trading book risk and banking book liquidity risk and interest rate risk in line with risk appetite;
review limits, guidelines or trigger breaches and agree remedial actions in order to align exposures with agreed appetite;
approve market risk, liquidity risk and banking book interest rate risk policies;
ensure effective capital management governance is in place;
review and note the impact of internal and external factors on the net interest margin; and
recommend to the Board policies and guidelines under which the Bank will manage the matters such as:
•• balance sheet growth;•• deposits, advances and investments;•• foreign exchange activities and positions; and•• market, liquidity, credit and operational risk management.
control issues relating to the day to day management of the Bank; and
oversee any other issues specifically delegated to EXCO by the board.
ALCO
Chief executive (chairman)
Head: credit
Head: wealth and investment
Head: global markets
Head: risk and compliance
Head: investment banking
Head: corporate banking and transactional products and services
Chief financial officer
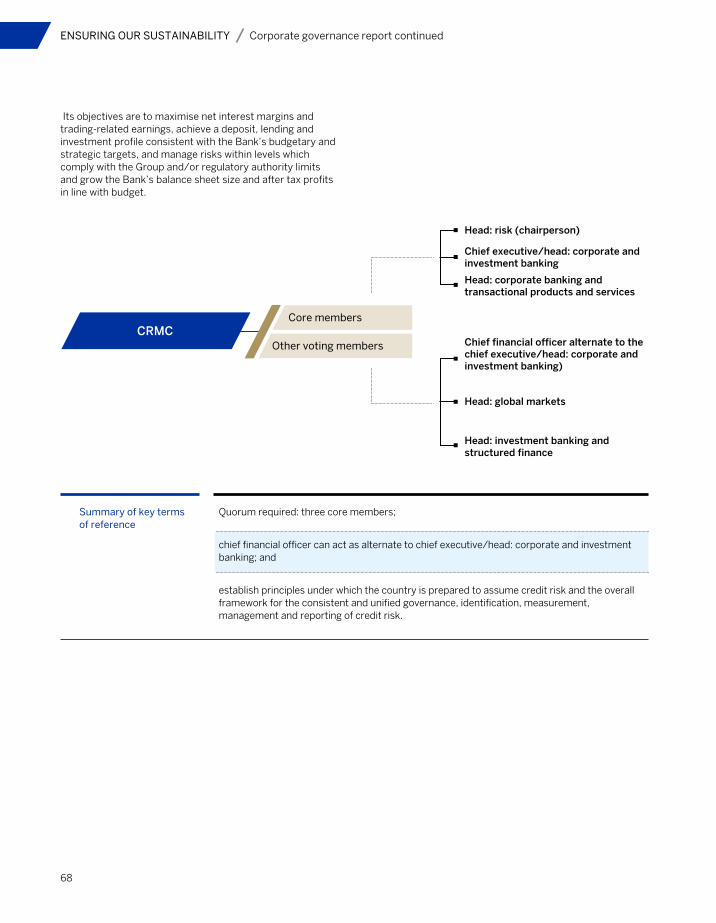
68
ENSURING OUR SUSTAINABILITY Corporate governance report continued
Its objectives are to maximise net interest margins and trading-related earnings, achieve a deposit, lending and investment profile consistent with the Bank’s budgetary and strategic targets, and manage risks within levels which comply with the Group and/or regulatory authority limits and grow the Bank’s balance sheet size and after tax profits in line with budget.
CRMCCore members
Other voting members
Head: risk (chairperson)
Chief executive/head: corporate and investment banking
Head: corporate banking and transactional products and services
Head: global markets
Head: investment banking and structured finance
Chief financial officer alternate to the chief executive/head: corporate and investment banking)
Summary of key terms of reference
Quorum required: three core members;
chief financial officer can act as alternate to chief executive/head: corporate and investment banking; and
establish principles under which the country is prepared to assume credit risk and the overall framework for the consistent and unified governance, identification, measurement, management and reporting of credit risk.
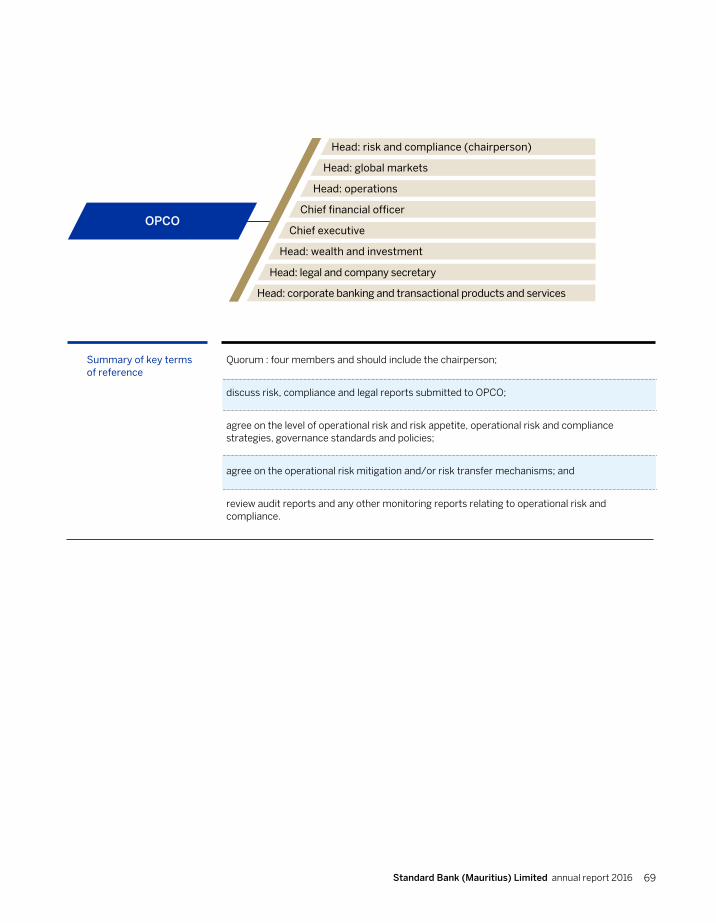
Standard Bank (Mauritius) Limited annual report 2016 69
ENSURING OUR SUSTAINABILITY Corporate governance report continued
Summary of key terms of reference
Quorum : four members and should include the chairperson;
discuss risk, compliance and legal reports submitted to OPCO;
agree on the level of operational risk and risk appetite, operational risk and compliance strategies, governance standards and policies;
agree on the operational risk mitigation and/or risk transfer mechanisms; and
review audit reports and any other monitoring reports relating to operational risk and compliance.
OPCO
Head: risk and compliance (chairperson)
Chief executive
Head: wealth and investment
Head: global markets
Head: operations
Head: legal and company secretary
Head: corporate banking and transactional products and services
Chief financial officer
70
ENSURING OUR SUSTAINABILITY Corporate governance report continued
Statement of remuneration philosophyGovernanceAt the heart of our strategy lies the value we place on our people. Thus effective management and remuneration of our talent is a core competency in the Bank. Rewards provide one of the most powerful strategic methods for a manager to motivate staff and are fundamentally linked with budget management. The Group aims to have remuneration policies and programmes that will enable it to attract, retain and motivate the top calibre talent that supports organisational objectives.
The Bank aims to apply this policy in line with the Group remuneration strategy and therefore endeavours to:
•• apply the full range of rewards to attract, retain and deploy teams of people with passion and skills;
•• provide a reward package, including long and short term incentives, that is understood, supported and valued by our people and recognises competencies and behaviours/values that help foster organisational success;
•• improve the equity, transparency, communication and education of the reward philosophy, the reward elements, the pay structures and market salary data;
•• facilitate the up skilling of line management to become owners of the ‘pay decision’ and committed to the ‘pay for contribution’ principle; and
•• allows the Bank to compete effectively in the labour market and to attract and retain highly competent staff with remuneration practices that are more sensitive to the diverse needs of our people throughout Africa.
In the course of 2016, the Bank participated in the annual local Banking survey run by KORNFERRY- HAY (America).The results were made available to the senior executive team. This allowed the managers to gauge where the remuneration of their various resources is pitched compared to the
market. The Bank aims at paying at least as per median for all positions, and up to the 75th percentile for scarce skills in the local market.
Talent management frameworkThe Bank’s talent management process aims to improve the Bank’s ability to engage critical talent and develop the capability of our people. It has become critical that we develop the capabilities of our people, have clear roles and deliverables, live by common values and establish a culture which is based on confidence and client excellence.
The Group talent approach complements its existing performance management system to help develop our people and motivate them to perform. This group approach enables us to develop a clearer understanding of capabilities needed across the Bank, as well as identify and fill capability gaps/shortages in critical areas by balancing internal development and mobility with external hiring.
Key outcomes of our improved talent process are to have a proper engagement with talent on career aspirations and progression; and to build succession for critical roles within the franchise.
In country, as part of the strategic goals for 2016, a talent identification & development programme project plan has been put in place to ensure that Talent in the Bank is developed and retained. Key development programmes have been put in place to ensure the tracking of talent.
Recognition programmeRecognising employees who go the extra mile is an integral part of the Standard Bank way to build a high performing organisation. There are different programmes which the Bank has initiated in its recognition endeavour. Since 2016, the Bank has embraced the Group practice and introduced the Mark of Excellence programme. The Mark of Excellence is a high-profile annual recognition award ceremony and recognition rewards are designed to recognise the top performers within each Business Unit
(BU) and Group Enabling Function (GEF) and the Bank, has followed suit by recognising it’s top performers across the Bank.
The Beyond Excellence programme is another method used by all employees to recognise colleagues who stand out as exceptional performers above and beyond what is considered part of the day-to-day job. In this programme, there are three recognition schemes:
•• Everyday recognition is an instant recognition scheme that line managers can give to reward their direct reports, such as:
•• thank you rewards: certificates, plaques, handwritten notes, public recognition;•• time off and leave: recognition
days (an extra day off - up to four per year); and•• discretionary rewards: treats such
as chocolate, restaurant vouchers, theatre tickets, spa vouchers, shopping vouchers, etc.
•• Everyone recognition is designed for colleague-to-colleague recognition. An employee can nominate a colleague for a recognition reward from his line manager.
During 2016 the Beyond Excellence recognition programme was very well supported by the various business units and a total 50 employees were recognised during the year. These awards are nominations based and are conditional on business performance.
Chief executiveThe chief executive receives a remuneration package and qualifies for long term incentives. He is not subject to a retention agreement. The components of his package are as follows:
•• guaranteed remuneration - based on his market value and the role that he plays;
•• annual bonus incentive - used to incentivise the achievement of group objectives; and
•• pension - provides a competitive post-retirement benefit in line with group employees.
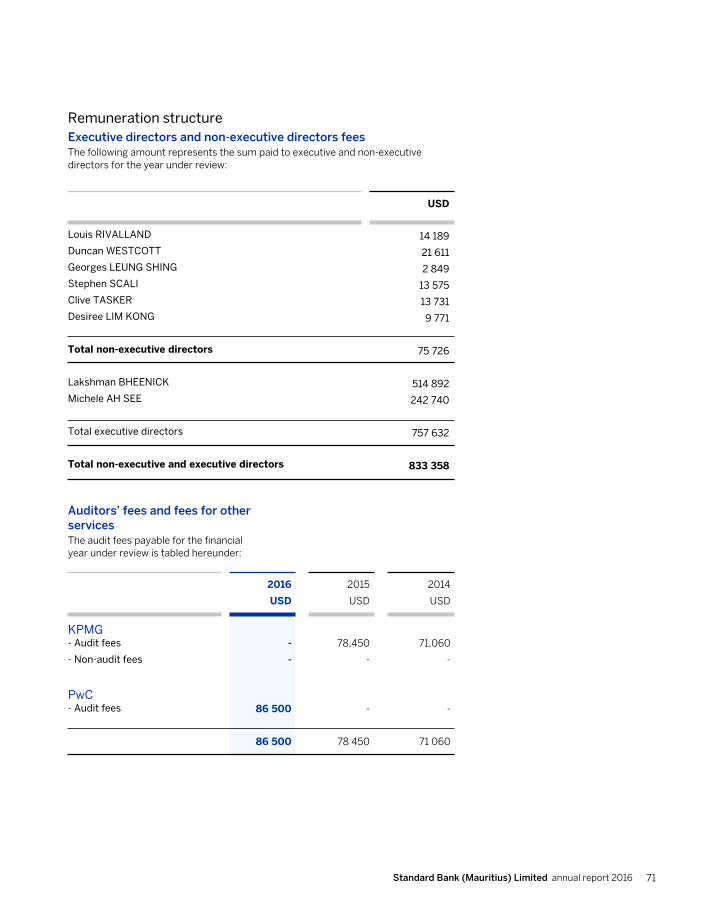
Standard Bank (Mauritius) Limited annual report 2016 71
ENSURING OUR SUSTAINABILITY Corporate governance report continued
Remuneration structure Executive directors and non-executive directors feesThe following amount represents the sum paid to executive and non-executive directors for the year under review:
Auditors’ fees and fees for other servicesThe audit fees payable for the financial year under review is tabled hereunder:
Louis RIVALLAND
Duncan WESTCOTT
Georges LEUNG SHING
Stephen SCALI
Clive TASKER
Desiree LIM KONG
Total non-executive directors
Lakshman BHEENICK
Michele AH SEE
Total executive directors
Total non-executive and executive directors
USD
14 189
21 611
2 849
13 575
13 731
9 771
75 726
514 892
242 740
757 632
833 358
KPMG - Audit fees
- Non-audit fees
PwC- Audit fees
2016
USD
-
-
86 500
86 500
2015
USD
78,450
-
-
78 450
2014
USD
71,060
-
-
71 060
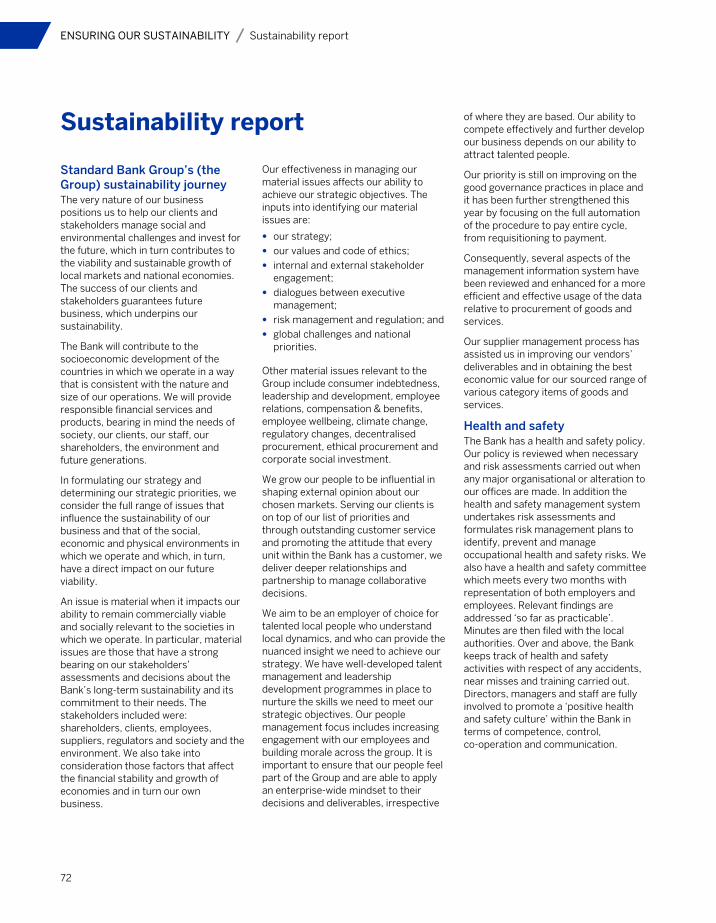
72
ENSURING OUR SUSTAINABILITY Sustainability report
Standard Bank Group’s (the Group) sustainability journeyThe very nature of our business positions us to help our clients and stakeholders manage social and environmental challenges and invest for the future, which in turn contributes to the viability and sustainable growth of local markets and national economies. The success of our clients and stakeholders guarantees future business, which underpins our sustainability.
The Bank will contribute to the socioeconomic development of the countries in which we operate in a way that is consistent with the nature and size of our operations. We will provide responsible financial services and products, bearing in mind the needs of society, our clients, our staff, our shareholders, the environment and future generations.
In formulating our strategy and determining our strategic priorities, we consider the full range of issues that influence the sustainability of our business and that of the social, economic and physical environments in which we operate and which, in turn, have a direct impact on our future viability.
An issue is material when it impacts our ability to remain commercially viable and socially relevant to the societies in which we operate. In particular, material issues are those that have a strong bearing on our stakeholders’ assessments and decisions about the Bank’s long-term sustainability and its commitment to their needs. The stakeholders included were: shareholders, clients, employees, suppliers, regulators and society and the environment. We also take into consideration those factors that affect the financial stability and growth of economies and in turn our own business.
Our effectiveness in managing our material issues affects our ability to achieve our strategic objectives. The inputs into identifying our material issues are:
•• our strategy;
•• our values and code of ethics;
•• internal and external stakeholder engagement;
•• dialogues between executive management;
•• risk management and regulation; and
•• global challenges and national priorities.
Other material issues relevant to the Group include consumer indebtedness, leadership and development, employee relations, compensation & benefits, employee wellbeing, climate change, regulatory changes, decentralised procurement, ethical procurement and corporate social investment.
We grow our people to be influential in shaping external opinion about our chosen markets. Serving our clients is on top of our list of priorities and through outstanding customer service and promoting the attitude that every unit within the Bank has a customer, we deliver deeper relationships and partnership to manage collaborative decisions.
We aim to be an employer of choice for talented local people who understand local dynamics, and who can provide the nuanced insight we need to achieve our strategy. We have well-developed talent management and leadership development programmes in place to nurture the skills we need to meet our strategic objectives. Our people management focus includes increasing engagement with our employees and building morale across the group. It is important to ensure that our people feel part of the Group and are able to apply an enterprise-wide mindset to their decisions and deliverables, irrespective
of where they are based. Our ability to compete effectively and further develop our business depends on our ability to attract talented people.
Our priority is still on improving on the good governance practices in place and it has been further strengthened this year by focusing on the full automation of the procedure to pay entire cycle, from requisitioning to payment.
Consequently, several aspects of the management information system have been reviewed and enhanced for a more efficient and effective usage of the data relative to procurement of goods and services.
Our supplier management process has assisted us in improving our vendors’ deliverables and in obtaining the best economic value for our sourced range of various category items of goods and services.
Health and safetyThe Bank has a health and safety policy. Our policy is reviewed when necessary and risk assessments carried out when any major organisational or alteration to our offices are made. In addition the health and safety management system undertakes risk assessments and formulates risk management plans to identify, prevent and manage occupational health and safety risks. We also have a health and safety committee which meets every two months with representation of both employers and employees. Relevant findings are addressed ‘so far as practicable’. Minutes are then filed with the local authorities. Over and above, the Bank keeps track of health and safety activities with respect of any accidents, near misses and training carried out. Directors, managers and staff are fully involved to promote a ‘positive health and safety culture’ within the Bank in terms of competence, control, co-operation and communication.
Sustainability report

Standard Bank (Mauritius) Limited annual report 2016 73
ENSURING OUR SUSTAINABILITY Sustainability report
Energy consumptionWe are dedicated to reducing the company’s carbon footprint and improving its energy efficiency. Our long-term objective is to implement an energy management strategy with achievable targets across all our operations with the lessons learnt in South Africa used to drive energy efficiency in our operations on the rest of the continent. The amount spent on electricity to perform our day-to-day activities is approximately MUR9 million a year for the Mauritius operation, thus managing this cost materially contributes to our sustainable long term financial performance.
Initiatives for energy efficiencies which were implemented in 2015 were sustained for 2016 and these include monitoring as well as sensitisation. The energy consumed in the Bank was 1,097,106 kilowatt hours (2015: 1,093,975 kilowatt hours).
Diesel Consumption for 2016 was nil as was the case in 2015 due to the fact that we had no significant power cuts.
CommunityOur Corporate Social Responsibility (CSR) projects are aimed at achieving and sustaining positive social development of the communities we operate in. Through various community interventions, our effective community re-investment further reinforces our values and achieves our business objectives. The Bank’s CSR initiatives are funded by an annual allocation of two percent of its chargeable income of the previous year.
Our main areas of intervention remained health, education and environment in 2016.
EducationEducation is the driving force behind uplifting society and the Bank firmly believes that education promotes socioeconomic development. Our involvement in this area is through:
ScholarshipsIn 2016, the total number of students benefiting from the Standard Bank scholarship amounted to thirty, with the
Bank financing their university fees as well as providing a monthly stipend to each beneficiary.
Case Noyale RCAThe Bank supported this Non-Governmental Organisation (NGO) with daily meal provision to the school children and renovation of school toilets.
Quartier de LumiereSupported the provision of materials and food for creative workshops (IT, painting, music) for underprivileged kids.
EnvironmentWe firmly believe that it is our responsibility to manage the environmental and social impacts that our activities, products and services have on society and to respond to critical environmental issues. During the year, we supported Eli Africa on environmental projects such as mangroves and endemic flora reforestation.
HealthDuring the year, we were quite active in assisting various NGOs.
Lois Lagesse Trust Fund
Mauritius Mental Health Association
Rêves et Espoirs
Friends in Hope
Mega blood donation
Etoile d’Espérance
Funded the purchase of braille papers, contribution for renovation of Lois Lagesse School for blinds
Supported MMHA daily food program for 125 beneficiaries with intellectual disabilities
Supported the yearly cost for services provided by psychologist
Funded the supply of materials for various workshops (therapy, art and craft, kitchen, gardening, sports and music)
A blood donation was organised for the 15th anniversary of the Bank in Mauritius. A total of 279 pints of blood were collected
The Bank extended its support by making monetary contributions towards the food and drink expenses of the NGO
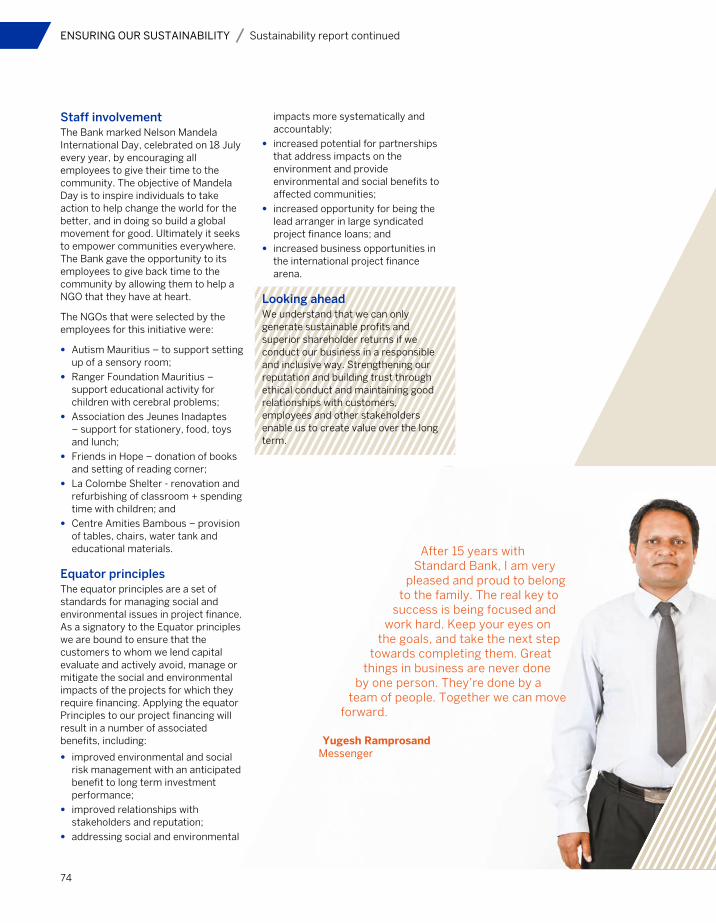
74
ENSURING OUR SUSTAINABILITY Sustainability report continued
Staff involvementThe Bank marked Nelson Mandela International Day, celebrated on 18 July every year, by encouraging all employees to give their time to the community. The objective of Mandela Day is to inspire individuals to take action to help change the world for the better, and in doing so build a global movement for good. Ultimately it seeks to empower communities everywhere. The Bank gave the opportunity to its employees to give back time to the community by allowing them to help a NGO that they have at heart.
The NGOs that were selected by the employees for this initiative were:
•• Autism Mauritius – to support setting up of a sensory room;
•• Ranger Foundation Mauritius – support educational activity for children with cerebral problems;
•• Association des Jeunes Inadaptes – support for stationery, food, toys and lunch;
•• Friends in Hope – donation of books and setting of reading corner;
•• La Colombe Shelter - renovation and refurbishing of classroom + spending time with children; and
•• Centre Amities Bambous – provision of tables, chairs, water tank and educational materials.
Equator principlesThe equator principles are a set of standards for managing social and environmental issues in project finance. As a signatory to the Equator principles we are bound to ensure that the customers to whom we lend capital evaluate and actively avoid, manage or mitigate the social and environmental impacts of the projects for which they require financing. Applying the equator Principles to our project financing will result in a number of associated benefits, including:
•• improved environmental and social risk management with an anticipated benefit to long term investment performance;
•• improved relationships with stakeholders and reputation;
•• addressing social and environmental
impacts more systematically and accountably;
•• increased potential for partnerships that address impacts on the environment and provide environmental and social benefits to affected communities;
•• increased opportunity for being the lead arranger in large syndicated project finance loans; and
•• increased business opportunities in the international project finance arena.
Looking aheadWe understand that we can only generate sustainable profits and superior shareholder returns if we conduct our business in a responsible and inclusive way. Strengthening our reputation and building trust through ethical conduct and maintaining good relationships with customers, employees and other stakeholders enable us to create value over the long term.
After 15 years with Standard Bank, I am very
pleased and proud to belong to the family. The real key to
success is being focused and work hard. Keep your eyes on
the goals, and take the next step towards completing them. Great
things in business are never done by one person. They’re done by a
team of people. Together we can move forward.
Yugesh RamprosandMessenger
ENSURING OUR SUSTAINABILITY Sustainability report continued
(Section 75 (3) of the Financial Reporting Act)
Name of public interest entity: Standard Bank (Mauritius) Limited
Reporting period: year ended 31 December 2016We, the Directors of Standard Bank (Mauritius) Limited, confirm that to the best of our knowledge the PIE has not complied with section 3.5 of the code and the reasons for non-compliance are as follows:
Corporate governance committeeThere is no corporate governance committee as all corporate governance matters are taken up at the full board.
Statement of compliance
Chairman Chief ExecutiveLouis Rivalland Lakshman Bheenick
22 March 2017
Standard Bank (Mauritius) Limited annual report 2016 75
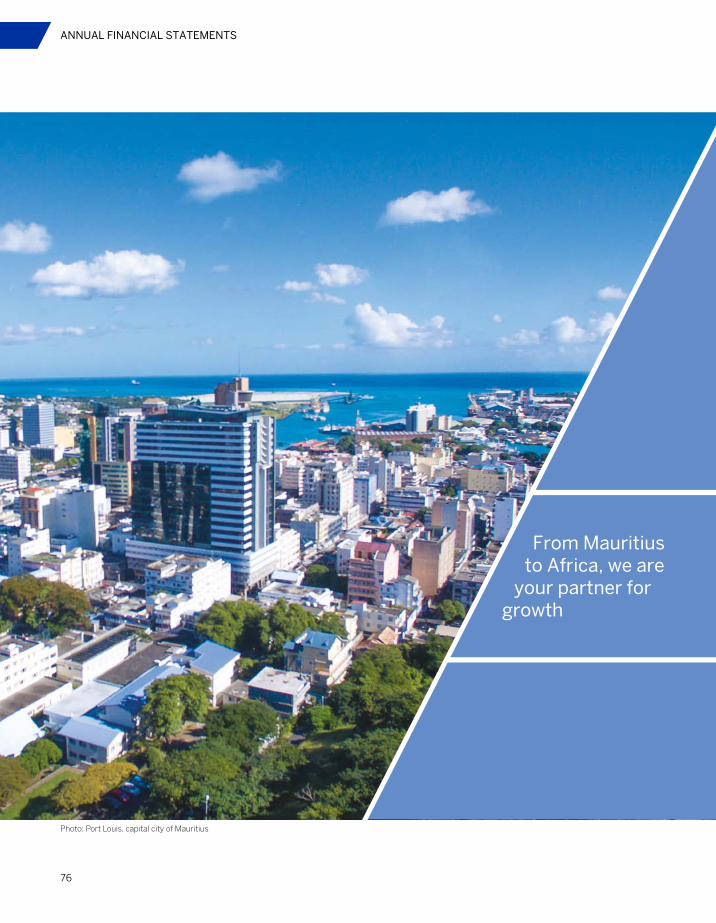
76
ANNUAL FINANCIAL STATEMENTS
Photo: Port Louis, capital city of Mauritius
From Mauritius to Africa, we are
your partner for growth
Standard Bank (Mauritius) Limited annual report 2016 77
The financial statements for the Bank’s operations in Mauritius presented in this annual report have been prepared by management, which is responsible for their integrity, consistency, objectivity and reliability. International Financial Reporting Standards as well as the requirements of the Banking Act 2004 and the guidelines issued there under have been applied and management has exercised its judgement and made best estimates where deemed necessary.
The Bank has designed and maintained its accounting systems, related internal controls and supporting procedures, to provide reasonable assurance that financial records are complete and accurate and that assets are safeguarded against loss from unauthorised use or disposal. These supporting procedures include careful selection and training of qualified staff, the implementation of organisation and governance structures providing a well-defined division of responsibilities, authorisation levels and accountability for performance, and the communication of the Bank’s policies, procedures manuals and guidelines of the BoM throughout the Bank.
The Bank’s board of directors, acting in part through the audit committee and conduct review committee and risk policy committee which comprise independent directors who are not officers or employees of the Bank, oversees management’s responsibility for financial reporting, internal controls, assessment and control of major risk areas, and assessment of significant and related party transactions.
The Bank’s internal auditor, who has full and free access to the audit committee, conducts a well designed program of internal audits in coordination with the Bank’s external auditors. In addition, the Bank’s compliance function maintains policies, procedures and programs directed at ensuring compliance with regulatory requirements.
Pursuant to the provisions of the Banking Act 2004, the BoM makes such examination and inquiry into the operations and affairs of the Bank as it deems necessary.
The Bank’s external auditors, PwC, have full and free access to the Board and its committees to discuss the audit and matters arising there from, such as their observations and fairness of financial reporting and the adequacy of internal controls.
Statement of management’s responsibility for financial reporting
Louis Rivalland Duncan Westcott Lakshman BheenickChairman Director Chief Executive
22 March 2017
ANNUAL FINANCIAL STATEMENTS
78
ANNUAL FINANCIAL STATEMENTS Statement of management ‘s responsibility for financial reporting
Company law requires the directors to prepare financial statements for each financial year which present fairly the financial position, financial performance and cash flows of the Standard Bank (Mauritius) Limited (the Bank). In preparing those financial statements, the directors are required to:
•• select suitable accounting policies and then apply them consistently;
•• make judgements and estimates that are reasonable and prudent;
•• state whether International financial reporting standards have been followed, subject to any material departures disclosed and explained in the financial statements; and
•• prepare the financial statements on the going concern basis unless it is inappropriate to presume that the Bank will continue in business.
The directors confirm that they have complied with the above requirements in preparing the financial statements.
The directors are responsible for keeping proper accounting records which disclose with reasonable accuracy at any time the financial position of the Bank and to enable them to ensure that the financial statements comply with the Mauritian Companies Act 2001. They are also responsible for safeguarding the assets of the Bank and hence for taking reasonable steps for the prevention and detection of fraud and other irregularities.
Statement of directors’ responsibilities in respect of the financial statements
Louis Rivalland Duncan Westcott Lakshman BheenickChairman Director Chief Executive
22 March 2017
Standard Bank (Mauritius) Limited annual report 2016 79
ANNUAL FINANCIAL STATEMENTS Statement of management ‘s responsibility for financial reporting
In accordance with section 166 (d) of the Companies Act 2001, we certify that to the best of our knowledge and belief, the Bank has filed with the Registrar of Companies, all such returns as are required of the Bank under the Companies Act 2001.
Secretary’s certificate
Company Secretary
22 March 2017
80
ANNUAL FINANCIAL STATEMENTS Independent auditor’s report to the shareholder of Standard Bank (Mauritius) Limited
8080
Report on the Audit of the Financial Statements
Our opinionIn our opinion, the financial statements give a true and fair view of the financial position of Standard Bank (Mauritius) Limited (the Bank) as at 31 December 2016 and of its financial performance and its cash flows for the year then ended in accordance with International Financial Reporting Standards and in compliance with the Mauritian Companies Act 2001.
What we have audited• The financial statements of Standard Bank (Mauritius) Limited set out on pages 83 to 166 comprise:
• the statement of financial position as at 31 December 2016;
• the statement of profit or loss and other comprehensive income for the year then ended;
• the statement of cash flows for the year then ended;
• the statement of changes in equity for the year then ended; and
• the notes comprising significant accounting policies and other explanatory information.
Certain required disclosures have been presented elsewhere in the annual report, rather than in the notes to the financial statements. These disclosures are cross-referenced from the financial statements and are identified as audited.
Basis for opinionWe conducted our audit in accordance with International Standards on Auditing (ISAs). Our responsibilities under those standards are further described in the “Auditor’s Responsibilities for the Audit of the Financial Statements” section of our report.
We believe that the audit evidence we have obtained is sufficient and appropriate to provide a basis for our opinion.
Independence We are independent of the Bank in accordance with the ‘International Ethics Standards Board for Accountants’ Code of Ethics for Professional Accountants (IESBA Code). We have fulfilled our other ethical responsibilities in accordance with the IESBA Code.
Other InformationThe directors are responsible for the other information. The other information comprises the financial highlights, the strategy, the non-financial performance, the Chairman and Chief Executive’s review, the macroeconomic review, the management discussion and analysis, the corporate governance report, the sustainability report, the statement of compliance, the statement of management’s responsibility for financial reporting, the statement of directors and the secretary’s certificate but does not include the financial statements and our auditor’s report thereon.
Our opinion on the financial statements does not cover the other information and we do not express any form of assurance conclusion thereon. Our reporting responsibilities regarding the corporate governance report is dealt with in the “Report on Other Legal and Regulatory Requirements” section of this report.
In connection with our audit of the financial statements, our responsibility is to read the other information identified above and, in doing so, consider whether the other information is materially inconsistent with the financial statements or our knowledge obtained in the audit, or otherwise appears to be materially misstated.
If, based on the work we have performed on the other information, we conclude that there is a material misstatement of this other information, we are required to report that fact. We have nothing to report in this regard.
Independent Auditor’s Report to the shareholder of Standard Bank (Mauritius) Limited
Standard Bank (Mauritius) Limited annual report 2016 81
Report on the Audit of the Financial Statements (continued)
Responsibilities of the Directors for the Financial Statements The Bank’s directors are responsible for the preparation and fair presentation of these financial statements in accordance with International Financial Reporting Standards and in compliance with the requirements of the Mauritian Companies Act 2001, the Mauritian Banking Act 2004 and regulations and guidelines of the BoM and for such internal control as the directors determine is necessary to enable the preparation of financial statements that are free from material misstatement, whether due to fraud or error.
In preparing the financial statements, the directors are responsible for assessing the Bank’s ability to continue as a going concern, disclosing, as applicable, matters related to going concern and using the going concern basis of accounting unless the directors either intend to liquidate the Bank or to cease operations, or have no realistic alternative but to do so.
The directors are responsible for overseeing the financial reporting process.
Auditor’s Responsibilities for the Audit of the Financial Statements Our objectives are to obtain reasonable assurance about whether the financial statements as a whole are free from material misstatement, whether due to fraud or error, and to issue an auditor’s report that includes our opinion. Reasonable assurance is a high level of assurance, but is not a guarantee that an audit conducted in accordance with ISAs will always detect a material misstatement when it exists. Misstatements can arise from fraud or error and are considered material if, individually or in the aggregate, they could reasonably be expected to influence the economic decisions of users taken on the basis of these financial statements.
As part of an audit in accordance with ISAs, we exercise professional judgement and maintain professional scepticism throughout the audit. We also:
• Identify and assess the risks of material misstatement of the financial statements, whether due to fraud or error, design and perform audit procedures responsive to those risks, and obtain audit evidence that is sufficient and appropriate to provide a basis for our opinion. The risk of not detecting a material misstatement resulting from fraud is higher than for one resulting from error, as fraud may involve collusion, forgery, intentional omissions, misrepresentations, or the override of internal control.
• Obtain an understanding of internal control relevant to the audit in order to design audit procedures that are appropriate in the circumstances, but not for the purpose of expressing an opinion on the effectiveness of the internal control.
• Evaluate the appropriateness of accounting policies used and the reasonableness of accounting estimates and related disclosures made by the directors.
• Conclude on the appropriateness of the directors’ use of the going concern basis of accounting and, based on the audit evidence obtained, whether a material uncertainty exists related to events or conditions that may cast significant doubt on the Bank’s ability to continue as a going concern. If we conclude that a material uncertainty exists, we are required to draw attention in our auditor’s report to the related disclosures in the financial statements or, if such disclosures are inadequate, to modify our opinion. Our conclusions are based on the audit evidence obtained up to the date of our auditor’s report. However, future events or conditions may cause the Bank to cease to continue as a going concern.
• Evaluate the overall presentation, structure and content of the financial statements, including the disclosures, and whether the financial statements represent the underlying transactions and events in a manner that achieves fair presentation.
We communicate with the directors regarding, among other matters, the planned scope and timing of the audit and significant audit findings, including any significant deficiencies in internal control that we identify during our audit.
Independent Auditor’s Report to the shareholder of Standard Bank (Mauritius) Limited
82
ANNUAL FINANCIAL STATEMENTS Independent auditor’s report to the shareholder of Standard Bank (Mauritius) Limited continued
Report on the Audit of the Financial Statements (continued)
Report on Other Legal and Regulatory Requirements
Mauritian Companies Act 2001 The Mauritian Companies Act 2001 requires that in carrying out our audit we consider and report to you on the following matters. We confirm that:
(a) we have no relationship with or interests in the Bank other than in our capacity as auditor;
(b) we have obtained all the information and explanations we have required; and
(c) in our opinion, proper accounting records have been kept by the Bank as far as appears from our examination of those records.
Mauritian Banking Act 2004 The Mauritian Banking Act 2004 requires that in carrying out our audit we consider and report to you on the following matters. We confirm that:
(a) in our opinion, the financial statements have been prepared on a basis consistent with that of the preceding year and are complete, fair and properly drawn up and comply with the Mauritian Banking Act 2004 and the regulations and guidelines issued by the Bank of Mauritius; and
(b) the explanations or information called for or given to us by the officers or agents of the Bank were satisfactory.
Mauritian Financial Reporting Act 2004 The directors are responsible for preparing the corporate governance report. Our responsibility is to report on the extent of compliance with the Code of Corporate Governance (the Code) as disclosed in the annual report on pages 45 to 71 and on whether the disclosure is consistent with the requirements of the Code.
In our opinion, the disclosure in the annual report on pages 45 to 71 is consistent with the requirements of the Code.
Other Matter This report, including the opinion, has been prepared for and only for the Bank’s shareholder in accordance with Section 205 of the Mauritian Companies Act 2001 and for no other purpose. We do not, in giving this opinion, accept or assume responsibility for any other purpose or to any other person to whom this report is shown or into whose hands it may come save where expressly agreed by our prior consent in writing.
PricewaterhouseCoopers Gilles Beesoo, licensed by FRC
22 March 2017
Independent Auditor’s Report to the shareholder of Standard Bank (Mauritius) Limited
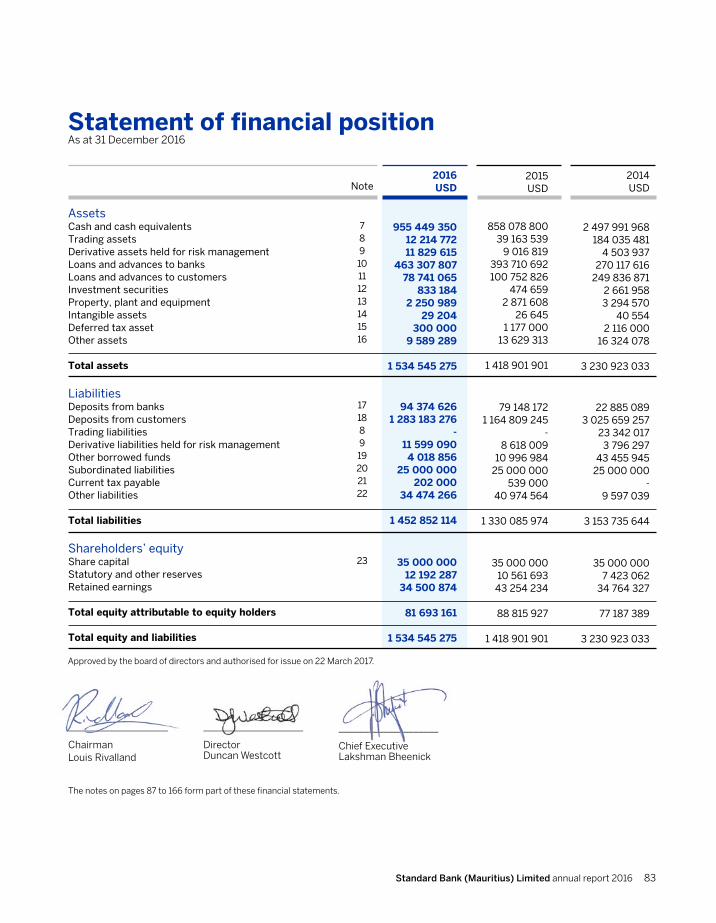
Standard Bank (Mauritius) Limited annual report 2016 83
Statement of financial positionAs at 31 December 2016
AssetsCash and cash equivalentsTrading assetsDerivative assets held for risk managementLoans and advances to banksLoans and advances to customersInvestment securities Property, plant and equipmentIntangible assetsDeferred tax assetOther assets
Total assets
LiabilitiesDeposits from banksDeposits from customersTrading liabilitiesDerivative liabilities held for risk managementOther borrowed fundsSubordinated liabilitiesCurrent tax payableOther liabilities
Total liabilities
Shareholders’ equityShare capitalStatutory and other reservesRetained earnings
Total equity attributable to equity holders
Total equity and liabilities
Approved by the board of directors and authorised for issue on 22 March 2017.
Note
78910111213141516
17188919202122
23
2016USD
955 449 350 12 214 772
11 829 615 463 307 807
78 741 065 833 184
2 250 989 29 204
300 000 9 589 289
1 534 545 275
94 374 626 1 283 183 276
- 11 599 090 4 018 856
25 000 000 202 000
34 474 266
1 452 852 114
35 000 000 12 192 287
34 500 874
81 693 161
1 534 545 275
2015USD
858 078 800 39 163 539
9 016 819 393 710 692 100 752 826
474 659 2 871 608
26 645 1 177 000
13 629 313
1 418 901 901
79 148 172 1 164 809 245
- 8 618 009
10 996 984 25 000 000
539 000 40 974 564
1 330 085 974
35 000 000 10 561 693
43 254 234
88 815 927
1 418 901 901
2014USD
2 497 991 968 184 035 481
4 503 937 270 117 616
249 836 871 2 661 958 3 294 570
40 554 2 116 000
16 324 078
3 230 923 033
22 885 089 3 025 659 257
23 342 017 3 796 297
43 455 945 25 000 000
- 9 597 039
3 153 735 644
35 000 000 7 423 062
34 764 327
77 187 389
3 230 923 033
ANNUAL FINANCIAL STATEMENTS Independent auditor’s report to the shareholder of Standard Bank (Mauritius) Limited continued
____________________
ChairmanLouis Rivalland
____________________
DirectorDuncan Westcott
____________________
Chief ExecutiveLakshman Bheenick
The notes on pages 87 to 166 form part of these financial statements.
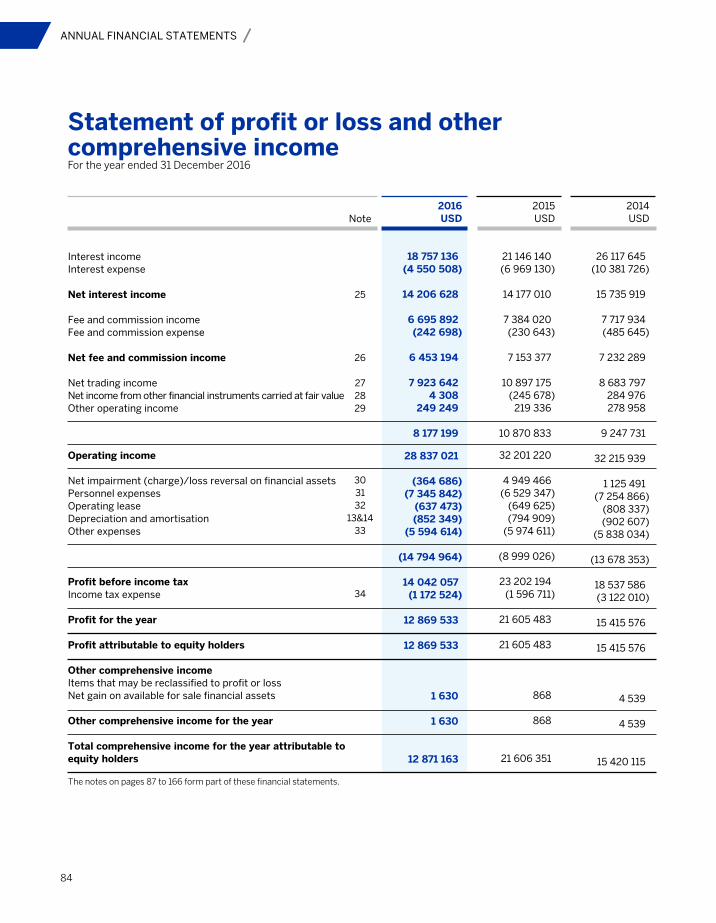
84
ANNUAL FINANCIAL STATEMENTS
Statement of profit or loss and other comprehensive incomeFor the year ended 31 December 2016
Interest income Interest expense Net interest income Fee and commission income Fee and commission expense Net fee and commission income Net trading incomeNet income from other financial instruments carried at fair valueOther operating income
Operating income Net impairment (charge)/loss reversal on financial assetsPersonnel expensesOperating leaseDepreciation and amortisationOther expenses Profit before income tax Income tax expense Profit for the year Profit attributable to equity holders
Other comprehensive incomeItems that may be reclassified to profit or lossNet gain on available for sale financial assets
Other comprehensive income for the year
Total comprehensive income for the year attributable toequity holders
Note
25
26
272829
303132
13&1433
34
2016USD
18 757 136 (4 550 508)
14 206 628
6 695 892(242 698)
6 453 194
7 923 6424 308
249 249
8 177 199
28 837 021
(364 686) (7 345 842)
(637 473) (852 349)
(5 594 614)
(14 794 964)
14 042 057(1 172 524)
12 869 533
12 869 533
1 630
1 630
12 871 163
2015USD
21 146 140 (6 969 130)
14 177 010
7 384 020(230 643)
7 153 377
10 897 175(245 678)
219 336
10 870 833
32 201 220
4 949 466 (6 529 347)
(649 625) (794 909)
(5 974 611)
(8 999 026)
23 202 194(1 596 711)
21 605 483
21 605 483
868
868
21 606 351
2014USD
26 117 645 (10 381 726)
15 735 919
7 717 934(485 645)
7 232 289
8 683 797284 976278 958
9 247 731
32 215 939
1 125 491 (7 254 866)
(808 337) (902 607)
(5 838 034)
(13 678 353)
18 537 586(3 122 010)
15 415 576
15 415 576
4 539
4 539
15 420 115
The notes on pages 87 to 166 form part of these financial statements.
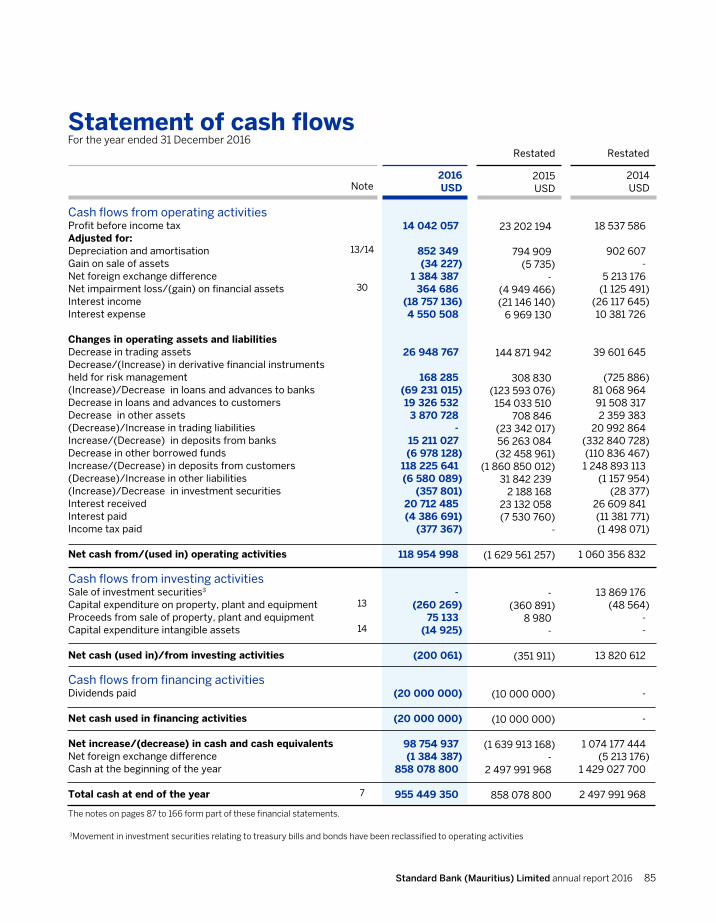
Standard Bank (Mauritius) Limited annual report 2016 85
Statement of cash flowsFor the year ended 31 December 2016
Cash flows from operating activitiesProfit before income taxAdjusted for: Depreciation and amortisationGain on sale of assets Net foreign exchange differenceNet impairment loss/(gain) on financial assets Interest incomeInterest expense
Changes in operating assets and liabilities Decrease in trading assets Decrease/(Increase) in derivative financial instruments held for risk management (Increase)/Decrease in loans and advances to banks Decrease in loans and advances to customers Decrease in other assets (Decrease)/Increase in trading liabilities Increase/(Decrease) in deposits from banks Decrease in other borrowed fundsIncrease/(Decrease) in deposits from customers (Decrease)/Increase in other liabilities (Increase)/Decrease in investment securitiesInterest receivedInterest paidIncome tax paid
Net cash from/(used in) operating activities
Cash flows from investing activitiesSale of investment securities3 Capital expenditure on property, plant and equipment Proceeds from sale of property, plant and equipment Capital expenditure intangible assets
Net cash (used in)/from investing activities
Cash flows from financing activitiesDividends paid
Net cash used in financing activities
Net increase/(decrease) in cash and cash equivalents Net foreign exchange differenceCash at the beginning of the year
Total cash at end of the year
Note
13/14
30
13
14
7
2016USD
14 042 057
852 349(34 227)
1 384 387364 686
(18 757 136)4 550 508
26 948 767
168 285(69 231 015)19 326 532 3 870 728
-15 211 027
(6 978 128) 118 225 641(6 580 089)
(357 801)20 712 485(4 386 691)
(377 367)
118 954 998
- (260 269)
75 133(14 925)
(200 061)
(20 000 000)
(20 000 000)
98 754 937(1 384 387)
858 078 800
955 449 350
2015USD
23 202 194
794 909(5 735)
-(4 949 466)(21 146 140)
6 969 130
144 871 942
308 830(123 593 076)
154 033 510 708 846
(23 342 017)56 263 084
(32 458 961) (1 860 850 012)
31 842 2392 188 168
23 132 058(7 530 760)
-
(1 629 561 257)
- (360 891)
8 980-
(351 911)
(10 000 000)
(10 000 000)
(1 639 913 168)-
2 497 991 968
858 078 800
2014USD
18 537 586
902 607-
5 213 176(1 125 491)
(26 117 645)10 381 726
39 601 645
(725 886) 81 068 964 91 508 317 2 359 383
20 992 864 (332 840 728) (110 836 467)
1 248 893 113 (1 157 954)
(28 377)26 609 841(11 381 771) (1 498 071)
1 060 356 832
13 869 176 (48 564)
--
13 820 612
-
-
1 074 177 444(5 213 176)
1 429 027 700
2 497 991 968
The notes on pages 87 to 166 form part of these financial statements.
3Movement in investment securities relating to treasury bills and bonds have been reclassified to operating activities
Restated Restated
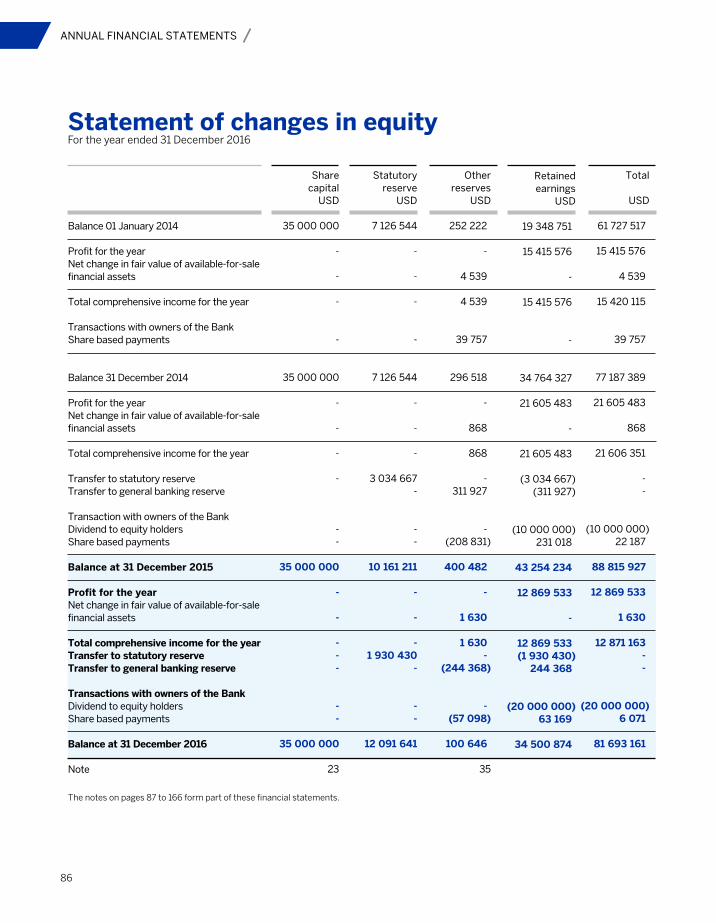
86
ANNUAL FINANCIAL STATEMENTS
Statement of changes in equityFor the year ended 31 December 2016
Balance 01 January 2014
Profit for the yearNet change in fair value of available-for-sale financial assets
Total comprehensive income for the year
Transactions with owners of the BankShare based payments
Balance 31 December 2014
Profit for the yearNet change in fair value of available-for-sale financial assets
Total comprehensive income for the year
Transfer to statutory reserve Transfer to general banking reserve
Transaction with owners of the BankDividend to equity holdersShare based payments
Balance at 31 December 2015
Profit for the yearNet change in fair value of available-for-sale financial assets
Total comprehensive income for the yearTransfer to statutory reserveTransfer to general banking reserve
Transactions with owners of the Bank Dividend to equity holdersShare based payments
Balance at 31 December 2016
Note
Retained earnings
USD
19 348 751
15 415 576
-
15 415 576
-
34 764 327
21 605 483
-
21 605 483
(3 034 667)(311 927)
(10 000 000)231 018
43 254 234
12 869 533
-
12 869 533(1 930 430)
244 368
(20 000 000)63 169
34 500 874
Total
USD
61 727 517
15 415 576
4 539
15 420 115
39 757
77 187 389
21 605 483
868
21 606 351
--
(10 000 000)22 187
88 815 927
12 869 533
1 630
12 871 163--
(20 000 000)6 071
81 693 161
The notes on pages 87 to 166 form part of these financial statements.
Statutory reserve
USD
7 126 544
-
-
-
-
7 126 544
-
-
-
3 034 667-
--
10 161 211
-
-
-1 930 430
-
--
12 091 641
Other reserves
USD
252 222
-
4 539
4 539
39 757
296 518
-
868
868
-311 927
-(208 831)
400 482
-
1 630
1 630-
(244 368)
-(57 098)
100 646
35
Share capital
USD
35 000 000
-
-
-
-
35 000 000
-
-
-
-
--
35 000 000
-
-
---
--
35 000 000
23
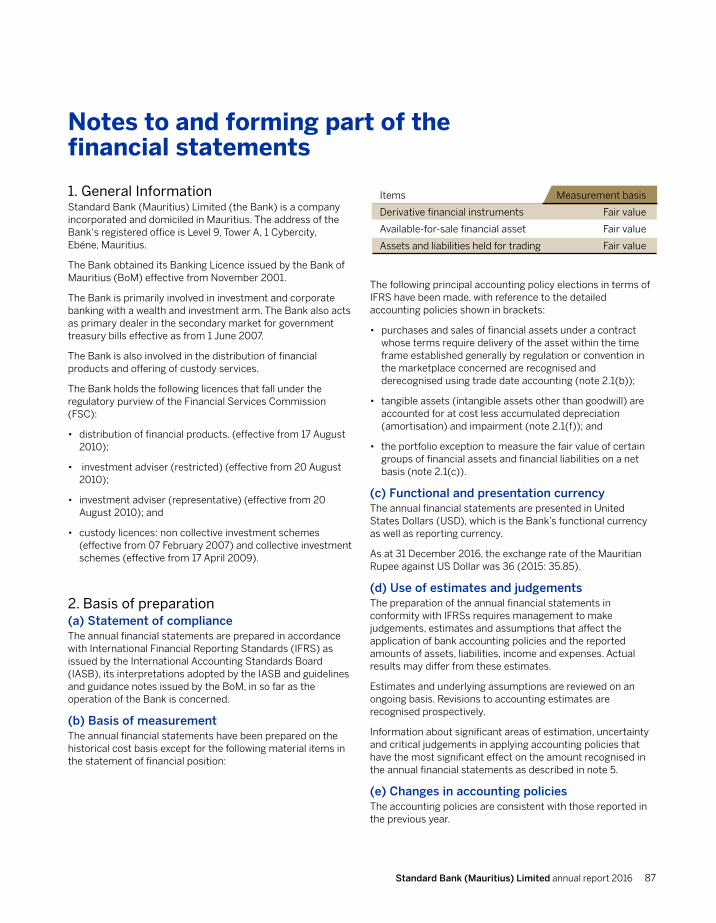
Standard Bank (Mauritius) Limited annual report 2016 87
1. General InformationStandard Bank (Mauritius) Limited (the Bank) is a company incorporated and domiciled in Mauritius. The address of the Bank‘s registered office is Level 9, Tower A, 1 Cybercity, Ebéne, Mauritius.
The Bank obtained its Banking Licence issued by the Bank of Mauritius (BoM) effective from November 2001.
The Bank is primarily involved in investment and corporate banking with a wealth and investment arm. The Bank also acts as primary dealer in the secondary market for government treasury bills effective as from 1 June 2007.
The Bank is also involved in the distribution of financial products and offering of custody services.
The Bank holds the following licences that fall under the regulatory purview of the Financial Services Commission (FSC):
• distribution of financial products. (effective from 17 August 2010);
• investment adviser (restricted) (effective from 20 August 2010);
• investment adviser (representative) (effective from 20 August 2010); and
• custody licences: non collective investment schemes (effective from 07 February 2007) and collective investment schemes (effective from 17 April 2009).
2. Basis of preparation(a) Statement of complianceThe annual financial statements are prepared in accordance with International Financial Reporting Standards (IFRS) as issued by the International Accounting Standards Board (IASB), its interpretations adopted by the IASB and guidelines and guidance notes issued by the BoM, in so far as the operation of the Bank is concerned.
(b) Basis of measurementThe annual financial statements have been prepared on the historical cost basis except for the following material items in the statement of financial position:
Notes to and forming part of the financial statements
Items Measurement basis
Derivative financial instruments Fair value
Available-for-sale financial asset Fair value
Assets and liabilities held for trading Fair value
The following principal accounting policy elections in terms of IFRS have been made, with reference to the detailed accounting policies shown in brackets:
• purchases and sales of financial assets under a contract whose terms require delivery of the asset within the time frame established generally by regulation or convention in the marketplace concerned are recognised and derecognised using trade date accounting (note 2.1(b));
• tangible assets (intangible assets other than goodwill) are accounted for at cost less accumulated depreciation (amortisation) and impairment (note 2.1(f)); and
• the portfolio exception to measure the fair value of certain groups of financial assets and financial liabilities on a net basis (note 2.1(c)).
(c) Functional and presentation currency The annual financial statements are presented in United States Dollars (USD), which is the Bank’s functional currency as well as reporting currency.
As at 31 December 2016, the exchange rate of the Mauritian Rupee against US Dollar was 36 (2015: 35.85).
(d) Use of estimates and judgementsThe preparation of the annual financial statements in conformity with IFRSs requires management to make judgements, estimates and assumptions that affect the application of bank accounting policies and the reported amounts of assets, liabilities, income and expenses. Actual results may differ from these estimates.
Estimates and underlying assumptions are reviewed on an ongoing basis. Revisions to accounting estimates are recognised prospectively.
Information about significant areas of estimation, uncertainty and critical judgements in applying accounting policies that have the most significant effect on the amount recognised in the annual financial statements as described in note 5.
(e) Changes in accounting policiesThe accounting policies are consistent with those reported in the previous year.
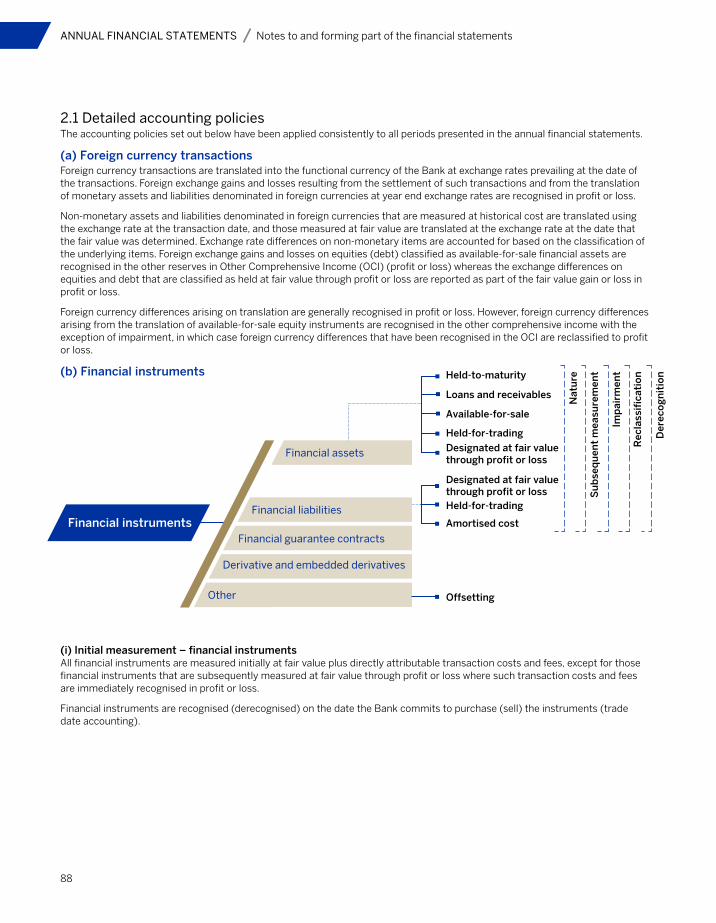
88
ANNUAL FINANCIAL STATEMENTS Notes to and forming part of the financial statements
2.1 Detailed accounting policies The accounting policies set out below have been applied consistently to all periods presented in the annual financial statements.
(a) Foreign currency transactionsForeign currency transactions are translated into the functional currency of the Bank at exchange rates prevailing at the date of the transactions. Foreign exchange gains and losses resulting from the settlement of such transactions and from the translation of monetary assets and liabilities denominated in foreign currencies at year end exchange rates are recognised in profit or loss.
Non-monetary assets and liabilities denominated in foreign currencies that are measured at historical cost are translated using the exchange rate at the transaction date, and those measured at fair value are translated at the exchange rate at the date that the fair value was determined. Exchange rate differences on non-monetary items are accounted for based on the classification of the underlying items. Foreign exchange gains and losses on equities (debt) classified as available-for-sale financial assets are recognised in the other reserves in Other Comprehensive Income (OCI) (profit or loss) whereas the exchange differences on equities and debt that are classified as held at fair value through profit or loss are reported as part of the fair value gain or loss in profit or loss.
Foreign currency differences arising on translation are generally recognised in profit or loss. However, foreign currency differences arising from the translation of available-for-sale equity instruments are recognised in the other comprehensive income with the exception of impairment, in which case foreign currency differences that have been recognised in the OCI are reclassified to profit or loss.
(b) Financial instruments
Held-to-maturity
Loans and receivables
Available-for-sale
Financial instrumentsFinancial guarantee contracts
Financial liabilities
Derivative and embedded derivatives
Other
Financial assets
Held-for-trading
Designated at fair value through profit or loss
Held-for-trading
Designated at fair value through profit or loss
Amortised cost
Offsetting
Nat
ure
Su
bse
qu
ent
mea
sure
men
t
Imp
airm
ent
Rec
lass
ific
atio
n
Der
eco
gn
itio
n(i) Initial measurement – financial instrumentsAll financial instruments are measured initially at fair value plus directly attributable transaction costs and fees, except for those financial instruments that are subsequently measured at fair value through profit or loss where such transaction costs and fees are immediately recognised in profit or loss.
Financial instruments are recognised (derecognised) on the date the Bank commits to purchase (sell) the instruments (trade date accounting).
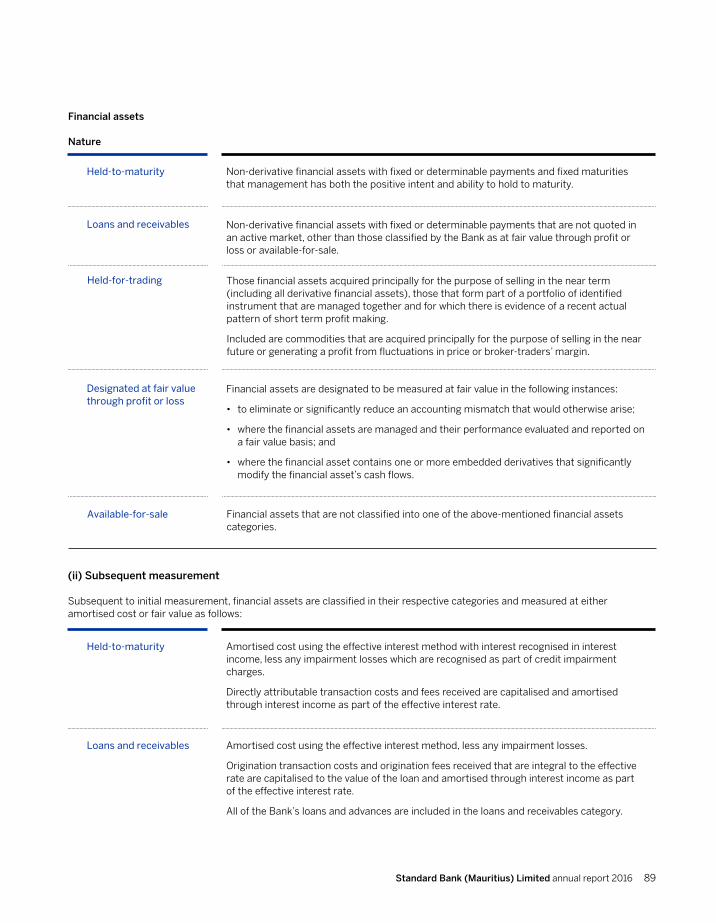
Standard Bank (Mauritius) Limited annual report 2016 89
Held-to-maturity
Loans and receivables
Designated at fair value through profit or loss
Non-derivative financial assets with fixed or determinable payments and fixed maturities that management has both the positive intent and ability to hold to maturity.
Financial assets are designated to be measured at fair value in the following instances:
• to eliminate or significantly reduce an accounting mismatch that would otherwise arise;
• where the financial assets are managed and their performance evaluated and reported on a fair value basis; and
• where the financial asset contains one or more embedded derivatives that significantly modify the financial asset’s cash flows.
Financial assets
Nature
Non-derivative financial assets with fixed or determinable payments that are not quoted in an active market, other than those classified by the Bank as at fair value through profit or loss or available-for-sale.
(ii) Subsequent measurement
Subsequent to initial measurement, financial assets are classified in their respective categories and measured at either amortised cost or fair value as follows:
Available-for-sale Financial assets that are not classified into one of the above-mentioned financial assets categories.
Held-to-maturity
Loans and receivables
Amortised cost using the effective interest method with interest recognised in interest income, less any impairment losses which are recognised as part of credit impairment charges.
Directly attributable transaction costs and fees received are capitalised and amortised through interest income as part of the effective interest rate.
Amortised cost using the effective interest method, less any impairment losses.
Origination transaction costs and origination fees received that are integral to the effective rate are capitalised to the value of the loan and amortised through interest income as part of the effective interest rate.
All of the Bank’s loans and advances are included in the loans and receivables category.
Held-for-trading Those financial assets acquired principally for the purpose of selling in the near term (including all derivative financial assets), those that form part of a portfolio of identified instrument that are managed together and for which there is evidence of a recent actual pattern of short term profit making.
Included are commodities that are acquired principally for the purpose of selling in the near future or generating a profit from fluctuations in price or broker-traders’ margin.
90
ANNUAL FINANCIAL STATEMENTS Notes to and forming part of the financial statements continued
Held-to-maturity loans and receivables (‘amortised cost’)
The following criteria are used in determining whether there is objective evidence of impairment for loans or banks of loans:
• known cash flow difficulties experienced by the borrower;
• a breach of contract, such as default or delinquency in interest and/or principal payments;
• breaches of loan covenants or conditions;
• it becomes probable that the borrower will enter bankruptcy or other financial reorganisation; and
• where the bank, for economic or legal reasons relating to the borrower’s financial difficulty, grants the borrower a concession that the bank would not otherwise consider.
The Bank first assesses whether there is objective evidence of impairment individually for financial assets that are individually significant, and individually or collectively for financial assets that are not individually significant. Loans and advances are analysed on a case-by-case basis and are classified as non-performing when amounts are due and unpaid for 90 days or where there has been a material breach of terms and conditions, the severity of which is highly likely to result in payment default. The impairment of non-performing loans takes account of past loss experience adjusted for changes in economic conditions and the nature and level of risk exposure since the recording of the historic losses.
When a loan carried at amortised cost has been identified as impaired, the carrying amount of the loan is reduced to an amount equal to the present value of estimated future cash flows, including the recoverable amount of any collateral, discounted at the financial asset’s original effective interest rate. The carrying amount of the asset is reduced through the use of a specific credit impairment account and the loss is recognised as a credit impairment charge in profit or loss.
(iii) Impairment
A financial asset is impaired if objective evidence indicates that a loss event has occurred after initial recognition which has a negative effect on the estimated future cash flows of the financial asset that can be estimated reliably. The Bank assesses at each reporting date whether there is objective evidence that a financial asset which is either carried at amortised cost or classified as available-for-sale is impaired as follows:
Available-for-sale
Held-for-trading
Fair value, with gains and losses recognized directly in the available-for-sale reserve until the financial asset is derecognised or impaired.
Interest income on debt financial assets is recognised in interest income in terms of the effective interest rate method. Dividends received on debt (equity) available-for-sale financial assets are recognised in interest income (other revenue) within profit or loss.
When debt (equity) available-for-sale financial assets are disposed of, the cumulative fair value adjustments in OCI are reclassified to interest income (other revenue).
Fair value, with gains and losses arising from changes in fair value (including interest and dividends) recognised in trading revenue.
Designated at fair value through profit or loss
Fair value, with gains and losses recognised in interest income/(other revenue) for all debt/ (equity) financial assets.

Standard Bank (Mauritius) Limited annual report 2016 91
Increases in loan impairments and any subsequent reversals thereof, or recoveries of amounts previously impaired (including loans that have been written off), are reflected within credit impairment charges in profit or loss. Subsequent to impairment, the effects of discounting unwind over time as interest income.
The calculation of the present value of the estimated future cash flows of collateralised financial assets recognised on an amortised cost basis includes cash flows that may result from foreclosure less costs of obtaining and selling the collateral, whether or not foreclosure is probable.
If the Bank determines that no objective evidence of impairment exists for an individually assessed financial asset, whether significant or not, it includes the asset in a bank of financial assets with similar credit risk characteristics and collectively assesses impairment. Assets that are individually assessed for impairment and for which an impairment loss is or continues to be recognised are not included in a collective assessment for impairment.
Impairment of banks of loans that are assessed collectively is recognised where there is objective evidence that a loss event has occurred after the initial recognition of the bank of loans but before the reporting date. In order to provide for latent losses in a bank of loans that have not yet been identified as specifically impaired, a credit impairment for incurred but not reported losses is recognised based on historic loss patterns and estimated emergence periods (time period between the loss event and the date on which the Bank identifies the losses). Groups of loans are also impaired when adverse economic conditions develop after initial recognition, which may impact future cash flows. The carrying amount of groups of loans is reduced through the use of a portfolio credit impairment account and the loss is recognised as a credit impairment charge in profit or loss.
Previously impaired loans are written off once all reasonable attempts at collection have been made and there is no realistic prospect of recovering outstanding amounts.
Available-for-sale Available-for-sale financial assets are impaired when there has been a significant or prolonged decline in the fair value of the instrument below its cost and for equity instruments where there is information about significant changes with an adverse effect on the environment in which the issuer operates that indicates that the cost of the investment in the equity instrument may not be recovered.
When an available-for-sale asset has been identified as impaired, the cumulative loss, measured as the difference between the acquisition price and the current fair value, less any previously recognised impairment losses on that financial asset, is reclassified from OCI to profit or loss.
If, in a subsequent period, the amount relating to impairment loss decreases and the decrease can be linked objectively to an event occurring after the impairment loss was recognised in profit or loss, the impairment loss is reversed through profit or loss for available-for-sale debt instruments. Any reversal of an impairment loss in respect of an available-for-sale equity instrument is recognised directly in OCI.
(iv) Reclassification
Reclassifications of financial assets are permitted only in the following instances:
Held-to-maturity Where the Bank is to sell more than an insignificant amount of held-to-maturity investments, the entire category would be tainted and reclassified as available-for-sale assets with the difference between amortised cost and fair value being accounted for in OCI.
92
ANNUAL FINANCIAL STATEMENTS Notes to and forming part of the financial statements continued
Available-for-sale The Bank may choose to reclassify financial assets that would meet the definition of loans and receivables if the Bank, at the date of reclassification, has the intention and ability to hold these financial assets for the foreseeable future or until maturity.
Held-for-trading The Bank may choose to reclassify held for trading non-derivative financial assets in the following instances:
• if the financial asset is no longer held for the purpose of selling it in the near term and the financial asset would not otherwise have met the definition of loans and receivables, it is permitted to be reclassified only in rare circumstances;
• if the financial asset is no longer held for the purpose of selling it in the near term and the financial asset would have met the definition of loans and receivables, it is permitted to be reclassified if the Bank, at the date of reclassification, has the intention and ability to hold these financial assets for the foreseeable future or until maturity.
Reclassifications are made at fair value as of the reclassification date. Effective interest rates for financial assets reclassified to loans and receivables, held-to-maturity and available-for-sale categories are determined at the reclassification date. Subsequent changes in estimates of cash flows (other than credit impairment charges) adjust the financial asset’s effective interest rates prospectively.
On reclassification of a trading asset, all embedded derivatives are reassessed and, if necessary, accounted for separately.
(v) Financial liabilitiesNature
Held-for-trading Those financial liabilities incurred principally for the purpose of re-purchasing in the near term (including all derivative financial liabilities) and those that form part of a portfolio of identified financial instruments that are managed together and for which there is evidence of a recent actual pattern of short term profit taking.
Designated at fair value through profit or loss
Financial liabilities are designated to be measured at fair value in the following instances:
• to eliminate or significantly reduce an accounting mismatch that would otherwise arise;
• where the financial liabilities are managed and their performance evaluated and reported on a fair value basis; and
• where the financial liability contains one or more embedded derivatives that significantly modify the financial asset’s cash flows.
At amortised cost All other financial liabilities not included the above categories.
(vi) Subsequent measurement
Subsequent to initial measurement, financial liabilities are classified in their respective categories and measured at either amortised cost or fair value as follows:
Held-for-trading Fair value, with gains and losses arising from changes in fair value (including interest and dividends) recognised in trading revenue.
Designated at fair value through profit or loss
Fair value, with gains and losses arising from changes in fair value (including interest) recognised in interest expense.
At amortised cost Amortised cost using the effective interest method with interest recognised in interest expense.
Standard Bank (Mauritius) Limited annual report 2016 93
(vii) Derecognition of financial assets and liabilities
Financial assets and liabilities are derecognised in the following instances:
Financial assets Financial assets are derecognised when the contractual rights to receive cash flows from the financial assets have expired, or where the Bank has transferred its contractual rights to receive cash flows on the financial asset such that it has transferred substantially all the risks and rewards of ownership of the financial asset. Any interest in transferred financial assets that is created or retained by the Bank is recognised as a separate asset or liability.
The Bank enters into transactions whereby it transfers assets recognised in its statement of financial position, but retains either all or a portion of the risks or rewards of the transferred assets. If all or substantially all risks and rewards are retained, then the transferred assets are not derecognised. Transfers of assets with retention of all or substantially all risks and rewards include securities lending and repurchase agreements.
When assets are sold to a third party with a concurrent total rate of return swap on the transferred assets, the transaction is accounted for as a secured financing transaction, similar to repurchase transactions. In transactions where the bank neither retains nor transfers substantially all the risks and rewards of ownership of a financial asset, the asset is derecognised if control over the asset is lost. The rights and obligations retained in the transfer are recognised separately as assets and liabilities as appropriate.
The rights and obligations retained in the transfer are recognised separately as assets and liabilities as appropriate. In transfers where control over the asset is retained, the Bank continues to recognise the asset to the extent of its continuing involvement, determined by the extent to which it is exposed to changes in the value of the transferred asset.
Where an existing financial asset is replaced by another from the same party on substantially different terms, or the terms of an existing financial assets are substantially modified, such an exchange or modification is treated as a derecognition of the original asset and the recognition of a new asset, with the difference in the respective carrying amounts being recognised in profit or loss.
In all other instances, the renegotiated asset or liability’s effective interest rate is re-determined at the date of modification taking into account the renegotiated terms.
Financial liabilities Financial liabilities are derecognised when the financial liabilities’ obligation is extinguished, that is, when the obligation is discharged, cancelled or expired.

94
ANNUAL FINANCIAL STATEMENTS Notes to and forming part of the financial statements continued
Deposits and subordinated liabilitiesDeposits and subordinated liabilities are the Bank’s sources of debt funding.
When the Bank sells a financial asset and simultaneously enters into a “repo” or “stock lending” agreement to repurchase the asset (or a similar asset) at a fixed price on a future date, the arrangement is accounted for as a deposit, and the underlying asset continues to be recognised in the Bank’s financial statements.
The Bank classifies capital instruments as financial liabilities or equity instruments in accordance with the substance of the contractual terms of the instruments.
Deposits and subordinated liabilities are initially measured at fair value plus transaction costs, and subsequently measured at their amortised cost using the effective interest method, except where the Bank designates the liabilities at fair value through profit or loss (refer to significant accounting policies Fair Value Measurement and Financial assets and liabilities designated at fair value through profit or loss).
Financial guarantee contractsA financial guarantee contract is a contract that requires the Bank (issuer) to make specified payments to reimburse the holder for a loss it incurs because a specified debtor fails to make payment when due in accordance with the original or modified terms of a debt instrument.
Financial guarantee contracts are initially recognised at fair value, which is generally equal to the premium received, and then amortised over the life of the financial guarantee. Financial guarantee contracts are subsequently measured at the higher of the:
• present value of any expected payment, when a payment under the guarantee has become probable; or
• unamortised premium.
Derivatives and embedded derivativesIn the normal course of business, the Bank enters into a variety of derivative transactions for trading purposes. Derivative financial instruments are
entered into for trading purposes and for hedging foreign exchange, interest rate, inflation, credit, and commodity and equity exposures. Derivative instruments used by the Bank in both trading and hedging activities include swaps, options, forwards, futures and other similar types of instruments based on foreign exchange rates, credit risk, inflation risk, interest rates and the prices of commodities and equities.
Derivatives are initially recognised at fair value. Derivatives that are not designated in a qualifying hedge accounting relationship are classified as held-for-trading with all changes in fair value being recognised within trading revenue. This includes forward contracts to purchase or sell commodities, where net settlement occurs or where physical delivery occurs and the commodities are held to settle another derivative contract. All derivative instruments are carried as financial assets when the fair value is positive and as financial liabilities when the fair value is negative.
Embedded derivatives included in hybrid instruments are treated and disclosed as separate derivatives when their economic characteristics and risks are not closely related to those of the host contract, the terms of the embedded derivative are the same as those of a stand-alone derivative and the combined contract is not measured at fair value through profit or loss. The host contract is accounted for and measured applying the relevant group accounting policy.
OtherOffsettingFinancial assets and liabilities are offset and the net amount reported in the statement of financial position when there is a legally enforceable right to set off the recognised amounts and there is an intention to settle the asset and the liability on a net basis, or to realise the asset and settle the liability simultaneously. The legally enforceable right must not be contingent on future events and must be enforceable in the normal course of business and in the event of default, insolvency or bankruptcy of the counterparties to the transaction.
Renegotiated loans If the terms of a financial asset are renegotiated or modified or an existing financial asset is replaced with a new one due to financial difficulties of the borrower, then an assessment is made whether the financial asset should be derecognised. If the cash flows of the renegotiated asset are substantially different, then the contractual rights to cash flows from the original financial asset are deemed to have expired.
Loans that would otherwise be past due or impaired and whose terms have been renegotiated and exhibit the characteristics of a performing loan are reset to performing loan status. Loans whose terms have been renegotiated are subject to ongoing review to determine whether they are considered to be impaired or past due.
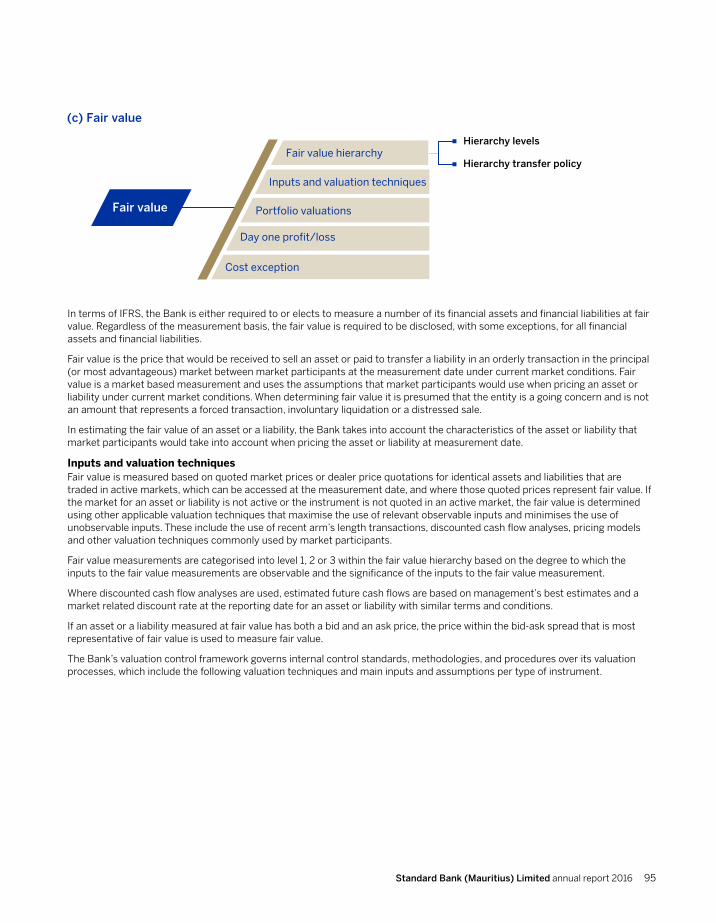
Standard Bank (Mauritius) Limited annual report 2016 95
Fair value Portfolio valuations
Inputs and valuation techniques
Day one profit/loss
Cost exception
Fair value hierarchyHierarchy levels
Hierarchy transfer policy
(c) Fair value
In terms of IFRS, the Bank is either required to or elects to measure a number of its financial assets and financial liabilities at fair value. Regardless of the measurement basis, the fair value is required to be disclosed, with some exceptions, for all financial assets and financial liabilities.
Fair value is the price that would be received to sell an asset or paid to transfer a liability in an orderly transaction in the principal (or most advantageous) market between market participants at the measurement date under current market conditions. Fair value is a market based measurement and uses the assumptions that market participants would use when pricing an asset or liability under current market conditions. When determining fair value it is presumed that the entity is a going concern and is not an amount that represents a forced transaction, involuntary liquidation or a distressed sale.
In estimating the fair value of an asset or a liability, the Bank takes into account the characteristics of the asset or liability that market participants would take into account when pricing the asset or liability at measurement date.
Inputs and valuation techniquesFair value is measured based on quoted market prices or dealer price quotations for identical assets and liabilities that are traded in active markets, which can be accessed at the measurement date, and where those quoted prices represent fair value. If the market for an asset or liability is not active or the instrument is not quoted in an active market, the fair value is determined using other applicable valuation techniques that maximise the use of relevant observable inputs and minimises the use of unobservable inputs. These include the use of recent arm’s length transactions, discounted cash flow analyses, pricing models and other valuation techniques commonly used by market participants.
Fair value measurements are categorised into level 1, 2 or 3 within the fair value hierarchy based on the degree to which the inputs to the fair value measurements are observable and the significance of the inputs to the fair value measurement.
Where discounted cash flow analyses are used, estimated future cash flows are based on management’s best estimates and a market related discount rate at the reporting date for an asset or liability with similar terms and conditions.
If an asset or a liability measured at fair value has both a bid and an ask price, the price within the bid-ask spread that is most representative of fair value is used to measure fair value.
The Bank’s valuation control framework governs internal control standards, methodologies, and procedures over its valuation processes, which include the following valuation techniques and main inputs and assumptions per type of instrument.
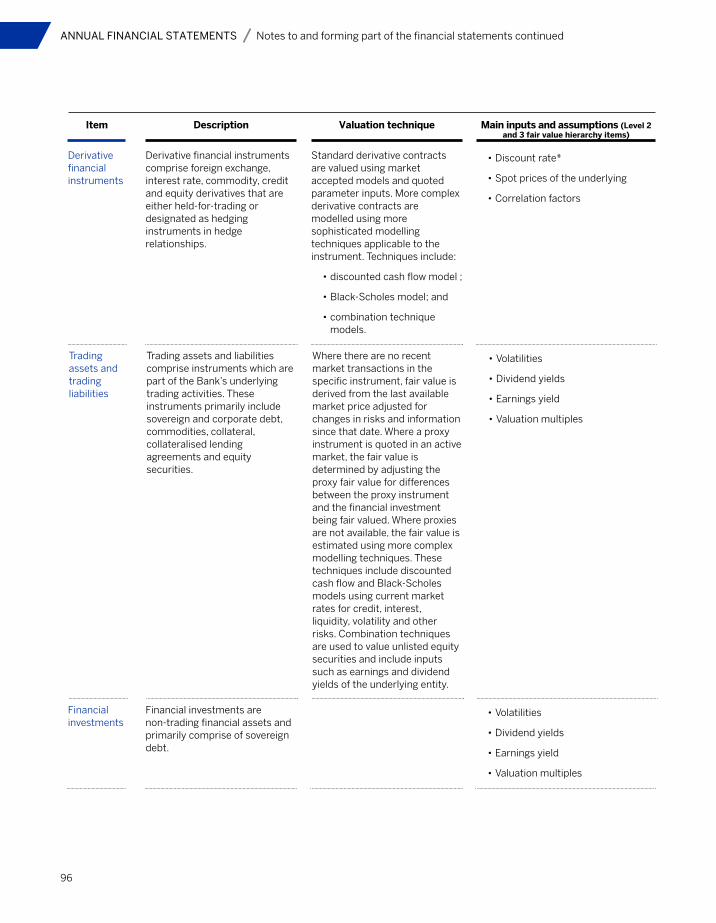
96
ANNUAL FINANCIAL STATEMENTS Notes to and forming part of the financial statements continued
Derivative financial instruments
Derivative financial instruments comprise foreign exchange, interest rate, commodity, credit and equity derivatives that are either held-for-trading or designated as hedging instruments in hedge relationships.
Item Description Valuation technique Main inputs and assumptions (Level 2 and 3 fair value hierarchy items)
Standard derivative contracts are valued using market accepted models and quoted parameter inputs. More complex derivative contracts are modelled using more sophisticated modelling techniques applicable to the instrument. Techniques include:
• discounted cash flow model ;
• Black-Scholes model; and
• combination technique models.
• Discount rate*
• Spot prices of the underlying
• Correlation factors
Trading assets and trading liabilities
Trading assets and liabilities comprise instruments which are part of the Bank’s underlying trading activities. These instruments primarily include sovereign and corporate debt, commodities, collateral, collateralised lending agreements and equity securities.
Where there are no recent market transactions in the specific instrument, fair value is derived from the last available market price adjusted for changes in risks and information since that date. Where a proxy instrument is quoted in an active market, the fair value is determined by adjusting the proxy fair value for differences between the proxy instrument and the financial investment being fair valued. Where proxies are not available, the fair value is estimated using more complex modelling techniques. These techniques include discounted cash flow and Black-Scholes models using current market rates for credit, interest, liquidity, volatility and other risks. Combination techniques are used to value unlisted equity securities and include inputs such as earnings and dividend yields of the underlying entity.
• Volatilities
• Dividend yields
• Earnings yield
• Valuation multiples
Financial investments
Financial investments are non-trading financial assets and primarily comprise of sovereign debt.
• Volatilities
• Dividend yields
• Earnings yield
• Valuation multiples
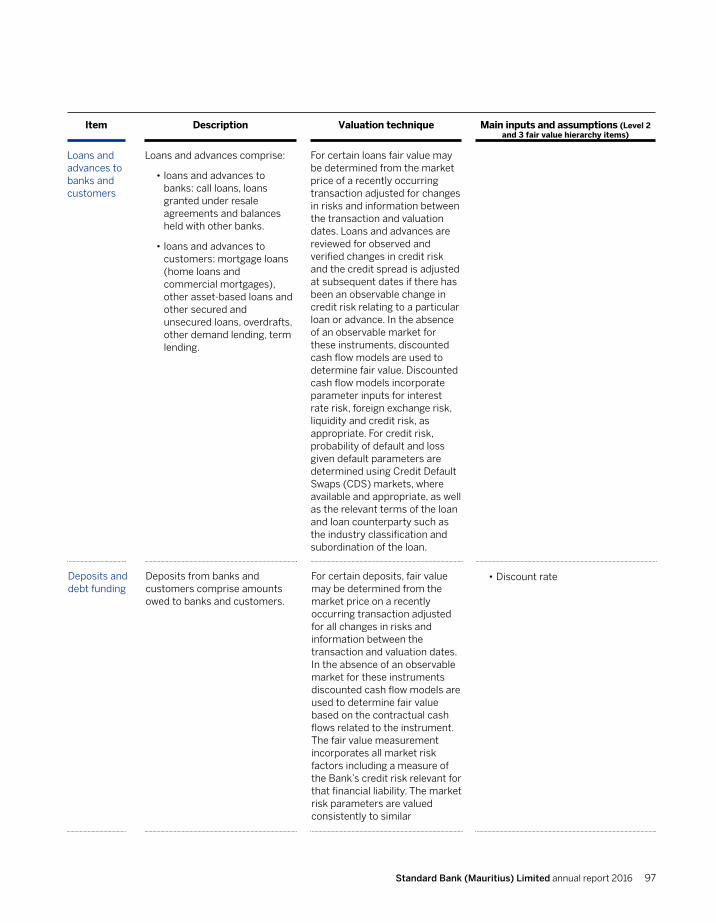
Standard Bank (Mauritius) Limited annual report 2016 97
Loans and advances to banks and customers
Loans and advances comprise:
• loans and advances to banks: call loans, loans granted under resale agreements and balances held with other banks.
• loans and advances to customers: mortgage loans (home loans and commercial mortgages), other asset-based loans and other secured and unsecured loans, overdrafts, other demand lending, term lending.
Item Description Valuation technique Main inputs and assumptions (Level 2 and 3 fair value hierarchy items)
For certain loans fair value may be determined from the market price of a recently occurring transaction adjusted for changes in risks and information between the transaction and valuation dates. Loans and advances are reviewed for observed and verified changes in credit risk and the credit spread is adjusted at subsequent dates if there has been an observable change in credit risk relating to a particular loan or advance. In the absence of an observable market for these instruments, discounted cash flow models are used to determine fair value. Discounted cash flow models incorporate parameter inputs for interest rate risk, foreign exchange risk, liquidity and credit risk, as appropriate. For credit risk, probability of default and loss given default parameters are determined using Credit Default Swaps (CDS) markets, where available and appropriate, as well as the relevant terms of the loan and loan counterparty such as the industry classification and subordination of the loan.
Deposits and debt funding
Deposits from banks and customers comprise amounts owed to banks and customers.
For certain deposits, fair value may be determined from the market price on a recently occurring transaction adjusted for all changes in risks and information between the transaction and valuation dates. In the absence of an observable market for these instruments discounted cash flow models are used to determine fair value based on the contractual cash flows related to the instrument. The fair value measurement incorporates all market risk factors including a measure of the Bank’s credit risk relevant for that financial liability. The market risk parameters are valued consistently to similar
• Discount rate
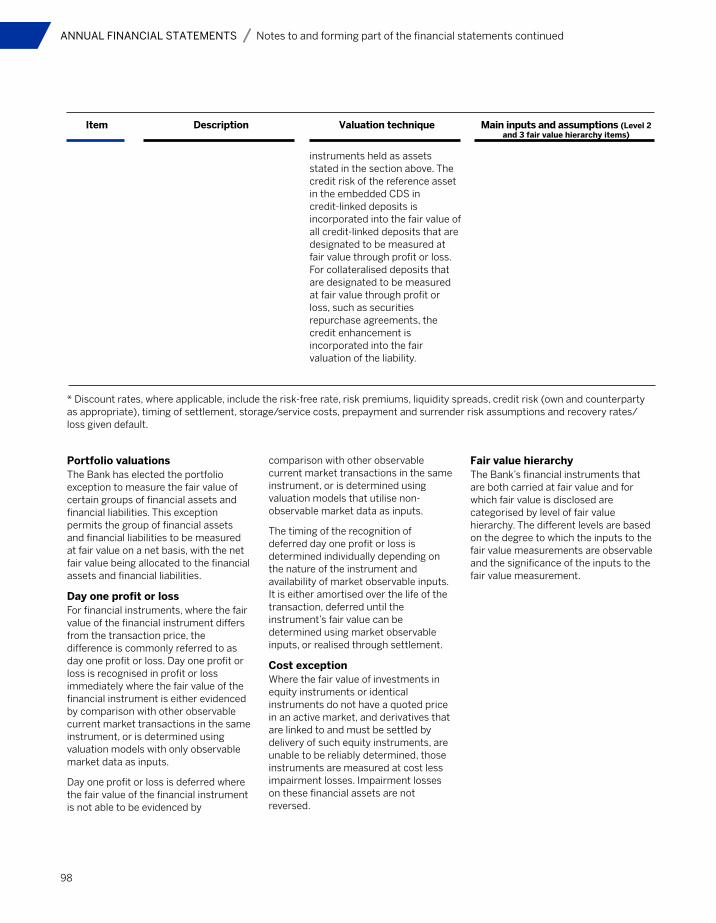
98
ANNUAL FINANCIAL STATEMENTS Notes to and forming part of the financial statements continued
instruments held as assets stated in the section above. The credit risk of the reference asset in the embedded CDS in credit-linked deposits is incorporated into the fair value of all credit-linked deposits that are designated to be measured at fair value through profit or loss. For collateralised deposits that are designated to be measured at fair value through profit or loss, such as securities repurchase agreements, the credit enhancement is incorporated into the fair valuation of the liability.
* Discount rates, where applicable, include the risk-free rate, risk premiums, liquidity spreads, credit risk (own and counterparty as appropriate), timing of settlement, storage/service costs, prepayment and surrender risk assumptions and recovery rates/loss given default.
Portfolio valuations The Bank has elected the portfolio exception to measure the fair value of certain groups of financial assets and financial liabilities. This exception permits the group of financial assets and financial liabilities to be measured at fair value on a net basis, with the net fair value being allocated to the financial assets and financial liabilities.
Day one profit or loss For financial instruments, where the fair value of the financial instrument differs from the transaction price, the difference is commonly referred to as day one profit or loss. Day one profit or loss is recognised in profit or loss immediately where the fair value of the financial instrument is either evidenced by comparison with other observable current market transactions in the same instrument, or is determined using valuation models with only observable market data as inputs.
Day one profit or loss is deferred where the fair value of the financial instrument is not able to be evidenced by
comparison with other observable current market transactions in the same instrument, or is determined using valuation models that utilise non-observable market data as inputs.
The timing of the recognition of deferred day one profit or loss is determined individually depending on the nature of the instrument and availability of market observable inputs. It is either amortised over the life of the transaction, deferred until the instrument’s fair value can be determined using market observable inputs, or realised through settlement.
Cost exception Where the fair value of investments in equity instruments or identical instruments do not have a quoted price in an active market, and derivatives that are linked to and must be settled by delivery of such equity instruments, are unable to be reliably determined, those instruments are measured at cost less impairment losses. Impairment losses on these financial assets are not reversed.
Fair value hierarchy The Bank’s financial instruments that are both carried at fair value and for which fair value is disclosed are categorised by level of fair value hierarchy. The different levels are based on the degree to which the inputs to the fair value measurements are observable and the significance of the inputs to the fair value measurement.
Item Description Valuation technique Main inputs and assumptions (Level 2 and 3 fair value hierarchy items)
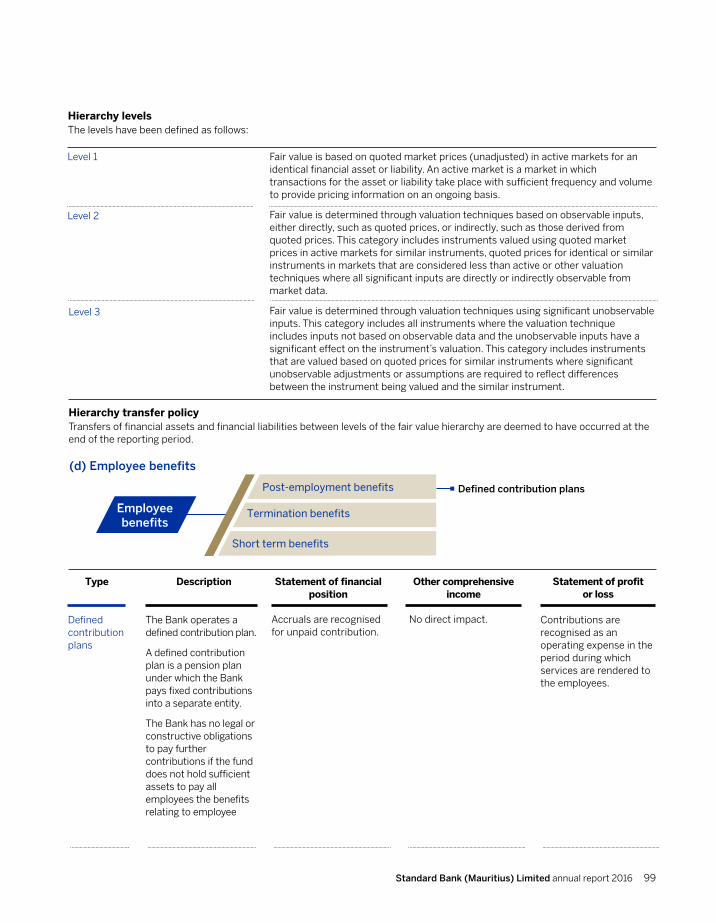
Standard Bank (Mauritius) Limited annual report 2016 99
Level 1 Fair value is based on quoted market prices (unadjusted) in active markets for an identical financial asset or liability. An active market is a market in which transactions for the asset or liability take place with sufficient frequency and volume to provide pricing information on an ongoing basis.
Fair value is determined through valuation techniques based on observable inputs, either directly, such as quoted prices, or indirectly, such as those derived from quoted prices. This category includes instruments valued using quoted market prices in active markets for similar instruments, quoted prices for identical or similar instruments in markets that are considered less than active or other valuation techniques where all significant inputs are directly or indirectly observable from market data.
Fair value is determined through valuation techniques using significant unobservable inputs. This category includes all instruments where the valuation technique includes inputs not based on observable data and the unobservable inputs have a significant effect on the instrument’s valuation. This category includes instruments that are valued based on quoted prices for similar instruments where significant unobservable adjustments or assumptions are required to reflect differences between the instrument being valued and the similar instrument.
Hierarchy levels The levels have been defined as follows:
Level 2
Level 3
Hierarchy transfer policy Transfers of financial assets and financial liabilities between levels of the fair value hierarchy are deemed to have occurred at the end of the reporting period.
Employeebenefits
Post-employment benefits
Termination benefits
Short term benefits
Defined contribution plans
(d) Employee benefits
Defined contribution plans
The Bank operates a defined contribution plan.
A defined contribution plan is a pension plan under which the Bank pays fixed contributions into a separate entity.
The Bank has no legal or constructive obligations to pay further contributions if the fund does not hold sufficient assets to pay all employees the benefits relating to employee
Type Description Statement of financial position
Other comprehensive income
Accruals are recognised for unpaid contribution.
No direct impact.
Statement of profitor loss
Contributions are recognised as an operating expense in the period during which services are rendered to the employees.
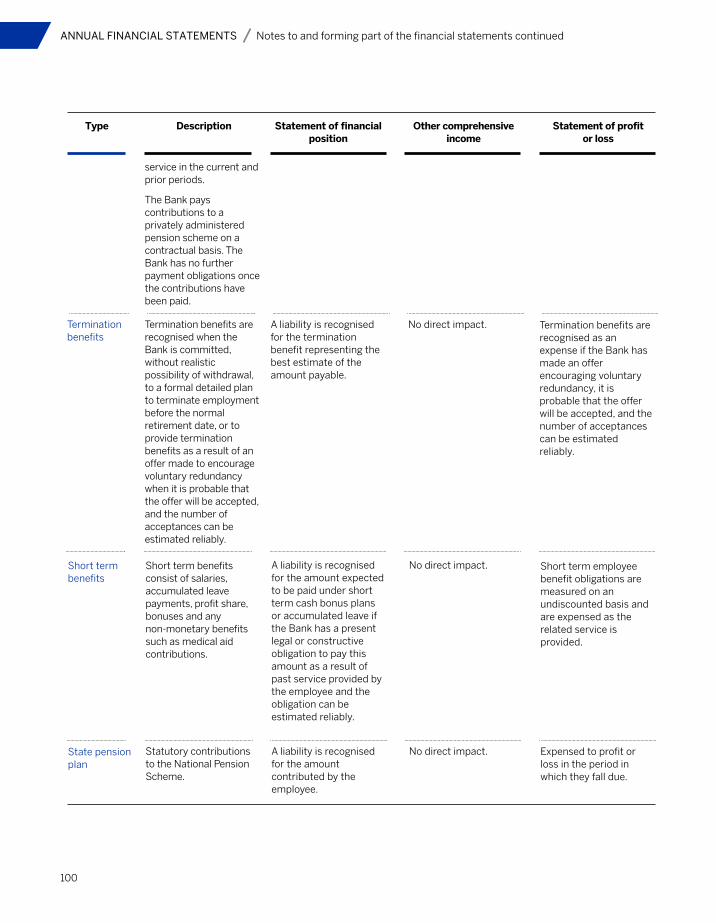
100
ANNUAL FINANCIAL STATEMENTS Notes to and forming part of the financial statements continued
service in the current and prior periods.
The Bank pays contributions to a privately administered pension scheme on a contractual basis. The Bank has no further payment obligations once the contributions have been paid.
Termination benefits
Termination benefits are recognised when the Bank is committed, without realistic possibility of withdrawal, to a formal detailed plan to terminate employment before the normal retirement date, or to provide termination benefits as a result of an offer made to encourage voluntary redundancy when it is probable that the offer will be accepted, and the number of acceptances can be estimated reliably.
A liability is recognised for the termination benefit representing the best estimate of the amount payable.
No direct impact. Termination benefits are recognised as an expense if the Bank has made an offer encouraging voluntary redundancy, it is probable that the offer will be accepted, and the number of acceptances can be estimated reliably.
Short term benefits
Short term benefits consist of salaries, accumulated leave payments, profit share, bonuses and any non-monetary benefits such as medical aid contributions.
A liability is recognised for the amount expected to be paid under short term cash bonus plans or accumulated leave if the Bank has a present legal or constructive obligation to pay this amount as a result of past service provided by the employee and the obligation can be estimated reliably.
No direct impact. Short term employee benefit obligations are measured on an undiscounted basis and are expensed as the related service is provided.
State pension plan
Statutory contributions to the National Pension Scheme.
A liability is recognised for the amount contributed by the employee.
No direct impact. Expensed to profit or loss in the period in which they fall due.
Type Description Statement of financial position
Other comprehensive income
Statement of profitor loss
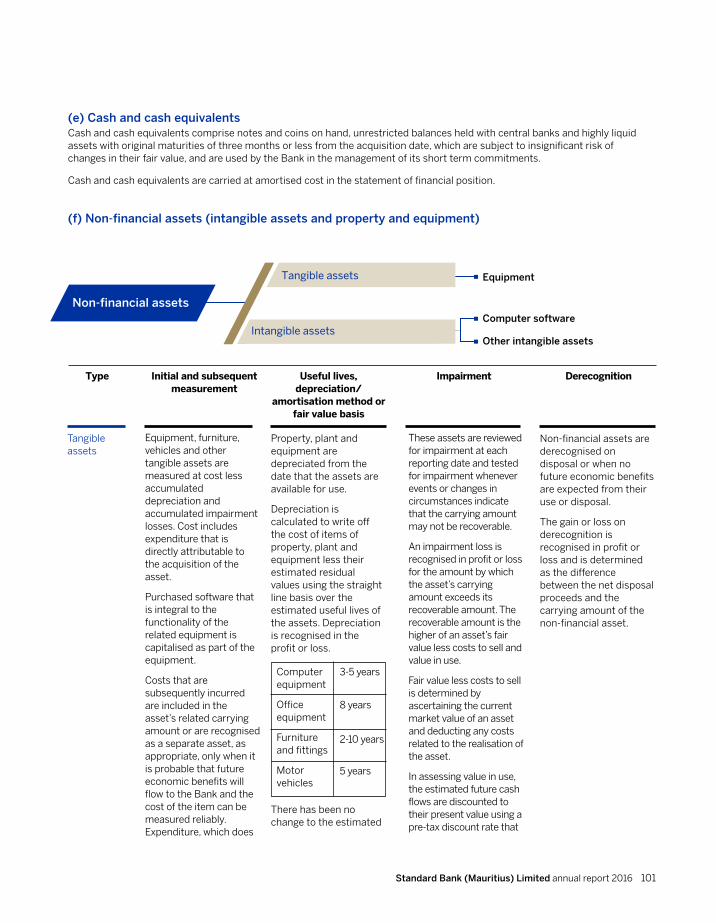
Standard Bank (Mauritius) Limited annual report 2016 101
Computer software
Other intangible assets
(e) Cash and cash equivalentsCash and cash equivalents comprise notes and coins on hand, unrestricted balances held with central banks and highly liquid assets with original maturities of three months or less from the acquisition date, which are subject to insignificant risk of changes in their fair value, and are used by the Bank in the management of its short term commitments.
Cash and cash equivalents are carried at amortised cost in the statement of financial position.
(f) Non-financial assets (intangible assets and property and equipment)
Non-financial assets
Tangible assets
Intangible assets
Equipment
Type Initial and subsequent measurement
Useful lives,depreciation/
amortisation method or fair value basis
Impairment Derecognition
Tangible assets
Equipment, furniture, vehicles and other tangible assets are measured at cost less accumulated depreciation and accumulated impairment losses. Cost includes expenditure that is directly attributable to the acquisition of the asset.
Purchased software that is integral to the functionality of the related equipment is capitalised as part of the equipment.
Costs that are subsequently incurred are included in the asset’s related carrying amount or are recognised as a separate asset, as appropriate, only when it is probable that future economic benefits will flow to the Bank and the cost of the item can be measured reliably. Expenditure, which does
Property, plant and equipment are depreciated from the date that the assets are available for use.
Depreciation is calculated to write off the cost of items of property, plant and equipment less their estimated residual values using the straight line basis over the estimated useful lives of the assets. Depreciation is recognised in the profit or loss.
There has been no change to the estimated
These assets are reviewed for impairment at each reporting date and tested for impairment whenever events or changes in circumstances indicate that the carrying amount may not be recoverable.
An impairment loss is recognised in profit or loss for the amount by which the asset’s carrying amount exceeds its recoverable amount. The recoverable amount is the higher of an asset’s fair value less costs to sell and value in use.
Fair value less costs to sell is determined by ascertaining the current market value of an asset and deducting any costs related to the realisation of the asset.
In assessing value in use, the estimated future cash flows are discounted to their present value using a pre-tax discount rate that
Non-financial assets are derecognised on disposal or when no future economic benefits are expected from their use or disposal.
The gain or loss on derecognition is recognised in profit or loss and is determined as the difference between the net disposal proceeds and the carrying amount of the non-financial asset.
Computer equipment
Office equipment
Furniture and fittings
Motor vehicles
3-5 years
8 years
2-10 years
5 years
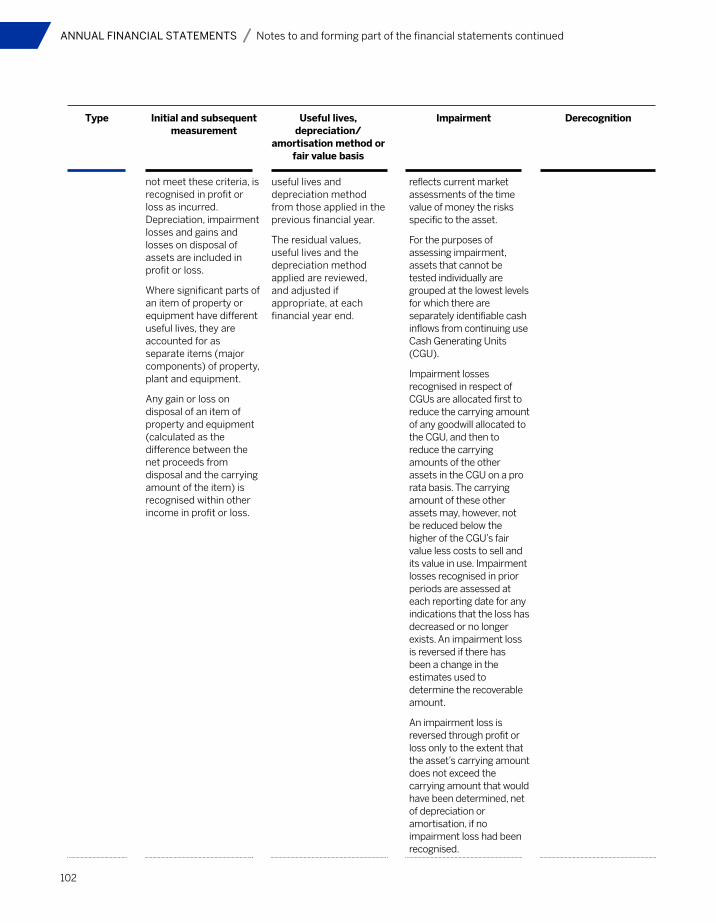
102
ANNUAL FINANCIAL STATEMENTS Notes to and forming part of the financial statements continued
not meet these criteria, is recognised in profit or loss as incurred. Depreciation, impairment losses and gains and losses on disposal of assets are included in profit or loss.
Where significant parts of an item of property or equipment have different useful lives, they are accounted for as separate items (major components) of property, plant and equipment.
Any gain or loss on disposal of an item of property and equipment (calculated as the difference between the net proceeds from disposal and the carrying amount of the item) is recognised within other income in profit or loss.
useful lives and depreciation method from those applied in the previous financial year.
The residual values, useful lives and the depreciation method applied are reviewed, and adjusted if appropriate, at each financial year end.
reflects current market assessments of the time value of money the risks specific to the asset.
For the purposes of assessing impairment, assets that cannot be tested individually are grouped at the lowest levels for which there are separately identifiable cash inflows from continuing use Cash Generating Units (CGU).
Impairment losses recognised in respect of CGUs are allocated first to reduce the carrying amount of any goodwill allocated to the CGU, and then to reduce the carrying amounts of the other assets in the CGU on a pro rata basis. The carrying amount of these other assets may, however, not be reduced below the higher of the CGU’s fair value less costs to sell and its value in use. Impairment losses recognised in prior periods are assessed at each reporting date for any indications that the loss has decreased or no longer exists. An impairment loss is reversed if there has been a change in the estimates used to determine the recoverable amount.
An impairment loss is reversed through profit or loss only to the extent that the asset’s carrying amount does not exceed the carrying amount that would have been determined, net of depreciation or amortisation, if no impairment loss had been recognised.
Type Initial and subsequent measurement
Useful lives,depreciation/
amortisation method or fair value basis
Impairment Derecognition
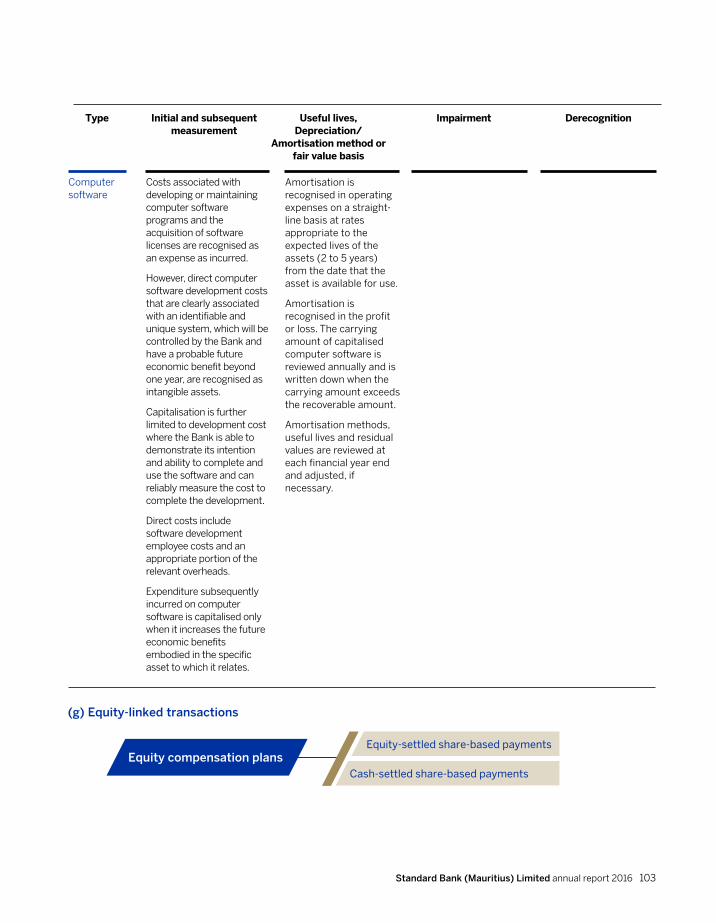
Standard Bank (Mauritius) Limited annual report 2016 103
Computer software
Costs associated with developing or maintaining computer software programs and the acquisition of software licenses are recognised as an expense as incurred.
However, direct computer software development costs that are clearly associated with an identifiable and unique system, which will be controlled by the Bank and have a probable future economic benefit beyond one year, are recognised as intangible assets.
Capitalisation is further limited to development cost where the Bank is able to demonstrate its intention and ability to complete and use the software and can reliably measure the cost to complete the development.
Direct costs include software development employee costs and an appropriate portion of the relevant overheads.
Expenditure subsequently incurred on computer software is capitalised only when it increases the future economic benefits embodied in the specific asset to which it relates.
Amortisation is recognised in operating expenses on a straight- line basis at rates appropriate to the expected lives of the assets (2 to 5 years) from the date that the asset is available for use.
Amortisation is recognised in the profit or loss. The carrying amount of capitalised computer software is reviewed annually and is written down when the carrying amount exceeds the recoverable amount.
Amortisation methods, useful lives and residual values are reviewed at each financial year end and adjusted, if necessary.
(g) Equity-linked transactions
Equity compensation plansEquity-settled share-based payments
Cash-settled share-based payments
Type Initial and subsequent measurement
Useful lives,Depreciation/
Amortisation method or fair value basis
Impairment Derecognition
104
ANNUAL FINANCIAL STATEMENTS Notes to and forming part of the financial statements continued
Equity-settled share-based payments The Bank operates both equity-settled and cash-settled share-based compensation plans. All share options are accounted for as share-based payment transactions.
The fair value of equity-settled share options is determined on the grant date and accounted for as staff costs over the vesting period of the share options, with a corresponding increase in the share-based payment reserve. Non-market vesting conditions are not considered in the valuation but are included in the estimate of the number of options expected to vest. At each reporting date, the estimate of the number of options expected to vest is reassessed and adjusted against income and equity over the remaining vesting period.
On vesting of the equity-settled share-based payments, amounts previously credited to the share-based payment reserve are transferred to retained earnings through an equity transfer.
Cash-settled share-based payments settled are accounted for as liabilities at fair value until settled. The liability is recognised over the vesting period and is revalued at every reporting date and on settlement. Any changes in the fair value liability are recognised in operating expenses-staff costs.
Cash-settled share-based payments
(h) Leases
Operating lease lessee
All leases that do not meet the criteria of a financial lease are classified as operating leases.
Type Description Statement of profit or loss
Accruals for unpaid lease charges, together with a straight-line lease asset or liability, being the difference between actual payments and the straight-line lease expense are recognised.
Payments made under operating leases, net of any incentives received from the lessor, are recognised in operating expenses on a straight-line basis over the term of the lease. Contingent rentals are expensed as they are incurred.
When an operating lease is terminated before the lease period has expired, any payment required to be made to the lessor by way of a penalty is recognised as operating expenses in the period in which termination takes place.
Operating lease lessor
All leases that do not meet the criteria of a financial lease are classified as operating leases.
The asset underlying the lease continues to be recognised and accounted for in terms of the relevant bank accounting policies.
Accruals for outstanding lease charges, together with a straight-line lease asset or liability, being the difference between actual payments and the straight-line lease income are recognised.
Operating lease income net of any incentives given to lessees is recognised on the straight-line basis or a more representative basis where applicable over the lease term and is recognised in operating expenses.
When an operating lease is terminated before the lease period has expired, any payment required by the Bank by way of a penalty is recognised as income in the period in which termination takes place.
Statement of financialposition

Standard Bank (Mauritius) Limited annual report 2016 105
Provisions for restructuring
Provisions for legal claims
Provisions for onerous contractsProvisions, contingent assets and contingent
liabilities
Provisions
Contingent assets
Contingent liabilities
(j) Provisions, contingent assets and contingent liabilities
Provisions Provisions are recognised when the Bank has a present legal or constructive obligation as a result of past events and it is probable that an outflow of resources embodying economic benefits will be required to settle the obligation and a reliable estimate of the amount of the obligation can be made. Provisions are determined by discounting the expected future cash flows using a pre-tax discount rate that reflects current market assessments of the time value of money and, where appropriate, the risks specific to the liability. The Bank provisions typically (when applicable) include the following:
Provisions for legal claimsProvisions for legal claims are recognised on a prudent basis for the estimated cost for all legal claims that have not been settled or reached conclusion at the reporting date. In determining the provision management considers the probability and likely settlement (if any). Reimbursements of expenditure to settle the provision are recognised when and only when it is virtually certain that the reimbursement will be received.
Provisions for restructuringA provision for restructuring is recognised when the Bank has approved a detailed formal plan, and the restructuring either has commenced or has been announced publicly. Future operating costs or losses are not provided for.
Provisions for onerous contractA provision for onerous contracts is recognised when the expected benefits to be derived by the Bank from a contract are lower than the unavoidable cost of meeting its obligations under the contract. The provision is measured at the present value of the lower of the expected cost of terminating the contract and the expected net cost of continuing with the contract. Before a provision is established, the Bank recognises any impairment loss on the assets associated with that contract.
Contingent assets Contingent assets are not recognised in the annual financial statements but are disclosed when, as a result of past events, it is probable that economic benefits will flow to the Bank, but this will only be confirmed by the occurrence or non-occurrence of one or more uncertain future events which are not wholly within the Bank control.
Contingent liabilities Contingent liabilities, which include certain guarantees other than financial guarantees, and letters of credit, pledged as collateral security, are possible obligations that arise from past events whose existence will be confirmed only by the occurrence, or non-occurrence, of one or more uncertain future events not wholly within the Bank’s control. Contingent liabilities are not recognised in the financial statements but are disclosed in the notes to the financial statements unless they are remote.

106
ANNUAL FINANCIAL STATEMENTS Notes to and forming part of the financial statements continued
Current tax
Deferred taxTaxationDirect taxation
Indirect tax
(k) Taxation
Current tax- determined for current period transactions and events
Type Offsetting
Current and deferred tax assets and liabilities are offset if there is a legally enforceable right to offset current tax liabilities and assets, and they relate to income taxes levied by the same tax authority on the same taxable entity but they intend to settle current tax liabilities and assets on a net basis or their tax assets and liabilities will be realised simultaneously.
Description, recognition and measurement
Current tax is recognised in the income tax expense line in the statement of profit or loss except to the extent that it relates to items recognised directly in equity or in OCI.
Current tax represents the expected tax payable on taxable income for the year, using tax rates enacted or substantively enacted at the reporting date, and any adjustments to tax payable in respect of previous years.
Deferred tax- determined for future tax consequences
Deferred tax is recognised in respect of temporary differences between the carrying amounts of assets and liabilities for financial reporting purposes and the amounts used for taxation purposes.
Deferred tax is not recognised for:
• temporary differences on the initial recognition of assets or liabilities in a transaction that is not a business combination and that effects neither accounting nor taxable profit or loss.
Deferred tax is measured at the tax rates that are expected to be applied to the temporary differences when they reverse, based on the laws that have been enacted or substantively enacted by the reporting date.
The amount of deferred tax provided is based on the expected manner of realisation or settlement of the carrying amount of the asset or liability and is not discounted.
Deferred tax asset are recognised for unused tax losses, tax credits and deductible temporary differences only to the extent that it is probable that future taxable profits will be available against which they can be utilised. Deferred tax assets are reviewed at each reporting date and are reduced to the extent that it is no longer probable that the related tax benefit will be realised.
Indirect taxation
Indirect taxes, including non-recoverable Value Added Tax (VAT), skills development levies and other duties for banking activities are recognised in profit or loss and disclosed separately in the statement of profit or loss.
N/A

Standard Bank (Mauritius) Limited annual report 2016 107
Trading revenue
Net fee and commission revenue
Other revenue
Revenue and expenditure Banking activities
(l) Revenue and expenditure
Net interest income
Non-interest revenue
Bank activities
Type Recognition and measurement
Interest income and expense are recognised in profit or loss on an accrual basis using the effective interest method for all interest-bearing financial instruments, except for those classified at fair value through profit or loss. In terms of the effective interest method, interest is recognised at a rate that exactly discounts estimated future cash payments or receipts through the expected life of the financial instrument or, where appropriate, a shorter period, to the carrying amount of the financial asset or liability. Direct incremental transaction costs incurred and origination fees received, including loan commitment fees, as a result of bringing margin-yielding assets or liabilities into the statement of financial position, are capitalised to the carrying amount of financial instruments that are not at fair value through profit or loss and amortised as interest income or expense over the life of the asset or liability as part of the effective interest rate.
Where the estimates of payments or receipts on financial assets are revised (except those that have been reclassified or financial liabilities that are subsequently revised refer to significant accounting policies (2.1) Financial Instruments), the carrying amount of the financial asset or financial liability is adjusted to reflect actual and revised estimated cash flows. The carrying amount is calculated by computing the present value of the estimated cash flows at the financial asset or financial liability’s original effective interest rate.
Any adjustment to the carrying value is recognised in net interest income.
Where financial assets have been impaired, interest income continues to be recognised on the impaired value based on the original effective interest rate.
Fair value gains and losses on realised debt financial instruments, including amounts reclassified from OCI in respect of available-for-sale debt financial assets, and excluding those classified as held-for-trading, are included in net interest income.
Interest income and expense on all trading assets and liabilities are considered to be incidental to the Bank’s trading operations and are presented together with all other changes in the fair value of trading assets and liabilities in net trading income (refer to significant accounting policies below net trading revenue).
Fair value changes on other derivatives held for risk management purposes, and other financial assets and liabilities carried at fair value through profit or loss, are presented in net income from other financial instruments carried at fair value through profit or loss and in the statement of profit or loss and OCI (refer to significant accounting policies below other revenue).
Description
Net interest income
Fee and commission income, including transactional fees, account servicing fees, investment management fees, sales commission, placement fees and syndication fees are recognised as the related services are performed. Fees and commission income and expense that are integral to the effective interest rate on a financial asset or liability are included in the measurement of the effective interest rate. Loan syndication fees, where the Bank does not participate in the syndication or participates at the same effective interest rate for comparable risk as other participants, are recognised as revenue when the syndication has been completed. Syndication fees that do not meet these criteria are capitalised as origination fees and amortised as interest income.
Net fee and commission income
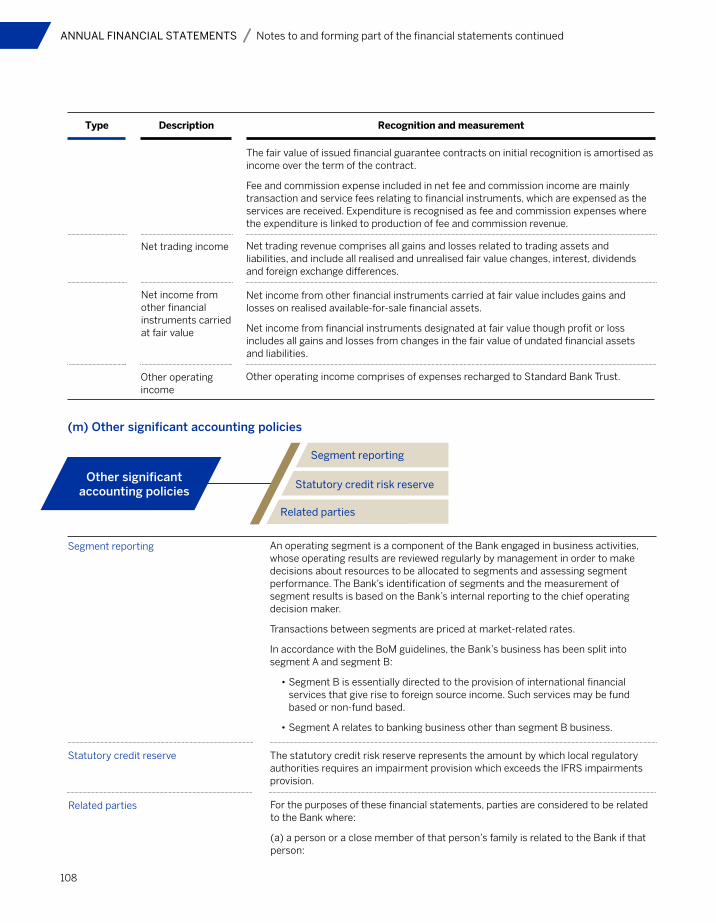
108
ANNUAL FINANCIAL STATEMENTS Notes to and forming part of the financial statements continued
Type Recognition and measurement
The fair value of issued financial guarantee contracts on initial recognition is amortised as income over the term of the contract.
Fee and commission expense included in net fee and commission income are mainly transaction and service fees relating to financial instruments, which are expensed as the services are received. Expenditure is recognised as fee and commission expenses where the expenditure is linked to production of fee and commission revenue.
Description
Net trading revenue comprises all gains and losses related to trading assets and liabilities, and include all realised and unrealised fair value changes, interest, dividends and foreign exchange differences.
Net trading income
Net income from other financial instruments carried at fair value includes gains and losses on realised available-for-sale financial assets.
Net income from financial instruments designated at fair value though profit or loss includes all gains and losses from changes in the fair value of undated financial assets and liabilities.
Net income from other financial instruments carried at fair value
Other operating income comprises of expenses recharged to Standard Bank Trust.Other operating income
Other significant accounting policies
Segment reporting
Statutory credit risk reserve
Related parties
(m) Other significant accounting policies
Segment reporting An operating segment is a component of the Bank engaged in business activities, whose operating results are reviewed regularly by management in order to make decisions about resources to be allocated to segments and assessing segment performance. The Bank’s identification of segments and the measurement of segment results is based on the Bank’s internal reporting to the chief operating decision maker.
Transactions between segments are priced at market-related rates.
In accordance with the BoM guidelines, the Bank’s business has been split into segment A and segment B:
• Segment B is essentially directed to the provision of international financial services that give rise to foreign source income. Such services may be fund based or non-fund based.
• Segment A relates to banking business other than segment B business.
Statutory credit reserve The statutory credit risk reserve represents the amount by which local regulatory authorities requires an impairment provision which exceeds the IFRS impairments provision.
Related parties For the purposes of these financial statements, parties are considered to be related to the Bank where:
(a) a person or a close member of that person’s family is related to the Bank if that person:

Standard Bank (Mauritius) Limited annual report 2016 109
(i) has control or joint control over the Bank;
(ii) has significant influence over the Bank; or
(iii) is a member of the key management personnel of the Bank or of a parent of the Bank.
(b) An entity is related to the Bank if any of the following conditions applies:
(i) the entity and the Bank are members of the same group (which means that each parent, subsidiary and fellow subsidiary is related to the others);
(ii) one entity is an associate or joint venture of the other entity (or an associate or joint venture of a member of a group of which the other entity is a member);
(iii) both entities are joint ventures of the same third party;
(iv) one entity is a joint venture of a third entity and the other entity is an
associate of the third entity;
(v) the entity is a post-employment defined benefit plan for the benefit of employees of either the Bank or an entity related to the Bank. If the Bank is itself such a plan, the sponsoring employers are also related to the Bank;
(vi) the entity is controlled or jointly controlled by a person identified in (a);
(vii) a person identified in (a)(i) has significant influence over the entity or is a member of the key management personnel of the entity (or of a parent of the entity); and
(viii) the entity, or any member of a group of which it is a part, provides key management personnel services to the Bank or to the parent of the Bank.
Pronouncement Effective date
Annual periods beginning on or after 1 January 2018.
Title
New standards and interpretations not yet adoptedThe following new or revised standards, amendments and interpretations are not yet effective for the year ended 31 December 2016 and have not been applied in preparing these annual financial statements.
Financial instruments
This standard will replace the existing standard on the recognition and measurement of financial instruments and requires all financial assets to be classified and measured on the basis of the entity’s business model for managing the financial assets and the contractual cash flow characteristics of the financial assets.
The accounting for financial assets differs in various other areas to existing requirements such as embedded derivatives and the recognition of fair value adjustments in OCI.
All changes in the fair value of financial liabilities that are designated at fair value through profit or loss due to changes in
IFRS 9
110
ANNUAL FINANCIAL STATEMENTS Notes to and forming part of the financial statements continued
Pronouncement Effective dateTitle
own credit risk will be required to be recognised within OCI.
The standard has introduced a new expected-loss impairment model that will require more timely recognition of expected credit losses. This new model will apply to financial assets measured at either amortised cost or fair value through OCI, as well as loan commitments when there is present commitment to extend credit (unless these are measured at fair value through profit or loss).
With the exception of purchased or originated credit impaired financial assets, expected credit losses are required to be measured through a loss allowance at an amount equal to either 12-month expected credit losses or full lifetime expected credit losses.
A loss allowance for full lifetime expected credit losses is required for a financial instrument if the credit risk of that financial instrument has increased significantly since initial recognition as well as for certain contract assets or trade receivables. For all other financial instruments, expected credit losses are measured at an amount equal to 12-month expected credit losses.
The revised general hedge accounting requirements are better aligned with an entity’s risk management activities; provide additional opportunities to apply hedge accounting and various simplifications in achieving hedge accounting.
The standard will be applied retrospectively. The impact on the annual financial statements has not yet been fully determined.
Annual periods beginning on or after 1 January 2018.
Revenue from contracts with customers
This standard will replace the existing revenue standards and their related interpretations. The standard sets out the requirements for recognising revenue that applies to all contracts with customers (except for contracts that are within the scope of the standards on leases, insurance contracts or financial instruments).
The core principle of the standard is that revenue recognised reflects the consideration to which the company expects to be entitled in exchange for the transfer of promised goods or services to the customer.
The standard incorporates a five step analysis to determine the amount and timing of revenue recognition.
The standard will be applied retrospectively. There will be no impact on the annual financial statements.
IFRS 15
Annual periods beginning on or after 1 January 2019.
Leases
This standard will replace the existing standard IAS 17 leases as well as the related interpretations and sets out the principles for the recognition, measurement, presentation and disclosure of leases for both parties to a contract, being the lessee (customer) and the lessor (supplier).
IFRS 16
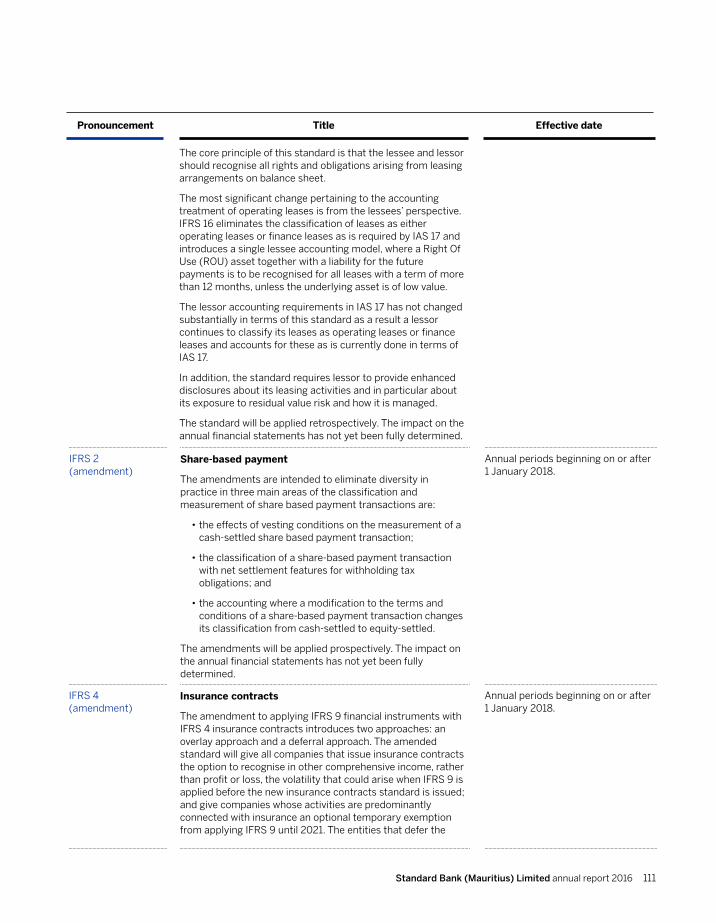
Standard Bank (Mauritius) Limited annual report 2016 111
Pronouncement Effective dateTitle
The core principle of this standard is that the lessee and lessor should recognise all rights and obligations arising from leasing arrangements on balance sheet.
The most significant change pertaining to the accounting treatment of operating leases is from the lessees’ perspective. IFRS 16 eliminates the classification of leases as either operating leases or finance leases as is required by IAS 17 and introduces a single lessee accounting model, where a Right Of Use (ROU) asset together with a liability for the future payments is to be recognised for all leases with a term of more than 12 months, unless the underlying asset is of low value.
The lessor accounting requirements in IAS 17 has not changed substantially in terms of this standard as a result a lessor continues to classify its leases as operating leases or finance leases and accounts for these as is currently done in terms of IAS 17.
In addition, the standard requires lessor to provide enhanced disclosures about its leasing activities and in particular about its exposure to residual value risk and how it is managed.
The standard will be applied retrospectively. The impact on the annual financial statements has not yet been fully determined.
Annual periods beginning on or after 1 January 2018.
Share-based payment
The amendments are intended to eliminate diversity in practice in three main areas of the classification and measurement of share based payment transactions are:
• the effects of vesting conditions on the measurement of a cash-settled share based payment transaction;
• the classification of a share-based payment transaction with net settlement features for withholding tax obligations; and
• the accounting where a modification to the terms and conditions of a share-based payment transaction changes its classification from cash-settled to equity-settled.
The amendments will be applied prospectively. The impact on the annual financial statements has not yet been fully determined.
IFRS 2 (amendment)
Annual periods beginning on or after 1 January 2018.
Insurance contracts
The amendment to applying IFRS 9 financial instruments with IFRS 4 insurance contracts introduces two approaches: an overlay approach and a deferral approach. The amended standard will give all companies that issue insurance contracts the option to recognise in other comprehensive income, rather than profit or loss, the volatility that could arise when IFRS 9 is applied before the new insurance contracts standard is issued; and give companies whose activities are predominantly connected with insurance an optional temporary exemption from applying IFRS 9 until 2021. The entities that defer the
IFRS 4 (amendment)
112
ANNUAL FINANCIAL STATEMENTS Notes to and forming part of the financial statements continued
Pronouncement Effective dateTitle
application of IFRS 9 will continue to apply the existing financial instruments Standard IAS 39.
The amendments to IFRS 4 supplement existing options in the standard that can already be used to address the temporary volatility.
The amendments will be applied retrospectively. There will be no impact on the annual financial statements.
Annual periods beginning on or after 1 January 2018.
Foreign currency transactions and advance consideration
The IFRIC provides guidance on how to determine the date of the transaction for the purpose of determining the exchange rate to use on initial recognition of the related asset, expense or income (or part of it) on the derecognition of a non-monetary asset or non-monetary liability arising from the payment or receipt of advance consideration in a foreign currency.
The IFRIC will be applied retrospectively or prospectively. The impact on the annual financial statements has not yet been fully determined but is not expected to have a significant impact on the Bank.
IFRIC 22
Annual periods beginning on or after 1 January 2018.
Investment property
The amendments clarify the requirements on transfers to, or from, investment property when, and only when, there is a change in use. A change in use occurs when the property meets, or ceases to meet, the definition of investment property and there is evidence of the change in use.
The amendments will be applied prospectively. There will be no impact on the annual financial statements.
IAS 40
(amendment)
3. Financial risk managementIntroduction and overviewThis note presents information about the Bank’s exposure to financial risks and the Bank’s management of capital.
For information on the Bank’s financial risk management framework and definition of the various types of risks that affect the Bank, please refer to the risk management section of the management discussion and analysis.
The Bank has exposure to the following risk from financial instruments:
• credit risk;
• liquidity risk; and
• market risk.
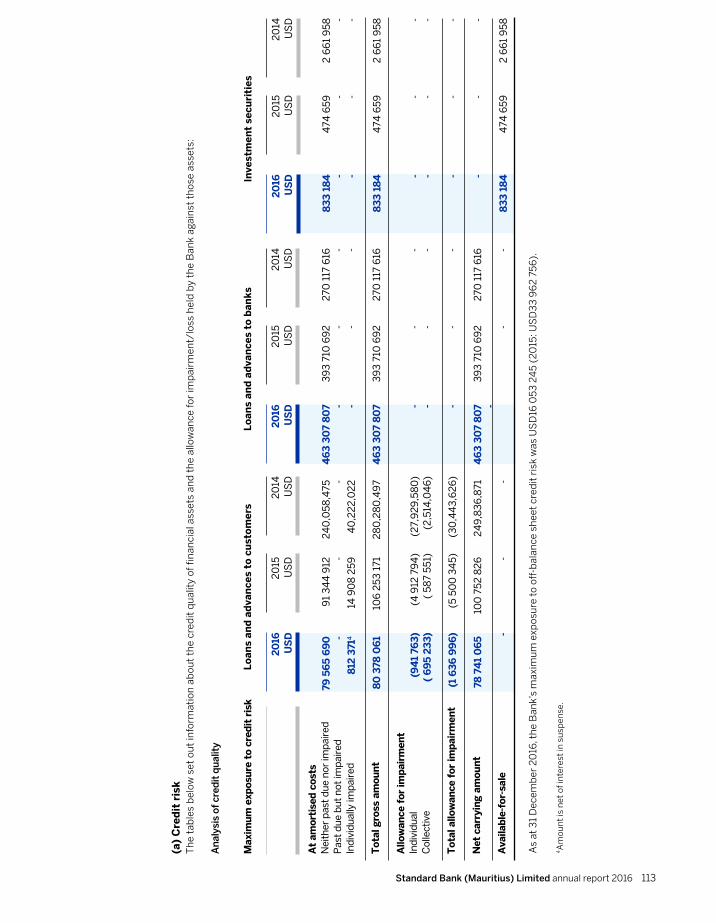
Standard Bank (Mauritius) Limited annual report 2016 113
20
16U
SD
8
33
18
4
-
-
83
3 1
84
-
-
-
- 8
33
18
4
20
15U
SD
474
659
-
-
474
659
-
-
-
-
474
659
20
14U
SD
2 6
61
958
-
-
2 6
61
958
-
-
-
-
2 6
61
958
Inve
stm
ent
secu
riti
es
20
16U
SD
79 5
65
69
0 -8
12 3
714
80
378
06
1
(94
1 76
3)
( 6
95
23
3)
(1 6
36
99
6)
78 7
41
06
5
-
Ana
lysi
s of
cre
dit
qua
lity
Max
imu
m e
xpo
sure
to
cre
dit
ris
k
At
amo
rtis
ed c
ost
sN
eith
er p
ast
due
nor
impa
ired
Pas
t du
e bu
t no
t im
pair
edIn
divi
dual
ly im
pair
ed
To
tal g
ross
am
ou
nt
Allo
wan
ce f
or
imp
airm
ent
Indi
vidu
alC
olle
ctiv
e
To
tal a
llow
ance
fo
r im
pai
rmen
t
Net
car
ryin
g a
mo
un
t
Ava
ilab
le-f
or-
sale
20
15U
SD
91
34
4 9
12-
14 9
08
259
10
6 2
53 1
71
(4 9
12 7
94
)(
587
551)
(5 5
00
34
5)
100
752
82
6
-
20
14U
SD
24
0,0
58,4
75
-4
0,2
22
,02
2
28
0,2
80
,49
7
(
27,
92
9,5
80
) (
2,5
14,0
46
) (
30
,44
3,6
26
)
2
49
,83
6,8
71
-
(a)
Cre
dit
ris
k
Th
e ta
ble
s b
elow
set
ou
t in
form
atio
n a
bou
t th
e cr
edit
qu
alit
y of
fin
anci
al a
sset
s an
d t
he
allo
wan
ce fo
r im
pai
rmen
t/lo
ss h
eld
by
the
Ban
k ag
ain
st t
hos
e as
sets
:
As
at 3
1 D
ecem
ber
20
16, t
he
Ban
k’s
max
imu
m e
xpos
ure
to
off-
bal
ance
sh
eet
cred
it r
isk
was
US
D16
05
3 2
45
(20
15: U
SD
33
96
2 7
56
).
4A
mou
nt
is n
et o
f in
tere
st in
su
spen
se.
Lo
ans
and
ad
van
ces
to c
ust
om
ers
20
16U
SD
46
3 3
07
80
7
-
-
46
3 3
07
80
7
-
-
-
4
63
30
7 8
07
-
20
15U
SD
39
3 7
10 6
92
-
-
39
3 7
10 6
92
-
-
-
3
93
710
69
2
-
20
14U
SD
270
117
616
-
-
270
117
616
-
-
-
270
117
616
-
Lo
ans
and
ad
van
ces
to b
ank
s
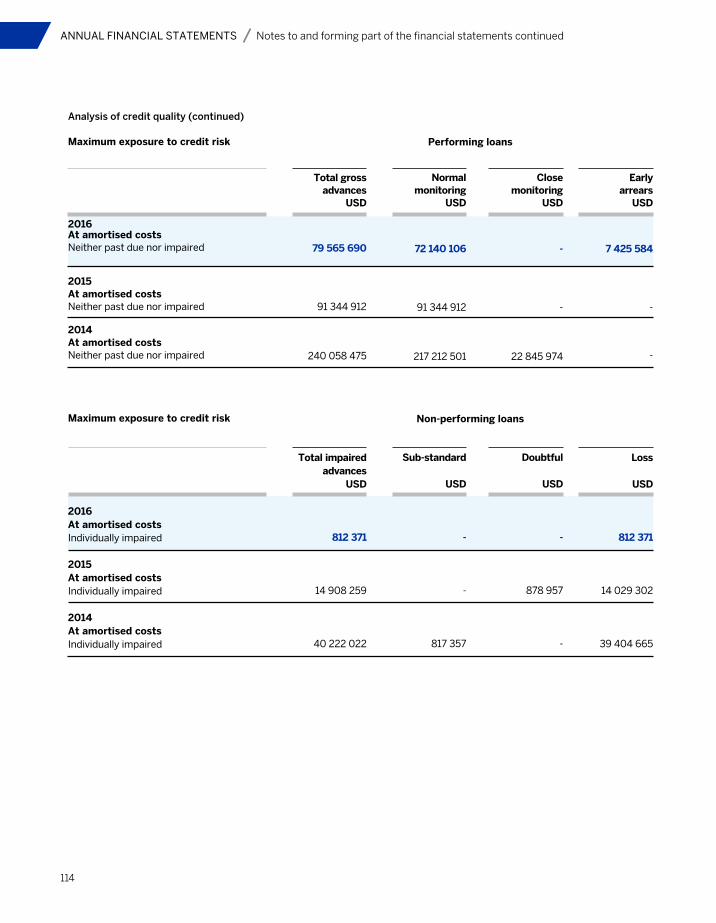
114
ANNUAL FINANCIAL STATEMENTS Notes to and forming part of the financial statements continued
Total gross advances
USD
79 565 690
91 344 912
240 058 475
Analysis of credit quality (continued)
Maximum exposure to credit risk
2016At amortised costsNeither past due nor impaired
2015At amortised costsNeither past due nor impaired
2014At amortised costsNeither past due nor impaired
Normalmonitoring
USD
72 140 106
91 344 912
217 212 501
Closemonitoring
USD
-
-
22 845 974
Performing loans
Earlyarrears
USD
7 425 584
-
-
Total impaired advances
USD
812 371
14 908 259
40 222 022
Maximum exposure to credit risk
2016At amortised costsIndividually impaired
2015At amortised costsIndividually impaired
2014At amortised costsIndividually impaired
Sub-standard
USD
-
-
817 357
Doubtful
USD
-
878 957
-
Non-performing loans
Loss
USD
812 371
14 029 302
39 404 665
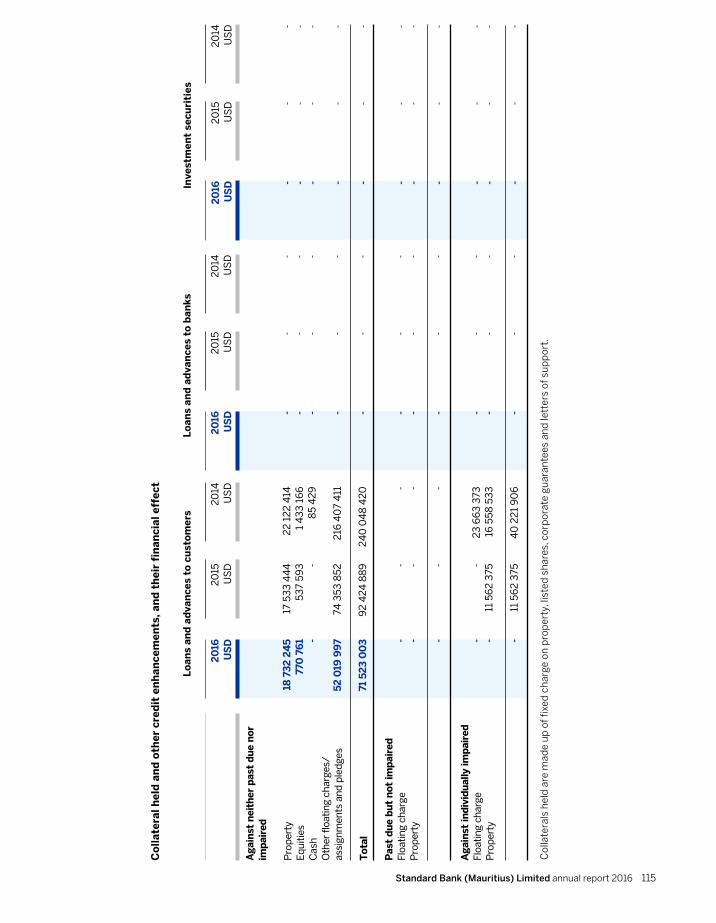
Standard Bank (Mauritius) Limited annual report 2016 115
20
16U
SD - - -
- - - - - - - -
20
15U
SD - - -
- - - - - - - -
20
14U
SD - - -
- - - - - - - -
Inve
stm
ent
secu
riti
es
20
16U
SD
18 7
32
24
5
770
76
1 -
52
019
99
7
71 5
23
00
3 - - - - - -
Ag
ain
st n
eith
er p
ast
du
e n
or
imp
aire
d
Pro
pert
y E
quiti
es
Cas
h
Oth
er fl
oatin
g ch
arge
s/as
sign
men
ts a
nd p
ledg
es
To
tal
Pas
t d
ue
bu
t n
ot
imp
aire
d
Floa
ting
char
ge
Pro
pert
y
Ag
ain
st in
div
idu
ally
imp
aire
d
Floa
ting
char
ge
Pro
pert
y
20
15U
SD
17
533
44
4
53
7 59
3
-
74
353
852
92
42
4 8
89 - - - -
11 5
62
375
11 5
62
375
20
14U
SD
22
12
2 4
14
1 4
33
16
6
85
42
9
216
40
7 4
11
24
0 0
48
42
0 - - - 2
3 6
63
373
1
6 5
58 5
33
40
22
1 9
06
Co
llat
eral
hel
d a
nd
oth
er c
red
it e
nh
ance
men
ts, a
nd
th
eir
fin
anci
al e
ffec
t
Col
late
rals
hel
d a
re m
ade
up
of fi
xed
ch
arge
on
pro
per
ty, l
iste
d s
har
es, c
orp
orat
e gu
aran
tees
an
d le
tter
s of
su
pp
ort.
Lo
ans
and
ad
van
ces
to c
ust
om
ers
20
16U
SD - - -
- - - - - - - -
20
15U
SD - - -
- - - - - - - -
20
14U
SD - - -
- - - - - - - -
Lo
ans
and
ad
van
ces
to b
ank
s
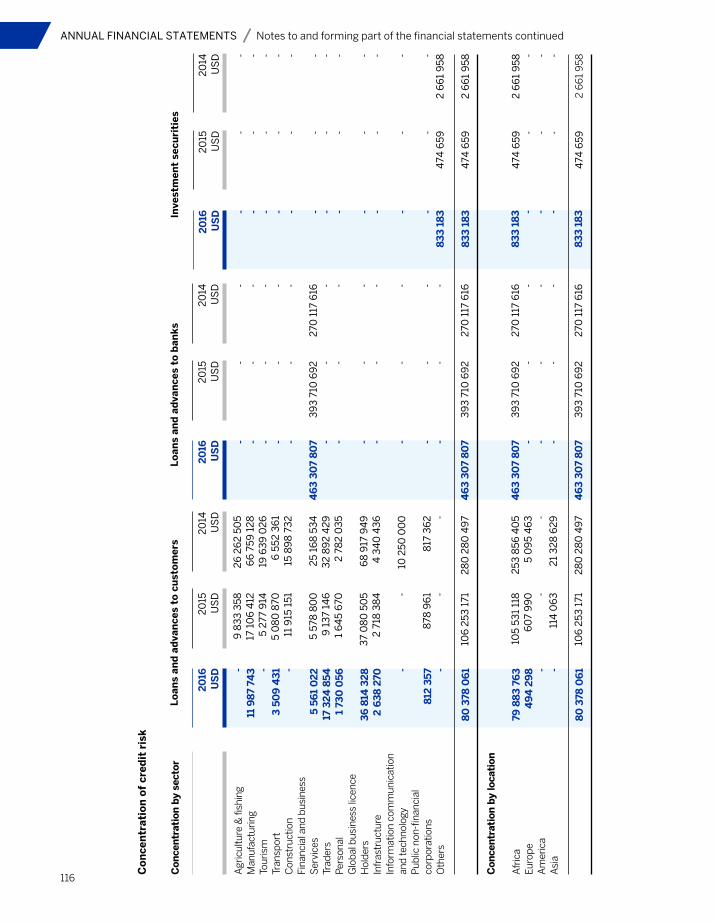
116
ANNUAL FINANCIAL STATEMENTS Notes to and forming part of the financial statements continued
20
16U
SD - - - - - - - - - - - -
83
3 1
83
83
3 1
83
83
3 1
83
-
-
-
83
3 1
83
20
15U
SD - - - - - - - - - - - -
474
659
4
74 6
59
474
659
-
-
-
474
659
20
14U
SD - - - - - - - - - - - -
2 6
61
958
2
66
1 9
58
2 6
61
958
-
-
-
2 6
61
958
Inve
stm
ent
secu
riti
es
20
16U
SD -
11 9
87
743 -
3 5
09
43
1 -
5 5
61
02
217
32
4 8
54
1 73
0 0
56
36
814
32
82
63
8 2
70
-
812
35
7 -
80
378
06
1
79 8
83
76
34
94
29
8 - -
80
378
06
1
Co
nce
ntr
atio
n b
y se
cto
r
Agr
icul
ture
& fi
shin
g M
anuf
actu
ring
To
uris
m
Tran
spor
t C
onst
ruct
ion
Fi
nanc
ial a
nd b
usin
ess
Ser
vice
s Tr
ader
s Pe
rson
al
Glo
bal b
usin
ess
licen
ce
Hol
ders
In
fras
truc
ture
In
form
atio
n co
mm
unic
atio
n
and
tech
nolo
gy
Pub
lic n
on-f
inan
cial
co
rpor
atio
ns
Oth
ers
Co
nce
ntr
atio
n b
y lo
cati
on
Afr
ica
Euro
pe
Am
eric
a A
sia
20
15U
SD
9 8
33
358
17 1
06
412
5 2
77 9
145
08
0 8
7011
915
151
5 57
8 8
00
9 1
37
146
1 6
45
670
37
08
0 5
05
2 7
18 3
84 -
878
96
1 -
106
253
171
105
531
118
60
7 9
90 -
11
4 0
63
106
253
171
20
14U
SD
26
26
2 5
05
6
6 7
59 1
28
1
9 6
39
02
6
6 5
52 3
61
15
89
8 7
32
25
168
53
4
32
89
2 4
29
2
78
2 0
35
6
8 9
17 9
49
4
34
0 4
36
10
250
00
0
817
36
2 -
28
0 2
80
49
7
253
856
40
55
09
5 4
63 -
2
1 3
28
62
9
28
0 2
80
49
7
Co
nce
ntr
atio
n o
f cr
edit
ris
k
Lo
ans
and
ad
van
ces
to c
ust
om
ers
20
16U
SD - - - - -
46
3 3
07
80
7 - - - - - - - 4
63
30
7 8
07
46
3 3
07
80
7 -
-
-
46
3 3
07
80
7
20
15U
SD - - - - -
39
3 7
10 6
92 - - - - - - -
39
3 7
10 6
92
39
3 7
10 6
92 -
-
-
39
3 7
10 6
92
20
14U
SD - - - - -
270
117
616
- - - - - - -
270
117
616
270
117
616
-
-
-
270
117
616
Lo
ans
and
ad
van
ces
to b
ank
s
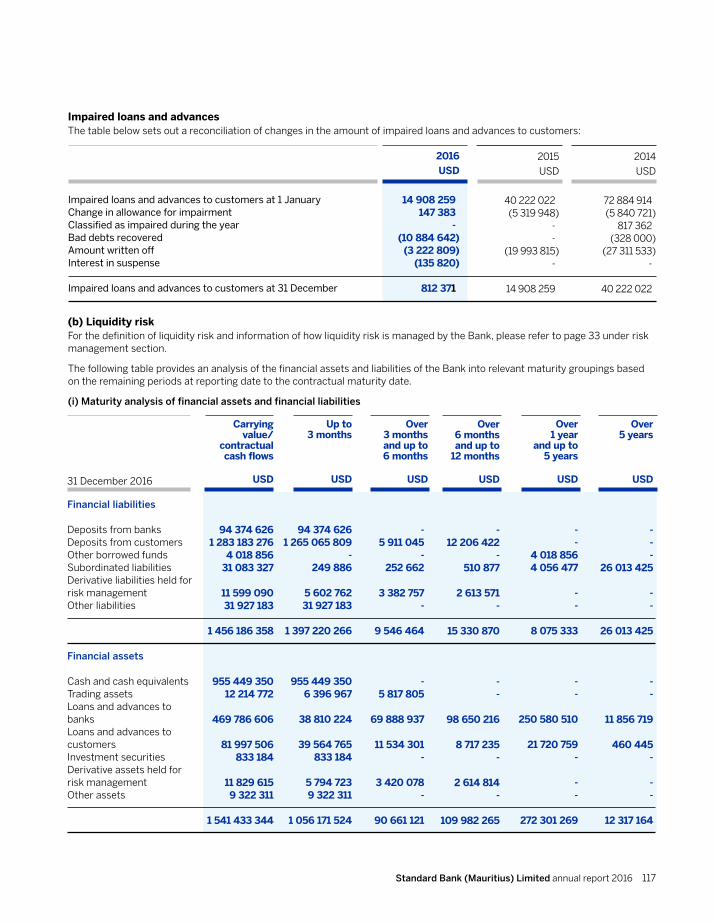
Standard Bank (Mauritius) Limited annual report 2016 117
(b) Liquidity riskFor the definition of liquidity risk and information of how liquidity risk is managed by the Bank, please refer to page 33 under risk management section.
The following table provides an analysis of the financial assets and liabilities of the Bank into relevant maturity groupings based on the remaining periods at reporting date to the contractual maturity date.
(i) Maturity analysis of financial assets and financial liabilities
Impaired loans and advancesThe table below sets out a reconciliation of changes in the amount of impaired loans and advances to customers:
2016
USD
14 908 259147 383
-(10 884 642)
(3 222 809)(135 820)
812 371
Impaired loans and advances to customers at 1 JanuaryChange in allowance for impairmentClassified as impaired during the yearBad debts recoveredAmount written offInterest in suspense
Impaired loans and advances to customers at 31 December
2015
USD
40 222 022(5 319 948)
--
(19 993 815)-
14 908 259
2014
USD
72 884 914(5 840 721)
817 362(328 000)
(27 311 533)-
40 222 022
Carrying value/
contractual cash flows
USD
94 374 626 1 283 183 276
4 018 856 31 083 327
11 599 09031 927 183
1 456 186 358
955 449 35012 214 772
469 786 606
81 997 506 833 184
11 829 615 9 322 311
1 541 433 344
Up to3 months
USD
94 374 6261 265 065 809
- 249 886
5 602 76231 927 183
1 397 220 266
955 449 3506 396 967
38 810 224
39 564 765 833 184
5 794 723 9 322 311
1 056 171 524
Over3 monthsand up to6 months
USD
-5 911 045
- 252 662
3 382 757
-
9 546 464
-
5 817 805
69 888 937
11 534 301 -
3 420 078 -
90 661 121
Over6 monthsand up to
12 months
USD
-12 206 422
- 510 877
2 613 571
-
15 330 870
- -
98 650 216
8 717 235 -
2 614 814
-
109 982 265
Over1 year
and up to5 years
USD
--
4 018 856 4 056 477
-
-
8 075 333
- -
250 580 510
21 720 759 -
-
-
272 301 269
Over5 years
USD
- - - 26 013 425
-
-
26 013 425
- -
11 856 719
460 445 -
- -
12 317 164
31 December 2016
Financial liabilities
Deposits from banksDeposits from customersOther borrowed fundsSubordinated liabilitiesDerivative liabilities held for risk managementOther liabilities
Financial assets
Cash and cash equivalentsTrading assetsLoans and advances tobanksLoans and advances to customersInvestment securitiesDerivative assets held for risk managementOther assets

31 December 2015
Financial liabilities
Deposits from banksDeposits from customersOther borrowed fundsSubordinated liabilitiesUnrecognised loan commitments5
Derivative liabilities held for risk managementOther liabilities
Financial assets
Cash and cash equivalentsTrading assetsLoans and advances tobanksLoans and advances to customersInvestment securitiesDerivative assets held for risk managementOther assets
118
ANNUAL FINANCIAL STATEMENTS Notes to and forming part of the financial statements continued
Carrying value/
contractual cash flows
USD
79 148 172 1 164 809 245
10 996 98425 000 000
20 905 668
8 618 00939 370 705
1 348 848 783
858 078 80039 163 539
393 710 692
100 752 826474 659
9 016 81913 501 021
1 414 698 356
Up to3 months
USD
79 148 1721 151 076 271
6 760 555 -
-
8 618 00939 370 705
1 284 973 712
858 078 80030 573 363
52 461 925
23 609 619474 659
9 016 81913 501 021
987 716 206
Over3 monthsand up to6 months
USD
-5 861 506
- -
-
- -
5 861 506
- 5 191 880
120 264 266
1 541 896 -
- -
126 998 042
Over6 monthsand up to
12 months
USD
-6 446 9494 236 429
-
20 905 668
- -
31 589 046
- 3 398 296
150 984 501
9 220 839 -
- -
163 603 636
Over1 year
and up to5 years
USD
-1 424 519
- -
-
- -
1 424 519
- -
70 000 000
49 078 102 -
- -
119 078 102
Over5 years
USD
- - -
25 000 000
-
- -
25 000 000
- -
-
17 302 370 -
- -
17 302 370
31 December 2014
Financial liabilities
Deposits from banksDeposits from customersOther borrowed fundsTrading liabilitiesSubordinated liabilities Unrecognised loan commitments5
Derivative liabilities held for risk managementOther liabilities
Financial assets
Cash and cash equivalentsTrading assetsLoans and advances to banksLoans and advances to customersInvestment securitiesDerivative assets held for risk managementOther assets
22 885 089 3 025 659 257
43 455 945 23 342 017
25 000 000
15 462 256
3 796 2977 890 576
3 167 491 437
2 497 991 968184 035 481
270 117 616
249 836 8712 661 958
4 503 93716 130 091
3 225 277 922
2 601 758 2 975 821 582
38 278 088 23 342 017
-
-
3 796 2977 890 576
3 051 730 318
2 497 991 968184 035 481
730 780
89 916 699-
4 503 93716 130 091
2 793 308 956
20 283 331 40 756 312
- - -
15 462 256
--
76 501 899
- -
24 128 372
6 759 6912 661 958
- -
33 550 021
- 5 815 811 5 177 857
- -
-
--
10 993 668
- -
195 243 263
17 685 152-
- -
212 928 415
- 3 265 552
- - -
-
--
3 265 552
- -
50 015 201
93 288 602-
- -
143 303 803
- - - -
25 000 000
-
--
25 000 000
- -
-
42 186 727-
- -
42 186 727
5Unrecognised loan commitments were reclassified from irrevocable to revocable facilities in 2016.
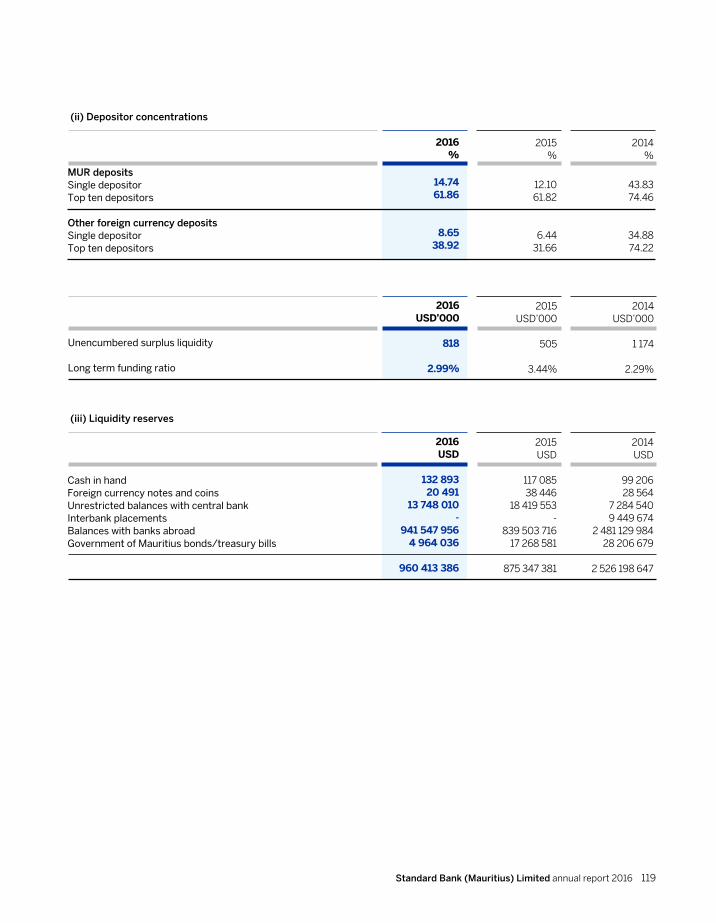
Standard Bank (Mauritius) Limited annual report 2016 119
(ii) Depositor concentrations
2016%
14.7461.86
8.6538.92
MUR depositsSingle depositorTop ten depositors
Other foreign currency depositsSingle depositorTop ten depositors
2015%
12.1061.82
6.4431.66
2014%
43.8374.46
34.8874.22
(iii) Liquidity reserves
2016USD
132 89320 491
13 748 010-
941 547 9564 964 036
960 413 386
Cash in handForeign currency notes and coinsUnrestricted balances with central bank Interbank placementsBalances with banks abroadGovernment of Mauritius bonds/treasury bills
2015USD
117 08538 446
18 419 553-
839 503 71617 268 581
875 347 381
2014USD
99 20628 564
7 284 5409 449 674
2 481 129 98428 206 679
2 526 198 647
2016USD’000
818
2.99%
Unencumbered surplus liquidity
Long term funding ratio
2015USD’000
505
3.44%
2014USD’000
1 174
2.29%
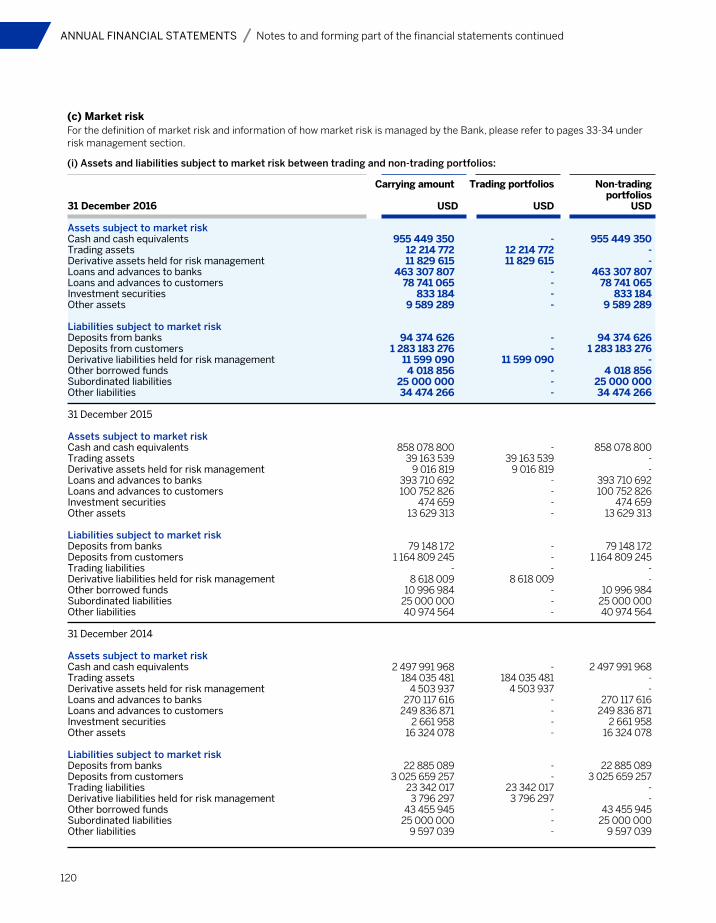
120
ANNUAL FINANCIAL STATEMENTS Notes to and forming part of the financial statements continued
(c) Market riskFor the definition of market risk and information of how market risk is managed by the Bank, please refer to pages 33-34 under risk management section.
(i) Assets and liabilities subject to market risk between trading and non-trading portfolios:
Carrying amount
USD
955 449 350 12 214 772 11 829 615
463 307 807 78 741 065
833 184 9 589 289
94 374 626 1 283 183 276
11 599 090 4 018 856
25 000 000 34 474 266
858 078 800 39 163 539
9 016 819 393 710 692 100 752 826
474 659 13 629 313
79 148 172 1 164 809 245
- 8 618 009
10 996 984 25 000 000
40 974 564
2 497 991 968184 035 481
4 503 937270 117 616
249 836 8712 661 958
16 324 078
22 885 0893 025 659 257
23 342 0173 796 297
43 455 94525 000 000
9 597 039
31 December 2016
Assets subject to market risk Cash and cash equivalents Trading assets Derivative assets held for risk management Loans and advances to banks Loans and advances to customers Investment securities Other assets
Liabilities subject to market riskDeposits from banks Deposits from customersDerivative liabilities held for risk management Other borrowed funds Subordinated liabilities Other liabilities
31 December 2015
Assets subject to market risk Cash and cash equivalents Trading assets Derivative assets held for risk management Loans and advances to banks Loans and advances to customers Investment securities Other assets
Liabilities subject to market riskDeposits from banks Deposits from customersTrading liabilitiesDerivative liabilities held for risk management Other borrowed funds Subordinated liabilities Other liabilities
31 December 2014
Assets subject to market risk Cash and cash equivalents Trading assets Derivative assets held for risk management Loans and advances to banks Loans and advances to customers Investment securities Other assets
Liabilities subject to market riskDeposits from banks Deposits from customersTrading liabilitiesDerivative liabilities held for risk management Other borrowed funds Subordinated liabilitiesOther liabilities
Trading portfolios
USD
-
12 214 772 11 829 615 - - -
-
- -
11 599 090 - -
-
- 39 163 539
9 016 819 - - -
-
- -
-8 618 009
- -
-
-
184 035 4814 503 937
- - -
-
- -
23 342 0173 796 297
- -
-
Non-trading portfolios
USD
955 449 350 - -
463 307 807 78 741 065
833 184 9 589 289
94 374 626 1 283 183 276
- 4 018 856
25 000 000 34 474 266
858 078 800 -
- 393 710 692
100 752 826 474 659
13 629 313
79 148 172 1 164 809 245
- -
10 996 984 25 000 000
40 974 564
2 497 991 968 -
-270 117 616
249 836 8712 661 958
16 324 078
22 885 0893 025 659 257
--
43 455 94525 000 000
9 597 039
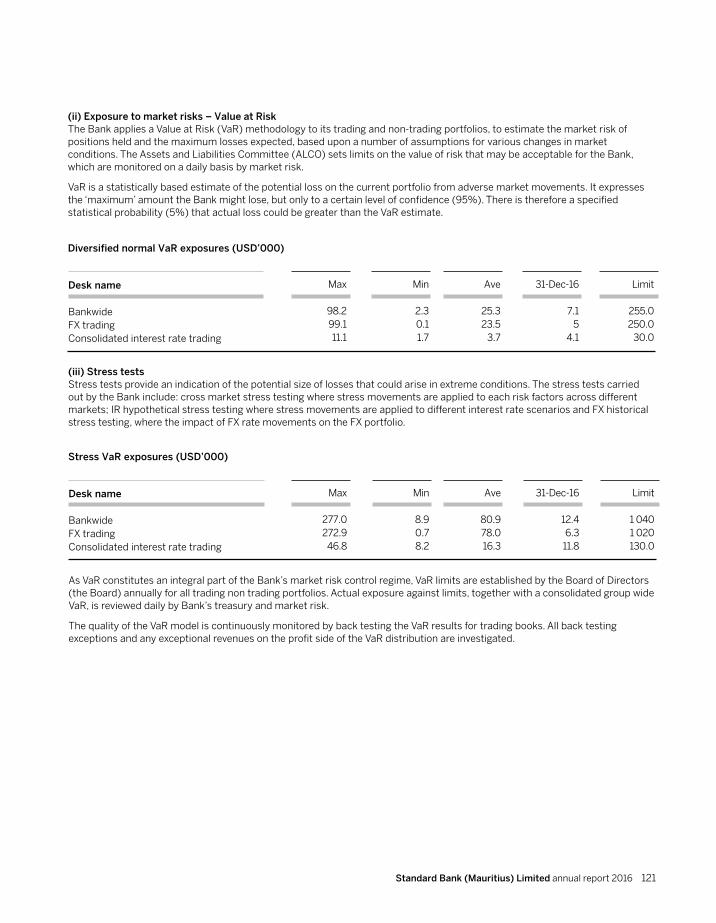
Standard Bank (Mauritius) Limited annual report 2016 121
(ii) Exposure to market risks – Value at RiskThe Bank applies a Value at Risk (VaR) methodology to its trading and non-trading portfolios, to estimate the market risk of positions held and the maximum losses expected, based upon a number of assumptions for various changes in market conditions. The Assets and Liabilities Committee (ALCO) sets limits on the value of risk that may be acceptable for the Bank, which are monitored on a daily basis by market risk.
VaR is a statistically based estimate of the potential loss on the current portfolio from adverse market movements. It expresses the ‘maximum’ amount the Bank might lose, but only to a certain level of confidence (95%). There is therefore a specified statistical probability (5%) that actual loss could be greater than the VaR estimate.
Diversified normal VaR exposures (USD’000)
Desk name
BankwideFX tradingConsolidated interest rate trading
Min
2.30.11.7
Ave
25.323.5
3.7
31-Dec-16
7.15
4.1
Limit
255.0250.0
30.0
Max
98.299.111.1
(iii) Stress testsStress tests provide an indication of the potential size of losses that could arise in extreme conditions. The stress tests carried out by the Bank include: cross market stress testing where stress movements are applied to each risk factors across different markets; IR hypothetical stress testing where stress movements are applied to different interest rate scenarios and FX historical stress testing, where the impact of FX rate movements on the FX portfolio.
Stress VaR exposures (USD’000)
Desk name
BankwideFX tradingConsolidated interest rate trading
Min
8.90.78.2
Ave
80.978.016.3
31-Dec-16
12.46.3
11.8
Limit
1 0401 020130.0
Max
277.0272.9
46.8
As VaR constitutes an integral part of the Bank’s market risk control regime, VaR limits are established by the Board of Directors (the Board) annually for all trading non trading portfolios. Actual exposure against limits, together with a consolidated group wide VaR, is reviewed daily by Bank’s treasury and market risk.
The quality of the VaR model is continuously monitored by back testing the VaR results for trading books. All back testing exceptions and any exceptional revenues on the profit side of the VaR distribution are investigated.
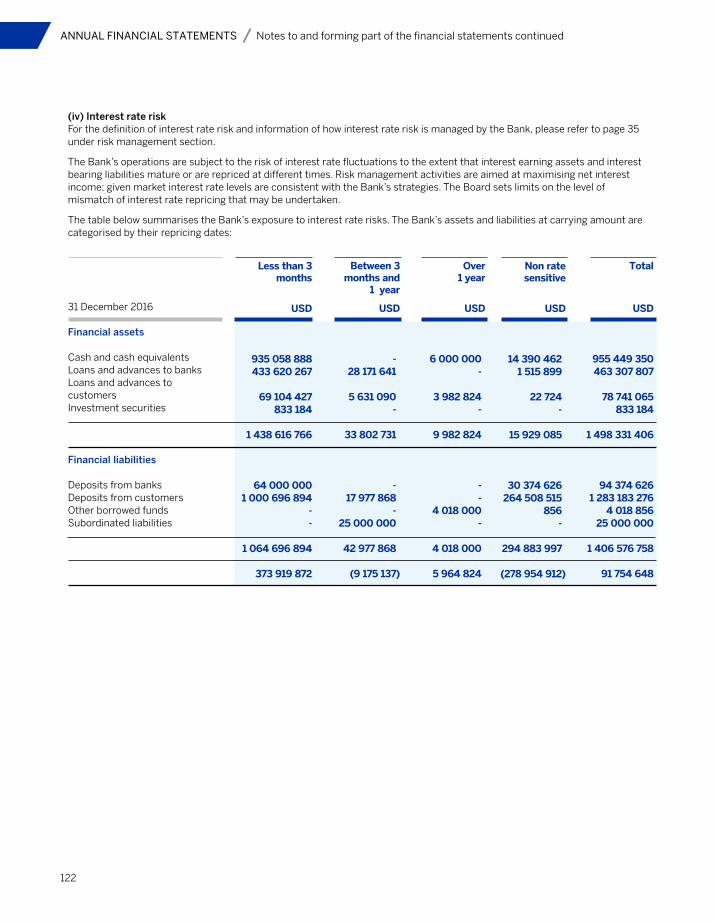
31 December 2016
Financial assets
Cash and cash equivalents Loans and advances to banks Loans and advances to customers Investment securities
Financial liabilities
Deposits from banks Deposits from customers Other borrowed fundsSubordinated liabilities
122
ANNUAL FINANCIAL STATEMENTS Notes to and forming part of the financial statements continued
(iv) Interest rate riskFor the definition of interest rate risk and information of how interest rate risk is managed by the Bank, please refer to page 35 under risk management section.
The Bank’s operations are subject to the risk of interest rate fluctuations to the extent that interest earning assets and interest bearing liabilities mature or are repriced at different times. Risk management activities are aimed at maximising net interest income; given market interest rate levels are consistent with the Bank’s strategies. The Board sets limits on the level of mismatch of interest rate repricing that may be undertaken.
The table below summarises the Bank’s exposure to interest rate risks. The Bank’s assets and liabilities at carrying amount are categorised by their repricing dates:
Less than 3 months
USD
935 058 888433 620 267
69 104 427833 184
1 438 616 766
64 000 0001 000 696 894
- -
1 064 696 894
373 919 872
Between 3 months and
1 year
USD
- 28 171 641
5 631 090-
33 802 731
- 17 977 868
- 25 000 000
42 977 868
(9 175 137)
Over1 year
USD
6 000 000 -
3 982 824 -
9 982 824
- -
4 018 000 -
4 018 000
5 964 824
Non rate sensitive
USD
14 390 4621 515 899
22 724 -
15 929 085
30 374 626264 508 515
856 -
294 883 997
(278 954 912)
Total
USD
955 449 350463 307 807
78 741 065833 184
1 498 331 406
94 374 6261 283 183 276
4 018 85625 000 000
1 406 576 758
91 754 648
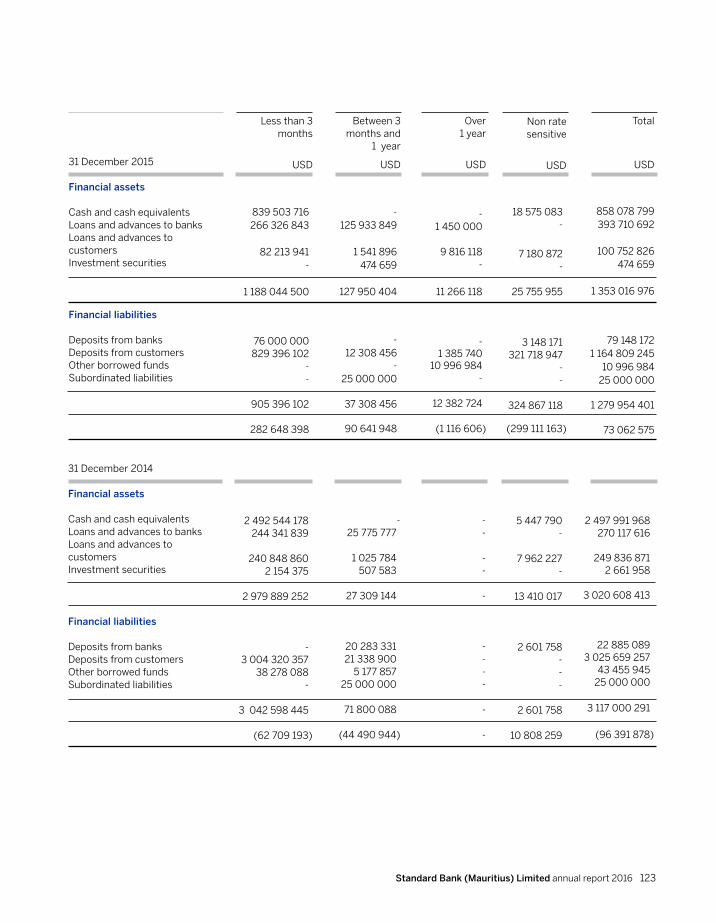
Standard Bank (Mauritius) Limited annual report 2016 123
31 December 2015
Financial assets
Cash and cash equivalents Loans and advances to banks Loans and advances to customers Investment securities
Financial liabilities
Deposits from banks Deposits from customers Other borrowed fundsSubordinated liabilities
Less than 3 months
USD
839 503 716266 326 843
82 213 941-
1 188 044 500
76 000 000829 396 102
--
905 396 102
282 648 398
Between 3 months and
1 year
USD
-125 933 849
1 541 896474 659
127 950 404
-12 308 456
-25 000 000
37 308 456
90 641 948
Over1 year
USD
-1 450 000
9 816 118-
11 266 118
-1 385 740
10 996 984-
12 382 724
(1 116 606)
Non rate sensitive
USD
18 575 083-
7 180 872-
25 755 955
3 148 171321 718 947
- -
324 867 118
(299 111 163)
Total
USD
858 078 799393 710 692
100 752 826474 659
1 353 016 976
79 148 172 1 164 809 245
10 996 984 25 000 000
1 279 954 401
73 062 575
31 December 2014
Financial assets
Cash and cash equivalents Loans and advances to banks Loans and advances to customers Investment securities
Financial liabilities
Deposits from banks Deposits from customers Other borrowed fundsSubordinated liabilities
2 492 544 178244 341 839
240 848 8602 154 375
2 979 889 252
-3 004 320 357
38 278 088-
3 042 598 445
(62 709 193)
-25 775 777
1 025 784507 583
27 309 144
20 283 33121 338 900
5 177 85725 000 000
71 800 088
(44 490 944)
- -
- -
-
- -
- -
-
-
5 447 790-
7 962 227 -
13 410 017
2 601 758--
-
2 601 758
10 808 259
2 497 991 968 270 117 616
249 836 871 2 661 958
3 020 608 413
22 885 089 3 025 659 257
43 455 945 25 000 000
3 117 000 291
(96 391 878)
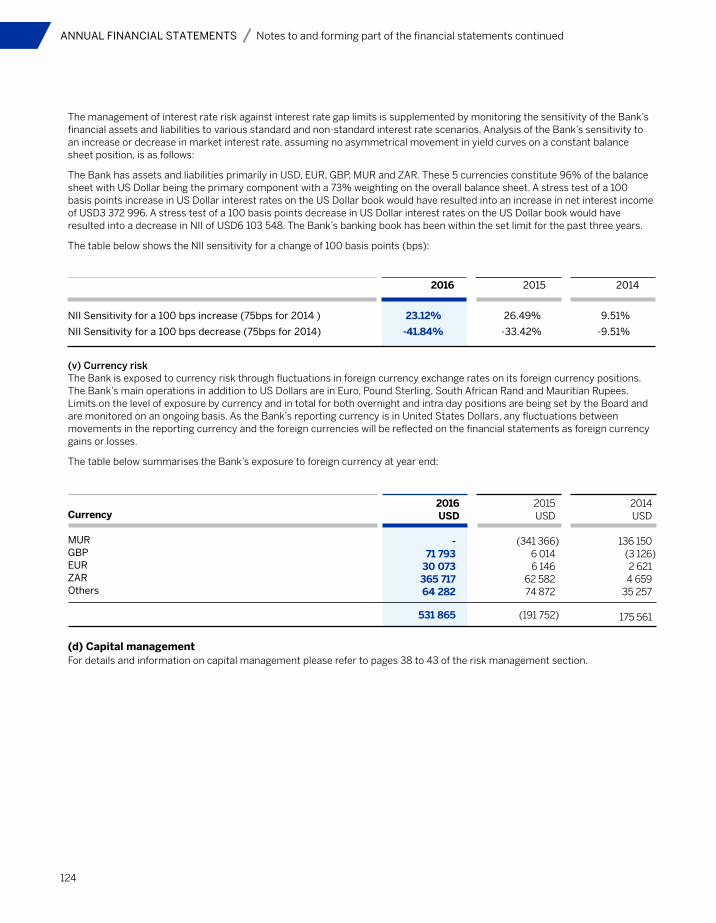
124
ANNUAL FINANCIAL STATEMENTS Notes to and forming part of the financial statements continued
The management of interest rate risk against interest rate gap limits is supplemented by monitoring the sensitivity of the Bank’s financial assets and liabilities to various standard and non-standard interest rate scenarios. Analysis of the Bank’s sensitivity to an increase or decrease in market interest rate, assuming no asymmetrical movement in yield curves on a constant balance sheet position, is as follows:
The Bank has assets and liabilities primarily in USD, EUR, GBP, MUR and ZAR. These 5 currencies constitute 96% of the balance sheet with US Dollar being the primary component with a 73% weighting on the overall balance sheet. A stress test of a 100 basis points increase in US Dollar interest rates on the US Dollar book would have resulted into an increase in net interest income of USD3 372 996. A stress test of a 100 basis points decrease in US Dollar interest rates on the US Dollar book would have resulted into a decrease in NII of USD6 103 548. The Bank’s banking book has been within the set limit for the past three years.
The table below shows the NII sensitivity for a change of 100 basis points (bps):
NII Sensitivity for a 100 bps increase (75bps for 2014 ) 23.12% 26.49% 9.51%
NII Sensitivity for a 100 bps decrease (75bps for 2014) -41.84% -33.42% -9.51%
2016 2015 2014
(v) Currency riskThe Bank is exposed to currency risk through fluctuations in foreign currency exchange rates on its foreign currency positions. The Bank’s main operations in addition to US Dollars are in Euro, Pound Sterling, South African Rand and Mauritian Rupees. Limits on the level of exposure by currency and in total for both overnight and intra day positions are being set by the Board and are monitored on an ongoing basis. As the Bank’s reporting currency is in United States Dollars, any fluctuations between movements in the reporting currency and the foreign currencies will be reflected on the financial statements as foreign currency gains or losses.
The table below summarises the Bank’s exposure to foreign currency at year end:
2016USD
- 71 793
30 073 365 717 64 282
531 865
Currency
MUR GBP EUR ZAR Others
2015USD
(341 366) 6 014 6 146
62 582 74 872
(191 752)
2014USD
136 150 (3 126) 2 621 4 659
35 257
175 561
(d) Capital managementFor details and information on capital management please refer to pages 38 to 43 of the risk management section.
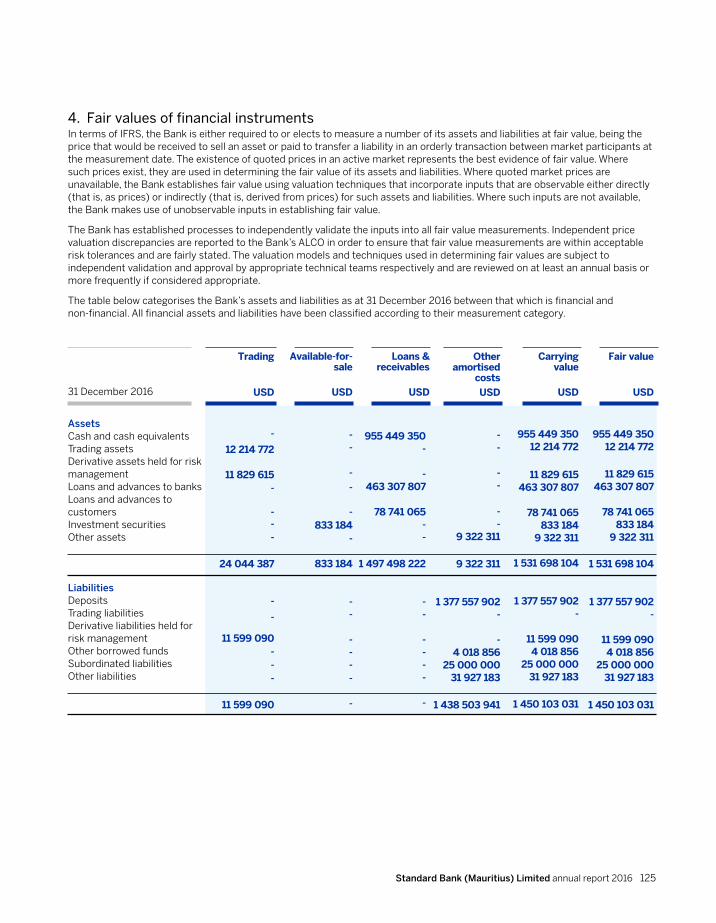
Standard Bank (Mauritius) Limited annual report 2016 125
31 December 2016
AssetsCash and cash equivalents Trading assets Derivative assets held for risk managementLoans and advances to banks Loans and advances to customers Investment securities Other assets
LiabilitiesDepositsTrading liabilities Derivative liabilities held for risk managementOther borrowed fundsSubordinated liabilitiesOther liabilities
4. Fair values of financial instrumentsIn terms of IFRS, the Bank is either required to or elects to measure a number of its assets and liabilities at fair value, being the price that would be received to sell an asset or paid to transfer a liability in an orderly transaction between market participants at the measurement date. The existence of quoted prices in an active market represents the best evidence of fair value. Where such prices exist, they are used in determining the fair value of its assets and liabilities. Where quoted market prices are unavailable, the Bank establishes fair value using valuation techniques that incorporate inputs that are observable either directly (that is, as prices) or indirectly (that is, derived from prices) for such assets and liabilities. Where such inputs are not available, the Bank makes use of unobservable inputs in establishing fair value.
The Bank has established processes to independently validate the inputs into all fair value measurements. Independent price valuation discrepancies are reported to the Bank’s ALCO in order to ensure that fair value measurements are within acceptable risk tolerances and are fairly stated. The valuation models and techniques used in determining fair values are subject to independent validation and approval by appropriate technical teams respectively and are reviewed on at least an annual basis or more frequently if considered appropriate.
The table below categorises the Bank’s assets and liabilities as at 31 December 2016 between that which is financial and non-financial. All financial assets and liabilities have been classified according to their measurement category.
Trading
USD
-
12 214 772
11 829 615-
- - -
24 044 387
-
-
11 599 090 - - -
11 599 090
Available-for- sale
USD
- -
-
-
- 833 184
-
833 184
- -
- - - - -
Loans & receivables
USD
955 449 350-
- 463 307 807
78 741 065--
1 497 498 222
- -
- - - -
-
Other amortised
costs
USD
- -
- -
- -
9 322 311
9 322 311
1 377 557 902-
- 4 018 856
25 000 00031 927 183
1 438 503 941
Carryingvalue
USD
955 449 35012 214 772
11 829 615463 307 807
78 741 065833 184
9 322 311
1 531 698 104
1 377 557 902-
11 599 090
4 018 85625 000 000
31 927 183
1 450 103 031
Fair value
USD
955 449 35012 214 772
11 829 615463 307 807
78 741 065833 184
9 322 311
1 531 698 104
1 377 557 902-
11 599 090
4 018 85625 000 000
31 927 183
1 450 103 031

31 December 2015
AssetsCash and cash equivalents Trading assets Derivative assets held for risk managementLoans and advances to banks Loans and advances to customers Investment securities Other assets
LiabilitiesDepositsTrading liabilities Derivative liabilities held for risk managementOther borrowed fundsSubordinated liabilitiesOther liabilities
126
ANNUAL FINANCIAL STATEMENTS Notes to and forming part of the financial statements continued
Trading
USD
- 39 163 539
9 016 819-
- - -
48 180 358
- -
8 618 009
- - -
8 618 009
Available-for-Sale
USD
- -
- -
- 474 659
-
474 659
- -
- - - -
-
Loans & receivables
USD
858 078 800-
- 393 710 692
100 752 826--
1 352 542 318
- -
- - - -
-
Otheramortised
costsUSD
- -
- -
- -
13 501 021
13 501 021
1 243 957 417-
- 10 996 984
25 000 00039 370 705
1 319 325 106
Carryingvalue
USD
858 078 80039 163 539
9 016 819393 710 692
100 752 826474 659
13 501 021
1 414 698 356
1 243 957 417-
8 618 009 10 996 984
25 000 00039 370 705
1 327 943 115
Fair value
USD
858 078 80039 163 539
9 016 819393 710 692
100 752 826474 659
13 501 021
1 414 698 356
1 243 957 417-
8 618 009 10 996 984
25 000 00039 370 705
1 327 943 115
31 December 2014
AssetsCash and cash equivalents Trading assets Derivative assets held for risk managementLoans and advances to banks Loans and advances to customers Investment securities Other assets
LiabilitiesDepositsTrading liabilities Derivative liabilities held for risk managementOther borrowed fundsSubordinated liabilitiesOther liabilities
- 184 035 481
4 503 937-
- --
188 539 418
- 23 342 017
3 796 297- -
-
27 138 314
- -
- -
- 2 661 958
-
2 661 958
- -
- - - -
-
2 497 991 968-
-
270 117 616
249 836 871--
3 017 946 455
- -
- - -
-
-
- -
- -
--
16 130 091
16 130 091
3 048 544 346-
- 43 455 945
25 000 0007 890 576
3 124 890 867
2 497 991 968184 035 481
4 503 937270 117 616
249 836 8712 661 958
16 130 091
3 225 277 922
3 048 544 34623 342 017
3 796 29743 455 945
25 000 0007 890 576
3 152 029 181
2 497 991 968184 035 481
4 503 937270 117 616
249 836 8712 661 958
16 130 091
3 225 277 922
3 048 544 34623 342 017
3 796 29743 455 945
25 000 0007 890 576
3 152 029 181

Standard Bank (Mauritius) Limited annual report 2016 127
The tables that follow analyse the Bank’s financial assets and liabilities at the end of the reporting period, by level of fair value hierarchy as required by IFRS. The different levels are based on the extent to which observable market data and inputs are used in the calculation of the fair value of the financial assets and liabilities. The levels of the hierarchy are defined as follows:
Level 1 – fair values are based on quoted market prices (unadjusted) in active markets for an identical financial asset or liability. An active market is a market in which transactions for the asset or liability take place with sufficient frequency and volume to provide pricing information on an ongoing basis.
Level 2 – Fair value is determined through valuation techniques based on observable inputs, either directly, such as quoted prices, or indirectly, such as those derived from quoted prices. This category includes instruments valued using quoted market prices in active markets for similar instruments, quoted prices for identical or similar instruments in markets that are considered less than active or other valuation techniques where all significant inputs are directly or indirectly observable from market data.
Level 3 – Fair value is determined through valuation techniques using significant unobservable inputs. This category includes all instruments where the valuation technique includes inputs not based on observable data and the unobservable inputs have a significant effect on the instrument’s valuation. This category includes instruments that are valued based on quoted prices for similar instruments where significant unobservable adjustments or assumptions are required to reflect differences between the instrument being valued and the similar instrument.
Level 1
USD
955 449 350 - - -
- -
8 792 527
964 241 877
30 341 194 1 000 433 600
-
- - -
28 055 528
1 058 830 322
Level 2
USD
- 12 214 772 11 829 615
463 307 807 78 648 004
833 184 -
566 833 382
64 033 432282 749 676
-
11 599 090 4 018 856
25 000 000 -
387 401 054
Level 3
USD
- - - -
1 730 057 -
529 784
2 259 841
- - -
- - -
3 871 655
3 871 655
Carryingvalue
USD
955 449 350 12 214 772 11 829 615
463 307 807 80 378 061
833 184 9 322 311
1 533 335 100
94 374 626 1 283 183 276
-
11 599 090 4 018 856
25 000 000 31 927 183
1 450 103 031
Fair value
USD
955 449 350 12 214 772 11 829 615
463 307 807 80 378 061
833 184 9 322 311
1 533 335 100
94 374 626 1 283 183 276
-
11 599 090 4 018 856
25 000 000 31 927 183
1 450 103 031
31 December 2016
AssetsCash and cash equivalents Trading assets Derivative assets held for risk managementLoans and advances to banks Loans and advances to customers Investment securities Other assets
LiabilitiesDeposits from banksDeposits from customersTrading liabilities Derivative liabilities held for risk managementOther borrowed fundsSubordinated liabilitiesOther liabilities
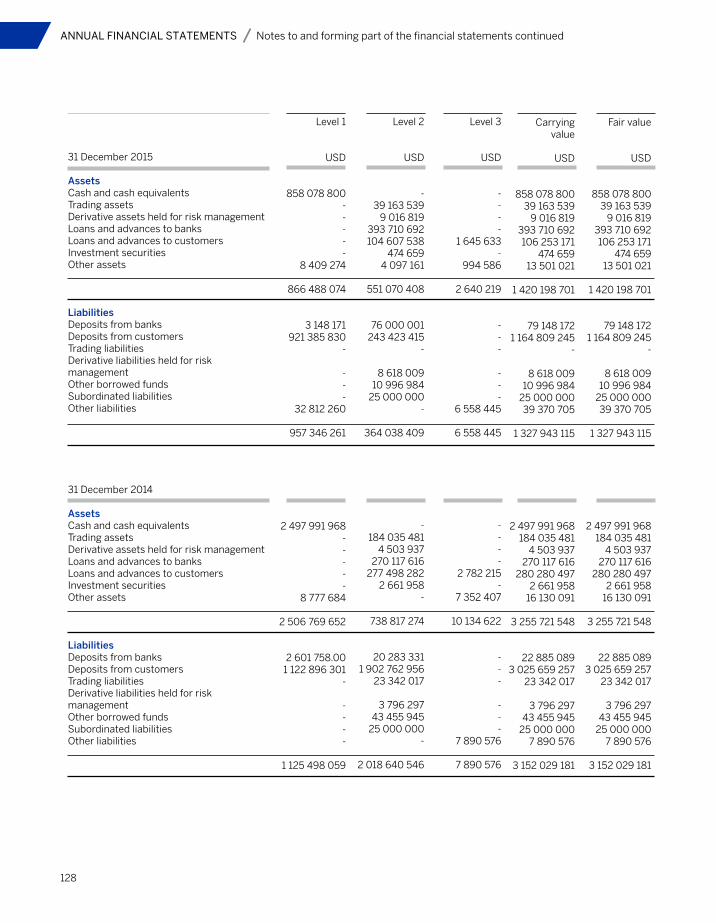
31 December 2015
AssetsCash and cash equivalents Trading assets Derivative assets held for risk managementLoans and advances to banks Loans and advances to customers Investment securities Other assets
LiabilitiesDeposits from banksDeposits from customersTrading liabilities Derivative liabilities held for risk managementOther borrowed fundsSubordinated liabilitiesOther liabilities
128
ANNUAL FINANCIAL STATEMENTS Notes to and forming part of the financial statements continued
Level 1
USD
858 078 800 - - -
--
8 409 274
866 488 074
3 148 171 921 385 830
-
- - -
32 812 260
957 346 261
Level 2
USD
- 39 163 539
9 016 819 393 710 692 104 607 538
474 659 4 097 161
551 070 408
76 000 001 243 423 415
-
8 618 009 10 996 984
25 000 000 -
364 038 409
Level 3
USD
- - - -
1 645 633 -
994 586
2 640 219
- - -
- - -
6 558 445
6 558 445
Carryingvalue
USD
858 078 800 39 163 539
9 016 819 393 710 692 106 253 171
474 659 13 501 021
1 420 198 701
79 148 172 1 164 809 245
-
8 618 009 10 996 984
25 000 000 39 370 705
1 327 943 115
Fair value
USD
858 078 800 39 163 539
9 016 819 393 710 692 106 253 171
474 659 13 501 021
1 420 198 701
79 148 172 1 164 809 245
-
8 618 009 10 996 984
25 000 000 39 370 705
1 327 943 115
31 December 2014
AssetsCash and cash equivalents Trading assets Derivative assets held for risk managementLoans and advances to banks Loans and advances to customers Investment securities Other assets
LiabilitiesDeposits from banksDeposits from customersTrading liabilities Derivative liabilities held for risk managementOther borrowed fundsSubordinated liabilitiesOther liabilities
2 497 991 968 - - -
- -
8 777 684
2 506 769 652
2 601 758.00 1 122 896 301
-
- - --
1 125 498 059
-184 035 481
4 503 937270 117 616
277 498 2822 661 958
-
738 817 274
20 283 3311 902 762 956
23 342 017
3 796 29743 455 945
25 000 000-
2 018 640 546
- - - -
2 782 215-
7 352 407
10 134 622
- - -
- - -
7 890 576
7 890 576
2 497 991 968184 035 481
4 503 937270 117 616
280 280 4972 661 958
16 130 091
3 255 721 548
22 885 0893 025 659 257
23 342 017
3 796 29743 455 945
25 000 0007 890 576
3 152 029 181
2 497 991 968184 035 481
4 503 937270 117 616
280 280 4972 661 958
16 130 091
3 255 721 548
22 885 0893 025 659 257
23 342 017
3 796 29743 455 945
25 000 0007 890 576
3 152 029 181
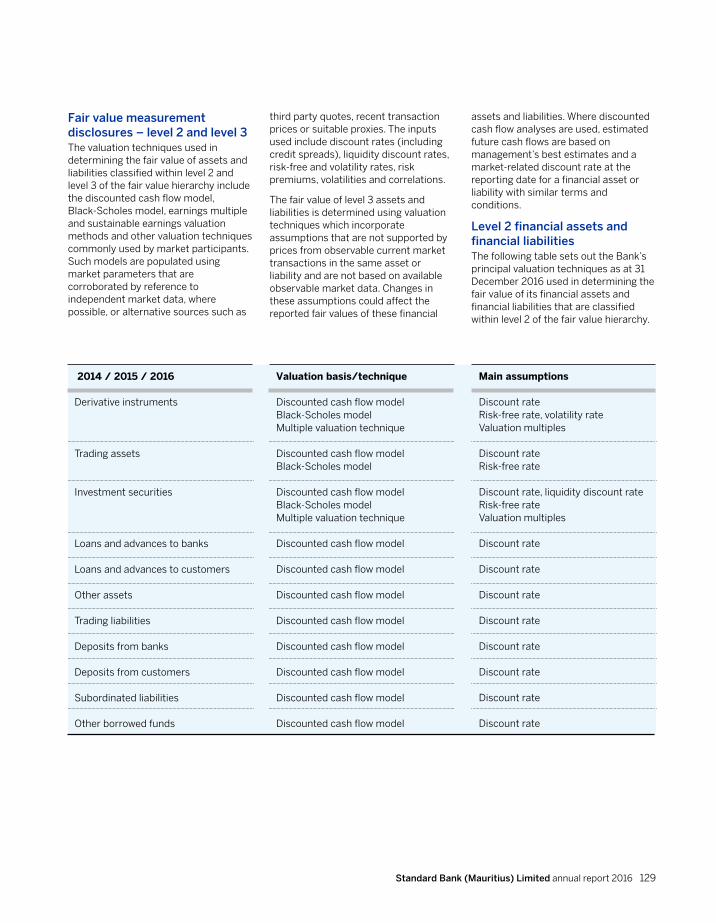
Standard Bank (Mauritius) Limited annual report 2016 129
Fair value measurement disclosures – level 2 and level 3The valuation techniques used in determining the fair value of assets and liabilities classified within level 2 and level 3 of the fair value hierarchy include the discounted cash flow model, Black-Scholes model, earnings multiple and sustainable earnings valuation methods and other valuation techniques commonly used by market participants. Such models are populated using market parameters that are corroborated by reference to independent market data, where possible, or alternative sources such as
third party quotes, recent transaction prices or suitable proxies. The inputs used include discount rates (including credit spreads), liquidity discount rates, risk-free and volatility rates, risk premiums, volatilities and correlations.
The fair value of level 3 assets and liabilities is determined using valuation techniques which incorporate assumptions that are not supported by prices from observable current market transactions in the same asset or liability and are not based on available observable market data. Changes in these assumptions could affect the reported fair values of these financial
assets and liabilities. Where discounted cash flow analyses are used, estimated future cash flows are based on management’s best estimates and a market-related discount rate at the reporting date for a financial asset or liability with similar terms and conditions.
Level 2 financial assets and financial liabilitiesThe following table sets out the Bank’s principal valuation techniques as at 31 December 2016 used in determining the fair value of its financial assets and financial liabilities that are classified within level 2 of the fair value hierarchy.
2014 / 2015 / 2016 Derivative instruments
Trading assets
Investment securities
Loans and advances to banks
Loans and advances to customers
Other assets
Trading liabilities
Deposits from banks
Deposits from customers
Subordinated liabilities
Other borrowed funds
Valuation basis/technique
Discounted cash flow modelBlack-Scholes modelMultiple valuation technique
Discounted cash flow modelBlack-Scholes model
Discounted cash flow modelBlack-Scholes modelMultiple valuation technique
Discounted cash flow model
Discounted cash flow model
Discounted cash flow model
Discounted cash flow model
Discounted cash flow model
Discounted cash flow model
Discounted cash flow model
Discounted cash flow model
Main assumptions
Discount rateRisk-free rate, volatility rateValuation multiples
Discount rateRisk-free rate
Discount rate, liquidity discount rateRisk-free rateValuation multiples Discount rate
Discount rate
Discount rate
Discount rate
Discount rate
Discount rate
Discount rate
Discount rate
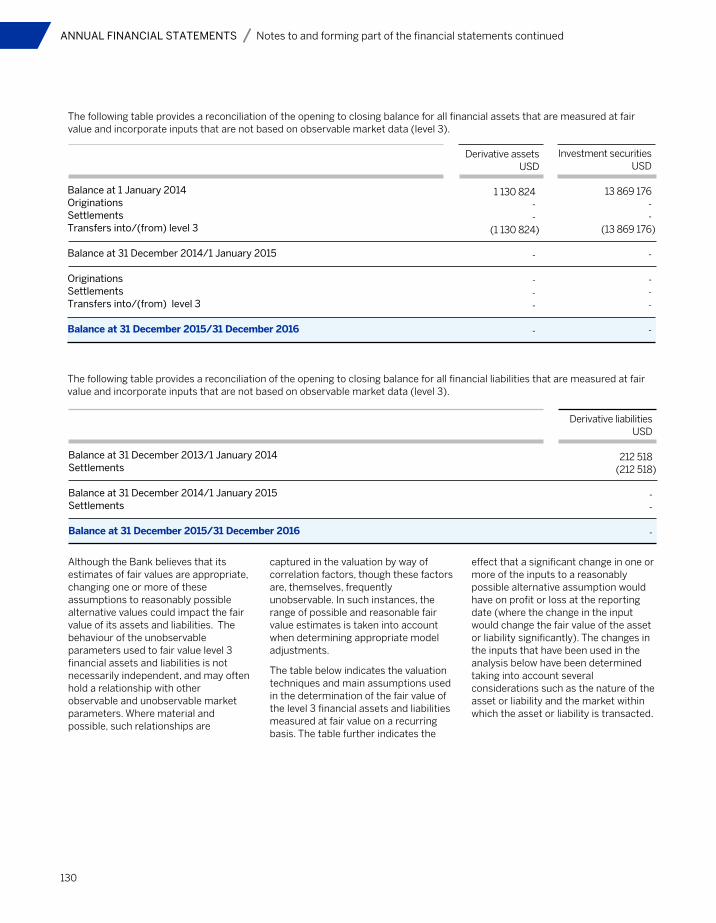
130
ANNUAL FINANCIAL STATEMENTS Notes to and forming part of the financial statements continued
The following table provides a reconciliation of the opening to closing balance for all financial assets that are measured at fair value and incorporate inputs that are not based on observable market data (level 3).
Balance at 1 January 2014OriginationsSettlementsTransfers into/(from) level 3
Balance at 31 December 2014/1 January 2015
OriginationsSettlementsTransfers into/(from) level 3
Balance at 31 December 2015/31 December 2016
Derivative assetsUSD
1 130 824 - -
(1 130 824)
-
- - -
-
Investment securitiesUSD
13 869 176 - -
(13 869 176) -
- - - -
The following table provides a reconciliation of the opening to closing balance for all financial liabilities that are measured at fair value and incorporate inputs that are not based on observable market data (level 3).
Balance at 31 December 2013/1 January 2014Settlements
Balance at 31 December 2014/1 January 2015Settlements
Balance at 31 December 2015/31 December 2016
Derivative liabilitiesUSD
212 518(212 518)
--
-
Although the Bank believes that its estimates of fair values are appropriate, changing one or more of these assumptions to reasonably possible alternative values could impact the fair value of its assets and liabilities. The behaviour of the unobservable parameters used to fair value level 3 financial assets and liabilities is not necessarily independent, and may often hold a relationship with other observable and unobservable market parameters. Where material and possible, such relationships are
captured in the valuation by way of correlation factors, though these factors are, themselves, frequently unobservable. In such instances, the range of possible and reasonable fair value estimates is taken into account when determining appropriate model adjustments.
The table below indicates the valuation techniques and main assumptions used in the determination of the fair value of the level 3 financial assets and liabilities measured at fair value on a recurring basis. The table further indicates the
effect that a significant change in one or more of the inputs to a reasonably possible alternative assumption would have on profit or loss at the reporting date (where the change in the input would change the fair value of the asset or liability significantly). The changes in the inputs that have been used in the analysis below have been determined taking into account several considerations such as the nature of the asset or liability and the market within which the asset or liability is transacted.
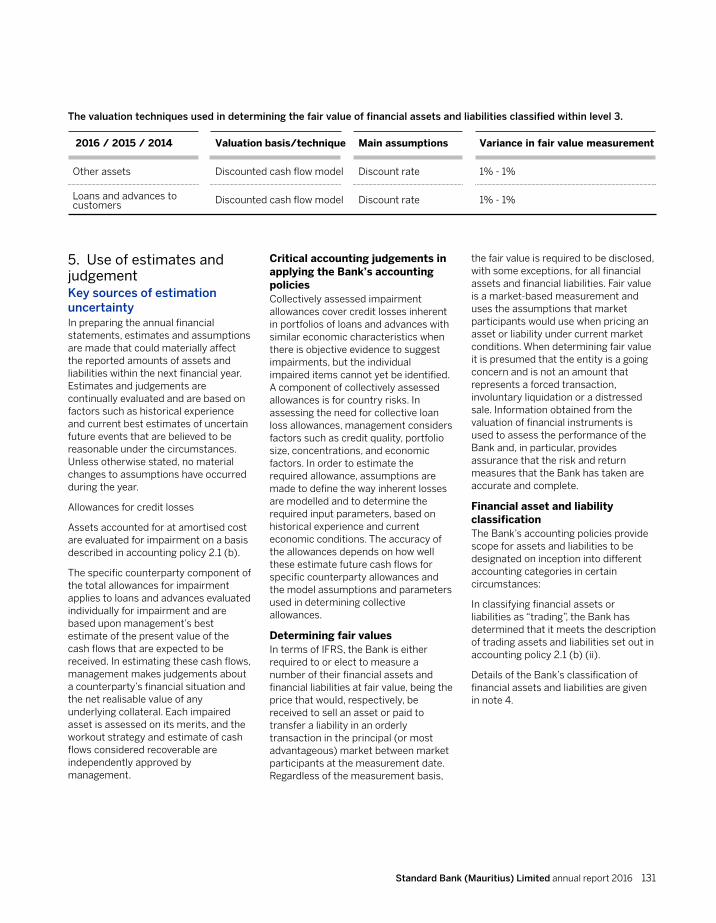
Standard Bank (Mauritius) Limited annual report 2016 131
The valuation techniques used in determining the fair value of financial assets and liabilities classified within level 3.
2016 / 2015 / 2014
Other assets
Loans and advances to customers
Valuation basis/technique
Discounted cash flow model
Discounted cash flow model
Main assumptions
Discount rate
Discount rate
Variance in fair value measurement
1% - 1%
1% - 1%
5. Use of estimates and judgementKey sources of estimation uncertaintyIn preparing the annual financial statements, estimates and assumptions are made that could materially affect the reported amounts of assets and liabilities within the next financial year. Estimates and judgements are continually evaluated and are based on factors such as historical experience and current best estimates of uncertain future events that are believed to be reasonable under the circumstances. Unless otherwise stated, no material changes to assumptions have occurred during the year.
Allowances for credit losses
Assets accounted for at amortised cost are evaluated for impairment on a basis described in accounting policy 2.1 (b).
The specific counterparty component of the total allowances for impairment applies to loans and advances evaluated individually for impairment and are based upon management’s best estimate of the present value of the cash flows that are expected to be received. In estimating these cash flows, management makes judgements about a counterparty’s financial situation and the net realisable value of any underlying collateral. Each impaired asset is assessed on its merits, and the workout strategy and estimate of cash flows considered recoverable are independently approved by management.
Critical accounting judgements in applying the Bank’s accounting policies Collectively assessed impairment allowances cover credit losses inherent in portfolios of loans and advances with similar economic characteristics when there is objective evidence to suggest impairments, but the individual impaired items cannot yet be identified. A component of collectively assessed allowances is for country risks. In assessing the need for collective loan loss allowances, management considers factors such as credit quality, portfolio size, concentrations, and economic factors. In order to estimate the required allowance, assumptions are made to define the way inherent losses are modelled and to determine the required input parameters, based on historical experience and current economic conditions. The accuracy of the allowances depends on how well these estimate future cash flows for specific counterparty allowances and the model assumptions and parameters used in determining collective allowances.
Determining fair valuesIn terms of IFRS, the Bank is either required to or elect to measure a number of their financial assets and financial liabilities at fair value, being the price that would, respectively, be received to sell an asset or paid to transfer a liability in an orderly transaction in the principal (or most advantageous) market between market participants at the measurement date. Regardless of the measurement basis,
the fair value is required to be disclosed, with some exceptions, for all financial assets and financial liabilities. Fair value is a market-based measurement and uses the assumptions that market participants would use when pricing an asset or liability under current market conditions. When determining fair value it is presumed that the entity is a going concern and is not an amount that represents a forced transaction, involuntary liquidation or a distressed sale. Information obtained from the valuation of financial instruments is used to assess the performance of the Bank and, in particular, provides assurance that the risk and return measures that the Bank has taken are accurate and complete.
Financial asset and liability classificationThe Bank’s accounting policies provide scope for assets and liabilities to be designated on inception into different accounting categories in certain circumstances:
In classifying financial assets or liabilities as “trading”, the Bank has determined that it meets the description of trading assets and liabilities set out in accounting policy 2.1 (b) (ii).
Details of the Bank’s classification of financial assets and liabilities are given in note 4.
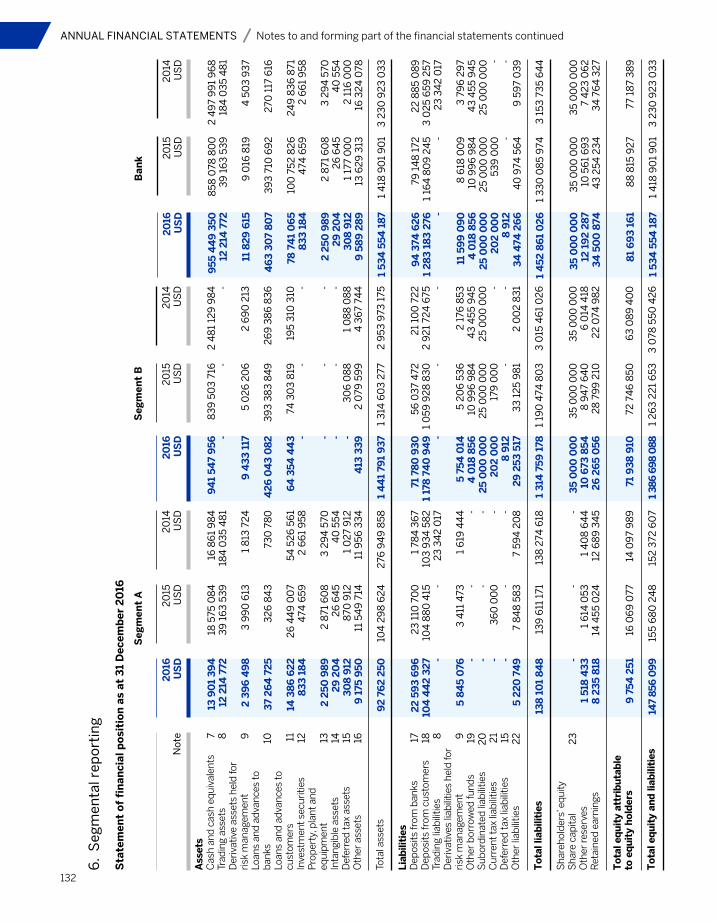
132
ANNUAL FINANCIAL STATEMENTS Notes to and forming part of the financial statements continued
6.
Seg
men
tal r
epo
rtin
g
20
16U
SD
95
5 4
49
35
012
214
772
11 8
29
615
46
3 3
07
80
7
78 7
41
06
58
33
18
4
2 2
50
98
92
9 2
04
30
8 9
129
58
9 2
89
1 5
34
55
4 1
87
94
374
62
6
1 2
83
18
3 2
76
-
11
59
9 0
90
4
018
85
6
25
00
0 0
00
2
02
00
0
8 9
12 3
4 4
74 2
66
1 4
52
86
1 0
26
35
00
0 0
00
12
19
2 2
87
34
50
0 8
74
8
1 6
93
16
1
1 5
34
55
4 1
87
20
15U
SD
858
078
80
03
9 1
63
53
9
9 0
16 8
19
39
3 7
10 6
92
100
752
82
64
74 6
59
2 8
71 6
08
26
64
51
177
00
013
62
9 3
13
1 4
18 9
01
90
1
79
14
8 1
72
1 16
4 8
09
24
5
-
8 6
18 0
09
1
0 9
96
98
4
25
00
0 0
00
5
39
00
0
-
40
974
56
4
1 3
30
08
5 9
74
35
00
0 0
00
10
56
1 6
93
4
3 2
54 2
34
88
815
92
7
1 4
18 9
01
90
1
20
14U
SD
2 4
97
99
1 9
68
18
4 0
35
48
1
4 5
03
93
7
270
117
616
2
49
83
6 8
71
2 6
61
958
3
29
4 5
70
40
554
2
116
00
0
16
32
4 0
78
3 2
30
92
3 0
33
22
88
5 0
89
3
02
5 6
59 2
57
23
34
2 0
17
3 7
96
29
7 4
3 4
55 9
45
2
5 0
00
00
0
-
-
9 5
97
03
9
3 1
53 7
35
64
4
35
00
0 0
00
7
42
3 0
62
3
4 7
64
32
7
77 1
87
38
9 3
23
0 9
23
03
3
Ban
k
20
16U
SD
13 9
01
39
412
214
772
2 3
96
49
8
37
26
4 7
25
14 3
86
62
28
33
18
4
2 2
50
98
92
9 2
04
30
8 9
129
175
95
0
92
76
2 2
50
22
59
3 6
96
104
44
2 3
27 -
5 8
45
076
- - - -5
22
0 7
49
138
10
1 8
48 -
1 5
18 4
33
8 2
35
818
9 7
54
25
1
147
856
09
9
Ass
ets
Cas
h an
d ca
sh e
quiv
alen
ts
Trad
ing
asse
ts
Der
ivat
ive
asse
ts h
eld
for
risk
man
agem
ent
Loan
s an
d ad
vanc
es to
ba
nks
Loan
s an
d ad
vanc
es to
cu
stom
ers
Inve
stm
ent s
ecur
ities
P
rope
rty,
pla
nt a
nd
equi
pmen
tIn
tang
ible
ass
ets
Def
erre
d ta
x as
sets
O
ther
ass
ets
Tota
l ass
ets
Liab
iliti
esD
epos
its fr
om b
anks
D
epos
its fr
om c
usto
mer
s Tr
adin
g lia
bilit
ies
Der
ivat
ives
liab
ilitie
s he
ld fo
r ri
sk m
anag
emen
t O
ther
bor
row
ed fu
nds
Sub
ordi
nate
d lia
bilit
ies
Cur
rent
tax
liabi
litie
s D
efer
red
tax
liabi
litie
sO
ther
liab
ilitie
s
To
tal l
iab
iliti
es
Sha
reho
lder
s’ e
quity
Sha
re c
apita
l O
ther
rese
rves
R
etai
ned
earn
ings
To
tal e
qu
ity
attr
ibu
tab
le
to e
qu
ity
ho
lder
s
To
tal e
qu
ity
and
liab
iliti
es
20
15U
SD
18 5
75 0
84
39
16
3 5
39
3 9
90
613
32
6 8
43
26
44
9 0
07
474
659
2 8
71 6
08
26
64
58
70 9
1211
54
9 7
14
104
29
8 6
24
23
110
70
0
104
88
0 4
15-
3 4
11 4
73
-
-
36
0 0
00
-
7
84
8 5
83
139
611
171
-1
614
053
14 4
55 0
24
16 0
69
077
155
68
0 2
48
20
14U
SD
16
86
1 9
84
18
4 0
35
48
1
1 8
13 7
24
73
0 7
80
54
52
6 5
61
2 6
61
958
3 2
94
570
4
0 5
54
1 0
27
912
1
1 9
56 3
34
276
94
9 8
58
1 78
4 3
67
103
93
4 5
82
23
34
2 0
17
1 6
19 4
44
-
-
-
- 7
59
4 2
08
138
274
618
-1
40
8 6
44
12 6
89
34
5
14 0
97
98
9
152
372
60
7
Sta
tem
ent
of
fin
anci
al p
osi
tio
n a
s at
31
Dec
emb
er 2
016
Seg
men
t A
20
16U
SD
94
1 5
47
95
6 -
9 4
33
117
42
6 0
43
08
2
64
35
4 4
43 -
-
- -
413
33
9
1 4
41
791
93
7
71 7
80
93
01
178
74
0 9
49 -
5 7
54
014
4 0
18 8
56
25
00
0 0
00
20
2 0
00
8 9
122
9 2
53
517
1 3
14 7
59
178
35
00
0 0
00
10 6
73 8
54
26
26
5 0
56
71 9
38
910
1 38
6 6
98
088
20
15U
SD
83
9 5
03
716 -
5 0
26
20
6
39
3 3
83
84
9
74 3
03
819 -
- -
30
6 0
88
2 0
79 5
99
1 3
14 6
03
277
56
03
7 4
72
1 0
59 9
28
83
0 -
5 2
06
53
6
10
99
6 9
84
2
5 0
00
00
0
179
00
0
-
33
12
5 9
81
1 19
0 4
74 8
03
35
00
0 0
00
8 9
47
64
02
8 7
99
210
72 7
46
850
1 2
63
22
1 6
53
20
14U
SD
2 4
81
129
98
4
-
2 6
90
213
26
9 3
86
83
6
19
5 3
10 3
10
- - -
1 0
88
08
8
4 3
67
744
2 9
53 9
73 1
75
21
100
72
2
2 9
21
724
675
-
2 1
76 8
53
43
455
94
5
25
00
0 0
00
-
- 2
00
2 8
31
3 0
15 4
61
02
6
35
00
0 0
00
6 0
14 4
182
2 0
74 9
82
63
08
9 4
00
3 0
78 5
50 4
26
Seg
men
t B
Not
e 7 8 9 10 11 12 13 14 15 16 17 18 8 9 19 20 21 15 22
23
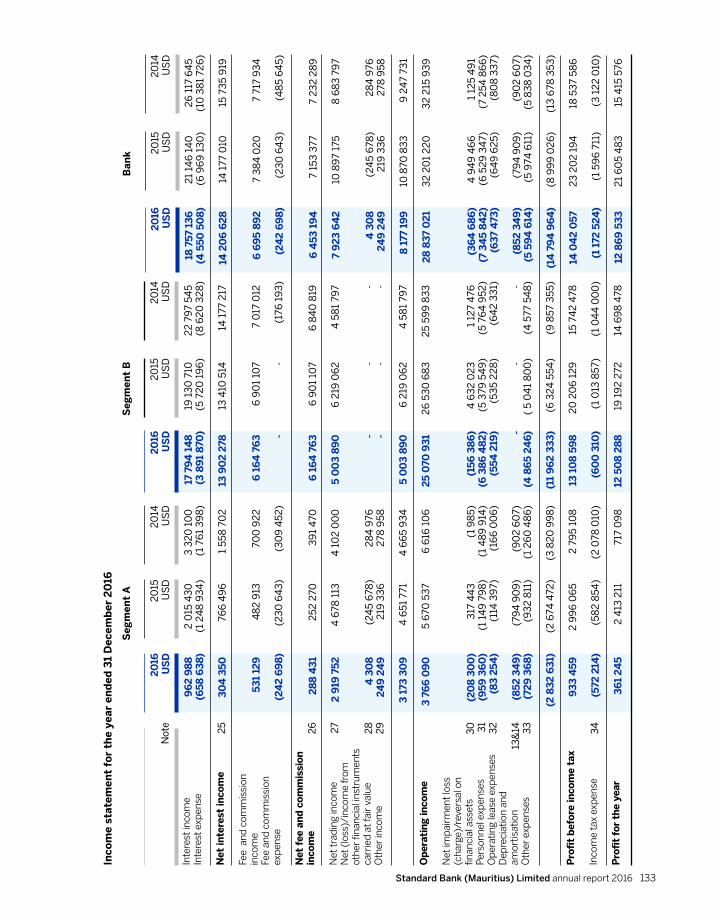
Standard Bank (Mauritius) Limited annual report 2016 133
20
16U
SD
18
75
7 13
6
(4
55
0 5
08
)
14 2
06
62
8
6 6
95
89
2
(24
2 6
98
)
6 4
53
19
4
7 9
23
64
2
4 3
08
24
9 2
49
8 1
77 1
99
28
83
7 0
21
(36
4 6
86
)(7
34
5 8
42
) (6
37
473
)
(85
2 3
49
) (
5 5
94
614
)
(14
79
4 9
64
)
14 0
42
05
7
(1 1
72 5
24
)
12 8
69
53
3
20
15U
SD
21
146
14
0
(6
96
9 1
30
)
14 1
77 0
10
7 3
84
02
0
(2
30
64
3)
7 15
3 3
77
10
89
7 17
5
(2
45
678
) 2
19 3
36
10 8
70 8
33
32
20
1 2
20
4 9
49
46
6(6
52
9 3
47)
(6
49
62
5)
(79
4 9
09
) (
5 9
74 6
11)
(8 9
99
02
6)
23
20
2 1
94
(1 5
96
711
)
21
60
5 4
83
20
14U
SD
2
6 1
17 6
45
(
10 3
81
726
)
1
5 73
5 9
19
7 7
17 9
34
(4
85
64
5)
7 2
32
28
9
8 6
83
79
7
28
4 9
76
278
958
9 2
47
731
32
215
93
9 1
125
49
1 (
7 2
54 8
66
) (
80
8 3
37)
(90
2 6
07)
(5
83
8 0
34
)
(13
678
353
)
18 5
37
586
(3 1
22
010
)
15 4
15 5
76
Ban
k
20
16U
SD
96
2 9
88
(
65
8 6
38
) 3
04
35
0
53
1 12
9
(24
2 6
98
)
28
8 4
31
2 9
19 7
52
4 3
08
24
9 2
49
3 1
73 3
09
3
76
6 0
90
(20
8 3
00
) (
95
9 3
60
) (8
3 2
54
)
(85
2 3
49
) (7
29
36
8)
(2
83
2 6
31)
93
3 4
59
(572
214
)
36
1 2
45
Inte
rest
inco
me
Inte
rest
exp
ense
Net
inte
rest
inco
me
Fee
and
com
mis
sion
in
com
e Fe
e an
d co
mm
issi
on
expe
nse
Net
fee
an
d c
om
mis
sio
n
inco
me
Net
trad
ing
inco
me
Net
(lo
ss)/
inco
me
from
ot
her
finan
cial
inst
rum
ents
ca
rrie
d at
fair
val
ue
Oth
er in
com
e
Op
erat
ing
inco
me
Net
impa
irm
ent l
oss
(cha
rge)
/rev
ersa
l on
fin
anci
al a
sset
s Pe
rson
nel e
xpen
ses
Ope
ratin
g le
ase
expe
nses
D
epre
ciat
ion
and
am
ortis
atio
n
Oth
er e
xpen
ses
Pro
fit
bef
ore
inco
me
tax
Inco
me
tax
expe
nse
Pro
fit
for
the
year
20
15U
SD
2 0
15 4
30
(
1 2
48
93
4)
766
49
6
48
2 9
13
(2
30
64
3)
252
270
4 6
78 1
13
(24
5 6
78)
219
33
6
4 6
51 7
71
5 6
70 5
37
317
44
3 (
1 14
9 7
98
) (1
14 3
97)
(79
4 9
09
) (9
32
811
)
(2
674
472
)
2 9
96
06
5
(58
2 8
54)
2 4
13 2
11
20
14U
SD
3 3
20
10
0(1
76
1 3
98
)
1 55
8 7
02
700
92
2
(3
09
452
)
39
1 4
70
4 1
02
00
0
28
4 9
76
278
958
4 6
65
93
4
6 6
16 1
06
(1 9
85)
(1
48
9 9
14)
(16
6 0
06
)
(90
2 6
07)
(1
26
0 4
86
)
(3
82
0 9
98
)
2 7
95
108
(2 0
78 0
10)
717
09
8
Inco
me
stat
emen
t fo
r th
e ye
ar e
nd
ed 3
1 D
ecem
ber
20
16
Seg
men
t A
20
16U
SD
17
794
14
8
(3
89
1 8
70)
1
3 9
02
278
6 1
64
76
3
-
6 1
64
76
3
5 0
03
89
0 - -
5 0
03
89
0
2
5 0
70 9
31
(15
6 3
86
)(6
38
6 4
82
) (5
54
219
) -
(4 8
65
24
6)
(1
1 9
62
33
3)
13
10
8 5
98
(60
0 3
10)
12
50
8 2
88
20
15U
SD
19
13
0 7
10
(5
720
19
6)
1
3 4
10 5
14
6 9
01
107 -
6 9
01
107
6 2
19 0
62 - -
6 2
19 0
62
2
6 5
30
68
3 4
63
2 0
23
(5 3
79 5
49
) (5
35
22
8)
-
( 5
04
1 8
00
)
(6
32
4 5
54)
20
20
6 1
29
(1 0
13 8
57)
19
19
2 2
72
20
14U
SD
2
2 7
97
545
(8
62
0 3
28
)
14
177
217
7 0
17 0
12
(1
76 1
93
)
6 8
40
819
4 5
81
797 - -
4 5
81
797
2
5 59
9 8
33
1 12
7 4
76
(5 7
64
952
) (6
42
33
1)
-
(4 5
77 5
48
)
(9
857
355
)
15
742
478
(1 0
44
00
0)
14
69
8 4
78
Seg
men
t B
Not
e
25 26 27 28 29 30 31 32
13&
14 33 34
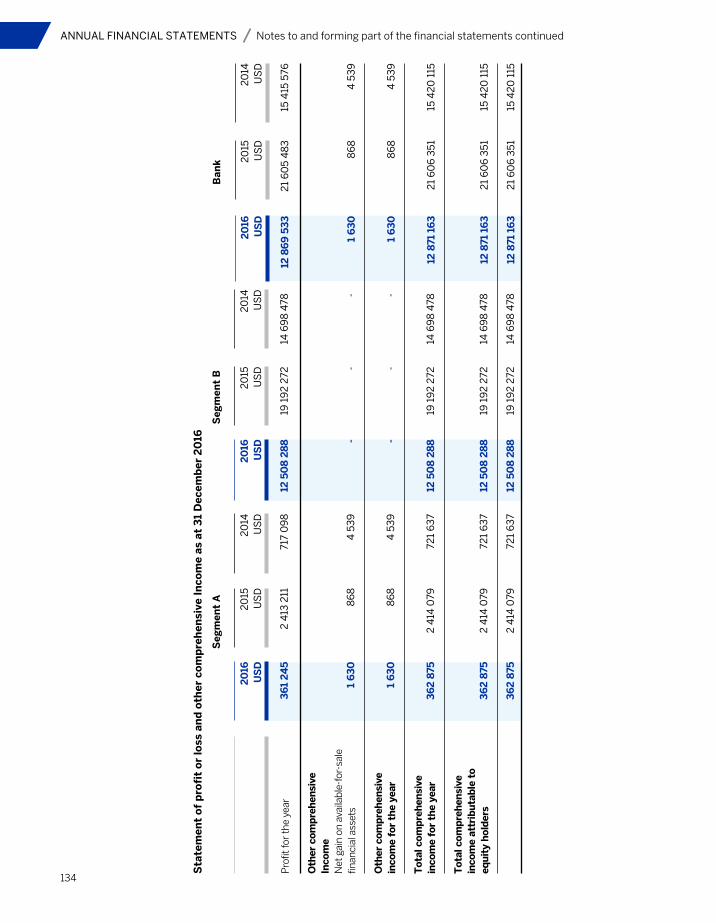
134
ANNUAL FINANCIAL STATEMENTS Notes to and forming part of the financial statements continued
20
16U
SD
12 8
69
53
3
1 6
30
1 6
30
12 8
71 1
63
12 8
71 1
63
12 8
71 1
63
20
15U
SD
21
60
5 4
83
86
8
86
8
21
60
6 3
51
21
60
6 3
51
21
60
6 3
51
20
14U
SD
15 4
15 5
76
4 5
39
4 5
39
15 4
20
115
15 4
20
115
15 4
20
115
Ban
k
20
16U
SD
36
1 2
45
1 6
30
1 6
30
36
2 8
75
36
2 8
75
36
2 8
75
Pro
fit fo
r th
e ye
ar
Oth
er c
om
pre
hen
sive
In
com
eN
et g
ain
on a
vaila
ble-
for-
sale
fin
anci
al a
sset
s
Oth
er c
om
pre
hen
sive
in
com
e fo
r th
e ye
ar
To
tal c
om
pre
hen
sive
in
com
e fo
r th
e ye
ar
To
tal c
om
pre
hen
sive
in
com
e at
trib
uta
ble
to
eq
uit
y h
old
ers
20
15U
SD
2 4
13 2
11
86
8
86
8
2 4
14 0
79
2 4
14 0
79
2 4
14 0
79
20
14U
SD
717
09
8
4 5
39
4 5
39
721
63
7
721
63
7
721
63
7
Sta
tem
ent
of
pro
fit
or
loss
an
d o
ther
co
mp
reh
ensi
ve I
nco
me
as a
t 3
1 D
ecem
ber
20
16
Seg
men
t A
20
16U
SD
12 5
08
28
8 - -
12 5
08
28
8
12 5
08
28
8
12 5
08
28
8
20
15U
SD
19 1
92
272
- -
19 1
92
272
19 1
92
272
19 1
92
272
20
14U
SD
14 6
98
478
- -
14 6
98
478
14 6
98
478
14 6
98
478
Seg
men
t B
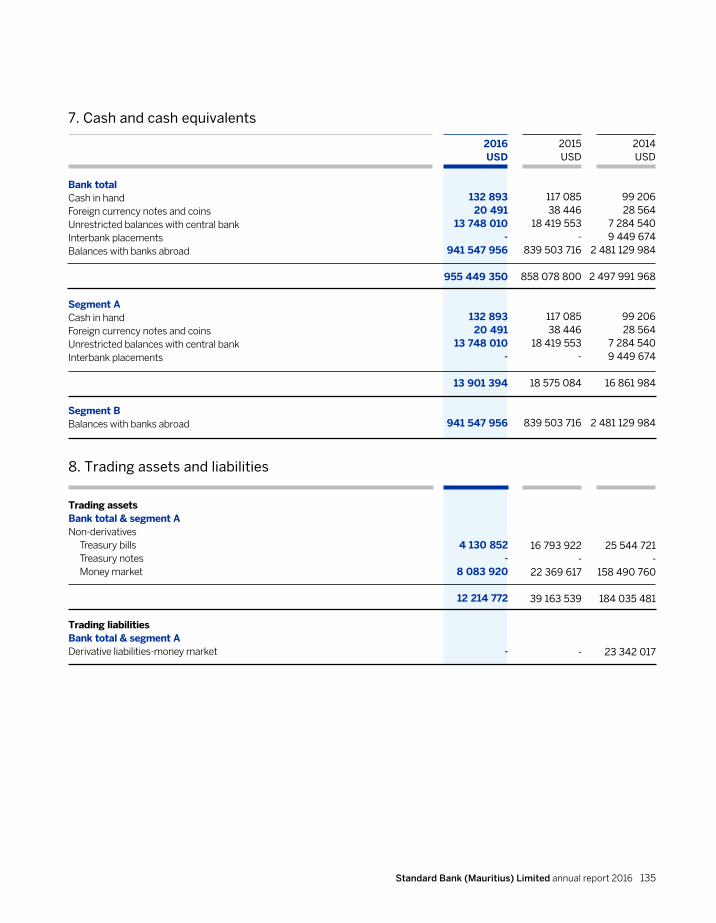
Standard Bank (Mauritius) Limited annual report 2016 135
2016USD
132 89320 491
13 748 010-
941 547 956
955 449 350
132 89320 491
13 748 010-
13 901 394
941 547 956
Bank totalCash in handForeign currency notes and coinsUnrestricted balances with central bank Interbank placementsBalances with banks abroad
Segment ACash in handForeign currency notes and coinsUnrestricted balances with central bank Interbank placements
Segment BBalances with banks abroad
2015USD
117 08538 446
18 419 553-
839 503 716
858 078 800
117 08538 446
18 419 553-
18 575 084
839 503 716
2014USD
99 20628 564
7 284 5409 449 674
2 481 129 984
2 497 991 968
99 20628 564
7 284 5409 449 674
16 861 984
2 481 129 984
7. Cash and cash equivalents
4 130 852-
8 083 920
12 214 772
-
Trading assets Bank total & segment ANon-derivatives Treasury bills Treasury notes Money market
Trading liabilities Bank total & segment A Derivative liabilities-money market
16 793 922-
22 369 617
39 163 539
-
25 544 721-
158 490 760
184 035 481
23 342 017
8. Trading assets and liabilities
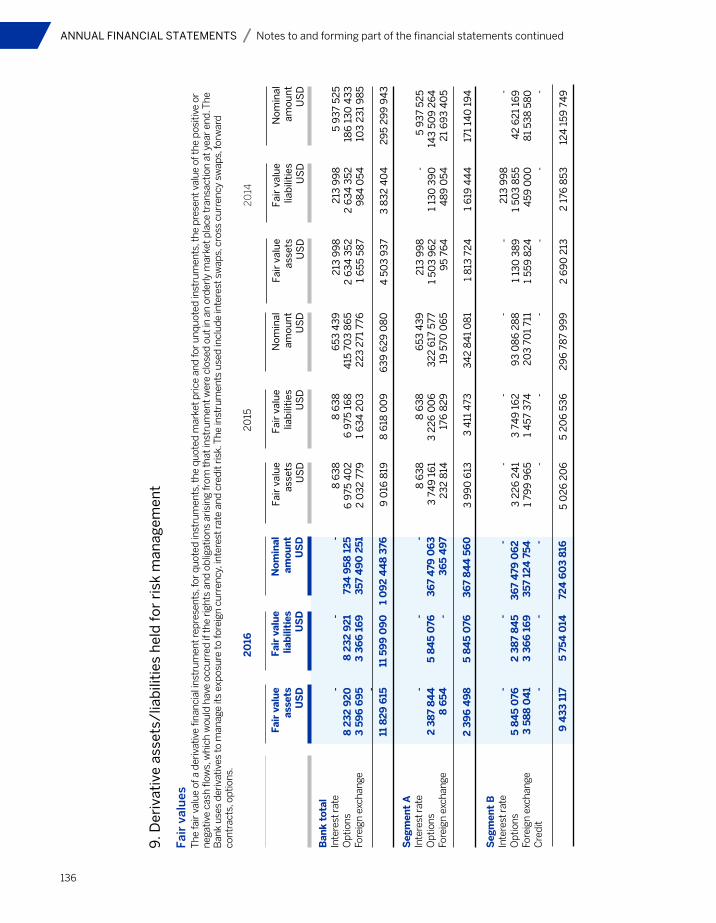
136
ANNUAL FINANCIAL STATEMENTS Notes to and forming part of the financial statements continued
Fair
val
ueas
sets
US
D 2
13 9
98
2 6
34
352
1 6
55 5
87
4 5
03
93
7
2
13 9
98
1
503
96
2
95
764
1 8
13 7
24 -
1 13
0 3
89
1
559
82
4 -
2 6
90
213
Fair
val
uelia
bili
ties
US
D 2
13 9
98
2 6
34
352
98
4 0
54
3 8
32
40
4 -1
130
39
0
48
9 0
54
1 6
19 4
44
213
99
81
503
855
459
00
0 -
2
176
853
Nom
inal
amou
ntU
SD
5 9
37
525
186
13
0 4
33
103
23
1 9
85
29
5 2
99
94
3
5 9
37
525
143
50
9 2
64
21
69
3 4
05
171
140
19
4 -4
2 6
21
169
81
538
58
0 -
124
159
74
9
20
14
Fair
val
ue
asse
tsU
SD -
8 2
32
92
0
3 5
96
69
5 -
11 8
29
615 -
2
38
7 8
44
8
65
4
2 3
96
49
8 -
5 8
45
076
3
58
8 0
41 -
9 4
33
117
Ban
k to
tal
Inte
rest
rate
Opt
ions
Fore
ign
exch
ange
Seg
men
t A
Inte
rest
rate
Opt
ions
Fore
ign
exch
ange
Seg
men
t B
Inte
rest
rate
Opt
ions
Fore
ign
exch
ange
Cre
dit
Fair
val
ue
liab
iliti
esU
SD -
8 2
32
92
1 3
36
6 1
69
11 5
99
09
0
-
5 8
45
076
-
5 8
45
076
- 2
38
7 8
45
3
36
6 1
69
-
5
75
4 0
14
No
min
alam
ou
nt
US
D -73
4 9
58
12
53
57
49
0 2
51
1 0
92
44
8 3
76
-3
67
479
06
33
65
49
7
36
7 8
44
56
0 -3
67
479
06
23
57
124
75
4 -
724
60
3 8
16
Fair
val
ues
The
fair
val
ue o
f a d
eriv
ativ
e fin
anci
al in
stru
men
t rep
rese
nts,
for
quot
ed in
stru
men
ts, t
he q
uote
d m
arke
t pri
ce a
nd fo
r un
quot
ed in
stru
men
ts, t
he p
rese
nt v
alue
of t
he p
ositi
ve o
r ne
gativ
e ca
sh fl
ows,
whi
ch w
ould
hav
e oc
curr
ed if
the
righ
ts a
nd o
blig
atio
ns a
risi
ng fr
om th
at in
stru
men
t wer
e cl
osed
out
in a
n or
derl
y m
arke
t pla
ce tr
ansa
ctio
n at
yea
r en
d. T
he
Ban
k us
es d
eriv
ativ
es to
man
age
its e
xpos
ure
to fo
reig
n cu
rren
cy, i
nter
est r
ate
and
cred
it ri
sk. T
he in
stru
men
ts u
sed
incl
ude
inte
rest
sw
aps,
cro
ss c
urre
ncy
swap
s, fo
rwar
d
cont
ract
s, o
ptio
ns.
20
16
Fair
val
ueas
sets
US
D 8
63
8
6 9
75 4
02
2
03
2 7
79
9 0
16 8
19
8 6
38
3
74
9 1
61
23
2 8
14
3 9
90
613
- 3
22
6 2
41
1 7
99
96
5
-
5 0
26
20
6
Fair
val
uelia
bili
ties
US
D 8
63
8
6 9
75 1
68
1
63
4 2
03
8 6
18 0
09
8 6
38
3
22
6 0
06
1
76 8
29
3 4
11 4
73
- 3
74
9 1
62
1
457
374
-
5
20
6 5
36
Nom
inal
amou
ntU
SD
653
43
94
15 7
03
86
52
23
271
776
63
9 6
29
08
0
653
43
93
22
617
577
19 5
70 0
65
34
2 8
41
08
1 -9
3 0
86
28
82
03
70
1 71
1 -
29
6 7
87
99
9
20
15
9. D
eriv
ativ
e as
sets
/lia
bili
ties
hel
d f
or
risk
man
agem
ent
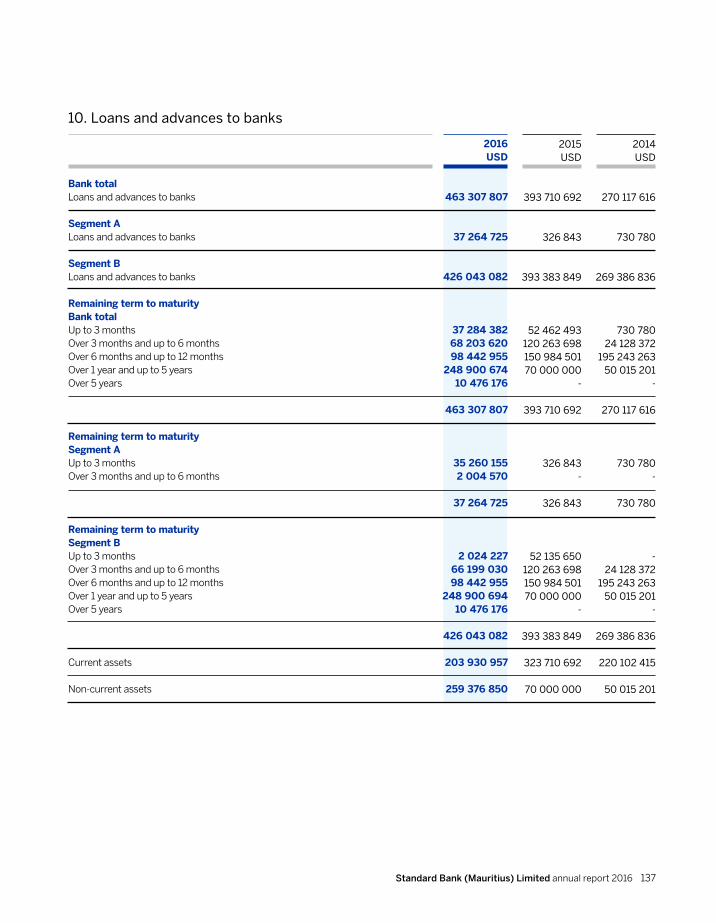
Standard Bank (Mauritius) Limited annual report 2016 137
2016USD
463 307 807
37 264 725
426 043 082
37 284 382 68 203 620 98 442 955
248 900 674 10 476 176
463 307 807
35 260 1552 004 570
37 264 725
2 024 227 66 199 030 98 442 955
248 900 694 10 476 176
426 043 082
203 930 957
259 376 850
Bank totalLoans and advances to banks
Segment ALoans and advances to banks
Segment BLoans and advances to banks
Remaining term to maturity Bank totalUp to 3 monthsOver 3 months and up to 6 monthsOver 6 months and up to 12 monthsOver 1 year and up to 5 yearsOver 5 years
Remaining term to maturitySegment AUp to 3 months Over 3 months and up to 6 months
Remaining term to maturity Segment BUp to 3 monthsOver 3 months and up to 6 monthsOver 6 months and up to 12 monthsOver 1 year and up to 5 yearsOver 5 years
Current assets
Non-current assets
2015USD
393 710 692
326 843
393 383 849
52 462 493 120 263 698 150 984 501 70 000 000
-
393 710 692
326 843-
326 843
52 135 650 120 263 698 150 984 501 70 000 000
-
393 383 849
323 710 692
70 000 000
2014USD
270 117 616
730 780
269 386 836
730 78024 128 372
195 243 26350 015 201
-
270 117 616
730 780-
730 780
-24 128 372
195 243 26350 015 201
-
269 386 836
220 102 415
50 015 201
10. Loans and advances to banks
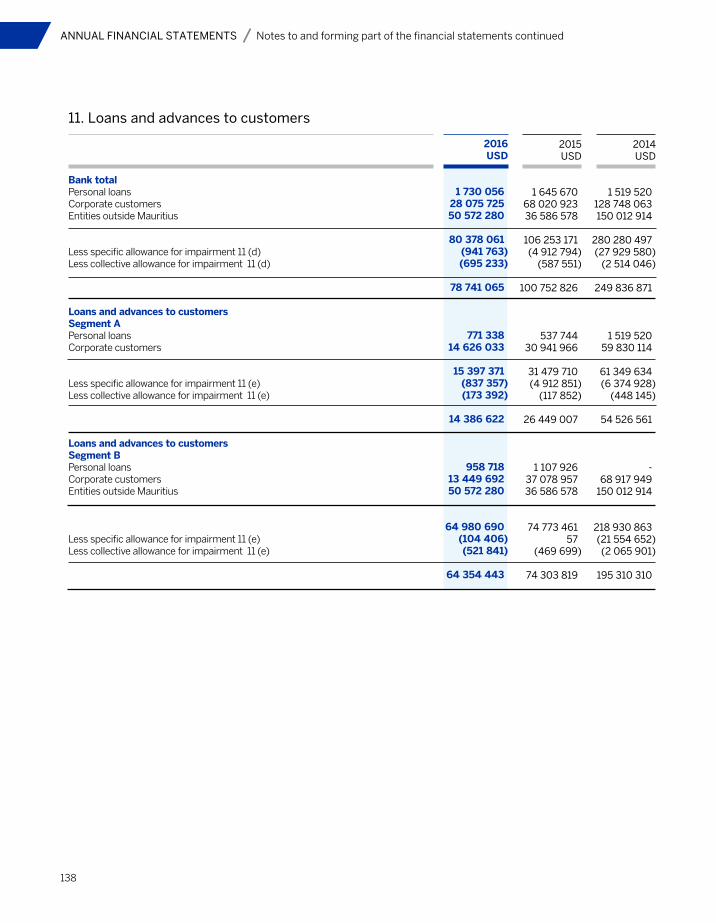
138
ANNUAL FINANCIAL STATEMENTS Notes to and forming part of the financial statements continued
2016USD
1 730 05628 075 72550 572 280
80 378 061(941 763)(695 233)
78 741 065
771 33814 626 033
15 397 371(837 357)(173 392)
14 386 622
958 71813 449 69250 572 280
64 980 690
(104 406)(521 841)
64 354 443
Bank totalPersonal loansCorporate customersEntities outside Mauritius
Less specific allowance for impairment 11 (d)Less collective allowance for impairment 11 (d)
Loans and advances to customersSegment APersonal loansCorporate customers
Less specific allowance for impairment 11 (e)Less collective allowance for impairment 11 (e)
Loans and advances to customersSegment BPersonal loansCorporate customersEntities outside Mauritius
Less specific allowance for impairment 11 (e)Less collective allowance for impairment 11 (e)
2015USD
1 645 67068 020 92336 586 578
106 253 171(4 912 794)
(587 551)
100 752 826
537 74430 941 966
31 479 710(4 912 851)
(117 852)
26 449 007
1 107 92637 078 95736 586 578
74 773 46157
(469 699)
74 303 819
2014USD
1 519 520 128 748 063 150 012 914
280 280 497(27 929 580)
(2 514 046)
249 836 871
1 519 520 59 830 114
61 349 634 (6 374 928) (448 145)
54 526 561
-68 917 949
150 012 914
218 930 863(21 554 652)(2 065 901)
195 310 310
11. Loans and advances to customers
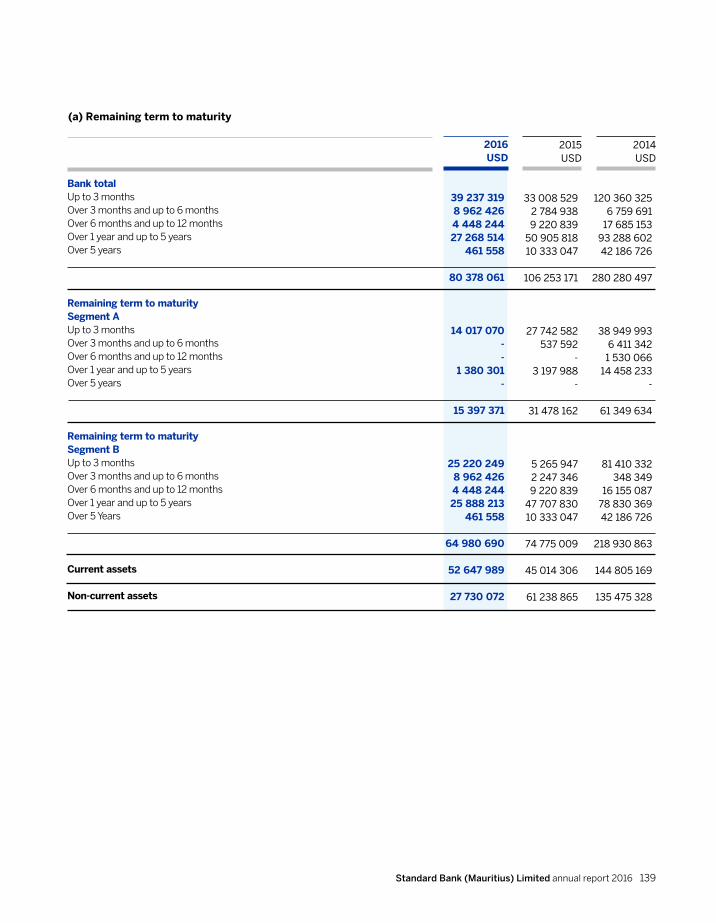
Standard Bank (Mauritius) Limited annual report 2016 139
2016USD
39 237 3198 962 4264 448 24427 268 514
461 558
80 378 061
14 017 070-
- 1 380 301
-
15 397 371
25 220 2498 962 4264 448 24425 888 213
461 558
64 980 690
52 647 989
27 730 072
2015USD
33 008 5292 784 9389 220 839
50 905 81810 333 047
106 253 171
27 742 582537 592
- 3 197 988
-
31 478 162
5 265 9472 247 3469 220 839
47 707 83010 333 047
74 775 009
45 014 306
61 238 865
2014USD
120 360 325 6 759 691
17 685 153 93 288 602 42 186 726
280 280 497
38 949 993 6 411 342
1 530 066 14 458 233
-
61 349 634
81 410 332 348 349
16 155 087 78 830 369 42 186 726
218 930 863
144 805 169
135 475 328
Bank totalUp to 3 monthsOver 3 months and up to 6 monthsOver 6 months and up to 12 monthsOver 1 year and up to 5 yearsOver 5 years
Remaining term to maturity Segment AUp to 3 monthsOver 3 months and up to 6 monthsOver 6 months and up to 12 monthsOver 1 year and up to 5 yearsOver 5 years
Remaining term to maturitySegment BUp to 3 monthsOver 3 months and up to 6 monthsOver 6 months and up to 12 monthsOver 1 year and up to 5 yearsOver 5 Years
Current assets
Non-current assets
(a) Remaining term to maturity
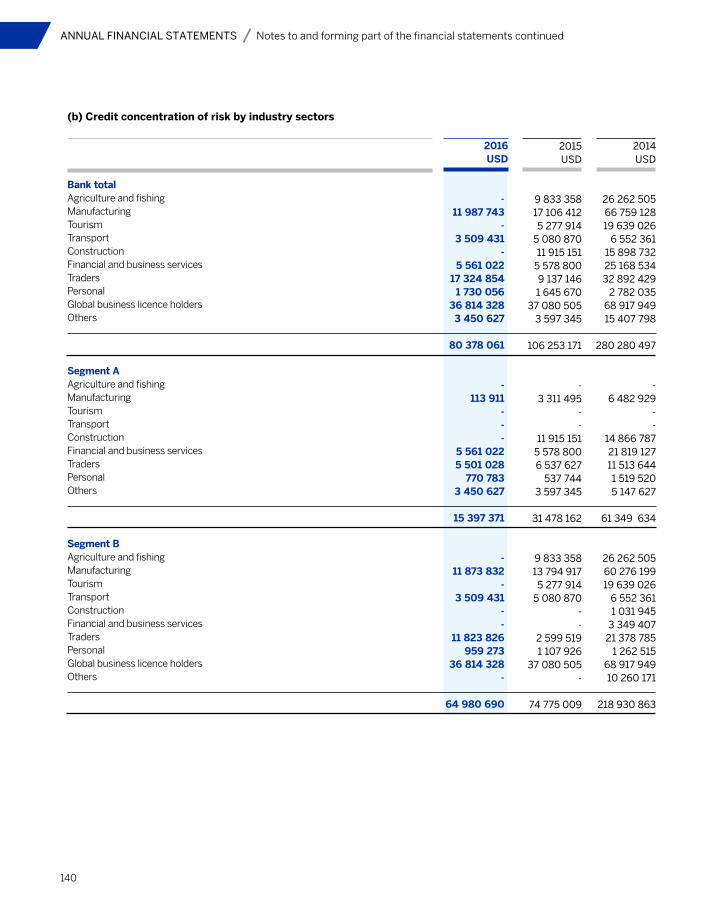
140
ANNUAL FINANCIAL STATEMENTS Notes to and forming part of the financial statements continued
2016USD
-11 987 743
-3 509 431
-5 561 022
17 324 8541 730 056
36 814 3283 450 627
80 378 061
- 113 911
- - -
5 561 0225 501 028
770 7833 450 627
15 397 371
-11 873 832
-3 509 431
--
11 823 826959 273
36 814 328-
64 980 690
2015USD
9 833 35817 106 4125 277 914
5 080 87011 915 151
5 578 8009 137 1461 645 670
37 080 5053 597 345
106 253 171
- 3 311 495
- -
11 915 1515 578 8006 537 627
537 7443 597 345
31 478 162
9 833 35813 794 917
5 277 9145 080 870
- -
2 599 5191 107 926
37 080 505 -
74 775 009
2014USD
26 262 505 66 759 128 19 639 026
6 552 361 15 898 732 25 168 534 32 892 429
2 782 035 68 917 949 15 407 798
280 280 497
- 6 482 929
- -
14 866 787 21 819 127 11 513 644
1 519 5205 147 627
61 349 634
26 262 505 60 276 199 19 639 026
6 552 361 1 031 945
3 349 407 21 378 785
1 262 515 68 917 949 10 260 171
218 930 863
Bank totalAgriculture and fishingManufacturingTourismTransportConstructionFinancial and business servicesTradersPersonalGlobal business licence holdersOthers
Segment AAgriculture and fishingManufacturingTourismTransportConstructionFinancial and business servicesTradersPersonalOthers
Segment BAgriculture and fishingManufacturingTourismTransportConstructionFinancial and business servicesTradersPersonalGlobal business licence holdersOthers
(b) Credit concentration of risk by industry sectors
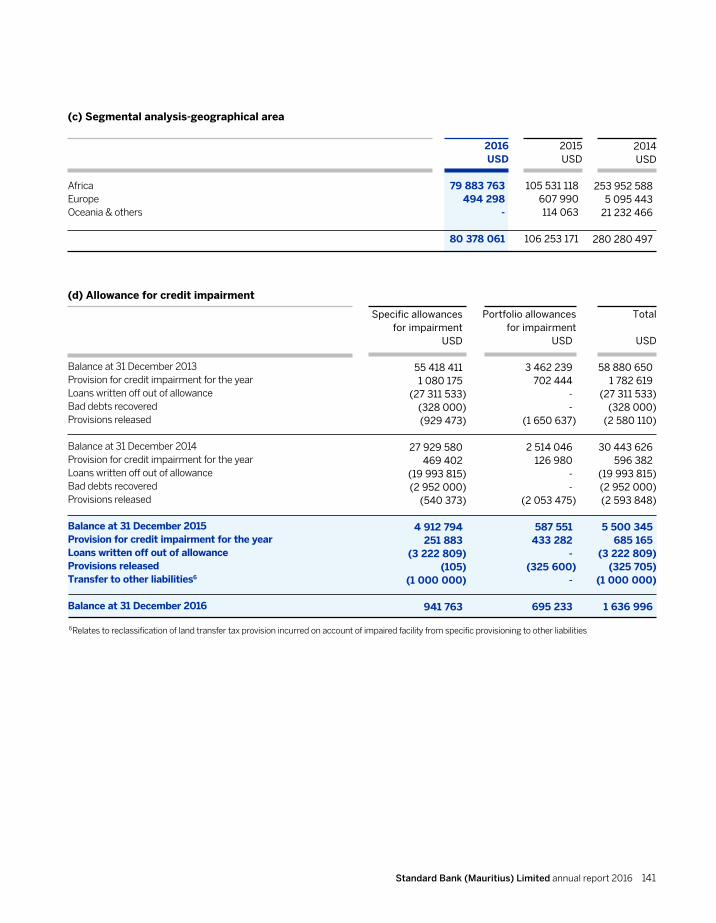
Standard Bank (Mauritius) Limited annual report 2016 141
2016USD
79 883 763494 298
-
80 378 061
2015USD
105 531 118607 990114 063
106 253 171
2014USD
253 952 588 5 095 443
21 232 466
280 280 497
(c) Segmental analysis-geographical area
AfricaEuropeOceania & others
Specific allowances for impairment
USD
55 418 411 1 080 175
(27 311 533)(328 000)
(929 473)
27 929 580 469 402
(19 993 815)(2 952 000)
(540 373)
4 912 794 251 883
(3 222 809) (105)
(1 000 000)
941 763
Portfolio allowancesfor impairment
USD
3 462 239702 444
--
(1 650 637)
2 514 046 126 980
- -
(2 053 475)
587 551 433 282
- (325 600)
-
695 233
Total
USD
58 880 6501 782 619
(27 311 533)(328 000)
(2 580 110)
30 443 626 596 382
(19 993 815) (2 952 000) (2 593 848)
5 500 345 685 165
(3 222 809) (325 705)
(1 000 000)
1 636 996
(d) Allowance for credit impairment
Balance at 31 December 2013Provision for credit impairment for the yearLoans written off out of allowanceBad debts recoveredProvisions released
Balance at 31 December 2014Provision for credit impairment for the yearLoans written off out of allowanceBad debts recoveredProvisions released
Balance at 31 December 2015Provision for credit impairment for the yearLoans written off out of allowanceProvisions releasedTransfer to other liabilities6
Balance at 31 December 2016
6Relates to reclassification of land transfer tax provision incurred on account of impaired facility from specific provisioning to other liabilities
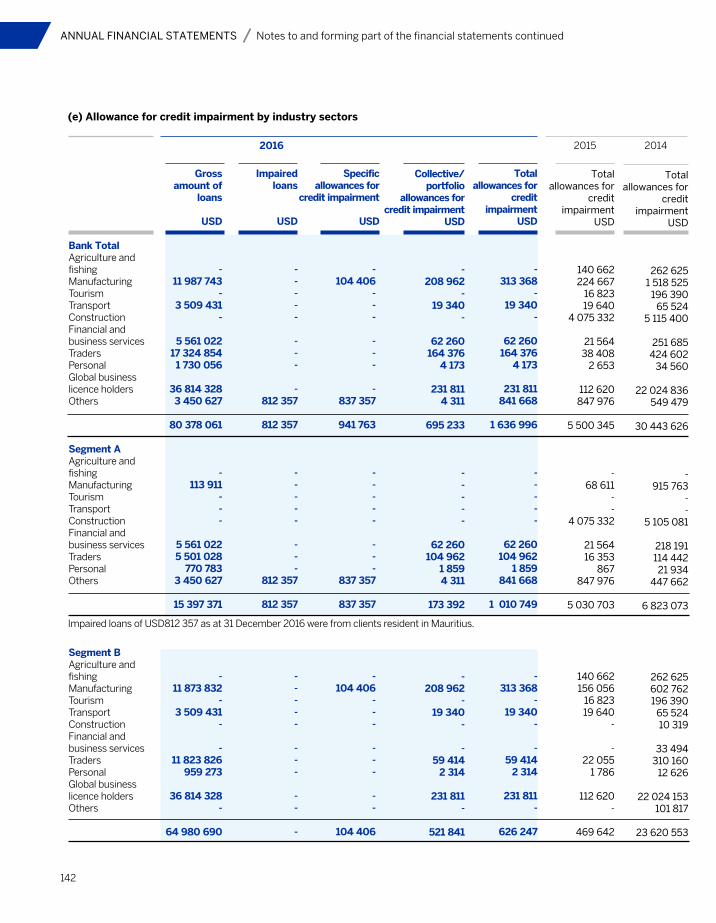
142
ANNUAL FINANCIAL STATEMENTS Notes to and forming part of the financial statements continued
Totalallowances for
credit impairment
USD
262 6251 518 525
196 39065 524
5 115 400
251 685424 602
34 560
22 024 836549 479
30 443 626
-915 763
--
5 105 081
218 191114 44221 934
447 662
6 823 073
262 625 602 762 196 390
65 524 10 319
33 494 310 160
12 626
22 024 153 101 817
23 620 553
Grossamount of
loans
USD
-
11 987 743-
3 509 431-
5 561 02217 324 8541 730 056
36 814 3283 450 627
80 378 061
- 113 911
- - -
5 561 0225 501 028
770 7833 450 627
15 397 371
-11 873 832
-3 509 431
-
-11 823 826
959 273
36 814 328-
64 980 690
Bank TotalAgriculture and fishingManufacturingTourismTransportConstructionFinancial and business servicesTradersPersonalGlobal business licence holdersOthers
Segment AAgriculture and fishingManufacturingTourismTransportConstructionFinancial and business servicesTradersPersonalOthers
Segment BAgriculture and fishingManufacturingTourismTransportConstructionFinancial and business servicesTradersPersonalGlobal business licence holdersOthers
Impairedloans
USD
-----
---
-812 357
812 357
- -
---
---
812 357
812 357
-----
---
--
-
2016
Collective/ portfolio
allowances for credit impairment
USD
-208 962
-19 340
-
62 260164 376
4 173
231 8114 311
695 233
- -
- - -
62 260104 962
1 8594 311
173 392
-208 962
-19 340
-
-59 414
2 314
231 811-
521 841
Totalallowances for
credit impairment
USD
-313 368
-19 340
-
62 260164 376
4 173
231 811841 668
1 636 996
- -
- - -
62 260104 962
1 859841 668
1 010 749
-313 368
-19 340
-
-59 414
2 314
231 811-
626 247
Totalallowances for
credit impairment
USD
140 662224 667
16 82319 640
4 075 332
21 56438 408
2 653
112 620847 976
5 500 345
-68 611
- -
4 075 332
21 56416 353
867847 976
5 030 703
140 662156 056
16 82319 640
-
-22 055
1 786
112 620-
469 642
2015 2014
(e) Allowance for credit impairment by industry sectors
Specific allowances for
credit impairment
USD
-104 406
---
---
-837 357
941 763
- -
---
---
837 357
837 357
-104 406
---
---
--
104 406
Impaired loans of USD812 357 as at 31 December 2016 were from clients resident in Mauritius.
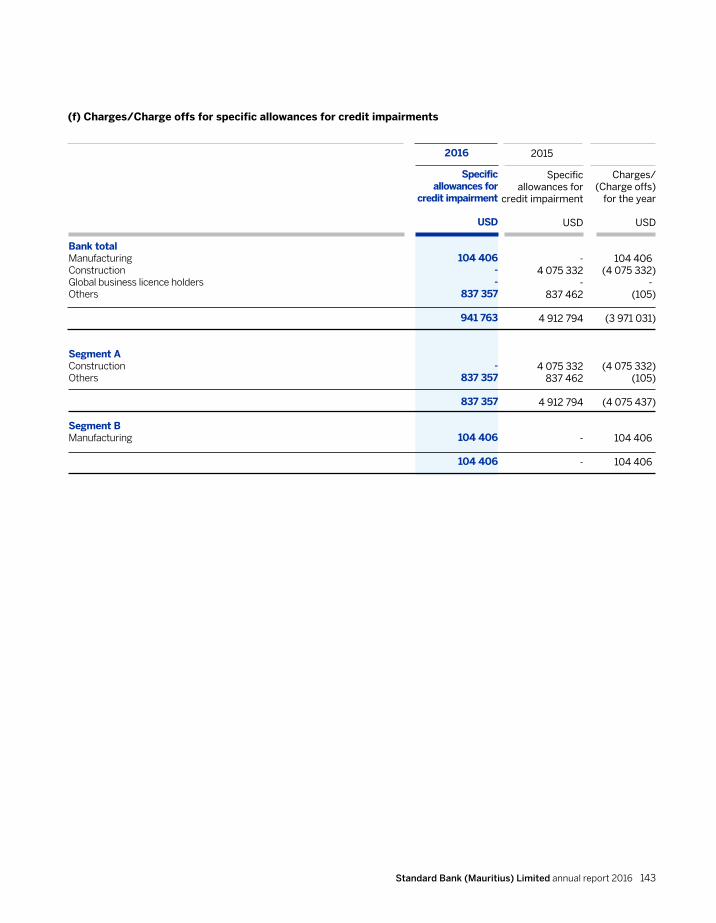
Standard Bank (Mauritius) Limited annual report 2016 143
Bank totalManufacturingConstructionGlobal business licence holdersOthers
Segment AConstructionOthers
Segment BManufacturing
Specificallowances for
credit impairment
USD
-4 075 332
-837 462
4 912 794
4 075 332837 462
4 912 794
-
-
Charges/ (Charge offs)
for the year
USD
104 406
(4 075 332)-
(105)
(3 971 031)
(4 075 332) (105)
(4 075 437)
104 406
104 406
(f) Charges/Charge offs for specific allowances for credit impairments
Specific allowances for
credit impairment
USD
104 406
--
837 357
941 763
-837 357
837 357
104 406
104 406
2016 2015

144
ANNUAL FINANCIAL STATEMENTS Notes to and forming part of the financial statements continued
2016USD
833 184
833 184
833 184
833 184
Unlisted – available-for-saleComprising ofTreasury notes
Segment ATreasury notes
2015USD
474 659
474 659
474 659
474 659
2014USD
2 661 958
2 661 958
2 661 958
2 661 958
12. Investment securities
Maturity analysis
2016USD
833 184-
833 184
833 184-
833 184
Bank total Up to 3 monthsOver 3 months and up to 6 months
Segment AUp to 3 monthsOver 3 months and up to 6 months
2015USD
474 659-
474 659
474 659-
474 659
2014USD
- 2 661 958
2 661 958
- 2 661 958
2 661 958
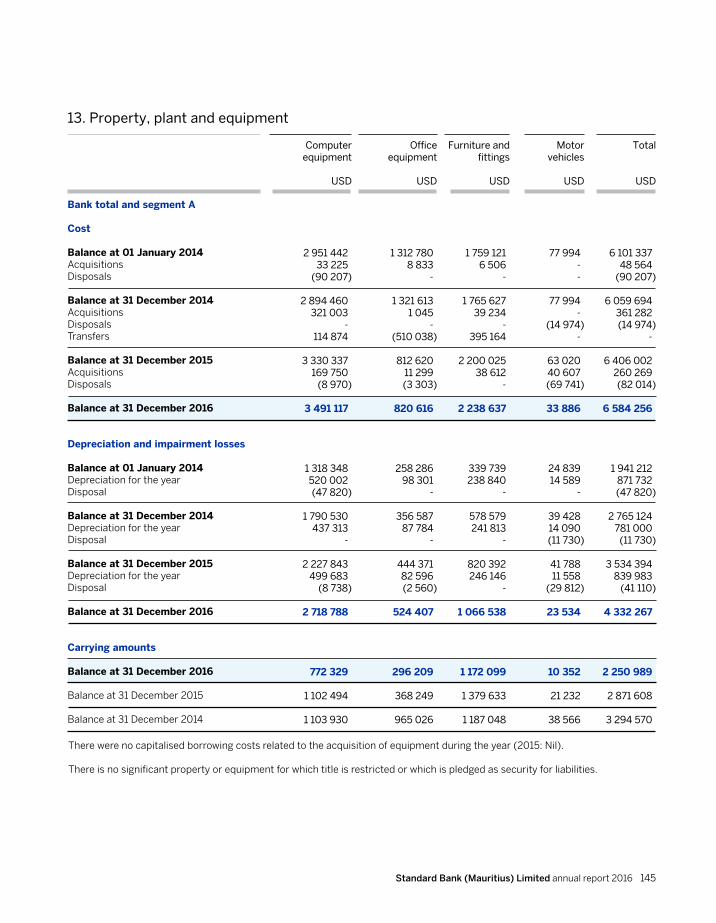
Standard Bank (Mauritius) Limited annual report 2016 145
Officeequipment
USD
1 312 780 8 833
-
1 321 613 1 045
-(510 038)
812 620 11 299 (3 303)
820 616
258 286 98 301
-
356 587 87 784
-
444 371 82 596 (2 560)
524 407
296 209
368 249
965 026
Furniture and fittings
USD
1 759 121 6 506
-
1 765 627 39 234
-395 164
2 200 025
38 612 -
2 238 637
339 739 238 840
-
578 579 241 813
-
820 392 246 146
-
1 066 538
1 172 099
1 379 633
1 187 048
Computer equipment
USD
2 951 442 33 225
(90 207)
2 894 460 321 003
- 114 874
3 330 337 169 750
(8 970)
3 491 117
1 318 348 520 002 (47 820)
1 790 530
437 313 -
2 227 843 499 683
(8 738)
2 718 788
772 329
1 102 494
1 103 930
Bank total and segment A
Cost
Balance at 01 January 2014AcquisitionsDisposals
Balance at 31 December 2014AcquisitionsDisposalsTransfers
Balance at 31 December 2015AcquisitionsDisposals
Balance at 31 December 2016
Depreciation and impairment losses
Balance at 01 January 2014 Depreciation for the yearDisposal
Balance at 31 December 2014Depreciation for the yearDisposal
Balance at 31 December 2015Depreciation for the yearDisposal
Balance at 31 December 2016
Carrying amounts
Balance at 31 December 2016
Balance at 31 December 2015
Balance at 31 December 2014
13. Property, plant and equipment
Motorvehicles
USD
77 994
- -
77 994
- (14 974)
-
63 020 40 607
(69 741)
33 886
24 839 14 589
-
39 428 14 090 (11 730)
41 788 11 558
(29 812)
23 534
10 352
21 232
38 566
There were no capitalised borrowing costs related to the acquisition of equipment during the year (2015: Nil).
There is no significant property or equipment for which title is restricted or which is pledged as security for liabilities.
Total
USD
6 101 337
48 564 (90 207)
6 059 694
361 282 (14 974)
-
6 406 002 260 269 (82 014)
6 584 256
1 941 212 871 732
(47 820)
2 765 124 781 000
(11 730)
3 534 394 839 983
(41 110)
4 332 267
2 250 989
2 871 608
3 294 570
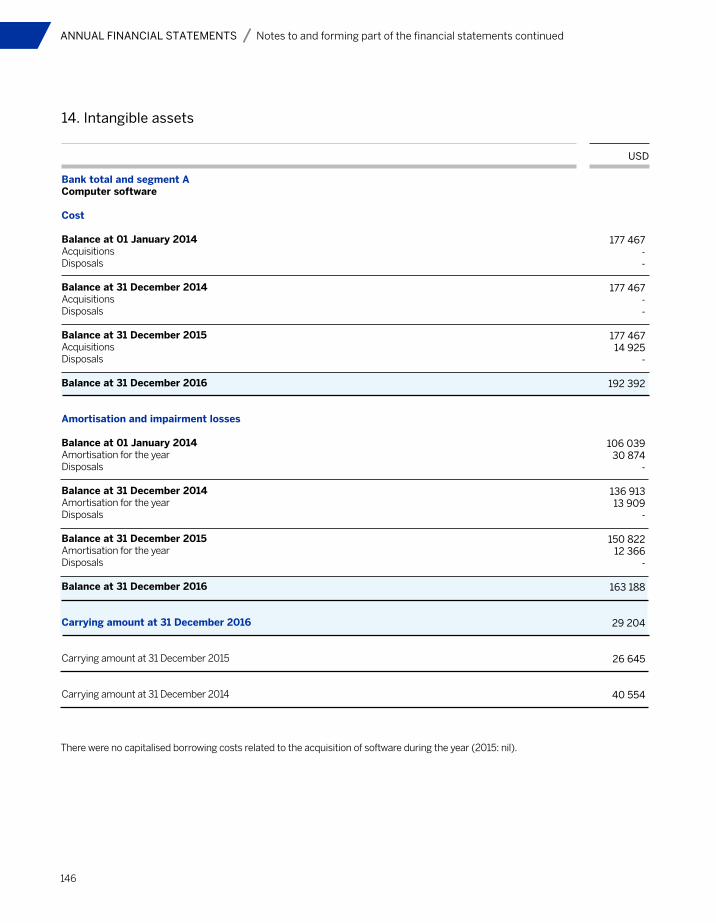
146
ANNUAL FINANCIAL STATEMENTS Notes to and forming part of the financial statements continued
Bank total and segment AComputer software Cost Balance at 01 January 2014AcquisitionsDisposals
Balance at 31 December 2014AcquisitionsDisposals
Balance at 31 December 2015AcquisitionsDisposals Balance at 31 December 2016 Amortisation and impairment losses
Balance at 01 January 2014Amortisation for the yearDisposals Balance at 31 December 2014Amortisation for the yearDisposals Balance at 31 December 2015Amortisation for the yearDisposals Balance at 31 December 2016 Carrying amount at 31 December 2016 Carrying amount at 31 December 2015 Carrying amount at 31 December 2014
USD
177 467 -
-
177 467 -
-
177 467 14 925
-
192 392
106 03930 874
-
136 91313 909
-
150 82212 366
-
163 188
29 204
26 645
40 554
14. Intangible assets
There were no capitalised borrowing costs related to the acquisition of software during the year (2015: nil).
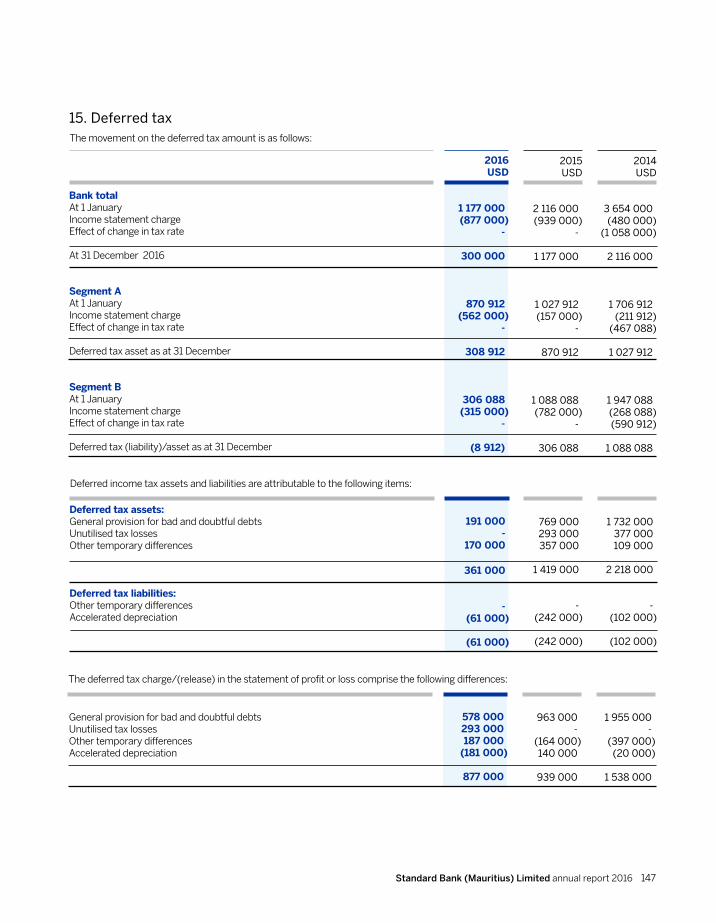
Standard Bank (Mauritius) Limited annual report 2016 147
2016USD
1 177 000(877 000)
-
300 000
870 912(562 000)
-
308 912
306 088(315 000)
-
(8 912)
Bank totalAt 1 JanuaryIncome statement chargeEffect of change in tax rate
At 31 December 2016
Segment AAt 1 JanuaryIncome statement chargeEffect of change in tax rate
Deferred tax asset as at 31 December
Segment BAt 1 JanuaryIncome statement chargeEffect of change in tax rate
Deferred tax (liability)/asset as at 31 December
2015USD
2 116 000(939 000)
-
1 177 000
1 027 912(157 000)
-
870 912
1 088 088(782 000)
-
306 088
2014USD
3 654 000(480 000)
(1 058 000)
2 116 000
1 706 912(211 912)
(467 088)
1 027 912
1 947 088(268 088)(590 912)
1 088 088
15. Deferred taxThe movement on the deferred tax amount is as follows:
191 000-
170 000
361 000
-(61 000)
(61 000)
Deferred tax assets:General provision for bad and doubtful debtsUnutilised tax lossesOther temporary differences
Deferred tax liabilities:Other temporary differencesAccelerated depreciation
769 000293 000357 000
1 419 000
-(242 000)
(242 000)
1 732 000377 000109 000
2 218 000
-(102 000)
(102 000)
Deferred income tax assets and liabilities are attributable to the following items:
578 000293 000187 000
(181 000)
877 000
General provision for bad and doubtful debtsUnutilised tax lossesOther temporary differencesAccelerated depreciation
963 000-
(164 000)140 000
939 000
1 955 000-
(397 000)(20 000)
1 538 000
The deferred tax charge/(release) in the statement of profit or loss comprise the following differences:

148
2016USD
8 792 527---
796 762
9 589 289
8 792 527---
383 423
9 175 950
-413 339
413 339
Mandatory balances with central bankAccrued interest receivableProperty held-for-saleCurrent tax receivable (note 21)Other
Segment AMandatory balances with central bankAccrued interest receivableProperty held-for-saleCurrent tax receivable (note 21)Other
Segment BAccrued interest receivableOther
2015USD
8 394 8954 111 540
--
1 122 878
13 629 313
8 394 8952 265 162
--
889 657
11 549 714
1 846 378233 221
2 079 599
2014USD
8 777 6846 062 594
236 2201 266
1 246 314
16 324 078
8 777 6841 933 798
236 2201 266
1 007 366
11 956 334
4 128 796238 948
4 367 744
16. Other assets
Deposits are placed with the central bank for the purpose of reserve requirements and are therefore not available-for-use.
The Bank held property as a consequence of enforcement of security over loan and advances.
Accrued interest for 2016 of USD2 021 262 has been reclassified under loan and advances to customers/banks and cash and cash equivalent.
64 033 43230 341 194
94 374 626
20 001 4672 592 229
22 593 696
44 031 96527 748 965
71 780 930
Bank total Money market depositsOther deposits from banks
Segment AMoney market depositsOther deposits from banks
Segment BMoney market depositsOther deposits from banks
76 000 0003 148 172
79 148 172
20 000 0003 110 700
23 110 700
56 000 00037 472
56 037 472
21 100 7221 784 367
22 885 089
-1 784 367
1 784 367
20 283 331817 391
21 100 722
17. Deposits from banks
ANNUAL FINANCIAL STATEMENTS Notes to and forming part of the financial statements continued
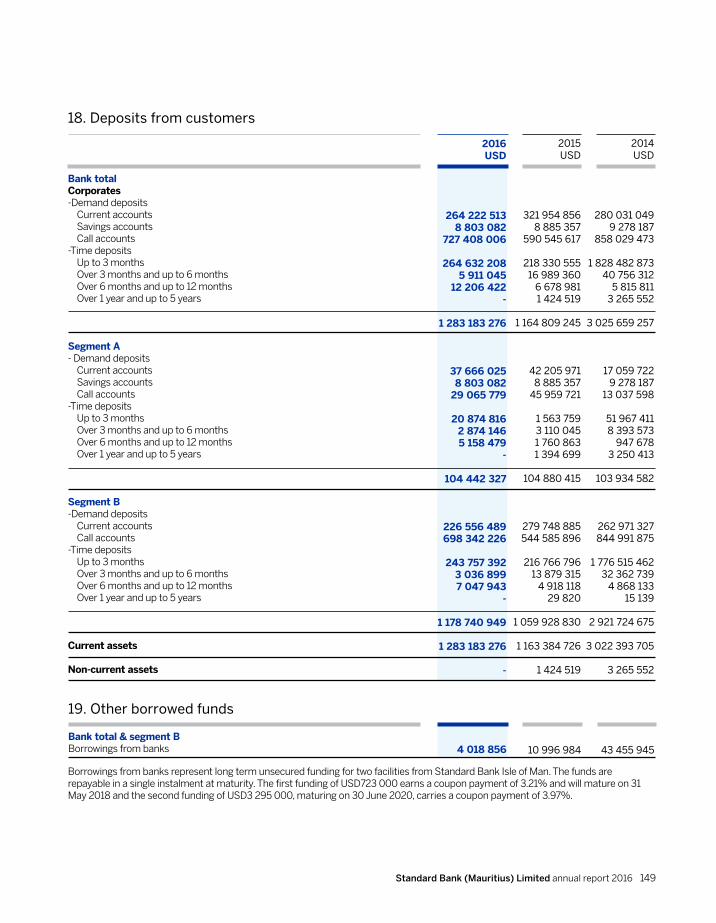
Standard Bank (Mauritius) Limited annual report 2016 149
2016USD
264 222 513 8 803 082
727 408 006
264 632 208 5 911 045
12 206 422 -
1 283 183 276
37 666 025 8 803 082
29 065 779
20 874 816 2 874 146 5 158 479
-
104 442 327
226 556 489
698 342 226
243 757 392 3 036 899 7 047 943
-
1 178 740 949
1 283 183 276
-
2015USD
321 954 856 8 885 357
590 545 617
218 330 555 16 989 360
6 678 981 1 424 519
1 164 809 245
42 205 971 8 885 357
45 959 721
1 563 759 3 110 045 1 760 863 1 394 699
104 880 415
279 748 885 544 585 896
216 766 79613 879 315
4 918 118 29 820
1 059 928 830
1 163 384 726
1 424 519
2014USD
280 031 049 9 278 187
858 029 473
1 828 482 873 40 756 312
5 815 811 3 265 552
3 025 659 257
17 059 722 9 278 187
13 037 598
51 967 411 8 393 573
947 678 3 250 413
103 934 582
262 971 327 844 991 875
1 776 515 462 32 362 739
4 868 133 15 139
2 921 724 675
3 022 393 705
3 265 552
Bank totalCorporates-Demand deposits Current accounts Savings accounts Call accounts-Time deposits Up to 3 months Over 3 months and up to 6 months Over 6 months and up to 12 months Over 1 year and up to 5 years
Segment A- Demand deposits Current accounts Savings accounts Call accounts-Time deposits Up to 3 months Over 3 months and up to 6 months Over 6 months and up to 12 months Over 1 year and up to 5 years
Segment B-Demand deposits Current accounts Call accounts-Time deposits Up to 3 months Over 3 months and up to 6 months Over 6 months and up to 12 months Over 1 year and up to 5 years
Current assets
Non-current assets
18. Deposits from customers
19. Other borrowed funds
4 018 856 10 996 984 43 455 945
Bank total & segment BBorrowings from banks
Borrowings from banks represent long term unsecured funding for two facilities from Standard Bank Isle of Man. The funds are repayable in a single instalment at maturity. The first funding of USD723 000 earns a coupon payment of 3.21% and will mature on 31 May 2018 and the second funding of USD3 295 000, maturing on 30 June 2020, carries a coupon payment of 3.97%.

150
Rate
USD 3 months Libor + 3.84% p.a.
Notional valueUSD
25 000 000
Carrying valueUSD
25 000 000
Maturity date
December 2022
20. Subordinated liabilities
Date issued
December 2012
Lender
SBSA
The Bank did not have any defaults of principal, interest or other breaches with respect to its subordinated liabilities in 2014 to 2016.
2016USD
25 000 000Bank total and segment BSBSA
2015USD
25 000 000
2014USD
25 000 000
21. Current tax liabilities
202 000-
202 000
--
-
202 000-
202 000
Bank totalIncome tax based on chargeable incomeAdvanced payments made
Segment AIncome tax based on chargeable incomeAdvanced payments made
Segment BIncome tax based on chargeable incomeAdvanced payments made
539 000-
539 000
360 000-
360 000
179 000-
179 000
1 064 000(1 065 266)
(1 266)
905 000(661 752)
243 248
159 000
(403 514)
(244 514)
22. Other liabilities
-1 735 116
28 055 5284 683 622
34 474 266
-1 735 116
3 485 633
5 220 749
--
28 055 5281 197 989
29 253 517
Accrued interest payable Accrued expense Unsettled money market transactions7
Others Segment AAccrued interest payableAccrued expenseOthers
Segment BAccrued interest payableAccrued expenseUnsettled money market transactionsOthers
200 5731 391 556
32 812 2606 570 175
40 974 564
105 0111 391 5566 352 016
7 848 583
95 562-
32 812 260218 159
33 125 981
756 281609 014
-8 231 744
9 597 039
63 986609 014
6 921 208
7 594 208
692 295--
1 310 536
2 002 831
Accrued interest for 2016 USD354 454 has been reclassified under deposits.7Relate to uncleared balances on nostro accounts for money market transactions with value date after trade date. These are cleared within 2 business days.
ANNUAL FINANCIAL STATEMENTS Notes to and forming part of the financial statements continued

Standard Bank (Mauritius) Limited annual report 2016 151
2016USD
40 000 000
35 000 000
5 000 000
2015USD
40 000 000
35 000 000
5 000 000
2014USD
40 000 000
35 000 000
5 000 000
Authorised capitalOrdinary (40,000,000 shares of USD1 each)
Issued and paid capitalOrdinary (35,000,000 shares of USD1 each)
Unissued capitalOrdinary (5,000,000 shares of USD1 each)
23. Share capital
2016USD
23 332 670 2 800 245
3 836 8714 201 444
356 665 019
390 836 249
1 175 79220 900281 313131 266313 889
1 923 160
22 156 8782 779 3453 555 5584 070 178
356 351 130
388 913 089
2015USD
15 015 504 3 801 068
1 540 3515 895 624
411 287 779
437 540 326
1 150 7372 080 033
35 886296 181
24 532 031
28 094 868
13 864 7671 721 035
1 504 4655 626 443
386 755 748
409 472 458
2014USD
50 323 25010 338 866
3 992 6429 637 188
160 370 269
234 662 215
1 192 4402 715 085
6 58468 343
36 419 899
40 402 351
49 130 8107 623 781
3 986 0589 568 845
123 950 370
194 259 865
Guarantees on account of customersLetters of credit and other obligations on account of customersSpot foreign exchange contractsAccepted letters of creditLiabilities for swaps and forwards
Segment AGuarantees on account of customersLetters of credit and other obligations on account of customersSpot foreign exchange contractsAccepted letters of creditLiabilities for swaps and forwards
Segment BGuarantees on account of customersLetters of credit and other obligations on account of customersSpot foreign exchange contractsAccepted letters of creditLiabilities for swaps and forwards
24. Contingent liabilities
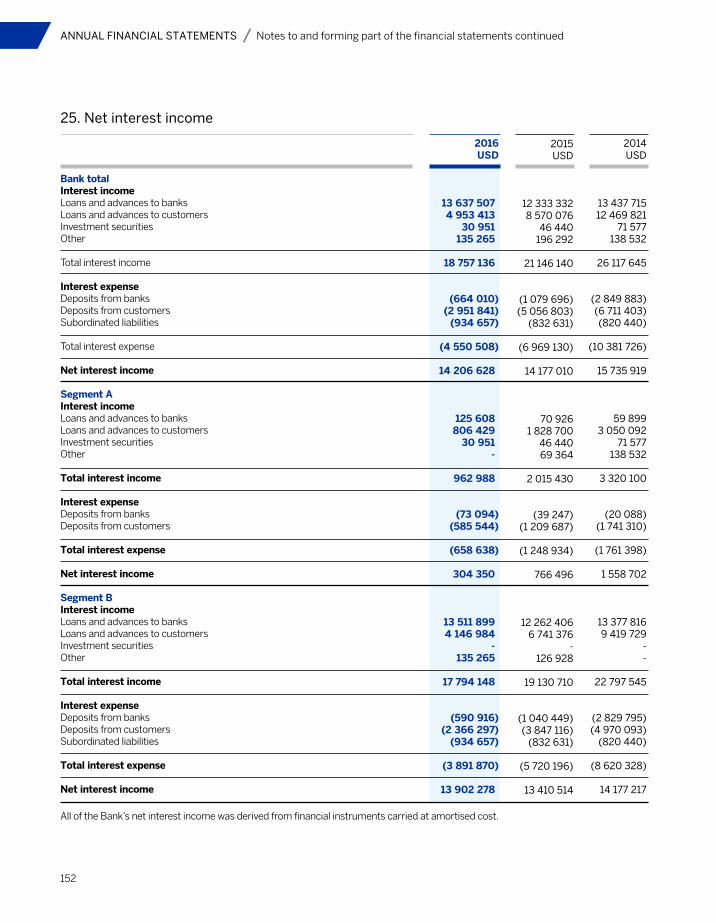
152
2016USD
13 637 507 4 953 413
30 951 135 265
18 757 136
(664 010)
(2 951 841)(934 657)
(4 550 508)
14 206 628
125 608 806 429
30 951 -
962 988
(73 094)
(585 544)
(658 638)
304 350
13 511 899 4 146 984
-135 265
17 794 148
(590 916)
(2 366 297)(934 657)
(3 891 870)
13 902 278
2015USD
12 333 332 8 570 076
46 440 196 292
21 146 140
(1 079 696)(5 056 803)
(832 631)
(6 969 130)
14 177 010
70 926 1 828 700
46 440 69 364
2 015 430
(39 247)(1 209 687)
(1 248 934)
766 496
12 262 406
6 741 376 -
126 928
19 130 710
(1 040 449)(3 847 116)
(832 631)
(5 720 196)
13 410 514
2014USD
13 437 715
12 469 821 71 577
138 532
26 117 645
(2 849 883) (6 711 403) (820 440)
(10 381 726)
15 735 919
59 899 3 050 092
71 577 138 532
3 320 100
(20 088) (1 741 310)
(1 761 398)
1 558 702
13 377 816 9 419 729
--
22 797 545
(2 829 795) (4 970 093)
(820 440)
(8 620 328)
14 177 217
Bank totalInterest incomeLoans and advances to banksLoans and advances to customersInvestment securitiesOther
Total interest income
Interest expenseDeposits from banksDeposits from customersSubordinated liabilities
Total interest expense
Net interest income
Segment AInterest incomeLoans and advances to banksLoans and advances to customersInvestment securitiesOther
Total interest income
Interest expenseDeposits from banksDeposits from customers
Total interest expense
Net interest income
Segment BInterest incomeLoans and advances to banksLoans and advances to customersInvestment securitiesOther
Total interest income
Interest expenseDeposits from banksDeposits from customersSubordinated liabilities
Total interest expense
Net interest income
25. Net interest income
All of the Bank’s net interest income was derived from financial instruments carried at amortised cost.
ANNUAL FINANCIAL STATEMENTS Notes to and forming part of the financial statements continued
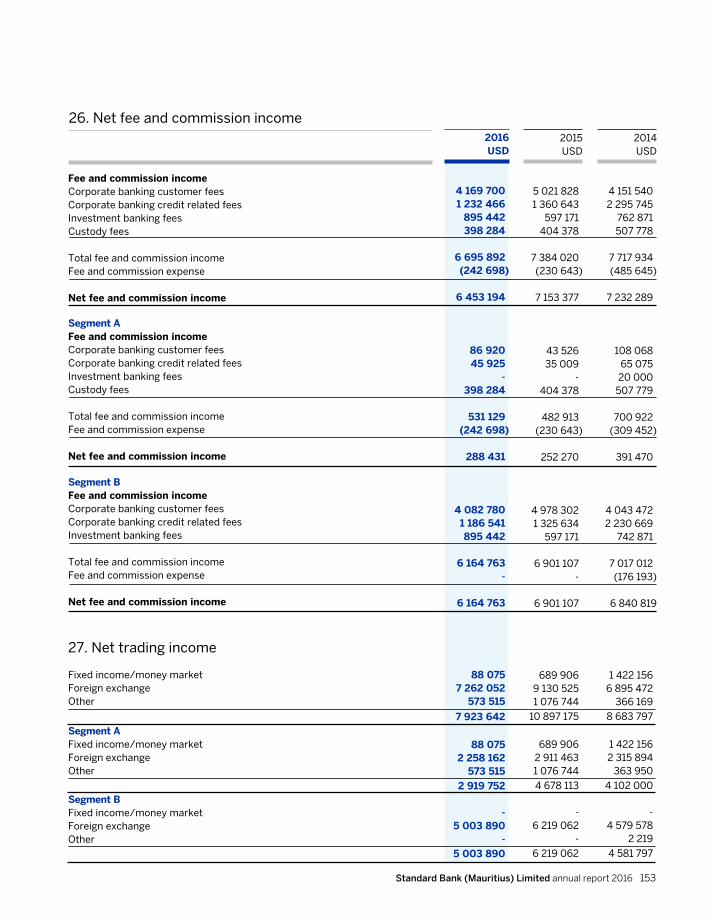
Standard Bank (Mauritius) Limited annual report 2016 153
2016USD
4 169 700 1 232 466
895 442 398 284
6 695 892(242 698)
6 453 194
86 920 45 925
-398 284
531 129(242 698)
288 431
4 082 780 1 186 541 895 442
6 164 763
-
6 164 763
88 075 7 262 052
573 515
7 923 642
88 075 2 258 162
573 515
2 919 752
-5 003 890
-
5 003 890
2015USD
5 021 828 1 360 643
597 171 404 378
7 384 020(230 643)
7 153 377
43 526 35 009
-404 378
482 913(230 643)
252 270
4 978 302 1 325 634
597 171
6 901 107-
6 901 107
689 906 9 130 525 1 076 744
10 897 175
689 906 2 911 463 1 076 744
4 678 113
-6 219 062
-
6 219 062
2014USD
4 151 540 2 295 745
762 871 507 778
7 717 934(485 645)
7 232 289
108 068 65 075
20 000 507 779
700 922(309 452)
391 470
4 043 472 2 230 669
742 871
7 017 012(176 193)
6 840 819
1 422 156 6 895 472
366 169
8 683 797
1 422 156 2 315 894
363 950
4 102 000
-4 579 578
2 219
4 581 797
Fee and commission income Corporate banking customer fees Corporate banking credit related fees Investment banking fees Custody fees
Total fee and commission income Fee and commission expense
Net fee and commission income Segment A Fee and commission incomeCorporate banking customer fees Corporate banking credit related fees Investment banking fees Custody fees
Total fee and commission income Fee and commission expense
Net fee and commission income
Segment B Fee and commission incomeCorporate banking customer fees Corporate banking credit related fees Investment banking fees
Total fee and commission income Fee and commission expense
Net fee and commission income
27. Net trading income
Fixed income/money market Foreign exchange Other
Segment A Fixed income/money market Foreign exchange Other
Segment B Fixed income/money market Foreign exchange Other
26. Net fee and commission income
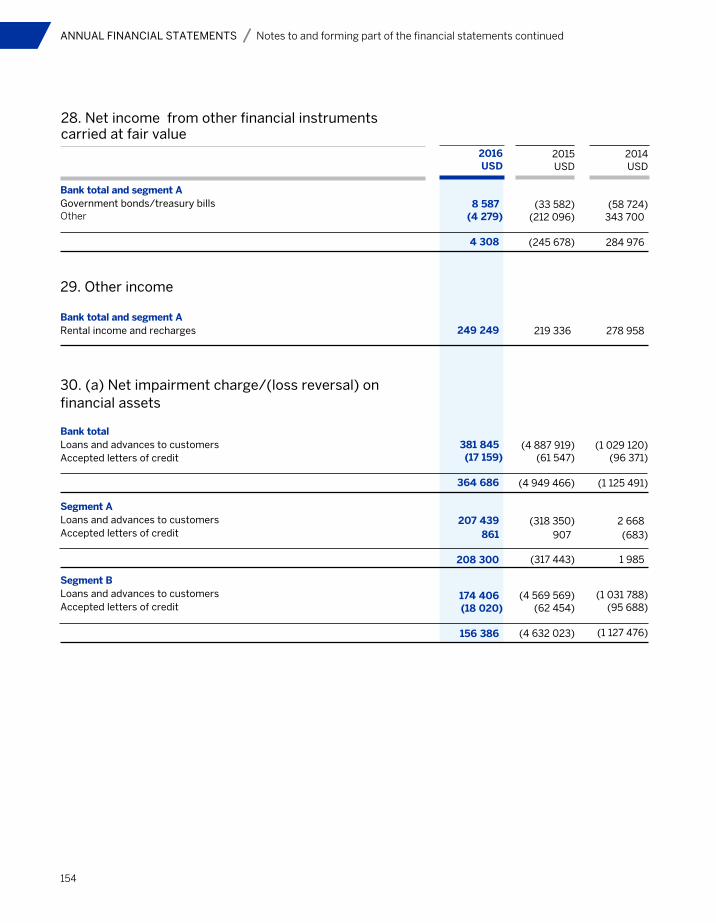
154
2016USD
8 587(4 279)
4 308
249 249
381 845(17 159)
364 686
207 439861
208 300
174 406(18 020)
156 386
2015USD
(33 582) (212 096)
(245 678)
219 336
(4 887 919)(61 547)
(4 949 466)
(318 350)907
(317 443)
(4 569 569)(62 454)
(4 632 023)
2014USD
(58 724)343 700
284 976
278 958
(1 029 120)(96 371)
(1 125 491)
2 668(683)
1 985
(1 031 788)(95 688)
(1 127 476)
Bank total and segment AGovernment bonds/treasury bills Other
29. Other income
Bank total and segment A Rental income and recharges
30. (a) Net impairment charge/(loss reversal) on financial assets
Bank total Loans and advances to customers Accepted letters of credit
Segment A Loans and advances to customersAccepted letters of credit
Segment B Loans and advances to customersAccepted letters of credit
28. Net income from other financial instruments carried at fair value
ANNUAL FINANCIAL STATEMENTS Notes to and forming part of the financial statements continued

Standard Bank (Mauritius) Limited annual report 2016 155
30. (b) Breakdown of net impairment (loss reversal)/charge on loans and advances to customers
Bank total Provision madeProvision releasedRecoveries
Segment AProvision madeProvision releasedRecoveries
Segment BProvision madeProvision releasedRecoveries
31 (a) Personnel expenses
Bank total Wages and salaries Other personnel expenses Compulsory social security obligations Contributions to defined contribution plans Share-based payment-cash settled
Segment A Wages and salaries Other personnel expenses Compulsory social security obligations Contributions to defined contribution plans Share-based payment-cash settled
Segment B Wages and salaries Other personnel expenses Compulsory social security obligations Contributions to defined contribution plans Share-based payment-cash settled
4 766 3461 969 065
39 031451 046120 354
7 345 842
622 481257 229
5 09858 90615 646
959 360
4 143 8651 711 836
33 933392 140104 708
6 386 482
4 142 0591 854 766
97 826412 51022 186
6 529 347
729 404326 618
17 22772 642
3 907
1 149 798
3 412 6551 528 148
80 599339 868
18 279
5 379 549
4 260 1272 248 732
109 626460 308176 073
7 254 866
874 892461 816
22 51494 53236 160
1 489 914
3 385 2351 786 916
87 112365 776139 913
5 764 952
2016USD
676 222(294 377)
-
381 845
283 783(76 344)
-
207 439
392 439(218 033)
-
174 406
2015USD
596 382(2 532 301)
(2 952 000)
(4 887 919)
484 867(803 217)
-
(318 350)
111 515(1 729 084)
(2 952 000)
(4 569 569)
2014USD
1 782 619(2 483 739)
(328 000)
(1 029 120)
1 055 892(1 053 224)
-
2 668
727 409(1 431 197)(328 000)
(1 031 788)
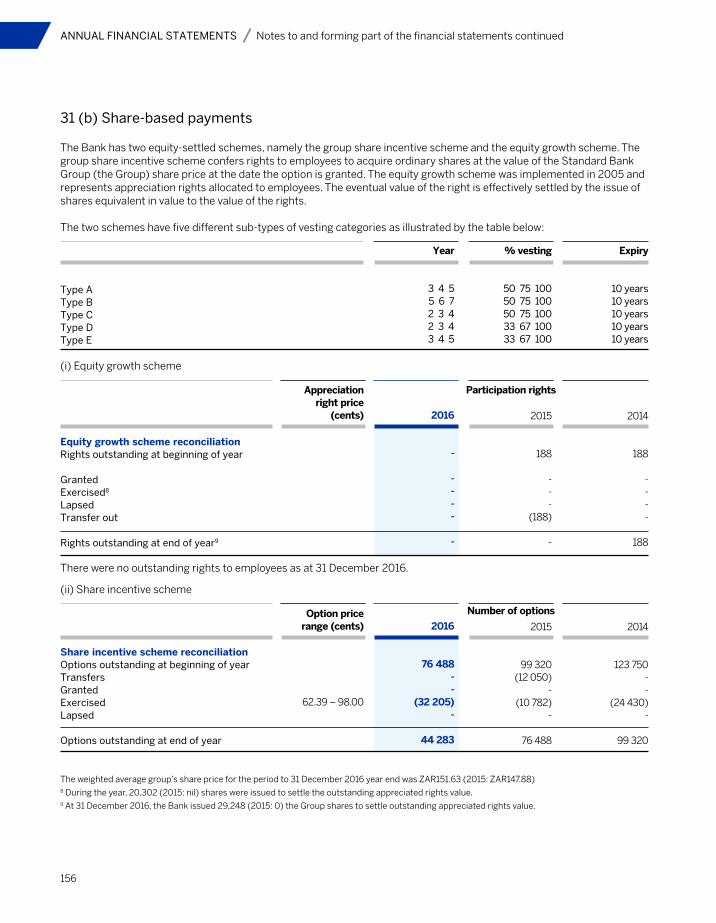
156
31 (b) Share-based payments
The Bank has two equity-settled schemes, namely the group share incentive scheme and the equity growth scheme. The group share incentive scheme confers rights to employees to acquire ordinary shares at the value of the Standard Bank Group (the Group) share price at the date the option is granted. The equity growth scheme was implemented in 2005 and represents appreciation rights allocated to employees. The eventual value of the right is effectively settled by the issue of shares equivalent in value to the value of the rights.
The two schemes have five different sub-types of vesting categories as illustrated by the table below:
(i) Equity growth scheme
(ii) Share incentive scheme
There were no outstanding rights to employees as at 31 December 2016.
The weighted average group’s share price for the period to 31 December 2016 year end was ZAR151.63 (2015: ZAR147.88)8 During the year, 20,302 (2015: nil) shares were issued to settle the outstanding appreciated rights value.9 At 31 December 2016, the Bank issued 29,248 (2015: 0) the Group shares to settle outstanding appreciated rights value.
Type AType BType CType DType E
Equity growth scheme reconciliationRights outstanding at beginning of year
GrantedExercised8 Lapsed Transfer out
Rights outstanding at end of year9
Share incentive scheme reconciliationOptions outstanding at beginning of yearTransfers Granted Exercised Lapsed
Options outstanding at end of year
Year
3 4 55 6 72 3 42 3 43 4 5
2016
-
----
-
2016
76 488--
(32 205)-
44 283
Appreciationright price
(cents)
Option pricerange (cents)
62.39 – 98.00
% vesting
50 75 10050 75 10050 75 10033 67 10033 67 100
2015
188
---
(188)
-
2015
99 320(12 050)
-(10 782)
-
76 488
Expiry
10 years10 years10 years10 years10 years
2014
188
----
188
2014
123 750--
(24 430)-
99 320
ANNUAL FINANCIAL STATEMENTS Notes to and forming part of the financial statements continued
Participation rights
Number of options
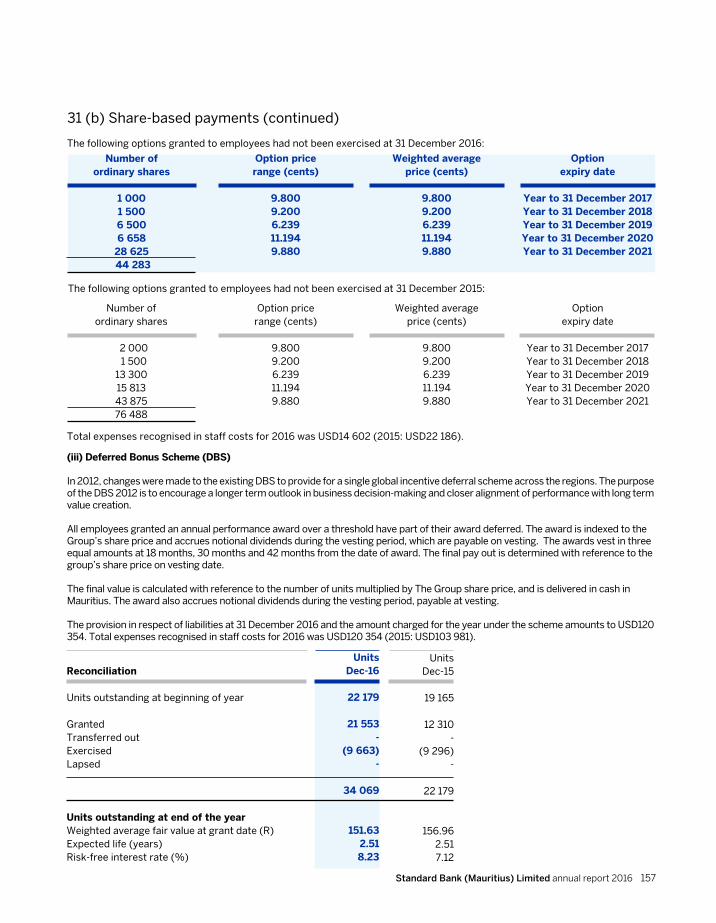
Standard Bank (Mauritius) Limited annual report 2016 157
31 (b) Share-based payments (continued)
The following options granted to employees had not been exercised at 31 December 2016:
Number ofordinary shares
1 0001 5006 5006 658
28 625 44 283
Number ofordinary shares
2 000 1 50013 30015 81343 87576 488
Option pricerange (cents)
9.8009.2006.23911.1949.880
Weighted averageprice (cents)
9.8009.2006.23911.1949.880
Option expiry date
Year to 31 December 2017Year to 31 December 2018Year to 31 December 2019Year to 31 December 2020Year to 31 December 2021
Option pricerange (cents)
9.8009.2006.23911.1949.880
Weighted averageprice (cents)
9.8009.2006.23911.1949.880
Option expiry date
Year to 31 December 2017Year to 31 December 2018Year to 31 December 2019Year to 31 December 2020Year to 31 December 2021
The following options granted to employees had not been exercised at 31 December 2015:
Total expenses recognised in staff costs for 2016 was USD14 602 (2015: USD22 186).
(iii) Deferred Bonus Scheme (DBS)
In 2012, changes were made to the existing DBS to provide for a single global incentive deferral scheme across the regions. The purpose of the DBS 2012 is to encourage a longer term outlook in business decision-making and closer alignment of performance with long term value creation.
All employees granted an annual performance award over a threshold have part of their award deferred. The award is indexed to the Group’s share price and accrues notional dividends during the vesting period, which are payable on vesting. The awards vest in three equal amounts at 18 months, 30 months and 42 months from the date of award. The final pay out is determined with reference to the group’s share price on vesting date.
The final value is calculated with reference to the number of units multiplied by The Group share price, and is delivered in cash in Mauritius. The award also accrues notional dividends during the vesting period, payable at vesting.
The provision in respect of liabilities at 31 December 2016 and the amount charged for the year under the scheme amounts to USD120 354. Total expenses recognised in staff costs for 2016 was USD120 354 (2015: USD103 981).
Reconciliation
Units outstanding at beginning of year
GrantedTransferred outExercisedLapsed Units outstanding at end of the year Weighted average fair value at grant date (R) Expected life (years) Risk-free interest rate (%)
Units Dec-16
22 179
21 553 -
(9 663)-
34 069
151.632.518.23
Units Dec-15
19 165
12 310 -
(9 296)-
22 179
156.962.517.12
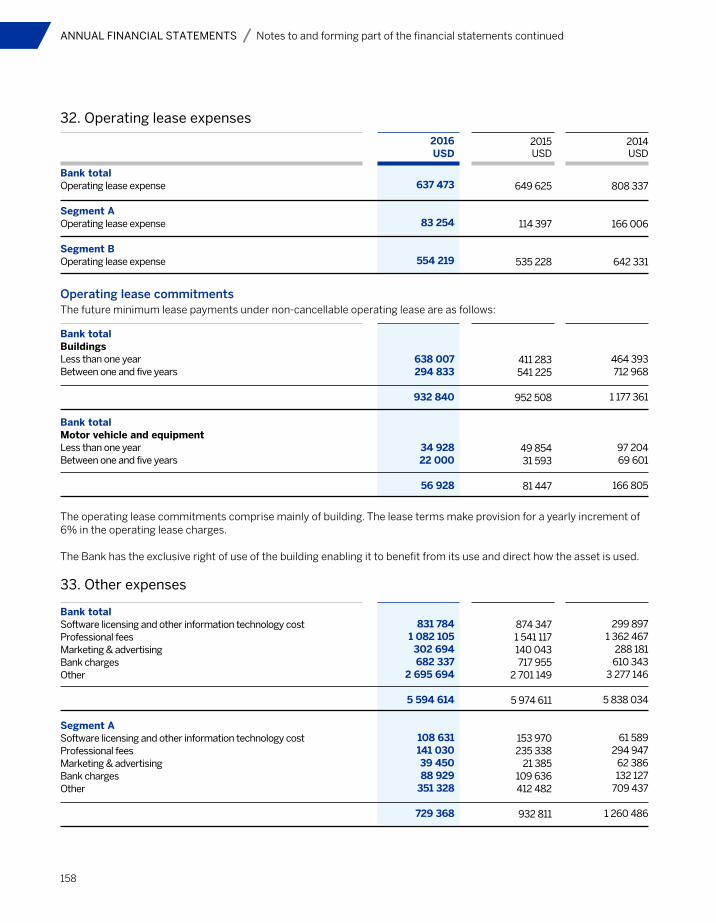
158
32. Operating lease expenses
Operating lease commitmentsThe future minimum lease payments under non-cancellable operating lease are as follows:
The operating lease commitments comprise mainly of building. The lease terms make provision for a yearly increment of 6% in the operating lease charges.
The Bank has the exclusive right of use of the building enabling it to benefit from its use and direct how the asset is used.
33. Other expenses
Bank total Operating lease expense
Segment A Operating lease expense
Segment B Operating lease expense
Bank totalBuildings Less than one year Between one and five years
Bank totalMotor vehicle and equipmentLess than one year Between one and five years
Bank total Software licensing and other information technology costProfessional feesMarketing & advertisingBank chargesOther
Segment A Software licensing and other information technology costProfessional feesMarketing & advertisingBank chargesOther
2016USD
637 473
83 254
554 219
638 007294 833
932 840
34 92822 000
56 928
831 784 1 082 105 302 694 682 337
2 695 694
5 594 614
108 631 141 030 39 450 88 929
351 328
729 368
2015USD
649 625
114 397
535 228
411 283541 225
952 508
49 85431 593
81 447
874 347 1 541 117 140 043 717 955
2 701 149
5 974 611
153 970 235 338
21 385 109 636 412 482
932 811
2014USD
808 337
166 006
642 331
464 393712 968
1 177 361
97 20469 601
166 805
299 897 1 362 467
288 181 610 343
3 277 146
5 838 034
61 589 294 947
62 386 132 127
709 437
1 260 486
ANNUAL FINANCIAL STATEMENTS Notes to and forming part of the financial statements continued
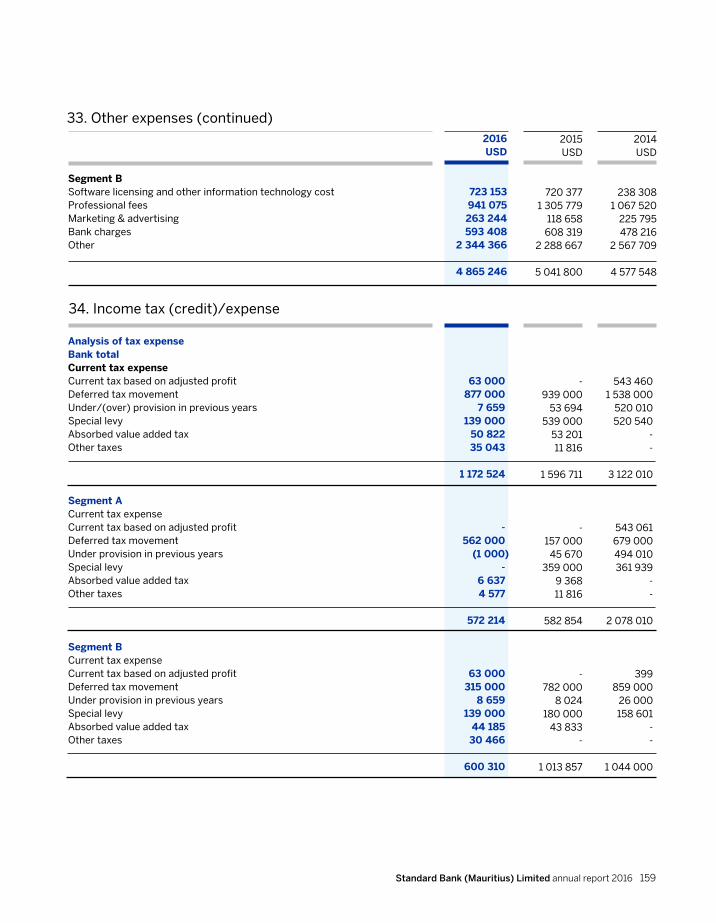
Standard Bank (Mauritius) Limited annual report 2016 159
2016USD
723 153 941 075 263 244 593 408
2 344 366
4 865 246
2015USD
720 377 1 305 779
118 658 608 319
2 288 667
5 041 800
2014USD
238 308 1 067 520
225 795 478 216
2 567 709
4 577 548
Segment BSoftware licensing and other information technology cost Professional feesMarketing & advertisingBank chargesOther
63 000877 000
7 659139 000
50 822 35 043
1 172 524
-562 000
(1 000)-
6 637 4 577
572 214
63 000 315 000
8 659 139 000
44 185 30 466
600 310
-939 000
53 694539 000
53 201 11 816
1 596 711
-157 000
45 670359 000
9 368 11 816
582 854
- 782 000
8 024 180 000
43 833 -
1 013 857
543 460 1 538 000
520 010 520 540
- -
3 122 010
543 061 679 000
494 010 361 939
- -
2 078 010
399
859 000 26 000
158 601 - -
1 044 000
Analysis of tax expenseBank total Current tax expense Current tax based on adjusted profitDeferred tax movementUnder/(over) provision in previous years Special levyAbsorbed value added taxOther taxes
Segment ACurrent tax expenseCurrent tax based on adjusted profitDeferred tax movementUnder provision in previous years Special levyAbsorbed value added taxOther taxes
Segment BCurrent tax expense Current tax based on adjusted profit Deferred tax movement Under provision in previous years Special levy Absorbed value added taxOther taxes
34. Income tax (credit)/expense
33. Other expenses (continued)
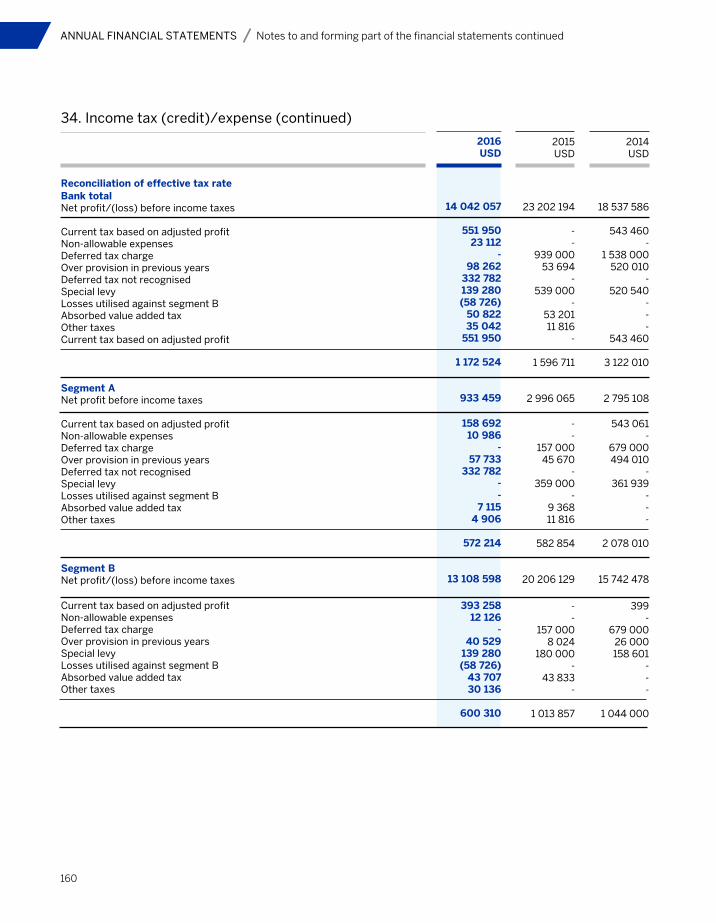
160
2016USD
14 042 057
551 95023 112
-98 262
332 782139 280(58 726)
50 822 35 042
551 950
1 172 524
933 459
158 69210 986
-57 733
332 782--
7 1154 906
572 214
13 108 598
393 258 12 126
-40 529
139 280(58 726)
43 70730 136
600 310
2015USD
23 202 194
--
939 00053 694
-539 000
-53 201 11 816
-
1 596 711
2 996 065
--
157 00045 670
-359 000
-9 368 11 816
582 854
20 206 129
- -157 000
8 024 180 000
- 43 833
-
1 013 857
2014USD
18 537 586
543 460 -
1 538 000 520 010
- 520 540
- -
- 543 460
3 122 010
2 795 108
543 061-
679 000 494 010
- 361 939
--
-
2 078 010
15 742 478
399 -
679 000 26 000
158 601 -
- -
1 044 000
34. Income tax (credit)/expense (continued)
Reconciliation of effective tax rateBank totalNet profit/(loss) before income taxes
Current tax based on adjusted profitNon-allowable expensesDeferred tax chargeOver provision in previous years Deferred tax not recognised Special levyLosses utilised against segment BAbsorbed value added taxOther taxesCurrent tax based on adjusted profit
Segment ANet profit before income taxes
Current tax based on adjusted profitNon-allowable expensesDeferred tax chargeOver provision in previous yearsDeferred tax not recognisedSpecial levyLosses utilised against segment BAbsorbed value added taxOther taxes
Segment BNet profit/(loss) before income taxes
Current tax based on adjusted profitNon-allowable expensesDeferred tax chargeOver provision in previous years Special levy Losses utilised against segment BAbsorbed value added taxOther taxes
ANNUAL FINANCIAL STATEMENTS Notes to and forming part of the financial statements continued
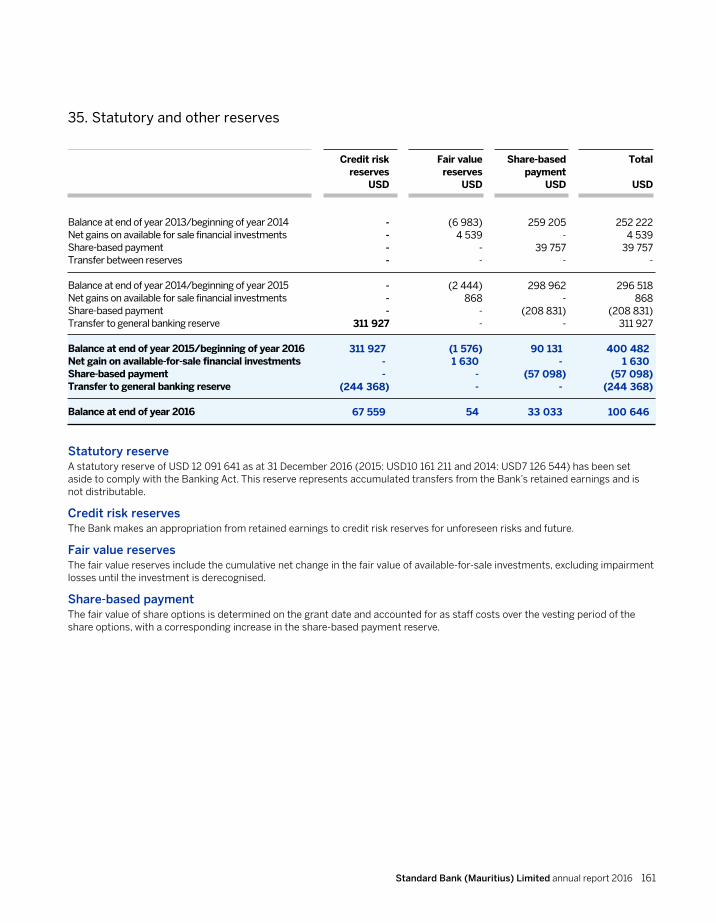
Standard Bank (Mauritius) Limited annual report 2016 161
35. Statutory and other reserves
Credit riskreserves
USD
----
---
311 927
311 927--
(244 368)
67 559
Balance at end of year 2013/beginning of year 2014Net gains on available for sale financial investmentsShare-based paymentTransfer between reserves
Balance at end of year 2014/beginning of year 2015Net gains on available for sale financial investmentsShare-based paymentTransfer to general banking reserve
Balance at end of year 2015/beginning of year 2016Net gain on available-for-sale financial investmentsShare-based paymentTransfer to general banking reserve
Balance at end of year 2016
Fair valuereserves
USD
(6 983)4 539
--
(2 444)868
--
(1 576)1 630
--
54
Share-based payment
USD
259 205-
39 757-
298 962-
(208 831)-
90 131-
(57 098)-
33 033
Total
USD
252 2224 539
39 757-
296 518868
(208 831)311 927
400 4821 630
(57 098)(244 368)
100 646
Statutory reserveA statutory reserve of USD 12 091 641 as at 31 December 2016 (2015: USD10 161 211 and 2014: USD7 126 544) has been set aside to comply with the Banking Act. This reserve represents accumulated transfers from the Bank’s retained earnings and is not distributable.
Credit risk reservesThe Bank makes an appropriation from retained earnings to credit risk reserves for unforeseen risks and future.
Fair value reservesThe fair value reserves include the cumulative net change in the fair value of available-for-sale investments, excluding impairment losses until the investment is derecognised.
Share-based paymentThe fair value of share options is determined on the grant date and accounted for as staff costs over the vesting period of the share options, with a corresponding increase in the share-based payment reserve.
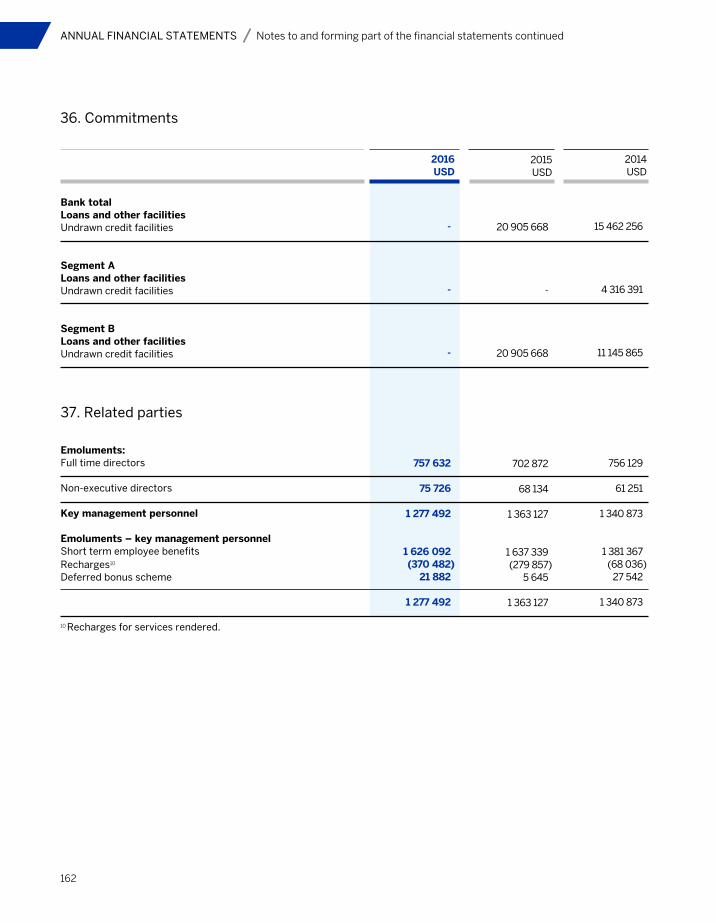
162
36. Commitments
Bank totalLoans and other facilitiesUndrawn credit facilities
Segment ALoans and other facilitiesUndrawn credit facilities
Segment BLoans and other facilitiesUndrawn credit facilities
37. Related parties
Emoluments:Full time directors
Non-executive directors
Key management personnel
Emoluments – key management personnelShort term employee benefitsRecharges10
Deferred bonus scheme
2016USD
-
-
-
757 632
75 726
1 277 492
1 626 092(370 482)
21 882
1 277 492
2015USD
20 905 668
-
20 905 668
702 872
68 134
1 363 127
1 637 339(279 857)
5 645
1 363 127
2014USD
15 462 256
4 316 391
11 145 865
756 129
61 251
1 340 873
1 381 367(68 036)
27 542
1 340 873
10 Recharges for services rendered.
ANNUAL FINANCIAL STATEMENTS Notes to and forming part of the financial statements continued

Standard Bank (Mauritius) Limited annual report 2016 163
37. Related parties (continued)
(i) Balances and placements with parentAt 01 JanuaryMade during the yearRepaid during the year
At 31 December
Loans and advances to parentAt 01 JanuaryMade during the yearRepaid during the year
At 31 December
Interest received from parent during the year
Accrued interest receivable from parent at 31 December
(ii) Balances and placements with other related partiesAt 01 JanuaryMade during the yearRepaid during the year
At 31 December
Loans and advances to other related partiesAt 01 JanuaryMade during the yearRepaid during the year
At 31 December
Interest received from other related entities during the year
Accrued interest receivable from other related entities at 31 December
2016USD
1 098 468 56584 781 099 787
(84 743 248 518)
1 136 319 834
5 000 000--
5 000 000
11 349 398
1 716 053
85 489157 897 551
-
157 983 040
116 298 000-
(49 928 955)
66 369 045
2 116 010
253 367
2015USD
2 619 306 802151 819 966 725
(153 340 804 962)
1 098 468 565
2 678 5712 321 429
-
5 000 000
9 501 350
1 496 112
237 641-
(152 152)
85 489
100 000 00016 298 000
-
116 298 000
2 712 518
135 502
2014USD
1 813 845 546113 875 966 196
(113 070 504 940)
2 619 306 802
3 436 364-
(757 793)
2 678 571
8 444 624
3 242 204
13 291 588-
(13 053 947)
237 641
100 000 000--
100 000 000
4 025 965
134 094
Placements and loans are agreed at commercial rates and on same terms and conditions as for all customers of the Bank. Furthermore, none of the facilities provided during the year under review was non-performing.
The following transactions were carried out with related parties:
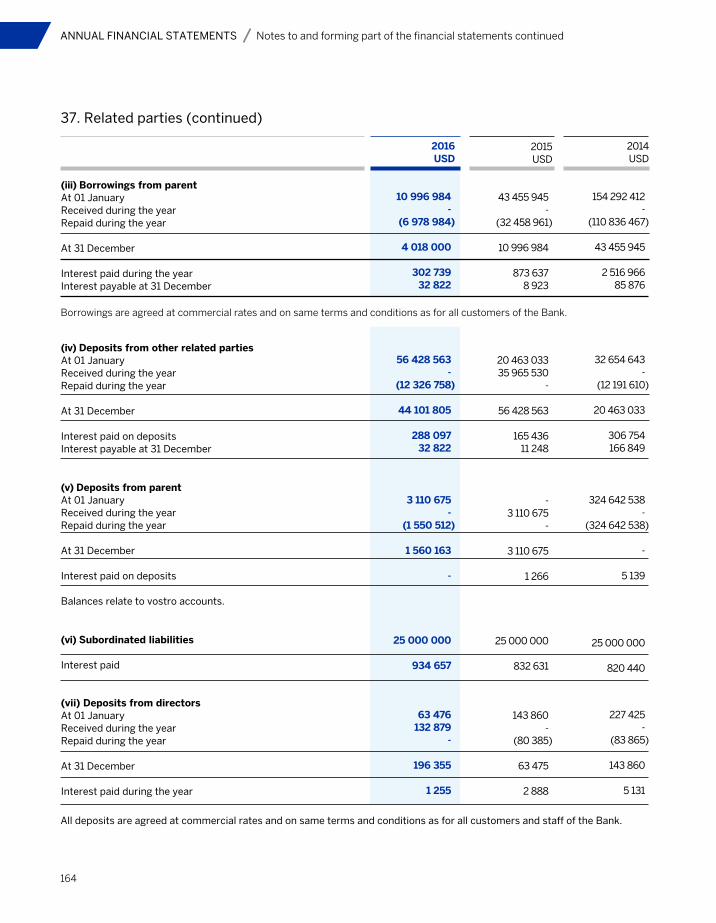
164
37. Related parties (continued)
(iii) Borrowings from parentAt 01 JanuaryReceived during the yearRepaid during the year
At 31 December
Interest paid during the yearInterest payable at 31 December
2016USD
10 996 984-
(6 978 984)
4 018 000
302 73932 822
2015USD
43 455 945-
(32 458 961)
10 996 984
873 6378 923
2014USD
154 292 412-
(110 836 467)
43 455 945
2 516 96685 876
Borrowings are agreed at commercial rates and on same terms and conditions as for all customers of the Bank.
(iv) Deposits from other related partiesAt 01 January Received during the yearRepaid during the year
At 31 December
Interest paid on depositsInterest payable at 31 December
(v) Deposits from parentAt 01 January Received during the yearRepaid during the year
At 31 December
Interest paid on deposits
Balances relate to vostro accounts.
(vi) Subordinated liabilities
Interest paid
(vii) Deposits from directors At 01 January Received during the yearRepaid during the year
At 31 December
Interest paid during the year
56 428 563-
(12 326 758)
44 101 805
288 09732 822
3 110 675-
(1 550 512)
1 560 163
-
25 000 000
934 657
63 476132 879
-
196 355
1 255
20 463 03335 965 530
-
56 428 563
165 43611 248
-3 110 675
-
3 110 675
1 266
25 000 000
832 631
143 860-
(80 385)
63 475
2 888
32 654 643-
(12 191 610)
20 463 033
306 754166 849
324 642 538-
(324 642 538)
-
5 139
25 000 000
820 440
227 425-
(83 865)
143 860
5 131
All deposits are agreed at commercial rates and on same terms and conditions as for all customers and staff of the Bank.
ANNUAL FINANCIAL STATEMENTS Notes to and forming part of the financial statements continued
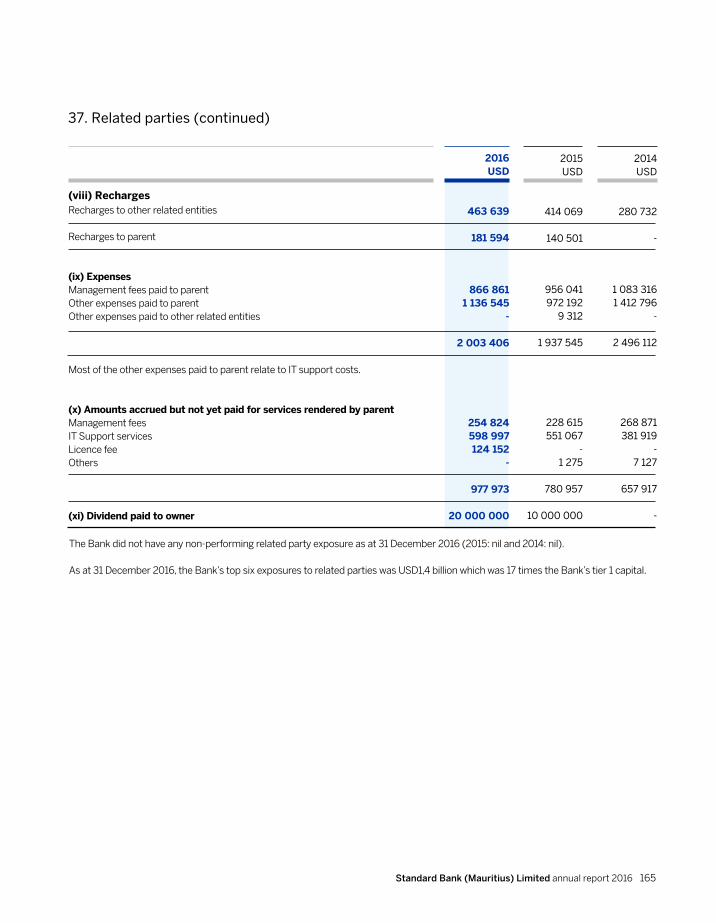
Standard Bank (Mauritius) Limited annual report 2016 165
37. Related parties (continued)
2016USD
463 639
181 594
866 8611 136 545
-
2 003 406
254 824598 997124 152
-
977 973
20 000 000
2015USD
414 069
140 501
956 041972 192
9 312
1 937 545
228 615551 067
-1 275
780 957
10 000 000
2014USD
280 732
-
1 083 3161 412 796
-
2 496 112
268 871381 919
-7 127
657 917 -
(viii) Recharges Recharges to other related entities
Recharges to parent
(ix) Expenses Management fees paid to parent Other expenses paid to parentOther expenses paid to other related entities
Most of the other expenses paid to parent relate to IT support costs.
(x) Amounts accrued but not yet paid for services rendered by parent Management feesIT Support servicesLicence feeOthers (xi) Dividend paid to owner
The Bank did not have any non-performing related party exposure as at 31 December 2016 (2015: nil and 2014: nil).
As at 31 December 2016, the Bank’s top six exposures to related parties was USD1,4 billion which was 17 times the Bank’s tier 1 capital.
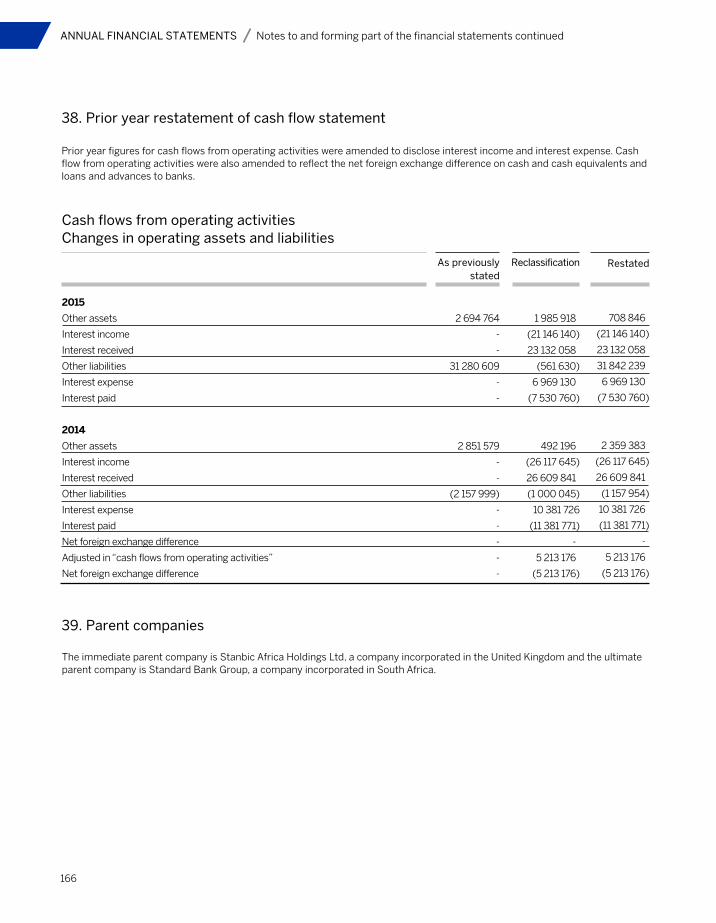
166
Prior year figures for cash flows from operating activities were amended to disclose interest income and interest expense. Cash flow from operating activities were also amended to reflect the net foreign exchange difference on cash and cash equivalents and loans and advances to banks.
38. Prior year restatement of cash flow statement
As previously stated
2 694 764
-
-
31 280 609
-
-
2 851 579
-
-
(2 157 999)
-
-
-
-
-
2015
Other assets
Interest income
Interest received
Other liabilities
Interest expense
Interest paid
2014
Other assets
Interest income
Interest received
Other liabilities
Interest expense
Interest paid
Net foreign exchange difference
Adjusted in “cash flows from operating activities”
Net foreign exchange difference
Reclassification
1 985 918
(21 146 140)
23 132 058
(561 630)
6 969 130
(7 530 760)
492 196
(26 117 645)
26 609 841
(1 000 045)
10 381 726
(11 381 771)
-
5 213 176
(5 213 176)
Restated
708 846
(21 146 140)
23 132 058
31 842 239
6 969 130
(7 530 760)
2 359 383
(26 117 645)
26 609 841
(1 157 954)
10 381 726
(11 381 771)
-
5 213 176
(5 213 176)
Cash flows from operating activitiesChanges in operating assets and liabilities
39. Parent companies
The immediate parent company is Stanbic Africa Holdings Ltd, a company incorporated in the United Kingdom and the ultimate parent company is Standard Bank Group, a company incorporated in South Africa.
ANNUAL FINANCIAL STATEMENTS Notes to and forming part of the financial statements continued