200


Our vision is to create opportunities for the future.

Before bringing life to a vision we have to see it first and for that we need people who specialize in seeing the impossible. Here at JDW, we are proud of the visionary people we have who take up the responsibility of creating opportunities for the future, not only for our Company but for the whole community we operate in.
We believe life is about the betterment of the human condition; it’s about social awareness, and random acts of kindness that weave the soul of humanity. Together, we all participate in weaving the social fabric; we should all therefore be patching the fabric when it develops holes. The change has begun, here at JDW, as we have started to unpack the challenges that encounter us, realizing that we each have a role that requires us to change and become more responsible for shaping our community and creating magic under JDW’s vision. A vision in which everyone is benefited, be it our shareholders, the farmers or you.
Ann
ual R
epor
t 201
8
01

JDW
Sug
ar M
ills
Lim
ited
02

Contents
Company Review
04 Corporate Information
06 Mission & Strategy
08 Notice of Annual General Meeting
13 Financial Performance
16 Chairman’s Review
18 Directors’ Report
30 Pattern of Shareholding
32 Categories of Shareholders
33 High Pressure Co-Generation Power Plants
34 Corporate Farming
38 Corporate Social Responsibility
Financial Statements
Unconsolidated
43 Independent Auditors’ Review Report
44 Statement of Compliance
46 Independent Auditors’ Report
52 Unconsolidated Statement of Financial Position
54 Unconsolidated Statement of Profit or Loss
55 Unconsolidated Statement of Comprehensive Income
56 Unconsolidated Statement of Cash Flow
57 Unconsolidated Statement of Changes in Equity
58 Notes to the Unconsolidated Financial Statements
Consolidated
117 Directors’ Report
119 Independent Auditors’ Report
124 Consolidated Statement of Financial Position
126 Consolidated Statement of Profit or Loss
127 Consolidated Statement of Comprehensive Income
128 Consolidated Statement of Cash Flow
129 Consolidated Statement of Changes in Equity
130 Notes to the Consolidated Financial Statements
Other Information
Investor’s Awareness
Form of Proxy
Ann
ual R
epor
t 201
8
03
Fina
ncia
l Sta
tem
ents
Oth
er In
form
atio
nC
ompa
ny R
evie
w

Corporate Information
Board of DirectorsMr. Jahangir Khan TareenDirector
Mukhdoom Syed Ahmed MahmudDirector / Chairman
Mr. Raheal MasudDirector / Chief Executive
Mrs. Samira MahmudMr. Ijaz AhmedMr. Asim Nisar BajwaMr. Qasim Hussain Safdar
Chief Operating OfficerRana Nasim Ahmed
Group Director (Finance), CFO & Company SecretaryMr. Muhammad Rafique
Audit CommitteeMr. Qasim Hussain SafdarChairman / Member
Mrs. Samira MahmudMember
Mr. Ijaz AhmedMember
HR & R CommitteeMr. Ijaz AhmedChairman / Member
Mrs. Samira MahmudMember
Mr. Asim Nisar BajwaMember / Secretary
RegistrarCorplink (Pvt.) Ltd.
JDW
Sug
ar M
ills
Lim
ited
04
Bankers Conventional The Bank of PunjabFaysal Bank LimitedMCB Bank LimitedNational Bank of PakistanAskari Bank LimitedSoneri Bank LimitedUnited Bank LimitedStandard Chartered Bank (Pakistan) LimitedAllied Bank LimitedHabib Bank LimitedHabib Metropolitan Bank Limited
IslamicNational Bank of PakistanDubai Islamic Bank Pakistan LimitedBankIslami Pakistan LimitedFaysal Bank LimitedAskari Bank Limited Bank Alfalah LimitedMeezan Bank Limited
AuditorsKPMG Taseer Hadi & Co.Chartered Accountants
Registered Office17-Abid Majeed Road, Lahore Cantonment, Lahore.
Legal AdvisorCornelius, Lane & Mufti
Ann
ual R
epor
t 201
8
05
Fina
ncia
l Sta
tem
ents
Oth
er In
form
atio
nC
ompa
ny R
evie
w
Web Presencewww.jdw-group.com
Unit-IMauza Shirin, Jamal Din Wali, District Rahim Yar Khan.
Unit-IIMachi Goth, Sadiqabad. District Rahim Yar Khan.
Unit-IIIMauza Laluwali, Near Village Islamabad, District Ghotki.
Mills
Mission• To be the market leader and a world-class organization by meeting and proactively anticipating customer
needs.
• To maximize the wealth of stakeholders by optimizing the long term returns and growth of the business.
• To be amongst the most efficient and lowest cost producers in the industry.
• To ensure a safe, harmonious and challenging working environment for the employees.
JDW
Sug
ar M
ills
Lim
ited
06

• To grow our base business in sugar and build those related activities where there is opportunity to smooth the impact of sugar price cycles.
• To produce sugar which is of highest international standards.
• To make investment in sugarcane crop to ensure regular supply of cane and profitability of growers.
• To offer equal and fair growth opportunities to all employees.
• To undertake and support community development and welfare projects in order to fulfil social commitments.
Strategy
Our Values
Innovating and improving
Protecting our people and
growers
Acting with integrity
Working together
Communityempowerment
Ann
ual R
epor
t 201
8
07
Fina
ncia
l Sta
tem
ents
Oth
er In
form
atio
nC
ompa
ny R
evie
w

Ordinary Business:
1. To confirm the minutes of last Extra Ordinary General Meeting held on November 01, 2018.
2. To receive, consider and adopt the annual audited unconsolidated and consolidated financial statements of the Company for the financial year ended on September 30, 2018 together with Directors’ and Auditors’ Reports thereon.
3. To appoint Auditors of the Company for the next financial year 2018-19 and to fix their remuneration. The retiring Auditors M/s KPMG Taseer Hadi & Co. Chartered Accountants, being eligible, have offered themselves for re-appointment as Auditors of the Company.
4. To transact any other business with permission of the Chair.
By Order of the Board
07 January 2019 (Muhammad Rafique)Lahore Company Secretary
Notice of Annual General Meeting
Notice is hereby given that 29th Annual General Meeting of JDW Sugar Mills Limited (the “Company”) will be held at Qasr-e-Zauk, 1E-3, Main Boulevard (Next to UC Hospital), Gulberg III, Lahore on Monday, January 28, 2019 at 9:30 a.m., to transact the following business:
JDW
Sug
ar M
ills
Lim
ited
08

Notes:
1) Member’s Register Closure:
The share transfer books of the Company will remain closed from 21st January, 2019 to 28th January, 2019 (both days inclusive). Transfers received in order at the Company’s Office or Shares Registrar’s Office; Messers Corplink (Private) Limited, Wings Arcade, 1-K Commercial, Model Town, Lahore by close of business on 20th January, 2019, will be treated in time and may be considered to exercise voting rights in Annual General Meeting.
2) For Attending the Meetings:
i. In case of individuals, the account holder or sub-account holder whose registration details are uploaded as per CDC Regulations, shall bring with him/her original valid CNIC or original passport at the time of attending the meeting.
ii. In case of Corporate Entity, a resolution of the Board of Directors/Power of Attorney with specimen signature of the nominee shall be produced (unless the same has been provided earlier) at the time of meeting.
iii. Members can also avail video conference facility (subject to availability of video conference facility in that city), if members collectively holding 10% or more shares are residing at that geographical location. In this regard, please fill the following and submit to Company at least 10 days before holding of the annual general meeting.
“I/we _____________ of ________________ being a member of JDW Sugar Mills Limited, holder of ___________ ordinary share(s) as per registered folio # _________________ hereby opt for video conference facility at _____________.”
3) For Appointing Proxies:
i. In case of individuals, the account holder or sub-account holder whose registration details are uploaded as per CDC Regulations shall submit the proxy form as per requirement.
ii. The Proxy form shall be witnessed by two persons, whose names, addresses and CNIC numbers shall be stated on the proxy form.
iii. Attested copies of CNICs or passports of the member, Proxy and witnesses shall be attached with the proxy form.
iv. In order to be effective, duly completed and signed proxy forms must be received at the Company’s Registered Office at least 48 hours before the time fixed for the meeting.
v. The Proxy shall produce his/her original CNIC or original passport at the time of the meeting.
vi. In case of corporate entity, a resolution of the Board of Directors/Power of Attorney with specimen signature should be submitted along with the proxy form to the Company.
vii. Form of Proxy is available on Company’s website i.e. www.jdw-group.com (in English and Urdu Language).
4) Submission of copy of Bank Mandate Form
(Mandatory):
All shareholders are requested to provide their Bank Mandate Form/Details (available on Company’s website i.e. www.jdw-group.com) to Company or Shares Registrar. Moreover, CDC shareholders are also requested to submit their complete bank mandate details to their investor accounts services or their brokers where shares are placed electronically.
5) Change of Address
Physical shareholders are requested to notify any change in their addresses to the Company or its Shares’ Registrar, Messer’s Corplink (Private) Limited. Furthermore, if not provided earlier, members holding shares in CDC/Participants accounts are also requested to update their addresses to CDC or their Participants/Stock Brokers.
6) Circulation of Annual Audited Account:
i. In compliance with Section 223(7) of the Companies Act, 2017 the audited financial statements of Company, along with relevant reports and disclosure for year ended on September 30, 2018 have been placed on the Company’s website: www.jdw-group.com for the information and review of shareholders.
ii. In compliance of SECP Notification S.R.O. No. 787(I)/2014 dated September 8, 2014 regarding provision of Annual Audited Financial Statements to shareholders via email, shareholders are requested if they wish to avail this facility please send their email ID to Company.
Ann
ual R
epor
t 201
8
09
Fina
ncia
l Sta
tem
ents
Oth
er In
form
atio
nC
ompa
ny R
evie
w

JDW
Sug
ar M
ills
Lim
ited
10

Ann
ual R
epor
t 201
8
11
Fina
ncia
l Sta
tem
ents
Oth
er In
form
atio
nC
ompa
ny R
evie
w

Rs. 41.90 billion2017-18
We Delivered as Committed
Payment to sugarcane growers on group basis
JDW
Sug
ar M
ills
Lim
ited
12

Financial Performance
Operating Results
2018 2017 2016 2015 2014 2013
Gross sales 40,251,476 49,962,325 40,122,718 34,982,617 32,327,134 28,516,197
Net sales 37,264,506 45,431,957 37,287,426 32,663,443 30,534,864 27,183,282
Cost of sales 34,148,122 40,807,425 30,832,944 27,797,896 27,306,099 23,981,411
Administrative and selling expenses 1,457,780 1,184,061 1,045,415 928,077 651,127 769,318
Finance cost 2,269,761 1,665,294 1,660,106 2,241,797 1,880,761 1,118,578
Other expenses 5,238 166,528 1,696,594 680,314 63,028 137,650
Other income (475,637) (571,049) (266,648) (195,925) (344,544) (134,507)
Profit from operations 2,129,003 3,844,992 3,979,122 3,453,081 2,859,154 2,429,410
(Loss) / profit before taxation (140,758) 2,179,698 2,319,016 1,211,285 978,394 1,310,832
(Loss) / profit after taxation (203,441) 1,588,396 2,033,932 1,517,250 979,706 924,523
(Loss) / earnings per share - basic and diluted Rs. (3.40) 26.57 34.03 25.38 16.39 15.47
Interim Dividend - cash % – 100 50 30 20 –
Final Dividend - cash % – 30 150 70 50 60
Total Dividend - cash % – 130 200 100 70 60
(Rupees in thousand)
Net Sales(Rupees in Million)
3,000
6,000
9,000
12,000
15,000
18,000
21,000
24,000
27,000
30,000
33,000
36,000
39,000
42,000
45,000
48,000
37,2
65
45,4
32
37,2
87
32,6
63
30,5
35
27,1
83
2018 2017 2016 2015Years
2014 2013
* Figures of 2017 have been restated.
Profit from Operations(Rupees in millions)
250
750
1,250
1,750
2,250
2,750
3,250
3,750
4,250
2,42
92,85
9
3,45
3
3,97
9
3,84
5
2,12
9
2018 2017 2016 2015 2014 2013Years A
nnua
l Rep
ort 2
018
13
Fina
ncia
l Sta
tem
ents
Oth
er In
form
atio
nC
ompa
ny R
evie
w

Financial Performance
Sucrose Recovery(%age)
9.0
9.5
10.0
10.5
11.0
11.5
12.0
11.3
5
10.8
611.0
2
10.9
4
10.2
710.5
5
2018 2017 2016 2015 2014 2013Years
Sugar Production(M. Tons)
100,000
200,000
300,000
400,000
500,000
600,000
700,000
800,000
900,000
1,000,000
888,711
813,406
602,878
563,819
603,835
538,381
2018 2017 2016 2015Years
2014 2013
Molasses Recovery(%age)
0.05
0.55
1.05
1.55
2.05
2.55
3.05
3.55
4.05
4.55
5.05
5.55
3.97
4.29
4.03
4.084.
39
5.04
2018 2017 2016 2015 2014 2013Years
Finance Cost(Rupees in Million)
250
750
1,250
1,750
2,250
2,750
2,27
0
1,66
5
1,66
0
2,24
2
1,88
1
1,11
9
2018 2017 2016 2015Years
2014 2013
JDW
Sug
ar M
ills
Lim
ited
14

2018 2017 2016 2015 2014 2013
Unit - I
Sugar production M.Tons 409,507 357,733 280,418 277,155 312,746 289,147
Sugar recovery % age 10.91 10.14 10.99 11.19 10.91 11.40
Molasses production M.Tons 177,607 154,437 101,604 97,400 123,377 99,001
Molasses recovery % age 4.73 4.38 3.98 3.93 4.30 3.90
Unit - II
Sugar production M.Tons 255,879 247,926 169,872 135,102 128,421 114,516
Sugar recovery % age 10.54 10.45 10.99 10.59 10.83 11.36
Molasses production M.Tons 133,267 110,324 68,207 54,841 52,304 41,384
Molasses recovery % age 5.49 4.65 4.41 4.30 4.41 4.11
Unit - III
Sugar production M.Tons 223,325 207,747 152,588 151,562 162,668 134,718
Sugar recovery % age 9.97 10.30 10.78 11.10 10.81 11.22
Molasses production M.Tons 113,728 83,072 55,150 54,093 62,572 48,155
Molasses recovery % age 5.08 4.12 3.90 3.96 4.16 4.01
JDW Sugar Mills Limited
Sugar production M.Tons 888,711 813,406 602,878 563,819 603,835 538,381
Sugar recovery % age 10.55 10.27 10.94 11.02 10.86 11.35
Molasses production M.Tons 424,602 347,833 224,961 206,334 238,253 188,539
Molasses recovery % age 5.04 4.39 4.08 4.03 4.29 3.97
Production Data
Ann
ual R
epor
t 201
8
15
Fina
ncia
l Sta
tem
ents
Oth
er In
form
atio
nC
ompa
ny R
evie
w

JDW Sugar Mills Limited complies with all the requirements set out in the Companies Act, 2017 (‘‘the Act’’) and the Listed Companies (Code of Corporate Governance) Regulations, 2017 (‘‘the CCG’’) with respect to the composition, procedures and meetings of the Board of Directors and its committees. As required under CCG, an annual evaluation of the Board of the Directors (‘‘the Board”) of JDW Sugar Mills Limited (‘‘the Company”) is carried out. The purpose of this evaluation is to ensure that the Board’s overall performance and effectiveness is measured and benchmarked against expectations in the context of objectives set for the Company. Areas, where improvements are required, are duly considered and action plans are framed and implemented.
For the Purpose of Board evaluation, a comprehensive criteria has been developed. The Board has recently completed its annual self-evaluation for the year ended September 30, 2018 and I report that:
• The overall performance of the Board measured on the basis of approved criteria for the year was satisfactory.
• The overall assessment, as satisfactory, is based on an evaluation of the following integral components, which have a direct bearing on the Board’s role in achievement of Company’s objectives:
The Board members are familiar with the current vision, mission and values and support them. The Board revisits the mission and vision statement from time to time. The Board has a clear understanding of the stakeholders (shareholders, customers, employees, vendors, society at large) whom the Company serves. The Board has a strategic vision of how the Organization should evolve over the next three to five years. Further, the Board sets annual goals and targets for the management in all major performance areas.
The Board members diligently performed their duties and thoroughly reviewed, discussed and approved business strategies, corporate objectives, budget plans, financial statements and other reports. It received clear and succinct agendas and supporting written material in sufficient time prior to Board and committee meetings. The Board met frequently enough to adequately discharge its responsibilities. The Board remained updated with respect to achievement of Company’s objectives, goals, strategies and financial performance through regular presentations by the management, internal and external auditors and other independent consultants. The Board provided appropriate direction and oversight on a timely basis.
The Board members effectively bring diversity to the Board and constitute a mix of Independent and Non-Executive Directors. The Non-Executive and Independent Directors were equally involved in important Board decisions. The Board has effectively set the tone at the top, by putting in place a transparent and robust system of governance. This is reflected by setting up an effective control environment, compliance with best practices of CCG and by promoting ethical and fair behaviour across the Company.
07 January 2019 ChairmanLahore
Chairman’s ReviewOn Board’s overall Performance u/s 192 of the Companies Act, 2017
JDW
Sug
ar M
ills
Lim
ited
16

Ann
ual R
epor
t 201
8
17
Fina
ncia
l Sta
tem
ents
Oth
er In
form
atio
nC
ompa
ny R
evie
w

Directors’ Report
The Directors take pleasure in presenting the Company’s 29 Annual Report together with the Audited Accounts for the year ended 30 September 2018.
OverviewJDW Sugar Mills Limited (“the Company”) was incorporated in Pakistan on 31 May 1990 as a private limited company and was subsequently converted into a public limited company on 24 August 1991. Shares of the Company are listed on the Pakistan Stock Exchange Limited. The registered office of the Company is situated at 17 - Abid Majeed Road, Lahore Cantonment, Lahore. The principal activity of the Company is production and sale of crystalline sugar, electricity and managing corporate farms.
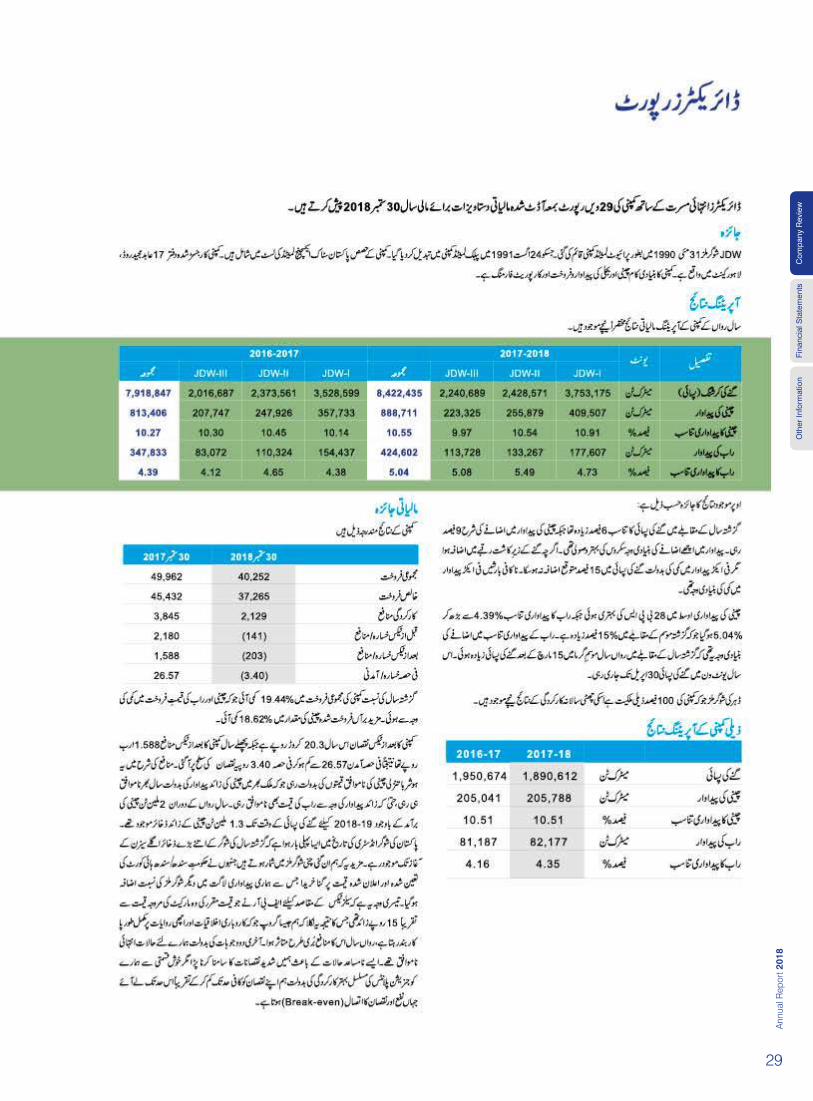
Operating ResultsThe operating and financial results for the year under review are summarized below:
Description Units2017-18 2016-17
JDW-I JDW-II JDW-III Combined JDW-I JDW-II JDW-III Combined
Sugarcane Crushed M.Tons 3,753,175 2,428,571 2,240,689 8,422,435 3,528,599 2,373,561 2,016,687 7,918,847
Sugar Production M.Tons 409,507 255,879 223,325 888,711 357,733 247,926 207,747 813,406
Sucrose Recovery %age 10.91 10.54 9.97 10.55 10.14 10.45 10.30 10.27
Molasses Production M.Tons 177,607 133,267 113,728 424,602 154,437 110,324 83,072 347,833
Molasses Recovery %age 4.73 5.49 5.08 5.04 4.38 4.65 4.12 4.39
The comments on above operating results are as under:
• Sugarcane crushed this time was 6% higher than last crushing season whereas increase in sugar production was 9% caused by slightly better sucrose recovery. Though there was increase in area under cultivation but due to low yield per acre experienced by the growers the expected increase in cane crushing of about 15% could not be achieved. Inadequate rains were the main reason which resulted in low yield per acre this time.
• Average sucrose recovery achieved this time was 28 bps higher whereas molasses recovery registered increase from 4.39% to 5.04% which is 15 % higher than the last crushing season. Increase in molasses recovery is mainly because of crushing of more cane in summer period beyond 15th March compared to last season. Crushing in unit I this time went up to 30th April.
Deharki Sugar Mills (Private) Limited being 100 % owned subsidiary of the Company has achieved the following operating results in its 7th year of its operation:
JDW
Sug
ar M
ills
Lim
ited
18

Ann
ual R
epor
t 201
8
19
Fina
ncia
l Sta
tem
ents
Oth
er In
form
atio
nC
ompa
ny R
evie
w

Operating Results – Subsidiary Company
30 Sep 18 30 Sep 17
Sugarcane Crushed M.Tons 1,890,612 1,950,674Sugar Production M.Tons 205,788 205,041Sucrose Recovery %age 10.51 10.51Molasses Production M.Tons 82,177 81,187Molasses Recovery %age 4.35 4.16
Financial OverviewAn analysis of the key operating results of the Company is given below: (Rs. in million) 30 Sep 18 30 Sep 17 Restated
Gross Sales 40,252 49,962 Net Sales 37,265 45,432 Operating Profit 2,129 3,845(Loss) / Profit before Tax (141) 2,180(Loss) / Profit after Tax (203) 1,588 (Loss) / Earnings per Share (3.40) 26.57
• The gross turnover of the company has dropped by 19.44% over last year which is due to decrease in average selling prices of sugar & molasses and 18.62% reduction in the sales quantity of sugar.
• The Company has earned loss after tax amounting to Rs. 203 million as compared to profit after tax of Rs. 1,588 million in the last year, resultantly earnings per share has reduced from Rs. 26.57 to loss per share amounting to Rs. 3.40. This substantial decline in profitability was caused by unfavourable sugar prices which remained unfavourable throughout the year due to surplus availability of sugar in the country. Even the prices of molasses were not favourable due to more production. Despite export of 2.0 million tons of sugar during the year under review there was still a surplus of 1.3 million tons of sugar stocks available just before start of crushing season 2018-19. This is the highest ever carried forward sugar stock in the history of sugar industry in Pakistan. Secondly, we were among the very few mills in Pakistan who purchased sugarcane at support/notified prices announced by the provincial government/Sindh High Court which increased our production cost as compared to rest of the Mills. Thirdly, sugar price rate fixed by the FBR for sales tax purposes was higher by approx. Rs. 15 per kg than the actual market price which for a group like us which is fully compliant to all the good business ethics & practices had adversely affected our profitability in the current year. Considering the last two reasons there was no level playing field for us. Under these adverse conditions we projected heavy losses in the
current year but fortunately due to continuous better performance of our co-generation plants we have been able to substantially reduce our losses and brought these losses down to almost a break-even level.
• Financial cost of the Company increased by Rs. 604 million in the current year due to carryover of more unsold stocks, non-receipt of export subsidies from Federal & Provincial Governments and increase in receivables from CPPA-G on account of export of electricity which caused more utilization of working capital lines in the current year to meet working capital requirements. Substantial increase in KIBOR was another reason for increase in the financial charges.
• Increase in selling expenses is attributable to freight charges on sugar exports and substantial increase in other income is majorly due to foreign exchange gain and profit on sale of operating fixed assets.
• In view of the above referred financial results all key financial covenants’ have shown slight deterioration as compared to comparative year end. The Company is fulfilling it’s all financial obligations on time and enjoys cordial relationship with all the financial institutions it’s dealing with.
• Honorable Sindh High Court had provided relief to the Mills in Sindh by reducing the sugarcane purchase rate from Rs. 182 per 40 kg to Rs. 172 per 40 kg from 23 December, 2017 for the crushing season 2017-18 through its order C.P.No.D-8666 of 2017. On 30 January 2018, Honorable Sindh High Court had further reduced the rate from Rs. 172 per 40 kg to Rs. 160 per 40 kg for the crushing season 2017-18 through its final order C.P. No.D-8666 of 2017, 7951 of 2017, 219 of 2018 and 440 of 2018 and stands modified the earlier order of December 2017. The group has strictly followed court orders for purchase and payment of sugarcane for its units located in the province of Sindh. Sugarcane support price of Rs. 180 per 40 kg remained unchanged in the province of Punjab.
• In view of the expected higher sugar production and carryover sugar stocks in the country the Federal Govt. allowed in December 2017 export of 2,000,000 tons of sugar for crushing season 2017-18 with freight support of Rs. 10.70/kg subject to the condition that the said amount of freight support will be given on a sliding scale between the international price of US$376/MT and $499/MT, i.e. once the price reaches at the level of $499/MT in international market, the State Bank of Pakistan would affect the stoppage of the freight support. Freight support will be shared by federal and provincial government on 50:50 basis. The Company has made highest export of sugar in
Directors’ Report
JDW
Sug
ar M
ills
Lim
ited
20

Ann
ual R
epor
t 201
8
21
Fina
ncia
l Sta
tem
ents
Oth
er In
form
atio
nC
ompa
ny R
evie
w

the country in accordance with SBP approved quota and on group basis company has made sugar export of 208,665 tons but substantial amount approx. Rs. 1.7 billion of subsidy from SBP is still receivable. On overall sugar industry basis approx. Rs. 13 billion is stuck up on account of export subsidy which has pushed the industry into severe cash flow problems making it difficult for the industry to clear growers’ payments.
• To bailout the sugar industry, Sindh Government also approved in its provincial cabinet meeting an additional export subsidy of Rs. 9.30/kg on export of sugar. This relief was restricted to export of 20,000 tons of sugar for each mill located in the province which has been received by us for sugar units located in the province of Sindh.
• There has been no improvement in the case of amount due from TDAP on account of Inland Freight Subsidy of Rs. 306 million for JDWSML and DSML which is still awaited. Company has completed all its formalities relating to documentation and in certain cases instructions to banks were also issued by TDAP to release payments but as of today not a single payment has so far been received. On overall industry basis an amount of Rs. 2.6 billion is stuck up since last more than six years.
• The statements of financial position size has increased from Rs. 42 billion to Rs. 58 billion. Accumulated reserves are now nearly 13 times of the paid up capital of the Company. If you look at the track record of dividend payouts of the Company you will find that except for two
years i.e. 2006-07 & 2017-18 Company was making regular payment of dividend since 2000-01.
• The year under review was a very difficult year due to surplus sugar production, most unfavourable sugar prices ever experienced in the past and inadequate permission for export of sugar by the Govt. The Government of Punjab was unable to enforce its own declared support price of sugarcane and majority of the mills purchased sugarcane at prices most suited to them which resulted in heavy losses to the growers. There was no proper check on evasion of sales tax which created lot of problems for the reason that huge quantity of sugar remained out of the system and resulted in depressing the sugar prices and carrying over huge unsold sugar stocks of 1.3 million tons as stated above. Imposition of 15% Regulatory Duty by the previous Governments on export of molasses is causing loss to each mill having no distillery set up which is discriminately and not giving level playing field. Abolishing of Regulatory Duty on export of molasses would help the sugar industry to get better prices of molasses.
Other points of your interest are summarized below:• The Company is working at developing its capacity
to store molasses in molasses tanks made of steel structure instead of in the open pits. During the year, more molasses tanks were added in the system. The Company now has storage capacity of approx. 200,000 tons of molasses in the steel made tanks. This investment in molasses tanks would give more
Directors’ Report
JDW
Sug
ar M
ills
Lim
ited
22

flexibility to the Company to store certain quantity of molasses beyond summer season and to sell them during period from July to October every year when molasses prices are always better compared to rest of the year. Our ultimate target on group basis for next few years is to finish the concept of storing molasses in the open pits.
• As usual growers’ payment has remained our top priority and for crushing season 2017-18 growers payments of approx. Rs. 41.90 billion on group basis were fully settled latest by May 31, 2018 despite difficulty of stuck up of huge amounts mentioned above. The Company has also financially supported its growers by providing them agri loans in the form of seeds, fertilizers, pesticides and agri implements etc.
Future Outlook• The crushing season 2018-19 started in the 2nd
week of December, 2018 and on group basis up to 06th January 2019, the Company produced 218,925 tons of sugar with average sucrose recovery of 10.37%. Crop size this time is approx. 25% lesser
not viable for any sugar mills to avail export quota in the presence of surplus sugar available. Subsequently in December 2018 Federal Government increased the sugar export quota from 1,000,000 tons to 1,100,000 tons without any condition of start of crushing season and advised the sugar industry to seek subsidies on export from the relevant province. The Govt. of Punjab has recently approved export subsidy of Rs. 5.35 per kg on certain quantity, notification of which is still awaited. We are expecting that Sindh province will also allow export subsidy to sugar mills located there.
• In view of permission for export of 1,100,000 tons of sugar, the ex-factory sugar price has increased and better prices are expected this year. Because of expected lower production of molasses the prices for this by-product have also improved. Trend of sucrose recoveries being achieved by us is also favorable. In view of these factors we are expecting 2018-19 a profitable year. We are maintaining continued good performance and want to focus more on value addition of by-products, making processes more efficient and saving more bagasse from the system.
Relationship with Growers• The Company enjoys cordial relationship with the
farmers’ community as it considers the growers to be its backbone. To maintain and further strengthen the relationship, the Company as a matter of principle gives priority and endeavours to;
• Consistently follow the policy of timely payments of sugarcane to growers.
• Fulfill farmers’ financial requirements by providing them financial assistance from own sources & and also through different financial schemes of National Rural
Support Programme (NRSP). During period under review, huge amount of agri loans were advanced to growers in the form of cash, seed, turbines, fertilizers and pesticides.
• Enhance technical skills through various extension and advisory programs.
• Provide better quality and better yield varieties of sugarcane resulting in increased productivity in sugarcane yield per acre.
and yield per acre being reported by growers is also less. However, sucrose recoveries are better than last crushing season. In view of these factors the Company is expecting at least 30% reduction in its sugar production this year.
• For current crushing season 2018-19, notified support prices of sugarcane are Rs. 180 per 40 kg in Punjab and Rs. 182 per 40 kg in the Province of Sindh.
• In view of the huge carry over sugar stocks of approx.
1.3 million tons in the country and expected sugar production during 2018-19 which would be sufficient to meet country’s requirement the Federal Govt. has allowed in October 2018 export of 1,000,000 tons of sugar without any export subsidy with restriction to start crushing season on 15 November, 2018, which was
Corporate and Financial Reporting FrameworkThe Directors are pleased to state that the Company is compliant with the provisions of the Listed Companies (Code of Corporate Governance) Regulations, 2017 (‘‘the CCG’’) as required by Securities & Exchange Commission of Pakistan (SECP).
Following are the statements on Corporate and Financial Reporting Framework; • The financial statements present fairly the state of
affairs of the Company, the results of its operations, cash flows and changes in equity;
Ann
ual R
epor
t 201
8
23
Fina
ncia
l Sta
tem
ents
Oth
er In
form
atio
nC
ompa
ny R
evie
w

• Proper books of accounts of the Company have been maintained;
• Accounting policies as stated in the notes to the financial statements have been consistently applied in preparation of financial statements and accounting estimates are based on reasonable prudent judgment;
• International Financial Reporting Standards, as applicable in Pakistan and the requirements of Companies Act, 2017 have been followed in preparation of the financial statements;
• The system of internal control is sound in design and has been effectively implemented and monitored;
• There are no doubts about the Company’s ability to continue as going concern;
• There has been no material departure from the best practices of corporate governance as detailed in the listing regulations;
• A statement regarding key financial data for the last six years is annexed to this report;
• Information about taxes and levies is given in the notes to the financial statements.
• There is no likelihood of any delayed payments or default in respect of all loans availed by the Company.
• During the year, 17 (seventeen) Board meetings were held. The minutes of the meetings were appropriately recorded and circulated. The attendance of the Directors in the above said meetings are mentioned as follows:
Sr. No. Name of Directors Designation Meetings
Attended
1 Mr. Jahangir Khan Tareen
Executive Director 17
2 Mukhdoom Syed Ahmed Mahmud
Chairman / Non-Executive Director
12
3 Mrs. Samira Mahmud Non-Executive Director 11
4 Mr. Ijaz Ahmed Non-Executive Director 17
5 Mr. Raheal Masud CEO / Executive Director 17
6 Mr. Asim Nisar Bajwa
Independent Director 15
7 Mr. Qasim Hussain Safdar
Independent Director 17
8 Mr. Zafar Iqbal Non-Executive Director 1
Directors who could not attend Board meetings due to their pre-occupations were granted leave of absence.
During the year, Mr. Asim Nisar Bajwa resigned from the position of Non-Executive Director on 19-Sep-18, in order to fill casual vacancy, Board of Directors appointed Mr. Zafar Iqbal as Non-Executive Director on 28-Sep-18, subsequent to year end, Mr. Asim Nisar Bajwa has been elected as Independent Director by Board of Directors and Mr. Zafar Iqbal stood retired from the Position of Non- Executive Director on 01-Nov-18.
Audit CommitteeThe Board has constituted an Audit Committee consisting of three members including Chairman of the Committee. The committee regularly meets as per requirement of the code. The committee assists the Board in reviewing internal audit manual and internal audit system.
Human Resource and Remuneration CommitteeThe Board has constituted a Human Resource and Remuneration Committee in compliance with the CCG.
Directors’ Remuneration The remuneration of a Director is approved by the Board of Directors. However, in accordance with the CCG, it is ensured that no Director takes part in deciding his own remuneration. Non-Executive Directors are paid remuneration with view of attracting and retaining Directors needed to govern the Company successfully. However, no such remuneration is set at a level that could be perceived to compromise their independence. No meeting fee was paid to any Director. For information on remuneration of Directors and CEO, please refer relevant notes to the financial statements.
Directors’ Training ProgramAs required by the CCG, Company had conducted professional training for its Directors.
Composition of BoardThe total number of directors are 7 as per the following:
a) Male: 06b) Female: 01
The composition of the Board is as under:
Directors’ Report
JDW
Sug
ar M
ills
Lim
ited
24

Category Names
Independent Directors Mr. Asim Nisar Bajwa Mr. Qasim Hussain Safdar
Executive Directors Mr. Jahangir Khan Tareen Mr. Raheal Masud
Non-Executive Directors Mukhdoom Syed Ahmed Mahmud Mrs. Samira Mahmud Mr. Ijaz Ahmed
Subsequent Events / Material Changes Except as disclosed, there were no material changes or commitments which have occurred between the end of financial year of the Company to which the financial statements relate and the date of the report.
Adequacy of Internal Financial Controls The Directors are aware of their responsibility with respect to internal financial controls. Through discussions with management and Auditors (both internal and external), they confirm that adequate controls have been implemented by the Company.
Pattern of ShareholdingThere were 1,189 shareholders of the Company as of 30 September 2018. A statement of pattern of shareholding is enclosed in this report.
Statement of transaction in shares of the Company by the Directors, CEO, CFO and Company Secretary and their spouses and minor children during the year is enclosed in this report.
Environmental Policy The Company has a comprehensive policy that is in strict compliance with relevant environmental protocols.
Principal RisksFollowing are the principal risks faced by the Company;
• Depressed Sugar Sales Prices
• Higher Sugarcane Procurement Prices
• Borrowing Costs
• Foreign Currency Fluctuations
• Delay in Payments of Government Subsidies
Value of Provident Fund & Gratuity Fund InvestmentsThe Company operates a recognized provident fund scheme covering its eligible permanent employees. Equal monthly contributions to the fund are made both by the Company and its employees in accordance with Fund’s Rules. As per audited accounts of the Employees Provident Fund the value of its investments as on 30 June 2018 is aggregating to Rs. 492 million (2017: Rs. 502 million).
The Company also operates an approved funded Gratuity Fund Scheme covering all its eligible permanent employees in accordance with Gratuity Fund Rules. The value of its investments as on 30 June 2018 is aggregating to Rs. 87 million (2017: Rs. 97 million).
National ExchequerThe Company contributed a sum of Rs. 3,659 million (2017: Rs. 5,137 Million) approximately to the national exchequer in the form of taxes & duties during the year under review.
Corporate Social Responsibility ActivitiesThe Company undertook the Corporate Social Responsibility Activities which are discussed in detail at pages from 38 to 40 during the period under review.
AuditorsThe present auditors M/s. KPMG Taseer Hadi & Co., Chartered Accountants retired and have offered themselves for re-appointment.
AcknowledgementThe Directors would like to express their appreciation for the dedication and hard work of the workers, staff and members of the management team. Growers are the key element of our industry and we thank them for their continued co-operation. The Directors of the Company are also thankful to the banks, financial institutions and leasing companies for the financial assistance and co-operation, which they have extended to the Company.
Chief Executive Director
07 January 2019 Lahore
Ann
ual R
epor
t 201
8
25
Fina
ncia
l Sta
tem
ents
Oth
er In
form
atio
nC
ompa
ny R
evie
w

JDW
Sug
ar M
ills
Lim
ited
26

Ann
ual R
epor
t 201
8
27
Fina
ncia
l Sta
tem
ents
Oth
er In
form
atio
nC
ompa
ny R
evie
w

JDW
Sug
ar M
ills
Lim
ited
28
Ann
ual R
epor
t 201
8
29
Fina
ncia
l Sta
tem
ents
Oth
er In
form
atio
nC
ompa
ny R
evie
w

Pattern of Shareholdingthe Companies Act, 2017 (Section 227(2)(f)
Shareholding 2.2 No. of Shareholders From To Total Shares Held
325 1 100 9,668 403 101 500 125,332 88 501 1,000 68,274 286 1,001 5,000 466,896 21 5,001 10,000 152,355 12 10,001 15,000 154,573 6 15,001 20,000 114,947 4 20,001 25,000 94,023 4 25,001 30,000 112,606 2 30,001 35,000 63,578 1 35,001 40,000 37,211 2 40,001 45,000 85,825 2 45,001 50,000 97,000 1 55,001 60,000 55,311 2 60,001 65,000 126,927 1 70,001 75,000 72,150 2 75,001 80,000 156,540 2 105,001 110,000 212,473 2 110,001 115,000 229,551 1 115,001 120,000 117,407 1 190,001 195,000 192,548 2 195,001 200,000 400,000 1 205,001 210,000 208,167 1 345,001 350,000 348,494 1 365,001 370,000 367,327 1 530,001 535,000 533,223 1 650,001 655,000 651,864 1 775,001 780,000 775,378 1 795,001 800,000 800,000 1 1,425,001 1,430,000 1,430,000 1 1,495,001 1,500,000 1,500,000 1 1,700,001 1,705,000 1,703,281 1 2,120,001 2,125,000 2,123,648 1 2,140,001 2,145,000 2,143,648 1 2,215,001 2,220,000 2,216,145 1 2,285,001 2,290,000 2,285,636 1 2,935,001 2,940,000 2,937,381 1 2,955,001 2,960,000 2,957,342 1 6,705,001 6,710,000 6,706,988 1 11,095,001 11,100,000 11,099,012 1 15,840,001 15,845,000 15,843,932 1,189 59,776,661
1.1 Name of the Company JDW SUGAR MILLS LIMITED
2.1 Pattern of holding of the shares held by the shareholders as at 30-09-2018
JDW
Sug
ar M
ills
Lim
ited
30

2.3 Categories of shareholders Shares Held Percentage
2.3.1 Directors, Chief Executive Officer, 31,588,575 52.8443% and their spouse and minor children 2.3.2 Associated Companies, - 0.0000% undertakings and related parties. (Parent Company) 2.3.3 NIT and ICP 19,965 0.0334% 2.3.4 Banks Development 46,196 0.0773% Financial Institutions, Non Banking Financial Institutions. 2.3.5 Insurance Companies - 0.0000% 2.3.6 Modarabas and Mutual Funds 8,150 0.0136% 2.3.7 Shareholders holding 10% or more 36,783,213 61.5344% 2.3.8 General Public a. Local 22,766,909 38.0866% b. Foreign - 0.0000% 2.3.9 Others (to be specified) Joint Stock Companies 2,337,208 3.9099% Investment Companies 2,085 0.0035% Foreign Companies 3,007,145 5.0306% Others 428 0.0007%
Ann
ual R
epor
t 201
8
31
Fina
ncia
l Sta
tem
ents
Oth
er In
form
atio
nC
ompa
ny R
evie
w
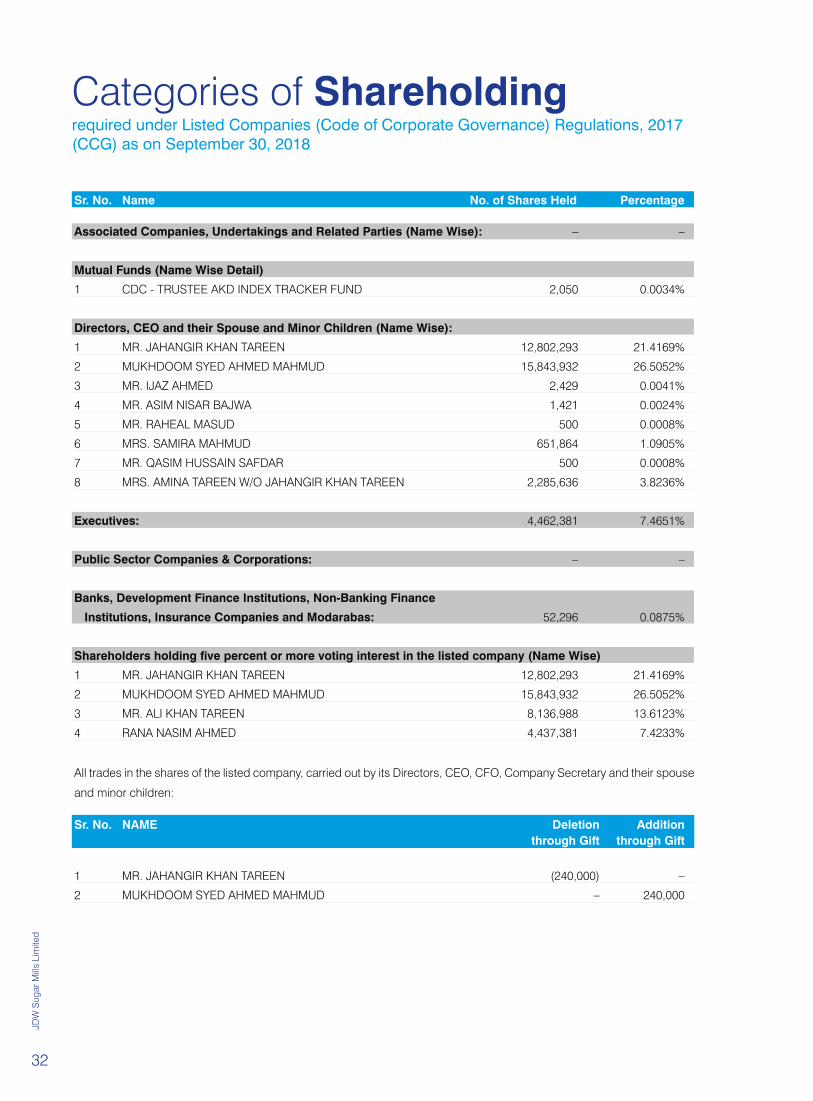
Categories of Shareholdingrequired under Listed Companies (Code of Corporate Governance) Regulations, 2017 (CCG) as on September 30, 2018
Sr. No. Name No. of Shares Held Percentage
Associated Companies, Undertakings and Related Parties (Name Wise): – –
Mutual Funds (Name Wise Detail)
1 CDC - TRUSTEE AKD INDEX TRACKER FUND 2,050 0.0034%
Directors, CEO and their Spouse and Minor Children (Name Wise):
1 MR. JAHANGIR KHAN TAREEN 12,802,293 21.4169%
2 MUKHDOOM SYED AHMED MAHMUD 15,843,932 26.5052%
3 MR. IJAZ AHMED 2,429 0.0041%
4 MR. ASIM NISAR BAJWA 1,421 0.0024%
5 MR. RAHEAL MASUD 500 0.0008%
6 MRS. SAMIRA MAHMUD 651,864 1.0905%
7 MR. QASIM HUSSAIN SAFDAR 500 0.0008%
8 MRS. AMINA TAREEN W/O JAHANGIR KHAN TAREEN 2,285,636 3.8236%
Executives: 4,462,381 7.4651%
Public Sector Companies & Corporations: – –
Banks, Development Finance Institutions, Non-Banking Finance
Institutions, Insurance Companies and Modarabas: 52,296 0.0875%
Shareholders holding five percent or more voting interest in the listed company (Name Wise)
1 MR. JAHANGIR KHAN TAREEN 12,802,293 21.4169%
2 MUKHDOOM SYED AHMED MAHMUD 15,843,932 26.5052%
3 MR. ALI KHAN TAREEN 8,136,988 13.6123%
4 RANA NASIM AHMED 4,437,381 7.4233%
All trades in the shares of the listed company, carried out by its Directors, CEO, CFO, Company Secretary and their spouse
and minor children:
Sr. No. NAME Deletion Addition through Gift through Gift
1 MR. JAHANGIR KHAN TAREEN (240,000) –
2 MUKHDOOM SYED AHMED MAHMUD – 240,000
JDW
Sug
ar M
ills
Lim
ited
32

High Pressure Co-Generation Power Plants
2018, was another satisfactory year for the pioneering Co-Generation projects which effectively achieved its generation capacity levels, maintaining it throughout the year. The plants ran smoothly contributing its share to the National Grid.
The first 26.6 MW power plant at JDW Unit-II, Sadiqabad, District Rahim Yar Khan, Punjab achieved Commercial Operations Date (COD) on June 12, 2014 after completing all independent testing and certification requirements, while the second 26.8 MW plant at JDW Unit-III, District Ghotki, Sindh achieved COD on October 3, 2014.
Both power plants are fully operational and supplying affordable and renewable electricity under Energy Purchase
Agreements executed with National Transmission & Despatch Company Limited (“NTDC”) through the Central Power Purchasing Agency (Guarantee) Limited (“CPPA-G”). The plants efficiently utilize indigenous bagasse as fuel, which besides being environment friendly, also has the major benefit of saving precious foreign exchange for the country compared to imported fuels such as furnace oil or imported coal.
The Company’s power plants are the first to materialize under NEPRA’s upfront bagasse tariff. As various other sugar mills are now following suit, it is hoped that the Company’s initiatives will serve as a catalyst for the realization of the sugar industry’s 2,500 MW power potential.
Ann
ual R
epor
t 201
8
33
Fina
ncia
l Sta
tem
ents
Oth
er In
form
atio
nC
ompa
ny R
evie
w

Human resource is undoubtedly the backbone of our industry business. With sound farming knowledge, distinctive agronomic strategies and modern machinery, our people help us building highly efficient and eco-friendly farms with higher yields. Our innovative farming techniques have also led us to build the capacity of existing farmers resulting in improved and reliable cane supply to JDW.
JDW believes in investing in our future by undertaking large scale research and development activities such as:
• Varietal screening and selection;• Soil and water testing laboratory;• Bio-laboratory facility;• Hot water treatment facility (Disease free Seed Screening Program);• Transfer of technology;• Application of GIS (Computerized Geographic Information
System); and• Application of precision agriculture methodologies
Automation and MechanizationLarge scale farming operations cannot be managed effectively without mechanization. We have managed to
Corporate Farming
acquire latest tractors and other farming equipment’s from local as well as foreign sources. In addition to that, we have rationalized farm layouts and combined the traditional farming techniques with newly acquired technologies to achieve maximum yield in the region. Few of our mechanized operations are given below: -
• Using semi-mechanized planting techniques;• Fertilizing (2 and 3 row coulter applicators);• Magnum 340 HP tractors with GPS Scrappers for
levelling;• Magnum 340 HP tractors with GPS enable Ecolotiger
Cultivation;• Puma 140 HP tractors with hydraulic tilting blade to
make drains;• CNH 140 HP tractors for Zonal Ripper;• Gypsum spreaders;• Inter row herbicide sprayers;• High clearance tractor spraying;• Granular pesticide applicator;• Harvesting;• Designing and manufacturing of stubble cultivator or
bed degenerator to replace rotavater: and • Well-equipped workshop for high tech maintenance.
JDW
Sug
ar M
ills
Lim
ited
34

Precision AgriculturePrecision Agriculture (PA) is the act of managing different land variables using latest technology such as Global Positioning Systems (GPS), Geographic Information Systems (GIS), Remote Sensing (RS) and Yield Mapping. Adoption of PA practices can improve the efficiency and profitability of farming operations to a great extent. Under the supervision of foreign consultants, our engineering team is making full use of these techniques to achieve higher yield at lower costs.
Sustaining Field Operations by Replacing Rotary HOE with Stumble Cultivator:Designing and fabrication of bed degenerator at site workshop is now ready to work in the fields. This will create revolution in term of time and energy saving in offset and seed bed operations. Replacement of rotary hoe will stop deterioration of soil structure which leads to improve soil by maintaining soil porosity, water holding capacity, soil drainage and reduction of surface sealing.
Crop Varieties:Cultivating the right variety is imperative to sustainable and competitive farming. At JDW we have developed our own sugarcane varieties using conventional sugarcane breeding and selection processes. Parents with valuable traits are used for cross-pollination and are selected from our germplasm collection. This collection includes local selected varieties, clones from previous crosses and wild and foreign varieties. Local varieties are taken as parent material with sugarcane flower forcing. JDW got new seedling with local crosses to have better adoptive new cultivars. Further selection is underway from local crossed seedlings.
Pest and Diseases:Due to the inherent nature of sugarcane crop, pest and disease outbreaks like red rot, pokah, sugarcane pyrilla are a common feature. Also since the majority of our cane growing area lies along the Indus River there is a greater risk of presence of harmful weeds and herbs. JDW has established a separate bio-lab with a team of entomologists keeping a continuous check on the pest and disease situation and other entomological challenges common to sugarcane cultivation.
Ann
ual R
epor
t 201
8
35
Fina
ncia
l Sta
tem
ents
Oth
er In
form
atio
nC
ompa
ny R
evie
w

Production of disease free seed for corporate farms and local growers.
Production of certified seed (Disease free seed playing vital role in sugar industry).Recent tests revealed ratoon stunting RSD and White leaf disease WLD is found common in commercial cultivars of the area. In this scenario seed certification is important to keep sustain cane production through these locally adopted cultivars.
Weed Management:Creeping weeds like morning glory and twine vine is going to be a serious problem among farms. These weeds were introduced around flood areas around Indus river bank in 2010. A serious efforts of herbicide trials are underway to control and check the further spread of these weeds. JDW
is making long- and short-term strategy to overcome this problem.
Hot Water Treatment (HWT) Facility:Hot water treatment is primarily required to ensure disease free seed for farms. Small portable HWT plant was setup in 2014 under crop improvement (R&D), new portable setup was imported last year and HWT started in 2016-17. Fixed hot water treatment plants of bigger capacity are now constructed at unit 1 and unit 4. These plants have started HWT operation during the season 2017-18.
Irrigation:JDW has always emphasized on improving irrigation efficiency in the region. Over the years, irrigation using poor quality tube well water has led to serious soiled gradation that resulted in loss of yield. At JDW, all ground water sources are constantly tested in the laboratory to ensure
Corporate Farming
JDW
Sug
ar M
ills
Lim
ited
36

that suitable water is supplied to crops. The farms are designed using latest laser levelling technology to ensure improved irrigation, at reduced costs and increasing yield potential. In recent times, addition of flow-meters on irrigation sources started to quantify the efficiency of irrigation.
Harvesting Operations:JDW has adopted the use of mechanical harvesters and prime mover cane transport systems for harvesting and transporting cane from farm to mill on timely basis. This saves a lot of harvesting and transportation costs and crucial cane nutrition. JDW currently operates 16 harvesters and has the capacity to mechanically harvest over 450,000 tonnes of cane over 13,000 acres per season. The mechanical harvest and transport system continues to evolve into a world class operation as efficiencies improve with new innovations, improved infrastructure and improved farm designs.
Cane production is affected by both harvesting and field issues which can impact on sugar quality and quantity. Both harvesting efficiency and crop presentation affect cane yield, cane quality and ratooning. Foreign consultants are working with JDW and have developed Harvesting Best Practice (HBP) guidelines to reduce cane loss, improve cane quality, and reduce stool damage. The HBP guidelines also focus on the impact that crop presentation has on harvesting efficiency. Information available covers topics such as farming for efficient harvesting; the effect of extractor fan speed on cane loss, crop yield, Commercial Cane Sugar (CCS), reduction in base cutter/chopper losses; and improvement in billet quality for planting.
Ann
ual R
epor
t 201
8
37
Fina
ncia
l Sta
tem
ents
Oth
er In
form
atio
nC
ompa
ny R
evie
w

Corporate Social Responsibility
Sugarcane Productivity Enhancement Project (SPEP):SPEP was initiated as a joint venture between NRSP and the Jamal Din Wali Sugar Mills in 2000 with the objective of enabling 10,000 farmers with small land-holdings to double their per acre yield of sugarcane, and thereby raise their incomes and standard of living, over three years. The project was launched in District Rahim Yar Khan in areas adjacent to the JDW Mill. These consist of fifteen union councils having 108 revenue villages, 193,026 acres of land and 36,228 households in two Tehsils: Rahim Yar Khan and Sadiqabad. It is a comprehensive and intended intervention for agriculture production expansion and the living standards of poor people. Its need was felt when the statistics of the region showed the declining trends in the acreage of sugarcane. The declining trend was attributed to poor seed quality, low yields, nonscientific agronomic practices, lack of access to credit and delayed payment to small growers by the Mills which discouraged the small farmers and growers. Therefore, SPEP was initiated as a joint venture between NRSP and the Jamal Din Wali Sugar Mills with the objective to double the production of sugarcane of 10,000 small farmers living in designated Union Council around the JDW Mill in RYK. SPEP has been designed to enhance small farm (<20 acres) profitability through agriculture & livestock extension services and provision of credit without collateral. The community organizations (COs) receive SPEP support from a professional team consisting of a social organizer, an agricultural extension officer, and a veterinary officer. The SPEP program had a significant positive impact on total household income, farm income, sugarcane income, and household expenditures.
The following activities have been carried out in the SPEP area;
• Community Mobilization carried out by NRSP
• Organization of small farmers into Community Organization (CO)
• Providing them planning and management training• Development of marketing channels
Extension services carried out by JDW Mill
• Arrangement of quality inputs• Giving technical advice• Better agronomic practices
Financial Services carried out both by NRSP and JDW Mills i.e., SPEP
• CO savings• Credit for fertilizer• Credit for agriculture machinery and implements
With continued support from JDW Sugar Mills, NRSP expanded its operation in 58 union councils. The number of active COs grew in 2017-18 up to 7,976 with a membership of 93,029 farmers. The main features of the SPEP include:
• Increase income of poor rural people by the increase in per acre yield of sugarcane, through:
• Improvement in production technology
• Resource use efficiency
• Need-based support (credit, agri-machinery, inputs, seed etc.)
• Assurance of timely payments by sugar mills.
• Ensure sufficient quantity of quality sugarcane in the catchment area of sugar mills.
• Social mobilization and organization of the rural poor into Community Organizations (COs)
• Provision of agricultural extension services; agricultural graduates employed by JDW Sugar Mills provide services through direct advice in CO meetings, published literature and farm visits.
JDW
Sug
ar M
ills
Lim
ited
38

• Credit facility from JDW Sugar Mills and NRSP for the purchase of seed and other agricultural inputs on the guarantee of the COs.
• Small farmers have access to new Seeds, Pesticides/farm machinery provided by JDW Sugar Mills on credit at subsidized rates
NRSP has distributed loan of Rs. 2,178 million in the year 2017-18 to raise the productivity & income of the farming communities, which is really helping to increase the social and economic life of the rural communities.
SPEP program has a significant impact on the income of participating households in treatment villages especially for those rural households that participate in CO over longer periods
Sugarcane Crop Improvement Program:Sugarcane crop can improve with new sugarcane varieties and this can only achieve through sugarcane research and breeding. JDW is producing its own seed/fuzz through sugarcane flowering and crossing. We normally produce 400 successful crosses each year and achieve excellent germination from the sexual seed. We germinate the seed in specific germination chamber which give excellent results. This year, we have produced 19,000 seedlings successfully through which we are doing the selection process for the varieties.We are also importing the vegetative seed of varieties from different countries through CIRAD France. From this material, there are few promising sugarcane varieties in the pipeline. The sucrose % ranges from 11 to 12.5 and average yield is 1,000 to 1,200 mounds/acre. We are propagating and multiplying these clones for further plantings at mills farms in Punjab and Sindh. Disease resistance is very important in new varieties.
Now, we are producing healthy seed nurseries through hot water treatment technology. Large HWT facilities have been built at JDW mills and we are successfully producing disease free seed nurseries.
We have also start working on drone technology for agriculture use. We will do foliar spray against vine weeds on sugarcane crop when the crop gets long and manual spray becomes impossible. Our aim is to develop drone sprayer for sugarcane crop and get weed free crop at the time of harvest.
Integrated Pest Management:Humans have long been in direct competition with attack of pests from our ancestral beginnings. Pest competes with humans for food, fiber and shelter. Different kind of insect pest’s attack sugarcane crop which can be divided into two classes (a) sucking pests (b) sugarcane borers. Pests of both classes can damage the crop severely which may lead to low yield and inferior quality cane. JDW group owns a specialized team for managing insect pests of grower’s crop under Umbrella of “Cane Development & Farmer Support Program”. Among sucking pests “Pyrilla Perpusilla” is a major threat which severely damage the crop, if multiplied unchecked and as far as borers are concerned “Stem Borer” is the most problematic in the area.
For management of insect pests, team of “JDW group” is working at grass root level and educating the growers through cluster meetings, individual contacts, crop visits and printed pamphlets. We used IPM approach i.e. utilizing both biological agents and chemicals for keeping pest population below economic threshold level (ETL). Insects cane reduce yield up to 50% and sucrose accumulation up to 35% and even more under extra ordinary attack.
Farmer Support Program:Livestock provides cash flow to farmers to meet the day to day expenses of their family and hence play a pivotal role in running their economy. To harness full potential of animals either in form of milk or meat, knowledge pertaining to animal’s nutrition and health is of utmost importance. To transfer knowledge and skill to Livestock farmers of our area, JDW Group under umbrella of “Farmer Support Program” providing following facilities to farmers at their door steps.
• All kind of treatment of sick animals at their door steps.
• Artificial insemination for both buffalo and cow with local and imported semen as well, for breed improvement.
• De worming for control of ecto and endo parasites.
• Seasonal vaccination for control of out breaks of FMD, HS and ETV like diseases.
• Provision of mineral mixtures to tackle the deficiency of mineral elements.
• All medicines are provided to growers at invoice price and services are free of cost.
• Dissemination of important information about animals’ health, nutrition and management through printed pamphlets.
Ann
ual R
epor
t 201
8
39
Fina
ncia
l Sta
tem
ents
Oth
er In
form
atio
nC
ompa
ny R
evie
w

Quality Education for All (QEFA):JDW Sugar Mills has created its valuable cooperation with the District education department to make positive contribution in the educational institutes for raising the education level of rural community, elementary and higher schools.
In 2002-03, the District Government of Rahim Yar Khan took a bold initiative in the education sector and handed over the management of all the primary schools of Rasool Pur Union Council to NRSP. JDW Sugar Mills fully supported this initiative and provided operational, financial and logistic support to the project. The local community was mobilized & fully involved in the management of schools. The following additional tasks were given to the community:
• Raising funds for provision of missing facilities• Reducing the drop-out rate and increasing enrollment• Reducing teacher’s absenteeism.
JDW-NRSP QEFA Project Activity / Description Achievement
Boys/Men Girls/Women Total
No. of Schools (QEFA) 17 6 23
Govt. Primary school 7 – 7
Govt. Masjid Maktab School 6 – 6
Enrolments 856 1,560 2,416
No. of teachers (Current Status) Total 13 46 59
Teachers trained 209 231 440
School councils formed 47 35 82
School council members 335 215 550
School council members trained 125 61 186
Achieving inclusive and quality education for all is reaffirms the belief that education is one of the most powerful and proven vehicles for sustainable development. There is strong evidence which showing that there are positive effects of decentralizing the education to the lower levels because of the QEFA project. The project has been a resounding success, resulting in efficient management of schools, increase in the student enrolment, reduction in the drop-out ratio, provision of basic facilities, and involvement of local communities in monitoring the performance of school administration.
For Year 2017-18 JDW Sugar Mills has spent Rs. 3.93 million for district Rahim Yar khan and 6.07 million has been utilized in district Ghotki & khairpur to upgrade the level of education. These funds included employment of teachers, new classrooms, boundary walls, and furniture for students and teachers, toilets, sheds, water supplies, electricity & electrification, IT labs, supports material, walking bridge and whitewash.
Currently NRSP is running 23 schools in district Rahim Yar Khan with the enrollment of more than 2,416 students to uplift the education level in Rahim Yar Khan. During this year different activities/events have been carried out to develop the intellectual abilities of the students and to encourage/ motivate them to continue their education. Under the QEFA project different activities have been carried out.
Corporate Social Responsibility
JDW
Sug
ar M
ills
Lim
ited
40

Ann
ual R
epor
t 201
8
41
Fina
ncia
l Sta
tem
ents
Oth
er In
form
atio
nC
ompa
ny R
evie
w
Unconsolidated Financial Statements
for the year ended 30 September 2018


Ann
ual R
epor
t 201
8
43
Fina
ncia
l Sta
tem
ents
Oth
er In
form
atio
nC
ompa
ny R
evie
w
We have reviewed the enclosed Statement of Compliance with the Listed Companies (Code of Corporate Governance) Regulations, 2017 (the Regulations) prepared by the Board of Directors of JDW Sugar Mills Limited for the year ended 30 September 2018 in accordance with the requirements of regulation 40 of the Regulations.
The responsibility for compliance with the Regulations is that of the Board of Directors of the Company. Our responsibility is to review whether the Statement of Compliance reflects the status of the Company’s compliance with the provisions of the Regulations and report if it does not and to highlight any non-compliance with the requirements of the Regulations. A review is limited primarily to inquiries of the Company’s personnel and review of various documents prepared by the Company to comply with the Regulations.
As a part of our audit of the financial statements we are required to obtain an understanding of the accounting and internal control systems sufficient to plan the audit and develop an effective audit approach. We are not required to consider whether the Board of Directors’ statement on internal control covers all risks and controls or to form an opinion on the effectiveness of such internal controls, the Company’s corporate governance procedures and risks.
The Regulations require the Company to place before the Audit Committee, and upon recommendation of the Audit Committee, place before the Board of Directors for their review and approval, its related party transactions and also ensure compliance with the requirements of section 208 of the Companies Act, 2017. We are only required and have ensured compliance of this requirement to the extent of the approval of the related party transactions by the Board of Directors upon recommendation of the Audit Committee. We have not carried out procedures to assess and determine the Company’s process for identification of related parties and that whether the related party transactions were undertaken at arm’s length price or not.
Based on our review, nothing has come to our attention which causes us to believe that the Statement of Compliance does not appropriately reflect the Company’s compliance, in all material respects, with the requirements contained in the Regulations as applicable to the Company for the year ended 30 September 2018.
Further, we highlight below instance of non-compliance with the requirement of the Regulations as reflected in the paragraph reference where it is stated in the Statement of Compliance: Paragraph Reference Description
i. 11 The Chief Financial Officer of the Company also holds the position of Company Secretary.
Independent Auditors’ Review ReportTo the members of JDW Sugar Mills Limited
Review Report on the Statement of Compliance contained in Listed Companies (Code of Corporate Governance) Regulations, 2017
Telephone + 92 (42) 111-KPMGTH (576484)Fax + 92 (42) 37429907Internet www.kpmg.com.pk
KPMG Taseer Hadi & Co.Chartered Accountants351 Shadman-1, Jail Road, Lahore 54000 Pakistan
07 January 2019 KPMG Taseer Hadi & Co.Lahore Chartered Accountants
KPMG Taseer Hadi & Co., a Partnership firm registered in Pakistan and a member firm of the KPMG network of independent member firms affiliated with KPMG International Cooperative (‘‘KPMG International’’), a Swiss entity.
JDW
Sug
ar M
ills
Lim
ited
44
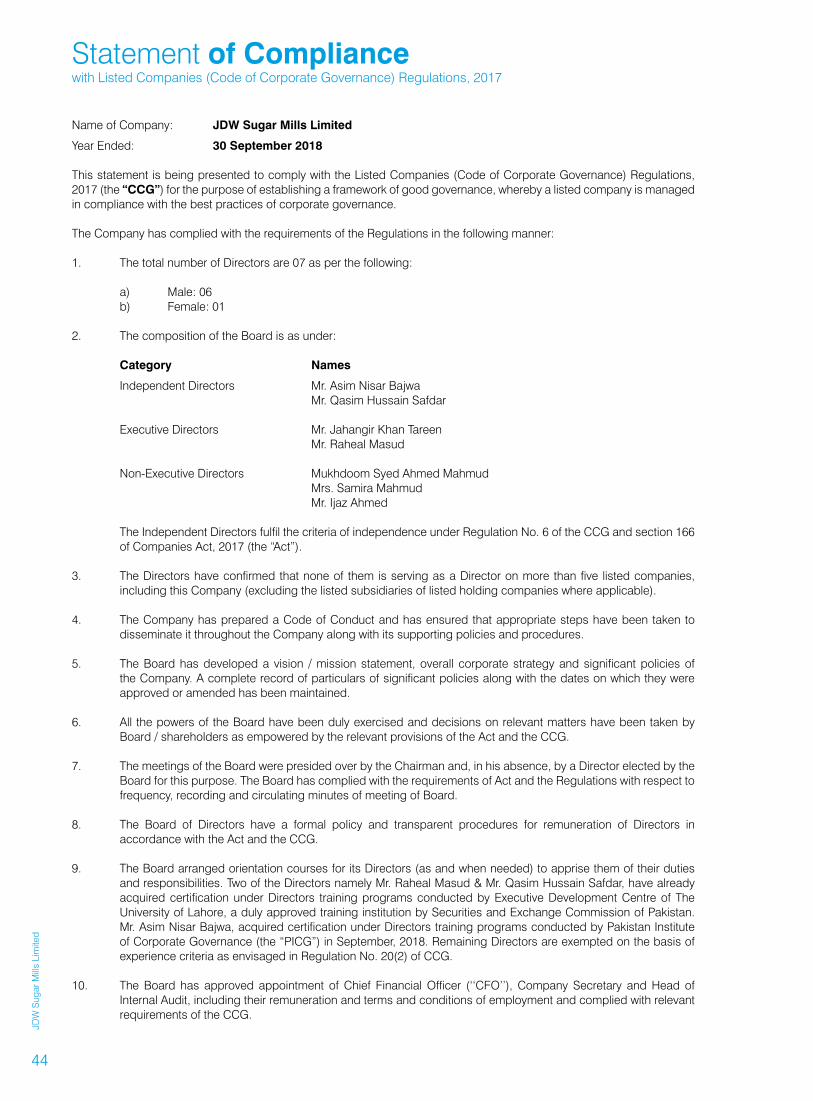
Name of Company: JDW Sugar Mills Limited
Year Ended: 30 September 2018
This statement is being presented to comply with the Listed Companies (Code of Corporate Governance) Regulations, 2017 (the “CCG”) for the purpose of establishing a framework of good governance, whereby a listed company is managed in compliance with the best practices of corporate governance.
The Company has complied with the requirements of the Regulations in the following manner:
1. The total number of Directors are 07 as per the following:
a) Male: 06b) Female: 01
2. The composition of the Board is as under:
Category Names
Independent Directors Mr. Asim Nisar Bajwa Mr. Qasim Hussain Safdar
Executive Directors Mr. Jahangir Khan Tareen Mr. Raheal Masud
Non-Executive Directors Mukhdoom Syed Ahmed Mahmud Mrs. Samira Mahmud Mr. Ijaz Ahmed
The Independent Directors fulfil the criteria of independence under Regulation No. 6 of the CCG and section 166 of Companies Act, 2017 (the “Act”).
3. The Directors have confirmed that none of them is serving as a Director on more than five listed companies, including this Company (excluding the listed subsidiaries of listed holding companies where applicable).
4. The Company has prepared a Code of Conduct and has ensured that appropriate steps have been taken to disseminate it throughout the Company along with its supporting policies and procedures.
5. The Board has developed a vision / mission statement, overall corporate strategy and significant policies of the Company. A complete record of particulars of significant policies along with the dates on which they were approved or amended has been maintained.
6. All the powers of the Board have been duly exercised and decisions on relevant matters have been taken by Board / shareholders as empowered by the relevant provisions of the Act and the CCG.
7. The meetings of the Board were presided over by the Chairman and, in his absence, by a Director elected by the Board for this purpose. The Board has complied with the requirements of Act and the Regulations with respect to frequency, recording and circulating minutes of meeting of Board.
8. The Board of Directors have a formal policy and transparent procedures for remuneration of Directors in accordance with the Act and the CCG.
9. The Board arranged orientation courses for its Directors (as and when needed) to apprise them of their duties and responsibilities. Two of the Directors namely Mr. Raheal Masud & Mr. Qasim Hussain Safdar, have already acquired certification under Directors training programs conducted by Executive Development Centre of The University of Lahore, a duly approved training institution by Securities and Exchange Commission of Pakistan. Mr. Asim Nisar Bajwa, acquired certification under Directors training programs conducted by Pakistan Institute of Corporate Governance (the “PICG”) in September, 2018. Remaining Directors are exempted on the basis of experience criteria as envisaged in Regulation No. 20(2) of CCG.
10. The Board has approved appointment of Chief Financial Officer (‘‘CFO’’), Company Secretary and Head of Internal Audit, including their remuneration and terms and conditions of employment and complied with relevant requirements of the CCG.
Statement of Compliancewith Listed Companies (Code of Corporate Governance) Regulations, 2017

Ann
ual R
epor
t 201
8
45
Fina
ncia
l Sta
tem
ents
Oth
er In
form
atio
nC
ompa
ny R
evie
w
11. The CFO of the Company also holds the position of Company Secretary.
12. CFO and CEO duly endorsed the financial statements before approval of the Board.
13. The Board has formed an audit committee. It comprises of following 03 (Three) Directors:
Name Designation Category
Mr. Qasim Hussain Safdar Chairman / Member Independent DirectorMrs. Samira Mahmud Member Non-Executive DirectorMr. Ijaz Ahmed Member Non-Executive Director
The Board has formed a Human Resource and Remuneration committee. It comprises of following 03 (Three)Directors:
Name Designation Category
Mr. Ijaz Ahmed Chairman / Member Non-Executive DirectorMrs. Samira Mahmud Member Non-Executive DirectorMr. Asim Nisar Bajwa Member Independent Director
The Board has formed a Nomination Committee. It comprises of following 02 (Two) Directors:
Name Designation Category
Mr. Jahangir Khan Tareen Chairman / Member Executive DirectorMr. Asim Nisar Bajwa Member Independent Director
The Board has formed a Risk Management Committee. It comprises of following 02 (Two) Directors:
Name Designation Category
Mr. Jahangir Khan Tareen Chairman / Member Executive DirectorMr. Asim Nisar Bajwa Member Independent Director
14. The Terms of Reference of the aforesaid committees have been formed, documented and advised to the committees for compliance.
15. The frequency of meetings (quarterly / half yearly / yearly) of the committees were as per following:
a) Audit Committee: 05 meetings held during the year ended on September 30, 2018; and
b) HR and Remuneration Committee: 02 meetings held during the year ended on September 30, 2018.
16. The Board has set up an effective internal audit function controlled by internal audit department, which is comprised of qualified and experienced professional for the purpose and are conversant with the policies and procedures of the Company.
17. The statutory auditors of the Company have confirmed, that they have been given a satisfactory rating under the quality control review program of the ICAP and registered with Audit Oversight Board of Pakistan, that they or any of the partners of the firm, their spouses and minor children, do not hold shares of the Company and that the firm and all its partners are in compliance with International Federation of Accountants (IFAC) guidelines on code of ethics as adopted by the ICAP.
18. The statutory auditors or the persons associated with them have not been appointed to provide other services except in accordance with the Act, the CCG or any other regulatory requirement and the auditors have confirmed that they have observed IFAC guidelines in this regard.
19. We confirm that all other requirements of the Regulations have been complied with.
07 January 2019 MUKHDOOM SYED AHMED MAHMUDLahore Chairman

JDW
Sug
ar M
ills
Lim
ited
46
Opinion
We have audited the annexed unconsolidated financial statements of JDW Sugar Mills Limited (“the Company”), which comprise the unconsolidated statement of financial position as at 30 September 2018, and the unconsolidated statement of profit or loss, the unconsolidated statement of comprehensive income, the unconsolidated statement of changes in equity, the unconsolidated statement of cash flows for the year then ended, and notes to the unconsolidated financial statements, including a summary of significant accounting policies and other explanatory information, and we state that we have obtained all the information and explanations which, to the best of our knowledge and belief, were necessary for the purposes of the audit.
In our opinion and to the best of our information and according to the explanations given to us, the unconsolidated statement of financial position, the unconsolidated statement of profit or loss, the unconsolidated statement of comprehensive income, the unconsolidated statement of changes in equity and the unconsolidated statement of cash flows together with the notes forming part thereof conform with the accounting and reporting standards as applicable in Pakistan and give the information required by the Companies Act, 2017 (XIX of 2017), in the manner so required and respectively give a true and fair view of the state of the Company’s affairs as at 30 September 2018 and of the loss, the comprehensive loss, the changes in equity and its cash flows for the year then ended.
Basis for Opinion
We conducted our audit in accordance with International Standards on Auditing (ISAs) as applicable in Pakistan. Our responsibilities under those standards are further described in the Auditors’ Responsibilities for the Audit of the unconsolidated financial statements section of our report. We are independent of the Company in accordance with the International Ethics Standards Board for Accountants’ Code of Ethics for Professional Accountants as adopted by the Institute of Chartered Accountants of Pakistan (the Code) and we have fulfilled our other ethical responsibilities in accordance with the Code. We believe that the audit evidence we have obtained is sufficient and appropriate to provide a basis for our opinion.
Key Audit Matters
Key audit matters are those matters that, in our professional judgment, were of most significance in our audit of the unconsolidated financial statements of the current period. These matters were addressed in the context of our audit of the unconsolidated financial statements as a whole, and in forming our opinion thereon, and we do not provide a separate opinion on these matters.
Independent Auditors’ Report To the members of JDW Sugar Mills Limited
Report on the Audit of the Unconsolidated Financial Statements
Telephone + 92 (42) 111-KPMGTH (576484)Fax + 92 (42) 37429907Internet www.kpmg.com.pk
KPMG Taseer Hadi & Co.Chartered Accountants351 Shadman-1, Jail Road, Lahore 54000 Pakistan

Ann
ual R
epor
t 201
8
47
Fina
ncia
l Sta
tem
ents
Oth
er In
form
atio
nC
ompa
ny R
evie
w
Following are the Key audit matters:
Sr. No. Key audit matters How the matter was addressed in our audit
1 Revenue recognition
Refer to notes 5.8 and 31 to the unconsolidated financial statements.
The Company principally generates revenue from sale of sugar, agriculture produce and electricity in the domestic market. Additionally revenue is also generated from sale of sugar in the international market.
We identified revenue recognition as a key audit matter because it is one of the key performance indicator of the Company and gives rise to an inherent risk of misstatement to meet expectations or targets.
Our audit procedures, amongst others, included the following:
• obtaining an understanding of the process relating to recording of sales and testing the design, implementation and operating effectiveness of relevant key internal controls over recording of sales;
• assessing the appropriateness of the Company’s accounting policy for recording of sales and compliance of the policy with applicable accounting standards;
• comparing a sample of sale transactions recorded during the year with sales orders, sales invoices, delivery challans and other relevant underlying documents;
• comparing a sample of sale transactions recorded near the year end with the sales orders, sales invoices, delivery challans and other relevant underlying documentation to assess if the sale was recorded in the appropriate accounting period;
• comparing a sample of electricity sales transactions with energy invoices duly verified by Central Power Purchasing Agency (Guarantee) Limited (‘‘CPPA-G’’) and assessed whether the sale was recorded in the appropriate accounting period;
• for a sample of invoices, recalculating the invoice amount based on fixed and variable component provided by National Electric Power Regulatory Authority (NEPRA);
• inspecting on a sample basis, credit notes issued near to and subsequent to year end to evaluate whether the adjustments to sales had been accurately recorded in the appropriate accounting period; and
• scanning for any manual journal entries relating to sales recorded during and near the year end which were considered to be material or met other specific risk based criteria for inspecting underlying documentation.
2 Capitalization of property, plant and equipment
Refer notes 5.1 and 19 to the unconsolidated financial statements.
The Company has made significant capital expenditure on balancing, modernization and replacement of plant and equipment.
We identified capitalization of property, plant and equipment as a key audit matter because there is a risk that amounts being capitalized may not meet the capitalization criteria with related implications on depreciation charge for the year.
Our audit procedures, amongst others, included the following:
• obtaining an understanding of and testing the design, implementation and operating effectiveness of management’s key internal control over capital expenditure;
• comparing, on sample basis, the costs incurred on projects with supporting documentation and contracts;
• assessing the nature of costs incurred for the capital projects for appropriateness by comparing, on sample basis, amounts recorded with underlying documentation and considering that the expenditure meets the criteria for capitalization as per the applicable accounting standards; and

JDW
Sug
ar M
ills
Lim
ited
48
Sr. No. Key audit matters How the matter was addressed in our audit
• inspecting supporting documents for the date of capitalization when project assets were ready for its intended use to assess that depreciation commenced and further capitalization of costs ceased from that date and to assess the useful life assigned by management including testing the calculation of related depreciation.
3 Valuation of stock-in-trade
Refer notes 5.4 and 27 to the unconsolidated financial statements.
The balance of gross stock-in-trade at 30 September 2018 was Rs. 19,730.03 million.
We identified valuation of stock-in-trade as a key audit matter as it involves significant management judgement in determining the carrying value of stock- in-trade.
Our audit procedures, amongst others, included the following:
• assessing the appropriateness of Company’s accounting policy for valuation of stock-in- trade and compliance of the policy with the requirements of the prevailing accounting standards;
• obtaining an understanding of internal controls over valuation of stock-in-trade and testing, on a sample basis, their design, implementation and operating effectiveness;
• obtaining an understanding and assessing reasonableness of the management’s determination of net realizable value (NRV) and the key estimates adopted, including future selling prices and costs necessary to make the sales and their basis; and
• comparing the NRV, on a sample basis, to the cost of stock-in-trade to assess whether any adjustments are required to the value of stock in trade in accordance with the accounting policy.
4 Recoverability of long term investments
Refer note 22 to the unconsolidated financial statements.
Investments in subsidiaries includes carrying value of investment of Rs. 2,310.46 million in Deharki Sugar Mills (Private) Limited, Faruki Pulp Mills Limited, Sadiqabad Power (Private) Limited and Ghotki Power (Private) Limited unquoted subsidiaries.
As at 30 September 2018, management conducted an impairment test to assess the recoverability of the carrying value of investment in subsidiaries. This was performed using a discounted cash flow model.
We identified assessing the carrying value of investment in subsidiaries as a key audit matter because significant degree of management judgement involved in assessing their recoverable amount.
Our audit procedures, amongst others, included the following:
• discussing with the Company’s management key assumptions used in the valuation model and testing the mathematical accuracy of the model;
• involving our internal valuation specialist to assist us in evaluating the assumptions and judgements adopted by management in its discounted cash flow analysis (i.e. growth rate, terminal values and the discount rate) used to derive the recoverable amount of investments made; and
• comparing the recoverable amount with the cost of investment to identify impairment, if any.

Ann
ual R
epor
t 201
8
49
Fina
ncia
l Sta
tem
ents
Oth
er In
form
atio
nC
ompa
ny R
evie
w
Sr. No. Key audit matters How the matter was addressed in our audit
5 Growing cane valuation
Refer note 25 to the unconsolidated financial statements.
The Company’s biological assets include standing cane, wheat and guar crops which are measured at fair value less costs to sell.
The carrying value of the growing cane as at 30 September 2018 was Rs. 2,024.70 million.
Estimating the fair value is a complex process involving a number of judgements and estimates regarding various inputs. Due to the nature of the asset, the valuation technique includes a discounted cash flow model that uses a number of inputs from internal sources due to a lack of relevant and reliable observable inputs. Consequently, we have determined the valuation of growing cane to be a key audit matter.
Our audit procedures, amongst others, included the following:
• assessing the design and implementation of the controls around the valuation of the biological assets;
• assessing the appropriateness of the principles used in the valuation of growing cane, and analyzing the significant assumptions used by management in their valuation models;
• evaluating the Company’s inputs used in calculating the estimated cash flows by comparing them with historical performance and the Company’s plans;
• involving our own valuation specialist to assist in evaluating the appropriateness of the discount rates used, which included comparing the discount rate with sector averages for the relevant markets in which the Company operates; and
• evaluating the adequacy of the financial statement disclosures, including disclosures of key assumptions, judgements and sensitivities.
Information Other than the Unconsolidated Financial Statements and Auditor’s Report Thereon
Management is responsible for the other information. Other information comprises the information included in the annual report for the year ended 30 September 2018, but does not include the consolidated and unconsolidated financial statements and our auditors’ report thereon.
Our opinion on the unconsolidated financial statements does not cover the other information and we do not express any form of assurance conclusion thereon.
In connection with our audit of the unconsolidated financial statements, our responsibility is to read the other information and, in doing so, consider whether the other information is materially inconsistent with the unconsolidated financial statements or our knowledge obtained in the audit or otherwise appears to be materially misstated. If, based on the work we have performed, we conclude that there is a material misstatement of this other information, we are required to report that fact. We have nothing to report in this regard.
Responsibilities of Management and Board of Directors for the Unconsolidated Financial Statements
Management is responsible for the preparation and fair presentation of the unconsolidated financial statements in accordance with the accounting and reporting standards as applicable in Pakistan and the requirements of Companies Act, 2017(XIX of 2017) and for such internal control as management determines is necessary to enable the preparation of unconsolidated financial statements that are free from material misstatement, whether due to fraud or error.
In preparing the unconsolidated financial statements, management is responsible for assessing the Company’s ability to continue as a going concern, disclosing, as applicable, matters related to going concern and using the going concern basis of accounting unless management either intends to liquidate the Company or to cease operations, or has no realistic alternative but to do so.
Board of Directors are responsible for overseeing the Company’s financial reporting process.

JDW
Sug
ar M
ills
Lim
ited
50
Auditor’s Responsibilities for the Audit of the Unconsolidated Financial Statements
Our objectives are to obtain reasonable assurance about whether the unconsolidated financial statements as a whole are free from material misstatement, whether due to fraud or error and to issue an auditor’s report that includes our opinion. Reasonable assurance is a high level of assurance, but is not a guarantee that an audit conducted in accordance with ISAs as applicable in Pakistan will always detect a material misstatement when it exists. Misstatements can arise from fraud or error and are considered material if, individually or in the aggregate, they could reasonably be expected to influence the economic decisions of users taken on the basis of these unconsolidated financial statements.
As part of an audit in accordance with ISAs as applicable in Pakistan, we exercise professional judgment and maintain professional skepticism throughout the audit. We also:
• Identify and assess the risks of material misstatement of the unconsolidated financial statements, whether due to fraud or error, design and perform audit procedures responsive to those risks, and obtain audit evidence that is sufficient and appropriate to provide a basis for our opinion. The risk of not detecting a material misstatement resulting from fraud is higher than for one resulting from error, as fraud may involve collusion, forgery, intentional omissions, misrepresentations, or the override of internal control.
• Obtain an understanding of internal control relevant to the audit in order to design audit procedures that are appropriate in the circumstances, but not for the purpose of expressing an opinion on the effectiveness of the Company’s internal control.
• Evaluate the appropriateness of accounting policies used and the reasonableness of accounting estimates and related disclosures made by management.
• Conclude on the appropriateness of management’s use of the going concern basis of accounting and, based on the audit evidence obtained, whether a material uncertainty exists related to events or conditions that may cast significant doubt on the Company’s ability to continue as a going concern. If we conclude that a material uncertainty exists, we are required to draw attention in our auditor’s report to the related disclosures in the unconsolidated financial statements or, if such disclosures are inadequate, to modify our opinion. Our conclusions are based on the audit evidence obtained up to the date of our auditor’s report. However, future events or conditions may cause the Company to cease to continue as a going concern.
• Evaluate the overall presentation, structure and content of the unconsolidated financial statements, including the disclosures, and whether the unconsolidated financial statements represent the underlying transactions and events in a manner that achieves fair presentation.
We communicate with the Board of Directors regarding, among other matters, the planned scope and timing of the audit and significant audit findings, including any significant deficiencies in internal control that we identify during our audit.
We also provide the board of directors with a statement that we have complied with relevant ethical requirements regarding independence, and to communicate with them all relationships and other matters that may reasonably be thought to bear on our independence, and where applicable, related safeguards.
From the matters communicated with the Board of Directors, we determine those matters that were of most significance in the audit of the unconsolidated financial statements of the current period and are therefore the key audit matters. We describe these matters in our auditor’s report unless law or regulation precludes public disclosure about the matter or when, in extremely rare circumstances, we determine that a matter should not be communicated in our report because the adverse consequences of doing so would reasonably be expected to outweigh the public interest benefits of such communication.

Ann
ual R
epor
t 201
8
51
Fina
ncia
l Sta
tem
ents
Oth
er In
form
atio
nC
ompa
ny R
evie
w
Report on Other Legal and Regulatory Requirements
Based on our audit, we further report that in our opinion:
a) proper books of account have been kept by the Company as required by the Companies Act, 2017(XIX of 2017);
b) the unconsolidated statement of financial position, the unconsolidated statement of profit or loss, the unconsolidated statement of comprehensive income, the unconsolidated statement of changes in equity and the unconsolidated statement of cash flows together with the notes thereon have been drawn up in conformity with the Companies Act, 2017 (XIX of 2017) and are in agreement with the books of account and returns;
c) investments made, expenditure incurred and guarantees extended during the year were for the purpose of the Company’s business; and
d) zakat deductible at source under the Zakat and Ushr Ordinance, 1980 (XVlII of 1980), was deducted by the Company and deposited in the Central Zakat Fund established under section 7 of that Ordinance.
The engagement partner on the audit resulting in this independent auditor’s report is Mr. Kamran Iqbal Yousafi.
07 January 2019 KPMG Taseer Hadi & Co.Lahore Chartered Accountants
KPMG Taseer Hadi & Co., a Partnership firm registered in Pakistan and a member firm of the KPMG network of independent member firms affiliated with KPMG International Cooperative (‘‘KPMG International’’), a Swiss entity.

JDW
Sug
ar M
ills
Lim
ited
52
Unconsolidated Statement of Financial Position
Note 2018 2017 2016 Rupees Rupees Rupees Restated Restated
SHARE CAPITAL AND RESERVES Share capital 7 597,766,610 597,766,610 597,766,610 Share premium reserve 8 678,316,928 678,316,928 678,316,928 Accumulated profit 6,951,403,122 7,343,537,818 7,259,500,998 8,227,486,660 8,619,621,356 8,535,584,536 NON-CURRENT LIABILITIES Redeemable capital - secured 9 – – 83,333,333 Long term finances - secured 10 8,785,694,471 9,792,313,674 9,495,166,901 Liabilities against assets subject to finance lease - secured 11 144,677,914 153,047,674 495,823,654 Deferred taxation 12 1,617,167,472 1,753,983,783 1,641,059,144 Retirement benefits 13 53,784,119 29,618,756 101,168,252 10,601,323,976 11,728,963,887 11,816,551,284 CURRENT LIABILITIES Short term borrowings 14 23,553,685,516 10,053,163,155 3,415,654,047 Current portion of non-current liabilities 15 4,106,050,113 3,368,757,109 3,139,610,613 Trade and other payables 16 10,756,257,312 8,301,045,340 7,299,888,872 Unclaimed dividend 34,072,815 64,248,402 27,794,069 Accrued profit / interest / mark-up 17 534,626,215 226,191,820 125,798,019 38,984,691,971 22,013,405,826 14,008,745,620
CONTINGENCIES AND COMMITMENTS 18 57,813,502,607 42,361,991,069 34,360,881,440
The annexed notes from 1 to 51 form an integral part of these unconsolidated financial statements.
Chief Financial Officer

Ann
ual R
epor
t 201
8
53
Fina
ncia
l Sta
tem
ents
Oth
er In
form
atio
nC
ompa
ny R
evie
w
As at 30 September 2018
Chief Executive Director
Note 2018 2017 2016 Rupees Rupees Rupees Restated Restated
ASSETS NON-CURRENT ASSETS Property, plant and equipment 19 22,010,170,144 21,476,751,288 19,919,032,625 Investment property 20 218,599,597 218,599,597 196,467,698 Intangibles 21 618,849,288 620,889,016 622,928,744 Long term investments 22 2,310,460,383 2,303,378,840 2,283,110,383 Long term advances 23 – 3,272,223 18,430,247 Long term deposits 24 37,488,439 54,978,065 111,446,138 25,195,567,851 24,677,869,029 23,151,415,835 CURRENT ASSETS Biological assets 25 2,024,707,028 2,282,737,798 2,240,966,107 Stores, spare parts and loose tools 26 1,309,256,367 1,412,675,360 1,080,682,261 Stock-in-trade 27 19,730,034,110 7,939,757,487 5,035,625,241 Trade debts - unsecured considered good 28 5,471,467,968 2,941,217,253 870,429,870 Advances, deposits, prepayments and other receivables 29 3,028,850,483 2,182,572,665 1,126,498,627 Advance tax - net 947,704,351 791,404,202 848,667,402 Cash and bank balances 30 105,914,449 133,757,275 6,596,097 32,617,934,756 17,684,122,040 11,209,465,605
57,813,502,607 42,361,991,069 34,360,881,440

JDW
Sug
ar M
ills
Lim
ited
54
Unconsolidated Statement of Profit or LossFor the year ended 30 September 2018
Chief Financial Officer Chief Executive Director
Note 2018 2017 Rupees Rupees Restated
Gross sales 40,251,476,355 49,962,324,692
Sales tax and others (2,986,969,986) (4,530,367,689)
Net sales 31 37,264,506,369 45,431,957,003
Cost of sales 32 (34,148,122,116) (40,807,425,417)
Gross profit 3,116,384,253 4,624,531,586
Administrative expenses 33 (1,033,466,077) (1,099,255,365)
Selling expenses 34 (424,314,254) (84,805,426)
Other income 35 475,637,156 571,049,173
Other expenses 36 (5,237,703) (166,528,263)
(987,380,878) (779,539,881)
Profit from operations 2,129,003,375 3,844,991,705
Finance cost 37 (2,269,761,395) (1,665,293,789)
(Loss) / profit before taxation (140,758,020) 2,179,697,916
Taxation 38 (62,682,495) (591,301,563)
(Loss) / profit after taxation (203,440,515) 1,588,396,353
(Loss) / earnings per share - basic and diluted 39 (3.40) 26.57
The annexed notes from 1 to 51 form an integral part of these unconsolidated financial statements.

Ann
ual R
epor
t 201
8
55
Fina
ncia
l Sta
tem
ents
Oth
er In
form
atio
nC
ompa
ny R
evie
w
Chief Financial Officer Chief Executive Director
Unconsolidated Statement of Comprehensive IncomeFor the year ended 30 September 2018
2018 2017 Rupees Rupees Restated
(Loss) / profit after taxation (203,440,515) 1,588,396,353
Other comprehensive loss
Items that will not be reclassified to profit or loss:
- Re-measurement of defined benefit liability (13,189,011) (14,204,297)
- Related tax 3,824,813 4,261,289
(9,364,198) (9,943,008)
Total comprehensive (loss) / income for the year (212,804,713) 1,578,453,345
The annexed notes from 1 to 51 form an integral part of these unconsolidated financial statements.

JDW
Sug
ar M
ills
Lim
ited
56
Unconsolidated Statement of Cash FlowFor the year ended 30 September 2018
Note 2018 2017 Rupees Rupees Restated
CASH FLOWS FROM OPERATING ACTIVITIES
Cash (used in) / generated from operations 40 (8,531,799,685) 39,279,886
Taxes paid (351,974,142) (421,113,724)
Staff retirement benefits paid (64,236,287) (174,985,986)
Workers’ Profit Participation Fund paid 16.2 (183,088,904) (193,329,828)
(599,299,333) (789,429,538)
Net cash used in operating activities (9,131,099,018) (750,149,652)
CASH FLOWS FROM INVESTING ACTIVITIES
Capital expenditure (2,400,682,903) (2,939,733,916)
Advances for future issuance of shares (7,081,543) (20,268,457)
Long term advances 17,194,443 22,333,332
Long term deposits 17,489,626 56,468,073
Proceeds from sale of operating fixed assets 534,801,636 86,227,818
Proceeds from sale of investment property – 37,437,422
Net cash used in investing activities (1,838,278,741) (2,757,535,728)
CASH FLOWS FROM FINANCING ACTIVITIES
Long term finances - net (221,183,293) 593,535,655
Short term borrowings - net 11,318,319,333 6,342,221,271
Finance cost paid (1,943,734,214) (1,524,503,193)
Lease rentals paid (184,564,351) (613,732,820)
Dividend paid (209,505,570) (1,457,962,192)
Net cash generated from financing activities 8,759,331,905 3,339,558,721
Net decrease in cash and cash equivalents (2,210,045,854) (168,126,659)
Cash and cash equivalents at beginning of the year (2,374,033,959) (2,205,907,300)
Cash and cash equivalents at end of the year (4,584,079,813) (2,374,033,959)
Cash and cash equivalents comprise of the following:
- Cash and bank balances 105,914,449 133,757,275
- Running finances and morabaha finances 14.2 & 14.6 (4,689,994,262) (2,507,791,234)
(4,584,079,813) (2,374,033,959)
The annexed notes from 1 to 51 form an integral part of these unconsolidated financial statements.
Chief Financial Officer Chief Executive Director

Ann
ual R
epor
t 201
8
57
Fina
ncia
l Sta
tem
ents
Oth
er In
form
atio
nC
ompa
ny R
evie
w
R
eser
ves
Cap
ital
Rev
enue
S
har
e A
ccum
ulat
ed
Sh
are
cap
ital
pre
miu
m
pro
fit
Tota
l res
erve
s To
tal e
qui
ty
R
upee
s R
upee
s R
upee
s R
upee
s R
upee
s B
alan
ce a
s at
30
Sept
embe
r 201
6 - a
s pr
evio
usly
sta
ted
597
,766
,610
6
78,3
16,9
28
7,0
44,6
72,5
56
7,7
22,9
89,4
84
8,3
20,7
56,0
94
Effe
ct o
f res
tate
men
t - n
ote
48
–
–
214
,828
,442
2
14,8
28,4
42
214
,828
,442
Bal
ance
as
at 3
0 Se
ptem
ber 2
016
– as
rest
ated
5
97,7
66,6
10
678
,316
,928
7
,259
,500
,998
7
,937
,817
,926
8
,535
,584
,536
Tota
l com
preh
ensi
ve in
com
e fo
r the
yea
r
Profi
t for
the
year
end
ed 3
0 Se
ptem
ber 2
017
–
–
1,5
88,3
96,3
53
1,5
88,3
96,3
53
1,5
88,3
96,3
53
Oth
er c
ompr
ehen
sive
loss
for t
he y
ear e
nded
30
Sept
embe
r 201
7 –
net o
f tax
–
–
(9
,943
,008
) (9
,943
,008
) (9
,943
,008
)
–
–
1,5
78,4
53,3
45
1,5
78,4
53,3
45
1,5
78,4
53,3
45
Tran
sact
ions
with
ow
ners
of t
he C
ompa
ny
Fina
l cas
h di
vide
nd fo
r the
yea
r end
ed 3
0 Se
ptem
ber 2
016
@ R
s. 1
5.00
per
sha
re
–
–
(896
,649
,915
) (8
96,6
49,9
15)
(896
,649
,915
)
Inte
rim c
ash
divi
dend
for t
he p
erio
d en
ded
31 M
arch
201
7 @
Rs.
10.
00 p
er s
hare
–
–
(5
97,7
66,6
10)
(597
,766
,610
) (5
97,7
66,6
10)
–
–
(1,4
94,4
16,5
25)
(1,4
94,4
16,5
25)
(1,4
94,4
16,5
25)
Bal
ance
as
at 3
0 Se
ptem
ber 2
017
- res
tate
d 5
97,7
66,6
10
678
,316
,928
7
,343
,537
,818
8
,021
,854
,746
8
,619
,621
,356
Tota
l com
preh
ensi
ve lo
ss fo
r the
yea
r
Loss
for t
he y
ear e
nded
30
Sept
embe
r 201
8 –
–
(2
03,4
40,5
15)
(203
,440
,515
) (2
03,4
40,5
15)
Oth
er c
ompr
ehen
sive
loss
for t
he y
ear e
nded
30
Sept
embe
r 201
8 –
net o
f tax
–
–
(9
,364
,198
) (9
,364
,198
) (9
,364
,198
)
–
–
(212
,804
,713
) (2
12,8
04,7
13)
(212
,804
,713
)
Tran
sact
ions
with
ow
ners
of t
he C
ompa
ny
Fina
l cas
h di
vide
nd fo
r the
yea
r end
ed 3
0 Se
ptem
ber 2
017
@ R
s. 3
.00
per s
hare
–
–
(1
79,3
29,9
83)
(179
,329
,983
) (1
79,3
29,9
83)
Bal
ance
as
at 3
0 Se
ptem
ber 2
018
597
,766
,610
6
78,3
16,9
28
6,9
51,4
03,1
22
7,6
29,7
20,0
50
8,2
27,4
86,6
60
The
anne
xed
note
s fro
m 1
to 5
1 fo
rm a
n in
tegr
al p
art o
f the
se u
ncon
solid
ated
fina
ncia
l sta
tem
ents
.
Unconsolidated Statement of Changes In EquityFor the year ended 30 September 2018
Chi
ef F
inan
cial
Offi
cer
Chi
ef E
xecu
tive
Dire
ctor

JDW
Sug
ar M
ills
Lim
ited
58
1 STATUS AND NATURE OF BUSINESS
1.1 JDW Sugar Mills Limited (“the Company”) was incorporated in Pakistan on 31 May 1990 as a private limited company and was subsequently converted into a public limited company on 24 August 1991. Shares of the Company are listed on the Pakistan Stock Exchange Limited. The principal activity of the Company is production and sale of crystalline sugar, electricity and managing corporate farms.
The geographical locations and addresses of the Company’s business units, including production facilities are as under:
– Head office and registered office : 17 - Abid Majeed Road, Lahore Cantonment, Lahore– Unit-I : Mauza Sharin, Jamal Din Wali, District Rahim Yar Khan – Unit-II : Machi Goth, Sadiqabad, District Rahim Yar Khan – Unit-III : Village Laluwali, District Ghotki
1.2 The Company executed Energy Purchase Agreements (“EPA”) on 20 March 2014 with National Transmission & Despatch Company Limited (“NTDC”) through the Central Power Purchasing Agency (Guarantee) Limited (“CPPA-G”) for its Bagasse Based Co-Generation Power Plants (“Co-Generation Power”) at JDW Unit-II, Sadiqabad, District Rahim Yar Khan, Punjab and JDW Unit-III, District Ghotki, Sindh.
The 26.60 MW power plant at Unit-II achieved Commercial Operations Date (“COD”) on 12 June 2014 while
the 26.83 MW power plant at Unit-III achieved COD on 03 October 2014 after completing all independent testing and certification requirements and supplying renewable electricity to the national grid. Further, the Company’s Co-Generation Power Plants are the first to materialize under National Electric Power Regulatory Authority’s (“NEPRA”) upfront bagasse tariff.
2 SUMMARY OF SIGNIFICANT EVENTS AND TRANSACTIONS IN THE CURRENT REPORTING PERIOD
The Company’s financial position and performance was particularly affected by the following events and transactions during the reporting period:
– Incurred capital expenditure of Rs. 2,556 million as part of balancing, modernization and replacement
(“BMR”). – Obtained further long term finance from various financial institution amounting to Rs. 2,994 million.
– Due to the first time application of financial reporting requirements under the Companies Act, 2017, including
disclosure and presentation requirements of the fourth schedule of the Companies Act, 2017, some of the amounts reported for the previous period have been reclassified.
3 BASIS OF PREPARATION
3.1 Separate financial statements
These unconsolidated financial statements are the separate financial statements of the Company in which investments in subsidiaries and associate are accounted for on the basis of direct equity interest rather than on the basis of reported results and net assets of the investees. Consolidated financial statements of the Company are prepared separately.
The Company has following investments: Country of Name of company incorporation Shareholding
Subsidiaries
- Deharki Sugar Mills (Private) Limited (“DSML”) Pakistan 100%
- Ghotki Power (Private) Limited (“GPL”) Pakistan 100%
- Sadiqabad Power (Private) Limited (“SPL”) Pakistan 100%
- Faruki Pulp Mills Limited (“FPML”) Pakistan 57.67%
Notes to the Unconsolidated Financial StatementsFor the year ended 30 September 2018

Ann
ual R
epor
t 201
8
59
Fina
ncia
l Sta
tem
ents
Oth
er In
form
atio
nC
ompa
ny R
evie
w
Country of Name of company incorporation Shareholding
Associate
- JDW Power (Private) Limited (‘‘JDWPL’’) Pakistan 47.37% 3.2 Statement of compliance
These unconsolidated financial statements have been prepared in accordance with the accounting and reporting standards as applicable in Pakistan. The accounting and reporting standards applicable in Pakistan comprise of:
– International Financial Reporting Standards (IFRS) issued by the International Accounting Standards
Board (IASB) as notified under the Companies Act, 2017;
– Islamic Financial Accounting Standards (IFAS) issued by the Institute of Chartered Accountants of Pakistan as notified under the Companies Act, 2017; and
– Provisions of and directives issued under the Companies Act, 2017. Where provisions of and directives issued under the Companies Act, 2017 differ from the IFRS, the
provisions of and directives issued under the Companies Act, 2017 have been followed. 3.3 Basis of measurement
These unconsolidated financial statements have been prepared under the historical cost convention except for the following:
– Certain financial instruments which are measured at fair value;
– Retirement benefits at present value; and
– Biological assets which are measured at fair value less costs to sell at the point of harvest. 3.4 Functional and presentation currency
These unconsolidated financial statements are presented in Pakistani Rupees (“Rs.”) which is the Company’s functional currency. All amounts have been rounded off to the nearest rupee, unless otherwise stated.
4 USE OF ESTIMATES AND JUDGMENTS
The preparation of unconsolidated financial statements in conformity with approved accounting standards requires management to make judgments, estimates and assumptions that affect the application of policies and reported amounts of assets, liabilities, income and expenses. The estimates and associated assumptions are based on historical experience and various other factors that are believed to be reasonable under circumstances, and the results of which form the basis for making judgment about carrying value of assets and liabilities that are not readily apparent from other sources. Actual results may differ from these estimates.
The estimates and underlying assumptions are reviewed on an ongoing basis. Revisions to accounting estimates are recognized in the period in which estimates are revised if the revision affects only that period, or in the period of the revision and future periods if the revision affects both current and future periods.
The areas where assumptions and estimates are significant to the Company’s unconsolidated financial statements or where judgment was exercised in application of accounting policies are as follows:
4.1 Property, plant and equipment
The Company reviews the useful lives and residual values of property, plant and equipment on a regular basis. Any change in estimates in future years might affect the carrying amounts of the respective items of property, plant and equipment with a corresponding effect on the depreciation charge and impairment.
4.2 Stores, spare parts and loose tools
The Company reviews the stores, spare parts and loose tools for possible impairment on an annual basis. Any change in estimates in future years might affect the carrying amounts of the respective items of stores, spare parts and loose tools with a corresponding effect on the provision.

JDW
Sug
ar M
ills
Lim
ited
60
4.3 Stock-in-trade
The Company reviews the carrying amount of stock-in-trade on a regular basis. Carrying amount of stock-in-trade is adjusted where the net realizable value is below the cost. Net realizable value is the estimated selling price in the ordinary course of business, less the estimated costs of completion and estimated costs necessary to make the sale.
4.4 Provision against trade debts, advances, deposits and other receivables
The Company reviews the recoverability of its trade debts, advances, deposits and other receivables to assess amount of bad debts and provision required there against on annual basis.
4.5 Provisions and contingencies
The Company reviews the status of all pending litigations and claims against the Company. Based on its judgment and the advice of the legal advisors for the estimated financial outcome, appropriate disclosure or provision is made. The actual outcome of these litigations and claims can have an effect on the carrying amounts of the liabilities recognized at the statement of financial position date.
4.6 Employee benefits
The Company operates approved funded gratuity scheme covering eligible full time permanent workers who have completed the minimum qualifying period of service as defined under the respective scheme. The gratuity scheme is managed by trustees. The calculation of the benefit requires assumptions to be made of future outcomes, the principal ones being in respect of increase in remuneration and the discount rate used to convert future cash flows to current values. The assumptions used for the plan are determined by independent actuary on annual basis.
4.7 Recoverable amounts of assets / cash generating units and impairment
The management of the Company reviews carrying amounts of its assets including goodwill, long term investments, receivables and advances and cash generating units for possible impairment and makes formal estimates of recoverable amount if there is any such indication and in case of goodwill formal estimates of recoverable amount is made on annual basis.
4.8 Intangibles
The Company reviews the rate of amortization and value of intangible assets for possible impairment, on an annual basis. Any change in the estimates in future years might affect the carrying amounts of intangible assets with a corresponding affect on the amortization charge and impairment.
4.9 Taxation
The Company takes into account the current income tax law and decisions taken by the taxation authorities. Instances where the Company’s views differ from the views taken by the income tax department at the assessment stage and where the Company considers that its view on items of material nature is in accordance with law, the amounts are shown as contingent liabilities.
4.10 Measurement of fair value for biological assets
Management of the Company regularly reviews significant unobservable inputs and valuation adjustments used to arrive at fair value of biological assets. Any change in those inputs and valuation adjustment might affect valuation of biological assets and accordingly charge to the statement of profit or loss.
5 SUMMARY OF SIGNIFICANT ACCOUNTING POLICIES
The significant accounting policies have been applied consistently to all periods presented in these financial statements, except as disclosed in note 5.1. 5.1 Property, plant and equipment
Owned
Property, plant and equipment, except freehold land are stated at cost less accumulated depreciation and any identified impairment losses. Freehold land and capital work in progress are stated at cost less any identified impairment losses. Cost comprises purchase price, including import duties and non-refundable purchase taxes, after deducting trade discounts and rebates, and includes other costs directly attributable to the acquisition or construction, erection and installation. Cost in relation to certain property, plant and equipment signifies historical cost and borrowing costs as referred to in note 5.13.
Notes to the Unconsolidated Financial StatementsFor the year ended 30 September 2018

Ann
ual R
epor
t 201
8
61
Fina
ncia
l Sta
tem
ents
Oth
er In
form
atio
nC
ompa
ny R
evie
w
Subsequent costs are included in the asset’s carrying amount or recognized as a separate asset, as appropriate, only when it is probable that future economic benefits associated with the item will flow to the Company and the cost of the item can be measured reliably. Major repairs and improvements are capitalized. All other repair and maintenance costs are charged to statement of profit or loss during the period in which they are incurred.
The amendments to IAS 16 Property, plant and equipment and IAS 41 Agriculture define a bearer plant and require biological assets that meet the definition of a bearer plant to be accounted for as property, plant and equipment in accordance with IAS 16, instead of IAS 41. In terms of the amendments, bearer plants can be measured using either the cost model or the revaluation model set out in IAS 16 and not at fair value as previously measured.
The Company’s sugarcane roots qualify as bearer plants under the definition in IAS 41 Agriculture and
are therefore accounted for under the rules for property, plant and equipment. Sugarcane roots are stated at cost less accumulated depreciation and accumulated impairment losses.
Costs capitalized to sugarcane roots include preparing the land, maintaining a source of seed cane, planting the seed cane and costs related to establishing new area under cane. Depreciation of bearer plants commence when they are ready for their intended use. Costs incurred for infilling including block infilling are generally recognized in the statement of profit or loss unless there is a significant increase in the yield of the sections, in which case such costs are capitalized and depreciated over the remaining useful life of the respective fields. Depreciation on bearer plants is recognized so as to write off its cost less residual values over useful lives, using the straight-line method. The estimated useful lives, residual values and depreciation method are reviewed at the end of each reporting period, with the effect of any changes in estimate accounted for on a prospective basis. Estimated useful lives of the bearer plants has been determined to be 6 years.
Depreciation is charged to statement of profit or loss on reducing balance method so as to write off
the written down value of assets over their estimated useful lives at rates disclosed in note 19.1, except that straight-line method is used for assets related to Corporate Farms. However, sometimes, the future economic benefits embodied in an asset are absorbed in producing other assets. In this case, the depreciation charge constitutes part of the cost of the other asset and is included in its carrying amount.
Depreciation on additions is charged from the date when the asset is available for use, while no
depreciation is charged on the date of disposal. The Company assesses at each statement of financial position date whether there is any indication that
property, plant and equipment may be impaired. If such indication exists, the carrying amounts of such assets are reviewed to assess whether they are recorded in excess of their recoverable amount. Where carrying values exceed the respective recoverable amount, assets are written down to their recoverable amounts and the resulting impairment loss is recognized in statement of profit or loss. The recoverable amount is the higher of an asset’s fair value less costs to sell and value in use. Where an impairment loss is recognized, the depreciation charge is adjusted in the future periods to allocate the asset’s revised carrying amount over its estimated useful life.
The gain or loss on disposal or retirement of an asset represented by the difference between the sale
proceeds and the carrying amount of the asset is recognized as an income or expense. Leased
Assets held under finance lease arrangements are initially recorded at the lower of present value of minimum lease payments under the lease agreements and the fair value of the leased assets. Depreciation on leased assets is charged by applying reducing balance method at the rates used for similar owned assets, so as to depreciate the assets over their estimated useful lives in view of certainty of ownership of assets at end of the lease term.

JDW
Sug
ar M
ills
Lim
ited
62
5.2 Intangibles
Goodwill
Goodwill arising on the acquisition of the subsidiaries is measured at cost less accumulated impairment losses.
Computer software
Expenditure incurred to acquire computer software is capitalized as an intangible asset and stated at cost less accumulated amortization (for finite useful life of intangible asset) and any identified impairment loss. The estimated useful life and amortization method is reviewed at the end of each annual reporting period, with effect of any changes in estimate being accounted for on a prospective basis.
Intangible assets with finite useful life are amortized using straight-line method over its useful period.
Amortization on additions to intangible assets is charged from the date when an asset is put to use and on disposal up to the date of disposal.
Subsequent expenditure is capitalized only when it increases the future economic benefits embodied in
the specific assets to which it relates. 5.3 Stores, spare parts and loose tools
These are stated at lower of cost and net realizable value. Cost is determined using the weighted average method. Items in transit are valued at cost comprising invoice value plus other charges paid thereon.
The Company reviews the stores and spare parts for possible impairment on an annual basis. Any change in estimates in future years might affect the carrying amounts of respective items of stores and spare parts with a corresponding effect on provision.
5.4 Stock-in-trade
These are valued at the lower of weighted average cost and net realizable value except for stock in transit, which is valued at cost comprising invoice value and related expenses incurred thereon up to the statement of financial position date.
Cost is determined as follows:
Raw materials Average cost Work-in-process and finished goods Average manufacturing cost Molasses and bagasse - by products Net realizable value
Net realizable value is the estimated selling price in the ordinary course of business, less estimated
selling expenses. The cost of harvested crops transferred from biological assets to stock-in-trade is its fair value less cost
to sell at the date of harvest. 5.5 Biological assets
Consumable biological assets, comprising standing sugarcane, wheat and guar, are measured at their fair value determined by discounting future cash flows from operations over the estimated useful life of the biological assets using Company’s weighted average cost of capital. Significant assumptions used are stated in note 25.1 to these unconsolidated financial statements. Fair value is deemed to approximate the cost when little biological transformation has taken place or the impact of the transformation on price is not expected to be material.
The sugarcane roots are bearer plants and are therefore presented and accounted for as property, plant and equipment. However, the standing cane, wheat and guar are accounted for as biological assets until the point of harvest. Sugarcane, wheat and guar are transferred to inventory at fair value less costs to sell when harvested. Changes in fair value of sugarcane, wheat and guar are recognized in the statement of profit or loss.
Notes to the Unconsolidated Financial StatementsFor the year ended 30 September 2018

Ann
ual R
epor
t 201
8
63
Fina
ncia
l Sta
tem
ents
Oth
er In
form
atio
nC
ompa
ny R
evie
w
5.6 Employee benefits
5.6.1 Defined contribution plan
The Company operates approved contributory provident fund for its eligible employees. Equal monthly contribution is made both by the Company and employee to the fund at the rate of 10% of basic salary.
5.6.2 Defined benefit plans
The Company operates an approved funded defined benefit gratuity plan covering all of its eligible employees who have completed the minimum qualifying period. The calculation of defined benefit obligation is performed by qualified actuary by using the projected unit credit method and charge for the year other than on account of experience adjustment is included in statement of profit or loss.
Remeasurement of the net defined benefit liability, which comprise actuarial gains and losses, the
return on plan assets (excluding interest) and the effect of asset ceiling (if any, excluding interest), are recognized immediately in other comprehensive income. The Company determines the net interest expense / (income) on the net defined liability / (asset) for the period by applying the discount rate used to measure the defined benefit obligation at the beginning of the annual period to the then - net defined benefit liability / (asset) during the period as a result of contributions and benefit payments. Net interest expense and other expenses related to defined benefit plans are recognized in statement of profit or loss.
5.7 Taxation
Income tax expense comprises current and deferred tax.
Current
Provision of current tax is based on the taxable income for the year determined in accordance with the prevailing law for taxation of income. The charge for current tax is calculated using enacted or substantially enacted at the reporting date and after taking into account tax credits, rebates and exemptions, if any. The charge for current tax also includes adjustments, where considered necessary, to provision for tax made in previous years arising from assessments framed during the year for such years.
Deferred
Deferred tax is recognized in respect of temporary differences between the carrying amounts of assets and liabilities for financial reporting purposes and the amounts used for taxation purposes.
Deferred tax is not recognized for:
– temporary differences on the initial recognition of assets or liabilities in a transaction that is not a business combination and that affects neither accounting nor taxable profit or loss;
– temporary differences related to investments in subsidiaries, associates and joint arrangements to the extent that the Group is able to control the timing of the reversal of the temporary differences and it is probable that they will not reverse in the foreseeable future; and
– taxable temporary differences arising on the initial recognition of goodwill. Deferred tax assets are recognized for unused tax losses, unused tax credits and deductible temporary
differences to the extent that it is probable that future taxable profits will be available against which they can be used. Future taxable profits are determined based on the reversal of relevant taxable temporary differences. If the amount of taxable temporary differences is insufficient to recognize a deferred tax asset in full, then future taxable profits, adjusted for reversals of existing temporary differences, are considered. Deferred tax assets are reviewed at each reporting date and are reduced to the extent that it is no longer probable that the related tax benefit will be realized; such reductions are reversed when the probability of future taxable profits improves.
Unrecognized deferred tax assets are reassessed at each reporting date and recognized to the extent that it has become probable that future taxable profits will be available against which they can be used.

JDW
Sug
ar M
ills
Lim
ited
64
Deferred tax is measured at the tax rates that are expected to be applied to temporary differences when they reverse, using tax rates enacted or substantively enacted at the reporting date.
The measurement of deferred tax reflects the tax consequences that would follow from the manner in
which the Company expects, at the reporting date, to recover or settle the carrying amount of its assets and liabilities. For this purpose, the carrying amount of investment property measured at fair value is presumed to be recovered through sale, and the Company has not rebutted this presumption.
5.8 Revenue recognition
Revenue from sale of goods is measured at fair value of the consideration received or receivable, net of discounts and applicable taxes. Revenue is recognized when the significant risks and rewards of ownership have been transferred to the customer, recovery of the consideration is probable, the associated costs and possible return of goods can be estimated reliably, there is no continuing involvement of management with the goods and the amount of revenue can be measured reliably.
– Revenue from sale of goods is recorded when significant risks and rewards of ownership are
transferred to the customer, which coincides with the date of delivery. Sale of goods comprise the sale of sugar, agriculture produce and agri inputs;
– Revenue from the sale of electricity is recognized on transmission of electricity;
– Rental income are recognized on accrual basis and is disclosed under other income in the statement of profit or loss;
– Dividend income is recognized when the Company’s right to receive the dividend is established and included in operating profit in the statement of profit or loss as part of other income;
– Interest income is recognized as and when accrued on effective interest method. Interest income is disclosed under other income in the statement of profit or loss; and
– Government incentive relating to export sales are recognized when the right to receive such incentives has been established and the underlying conditions are met.
NEPRA in its review decision in the matter of Quarterly Indexations of Tariff for all Bagasse Based Co-Generation Power Plants including the Company, identified that it has made an inadvertent calculation error in the debt servicing component approved in a number of quarterly indexation decisions of the Company and decided to rectify the same under Section 7 of Regulation of Generation, Transmission and Distribution of Electric Power Act, 1997 read with Regulation 3 of National Electric Power Regulatory Authority (Review Procedure) Regulations, 2009. Accordingly, the debt servicing components were revised and deemed replaced retrospectively.
5.9 Provisions
Provisions are recognized when the Company has a present legal or constructive obligation as a result of past event and it is probable that an outflow of economic benefits will be required to settle the obligation and a reliable estimate can be made. Provisions are reviewed at each statement of financial position date and adjusted to reflect the current best estimate.
5.10 Leases
Leases are classified as finance lease whenever terms of the lease transfer substantially all risks and rewards of ownership to the lessee. All other leases are classified as operating leases.
Finance leases
Finance leases are stated at amounts equal to the fair value or, if lower, the present value of the minimum lease payments. The minimum lease payments are apportioned between the finance charge and the reduction of the outstanding liability. The finance cost is charged to statement of profit or loss.
The related rental obligations, net of finance costs, are included in liabilities against assets subject to
finance lease. The liabilities are classified as current and non-current depending upon the timing of the payment.
Notes to the Unconsolidated Financial StatementsFor the year ended 30 September 2018

Ann
ual R
epor
t 201
8
65
Fina
ncia
l Sta
tem
ents
Oth
er In
form
atio
nC
ompa
ny R
evie
w
Operating lease / Ijarah contracts
Leases where a significant portion of the risks and rewards of ownership are retained by the lessor, are classified as operating leases. Payments made under operating leases (net of any incentives received from the lessor) are charged to profit on a straight-line basis over the lease / ijarah term unless another systematic basis is representative of the time pattern of the Company’s benefit.
5.11 Financial instruments
Financial instruments recognized on the statement of financial position include investments, long-term loans and receivables, derivative instruments, trade and other receivables, cash and cash equivalents, trade and other payables and interest-bearing debt.
The Company classifies its financial assets at fair value through profit or loss and loans and receivables.
The classification depends on the purpose for which the financial assets were acquired. Management determines the classification of its financial assets at initial recognition. The Company classifies its financial liabilities apart from derivatives as other financial liabilities. Derivative financial liabilities are classified as financial liabilities at fair value through profit or loss.
Financial assets at fair value through profit or loss
Financial assets at fair value through profit or loss comprise derivative instruments. A financial asset is classified in this category if acquired principally for the purpose of selling in the short-term. Assets in this category are classified as current assets. Gains or losses arising from changes in the fair value of the financial assets at fair value through profit or loss are recognized in the statement of profit or loss in the period in which they arise.
Financial assets carried at fair value through profit or loss are initially recognized at fair value and
transaction costs are expensed in the statement of profit or loss. Financial liabilities at fair value through profit or loss
Financial liabilities at fair value through profit or loss comprise derivative instruments. Gains or losses arising from changes in the fair value of the derivatives at fair value through profit or loss are recognized in the statement of profit or loss in the period in which they arise.
Financial liabilities carried at fair value through profit or loss are initially recognized at fair value and
transaction costs are expensed in the statement of profit or loss.
Other financial liabilities
Other financial liabilities consist of trade and other payables and interest-bearing borrowings. These represent financial liabilities which are not classified as financial liabilities at fair value through profit or loss. They are included in current liabilities, except for maturities greater than 12 months after the end of the reporting period. These are classified as non-current liabilities.
Derecognition
Financial assets (or a portion thereof) are derecognized when the rights to receive cash flows from the asset have expired or have been transferred and the Company has substantially transferred all risks and rewards of ownership. On derecognition, the difference between the carrying amount of the financial asset and the proceeds receivable is included in the statement of profit or loss.
Financial liabilities (or a portion thereof) are derecognized when the obligation specified in the contract
is discharged, cancelled or expires. On derecognition, the difference between the carrying amount of the financial liability, and any amount paid is included in the statement of profit or loss.
Recognition and measurement
Investments are initially recognized at fair value plus transaction costs for all financial assets not carried at fair value through profit or loss. Financial assets and liabilities at fair value through profit or loss are subsequently carried at fair value. Loans and receivables and other financial liabilities are carried at amortized cost using the effective interest rate method.
JDW
Sug
ar M
ills
Lim
ited
66
Gains or losses arising from changes in the fair value of the financial assets at fair value through profit or loss category are presented in the statement of profit or loss in the period in which they arise. Dividend income from these assets is recognized in the statement of profit or loss when the Company’s right to receive payment is established.
Impairment of financial assets
Assets carried at amortized cost
The Company assesses at the end of each reporting date whether there is objective evidence that a financial asset or group of financial assets is impaired. A financial asset or a group of financial assets is impaired and impairment losses are incurred only if there is objective evidence of impairment as a result of one or more events that occurred after the initial recognition of the asset (a loss event) and that loss event (or events) has an impact on the estimated future cash flows of the financial asset or group of financial assets that can be reliably estimated.
Evidence of impairment may include indications that the debtors or a group of debtors is experiencing
significant financial difficulty, default or delinquency in interest or principal payments, the probability that they will enter bankruptcy or other financial reorganization, and where observable data indicate that there is a measurable decrease in the estimated future cash flows, such as changes in arrears or economic conditions that correlate with defaults.
For loans and receivables category, the amount of the loss is measured as the difference between the
asset’s carrying amount and the present value of estimated future cash flows (excluding future credit losses that have not been incurred), discounted at the financial asset’s original effective interest rate. The carrying amount of the asset is reduced and the amount of the loss is recognized in the statement of profit or loss. If a loan or held-to-maturity investment has a variable interest rate, the discount rate for measuring any impairment loss is the current effective interest rate determined under the contract.
If, in a subsequent period, the amount of the impairment loss decreases and the decrease can be
related objectively to an event occurring after the impairment was recognized (such as an improvement in the debtor’s credit rating), the reversal of the previously recognized impairment loss is recognized in the statement of profit or loss.
Loans and receivables
Loans and receivables are non-derivative financial assets with fixed or determinable payments that are not quoted in an active market.
Trade debts
Trade debts are stated initially at the fair value. Subsequent to initial recognition, these are stated at their amortized cost as reduced by appropriate provision for impairment, known impaired receivables are written off, while receivables considered doubtful are fully provided for.
Cash and cash equivalents
For the purpose of cash flow statement cash and cash equivalents comprise cash in hand, bank balances, running finances and morabaha finances which are stated in the statement of financial position at cost.
Mark-up bearing borrowings
Mark-up bearing borrowings are recognized initially at cost representing the fair value of consideration received less attributable transaction costs. Subsequent to initial recognition, mark-up bearing borrowings are stated at original cost less subsequent repayments, while the difference between the original recognized amounts (as reduced by periodic payments) and redemption value is recognized in the statement of profit or loss over the period of borrowings on an effective rate basis. The borrowing cost on qualifying asset is included in the cost of related asset.
5.12 Business combination
Business combinations are accounted for by applying the acquisition method. The cost of acquisition is measured as the fair value of assets given, equity instruments issued and the liabilities incurred or
Notes to the Unconsolidated Financial StatementsFor the year ended 30 September 2018

Ann
ual R
epor
t 201
8
67
Fina
ncia
l Sta
tem
ents
Oth
er In
form
atio
nC
ompa
ny R
evie
w
assumed at the date of acquisition. The consideration transferred includes the fair value of any asset or liability resulting from a contingent consideration arrangement, if any. Acquisition-related costs are expensed as incurred. Identifiable assets acquired and liabilities and contingent liabilities assumed in a business combination are measured initially at their fair values at the acquisition date. The excess of the consideration transferred over the fair value of the identifiable net assets acquired is recorded as goodwill. If this is less than the fair value of the net assets acquired in the case of a bargain purchase, the difference is recognized directly in the statement of profit or loss.
5.13 Borrowing cost
Borrowing costs directly attributable to the acquisition, construction or production of qualifying assets, which are assets that necessarily take a substantial period of time to get ready for their intended use, are added to the cost of those assets, until such time as the assets are substantially ready for their intended use. All other borrowing costs are recognized in statement of profit or loss as incurred.
5.14 Foreign currency transactions
Transactions in foreign currencies are translated to the respective functional currencies of the Company at exchange rates at the dates of the transactions. Monetary assets and liabilities denominated in foreign currencies at the reporting date are retranslated to the functional currency at the exchange rate at the reporting date. The foreign currency gain or loss on monetary items is the difference between amortized cost in the functional currency at the beginning of the year, adjusted for effective interest and payments during the year, and the amortized cost in foreign currency translated at the exchange rate at the end of the year.
Non-monetary assets and liabilities that are measured at fair value in a foreign currency are retranslated
to the functional currency at the exchange rate at the date that the fair value was determined. Non-monetary items that are measured based on historical cost in a foreign currency are not translated again at the reporting date.
Foreign currency differences arising on retranslation are generally recognized in statement of profit or
loss.
5.15 Investments
Investment in equity instruments of subsidiary companies
Investment in subsidiary company is measured at cost in the Company’s separate financial statements, as per the requirements of IAS-27 “Separate Financial Statements”. However, at subsequent reporting dates, the Company reviews the carrying amount of the investment and its recoverability to determine whether there is an indication that such investment has suffered an impairment loss. If any such indication exists the carrying amount of the investment is adjusted to the extent of impairment loss. Impairment losses are recognized as an expense. Where impairment losses subsequently reverse, the carrying amounts of the investments are increased to the revised recoverable amounts but limited to the extent of initial cost of investments. A reversal of impairment loss is recognized in unconsolidated statement of profit or loss.
Investments in equity instruments of associated companies
Associates are all entities over which the Company has significant influence but no control. Investments in associates are measured at cost less any identified impairment loss if any in the Company’s separate financial statements. However, at subsequent reporting dates, the Company reviews the carrying amount of the investment and its recoverability to determine whether there is an indication that such investment has suffered an impairment loss. If any such indication exists the carrying amount of the investment is adjusted to the extent of impairment loss. Impairment losses are recognized as an expense.
5.16 Investment property
Investment property is property held either to earn rental income or for capital appreciation or for both, but not for sale in ordinary course of business, use in production or supply of goods or services as for administrative purpose.

JDW
Sug
ar M
ills
Lim
ited
68
The Company’s investment property comprises of land which is carried at cost less identified impairment loss, if any. The Company assesses at each statement of financial position date whether there is any indication that investment property may be impaired. If such indication exists, the carrying amount of such assets are reviewed to assess whether they are recorded in excess of their recoverable amount. Where carrying value exceeds the respective recoverable amount, assets are written down to their recoverable amounts and the resulting impairment loss is recognized in the statement of profit or loss for the year. The recoverable amount is the higher of an asset’s fair value less costs to sell and value-in-use.
The gain or loss on disposal or retirement of an asset represented by the difference between the sale
proceeds and the carrying amounts of the asset is recognized as an income or expense. 5.17 Dividend
Dividend to ordinary shareholders is recognized as a deduction from accumulated profit in statement of changes in equity and as a liability in the Company’s financial statements in the year in which it is declared by the Company’s shareholders.
5.18 Earnings per share (EPS)
Basic EPS is calculated by dividing the profit or loss attributable to ordinary shareholders of the Company by weighted average number of ordinary shares outstanding during the year.
Diluted EPS is calculated by adjusting basic EPS with weighted average number of ordinary shares that
would be issued on conversion of all dilutive potential ordinary shares into ordinary shares and post-tax effect of changes in profit or loss attributable to ordinary shareholders of the Company that would result from conversion of all dilutive potential ordinary shares into ordinary shares.
6 STANDARDS, AMENDMENTS AND INTERPRETATIONS AND FORTH COMING REQUIREMENTS
6.1 Standards, amendments and interpretations to existing standards that are not yet effective but applicable / relevant to the Company’s operations.
6.1.1 IFRIC 4, Determining Whether an Arrangement Contains a Lease’ is applicable for annual periods beginning on or after January 1, 2006, however, Securities and Exchange Commission of Pakistan (SECP) granted waiver from the application of IFRIC 4 to all companies including power sector companies. This interpretation provides guidance on determining whether arrangements that do not take the legal form of a lease should, nonetheless, be accounted for as a lease in accordance with IAS 17, ‘Leases’.
Consequently, the Company is not required to account for a portion of its Energy Purchase Agreement
(EPA) as a lease under IAS 17. If the Company were to follow IFRIC 4 and IAS 17, the effect on the financial statements would be as follows:
2018 2017 Rupees Rupees
De-recognition of property, plant and equipment (4,897,686,962) (5,188,050,413) Recognition of lease debtor 6,516,865,697 6,792,460,189 Increase in deferred tax liability 469,561,833 481,322,933 Increase in un-appropriated profit at beginning of the year 513,825,774 276,877,594 (Decrease) / increase in profit for the year - net of tax (21,397,049) 236,948,180 Increase in un-appropriated profit at end of the year 492,428,725 513,825,774
Notes to the Unconsolidated Financial StatementsFor the year ended 30 September 2018

Ann
ual R
epor
t 201
8
69
Fina
ncia
l Sta
tem
ents
Oth
er In
form
atio
nC
ompa
ny R
evie
w
6.2 New Companies Act, 2017 and new and revised approved accounting standards, interpretations and amendments thereto
6.2.1 With effect from 1 January 2018, Companies Act, 2017 has become applicable. The new Act specified certain additional disclosures to be included in these unconsolidated financial statements. Accordingly, the Company has presented the required disclosures in these unconsolidated financial statements and represented certain comparatives. However there was no change in the reported amounts of statement of profit or loss and other comprehensive income or the amounts presented in the unconsolidated statement of financial position due to these re-presentations. Further, significant reclassifications / representations include unclaimed dividend and dividend payable which were previously classified under trade and other payables have now been presented separately in the unconsolidated statement of financial position.
6.2.2 The following standards, amendments and interpretations of approved accounting standards will be effective for accounting periods beginning on or after 01 October 2018:
– Classification and Measurement of Share-based Payment Transactions - amendments to IFRS 2
clarify the accounting for certain types of arrangements and are effective for annual periods beginning on or after 1 January 2018. The amendments cover three accounting areas (a) measurement of cash-settled share-based payments; (b) classification of share-based payments settled net of tax withholdings; and (c) accounting for a modification of a share-based payment from cash-settled to equity-settled. The new requirements could affect the classification and / or measurement of these arrangements and potentially the timing and amount of expense recognized for new and outstanding awards. The amendments are not likely to have an impact on Company’s financial statements.
– Transfers of Investment Property (Amendments to IAS 40 ‘Investment Property’ - effective for annual
periods beginning on or after 1 January 2018) clarifies that an entity shall transfer a property to, or from, investment property when, and only when there is a change in use. A change in use occurs when the property meets, or ceases to meet, the definition of investment property and there is evidence of the change in use. In isolation, a change in management’s intentions for the use of a property does not provide evidence of a change in use. The amendments are not likely to have an impact on Company’s financial statements.
Annual improvements to IFRS standards 2014-2016 cycle. The new cycle of improvements addresses improvements to following approved accounting standards:
– Amendments to IAS 28 ‘Investments in Associates and Joint Ventures’ (effective for annual periods
beginning on or after 1 January 2018) clarifies that a venture capital organization and other similar entities may elect to measure investments in associates and joint ventures at fair value through profit or loss, for each associate or joint venture separately at the time of initial recognition of investment. Furthermore, similar election is available to non-investment entity that has an interest in an associate or joint venture that is an investment entity, when applying the equity method, to retain the fair value measurement applied by that investment entity associate or joint venture to the investment entity associate’s or joint venture’s interests in subsidiaries. This election is made separately for each investment entity associate or joint venture. The amendments are not likely to have an impact on these unconsolidated financial statements.
– IFRIC 22 ‘Foreign Currency Transactions and Advance Consideration’ (effective for annual periods
beginning on or after 1 January 2018) clarifies which date should be used for translation when a foreign currency transaction involves payment or receipt in advance of the item it relates to. The related item is translated using the exchange rate on the date the advance foreign currency is received or paid and the prepayment or deferred income is recognized. The date of the transaction for the purpose of determining the exchange rate to use on initial recognition of the related asset, expense or income (or part of it) would remain the date on which receipt of payment from advance consideration was recognized. If there are multiple payments or receipts in advance, the entity shall determine a date of the transaction for each payment or receipt of advance consideration.

JDW
Sug
ar M
ills
Lim
ited
70
– IFRIC 23 ‘Uncertainty over Income Tax Treatments’ (effective for annual periods beginning on or after 1 January 2019) clarifies the accounting for income tax when there is uncertainty over income tax treatments under IAS 12. The interpretation requires the uncertainty over tax treatment be reflected in the measurement of current and deferred tax.
– IFRS 15 ‘Revenue from contracts with customers’ (effective for annual periods beginning on or after
01 July 2018). IFRS 15 establishes a comprehensive framework for determining whether, how much and when revenue is recognized. It replaces existing revenue recognition guidance, including IAS 18 ‘Revenue’, IAS 11 ‘Construction Contracts’ and IFRIC 13 ‘Customer Loyalty Programmes’. The Company is currently in the process of analyzing the potential impact of changes required in revenue recognition policies on adoption of the standard.
– IFRS 9 ‘Financial Instruments’ and amendment – Prepayment Features with Negative Compensation
(effective for annual periods beginning on or after 01 July 2018 and 01 January 2019 respectively). IFRS 9 replaces the existing guidance in IAS 39 Financial Instruments: Recognition and Measurement. IFRS 9 includes revised guidance on the classification and measurement of financial instruments, a new expected credit loss model for calculating impairment on financial assets, and new general hedge accounting requirements. It also carries forward the guidance on recognition and derecognition of financial instruments from IAS 39. The Company is currently in the process of analyzing the potential impact of changes required in classification, measurement of financial instruments and the disclosure requirements of the standard.
– IFRS 16 ‘Leases’ (effective for annual period beginning on or after 01 January 2019). IFRS 16 replaces
existing leasing guidance, including IAS 17 ‘Leases’, IFRIC 4 ‘Determining whether an Arrangement contains a Lease’, SIC-15 ‘Operating Leases- Incentives’ and SIC-27 ‘Evaluating the Substance of Transactions Involving the Legal Form of a Lease’. IFRS 16 introduces a single, on-statement of financial position lease accounting model for lessees. A lessee recognizes a right-of-use asset representing its right to use the underlying asset and a lease liability representing its obligation to make lease payments. There are recognition exemptions for short-term leases and leases of low value items. Lessor accounting remains similar to the current standard i.e. lessors continue to classify leases as finance or operating leases. The application of the standard is likely to have a material impact on the Company’s financial statements. The Company is currently in the process of analyzing the potential impact of changes required in classification, measurement of financial instruments and the disclosure requirements of the standard.
– Amendment to IAS 28 ‘Investments in Associates and Joint Ventures’ - Long Term Interests in
Associates and Joint Ventures (effective for annual period beginning on or after 01 January 2019). The amendment will affect companies that finance such entities with preference shares or with loans for which repayment is not expected in the foreseeable future (referred to as long-term interests or ‘LTI’). The amendment and accompanying example state that LTI are in the scope of both IFRS 9 and IAS 28 and explain the annual sequence in which both standards are to be applied. The amendment is not likely to have an impact on Company’s financial statements.
– Amendments to IAS 19 ‘Employee Benefits’- Plan Amendment, Curtailment or Settlement (effective
for annual periods beginning on or after 01 January 2019). The amendments clarify that on amendment, curtailment or settlement of a defined benefit plan, a company now uses updated actuarial assumptions to determine its current service cost and net interest for the period; and the effect of the asset ceiling is disregarded when calculating the gain or loss on any settlement of the plan and is dealt with separately in statement of other comprehensive income. The application of the amendments is not likely to have an impact on Company’s financial statements.
Annual Improvements to IFRS 2015–2017 Cycle - the improvements address amendments to
following approved accounting standards:
Notes to the Unconsolidated Financial StatementsFor the year ended 30 September 2018

Ann
ual R
epor
t 201
8
71
Fina
ncia
l Sta
tem
ents
Oth
er In
form
atio
nC
ompa
ny R
evie
w
– IFRS 3 Business Combinations and IFRS 11 Joint Arrangement - the amendment aims to clarify the accounting treatment when a company increases its interest in a joint operation that meets the definition of a business. A company remeasures its previously held interest in a joint operation when it obtains control of the business. A company does not remeasure its previously held interest in a joint operation when it obtains joint control of the business.
– IAS 12 Income Taxes - the amendment clarifies that all income tax consequences of dividends
(including payments on financial instruments classified as equity) are recognized consistently with the transaction that generates the distributable profits.
– IAS 23 Borrowing Costs - the amendment clarifies that a company treats as part of general borrowings
any borrowing originally made to develop an asset when the asset is ready for its intended use or sale.
The above amendments are not likely to have an impact on Company’s financial statements.
2018 2017 Rupees Rupees
7 SHARE CAPITAL
7.1 Authorized share capital 75,000,000 (2017: 75,000,000) voting ordinary shares of Rs. 10 each 750,000,000 750,000,000 25,000,000 (2017: 25,000,000) preference shares of Rs. 10 each 250,000,000 250,000,000 1,000,000,000 1,000,000,000 7.2 Issued, subscribed and paid up share capital 32,145,725 (2017: 32,145,725) voting ordinary shares of Rs. 10 each fully paid in cash 321,457,250 321,457,250 27,630,936 (2017: 27,630,936) voting bonus shares of Rs. 10 each fully paid 276,309,360 276,309,360 597,766,610 597,766,610
Mr. Jahangir Khan Tareen (Executive Director) holds 12,802,293 (2017: 13,042,293) and Mukhdoom
Syed Ahmed Mahmud (Non-Executive Director) holds 15,843,932 (2017: 15,603,932) ordinary shares of Rs. 10 each representing 21.42% (2017: 21.82%) and 26.51% (2017: 26.10%) of the paid up capital of the Company respectively.
8 SHARE PREMIUM RESERVE
This reserve can be utilized by the Company only for the purposes specified in section 81 (2) and 81 (3) of the Companies Act, 2017.

JDW
Sug
ar M
ills
Lim
ited
72
Note 2018 2017 Rupees Rupees
9 REDEEMABLE CAPITAL - SECURED
Privately Placed Term Finance Certificates - II 9.1 – 83,333,333 Current portion of non-current liabilities 15 – (83,333,333) – – 9.1 Privately Placed Term Finance Certificates - II
During the period, the Company has fully repaid to TFC holders an amount of Rs. 83.33 million (2017: Rs. 111.11 million). These carried mark-up at three months KIBOR plus 100 bps per annum (2017: three months KIBOR plus 100 bps per annum).
Note 2018 2017 Rupees Rupees
10 LONG TERM FINANCES - SECURED
Mark-up bearing finances from conventional bank 10.1.1 9,580,302,716 10,428,383,065 Islamic mode of financing 10.1.2 3,206,160,271 2,495,929,882 10.1 & 10.2 12,786,462,987 12,924,312,947 Current maturity presented under current liabilities: - Mark-up bearing finances from conventional bank (3,254,290,948) (2,806,999,273)- Islamic mode of financing (746,477,568) (325,000,000) 15 (4,000,768,516) (3,131,999,273) 8,785,694,471 9,792,313,674
Notes to the Unconsolidated Financial StatementsFor the year ended 30 September 2018

Ann
ual R
epor
t 201
8
73
Fina
ncia
l Sta
tem
ents
Oth
er In
form
atio
nC
ompa
ny R
evie
w
10.1 Long term finances - secured
Mark-up Loan Grace
Year Principal Principal
basis
Limit duration period
of loan outstanding outstanding
maturity 2018 2017
Rupees Years Years Rupees Rupees
10.1.1 Mark-up bearing finances from conventional bank
MCB Bank Limited - Led Syndicate
MCB Bank Limited 3mk + 1.00 1,000,000,000 07 Years 1.5 Years 2020 363,636,363 545,454,545
United Bank Limited 3mk + 1.00 500,000,000 07 Years 1.5 Years 2020 181,818,179 272,727,273
Allied Bank Limited 3mk + 1.00 940,000,000 07 Years 1.5 Years 2020 341,818,180 512,727,272
Askari Bank Limited 3mk + 1.00 500,000,000 07 Years 1.5 Years 2020 181,818,179 272,727,271
Habib Metropolitan Bank 3mk + 1.00 100,000,000 07 Years 1.5 Years 2020 36,363,637 54,545,455
The Bank of Punjab 3mk + 1.00 800,000,000 07 Years 1.5 Years 2020 290,909,090 436,363,636
JS Bank Limited 3mk + 1.00 150,000,000 07 Years 1.5 Years 2020 54,545,459 81,818,185
Meezan Bank Limited 3mk + 1.00 350,000,000 07 Years 1.5 Years 2020 127,156,290 190,734,434
4,340,000,000 1,578,065,377 2,367,098,071
Pak Oman Investment Company Limited (I) 3mk + 1.00 500,000,000 06 Years 01 Year 2020 175,000,000 275,000,000
Pak Oman Investment Company Limited (II) 3mk + 1.00 500,000,000 06 Years 01 Year 2022 375,000,000 475,000,000
The Bank of Punjab (I) 3mk + 1.00 300,000,000 06 Years 01 Year 2020 119,985,680 179,985,680
The Bank of Punjab (II) 3mk + 1.00 700,000,000 06 Years 01 Year 2020 280,000,000 420,000,000
The Bank of Punjab (III) 3mk + 1.00 500,000,000 05 Years 01 Year 2021 375,000,000 500,000,000
The Bank of Punjab (IV) 3mk + 1.00 750,000,000 05 Years 01 Year 2023 749,885,094 –
MCB Bank Limited (NIB) 3mk + 1.00 500,000,000 05 Years – 2020 155,074,890 258,458,150
Pak Libya Holding Company Limited 3mk + 1.00 100,000,000 05 Years – 2020 45,000,000 65,000,000
National Bank of Pakistan Limited (I) 3mk + 1.00 1,000,000,000 05 Years 01 Year 2020 562,500,000 812,500,000
National Bank of Pakistan Limited (II) 3mk + 0.50 1,000,000,000 05 Years 01 Year 2022 1,000,000,000 965,966,161
Soneri Bank Limited (I) 3mk + 1.00 300,000,000 05 Years – 2021 180,000,000 240,000,000
Soneri Bank Limited (II) 3mk + 1.00 500,000,000 05 Years 01 Year 2022 500,000,000 500,000,000
Faysal Bank Limited (I) 6mk + 1.00 500,000,000 05 Years – 2018 – 125,000,000
Faysal Bank Limited (II) 3mk + 1.00 650,000,000 06 Years – 2020 189,583,339 297,916,671
Faysal Bank Limited (III) 3mk + 1.00 500,000,000 05 Years – 2018 – 166,666,664
Faysal Bank Limited (IV) 3mk + 1.00 1,000,000,000 03 Years – 2019 333,333,336 666,666,668
Pak Brunei Investment Company Limited (I) 3mk + 1.00 200,000,000 6.5 Years 1.5 Years 2017 – 3,750,000
Pak Brunei Investment Company Limited (II) 3mk + 1.00 500,000,000 06 Years 01 Year 2024 500,000,000 –
Standard Chartered Bank (Pakistan) Limited 3mk + 1.00 1,000,000,000 05 Years – 2021 550,000,000 750,000,000
Askari Bank Limited (I) 3mk + 1.00 300,000,000 05 Years – 2021 165,000,000 225,000,000
Askari Bank Limited (II) 3mk + 1.00 500,000,000 05 Years 01 Year 2022 500,000,000 –
Askari Bank Limited (III) 3mk + 1.00 175,000,000 05 Years 01 Year 2023 175,000,000 –
MCB Bank Limited 3mk + 1.00 1,000,000,000 05 Years 02 Years 2021 634,375,000 634,375,000
Habib Bank Limited 6mk + 1.00 500,000,000 05 Years 01 Year 2021 437,500,000 500,000,000
13,475,000,000 8,002,237,339 8,061,284,994
17,815,000,000 9,580,302,716 10,428,383,065
10.1.2 Islamic mode of financing
Dubai Islamic Bank (Pakistan) Limited (I) 3mk + 1.00 500,000,000 5.5 Years 0.5 Year 2020 134,000,000 234,000,000
Dubai Islamic Bank (Pakistan) Limited (II) 3mk + 1.00 500,000,000 05 Years 01 Year 2021 343,750,000 468,750,000
Askari Bank Limited (Islamic) (I) 6mk + 1.00 300,000,000 06 Years 01 Year 2020 120,000,000 180,000,000
Askari Bank Limited (Islamic) (II) 3mk + 1.00 200,000,000 05 Years – 2021 110,000,000 150,000,000
Askari Bank Limited (Islamic) (III) 3mk + 1.00 250,000,000 05 Years 01 Year 2023 250,000,000 –
Faysal Bank Limited (Islamic) 3mk + 1.00 750,000,000 05 Years 01 Year 2023 750,000,000 –
Bank Alfalah Limited (Islamic) 3mk + 0.90 500,000,000 05 Years 01 Year 2022 498,410,271 463,179,882
National Bank of Pakistan (Islamic) 3mk + 0.50 1,000,000,000 05 Years 01 Year 2022 1,000,000,000 1,000,000,000
4,000,000,000 3,206,160,271 2,495,929,882
21,815,000,000 12,786,462,987 12,924,312,947
* 3 mk i.e. 3 months KIBOR

JDW
Sug
ar M
ills
Lim
ited
74
10.2 Long term finances are secured against ranking / joint parri passu charge on land, all present and future fixed assets, plant and machinery of the Company of Rs. 17,049 million (2017: Rs. 18,105 million) and personal guarantees of sponsor directors of the Company.
11 LIABILITIES AGAINST ASSETS SUBJECT TO FINANCE LEASE - SECURED
The amount of future minimum lease payments along with their present value and the periods during which they will fall due are:
2018
Present value Future Finance of future minimum cost for minimum lease future lease Note payments periods payments
Rupees Rupees Rupees
Less than one year 15 115,129,719 9,848,122 105,281,597 Between one and five years 152,863,012 8,185,098 144,677,914 267,992,731 18,033,220 249,959,511
2017
Present value Future Finance of future minimum cost for minimum lease future lease payments periods payments
Rupees Rupees Rupees
Less than one year 15 165,224,811 11,800,308 153,424,503 Between one and five years 158,215,952 5,168,278 153,047,674 323,440,763 16,968,586 306,472,177 Lease rentals are payable on quarterly / monthly basis and include finance cost ranging from three months to one
year KIBOR plus 100 bps per annum (2017: three months to one year KIBOR plus 100 to 300 bps per annum) which has been used as the discounting factor. The Company has the option to purchase the assets upon completion of lease period and has the intention to exercise such option.
Notes to the Unconsolidated Financial StatementsFor the year ended 30 September 2018

Ann
ual R
epor
t 201
8
75
Fina
ncia
l Sta
tem
ents
Oth
er In
form
atio
nC
ompa
ny R
evie
w
2018 2017 Rupees Rupees Restated
12 DEFERRED TAXATION
Deferred tax liability on taxable temporary differences arising in respect of: - accelerated tax depreciation on operating fixed assets 2,836,640,418 2,687,512,697 - leased assets 158,180,423 216,526,671 2,994,820,841 2,904,039,368 Deferred tax asset on deductible temporary differences arising in respect of: - liabilities against assets subject to finance lease (72,488,258) (91,941,653) - provisions for doubtful debts and obsolescence (24,354,082) (25,193,878) - impairment of investment in associate (26,100,000) (27,000,000) - provision for Workers’ Profit Participation Fund – (34,791,430) - tax losses (519,569,799) – - retirement benefits (19,238,864) – - tax credits (715,902,366) (971,128,624) (1,377,653,369) (1,150,055,585) 1,617,167,472 1,753,983,783 12.1 Movement in deferred tax balances is as follows: As at 01 October 1,753,983,783 1,641,059,144 Recognized in statement of profit or loss: - accelerated tax depreciation on operating fixed assets 149,127,721 284,332,811 - leased assets (58,346,248) (136,259,579) - liabilities against assets subject to finance lease 19,453,395 148,005,510 - provisions for doubtful debts and obsolescence 839,796 24,298,533 - impairment of investment in subsidiary and associate 900,000 576,319,800 - provision for Workers’ Profit Participation Fund 34,791,430 2,546,906 - retirement benefits (15,414,051) 33,294,929 - recognition of current year tax losses (519,569,799) – - derecognition / (recognition) of tax credits 255,226,258 (815,352,982) (132,991,498) 117,185,928 Recognized in other comprehensive income: - retirement benefits (3,824,813) (4,261,289) 1,617,167,472 1,753,983,783 13 RETIREMENT BENEFITS
The latest actuarial valuation of the Company’s defined benefit plan was conducted on 30 September 2018 using projected unit credit method. Details of obligation for defined benefit plan are as follows:
Note 2018 2017 Rupees Rupees
Present value of defined benefit obligation 13.1 142,649,329 119,018,899 Fair value of plan assets 13.2 (88,865,210) (89,400,143) Liability as at 30 September 53,784,119 29,618,756

JDW
Sug
ar M
ills
Lim
ited
76
2018 2017 Rupees Rupees
13.1 Movement in liability for funded defined benefit obligation Present value of defined benefit obligation at beginning of the year 119,018,899 101,168,252 Current service cost for the year 19,754,774 14,642,906 Interest cost for the year 8,880,532 7,746,250 Benefit paid during the year (8,190,955) (8,401,625) Actuarial loss on present value of defined benefit obligation 3,186,079 3,863,116 Present value of defined benefit obligation at end of the year 142,649,329 119,018,899 13.2 Movement in fair value of plan assets Balance at beginning of the year 89,400,143 – Return on plan assets excluding interest income 7,241,088 4,494,373 Contributions made during the year 10,417,866 103,648,576 Actuarial loss on fair value of plan assets (10,002,932) (10,341,181) Benefits paid by the fund (8,190,955) (8,401,625) Fair value of plan assets at end of the year 88,865,210 89,400,143
Plan assets comprises of: Nafa Islamic Assets Allocation Fund 49,574,211 50,988,256 Nafa Assets Allocation Fund 38,059,164 37,928,056 Askari Bank Limited 1,231,835 483,831 88,865,210 89,400,143 13.3 Charge for the year: Statement of profit or loss Current service cost 19,754,774 14,642,906 Interest cost for the year 8,880,532 7,746,250 Return on plan assets excluding interest income (7,241,088) (4,494,373) 21,394,218 17,894,783 Other comprehensive income Actuarial loss on obligation 3,186,079 3,863,116 Actuarial loss on defined benefit assets 10,002,932 10,341,181 34,583,229 32,099,080 13.4 Movement in actuarial losses Opening actuarial losses – – Actuarial loss during the year (13,189,011) (14,204,297) Charge to other comprehensive income 13,189,011 14,204,297 Closing actuarial losses – – 13.5 Historical information 2018 2017 2016 2015 2014
Rupees Rupees Rupees Rupees Rupees Present value of defined obligations 142,649,329 119,018,899 101,168,252 75,844,689 68,256,699 Experience adjustment loss / (gain) 13,189,011 14,204,297 17,810,879 5,293,750 (3,281,607) 13.6 Expected expense for the next year
The Company expects to charge Rs. 19.72 million to unconsolidated statement of profit or loss on account of defined benefit plan in 2019.
Notes to the Unconsolidated Financial StatementsFor the year ended 30 September 2018

Ann
ual R
epor
t 201
8
77
Fina
ncia
l Sta
tem
ents
Oth
er In
form
atio
nC
ompa
ny R
evie
w
13.7 Sensitivity analysis
Reasonably possible changes at the reporting date to one of the relevant actuarial assumptions, holding other assumptions constant, would have affected the defined benefit obligation by the amounts shown below.
Impact on defined benefit obligation 2018 2017 Change Increase Decrease Increase Decrease
Discount rate 100 BPS (11,281,262) 13,286,258 (8,438,481) 13,892,422 Salary growth rate 100 BPS 12,823,213 (11,095,841) 13,466,481 (8,269,646)
Although the analysis does not take account of the full distribution of cash flows expected under the plan, it does provide an approximation of the sensitivity of the assumptions shown.
2018 2017 Rupees Rupees
13.8 Actuarial assumptions Valuation discount rate 10% 8% Salary increase rate 10% 8% Expected return on plan assets 10% 8% Average expected remaining working life time of employees 9.15 9.28 Mortality rate SLIC 2001 - 2015 SLIC 2001 - 2015
Note 2018 2017 Rupees Rupees
14 SHORT TERM BORROWINGS
Mark-up based borrowings from conventional banks - secured - Cash finances 14.1 12,604,714,406 6,393,802,000 - Running finances 14.2 3,639,994,262 1,457,791,234 - Inland bill discounting 14.3 1,599,999,999 884,999,998 - Finance against trust receipts 14.4 165,777,672 266,569,923 18,010,486,339 9,003,163,155 Islamic mode of financing - secured - Salam / Istisna finances 14.5 3,417,466,960 – - Morabaha finances 14.6 1,050,000,000 1,050,000,000 - Tijarah finances 14.7 439,999,568 – 4,907,466,528 1,050,000,000 Borrowings from related party - unsecured - Deharki Sugar Mills (Private) Limited 14.8 635,732,649 – 23,553,685,516 10,053,163,155 14.1 The Company has obtained these facilities from various banks and financial institutions aggregating Rs.
18,638 million (2017: Rs. 15,800 million). The mark-up rates applicable during the year ranges from one to six months KIBOR plus 20 to 50 bps per annum (2017: one to six months KIBOR plus 20 to 50 bps per annum). These are secured against pledge of sugar and personal guarantees of sponsor directors of the Company.
14.2 The Company has obtained running finance facilities aggregating Rs. 4,180 million (2017: Rs. 2,580
million). The mark-up rates applicable during the year ranges from one to six months KIBOR plus 0 to 100 bps per annum (2017: one to six months KIBOR plus 20 to 100 bps per annum). These are secured against ranking charge / joint pari passu charge over present and future current assets of the Company and personal guarantees of the sponsor directors of the Company.

JDW
Sug
ar M
ills
Lim
ited
78
14.3 The Company has obtained inland bill discounting facility aggregating Rs. 1,900 million (2017: Rs. 1,100 million). The mark-up rate applicable during the year ranges from one to three months KIBOR plus 50 to 100 bps per annum (2017: one to three months KIBOR plus 50 bps per annum). These are secured against ranking charge / joint pari passu charge over present and future current assets of the Company and personal guarantees of the sponsor directors of the Company.
14.4 The limit of this facility is Rs. 950 million (2017: Rs. 850 million). It carries mark-up ranging from one to
six months KIBOR plus 50 to 250 bps per annum (2017: one to six months KIBOR plus 100 to 135 bps per annum). These are secured against ranking charge / joint pari passu charge over present and future current assets of the Company and personal guarantees of the sponsor directors of the Company.
14.5 The Company has obtained salam / istisna finances facilities from various banks and financial institutions
aggregating to Rs. 6,535 million (2017: Rs. 3,335 million). It carries mark-up ranging from three to six months KIBOR plus 20 to 55 bps per annum. These are secured against pledge of sugar and personal guarantees of sponsor directors of the Company.
14.6 The Company has obtained morabaha finance facilities aggregating Rs. 1,050 million (2017: Rs. 1,050
million). The mark-up rates applicable during the year ranges from three to six months KIBOR plus 50 to 75 bps per annum (2017: three to six months KIBOR plus 50 to 75 bps per annum). These are secured against ranking charge / joint pari passu charge over present and future current assets of the Company and personal guarantees of the sponsor directors of the Company.
14.7 The Company has obtained tijarah finance facility from Meezan Bank Limited aggregating to Rs. 500
million (2017: Rs. nil). The mark-up rate applicable during the year is three months KIBOR plus 55 bps per annum. These are secured against ranking charge / joint pari passu charge over present and future current assets of the Company and personal guarantees of the sponsor directors of the Company.
14.8 This represents interest bearing loan received from Deharki Sugar Mills (Private) Limited to meet working
capital requirements at an average interest rate of 7.18% per annum.
Note 2018 2017 Rupees Rupees
15 CURRENT PORTION OF NON-CURRENT LIABILITIES
Redeemable capital - secured 9 – 83,333,333 Long term finances - secured 10 4,000,768,516 3,131,999,273 Liabilities against assets subject to finance lease - secured 11 105,281,597 153,424,503 4,106,050,113 3,368,757,109
Note 2018 2017 Rupees Rupees Restated
16 TRADE AND OTHER PAYABLES
Advances from customers 8,138,041,881 6,418,358,640 Trade and other creditors 2,122,131,622 1,451,787,341 Due to related parties 16.1 143,786,248 828,159 Payable to Workers’ Profit Participation Fund 16.2 – 115,971,432 Payable to Workers’ Welfare Fund 16.3 26,574,555 26,574,555 Payables to Provident Fund 12,556,790 – Accrued expenses 203,753,232 167,781,704 Retention money 26,202,750 16,203,439 Tax deducted at source 13,212,662 33,309,670 Other payables 69,997,572 70,230,400 10,756,257,312 8,301,045,340
Notes to the Unconsolidated Financial StatementsFor the year ended 30 September 2018

Ann
ual R
epor
t 201
8
79
Fina
ncia
l Sta
tem
ents
Oth
er In
form
atio
nC
ompa
ny R
evie
w
Note 2018 2017 Rupees Rupees
16.1 Due to related parties Deharki Sugar Mills (Private) Limited 16.1.1 142,907,170 – Agro Industrial Solutions 16.1.2 879,078 828,159 143,786,248 828,159 16.1.1 This represents payable in respect of purchase of Bagasse from Deharki Sugar Mills (Private) Limited. 16.1.2 This amount represents payable in respect of consultancy services provided by the key management
personnel. Note 2018 2017 Rupees Rupees Restated
16.2 Payable to Workers’ Profit Participation Fund Balance as at 01 October 115,971,432 124,461,118 Add: Allocation for the year 36 – 115,971,432 Interest on funds utilized 37 61,879,769 68,868,710 Prior year adjustment 36 5,237,703 – 183,088,904 309,301,260 Less: Paid / adjusted during the year (183,088,904) (193,329,828) Balance as at 30 September – 115,971,432 16.3 Payable to Workers’ Welfare Fund Balance as at 01 October 26,574,555 45,745,525 Provision for the year – 18,510,840 Reversal of prior year provision – (37,681,810) Balance as at 30 September 26,574,555 26,574,555
2018 2017 Rupees Rupees
17 ACCRUED PROFIT / INTEREST / MARK-UP
Mark-up on financing / borrowings from conventional banks Redeemable capital - secured – 1,499,725 Long term finances - secured 140,949,231 105,471,103 Short term borrowings - secured 281,037,129 98,831,043 421,986,360 205,801,871 Profit on Islamic mode of financing Long term finances - secured 16,414,365 8,723,410 Short term borrowings - secured 96,225,490 11,666,539 112,639,855 20,389,949 534,626,215 226,191,820

JDW
Sug
ar M
ills
Lim
ited
80
18 CONTINGENCIES AND COMMITMENTS
18.1 Contingencies
18.1.1 A sales tax demand was raised by the tax department for the year 2002-2003 on grounds of various observations. Alternative dispute resolution committee unanimously decided the matter partially in favor of the Company and forwarded its recommendations to Federal Board of Revenue (“FBR”) for further necessary actions. FBR decided the case against the Company on 29 November 2013 and raised a demand of Rs. 47.63 million out of which the Company has deposited Rs. 47.5 million. However, the Company has filed an appeal before Honorable Lahore High Court against the order passed by the Appellate Tribunal, and expects a favorable outcome in this case.
18.1.2 The tax department issued a show cause notice to the Company on 09 April 2013 on the grounds that
the Company has charged Federal Excise duty at the rate of 0.5% instead of 8% on local supplies made and raised a demand of Rs. 50.68 million. Consequently, the Company filed a writ petition against this notice in the Honorable Lahore High Court (“Court”) on the basis that the rate of 0.5% has been charged as allowed by the FBR vide SRO 77(I)/2013 dated 07 February 2013. The Court suspended the proceedings of the notice vide its order dated 24 April 2013 and the final outcome of the case is pending. Management of the Company expects a favorable outcome in this case.
18.1.3 The Company was selected for audit u/s 177 of I.T.O 2001 for tax year 2008. Assistant Commissioner of
Inland Revenue (‘ACIR”) passed order u/s 122(5) / 122(1) by making additions on different issues i.e. interest expense, salaries, sale, gain on sale of assets etc., amounting to Rs. 516 million by reducing brought forward losses. The Company has filed appeal before Commissioner Inland Revenue (Appeals) (“CIR”), who vide order dated 06 April 2010 decided appeal in favor of the Company on most of the issues. The department filed appeal before Appellate Tribunal Inland Revenue (“ATIR”). Respectable ATIR passed an order in favor of the Company except for two issues with an aggregate amount of Rs. 72.57 million. The Company has filed an appeal before Honorable Lahore High Court, against the order of the ATIR. The management of the Company is confident that this case will be decided in its favor.
18.1.4 The Company (Previously United Sugar Mills Limited) was selected for audit u/s 177 of I.T.O 2001 for tax year 2008. The Company has filed Writ Petition before Honorable Lahore High Court (“Court”) against selection of audit which was rejected by the Court. Income tax department initiated audit proceeding and Deputy Commissioner Inland Revenue (‘DCIR”) passed order u/s 122(4)/(5) by making additions on different issues and created a demand of Rs. 76.56 million vide order dated 22 December 2017. The Company filed an appeal before CIR(A). The hearing of the same is pending. However, taxpayer has been granted stay by the Court against the recovery of demand. The management of the Company is confident that this case will be decided in its favor.
18.1.5 Additional Commissioner Inland Revenue (‘‘ACIR”) issued show cause notice u/s 122(5A) of
I.T.O 2001 for tax year 2011 confronting several matters. The said notice was duly complied and plea of the taxpayer was largely accepted by the department. ACIR passed order u/s 122(5A) by making additions on different issues and created a demand of Rs. 18.75 million vide order dated 30 June 2017. The Company filed an appeal before CIR(A). The hearing of the same is pending. The management of the Company is confident that this case will be decided in its favor.
18.1.6 The Company was selected for audit u/s 177 of I.T.O 2001 for tax year 2014. Deputy Commissioner Inland
Revenue (“DCIR”) passed order u/s 122(1) by making additions on different expenses, amounting to Rs. 163.16 million. The Company has filed appeal before Commissioner Inland Revenue (Appeals) (“CIR”) who vide order dated 07 March 2018 accepted the tax payer contention and has granted relief on major issues amounting Rs. 127.03 million and upheld the remaining issues amounting to Rs. 36.15 million. The Company has filed second appeal before Appellate Tribunal Inland Revenue (“ATIR”) against the issues. The hearing of the same is pending. The management of the Company is confident that this case will be decided in its favor.
Notes to the Unconsolidated Financial StatementsFor the year ended 30 September 2018

Ann
ual R
epor
t 201
8
81
Fina
ncia
l Sta
tem
ents
Oth
er In
form
atio
nC
ompa
ny R
evie
w
18.1.7 The Company was selected for audit u/s 72B of Sale Tax Act, 1990 for the period June 2013 to July 2014 by the Federal Board of Revenue (“FBR”). A sales tax demand was raised by the tax department on various grounds of Rs. 70.94 million. The Company has filed appeal before Commissioner Inland Revenue (Appeals) (“CIR”) who vide dated 08 February 2018 has granted relief amounting Rs. 57.37 million and the remaining issues with an aggregate amount of Rs. 12.62 million were upheld. The Company has filed second appeal before Appellate Tribunal Inland Revenue (“ATIR”). The hearing of the same is pending. The management of the Company is confident that this case will be decided in its favor.
18.1.8 Guarantees issued by the banks on behalf of the Company in favor of various parties as at the reporting
date amounts to Rs. 577 million (2017: Rs. 83 million). 2018 2017 Rupees Rupees
18.2 Commitments 18.2.1 Letters of credit for import of machinery and its related components 539,941,528 569,509,835 18.2.2 The amount of future lease rentals on agricultural contract and the period in which payments will become
due are as follows: 2018 2017 Rupees Rupees
Less than one year 201,961,777 242,773,563 Between one and five years 694,061,398 835,839,006 More than five years 4,173,750 6,016,667 900,196,925 1,084,629,236 18.2.3 The amount of future ijarah rentals for ijarah financing and the period in which these payments will
become due are as follows: 2018 2017 Rupees Rupees
Less than one year 1,098,556 1,465,012 Between one and five years – 629,115 1,098,556 2,094,127
Note 2018 2017 Rupees Rupees Restated
19 PROPERTY, PLANT AND EQUIPMENT
Operating fixed assets 19.1 21,133,041,009 19,587,235,455 Capital work in progress 19.6 752,229,377 1,799,514,371 Stores, spare parts and loose tools held for capital expenditure 124,899,758 90,001,462 22,010,170,144 21,476,751,288

JDW
Sug
ar M
ills
Lim
ited
82
19
.1
Op
erat
ing
fixe
d a
sset
s
C
ost
Dep
reci
atio
n N
et b
ook
A
s at
A
dditi
ons
/ Tr
ansf
ers
As
at
A
s at
Tran
sfer
s /
As
at
valu
e as
at
01
Oct
ober
(d
elet
ions
) du
ring
30 S
epte
mbe
r R
ate
01 O
ctob
er
For t
he
(del
etio
ns) d
urin
g 30
Sep
tem
ber
30 S
epte
mbe
r
2017
du
ring
the
year
th
e ye
ar
2018
2017
ye
ar
the
year
20
18
2018
R
upee
s R
upee
s
Rup
ees
R
upee
s
%
Rup
ees
R
upee
s
Rup
ees
R
upee
s
Rup
ees
O
wne
d
Fr
eeho
ld la
nd
1,6
46,0
76,4
99
1,9
50,0
00
–
1,6
48,0
26,4
99
– –
–
– –
1,6
48,0
26,4
99
–
–
Fact
ory
build
ing
on
1,9
40,8
06,8
60
91,
622,
290
–
2
,032
,033
,135
10
8
32,6
42,8
37
116
,156
,089
–
948
,417
,510
1
,083
,615
,625
freeh
old
land
(396
,015
)
(381
,416
)
Non
-fact
ory
build
ing
on
760
,110
,636
5
7,43
0,34
3
– 8
17,1
16,2
23
5-20
2
58,5
30,6
25
27,
009,
805
–
2
85,4
87,3
35
531
,628
,888
freeh
old
land
(424
,756
)
(53,
095)
Plan
t and
mac
hine
ry
18,
790,
043,
726
2
,549
,279
,753
2
54,1
67,3
34
21,
133,
763,
966
5-
20
4,8
76,2
59,6
55
841
,226
,708
5
5,09
2,06
6
5,5
75,1
57,9
66
15,
558,
606,
000
(459
,726
,847
)
(197
,420
,463
)
Suga
rcan
e ro
ots
604
,503
,978
3
62,3
82,3
03
–
673
,807
,851
17
2
01,2
16,3
45
112
,301
,308
–
186
,871
,335
4
86,9
36,5
16
(293
,078
,430
)
(126
,646
,318
)
Mot
or v
ehic
les
1,8
44,6
29,9
09
136
,604
,806
1
7,97
4,50
0
1,9
11,6
54,1
18
20
1,0
62,7
77,3
41
311
,677
,752
7
,022
,100
1
,316
,148
,658
5
95,5
05,4
60
(87,
555,
097)
(65,
328,
535)
Elec
trica
l ins
talla
tion
155
,500
,527
7
,846
,532
–
162
,943
,671
10
5
8,96
2,45
3
10,
155,
559
–
68,
870,
860
9
4,07
2,81
1
(4
03,3
88)
(2
47,1
52)
Offi
ce e
quip
men
t 6
6,18
1,34
6
709
,518
–
6
5,67
5,29
6
20
32,
921,
713
7
,871
,800
–
3
9,82
9,15
3
25,
846,
143
(1,2
15,5
68)
(9
64,3
60)
Tool
s an
d eq
uipm
ent
71,
003,
543
5
,108
,657
–
7
2,98
5,52
1
10-2
0 2
4,62
1,74
4
5,0
69,7
30
–
27,
948,
105
4
5,03
7,41
6
(3
,126
,679
)
(1,7
43,3
69)
Furn
iture
and
fixt
ure
22,
950,
277
1
,521
,917
–
23,
697,
918
10
8
,725
,453
2
,017
,452
–
10,
041,
327
1
3,65
6,59
1
(7
74,2
76)
(7
01,5
78)
Wei
ghbr
idge
3
3,73
2,89
4
7,0
90,4
63
– 4
0,82
3,35
7
10
18,
683,
384
1
,922
,608
–
20,
605,
992
2
0,21
7,36
5
–
–
R
oads
and
bou
ndar
y w
all
89,
791,
493
5
,452
,036
–
94,
889,
081
10
4
6,28
3,85
2
4,6
76,9
04
– 5
0,65
6,23
6
44,
232,
845
(354
,448
)
(304
,520
)
Notes to the Unconsolidated Financial StatementsFor the year ended 30 September 2018

Ann
ual R
epor
t 201
8
83
Fina
ncia
l Sta
tem
ents
Oth
er In
form
atio
nC
ompa
ny R
evie
w
C
ost
Dep
reci
atio
n N
et b
ook
A
s at
A
dditi
ons
/ Tr
ansf
ers
As
at
A
s at
Tran
sfer
s /
As
at
valu
e as
at
01
Oct
ober
(d
elet
ions
) du
ring
30 S
epte
mbe
r R
ate
01 O
ctob
er
For t
he
(del
etio
ns) d
urin
g 30
Sep
tem
ber
30 S
epte
mbe
r
2017
du
ring
the
year
th
e ye
ar
2018
2017
ye
ar
the
year
20
18
2018
R
upee
s R
upee
s
Rup
ees
R
upee
s
%
Rup
ees
R
upee
s
Rup
ees
R
upee
s
Rup
ees
Arm
s an
d am
mun
ition
s 7
,907
,517
3
16,5
40
– 8
,224
,057
10
4
,937
,556
3
15,6
42
– 5
,253
,198
2
,970
,859
–
–
Fire
figh
ting
equi
pmen
ts
82,
815,
232
–
– 8
2,81
5,23
2
20
41,
223,
855
8
,318
,276
–
49,
542,
131
3
3,27
3,10
1
–
–
Airc
raft
4
69,9
81,8
24
225
,807
,775
–
6
24,4
53,4
03
10-2
5 2
68,0
59,0
69
26,
287,
369
–
2
52,0
76,8
03
372
,376
,600
(7
1,33
6,19
6)
(4
2,26
9,63
5)
Tube
wel
l 8
,267
,613
–
–
8,2
67,6
13
10
3,8
43,7
89
442
,382
–
4
,286
,171
3
,981
,442
–
–
Com
pute
rs
36,
890,
899
2
7,92
2,05
1
–
63,
055,
769
33
2
6,02
5,21
7
10,
960,
654
–
3
5,44
8,65
5
27,
607,
114
(1,7
57,1
81)
(1
,537
,216
)
26,
631,
194,
773
3
,481
,044
,984
2
72,1
41,8
34
29,
464,
232,
710
7,7
65,7
14,8
88
1,4
86,4
10,0
38
62,
114,
166
8
,876
,641
,435
2
0,58
7,59
1,27
5
(9
20,1
48,8
81)
(4
37,5
97,6
57)
Le
ased
Pl
ant a
nd m
achi
nery
7
13,6
07,1
38
–
(254
,167
,334
) 4
59,4
39,8
04
5 1
02,0
57,3
46
30,
577,
490
(5
5,09
2,06
6)
77,
542,
770
3
81,8
97,0
34
–
–
M
otor
veh
icle
s 1
40,5
74,8
50
95,
345,
500
(1
7,97
4,50
0)
217
,945
,850
20
3
0,36
9,07
2
31,
046,
178
(7
,022
,100
) 5
4,39
3,15
0
163
,552
,700
–
–
854
,181
,988
9
5,34
5,50
0
(272
,141
,834
) 6
77,3
85,6
54
1
32,4
26,4
18
61,
623,
668
(6
2,11
4,16
6)
131
,935
,920
5
45,4
49,7
34
–
–
2
7,48
5,37
6,76
1
3,5
76,3
90,4
84
–
30,
141,
618,
364
7,8
98,1
41,3
06
1,5
48,0
33,7
06
– 9
,008
,577
,355
2
1,13
3,04
1,00
9
(9
20,1
48,8
81)
(4
37,5
97,6
57)
19
.2
Add
ition
s in
ope
ratin
g fix
ed a
sset
s in
clud
ed tr
ansf
er fr
om c
apita
l wor
k in
pro
gres
s am
ount
ing
to R
s. 2
,574
.66
mill
ion
(201
7: R
s. 1
,313
.59
mill
ion)
.
19
.2.1
Tr
ansf
ers
from
free
hold
land
repr
esen
ts tr
ansf
er o
f lan
d to
inve
stm
ent p
rope
rty d
urin
g th
e ye
ar a
mou
ntin
g to
Rs.
nil
(201
7: R
s. 3
8.29
mill
ion)
.

JDW
Sug
ar M
ills
Lim
ited
84
O
wn
ed
Fr
eeho
ld la
nd
1,7
01,6
91,6
80
1,3
45,2
50
(38
,288
,435
) 1
,646
,076
,499
–
–
– –
–
1,6
46,0
76,4
99
(18
,671
,996
) –
–
–
–
–
Fact
ory
bui
ldin
g o
n 1
,897
,903
,349
6
6,44
1,30
3
–
1,9
40,8
06,8
60
10
742
,924
,540
1
14,4
73,5
56
–
832
,642
,837
1
,108
,164
,023
free
hold
land
–
29,
192,
174
–
(
52,7
29,9
66)
12,
993,
202
(
37,7
48,4
61)
No
n-fa
cto
ry b
uild
ing
on
7
32,8
03,4
60
2,2
45,6
85
– 7
60,1
10,6
36
5-20
2
08,9
84,1
52
25,
146,
586
–
2
58,5
30,6
25
501
,580
,011
free
hold
land
– 4
4,48
2,04
1
–
(19
,420
,550
)
3
2,33
3,51
2
(7,
933,
625)
Pla
nt a
nd m
achi
nery
1
6,96
8,52
2,04
2
1,5
72,9
69,3
76
256
,387
,162
1
8,79
0,04
3,72
6
5-20
4
,141
,027
,110
7
25,0
49,8
53
28,
615,
487
4
,876
,259
,655
1
3,91
3,78
4,07
1
(
53,2
18,5
94)
81,
748,
028
(
46,3
05,9
83)
(
36,3
64,2
88)
42,
176,
566
(
14,3
03,3
78)
Sug
arca
ne r
oo
ts
540
,905
,484
2
55,0
49,2
14
–
604
,503
,978
17
1
70,8
87,7
51
100
,750
,663
–
2
01,2
16,3
45
403
,287
,633
(
191,
450,
720)
–
(70
,422
,069
)
–
–
–
Mo
tor
vehi
cles
1
,266
,794
,868
2
31,4
47,6
25
366
,242
,435
1
,844
,629
,909
20
6
93,2
44,3
21
249
,067
,700
1
39,6
15,2
92
1,0
62,7
77,3
41
781
,852
,568
(
57,9
32,8
61)
38,
077,
842
(
40,7
02,5
58)
–
21,
552,
586
–
Ele
ctric
al in
stal
latio
n 1
63,0
20,8
28
37,
481,
979
–
1
55,5
00,5
27
10
62,
980,
873
1
0,91
0,18
1
– 5
8,96
2,45
3
96,
538,
074
(3,
670,
556)
4
4,16
4,42
1
(2,
370,
243)
(85
,496
,145
)
2
9,89
1,14
1
(42
,449
,499
)
Offi
ce e
qui
pm
ent
110
,620
,512
2
,051
,001
–
6
6,18
1,34
6
20
53,
609,
489
1
2,46
6,21
9
–
32,
921,
713
3
3,25
9,63
3
(
3,63
3,15
2)
113
,000
(
3,07
4,67
1)
(
42,9
70,0
15)
39,
681
(
30,1
19,0
05)
Too
ls a
nd e
qui
pm
ent
63,
417,
990
1
2,55
9,18
2
–
71,
003,
543
10
-20
26,
504,
485
4
,391
,042
–
24,
621,
744
4
6,38
1,79
9
(
2,16
8,89
4)
8,3
44,5
43
(1,
478,
404)
(11
,149
,278
)
3
,355
,777
(
8,15
1,15
6)
Ag
ri im
ple
men
ts
36,
974,
512
–
3,9
60,0
01
–
10
19,
862,
520
2
,184
,323
9
67,5
79
– –
– –
–
(
40,9
34,5
13)
–
(23
,014
,422
)
Furn
iture
and
fixt
ure
35,
877,
618
2
,400
,257
–
2
2,95
0,27
7
10
15,
065,
225
2
,512
,917
–
8
,725
,453
1
4,22
4,82
4
(
11,7
78,2
10)
507
,176
(
6,41
0,31
8)
(
4,05
6,56
4)
234
,613
(
2,67
6,98
4)
C
ost
Dep
reci
atio
n N
et b
ook
A
s at
A
dditi
ons
/ Tr
ansfe
rs /
adjus
tmen
ts A
s at
As
at
Tr
ansf
ers /
(del
etio
ns)
As
at
valu
e as
at
01
Oct
ober
(d
elet
ions
) in
/ (o
ut)
30 S
epte
mbe
r R
ate
01 O
ctob
er
For t
he
/ ad
just
men
ts in
/ (o
ut)
30 S
epte
mbe
r 30
Sep
tem
ber
20
16
durin
g th
e ye
ar
durin
g th
e ye
ar
2017
2016
ye
ar
durin
g th
e ye
ar
2017
20
17
R
upee
s R
upee
s
Rup
ees
R
upee
s
%
Rup
ees
R
upee
s
Rup
ees
R
upee
s
Rup
ees
Notes to the Unconsolidated Financial StatementsFor the year ended 30 September 2018

Ann
ual R
epor
t 201
8
85
Fina
ncia
l Sta
tem
ents
Oth
er In
form
atio
nC
ompa
ny R
evie
w
C
ost
Dep
reci
atio
n N
et b
ook
A
s at
A
dditi
ons
/ Tr
ansfe
rs /
adjus
tmen
ts A
s at
As
at
Tr
ansf
ers /
(del
etio
ns)
As
at
valu
e as
at
01
Oct
ober
(d
elet
ions
) in
/ (o
ut)
30 S
epte
mbe
r R
ate
01 O
ctob
er
For t
he
/ ad
just
men
ts in
/ (o
ut)
30 S
epte
mbe
r 30
Sep
tem
ber
20
16
durin
g th
e ye
ar
durin
g th
e ye
ar
2017
2016
ye
ar
durin
g th
e ye
ar
2017
20
17
R
upee
s R
upee
s
Rup
ees
R
upee
s
%
Rup
ees
R
upee
s
Rup
ees
R
upee
s
Rup
ees
W
eig
hb
rid
ge
10,4
54,6
56
1,1
36,0
71
–
33,7
32,8
94
10
8,5
10,5
84
279,6
90
–
18,6
83,3
84
15,0
49,5
10
–
22,1
42,1
67
–
–
9,8
93,1
10
–
R
oa
ds
an
d b
ou
nd
ary
wa
ll 7
2,2
32,5
96
– –
8
9,7
91,4
93
10
32,1
46,0
53
4,0
08,6
54
–
46,2
83,8
52
43,5
07,6
41
– 1
7,5
58,8
97
–
–
1
0,1
29,1
45
–
A
rms
an
d a
mm
un
itio
ns
7,9
07,5
17
– –
7,9
07,5
17
10
4,6
07,5
60
329,9
96
– 4
,937,5
56
2,9
69,9
61
– –
–
–
–
–
F
ire fi
gh
ting
eq
uip
men
ts
78,8
19,4
48
– –
8
2,8
15,2
32
20
29,7
92,5
90
9,8
05,3
72
– 4
1,2
23,8
55
41,5
91,3
77
– 3
,995,7
84
–
–
1,6
25,8
93
–
A
ircra
ft
469,9
81,8
24
– –
4
69,9
81,8
24
10-2
5
237,7
05,0
84
30,3
53,9
85
– 2
68,0
59,0
69
201,9
22,7
55
– –
–
–
–
–
Tu
be w
ell
3,4
36,0
79
1,0
75,7
75
–
8,2
67,6
13
10
1,7
34,0
06
224,4
38
–
3,8
43,7
89
4,4
23,8
24
– 3
,755,7
59
–
–
1
,885,3
45
–
C
om
pu
ters
3
8,1
89,9
68
2,2
21,7
87
–
36,8
90,8
99
33
22,0
60,1
51
5,7
77,1
67
– 2
6,0
25,2
17
10,8
65,6
82
(2,5
60,3
43)
4,6
83,0
23
(2,0
98,0
60)
(
5,6
43,5
36)
4,2
41,3
61
(3,9
55,4
02)
2
4,1
99,5
54,4
32
2,1
88,4
24,5
05
588,3
01,1
63
26,6
31,1
94,7
73
6
,471,6
46,4
94
1,2
97,7
32,3
42
169,1
98,3
58
7,7
65,7
14,8
88
18,8
65,4
79,8
85
(345,0
85,3
26)
(
172,8
62,3
06)
Le
ase
d
P
lan
t a
nd
ma
ch
inery
9
69,9
94,3
00
–
(256,3
87,1
62)
713,6
07,1
38
5
92,3
54,9
03
38,3
17,9
30
(28,6
15,4
87)
102,0
57,3
46
611,5
49,7
92
– –
–
–
–
–
A
gri im
ple
men
ts
3,9
60,0
01
–
(3,9
60,0
01)
– 10
878,5
13
89,0
66
(967,5
79)
– –
–
–
–
–
–
–
M
oto
r ve
hic
les
412,9
70,9
35
93,8
46,3
50
(366,2
42,4
35)
140,5
74,8
50
20
117,7
37,6
52
52,2
46,7
12
(139,6
15,2
92)
30,3
69,0
72
110,2
05,7
78
– –
–
–
–
–
1
,386,9
25,2
36
93,8
46,3
50
(626,5
89,5
98)
854,1
81,9
88
2
10,9
71,0
68
90,6
53,7
08
(169,1
98,3
58)
132,4
26,4
18
721,7
55,5
70
–
–
25,5
86,4
79,6
68
2,2
82,2
70,8
55
(38,2
88,4
35)
27,4
85,3
76,7
61
6
,682,6
17,5
62
1,3
88,3
86,0
50
–
7,8
98,1
41,3
06
19,5
87,2
35,4
55
(345,0
85,3
26)
(
172,8
62,3
06)

JDW
Sug
ar M
ills
Lim
ited
86
19.3 Particulars of immovable property (i.e. land and building) in the name of Company are as follows:
Usage of immovable Total area Location property (Acres)
Mauza Sharin, Jamal Din Wali, District Rahim Yar Khan Manufacturing facility 318.60
Machi Goth, Sadiqabad, District Rahim Yar Khan Manufacturing facility 186.72
Village Laluwali, District Ghotki Manufacturing facility 140.03
59-A, Gulberg, Lahore Record room / space for corporate office 0.65
29-B, Gulberg, Lahore Rest house 0.30
Agricultural Land - Punjab (various locations) Agriculture land 882.57
Agricultural Land - Sindh (various locations) Agriculture land 1,128.73
The buildings on freehold land and other immovable assets of the Company are constructed / located
at above mentioned freehold land.
Note 2018 2017 Rupees Rupees Restated
19.4 Depreciation charge for the year has been allocated as follows:
Cost of goods manufactured 32.1 & 32.1.1.1 1,225,488,005 1,084,689,677 Administrative expenses 33 66,801,819 54,603,750 Cost of growing crops 35.1.1 255,743,882 249,092,623 1,548,033,706 1,388,386,050
19.5 Disposal of operating fixed assets
Accumulated Book Sales Gain / Mode of Relationship
Description Particulars of purchaser Cost depreciation value value (loss) disposal with the Company
Rupees Rupees Rupees Rupees Rupees
Plant and Machinery JK Sugar Mills (Pvt.) Ltd. 456,347,884 195,864,062 260,483,822 430,673,679 170,189,857 Negotiation Related Party Office Equipment Air Conditioners Abbas Khan 214,990 151,441 63,549 15,000 (48,549) Negotiation Other party Photocopier Digital Business System 180,000 138,748 41,252 50,000 8,748 - do - Other party Shoot Gun Muhammad Sajid 35,311 33,546 1,765 41,667 39,902 - do - Other party 430,301 323,735 106,566 106,667 101 Motor Vehicles Range Rover Toyota Royal Motors - RYK 26,621,250 20,877,837 5,743,413 8,500,000 2,756,587 Negotiation Other party Toyota Hilux Vigo JK Sugar Mills (Pvt.) Ltd. 2,925,000 2,307,128 617,872 2,100,000 1,482,128 - do - Related Party Toyota Hilux Vigo Muhammad Arif 2,450,000 2,154,141 295,859 1,568,182 1,272,323 - do - Other party Toyota Corolla Altis EFU General Insurance Limited 2,010,000 565,739 1,444,261 1,960,000 515,739 Insurance Claim Other party Toyota Land Cruiser Adnan Hafeez 1,888,254 1,699,429 188,825 1,350,000 1,161,175 Negotiation Other party Toyota Corolla Altis Israr Muhammad Khan 1,854,700 1,336,667 518,033 556,410 38,377 Company Policy Employee Toyota Corolla Altis Safdar Kanjoo 1,854,700 1,345,148 509,552 556,410 46,858 - do - Employee Toyota Corolla Altis Raja Mazhar Hussain 1,854,700 1,373,530 481,170 556,410 75,240 - do - Employee Toyota Corolla Altis Shahid Jamil 1,802,400 1,300,943 501,457 540,720 39,263 - do - Employee Toyota Corolla GLI Moin Khalid 1,720,000 1,157,025 562,975 1,377,272 814,297 Negotiation Other party Toyota Corolla GLI Afnan Arshad 1,689,500 1,196,766 492,734 675,800 183,066 Company Policy Employee Toyota Corolla GLI Muhammad Rafique Gohar 1,684,700 1,179,873 504,827 505,410 583 - do - Employee Honda City Khalid Rashid 1,629,000 1,149,454 479,546 488,700 9,154 - do - Employee Toyota Corolla GLI Tauseef Baig 1,619,700 1,129,838 489,862 485,910 (3,952) - do - Employee Toyota Corolla GLI Muhammid Khalid 1,619,700 1,146,486 473,214 485,910 12,696 - do - Employee Toyota Corolla GLI Safdar Ali Farooqi 1,587,400 1,184,008 403,392 1,250,000 846,608 - do - Employee Toyota Corolla XLI Aish Muhammad 1,549,700 1,066,841 482,859 619,880 137,021 - do - Employee Toyota Corolla XLI Syed Jaffar Hussain 1,549,700 1,095,414 454,286 619,880 165,594 - do - Employee Toyota Corolla XLI Mr. Jaffar Iqbal 1,549,700 1,103,635 446,065 619,880 173,815 - do - Employee Toyota Corolla XLI Shabir Jamal 1,365,016 1,183,014 182,002 619,880 437,878 - do - Employee Toyota Corolla XLI Khalid aziz 1,280,575 1,109,832 170,743 582,960 412,217 - do - Employee Toyota Corolla XLI Nazeer Ahmed 1,280,575 1,109,832 170,743 582,960 412,217 - do - Employee Suzuki Liana Nadeem Haider 1,239,000 943,958 295,042 495,600 200,558 - do - Employee Suzuki Swift Rafique-ul-Haq 1,151,000 792,369 358,631 460,400 101,769 - do - Employee Suzuki Swift Najam-ud-Din 1,151,000 792,369 358,631 460,400 101,769 - do - Employee Suzuki Swift Rana Zafar Iqbal 1,151,000 878,931 272,069 460,400 188,331 - do - Employee Suzuki Swift DX Muhammad Iqbal Javed 1,131,000 790,024 340,976 452,400 111,424 - do - Employee Suzuki Cultus Adnan Hafeez 1,119,000 503,550 615,450 900,000 284,550 - do - Employee Mitsubishi Pajero Wasif Khan 1,110,000 1,106,239 3,761 590,000 586,239 Negotiation Other party
Notes to the Unconsolidated Financial StatementsFor the year ended 30 September 2018

Ann
ual R
epor
t 201
8
87
Fina
ncia
l Sta
tem
ents
Oth
er In
form
atio
nC
ompa
ny R
evie
w
Accumulated Book Sales Gain / Mode of Relationship
Description Particulars of purchaser Cost depreciation value value (loss) disposal with the Company
Rupees Rupees Rupees Rupees Rupees
Suzuki Swift Saif Ullah 1,096,000 770,251 325,749 438,400 112,651 Company Policy Ex-employee Suzuki Swift Zulfiqar Ali 1,096,000 775,791 320,209 438,400 118,191 - do - Employee Suzuki Swift Muhammad Ajmal Khan 1,096,000 775,791 320,209 438,400 118,191 - do - Employee Suzuki Swift Shahzad Ahmed 1,096,000 775,791 320,209 438,400 118,191 - do - Employee Suzuki Swift Hafiz Farooq Ahmed 1,096,000 812,536 283,464 438,400 154,936 - do - Employee Suzuki Cultus Muhammad Jaffar 1,010,000 753,698 256,302 404,000 147,698 - do - Employee Suzuki Cultus Munawar Zarif 997,823 864,780 133,043 386,000 252,957 - do - Employee Suzuki Cultus Shahid Javed 990,000 681,534 308,466 396,400 87,934 - do - Employee Suzuki Cultus Zulfiqar Ali 711,515 616,646 94,869 364,400 269,531 - do - Employee Suzuki Pickup Khawar Muhammad Butt 699,000 345,859 353,141 470,000 116,859 Negotiation Other party Suzuki Bolan Qurban Ali 682,000 536,420 145,580 500,000 354,420 - do - Other party Suzuki Mehran Niaz Muhammad 612,000 434,231 177,769 244,800 67,031 Company Policy Employee Tractor Hassan Mehmood 604,967 473,891 131,076 725,000 593,924 Negotiation Other party Tractor Muhammad Ilyas 600,111 470,087 130,024 725,000 594,976 - do - Other party Tractor Hassan Mehmood 464,123 363,563 100,560 725,000 624,440 - do - Other party Suzuki Mehran Sheikh Waqas Shahid 409,800 78,064 331,736 594,545 262,809 - do - Other party Tractor Hassan Mehmood 351,000 274,950 76,050 725,000 648,950 - do - Other party Tractor Hassan Mehmood 351,000 274,950 76,050 725,000 648,950 - do - Other party Tractor Hassan Mehmood 351,000 274,950 76,050 725,000 648,950 - do - Other party Tractor Hassan Mehmood 312,000 244,400 67,600 725,000 657,400 - do - Other party Tractor Hassan Mehmood 312,000 244,400 67,600 725,000 657,400 - do - Other party Tractor Hassan Mehmood 312,000 244,400 67,600 725,000 657,400 - do - Other party Tractor Hassan Mehmood 312,000 244,400 67,600 725,000 657,400 - do - Other party Tractor Hassan Mehmood 312,000 244,400 67,600 725,000 657,400 - do - Other party Motorcycle Muhammad Sabir 86,000 41,721 44,279 34,000 (10,279) Company Policy Employee Motorcycle Syed Shehzad Ali 67,500 46,473 21,027 26,000 4,973 - do - Employee Motorcycle Amir Bux 52,774 50,135 2,639 40,041 37,402 - do - Employee Motorcycle Tariq Mehmood 36,214 34,403 1,811 11,770 9,959 - do - Employee 87,555,097 65,328,535 22,226,562 44,060,730 21,834,168Computers Laptop EFU General Insurance Ltd. 146,500 100,226 46,274 66,500 20,226 Insurance Claim Other party Laptop JK Sugar Mills (Pvt.) Ltd. 85,500 28,690 56,810 65,000 8,190 Negotiation Related Party 232,000 128,916 103,084 131,500 28,416
Air Craft Lake City Holdings (Pvt.) Ltd. 71,336,196 42,269,635 29,066,561 59,829,060 30,762,499 Negotiation Other party Assets - written off Sugarcane roots 293,078,430 126,646,318 166,432,112 – – Company Policy –Other assets 11,168,973 7,036,456 4,132,517 – – - do - – 304,247,403 133,682,774 170,564,629 – – 2018 920,148,881 437,597,657 482,551,224 534,801,636 222,815,041 2017 - restated 345,085,326 172,862,306 172,223,020 86,227,818 44,579,772
Note 2018 2017 Rupees Rupees Restated
19.6 Capital work in progress As at 1 October 1,799,514,371 924,081,851 Additions during the year 19.6.1 1,527,373,141 2,189,018,758 Transfers made during the year (2,574,658,135) (1,313,586,238) As at 30 September 752,229,377 1,799,514,371 Break-up of closing balances is as follows: – Advances to supplier 356,661,979 1,077,473,132 – Plant and machinery 334,963,931 439,115,723 – Building 49,104,735 93,249,886 – Sugarcane roots 11,087,511 14,483,645 – Roads & boundary walls 411,221 515,933 – Advances against purchase of air craft – 174,676,052 752,229,377 1,799,514,371 19.6.1 Additions to capital work in progress also include borrowing costs of Rs. 61.32 million (2017:
Rs. 28.47 million) relating to specific borrowings at the rates ranging from 6.65% to 9.43% per annum (2017: 6.65% to 7.14% per annum).

JDW
Sug
ar M
ills
Lim
ited
88
2018 2017 Rupees Rupees
20 INVESTMENT PROPERTY
Balance as at 01 October 218,599,597 196,467,698 Transferred from operating fixed assets – 38,288,435 Disposal of investment property – (16,156,536) Balance as at 30 September 218,599,597 218,599,597 20.1 Investment property represents agricultural land given on operating lease, the fair value of the investment
property is Rs. 530 million (2017: Rs. 374 million). The fair value of investment property was determined by internal assessment and was arrived at by reference to market evidence of transaction prices for similar properties.
20.2 The amount of future lease rentals on agricultural contract and the period in which payments will become
due are as follows:
2018 2017 Rupees Rupees
Less than one year 12,430,800 7,625,300 Note 2018 2017 Rupees Rupees
21 INTANGIBLES
Goodwill 21.1 608,310,693 608,310,693 Oracle computer software 21.2 10,538,595 12,578,323 618,849,288 620,889,016 21.1 Goodwill includes Rs. 568,545,391 and Rs. 39,765,302 arisen at the time of mergers of United Sugar
Mills Limited and Ghotki Sugar Mills (Private) Limited into the Company. For impairment testing, the recoverable amount has been determined based on the recent value in use calculations by discounting the four years cash flow projections at 14.49% per annum. Assumptions used in preparing the cash flows are based on past trends. The calculation of value in use is sensitive to discount rate and local inflation rates.
Note 2018 2017 Rupees Rupees
21.2 Oracle computer software Cost 20,397,279 20,397,279 Accumulated amortization As at 01 October 7,818,956 5,779,228 Amortization for the year 33 2,039,728 2,039,728 9,858,684 7,818,956 As at 30 September 10,538,595 12,578,323 Rate of amortization 10% 10%
Notes to the Unconsolidated Financial StatementsFor the year ended 30 September 2018

Ann
ual R
epor
t 201
8
89
Fina
ncia
l Sta
tem
ents
Oth
er In
form
atio
nC
ompa
ny R
evie
w
Note 2018 2017 Rupees Rupees
22 LONG TERM INVESTMENTS
Investment in subsidiary companies - unquoted 22.1 2,310,460,383 2,303,378,840 Investment in associated company - unquoted 22.2 – – 2,310,460,383 2,303,378,840
2018 2017 Rupees Rupees
22.1 Investment in subsidiary companies - unquoted Deharki Sugar Mills (Private) Limited (“DSML”) 104,975,000 (2017: 104,975,000) fully paid shares of Rs. 10 each Equity held 100% (2017: 100%) 1,049,750,000 1,049,750,000 Faruki Pulp Mills Limited (“FPML”) 310,892,638 (2017: 310,892,638) fully paid shares of Rs. 10 each Equity held 57.67% (2017: 57.67%) Cost 3,154,426,383 3,154,426,383 Less: Impairment allowance (1,921,066,000) (1,921,066,000) 1,233,360,383 1,233,360,383 Sadiqabad Power (Private) Limited (“SPL”) 1,000,100 (2017: nil) fully paid shares of Rs. 10 each Equity held 100% (2017: 100%) 10,001,000 – Advances for future issuance of shares 3,549,000 10,133,876 13,550,000 10,133,876 Ghotki Power (Private) Limited (“GPL”) 1,000,100 (2017: nil) fully paid shares of Rs. 10 each Equity held 100% (2017: 100%) 10,001,000 – Advances for future issuance of shares 3,799,000 10,134,581 13,800,000 10,134,581 2,310,460,383 2,303,378,840 22.2 Investment in associated company - unquoted JDW Power (Private) Limited (“JDWPL”) Cost as at 01 October 9,000,000 (2017: 9,000,000) fully paid 90,000,000 90,000,000 shares of Rs. 10 each Less: Accumulated impairment allowance (90,000,000) (90,000,000) Equity held 47.37% (2017: 47.37%) – – 22.3 Investment in subsidiaries and associate have been made in accordance with the requirements of the
Companies Act, 2017.

JDW
Sug
ar M
ills
Lim
ited
90
23 LONG TERM ADVANCES
This represents interest free soft loan given to Multan Electric Power Company (“MEPCO”) to meet 100% expenses of grid interconnection Unit II of the Company for Co-Generation Power. The loan is recoverable in 36 equal monthly instalments started after eighteen months from the commercial operation date i.e. 12 June 2014 for Unit II.
24 LONG TERM DEPOSITS
These mainly comprise of security deposits with leasing companies in respect of leasing facilities availed.
This also includes an advance amounting to Rs. 4.54 million (2017: Rs. 4.54 million) due from JDW Aviation (Pvt.) Limited. The maximum aggregate amount outstanding during the year with respect to month end balances amounts to Rs. 4.54 million.
25 BIOLOGICAL ASSETS
30 September 2018
Note Growing cane Wheat Guar Cotton Total
Rupees
At the beginning of the year at fair value 2,282,737,798 – – – 2,282,737,798 Fair value recorded in profit or loss 35.1 1,983,490,606 38,110,114 3,106,308 – 2,024,707,028 Transfer to cost of sales 32.1.1 (2,282,737,798) – – – (2,282,737,798) At the end of the year at fair value 1,983,490,606 38,110,114 3,106,308 – 2,024,707,028 30 September 2017
Note Growing Cane Wheat Guar Cotton Total
Rupees
At the beginning of the year at fair value 2,229,977,882 – – 10,988,225 2,240,966,107 Fair value recorded in profit or loss 35.1 2,282,737,798 – – – 2,282,737,798 Transfer to cost of sales 32.1.1 (2,229,977,882) – – (10,988,225) (2,240,966,107) At the end of the year at fair value 2,282,737,798 – – – 2,282,737,798
25.1 Measurement of fair values
25.1.1 Fair value hierarchy
In absence of active market for sugarcane standing crops, the fair value measurement for the standing crop has been categorized as Level 3 fair value based on the inputs to the valuation techniques used. Fair value has been determined on the basis of a discounted cash flow model. The valuation model considers the present value of net cash flows expected to be generated by the plantation. The cash flow projections include specific estimates for next year which mainly include crop’s expected yield. The expected cash flows are discounted using a risk adjusted discount rate.
25.1.2 Level 3 fair values
The following table shows a break down of the total gains recognized in respect of Level 3 fair values: Note 2018 2017 Rupees Rupees Restated
Net fair value (loss) / gain recognized in other income 35 (108,958,903) 241,293,644
Notes to the Unconsolidated Financial StatementsFor the year ended 30 September 2018

Ann
ual R
epor
t 201
8
91
Fina
ncia
l Sta
tem
ents
Oth
er In
form
atio
nC
ompa
ny R
evie
w
25.1.3 Valuation techniques and significant unobservable inputs
The key variables, assumptions and the impact of changes in those is given below: Unit 2018 2017 Rupees Rupees
Valued plantations (Actual) - Punjab Zone Acres 12,055 12,473 - Sindh Zone Acres 11,245 11,327 Estimated yield per acre - Punjab Zone Maunds 883 950 - Sindh Zone Maunds 878 922 Harvest age Months 12-14 12-14 Estimated future sugarcane market price per maund - Punjab Zone Rupees 180 180 - Sindh Zone Rupees 182 182 Risk - adjusted discount rate % per month 1.15% 0.85% Cost of Rs. 38 million is considered to approximate their respective fair values less point of harvest
costs as these assets are still at a very early stage of plantation and it is considered that in-significant biological transformation has taken place or the impact of fair value measurement is not significant.
25.2 Sensitivity analysis
Impact of changes in key subjective assumptions on fair value of biological assets is given below: Increase / Increase / (Decrease) (Decrease) 2018 2017 Rupees Rupees
Restated
Decrease of 10% in expected average yield per acre (228,365,170) (279,160,673) Decrease of 10% in expected average selling price per maund (330,048,781) (382,083,844) Increase of 10% in discount rate (8,642,588) (9,780,846) 25.3 Risk management strategy related to agricultural activities
The Company is exposed to the following risks relating to its sugarcane cultivation. Regulatory and environmental risks
The Company is subject to various laws and regulations in Pakistan. The Company has established environmental policies and procedures aimed at ensuring compliance with local environmental and other laws. Management performs regular reviews to identify environmental risks and to ensure that the systems in place are adequate to manage those risks.
Climate and other risks
Due to inherent nature of the agricultural assets, it contains elements of significant risks and uncertainties which may adversely affect business and resultant profitability, including but not limited to the following:
i) adverse weather conditions such as floods etc. affecting the quality and quantity of production;
and

JDW
Sug
ar M
ills
Lim
ited
92
ii) potential insect, fungal and weed infestations resulting in crop failure and reduced yields.
The Company is principally dependent upon the Government’s measures for flood control. The Company follows an effective preventive pesticide / insecticide / fungicide program and additional regularly monitors for any infestations and takes immediate curative measures.
Supply and demand risk
The price of sugarcane is driven by consumer demand of sugar as well as Government’s intervention in setting of minimum / support price for the grower. Surplus production or bumper crop may result in a lower selling price hence affecting profitability of the Company adversely. The Company manages this risk by aligning its harvest volume to market supply and demand. Management performs regular industry trend analysis for projected harvest volume and analysis.
2018 2017 Rupees Rupees
26 STORES, SPARE PARTS AND LOOSE TOOLS
Stores - Sugar 595,384,286 608,957,237 - Co-Generation Power 74,458,884 99,173,556 - Corporate farms 289,409,796 258,111,983 959,252,966 966,242,776 Spare parts - Sugar 380,260,009 485,124,901 - Co-Generation Power 80,717,676 67,151,836 460,977,685 552,276,737 Loose tools - Sugar 31,192,621 28,572,423 - Co-Generation Power 12,293,655 11,902,009 43,486,276 40,474,432 1,463,716,927 1,558,993,945 Less: Provision for obsolescence (154,460,560) (146,318,585) 1,309,256,367 1,412,675,360
2018 2017 Rupees Rupees
27 STOCK-IN-TRADE
Sugar 18,718,042,895 7,591,326,448 Bagasse 1,011,991,215 334,668,275 Molasses – 13,762,764 19,730,034,110 7,939,757,487 27.1 Stock-in-trade upto a maximum amount of Rs. 16,022 million (2017: Rs. 6,394 million) are under
hypothecation of commercial banks as security for short term borrowings.
Notes to the Unconsolidated Financial StatementsFor the year ended 30 September 2018

Ann
ual R
epor
t 201
8
93
Fina
ncia
l Sta
tem
ents
Oth
er In
form
atio
nC
ompa
ny R
evie
w
Note 2018 2017 Rupees Rupees Restated
28 TRADE DEBTS - UNSECURED
Considered good Local 28.1 5,037,620,440 2,941,217,253 Exports 28.2 433,847,528 – 5,471,467,968 2,941,217,253 Considered doubtful - local 39,203,083 39,203,083 5,510,671,051 2,980,420,336 Less: Provision for doubtful debts (39,203,083) (39,203,083) 5,471,467,968 2,941,217,253 28.1 This includes Rs. 3,241.66 million (2017: Rs. 1,321.04 million) receivable from Central Power Purchasing
Agency (Guarantee) Limited on account of sale of electricity under EPA. 28.2 This includes Rs. 434 million (2017: Rs. nil) receivable from foreign debtors in Asia. These are secured
against confirmed letter of credit.
Note 2018 2017 Rupees Rupees
29 ADVANCES, DEPOSITS, PREPAYMENTS AND OTHER RECEIVABLES
Advances to growers Unsecured - considered good 235,175,609 356,733,686 Unsecured - considered doubtful 4,937,966 4,937,966 240,113,575 361,671,652 Less: Provision for doubtful advances (4,937,966) (4,937,966) 235,175,609 356,733,686 Advances to suppliers and contractors Unsecured - considered good 408,850,763 312,234,688 Unsecured - considered doubtful 23,810,163 23,810,163 432,660,926 336,044,851 Less: Provision for doubtful advances (23,810,163) (23,810,163) 408,850,763 312,234,688 Advances to related party - unsecured, considered good 29.1 5,008,092 700,722,792 Advances to staff - unsecured, considered good - against salaries 29.2 & 29.3 10,763,647 11,727,993 - against expenses 3,904,396 6,755,319 Sugar export subsidy 1,660,445,300 43,800,000 Due from director - unsecured, considered good 29.4 22,372,086 – Due from related party 29.5 502,579,583 – Sales tax 95,375,398 671,634,155 Prepaid expenses 29,070,499 34,609,038 Current maturity of long term advances 23 5,166,670 19,088,890 Deposits 33,834,976 – Receivables from provident fund – 10,162,266 Other receivables 16,303,464 15,103,838 3,028,850,483 2,182,572,665

JDW
Sug
ar M
ills
Lim
ited
94
29.1 This amount represents advances given to Deharki Sugar Mills (Private) Limited, a wholly owned subsidiary company.
29.2 Advances given to staff are in accordance with the Company’s policy. These advances are secured
against provident fund. These includes an amount of Rs. 6.01 million (2017: Rs. 6.32 million) receivable from executives of the Company.
29.3 These include advances made to employees of the Company namely Safdar Kanjoo, Ghazanfar Ali
Syed and Zulfiqar Ali exceeding Rs. 1 million each. 29.4 This represents amount receivable on account of aircraft expenses amounting to Rs. 22.37 million
(2017: Rs. nil) due from Jahangir Khan Tareen, the director of the Company. The maximum aggregate amount outstanding during the year with respect to month end balances amounts to Rs. 22.37 million.
29.5 This amount includes receivables from JK Sugar Mills (Pvt.) Ltd., JK Dairies (Pvt.) Ltd and ATF Mango
Farms (Pvt.) Ltd. of Rs. 465.64 million (2017: Rs. nil), Rs. 11.23 million (2017: Rs. nil) and Rs. 25.72 million (2017: Rs. nil) respectively.
Note 2018 2017 Rupees Rupees
30 CASH AND BANK BALANCES
At banks: - Current accounts - Balance with islamic banks 22,700,707 14,007,219 - Balance with conventional banks 79,542,155 114,843,981 102,242,862 128,851,200 - Saving accounts - Deposits with conventional banks 30.1 635,556 2,264,620 102,878,418 131,115,820 Cash in hand 3,036,031 2,641,455 105,914,449 133,757,275 30.1 The balances in saving accounts carry mark-up ranging from 3.75% to 5.5% per annum (2017: 3.75%
per annum).
Notes to the Unconsolidated Financial StatementsFor the year ended 30 September 2018

Ann
ual R
epor
t 201
8
95
Fina
ncia
l Sta
tem
ents
Oth
er In
form
atio
nC
ompa
ny R
evie
w
Note 2018 2017 Rupees Rupees Restated
31 SALES - NET
Sugar 31.1 29,904,959,510 39,859,896,276 Agriculture produce 31.2 930,527,404 1,327,197,842 Electricity 31.3 4,775,322,653 4,523,028,533 Molasses - by product 31.4 2,678,907,963 2,621,326,893 Agri Inputs 1,704,293,430 1,511,242,053 Bagasse - by product 257,465,395 119,633,095 40,251,476,355 49,962,324,692 Less: - Sales tax on sugar (2,444,207,140) (3,847,104,686) - Sales tax on electricity, bagasse, agri inputs and molasses (526,828,835) (669,586,825) - Commission and others (15,934,011) (13,676,178) (2,986,969,986) (4,530,367,689) 37,264,506,369 45,431,957,003 31.1 Sugar Local 20,764,741,922 35,712,014,974 Export 31.1.1 9,140,217,588 4,147,881,302 29,904,959,510 39,859,896,276 31.1.1 This includes sugar export subsidy of Rs. 2,175.23 million (2017: Rs. nil).
2018 2017 Rupees Rupees Restated
31.2 Agriculture produce Sugarcane to Deharki Sugar Mills (Private) Limited 756,603,453 1,177,778,578 Sugarcane seed and others 173,923,951 149,419,264 930,527,404 1,327,197,842 31.3 Electricity Captive Power – 141,957,423 Co-Generation Power - variable energy price 2,872,566,392 2,769,747,989 - fixed energy price 1,902,756,261 1,611,323,121 4,775,322,653 4,381,071,110 4,775,322,653 4,523,028,533 31.4 Molasses - by product Sales Under DTRE (Duty & Tax Remission for Exporters) 2,439,869,038 2,163,275,476 Others 239,038,925 458,051,417 2,678,907,963 2,621,326,893

JDW
Sug
ar M
ills
Lim
ited
96
Note 2018 2017 Rupees Rupees Restated
32 COST OF SALES
Opening stock-in-trade 7,939,757,487 5,035,625,241 Add: Cost of goods manufactured 32.1 45,938,398,739 43,711,557,663 53,878,156,226 48,747,182,904 Less: Closing stock - Sugar (18,718,042,895) (7,591,326,448) - Bagasse (1,011,991,215) (334,668,275) - Molasses – (13,762,764) (19,730,034,110) (7,939,757,487) 34,148,122,116 40,807,425,417
32.1 Cost of goods manufactured Cost of crops consumed (including procurement and other costs) 32.1.1 38,779,100,860 37,487,520,466 Salaries, wages and other benefits 32.1.2 1,726,685,932 1,750,205,504 Cost of agri inputs 1,436,004,432 1,158,121,538 Depreciation 19.4 1,057,133,353 942,082,441 Stores and spare parts consumed 986,736,989 715,471,214 Cost of bagasse consumed 388,619,927 204,421,414 Packing materials consumed 363,996,061 311,565,358 Chemicals consumed 264,752,629 217,645,066 Operation and maintenance costs 32.1.3 220,935,421 211,527,800 Sugarcane roots written off 166,432,112 121,028,651 Vehicle running expenses 117,875,314 94,500,780 Oil, lubricants and fuel consumed 77,001,948 78,856,338 Insurance 72,915,816 75,480,273 Electricity and power 68,224,977 52,429,368 Repairs and maintenance 48,068,686 39,495,339 Handling and storage 46,132,534 31,934,162 Mud and bagasse shifting expenses 36,757,027 68,761,220 Freight and octroi 20,217,492 23,354,157 Printing and stationery 8,764,343 10,133,002 Provision for obsolescence 8,141,975 22,385,801 Telephone and fax 7,264,325 7,481,814 Assets written off 4,118,320 9,546,323 Initial land preparation 3,482,786 20,979,798 Travelling and conveyance 2,223,238 3,336,273 Operating lease rentals 1,632,519 27,409,032 Other expenses 25,179,723 25,884,531 45,938,398,739 43,711,557,663
Notes to the Unconsolidated Financial StatementsFor the year ended 30 September 2018
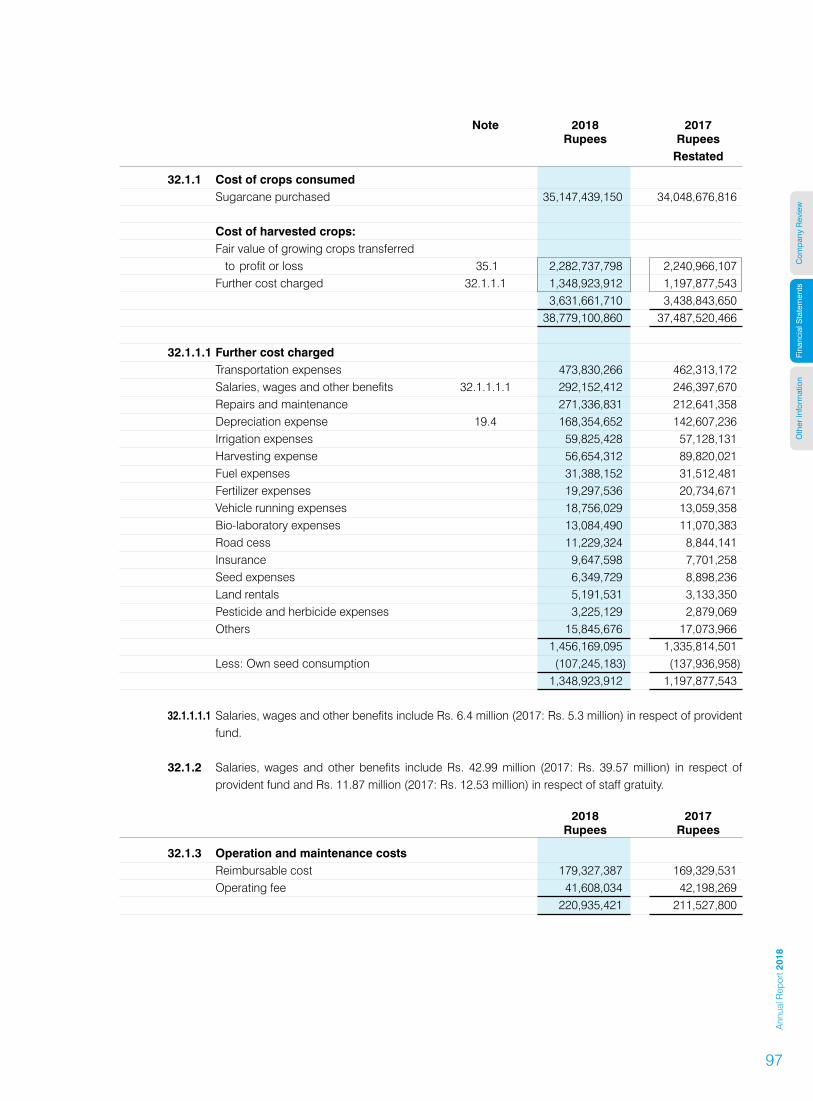
Ann
ual R
epor
t 201
8
97
Fina
ncia
l Sta
tem
ents
Oth
er In
form
atio
nC
ompa
ny R
evie
w
Note 2018 2017 Rupees Rupees Restated
32.1.1 Cost of crops consumed Sugarcane purchased 35,147,439,150 34,048,676,816 Cost of harvested crops: Fair value of growing crops transferred to profit or loss 35.1 2,282,737,798 2,240,966,107 Further cost charged 32.1.1.1 1,348,923,912 1,197,877,543 3,631,661,710 3,438,843,650 38,779,100,860 37,487,520,466
32.1.1.1 Further cost charged Transportation expenses 473,830,266 462,313,172 Salaries, wages and other benefits 32.1.1.1.1 292,152,412 246,397,670 Repairs and maintenance 271,336,831 212,641,358 Depreciation expense 19.4 168,354,652 142,607,236 Irrigation expenses 59,825,428 57,128,131 Harvesting expense 56,654,312 89,820,021 Fuel expenses 31,388,152 31,512,481 Fertilizer expenses 19,297,536 20,734,671 Vehicle running expenses 18,756,029 13,059,358 Bio-laboratory expenses 13,084,490 11,070,383 Road cess 11,229,324 8,844,141 Insurance 9,647,598 7,701,258 Seed expenses 6,349,729 8,898,236 Land rentals 5,191,531 3,133,350 Pesticide and herbicide expenses 3,225,129 2,879,069 Others 15,845,676 17,073,966 1,456,169,095 1,335,814,501 Less: Own seed consumption (107,245,183) (137,936,958) 1,348,923,912 1,197,877,543 32.1.1.1.1 Salaries, wages and other benefits include Rs. 6.4 million (2017: Rs. 5.3 million) in respect of provident
fund. 32.1.2 Salaries, wages and other benefits include Rs. 42.99 million (2017: Rs. 39.57 million) in respect of
provident fund and Rs. 11.87 million (2017: Rs. 12.53 million) in respect of staff gratuity.
2018 2017 Rupees Rupees
32.1.3 Operation and maintenance costs Reimbursable cost 179,327,387 169,329,531 Operating fee 41,608,034 42,198,269 220,935,421 211,527,800
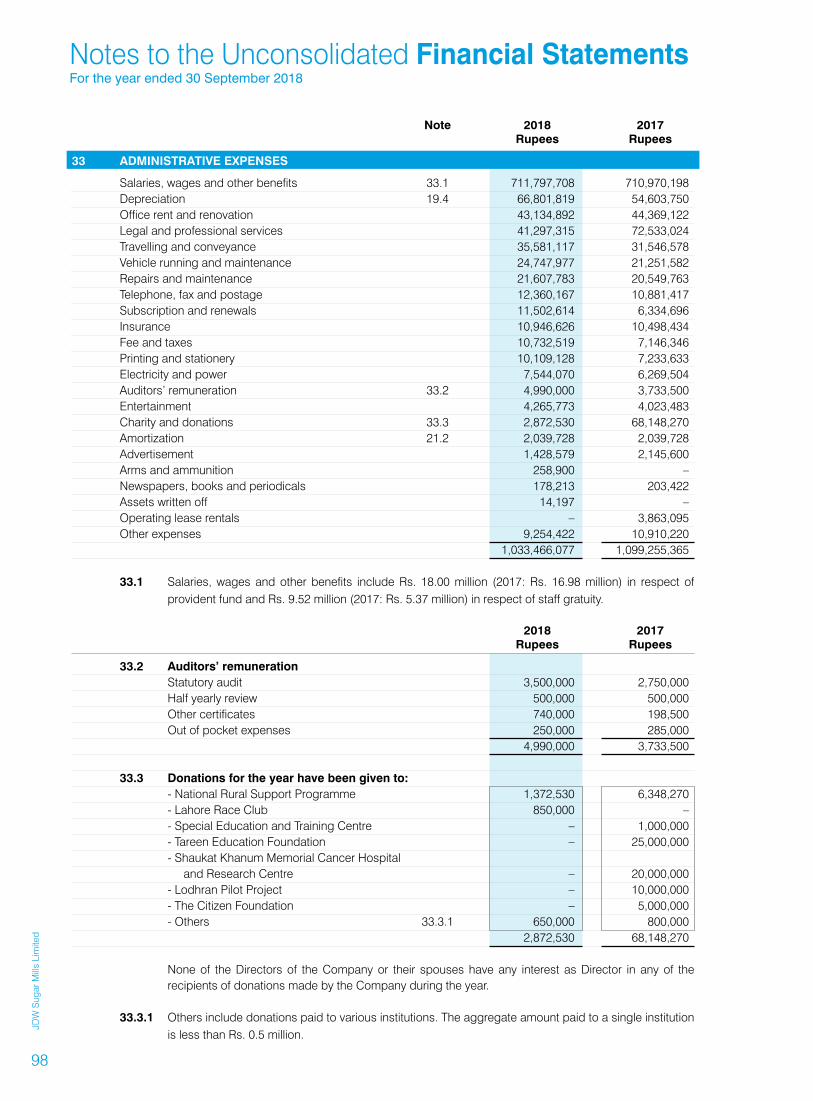
JDW
Sug
ar M
ills
Lim
ited
98
Note 2018 2017 Rupees Rupees
33 ADMINISTRATIVE EXPENSES
Salaries, wages and other benefits 33.1 711,797,708 710,970,198 Depreciation 19.4 66,801,819 54,603,750 Office rent and renovation 43,134,892 44,369,122 Legal and professional services 41,297,315 72,533,024 Travelling and conveyance 35,581,117 31,546,578 Vehicle running and maintenance 24,747,977 21,251,582 Repairs and maintenance 21,607,783 20,549,763 Telephone, fax and postage 12,360,167 10,881,417 Subscription and renewals 11,502,614 6,334,696 Insurance 10,946,626 10,498,434 Fee and taxes 10,732,519 7,146,346 Printing and stationery 10,109,128 7,233,633 Electricity and power 7,544,070 6,269,504 Auditors’ remuneration 33.2 4,990,000 3,733,500 Entertainment 4,265,773 4,023,483 Charity and donations 33.3 2,872,530 68,148,270 Amortization 21.2 2,039,728 2,039,728 Advertisement 1,428,579 2,145,600 Arms and ammunition 258,900 – Newspapers, books and periodicals 178,213 203,422 Assets written off 14,197 – Operating lease rentals – 3,863,095 Other expenses 9,254,422 10,910,220 1,033,466,077 1,099,255,365 33.1 Salaries, wages and other benefits include Rs. 18.00 million (2017: Rs. 16.98 million) in respect of
provident fund and Rs. 9.52 million (2017: Rs. 5.37 million) in respect of staff gratuity.
2018 2017 Rupees Rupees
33.2 Auditors’ remuneration Statutory audit 3,500,000 2,750,000 Half yearly review 500,000 500,000 Other certificates 740,000 198,500 Out of pocket expenses 250,000 285,000 4,990,000 3,733,500 33.3 Donations for the year have been given to: - National Rural Support Programme 1,372,530 6,348,270 - Lahore Race Club 850,000 – - Special Education and Training Centre – 1,000,000 - Tareen Education Foundation – 25,000,000 - Shaukat Khanum Memorial Cancer Hospital and Research Centre – 20,000,000 - Lodhran Pilot Project – 10,000,000 - The Citizen Foundation – 5,000,000 - Others 33.3.1 650,000 800,000 2,872,530 68,148,270 None of the Directors of the Company or their spouses have any interest as Director in any of the
recipients of donations made by the Company during the year. 33.3.1 Others include donations paid to various institutions. The aggregate amount paid to a single institution
is less than Rs. 0.5 million.
Notes to the Unconsolidated Financial StatementsFor the year ended 30 September 2018

Ann
ual R
epor
t 201
8
99
Fina
ncia
l Sta
tem
ents
Oth
er In
form
atio
nC
ompa
ny R
evie
w
Note 2018 2017 Rupees Rupees
34 SELLING EXPENSES
Freight outwards and port charges 361,605,895 31,868,024 Salaries, wages and other benefits 34.1 33,820,084 31,195,361 Other selling expenses 28,888,275 21,742,041 424,314,254 84,805,426 34.1 Salaries, wages and other benefits include Rs. 0.43 million (2017: Rs. 0.63 million) in respect of provident
fund. Note 2018 2017 Rupees Rupees Restated
35 OTHER INCOME
Income from financial assets Foreign exchange gain 153,668,669 10,465,107 Mark-up on delayed payment from Central Power Purchasing Agency (Guarantee) Limited 44,305,469 32,133,474 Interest income on bank deposits 694,474 1,053,924 198,668,612 43,652,505 Income from non-financial assets Gain on sale of operating fixed assets 222,815,041 44,579,772 Sale of mud 127,204,290 83,727,379 Scrap sales 22,532,464 88,441,503 Rental income from investment property 12,430,800 7,625,300 Net fair value (loss) / gain on biological assets 25.1.2 & 35.1 (108,958,903) 241,293,644 Reversal of prior year provision of Workers’ Welfare Fund – 37,681,810 Gain on sale of investment property – 21,280,886 Others 944,852 2,766,374 276,968,544 527,396,668 475,637,156 571,049,173 35.1 Fair value (loss) / gain on biological assets Fair value of growing crops 2,024,707,028 2,282,737,798 Cost of growing crops 35.1.1 (2,133,665,931) (2,041,444,154) (108,958,903) 241,293,644 35.1.1 Cost of growing crops Land rentals 726,608,788 758,259,225 Irrigation expenses 317,981,533 247,612,968 Fertilizer expenses 274,164,272 230,703,159 Depreciation expense 19.4 255,743,882 249,092,623 Salaries, wages and other benefits 35.1.1.1 224,696,329 273,588,344 Repairs and maintenance 143,060,220 116,336,278 Pesticide and herbicide expenses 109,799,466 79,674,850 Fuel expenses 38,874,570 32,343,176 Vehicle running expenses 16,685,108 19,693,746 Bio-laboratory expenses 13,268,970 14,558,992 Insurance 3,892,070 12,695,863 Others 8,890,723 6,884,930 2,133,665,931 2,041,444,154 35.1.1.1 Salaries, wages and other benefits include Rs. 6.3 million (2017: Rs. 6.8 million) in respect of provident
fund.

JDW
Sug
ar M
ills
Lim
ited
100
Note 2018 2017 Rupees Rupees Restated
36 OTHER EXPENSES
Prior year adjustment of Workers’ Profit Participation Fund 16.2 5,237,703 – Worker’s Profit Participation Fund 16.2 – 115,971,432 Provision for doubtful trade debts / advances – 26,909,293 Workers’ Welfare Fund 16.3 – 18,510,840 Others – 5,136,698 5,237,703 166,528,263
Note 2018 2017 Rupees Rupees
37 FINANCE COST
Mark-up based loans from conventional banks - short term borrowings - secured 927,638,756 575,963,492 - long term finances - secured 709,785,381 726,025,593 - redeemable capital - secured 1,495,987 8,867,880 - finance leases 17,037,141 41,872,570 1,655,957,265 1,352,729,535 Islamic mode of financing - short term borrowings - secured 335,725,100 148,702,976 - long term finances - secured 191,996,209 85,621,985 527,721,309 234,324,961 Borrowings from related party - unsecured - Deharki Sugar Mills (Private) Limited 34,465,820 –
Workers’ Profit Participation Fund 16.2 61,879,769 68,868,710 Bank charges and commission 51,061,356 37,842,498 112,941,125 106,711,208 Less: Borrowing costs capitalized (61,324,124) (28,471,915) 2,269,761,395 1,665,293,789
2018 2017 Rupees Rupees Restated
38 TAXATION
Income tax - current year 152,917,186 357,783,683 - change in estimate related to prior years 42,756,807 116,331,951 195,673,993 474,115,634 Deferred tax (132,991,498) 117,185,929 62,682,495 591,301,563
Notes to the Unconsolidated Financial StatementsFor the year ended 30 September 2018

Ann
ual R
epor
t 201
8
101
Fina
ncia
l Sta
tem
ents
Oth
er In
form
atio
nC
ompa
ny R
evie
w
38.1 Tax Charge Reconciliation
Numerical reconciliation between tax expense and accounting profit
2018 2017 Rupees Rupees Restated
(Loss) / profit before taxation (140,758,020) 2,179,697,916 Tax at 29% (2017: 30%) (40,819,826) 653,909,375 Tax effect of: - permanent differences 102,438,680 28,432,449 - tax credits on BMR (254,927,975) (177,033,967) - not adjustable for tax purposes (449,837,190) 35,522,088 - income under final tax regime (FTR) 94,048,614 14,069,978 - minimum tax 311,494,539 – - change in estimate related to prior years 42,756,807 34,709,557 - derecognition of prior year tax credits 255,226,838 – - others 2,302,008 1,692,083 62,682,495 591,301,563
38.2 As per management’s assessment, the provision for tax made in the unconsolidated financial statements is sufficient. A comparison of last two years of income tax provisions with tax assessment is presented below:
Tax provision Tax as per as per financial assessment / statements return Rupees Rupees
Tax Years 2017 – 78,524,659 2018 357,783,683 420,352,743 38.3 The two new high-pressure Co-Generation power plants have been set up by the Company under the
Federal Government’s Framework for Power Co-Generation 2013 read with the Policy for Development of Renewable Energy for Power Generation, 2006.
As per the aforementioned policies, the Company’s sale of electricity from the power plants to Central
Power Purchasing Agency (Guarantee) Limited is exempt from income tax including turnover tax and withholding tax on imports, and for this purpose, the new power generation units of the company shall be treated as separate entities.
However, the Company is seeking clarification on whether existing notified exemptions for other power projects shall also apply to the Company’s power projects or new exemptions shall be notified. In the meantime, the accounts of the Company including the power projects are being prepared under normal taxation regime.
38.4 For tax contingencies, refer note 18.1.

JDW
Sug
ar M
ills
Lim
ited
102
2018 2017 Restated
39 (LOSS) / EARNINGS PER SHARE - BASIC AND DILUTED
Basic (loss) / earnings per share (Loss) / profit after taxation Rupees (203,440,515) 1,588,396,353 Weighted average number of ordinary shares Numbers 59,776,661 59,776,661 Basic (loss) / earnings per share Rupees (3.40) 26.57 There is no dilutive effect on the basic (loss) / earnings per share.
2018 2017 Rupees Rupees Restated
40 CASH GENERATED FROM OPERATIONS
(Loss) / profit before taxation (140,758,020) 2,179,697,916 Adjustments for non-cash and other items: Finance cost 2,269,761,395 1,665,293,789 Depreciation 1,541,382,447 1,293,822,063 Fair value loss / (gain) on biological assets 108,958,903 (241,293,644) Staff retirement benefits 97,931,694 87,758,841 Assets written off 170,564,629 130,574,974 Provision for obsolescence 8,141,975 22,385,801 Prior year adjustment of Workers’ Profit Participation Fund 5,237,703 – Amortization of intangibles 2,039,728 2,039,728 Gain on disposal of operating fixed assets (222,815,041) (44,579,772) Workers’ Profit Participation Fund – 115,971,432 Workers’ Welfare Fund – 18,510,840 Provision for doubtful trade debts / advances – 26,909,293 Reversal of prior year provision Workers’ Welfare Fund – (37,681,810) Gain on disposal of investment property – (21,280,886) 3,981,203,433 3,018,430,649 Operating profit before working capital changes 3,840,445,413 5,198,128,565 (Increase) / decrease in current assets Stock-in-trade (11,790,276,623) (2,904,132,246) Biological assets 149,071,867 199,521,953 Trade debts (2,530,250,715) (2,095,504,325) Stores, spare parts and loose tools 95,277,018 (354,378,900) Advances, deposits, prepayments and other receivables (854,693,260) (1,033,172,285) (14,930,871,713) (6,187,665,803) Increase in current liabilities Trade and other payables 2,558,626,615 1,028,817,124 Cash (used in) / generated from operations (8,531,799,685) 39,279,886
Notes to the Unconsolidated Financial StatementsFor the year ended 30 September 2018
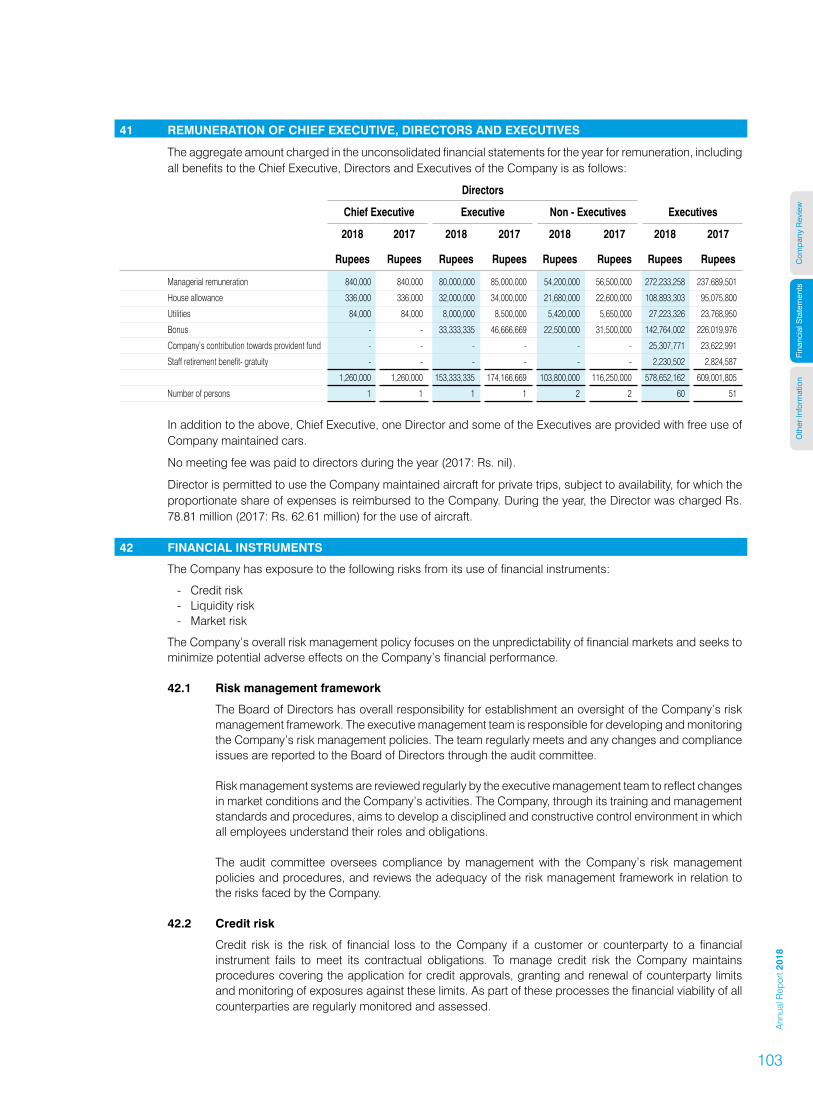
Ann
ual R
epor
t 201
8
103
Fina
ncia
l Sta
tem
ents
Oth
er In
form
atio
nC
ompa
ny R
evie
w
41 REMUNERATION OF CHIEF EXECUTIVE, DIRECTORS AND EXECUTIVES
The aggregate amount charged in the unconsolidated financial statements for the year for remuneration, including all benefits to the Chief Executive, Directors and Executives of the Company is as follows:
Directors
Chief Executive Executive Non - Executives Executives
2018 2017 2018 2017 2018 2017 2018 2017
Rupees Rupees Rupees Rupees Rupees Rupees Rupees Rupees
Managerial remuneration 840,000 840,000 80,000,000 85,000,000 54,200,000 56,500,000 272,233,258 237,689,501
House allowance 336,000 336,000 32,000,000 34,000,000 21,680,000 22,600,000 108,893,303 95,075,800
Utilities 84,000 84,000 8,000,000 8,500,000 5,420,000 5,650,000 27,223,326 23,768,950
Bonus - - 33,333,335 46,666,669 22,500,000 31,500,000 142,764,002 226,019,976
Company’s contribution towards provident fund - - - - - - 25,307,771 23,622,991
Staff retirement benefit- gratuity - - - - - - 2,230,502 2,824,587
1,260,000 1,260,000 153,333,335 174,166,669 103,800,000 116,250,000 578,652,162 609,001,805
Number of persons 1 1 1 1 2 2 60 51
In addition to the above, Chief Executive, one Director and some of the Executives are provided with free use of
Company maintained cars.
No meeting fee was paid to directors during the year (2017: Rs. nil).
Director is permitted to use the Company maintained aircraft for private trips, subject to availability, for which the proportionate share of expenses is reimbursed to the Company. During the year, the Director was charged Rs. 78.81 million (2017: Rs. 62.61 million) for the use of aircraft.
42 FINANCIAL INSTRUMENTS
The Company has exposure to the following risks from its use of financial instruments:
- Credit risk - Liquidity risk - Market risk
The Company’s overall risk management policy focuses on the unpredictability of financial markets and seeks to minimize potential adverse effects on the Company’s financial performance.
42.1 Risk management framework
The Board of Directors has overall responsibility for establishment an oversight of the Company’s risk management framework. The executive management team is responsible for developing and monitoring the Company’s risk management policies. The team regularly meets and any changes and compliance issues are reported to the Board of Directors through the audit committee.
Risk management systems are reviewed regularly by the executive management team to reflect changes
in market conditions and the Company’s activities. The Company, through its training and management standards and procedures, aims to develop a disciplined and constructive control environment in which all employees understand their roles and obligations.
The audit committee oversees compliance by management with the Company’s risk management
policies and procedures, and reviews the adequacy of the risk management framework in relation to the risks faced by the Company.
42.2 Credit risk
Credit risk is the risk of financial loss to the Company if a customer or counterparty to a financial instrument fails to meet its contractual obligations. To manage credit risk the Company maintains procedures covering the application for credit approvals, granting and renewal of counterparty limits and monitoring of exposures against these limits. As part of these processes the financial viability of all counterparties are regularly monitored and assessed.

JDW
Sug
ar M
ills
Lim
ited
104
42.2.1 Exposure to credit risk
The carrying amount of financial assets represents the maximum credit exposure. The maximum exposure to credit risk at the statement of financial position date was:
2018 2017 Rupees Rupees
Long term advances – 3,272,223 Long term deposits 37,488,439 54,978,065 Trade debts 5,471,467,968 2,941,217,253 Advances, deposits and other receivables 596,028,518 756,805,779 Bank balances 102,878,418 131,115,820 6,207,863,343 3,887,389,140
42.2.2 Concentration of credit risk
The Company identifies concentration of credit risk by reference to type of counter party. Maximum exposure to credit risk by type of counterparty is as follows:
2018 2017 Rupees Rupees
Customers 5,471,467,968 2,941,217,253 Banking companies 102,878,418 131,115,820 Others 633,516,957 815,056,067 6,207,863,343 3,887,389,140
42.2.3 Credit quality of financial assets
The credit quality of financial assets that are neither past due nor impaired can be assessed by reference to external credit ratings or to historical information about counterparty.
Trade debts - considered good
Majority of the Company’s sales are on advance basis and trade debts mainly represents receivable from Central Power Purchasing Agency (Guarantee) Limited a Government owned entity. Hence the management believes that no impairment allowance is necessary in respect of these trade debts.
2018 2017
Gross Accumulated Gross Accumulated carrying amount impairment carrying amount impairment
Rupees Rupees Rupees Rupees
The aging of trade receivables at the reporting date is:
Neither past due nor impaired 5,471,467,968 – 2,941,217,253 – Past due more than 365 days 39,203,083 39,203,083 39,203,083 39,203,083 5,510,671,051 39,203,083 2,980,420,336 39,203,083
Customer credit risk is managed subject to the Company’s established policy, procedures and controls
relating to customer credit risk management. Based on past experience the management believes that no further impairment allowance is necessary in respect of trade receivables as some receivables have been recovered subsequent to the year end and for other receivables there are reasonable grounds to believe that the amounts will be recovered in short course of time.
Notes to the Unconsolidated Financial StatementsFor the year ended 30 September 2018

Ann
ual R
epor
t 201
8
105
Fina
ncia
l Sta
tem
ents
Oth
er In
form
atio
nC
ompa
ny R
evie
w
Bank balances
The Company’s exposure to credit risk against balances with various commercial banks is as follows: 2018 2017 Rupees Rupees
At banks: Current accounts 102,242,862 128,851,200 Saving accounts 635,556 2,264,620 102,878,418 131,115,820
The credit quality of Company’s bank balances can be assessed with reference to external credit rating agencies as follows:
Rating Rating 2018 2017
Long term Short term Agency Rupees Rupees Banks
Al-Baraka Bank (Pakistan) Limited A A1 PACRA 32,859 40,273 Allied Bank Limited AAA A1+ PACRA 68,965 6,160,618 Askari Bank Limited AA+ A1+ PACRA 89,299 171,135 Askari Bank Limited (Islamic) AA+ A1+ PACRA 8,365,715 34,475 Bank Al Habib Limited AA+ A1+ PACRA 76,815 17,691 Bank Alfalah Limited AA+ A1+ PACRA 100,902 164,289 Bank Alfalah Limited (Islamic) AA+ A1+ PACRA 3,189,309 9,748,089 Bank Islami (Pakistan) Limited A+ A1 PACRA 23,444 179,831 Dubai Islamic Bank (Pakistan) Limited AA- A-1 JCR-VIS 31,504 21,447 Faysal Bank Limited AA A1+ PACRA 57,946 19,389,668 Faysal Bank Limited (Islamic) AA A1+ PACRA 27,945 – Habib Bank Limited AAA A-1+ JCR-VIS 519,368 2,884,279 JS Bank Limited AA- A1+ PACRA 711,420 433,876 MCB Bank Limited AAA A1+ PACRA 28,230,931 20,948,966 MCB Islamic Bank Limited A A1 PACRA 3,027,455 3,534,295 Meezan Bank Limited AA+ A-1+ JCR-VIS 6,843,510 164,629 National Bank of Pakistan AAA A1+ PACRA 13,169,613 54,653,533 National Bank of Pakistan (Islamic) AAA A1+ PACRA 1,184,425 295,399 Silk Bank Limited A- A-2 JCR-VIS 5,386 5,509 Sindh Bank Limited AA A-1+ JCR-VIS 29,478 17,071 Soneri Bank Limited AA- A1+ PACRA 25,262 14,455 Summit Bank Limited A- A-1 JCR-VIS 10,208,629 2,521,860 The Bank of Khyber A A1 PACRA 92,747 24,030 The Bank of Punjab AA A1+ PACRA 26,331,830 9,375,872 The First Micro Finance Bank Limited A+ A-1 JCR-VIS 50,464 10,907 Tameer Bank Limited A+ A1 PACRA 38,458 38,905 United Bank Limited AAA A-1+ JCR-VIS 344,739 169,112 Standard Chartered Bank (Pakistan) Limited AAA A1+ PACRA – 95,606 102,878,418 131,115,820
Due to the Company’s long standing business relationships with these counterparties and after giving due consideration to their strong financial standing, management does not expect non performance by these counterparties on their obligations to the Company. Accordingly, the credit risk is minimal.

JDW
Sug
ar M
ills
Lim
ited
106
42.3 Liquidity risk
Liquidity risk is the risk that the Company will not be able to meet its financial obligations as they fall due. The Company’s approach to managing liquidity is to ensure, as far as possible, that it will always have sufficient liquidity to meet its liabilities when due, under both normal and stressed conditions. For this purpose the Company has sufficient running finance facilities available from various commercial banks to meet its liquidity requirements. Further liquidity position of the Company is closely monitored through budgets, cash flow projections and comparison with actual results by the Board.
42.3.1 Exposure to liquidity risk
42.3.1(a) Contractual maturities of financial liabilities, including estimated interest payments.
2018
Carrying Contractual One year One to More than amount cash flows or less five years five years
Rupees
Non-derivative financial liabilities Long term finances - secured 12,786,462,987 15,658,363,596 5,393,363,596 10,265,000,000 – Short term borrowings 23,553,685,516 23,930,948,135 23,930,948,135 – – Liabilities against assets subject to finance lease - secured 249,959,511 267,992,731 115,129,719 152,863,012 – Accrued profit / interest / mark-up 534,626,215 534,626,215 534,626,215 – – Trade and other payables 2,565,871,424 2,565,871,424 2,565,871,424 – – 39,690,605,653 42,957,802,101 32,539,939,089 10,417,863,012 –
2017
Carrying Contractual One year One to More than amount cash flows or less five years five years
Rupees
Non-derivative financial liabilities Redeemable capital - secured 83,333,333 84,818,000 84,818,000 – – Long term finances - secured 12,924,312,947 14,881,058,077 3,944,212,155 10,936,845,922 – Short term borrowings 10,053,163,155 10,163,660,737 10,163,660,737 – – Liabilities against assets subject to finance lease - secured 306,472,177 323,440,763 165,224,811 158,215,952 – Accrued profit / interest / mark-up 226,191,820 226,191,820 226,191,820 – – Trade and other payables 1,706,831,043 1,706,831,043 1,706,831,043 – – 25,300,304,475 27,386,000,440 16,290,938,566 11,095,061,874 –
42.4 Market risk
Market risk is the risk that changes in market prices, such as foreign exchange rates, interest rates and equity prices will affect the Company’s income or the value of its holdings of financial instruments. The objective of market risk management is to manage and control market risk exposures within acceptable parameters, while optimizing the return.
42.4.1 Currency risk
Currency risk is the risk that fair values or future cash flows of a financial instrument will fluctuate because of changes in foreign exchange rates. Currency risk arises from sales, purchases and resulting balances that are denominated in a currency other than functional currency. The Company is not exposed to foreign currency risk as at the reporting date.
Notes to the Unconsolidated Financial StatementsFor the year ended 30 September 2018

Ann
ual R
epor
t 201
8
107
Fina
ncia
l Sta
tem
ents
Oth
er In
form
atio
nC
ompa
ny R
evie
w
42.4.2 Interest rate risk
The effective interest / mark-up rates for interest / mark-up bearing financial instruments are mentioned in relevant notes to the financial statements. The Company’s interest / mark-up bearing financial instruments as at the reporting date are as follows:
2018 2017
Financial Financial Financial Financial asset liability asset liability
Non-derivative financial instruments Note Rupees Rupees Rupees Rupees
Advance to Deharki Sugar Mills (Private) Limited 29 5,008,092 – 700,722,792 – Due to Deharki Sugar Mills (Private) Limited 16.1 – 142,907,170 – – Redeemable capital - secured 9 – – – 83,333,333 Long term finances - secured 10 – 12,786,462,987 – 12,924,312,947 Liabilities against assets subject to finance lease - secured 11 – 249,959,511 – 306,472,177 Short term borrowings 14 – 23,553,685,516 – 10,053,163,155 Cash at bank 30.1 635,556 – 2,264,620 – Variable rate instruments 5,643,648 36,733,015,184 702,987,412 23,367,281,612
The Company does not account for any fixed rate financial assets and liabilities at fair value through profit and loss. Therefore a change in interest rates at the reporting date would not affect statement of profit or loss.
Cash flow sensitivity analysis for variable rate instruments A change of 100 basis points in interest rates at the reporting date would have increased / (decreased)
profit for the year by the amounts shown below. This analysis assumes that all other variables, in particular foreign currency rates, remain constant. The analysis is performed on the same basis for 2018.
Profit or loss 100 bps
2018 2017 Increase Decrease Increase Decrease Rupees
(367,273,715) 367,273,715 (226,642,942) 226,642,942 The sensitivity analysis prepared is not necessarily indicative of the effects on profit for the year and
assets / liabilities of the Company. 42.4.3 Interest rate risk management
The Company manages these mismatches through risk management strategies where significant changes in gap position can be adjusted. The long and short term borrowing and loans and advances by the Company has variable rate pricing that is mostly dependent on Karachi Inter Bank Offered Rate (“KIBOR”) as indicated in respective notes.
42.4.4 Other price risk
Other price risk is the risk that the fair value or future cash flows of a financial instrument will fluctuate because of changes in market prices (other than those arising from interest rate risk or currency risk). The Company is not exposed to other price risk.

JDW
Sug
ar M
ills
Lim
ited
108
42.4.5 Fair values
Fair value is the price that would be received to sell an asset or paid to transfer a liability in an orderly transaction between market participants at the measurement date.
Underlying the definition of fair value is the presumption that the Company is a going concern without
any intention or requirement to curtail materially the scale of its operations or to undertake a transaction on adverse terms.
The fair value of financial assets and liabilities traded in active markets i.e. listed equity shares are based
on the quoted market prices at the close of trading on the period end date. The quoted market prices used for financial assets held by the Company is current bid price.
A financial instrument is regarded as quoted in an active market if quoted prices are readily and regularly
available from an exchange, dealer, broker, industry group, pricing service or regulatory agency and those prices represent actual and regularly occurring market transactions on an arm’s length basis.
IFRS 13, ‘Fair Value Measurements’ requires the Company to classify fair value measurements using a
fair value hierarchy that reflects the significance of the inputs used in making the measurements. The fair value hierarchy has the following levels:
- Quoted prices (unadjusted) in active markets for identical assets or liabilities that the entity can
access at the measurement date (level 1).
- Inputs other than quoted prices included within Level 1 that are observable for the asset or liability, either directly or indirectly (level 2).
- Unobservable inputs for the asset or liability (level 3).
42.4.5.1 Fair value measurement of financial instruments
The following table shows the carrying amounts and fair values of financial instruments and non-financial instruments including their levels in the fair value hierarchy:
Carrying amount Fair value
Loans and Financial
receivables at liabilities at Total Level 1 Level 2 Level 3
Note amortized cost amortized cost
On-balance sheet financial instruments Rupees
30 September 2018
Financial assets measured at fair value – – – – – –
Financial assets not measured at fair value
Long term advances – – – – – –
Long term deposits 37,488,439 – 37,488,439 – – –
Trade debts - unsecured considered good 5,471,467,968 – 5,471,467,968 – – –
Advances, deposits and other receivables 596,028,518 – 596,028,518 – – –
Cash and bank balances 105,914,449 – 105,914,449 – – –
42.4.5.2 6,210,899,374 – 6,210,899,374 – – –
Financial liabilities measured at fair value – – – – – –
Financial liabilities not measured at fair value
Long term finances - secured – 12,786,462,987 12,786,462,987 – – –
Short term borrowings – 23,553,685,516 23,553,685,516 – – –
Liabilities against assets
subject to finance lease - secured – 249,959,511 249,959,511 – – –
Accrued profit / interest / mark-up – 534,626,215 534,626,215 – – –
Trade and other payables – 2,565,871,424 2,565,871,424 – – –
42.4.5.2 – 39,690,605,653 39,690,605,653 – – –
Notes to the Unconsolidated Financial StatementsFor the year ended 30 September 2018
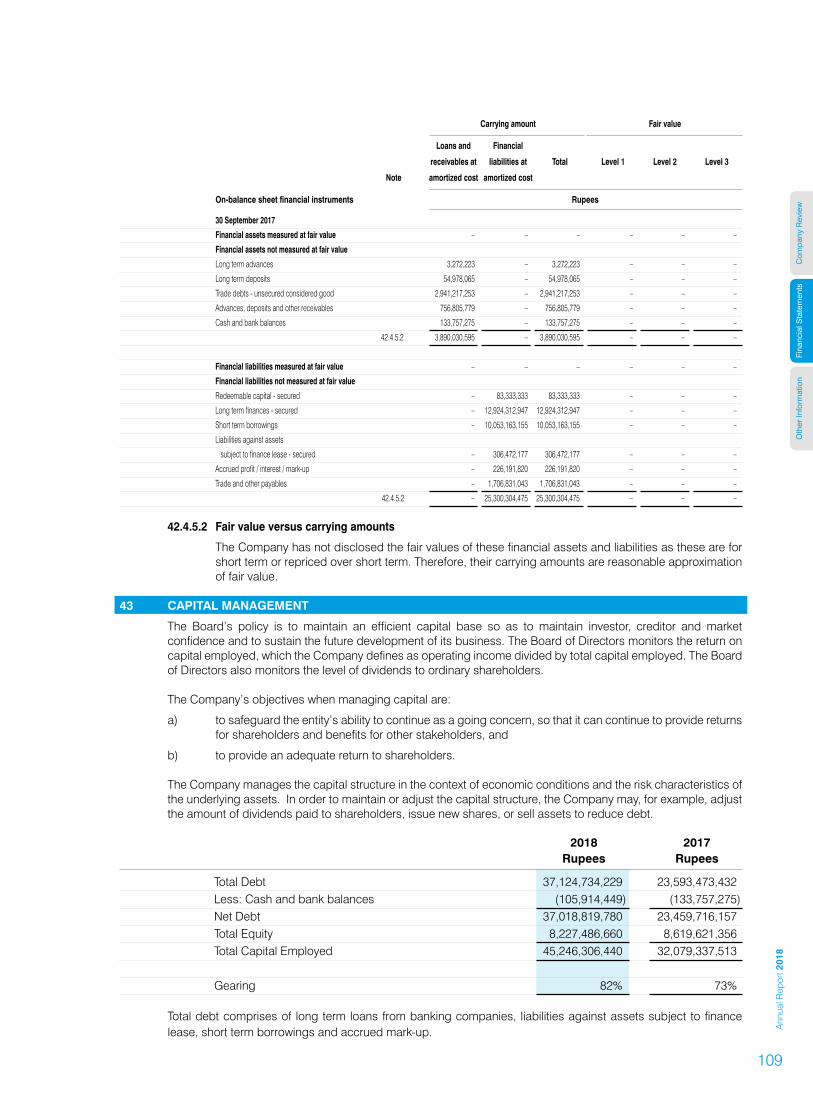
Ann
ual R
epor
t 201
8
109
Fina
ncia
l Sta
tem
ents
Oth
er In
form
atio
nC
ompa
ny R
evie
w
Carrying amount Fair value
Loans and Financial
receivables at liabilities at Total Level 1 Level 2 Level 3
Note amortized cost amortized cost
On-balance sheet financial instruments Rupees
30 September 2017
Financial assets measured at fair value – – – – – –
Financial assets not measured at fair value
Long term advances 3,272,223 – 3,272,223 – – –
Long term deposits 54,978,065 – 54,978,065 – – –
Trade debts - unsecured considered good 2,941,217,253 – 2,941,217,253 – – –
Advances, deposits and other receivables 756,805,779 – 756,805,779 – – –
Cash and bank balances 133,757,275 – 133,757,275 – – –
42.4.5.2 3,890,030,595 – 3,890,030,595 – – –
Financial liabilities measured at fair value – – – – – –
Financial liabilities not measured at fair value
Redeemable capital - secured – 83,333,333 83,333,333 – – –
Long term finances - secured – 12,924,312,947 12,924,312,947 – – –
Short term borrowings – 10,053,163,155 10,053,163,155 – – –
Liabilities against assets
subject to finance lease - secured – 306,472,177 306,472,177 – – –
Accrued profit / interest / mark-up – 226,191,820 226,191,820 – – –
Trade and other payables – 1,706,831,043 1,706,831,043 – – –
42.4.5.2 – 25,300,304,475 25,300,304,475 – – –
42.4.5.2 Fair value versus carrying amounts
The Company has not disclosed the fair values of these financial assets and liabilities as these are for short term or repriced over short term. Therefore, their carrying amounts are reasonable approximation of fair value.
43 CAPITAL MANAGEMENT
The Board’s policy is to maintain an efficient capital base so as to maintain investor, creditor and market confidence and to sustain the future development of its business. The Board of Directors monitors the return on capital employed, which the Company defines as operating income divided by total capital employed. The Board of Directors also monitors the level of dividends to ordinary shareholders.
The Company’s objectives when managing capital are:
a) to safeguard the entity’s ability to continue as a going concern, so that it can continue to provide returns for shareholders and benefits for other stakeholders, and
b) to provide an adequate return to shareholders. The Company manages the capital structure in the context of economic conditions and the risk characteristics of
the underlying assets. In order to maintain or adjust the capital structure, the Company may, for example, adjust the amount of dividends paid to shareholders, issue new shares, or sell assets to reduce debt.
2018 2017 Rupees Rupees
Total Debt 37,124,734,229 23,593,473,432 Less: Cash and bank balances (105,914,449) (133,757,275)Net Debt 37,018,819,780 23,459,716,157 Total Equity 8,227,486,660 8,619,621,356 Total Capital Employed 45,246,306,440 32,079,337,513
Gearing 82% 73%
Total debt comprises of long term loans from banking companies, liabilities against assets subject to finance lease, short term borrowings and accrued mark-up.

JDW
Sug
ar M
ills
Lim
ited
110
Total equity includes issued, subscribed and paid-up share capital, share premium reserves and accumulated profits. 44 TRANSACTIONS WITH RELATED PARTIES
The related parties comprise of subsidiary companies, associated company, other related companies, directors of the Company and entities under common directorship, key management personnel and post employment benefit plans. Amounts due from and due to related parties are shown under respective notes to these financial statements. Other significant transactions with related parties except those disclosed elsewhere are as follows:
2018 2017 Name of company Relationship Nature of transactions Rupees Rupees
Deharki Sugar Mills Subsidiary Company (Pvt.) Limited (Equity held 100%) Short term advance - net 1,339,344,000 704,300,000 Mark-up expense on short term advances 41,830,327 1,812,560 Mark-up income on short term advances 7,364,507 3,885,339 Sale of sugarcane 756,603,452 1,177,778,578 Purchase of bagasse 276,508,138 121,960,452 Reimbursement on use of Company’s aircraft 10,154,064 10,827,042 Rent on land acquired on lease 8,585,300 3,577,208 Purchase of property, plant and equipment 927,606 1,875,501 Proceeds from sale of property, plant and equipment – 4,951,950
Sadiqabad Power Subsidiary Company Investment in shares 10,001,000 – (Pvt.) Limited (Equity held 100%) Advances for issuance of shares 3,549,000 10,133,876 Ghotki Power Subsidiary Company Investment in shares 10,001,000 – (Pvt.) Limited (Equity held 100%) Advances for issuance of shares 3,799,000 10,134,581 JDW Aviation Associated Company Reimbursement of expenses 13,580,726 15,435,344 (Pvt.) Limited (Common directorship)
Post Employment Provident fund contribution 153,074,951 142,240,446 Benefit Plans Payment to recognized gratuity fund 10,417,866 103,648,576 Key Management Personnel Consultancy services 11,495,496 13,091,751 For remuneration and other benefits of Chief Executive, Executive Director and Non-Executive Directors, refer
note 41. 2018 2017 Tonnes Tonnes
45 CAPACITY AND PRODUCTION
Sugar Unit I Crushing capacity 3,000,000 3,000,000 Sugar production 409,507 357,733
Unit II Crushing capacity 1,500,000 1,500,000 Sugar production 255,879 247,926 Unit III Crushing capacity 2,100,000 2,100,000 Sugar production 223,325 207,747
The crushing capacity is based on 150 days (2017: 150 days).
Notes to the Unconsolidated Financial StatementsFor the year ended 30 September 2018

Ann
ual R
epor
t 201
8
111
Fina
ncia
l Sta
tem
ents
Oth
er In
form
atio
nC
ompa
ny R
evie
w
2018 2017 MWh MWh
Co - Generation Power
Unit II
Installed capacity (based on 8,760 hours) 233,016 233,016
Energy generated / produced 211,109 210,593
Energy delivered to Central Power Purchasing Agency (Guarantee) Limited 176,740 176,561
Unit III
Installed capacity (based on 8,760 hours) 235,031 235,031
Energy generated / produced 210,533 199,005
Energy delivered to Central Power Purchasing Agency (Guarantee) Limited 187,007 169,778
2018 2017
Corporate Farms Area Acres Area Acres
Land Punjab & Sindh 30,590 Punjab & Sindh 32,287 Land under cultivation Punjab & Sindh 23,300 Punjab & Sindh 22,208
46 PROVIDENT FUND TRUST
The following information is based on latest audited financial statements of Provident Fund Trust. 30 June 30 June
Unit 2018 2017
Size of fund - total assets Rupees 494,153,551 513,948,597 Cost of investments made Rupees 468,510,420 465,684,299 Percentage of investments made Percentage 94.81% 90.61% Fair value of investment Rupees 468,021,289 495,895,942
The breakup of cost of investments is as follows: 30 June 2018 30 June 2017
Rupees Percentage Rupees Percentage
Investments in mutual funds 80,000,000 17.08% 226,000,000 48.53%Certificate of investment and term deposits receipts 159,733,562 34.09% 131,068,994 28.15%Shares in listed companies 17,465,713 3.73% 16,286,227 3.50%Cash at bank 211,311,145 45.10% 92,329,078 19.82% 468,510,420 100% 465,684,299 100%
The investments of the Provident Fund Trust are in compliance with the provision of section 218 of the Companies
Act, 2017 and the rules formulated for this purpose.

JDW
Sug
ar M
ills
Lim
ited
112
47
RE
CO
NC
ILIA
TIO
N O
F M
OV
EM
EN
TS O
F LI
AB
ILIT
IES
TO
CA
SH
FLO
WS
AR
ISIN
G F
RO
M F
INA
NC
ING
AC
TIV
ITIE
S
2018
Eq
uity
Li
abili
ties
Issu
ed,
Shar
e Un
clai
med
Re
deem
able
Lo
ng te
rm
Liab
ilitie
s Sh
ort t
erm
Ac
crue
d
su
bscr
ibed
pr
emiu
m
Divi
dend
ca
pita
l -
finan
ces
- ag
ains
t bo
rrow
ings
pr
ofit /
and
paid
- up
se
cure
d se
cure
d as
sets
sub
ject
inte
rest
/
ca
pita
l
to
fina
ncia
l
mar
k-up
le
ase
- sec
ured
Rupe
es
Ba
lanc
e as
at 0
1 O
ctob
er 2
017
597
,766
,610
6
78,3
16,9
28
64,
248,
402
8
3,33
3,33
3
12,
924,
312,
947
3
06,4
72,1
77
10,
053,
163,
155
2
26,1
91,8
20
Ch
ange
s fro
m fi
nanc
ing
cash
flow
s
Lo
ans
rece
ived
durin
g th
e ye
ar
–
–
– –
2
,994
,149
,322
–
3
5,37
9,54
4,23
8
–
Di
viden
ds p
aid
–
–
(2
09,5
05,5
70)
–
– –
–
–
Lo
an re
paid
dur
ing th
e ye
ar
–
–
–
(83,
333,
333)
(3
,131
,999
,282
) (1
67,5
27,2
10)
(24,
061,
224,
905)
–
–
–
(2
09,5
05,5
70)
(83,
333,
333)
(1
37,8
49,9
60)
(167
,527
,210
) 1
1,31
8,31
9,33
3
–
O
ther
cha
nges
- Li
abili
ty re
late
d
In
tere
st e
xpen
se fo
r the
year
–
–
–
–
–
–
–
2,2
52,1
68,6
09
In
tere
st p
aid d
uring
the
year
–
–
–
–
–
–
–
(1
,943
,734
,214
)
Di
viden
d ap
prov
ed
–
–
1
79,3
29,9
83
–
–
–
–
–
Ne
t cha
nge
in ca
sh a
nd c
ash
equiv
alent
–
–
–
–
–
–
2,1
82,2
03,0
28
–
As
sets
acq
uired
on
finan
ce le
ase
–
–
–
–
–
111
,014
,544
–
–
To
tal l
iabi
lity-
rela
ted
othe
r cha
nges
–
–
1
79,3
29,9
83
–
–
111
,014
,544
2
,182
,203
,028
3
08,4
34,3
95
Ba
lanc
e as
at 3
0 Se
ptem
ber 2
018
597
,766
,610
6
78,3
16,9
28
34,
072,
815
–
12,
786,
462,
987
2
49,9
59,5
11
23,
553,
685,
516
5
34,6
26,2
15
Notes to the Unconsolidated Financial StatementsFor the year ended 30 September 2018

Ann
ual R
epor
t 201
8
113
Fina
ncia
l Sta
tem
ents
Oth
er In
form
atio
nC
ompa
ny R
evie
w
48 IMPACT OF RESTATEMENTS ON FINANCIAL STATEMENTS
The impact of the application of the revised standards as stated in note 5.1 and the impact of rate revision by NEPRA as stated in 5.8 on the Company’s financial results and financial position is disclosed below:
Effects of restatement on financial statements as at 30 September 2016
As per audited Effect of Restated financial statements restatements amount
Rupees
Statement of financial position Accumulated profit 7,044,672,556 214,828,442 7,259,500,998 Trade debts - unsecured 1,025,619,160 (155,189,290) 870,429,870 Biological assets - non-current assets 7,279,311 (7,279,311) – Property, plant and equipment 19,541,735,582 377,297,043 19,919,032,625
Effects of restatement on financial statements for the year ended 30 September 2017
As per audited Effect of Restated financial statements restatements amount
Rupees
Statement of financial position Accumulated profit 7,152,880,785 190,657,033 7,343,537,818 Property, plant and equipment 21,058,980,010 417,771,278 21,476,751,288 Trade debts - unsecured 3,234,430,508 (293,213,255) 2,941,217,253 Biological assets - non-current assets 14,595,399 (14,595,399) – Advance tax - net 784,949,809 6,454,393 791,404,202 Deferred taxation 1,818,467,413 (64,483,630) 1,753,983,783 Trade and other payables 8,310,801,726 (9,756,386) 8,301,045,340 Statement of Profit or loss Gross sales 50,100,348,657 (138,023,965) 49,962,324,692 Cost of sales (40,676,688,988) (130,736,429) (40,807,425,417) Other expenses (149,375,356) (17,152,907) (166,528,263) Other income 407,154,597 163,894,576 571,049,173 Taxation (662,239,586) 70,938,023 (591,301,563) Earning per share 26.98 (0.41) 26.57 Statement of Cash flow Profit before taxation 2,274,807,348 (95,109,432) 2,179,697,916 Adjustments for non-cash and other items 3,071,073,555 (52,642,906) 3,018,430,649 (Increase) / decrease in current assets (6,496,900,432) 309,234,629 (6,187,665,803) Cash flows from investing activities (2,596,053,437) (161,482,291) (2,757,535,728)

JDW
Sug
ar M
ills
Lim
ited
114
49 NUMBER OF EMPLOYEES
The average and total number of employees are as follows:
Total employees
2018 2017 Average number of employees during the year 7,435 8,517 Total number of employees as at 30 September 5,874 6,194 Factory employees
2018 2017 Average number of employees during the year 7,178 8,265 Total number of employees as at 30 September 5,620 5,934 50 DATE OF AUTHORIZATION FOR ISSUE
These unconsolidated financial statements were authorized for issue on 07 January 2019 by the Board of Directors of the Company.
51 CORRESPONDING FIGURES
Corresponding figures have been re-arranged and re-classified, wherever necessary, for the purposes of comparison and better presentation as per reporting framework however, no significant re-arrangements have been made, except for as required by additional requirements of Companies Act, 2017.
Chief Financial Officer Chief Executive Director
Notes to the Unconsolidated Financial StatementsFor the year ended 30 September 2018

Consolidated Financial Statements
for the year ended 30 September 2018


Fina
ncia
l Sta
tem
ents
Oth
er In
form
atio
nC
ompa
ny R
evie
w
Ann
ual R
epor
t 201
8
117
The Directors are pleased to present the Consolidated Financial Statements of JDW Sugar Mills Limited (“the Holding Company”) and its Subsidiary Companies; Deharki Sugar Mills (Private) Limited, Faruki Pulp Mills Limited, Sadiqabad Power (Private) Limited and Ghotki Power (Private) Limited (“the Group”) for the year ended September 30, 2018.
Deharki Sugar Mills (Private) Limited (“DSML”) was incorporated as a Private Limited Company. The Principal activity of Subsidiary Company is production and sale of crystalline sugar. The Holding Company holds 100% shares of the Subsidiary Company.
Faruki Pulp Mills Limited (“FPML”) was incorporated as a Public Limited Company. The Subsidiary Company will be engaged in the manufacture and sale of paper pulp. The Holding Company holds 57.67% shares of the Subsidiary Company.
Sadiqabad Power (Private) Limited (“SPL”) was incorporated on 16 December 2016. The Subsidiary Company will be engaged in the production of electricity under the expansion program of the Holding Company’s existing bagasse based co-generation power plants. The Holding Company holds 100% shares of the Subsidiary Company.
Ghotki Power (Private) Limited (“GPL”) was incorporated on 15 December 2016. The Subsidiary Company will be engaged in the production of electricity under the expansion program of the Holding Company’s existing bagasse based co-generation power plants. The Holding Company holds 100% shares of the Subsidiary Company.
It is being confirmed that to the best of our knowledge, these consolidated financial statements for the year ended September 30, 2018 give a true and fair view of the assets, liabilities, financial position and financial results of the Group and are in conformity with approved accounting standards as applicable in Pakistan.
FINANCIAL OVERVIEW
The consolidated financial results are as follows:
30 September 30 September 2018 2017
(Rs. in Million)
Gross Sales 48,465 57,054
Net Sales 44,531 51,631
Operating Profit 2,178 4,170
(Loss) / Profit before Tax (544) 2,213
(Loss) / Profit after Tax (760) 1,828
Directors have given their detailed review report of affairs of the Holding Company as well as Subsidiary Companies in Directors’ report to the shareholders of Holding Company.
07 January 2019 Lahore Chief Executive Director
Directors’ Reporton Consolidated Financial Statements

JDW
Gro
up
118

Fina
ncia
l Sta
tem
ents
Oth
er In
form
atio
nC
ompa
ny R
evie
w
Ann
ual R
epor
t 201
8
119
Opinion
We have audited the annexed consolidated financial statements of JDW Sugar Mills Limited and its subsidiaries (“the Group”), which comprise the consolidated statement of financial position as at 30 September 2018, and the consolidated statement of profit or loss, the consolidated statement of comprehensive income, the consolidated statement of changes in equity, the consolidated statement of cash flows for the year then ended, and notes to the consolidated financial statements, including a summary of significant accounting policies and other explanatory information.
In our opinion, consolidated financial statements give a true and fair view of the consolidated financial position of the Group as at 30 September 2018 and of its consolidated financial performance and its consolidated cash flows for the year then ended in accordance with accounting and reporting standards as applicable in Pakistan.
Basis for Opinion
We conducted our audit in accordance with International Standards on Auditing (ISAs) as applicable in Pakistan. Our responsibilities under those standards are further described in the Auditors’ Responsibilities for the Audit of the consolidated financial statements section of our report. We are independent of the Group in accordance with the International Ethics Standards Board for Accountants’ Code of Ethics for Professional Accountants as adopted by the Institute of Chartered Accountants of Pakistan (the Code) and we have fulfilled our other ethical responsibilities in accordance with the Code. We believe that the audit evidence we have obtained is sufficient and appropriate to provide a basis for our opinion.
Emphasis of matter
We draw attention to note 1.3 to the consolidated financial statements, which indicates that Faruki Pulp Mills Limited (“a Subsidiary Company”) has not been able to commence commercial production to date due to reasons explained therein. These conditions indicate the existence of a material uncertainty that may cast significant doubt about the Subsidiary Company’s ability to continue as a going concern. Our opinion is not qualified in respect of this matter.
Key Audit Matters
Key audit matters are those matters that, in our professional judgment, were of most significance in our audit of the consolidated financial statements of the current period. These matters were addressed in the context of our audit of the consolidated financial statements as a whole, and in forming our opinion thereon, and we do not provide a separate opinion on these matters.
Independent Auditors’ ReportTo the members of JDW Sugar Mills Limited
Telephone + 92 (42) 111-KPMGTH (576484)Fax + 92 (42) 37429907Internet www.kpmg.com.pk
KPMG Taseer Hadi & Co.Chartered Accountants351 Shadman-1, Jail Road, Lahore 54000 Pakistan

JDW
Gro
up
120
Sr. No. Key audit matters How the matter was addressed in our audit
1 Revenue recognition
Refer to notes 5.9 and 31 to the consolidated financial statements.
The Group principally generates revenue from sale of sugar, agriculture produce and electricity in the domestic market. Additionally revenue is also generated from sale of sugar in the international market.
We identified revenue recognition as a key audit matter because it is one of the key performance indicator of the Group and gives rise to an inherent risk of misstatement to meet expectations or targets.
Our audit procedures, amongst others, included the following:
• obtaining an understanding of the process relating to recording of sales and testing the design, implementation and operating effectiveness of relevant key internal controls over recording of sales;
• assessing the appropriateness of the Group’s accounting policy for recording of sales and compliance of the policy with applicable accounting standards;
• comparing a sample of sale transactions recorded during the year with sales orders, sales invoices, delivery challans and other relevant underlying documents;
• comparing a sample of sale transactions recorded near the year end with the sales orders, sales invoices, delivery challans and other relevant underlying documentation to assess if the sale was recorded in the appropriate accounting period;
• comparing a sample of electricity sales transactions with energy invoices duly verified by Central Power Purchasing Agency (Guarantee) Limited (‘‘CPPA-G’’) and assessed whether the sale was recorded in the appropriate accounting period;
• for a sample of invoices, recalculating the invoice amount based on fixed and variable component provided by National Electric Power Regulatory Authority (NEPRA);
• inspecting on a sample basis, credit notes issued near to and subsequent to year end to evaluate whether the adjustments to sales had been accurately recorded in the appropriate accounting period; and
• scanning for any manual journal entries relating to sales recorded during and near the year end which were considered to be material or met other specific risk based criteria for inspecting underlying documentation.
2 Capitalization of property, plant and equipment
Refer notes 5.2 and 19 to the consolidated financial statements.
The Group has made significant capital expenditure on balancing, modernization and replacement of plant and equipment.
We identified capitalization of property, plant and equipment as a key audit matter because there is a risk that amounts being capitalized may not meet the capitalization criteria with related implications on depreciation charge for the year.
Our audit procedures, amongst others, included the following:
• obtaining an understanding of and testing the design, implementation and operating effectiveness of management’s key internal control over capital expenditure;
• comparing, on sample basis, the costs incurred on projects with supporting documentation and contracts;
• assessing the nature of costs incurred for the capital projects for appropriateness by comparing, on sample basis, amounts recorded with underlying documentation and considering that the expenditure meets the criteria for capitalization as per the applicable accounting standards; and
Following are the Key audit matters:

Fina
ncia
l Sta
tem
ents
Oth
er In
form
atio
nC
ompa
ny R
evie
w
Ann
ual R
epor
t 201
8
121
Sr. No. Key audit matters How the matter was addressed in our audit
• inspecting supporting documents for the date of capitalization when project assets were ready for its intended use to assess that depreciation commenced and further capitalization of costs ceased from that date and to assess the useful life assigned by management including testing the calculation of related depreciation.
3 Valuation of stock-in-trade
Refer notes 5.5 and 27 to the consolidated financial statements.
The balance of gross stock-in-trade at 30 September 2018 was Rs. 24,252.93 million.
We identified valuation of stock-in-trade as a key audit matter as it involves significant management judgement in determining the carrying value of stock -in-trade.
Our audit procedures, amongst others, included the following:
• assessing the appropriateness of Groups’s accounting policy for valuation of stock-in- trade and compliance of the policy with the requirements of the prevailing accounting standards;
• obtaining an understanding of internal controls over valuation of stock-in-trade and testing, on a sample basis, their design, implementation and operating effectiveness;
• obtaining an understanding and assessing reasonableness of the management’s determination of net realizable value (NRV) and the key estimates adopted, including future selling prices and costs necessary to make the sales and their basis; and
• comparing the NRV, on a sample basis, to the cost of stock-in-trade to assess whether any adjustments are required to the value of stock in trade in accordance with the accounting policy.
4 Growing cane valuation
Refer note 25 to the consolidated financial statements.
The Group’s biological assets include standing cane, wheat and guar crops which are measured at fair value less costs to sell.
The carrying value of the growing cane as at 30 September 2018 was Rs. 2,024.70 million.
Estimating the fair value is a complex process involving a number of judgements and estimates regarding various inputs. Due to the nature of the asset, the valuation technique includes a discounted cash flow model that uses a number of inputs from internal sources due to a lack of relevant and reliable observable inputs. Consequently, we have determined the valuation of growing cane to be a key audit matter.
Our audit procedures, amongst others, included the following:
• assessing the design and implementation of the controls around the valuation of the biological assets;
• assessing the appropriateness of the principles used in the valuation of growing cane, and analyzing the significant assumptions used by management in their valuation models;
• evaluating the Group’s inputs used in calculating the estimated cash flows by comparing them with historical performance and the Group’s plans;
• involving our own valuation specialist to assist in evaluating the appropriateness of the discount rates used, which included comparing the discount rate with sector averages for the relevant markets in which the Group operates; and
• evaluating the adequacy of the financial statement disclosures, including disclosures of key assumptions, judgements and sensitivities.

JDW
Gro
up
122
Sr. No. Key audit matters How the matter was addressed in our audit
5 Impairment assessment of GoodwillGoodwill of Rs. 1,073.94 million was recognized on business acquisition undertaken by the Group as disclosed in note 21.1 to the consolidated financial statements.
The testing is subject to estimates and judgements made by the management with respect to future sales growth and profitability, cash flow projection and selection of appropriate discount rate.
We identified impairment testing of goodwill as a key audit matter because significant degree of management judgement is involved in assessing its recoverable amount.
Our audit procedures, amongst others, included the following:
• discussing with the management key assumptions used in valuation model and testing the mathematical accuracy of the model;
• involving our internal valuation specialists to assist us in evaluating the assumptions and judgements adopted by the management relating to growth rate, terminal values and the discount rate used to derive the recoverable amount of goodwill;
• comparing the recoverable amount with the goodwill recognized to identify impairment, if any; and
• assessing the adequacy of disclosure made in the consolidated financial statements in accordance with the requirements of the applicable accounting standards.
Information other than the Financial Statements and Auditor’s Report thereon
Management is responsible for the other information. Other information comprises the information included in the annual report for the year ended 30 September 2018, but does not include the consolidated and unconsolidated financial statements and our Auditors’ report thereon.
Our opinion on the consolidated financial statements does not cover the other information and we do not express any form of assurance conclusion thereon.
In connection with our audit of the consolidated financial statements, our responsibility is to read the other information and, in doing so, consider whether the other information is materially inconsistent with the consolidated financial statements or our knowledge obtained in the audit or otherwise appears to be materially misstated. If, based on the work we have performed, we conclude that there is a material misstatement of this other information, we are required to report that fact. We have nothing to report in this regard.
Responsibilities of Management and Board of Directors for the Consolidated Financial Statements
Management is responsible for the preparation and fair presentation of the consolidated financial statements in accordance with the accounting and reporting standards as applicable in Pakistan and the requirements of Companies Act, 2017 and for such internal control as management determines is necessary to enable the preparation of consolidated financial statements that are free from material misstatement, whether due to fraud or error.
In preparing the consolidated financial statements, management is responsible for assessing the Group’s ability to continue as a going concern, disclosing, as applicable, matters related to going concern and using the going concern basis of accounting unless management either intends to liquidate the Group or to cease operations, or has no realistic alternative but to do so.
The Board of Directors is responsible for overseeing the Group’s financial reporting process.
Auditor’s Responsibilities for the Audit of the Consolidated Financial Statements
Our objectives are to obtain reasonable assurance about whether the consolidated financial statements as a whole are free from material misstatement, whether due to fraud or error and to issue an auditor’s report that includes our opinion. Reasonable assurance is a high level of assurance, but is not a guarantee that an audit conducted in accordance with ISAs as applicable in Pakistan will always detect a material misstatement when it exists. Misstatements can arise from fraud or error and are considered material if, individually or in the aggregate, they could reasonably be expected to influence the economic decisions of users taken on the basis of these consolidated financial statements.
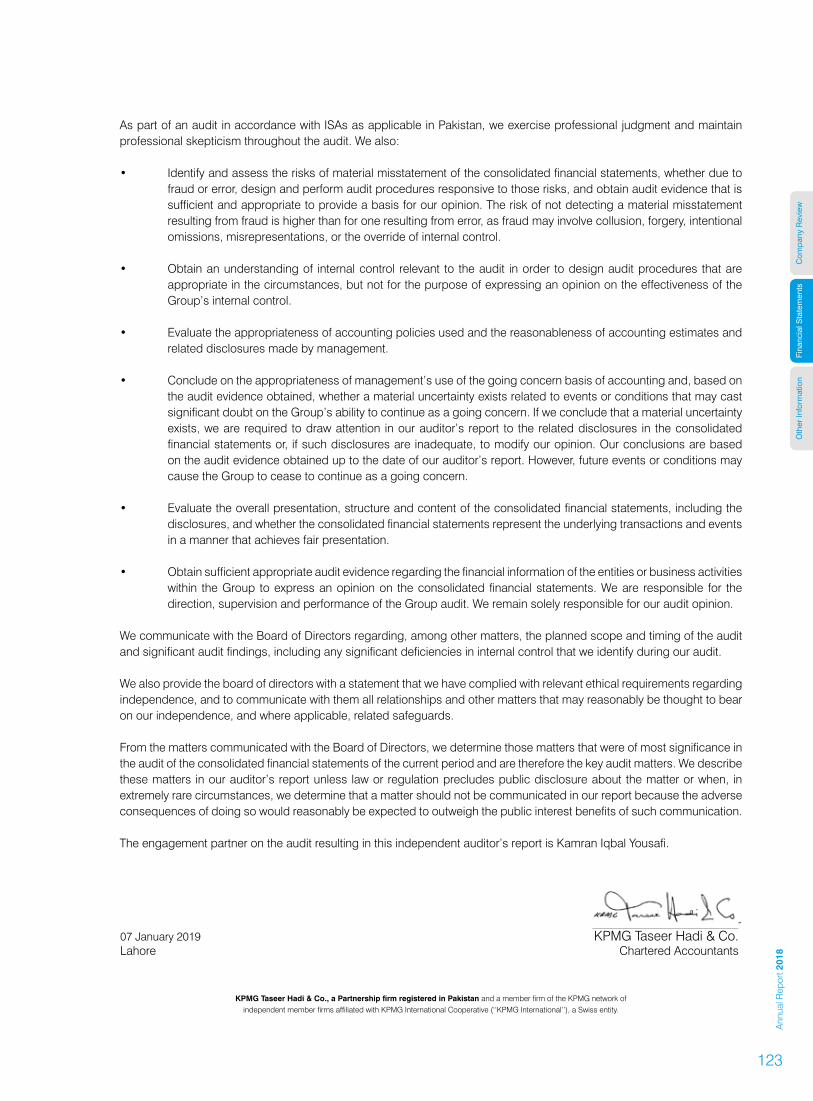
Fina
ncia
l Sta
tem
ents
Oth
er In
form
atio
nC
ompa
ny R
evie
w
Ann
ual R
epor
t 201
8
123
As part of an audit in accordance with ISAs as applicable in Pakistan, we exercise professional judgment and maintain professional skepticism throughout the audit. We also:
• Identify and assess the risks of material misstatement of the consolidated financial statements, whether due to fraud or error, design and perform audit procedures responsive to those risks, and obtain audit evidence that is sufficient and appropriate to provide a basis for our opinion. The risk of not detecting a material misstatement resulting from fraud is higher than for one resulting from error, as fraud may involve collusion, forgery, intentional omissions, misrepresentations, or the override of internal control.
• Obtain an understanding of internal control relevant to the audit in order to design audit procedures that are appropriate in the circumstances, but not for the purpose of expressing an opinion on the effectiveness of the Group’s internal control.
• Evaluate the appropriateness of accounting policies used and the reasonableness of accounting estimates and related disclosures made by management.
• Conclude on the appropriateness of management’s use of the going concern basis of accounting and, based on the audit evidence obtained, whether a material uncertainty exists related to events or conditions that may cast significant doubt on the Group’s ability to continue as a going concern. If we conclude that a material uncertainty exists, we are required to draw attention in our auditor’s report to the related disclosures in the consolidated financial statements or, if such disclosures are inadequate, to modify our opinion. Our conclusions are based on the audit evidence obtained up to the date of our auditor’s report. However, future events or conditions may cause the Group to cease to continue as a going concern.
• Evaluate the overall presentation, structure and content of the consolidated financial statements, including the disclosures, and whether the consolidated financial statements represent the underlying transactions and events in a manner that achieves fair presentation.
• Obtain sufficient appropriate audit evidence regarding the financial information of the entities or business activities within the Group to express an opinion on the consolidated financial statements. We are responsible for the direction, supervision and performance of the Group audit. We remain solely responsible for our audit opinion.
We communicate with the Board of Directors regarding, among other matters, the planned scope and timing of the audit and significant audit findings, including any significant deficiencies in internal control that we identify during our audit.
We also provide the board of directors with a statement that we have complied with relevant ethical requirements regarding independence, and to communicate with them all relationships and other matters that may reasonably be thought to bear on our independence, and where applicable, related safeguards.
From the matters communicated with the Board of Directors, we determine those matters that were of most significance in the audit of the consolidated financial statements of the current period and are therefore the key audit matters. We describe these matters in our auditor’s report unless law or regulation precludes public disclosure about the matter or when, in extremely rare circumstances, we determine that a matter should not be communicated in our report because the adverse consequences of doing so would reasonably be expected to outweigh the public interest benefits of such communication.
The engagement partner on the audit resulting in this independent auditor’s report is Kamran Iqbal Yousafi.
07 January 2019 KPMG Taseer Hadi & Co.Lahore Chartered Accountants
KPMG Taseer Hadi & Co., a Partnership firm registered in Pakistan and a member firm of the KPMG network of independent member firms affiliated with KPMG International Cooperative (‘‘KPMG International’’), a Swiss entity.

JDW
Gro
up
124
Note 2018 2017 2016 Rupees Rupees Rupees Restated Restated
SHARE CAPITAL AND RESERVES Share capital 7 597,766,610 597,766,610 597,766,610 Share premium reserve 8 678,316,928 678,316,928 678,316,928 Accumulated profit 7,553,230,137 8,499,933,160 8,172,314,009 Equity attributable to owners of the Parent 8,829,313,675 9,776,016,698 9,448,397,547
Non-controlling interests 43 480,996,662 483,176,144 486,430,148 9,310,310,337 10,259,192,842 9,934,827,695 NON-CURRENT LIABILITIES Redeemable capital - secured 9 – – 83,333,333 Long term finances - secured 10 11,046,944,471 10,162,313,674 10,103,138,981 Liabilities against assets subject to finance lease - secured 11 144,677,914 153,047,674 495,823,654 Deferred taxation 12 1,679,775,836 1,743,972,922 1,869,360,530 Retirement benefits 13 53,784,119 36,372,935 106,839,313 12,925,182,340 12,095,707,205 12,658,495,811 CURRENT LIABILITIES Short term borrowings - secured 14 27,855,950,339 13,783,388,645 3,594,347,767 Current portion of non-current liabilities 15 4,714,800,113 3,606,729,189 3,816,448,480 Trade and other payables 16 11,723,684,739 9,285,217,661 7,934,497,077 Unclaimed dividend 34,072,815 64,248,402 27,794,069 Accrued profit / interest / mark-up 17 642,496,578 277,241,631 132,500,195 44,971,004,584 27,016,825,528 15,505,587,588
CONTINGENCIES AND COMMITMENTS 18 67,206,497,261 49,371,725,575 38,098,911,094
The annexed notes from 1 to 52 form an integral part of these consolidated financial statements.
Chief Financial Officer
Consolidated Statement of Financial Position

Fina
ncia
l Sta
tem
ents
Oth
er In
form
atio
nC
ompa
ny R
evie
w
Ann
ual R
epor
t 201
8
125
Note 2018 2017 2016 Rupees Rupees Rupees Restated Restated
ASSETS NON-CURRENT ASSETS Property, plant and equipment 19 27,235,277,171 26,666,360,569 24,581,066,461 Investment property 20 218,599,597 218,599,597 196,467,698 Intangibles 21 1,073,947,842 1,076,016,261 1,078,098,811 Long term investments 22 – – – Long term advances 23 – 3,272,223 18,430,247 Long term deposits 24 37,552,439 55,042,065 111,510,138 28,565,377,049 28,019,290,715 25,985,573,355 CURRENT ASSETS
Biological assets 25 2,024,707,028 2,282,737,798 2,240,966,107 Stores, spare parts and loose tools 26 1,579,713,636 1,712,412,677 1,335,033,812 Stock-in-trade 27 24,252,933,912 11,331,790,869 5,287,410,535 Trade debts - unsecured considered good 28 6,118,517,116 3,294,827,101 890,823,609 Advances, deposits, prepayments and other receivables 29 3,583,613,379 1,734,614,036 1,543,949,118 Advance tax - net 956,005,124 825,347,483 783,413,904 Cash and bank balances 30 125,630,017 170,704,896 31,740,654 38,641,120,212 21,352,434,860 12,113,337,739
67,206,497,261 49,371,725,575 38,098,911,094
Chief Executive Director
As at 30 September 2018

JDW
Gro
up
126
Note 2018 2017 Rupees Rupees Restated
Gross sales 48,465,077,640 57,053,715,559
Sales tax and others (3,934,383,590) (5,422,413,247)
Net sales 31 44,530,694,050 51,631,302,312
Cost of sales 32 (41,244,607,208) (46,526,885,012)
Gross profit 3,286,086,842 5,104,417,300
Administrative expenses 33 (1,195,679,302) (1,273,545,024)
Selling expenses 34 (439,187,556) (90,520,675)
Other income 35 534,236,589 598,898,339
Other expenses 36 (7,580,596) (169,386,635)
(1,108,210,865) (934,553,995)
Profit from operations 2,177,875,977 4,169,863,305
Finance cost 37 (2,722,018,412) (1,956,637,158)
(Loss) / profit before taxation (544,142,435) 2,213,226,147
Taxation 38 (216,045,889) (384,944,407)
(Loss) / profit after taxation (760,188,324) 1,828,281,740
Attributable to:
Owners of the Parent Company (758,008,842) 1,831,717,792
Non-controlling interests 43 (2,179,482) (3,436,052)
(760,188,324) 1,828,281,740
The annexed notes from 1 to 52 form an integral part of these consolidated financial statements.
Chief Financial Officer Chief Executive Director
Consolidated Statement of Profit or LossFor the year ended 30 September 2018
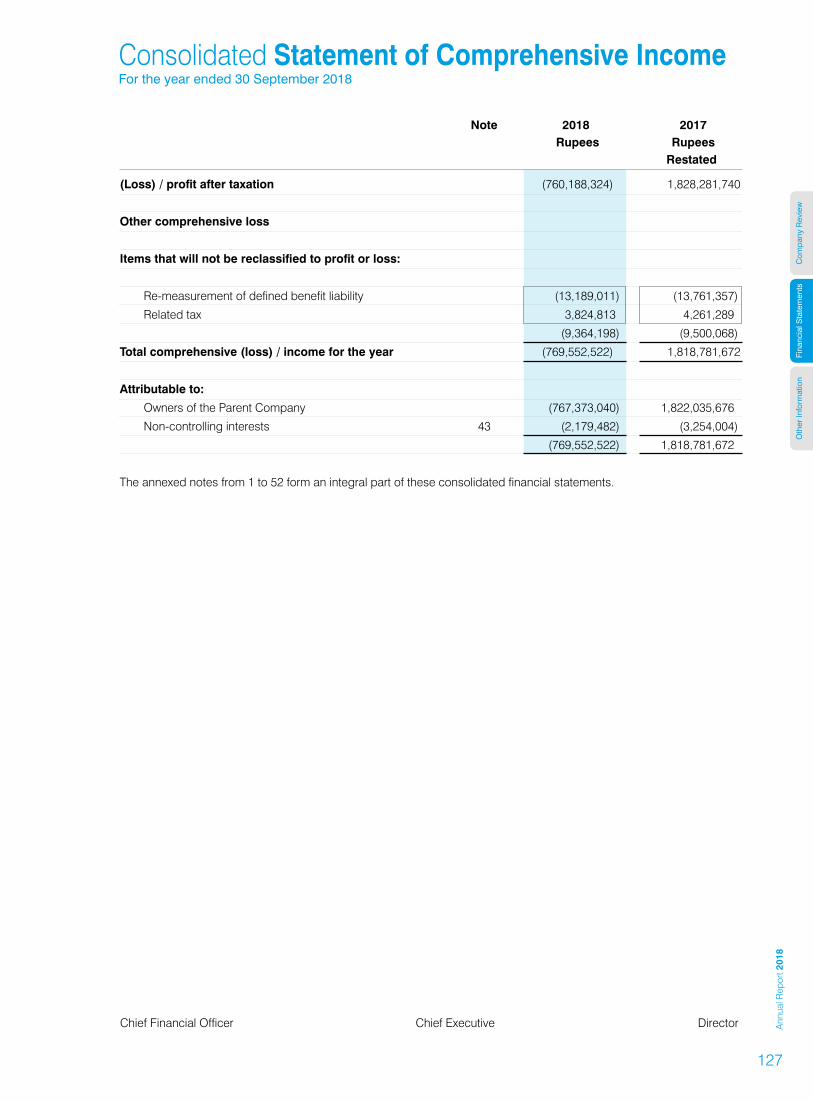
Fina
ncia
l Sta
tem
ents
Oth
er In
form
atio
nC
ompa
ny R
evie
w
Ann
ual R
epor
t 201
8
127
Note 2018 2017 Rupees Rupees Restated
(Loss) / profit after taxation (760,188,324) 1,828,281,740
Other comprehensive loss
Items that will not be reclassified to profit or loss:
Re-measurement of defined benefit liability (13,189,011) (13,761,357)
Related tax 3,824,813 4,261,289
(9,364,198) (9,500,068)
Total comprehensive (loss) / income for the year (769,552,522) 1,818,781,672
Attributable to:
Owners of the Parent Company (767,373,040) 1,822,035,676
Non-controlling interests 43 (2,179,482) (3,254,004)
(769,552,522) 1,818,781,672
The annexed notes from 1 to 52 form an integral part of these consolidated financial statements.
Chief Financial Officer Chief Executive Director
Consolidated Statement of Comprehensive IncomeFor the year ended 30 September 2018

JDW
Gro
up
128
Note 2018 2017 Rupees Rupees Restated
CASH FLOWS FROM OPERATING ACTIVITIES
Cash used in operations 39 (10,664,184,909) (1,720,079,631)
Taxes paid (406,658,808) (548,004,314)
Staff retirement benefits paid (91,233,656) (191,212,834)
Workers’ Profit Participation Fund paid 16.2 (186,034,175) (256,311,956)
(683,926,639) (995,529,104)
Net cash used in operating activities (11,348,111,548) (2,715,608,735)
CASH FLOWS FROM INVESTING ACTIVITIES
Capital expenditure (2,681,536,570) (3,656,364,428)
Long term advances 17,194,443 22,333,332
Long term deposits 17,489,626 56,468,073
Proceeds from sale of operating fixed assets 562,357,766 82,823,382
Proceeds from sale of investment property – 37,437,422
Net cash used in investing activities (2,084,494,735) (3,457,302,219)
CASH FLOWS FROM FINANCING ACTIVITIES
Long term finances - net 2,040,844,627 (36,324,745)
Short term borrowings - net 11,899,298,444 9,146,911,624
Finance cost paid (2,331,804,996) (1,769,145,925)
Lease rentals paid (184,564,351) (613,732,820)
Dividend paid (209,505,570) (1,457,962,192)
Net cash generated from financing activities 11,214,268,154 5,269,745,942
Net decrease in cash and cash equivalents (2,218,338,129) (903,165,012)
Cash and cash equivalents at beginning of the year (3,232,625,687) (2,329,460,675)
Cash and cash equivalents at end of the year (5,450,963,816) (3,232,625,687)
Cash and cash equivalents comprise of the following:
- Cash and bank balances 125,630,017 170,704,896
- Running finances and morabaha finances 14.2 & 14.5 (5,576,593,833) (3,403,330,583)
(5,450,963,816) (3,232,625,687)
The annexed notes from 1 to 52 form an integral part of these consolidated financial statements.
Chief Financial Officer Chief Executive Director
Consolidated Statement of Cash FlowFor the year ended 30 September 2018

Fina
ncia
l Sta
tem
ents
Oth
er In
form
atio
nC
ompa
ny R
evie
w
Ann
ual R
epor
t 201
8
129
A
ttri
but
able
to
Ow
ners
of
the
Co
mp
any
R
eser
ves
C
apita
l R
even
ue
S
har
e S
har
e A
ccum
ulat
ed
Sub
Non
-con
trol
ling
Tota
l
cap
ital
pre
miu
m
pro
fit
Tota
l To
tal
inte
rest
s eq
uity
R
upee
s R
upee
s R
upee
s R
upee
s R
upee
s R
upee
s R
upee
s B
alan
ce a
s at
30
Sep
tem
ber
2016
– a
s pr
evio
usly
sta
ted
5
97,7
66,6
10
678
,316
,928
7
,957
,485
,567
8
,635
,802
,495
9
,233
,569
,105
4
86,4
30,1
48
9,7
19,9
99,2
53
Eff
ect o
f res
tate
men
t - n
ote
49
–
–
214
,828
,442
2
14,8
28,4
42
214
,828
,442
–
214
,828
,442
Bal
ance
as
at 3
0 S
epte
mbe
r 20
16 -
as r
esta
ted
597
,766
,610
6
78,3
16,9
28
8,1
72,3
14,0
09
8,8
50,6
30,9
37
9,4
48,3
97,5
47
486
,430
,148
9
,934
,827
,695
Tota
l com
preh
ensi
ve in
com
e fo
r th
e ye
ar
Profi
t / (l
oss)
for t
he y
ear e
nded
30
Sept
embe
r 201
7
–
–
1,83
1,71
7,79
2
1,8
31,7
17,7
92
1,8
31,7
17,7
92
(3,4
36,0
52)
1,8
28,2
81,7
40
Oth
er c
ompr
ehen
sive
(los
s) /
inco
me
for t
he y
ear e
nded
30 S
epte
mbe
r 201
7 - n
et o
f tax
–
–
(9
,682
,116
) (9
,682
,116
) (9
,682
,116
) 1
82,0
48
(9,5
00,0
68)
–
–
1,
822,
035,
676
1
,822
,035
,676
1
,822
,035
,676
(3
,254
,004
) 1
,818
,781
,672
Tran
sact
ions
with
ow
ners
of t
he P
aren
t Com
pany
Fina
l cas
h di
vide
nd fo
r the
yea
r end
ed 3
0 Se
ptem
ber 2
016
@ R
s. 1
5.00
per
sha
re –
–
(8
96,6
49,9
15)
(896
,649
,915
) (8
96,6
49,9
15)
–
(8
96,6
49,9
15)
Inte
rim c
ash
divi
dend
for t
he p
erio
d en
ded
31 M
arch
201
7 @
Rs.
10.
00 p
er s
hare
–
–
(597
,766
,610
) (5
97,7
66,6
10)
(597
,766
,610
) –
(597
,766
,610
)
–
–
(1,
494,
416,
525)
(1
,494
,416
,525
) (1
,494
,416
,525
) –
(
1,49
4,41
6,52
5)
Bal
ance
as
at 3
0 S
epte
mbe
r 20
17 –
res
tate
d
5
97,7
66,6
10
678
,316
,928
8
,499
,933
,160
9
,178
,250
,088
9
,776
,016
,698
4
83,1
76,1
44
10,
259,
192,
842
Tota
l com
preh
ensi
ve lo
ss fo
r th
e ye
ar
Loss
for t
he y
ear e
nded
30
Sept
embe
r 201
8
–
–
(7
58,0
08,8
42)
(758
,008
,842
) (7
58,0
08,8
42)
(2,1
79,4
82)
(760
,188
,324
)
Oth
er c
ompr
ehen
sive
loss
for t
he y
ear e
nded
30 S
epte
mbe
r 201
8 - n
et o
f tax
–
–
(9
,364
,198
) (9
,364
,198
) (9
,364
,198
) –
(9,3
64,1
98)
–
–
(7
67,3
73,0
40)
(767
,373
,040
) (7
67,3
73,0
40)
(2,1
79,4
82)
(769
,552
,522
)
Tran
sact
ions
with
ow
ners
of t
he P
aren
t Com
pany
Fina
l cas
h di
vide
nd fo
r the
yea
r end
ed 3
0 Se
ptem
ber 2
017
@ R
s. 3
.00
per s
hare
–
–
(179
,329
,983
) (1
79,3
29,9
83)
(179
,329
,983
) –
(179
,329
,983
)
Bal
ance
as
at 3
0 S
epte
mbe
r 20
18
597
,766
,610
6
78,3
16,9
28
7,5
53,2
30,1
37
8,2
31,5
47,0
65
8,8
29,3
13,6
75
480
,996
,662
9
,310
,310
,337
The
anne
xed
note
s fro
m 1
to 5
2 fo
rm a
n in
tegr
al p
art o
f the
se c
onso
lidat
ed fi
nanc
ial s
tate
men
ts.
Chi
ef F
inan
cial
Offi
cer
Chi
ef E
xecu
tive
Dire
ctor
Consolidated Statement of Changes In EquityFor the year ended 30 September 2018

JDW
Gro
up
130
1 STATUS AND NATURE OF BUSINESS
The Group comprises of:
- JDW Sugar Mills Limited (“the Holding Company”); - Deharki Sugar Mills (Private) Limited - “DSML” (“the Subsidiary Company”); - Faruki Pulp Mills Limited - “FPML” (“the Subsidiary Company”); - Sadiqabad Power (Private) Limited - “SPL” (“the Subsidiary Company”); and - Ghotki Power (Private) Limited - “GPL” (“the Subsidiary Company”). 1.1 JDW Sugar Mills Limited (“the Holding Company”) was incorporated in Pakistan on 31 May 1990 as a
private limited company and was subsequently converted into a public limited company on 24 August 1991. Shares of the Holding Company are listed on the Pakistan Stock Exchange Limited. The registered office of the Holding Company is situated at 17 - Abid Majeed Road, Lahore Cantonment, Lahore. The principal activity of the Holding Company is production and sale of crystalline sugar, electricity and managing corporate farms.
The Holding Company executed Energy Purchase Agreements (“EPA”) on 20 March 2014 with National Transmission & Despatch Company Limited (“NTDC”) through the Central Power Purchasing Agency (Guarantee) Limited (“CPPA-G”) for its Bagasse Based Co-Generation Power Plants (“Co-Generation Power”) at JDW Unit-II, Sadiqabad, District Rahim Yar Khan, Punjab and JDW Unit-III, District Ghotki, Sindh.
The 26.60 MW power plant at Unit-II achieved Commercial Operations Date (“COD”) on 12 June 2014
while the 26.83 MW power plant at Unit-III of the Holding Company achieved COD on 03 October 2014 after completing all independent testing and certification requirements and supplying renewable electricity to the national grid. Further, the Holding Company’s Co-Generation Power Plants are the first to materialize under National Electric Power Regulatory Authority’s (“NEPRA”) upfront bagasse tariff.
1.2 Deharki Sugar Mills (Private) Limited (“the Subsidiary Company”) was incorporated in Pakistan on 14
July 2010 as a private limited company. The registered office of the Subsidiary Company is situated at 17-Abid Majeed Road, Lahore Cantonment, Lahore. The principal activity of the Subsidiary Company is manufacturing and sale of crystalline sugar. The Holding Company holds 100% shares of the Subsidiary Company.
1.3 Faruki Pulp Mills Limited (“the Subsidiary Company”) was incorporated in Pakistan on 20 October 1991
as a public limited company. FPML will be engaged in the manufacture and sale of paper pulp. The production facility is situated 20 km from Gujrat and the registered office is situated at 13-B, Block -K, Main Boulevard Gulberg II, Lahore. The Holding Company holds 57.67% shares of the Subsidiary Company at the end of the year.
FPML had its first trial production run in the year 1997 but since then has not commenced commercial
production. Further construction was suspended due to insufficient funds. Pursuant to the injection of further capital by the new investors, restructuring with the lenders in 2007 and obtaining long term loan from consortium of banks in 2010, FPML re-commenced trial production in 2012 and had a second trial run in 2013. However, these trial runs identified significant additional capex requirements to enable commercial production: principally the need for replacement of existing turbine, installation of additional mixed fuel boiler and equipment in the washing and bleaching process, to make the production processes commercially viable. The management expects that another 24 months approximately from the statement of financial position date shall be required to make the plant commercially viable. During 2013, active construction was suspended pending the design and installation of the boiler, turbine and procurement and installation of additional equipment in washing and bleaching process.
The above mentioned conditions indicate that a material uncertainty exists that may cast significant
doubt on FPML’s ability to continue as a going concern and, therefore, FPML may be unable to realize its assets and discharge its liabilities in the normal course of business. However, financial statements of FPML are prepared on a going concern basis as the management is confident, based upon a commitment of continued financial support from FPML’s principal shareholder, M/s JDW Sugar Mills Limited (“the Holding Company”), that it will be able to commence commercial production in year ending 30 September 2021. Statutory auditors of FPML in their audit report on the financial statements of FPML for the year ended 30 September 2018 have included emphasis of matter paragraph referring this matter in their audit report.
Notes to the Consolidated Financial StatementsFor the year ended 30 September 2018

Fina
ncia
l Sta
tem
ents
Oth
er In
form
atio
nC
ompa
ny R
evie
w
Ann
ual R
epor
t 201
8
131
1.4 Sadiqabad Power (Private) Limited (“the Subsidiary Company”) was incorporated in Pakistan on 16 December 2016. The Subsidiary Company will be engaged in the production of electricity under the expansion program of the Holding Company’s existing bagasse based co-generation power plants. The registered office of the Subsidiary Company is situated at 17-Abid Majeed Road, Lahore Cantonment, Lahore. The Holding Company holds 100% shares of the Subsidiary Company.
1.5 Ghotki Power (Private) Limited (“the Subsidiary Company”) was incorporated in Pakistan on 15
December 2016. The Subsidiary Company will be engaged in the production of electricity under the expansion program of the Holding Company’s existing bagasse based co-generation power plants. The registered office of the Subsidiary Company is situated at 17-Abid Majeed Road, Lahore Cantonment, Lahore. The Holding Company holds 100% shares of the Subsidiary Company.
1.6 Details regarding the Group’s investments in associate are given in note 22 to these consolidated
financial statements.
2 SUMMARY OF SIGNIFICANT TRANSACTIONS AND EVENTS AFFECTING THE GROUP’S FINANCIAL POSITION AND PERFORMANCE
The Group’s financial position and performance was particularly affected by the following events and transactions during the reporting period:
– The Group has incurred capital expenditure of Rs. 2,820 million as part of balancing, modernization and
replacement.
– Obtained further long term finance from various financial institution amounting to Rs. 5,494 million.
– Due to the first time application of financial reporting requirements under the Companies Act, 2017, including disclosure and presentation requirements of the fourth schedule of the Companies Act, 2017, some of the amounts reported for the previous period have been reclassified.
3 BASIS OF PREPARATION
3.1 Consolidated financial statements
These consolidated financial statements have been prepared from the information available in the audited separate financial statements of the Holding Company for the year ended 30 September 2018 and the audited financial statements of the subsidiaries for the period ended 30 September 2018.
3.2 Statement of compliance
These consolidated financial statements have been prepared in accordance with the accounting and reporting standards as applicable in Pakistan. The accounting and reporting standards applicable in Pakistan comprise of:
– International Financial Reporting Standards (IFRS) issued by the International Accounting Standards
Board (IASB) as notified under the Companies Act, 2017; – Islamic Financial Accounting Standards (IFAS) issued by the Institute of Chartered Accountants of
Pakistan as notified under the Companies Act, 2017; and – Provisions of and directives issued under the Companies Act, 2017.
Where provisions of and directives issued under the Companies Act, 2017 differ from the IFRS, the
provisions of and directives issued under the Companies Act, 2017 have been followed. 3.3 Basis of measurement
These consolidated financial statements have been prepared under the historical cost convention except for the following:
– Certain financial instruments which are measured at fair value;
– Retirement benefits at present value; and
– Biological assets which are measured at fair value less costs to sell at the point of harvest.

JDW
Gro
up
132
3.4 Functional and presentation currency
These consolidated financial statements are presented in Pakistani Rupees (“Rs”) which is also the Group’s functional currency. All financial information presented in Pakistani Rupees has been rounded off to the nearest rupee, unless otherwise stated.
4 USE OF ESTIMATES AND JUDGMENTS
The preparation of consolidated financial statements in conformity with approved accounting standards requires management to make judgments, estimates and assumptions that affect the application of policies and reported amounts of assets, liabilities, income and expenses. The estimates and associated assumptions are based on historical experience and various other factors that are believed to be reasonable under circumstances, and the results of which form the basis for making judgment about carrying value of assets and liabilities that are not readily apparent from other sources. Actual results may differ from these estimates.
The estimates and underlying assumptions are reviewed on an ongoing basis. Revisions to accounting estimates
are recognized in the period in which estimates are revised if the revision affects only that period, or in the period of the revision and future periods if the revision affects both current and future periods.
The areas where assumptions and estimates are significant to the Group’s consolidated financial statements or
where judgment was exercised in application of accounting policies are as follows: 4.1 Property, plant and equipment
The Group reviews the useful lives and residual values of property, plant and equipment on a regular basis. Any change in estimates in future years might affect the carrying amounts of the respective items of property, plant and equipment with a corresponding effect on the depreciation charge and impairment.
4.2 Stores, spare parts and loose tools
The Group reviews the stores, spare parts and loose tools for possible impairment on an annual basis. Any change in estimates in future years might affect the carrying amounts of the respective items of stores, spare parts and loose tools with a corresponding effect on the provision.
4.3 Stock-in-trade
The Group reviews the carrying amount of stock-in-trade on a regular basis. Carrying amount of stock-in-trade is adjusted where the net realizable value is below the cost. Net realizable value is the estimated selling price in the ordinary course of business, less the estimated costs of completion and estimated costs necessary to make the sale.
4.4 Provision against trade debts, advances, deposits and other receivables
The Group reviews the recoverability of its trade debts, advances, deposits and other receivables to assess amount of bad debts and provision required there against on annual basis.
4.5 Provisions and contingencies
The Group reviews the status of all pending litigations and claims against the Group. Based on its judgment and the advice of the legal advisors for the estimated financial outcome, appropriate disclosure or provision is made. The actual outcome of these litigations and claims can have an effect on the carrying amounts of the liabilities recognized at the statement of financial position date.
4.6 Employee benefits
The Group operates approved funded gratuity scheme for the Holding Company and unfunded gratuity scheme for the Subsidiary Company (“FPML”) covering eligible full time permanent workers of the respective companies who have completed the minimum qualifying period of service as defined under the respective scheme. The gratuity scheme is managed by trustees. The calculation of the benefit requires assumptions to be made of future outcomes, the principal ones being in respect of increase in remuneration and the discount rate used to convert future cash flows to current values. The assumptions used for the plan are determined by independent actuary on annual basis.
4.7 Recoverable amounts of assets / cash generating units and impairment
The management of the Group reviews carrying amounts of its assets including goodwill, long term investments, receivables and advances and cash generating units for possible impairment and makes formal estimates of recoverable amount if there is any such indication. In case of goodwill formal estimates of recoverable amount is made on annual basis.
Notes to the Consolidated Financial StatementsFor the year ended 30 September 2018

Fina
ncia
l Sta
tem
ents
Oth
er In
form
atio
nC
ompa
ny R
evie
w
Ann
ual R
epor
t 201
8
133
4.8 Intangibles
The Group reviews the rate of amortization and value of intangible assets for possible impairment, on an annual basis. Any change in the estimates in future years might affect the carrying amounts of intangible assets with a corresponding effect on the amortization charge and impairment.
4.9 Taxation
The Group takes into account the current income tax law and decisions taken by the taxation authorities. Instances where the Group’s views differ from the views taken by the income tax department at the assessment stage and where the Group considers that its view on items of material nature is in accordance with law, the amounts are shown as contingent liabilities.
4.10 Measurement of fair value for biological assets
Management of the Group regularly reviews significant unobservable inputs and valuation adjustments used to arrive at fair value of biological assets. Any change in those inputs and valuation adjustment might affect valuation of biological assets and accordingly charge to the statement of profit or loss.
5 SUMMARY OF SIGNIFICANT ACCOUNTING POLICIES
The significant accounting policies have been applied consistently to all periods presented in these financial statements except as disclosed in note 5.2. 5.1 Basis of consolidation
The consolidated financial statements include the financial statements of the Holding Company and its subsidiary companies. The accounting policies set out below have been applied consistently to all periods presented in these consolidated financial statements and have been applied consistently by Group entities.
Subsidiaries
Subsidiaries are those entities in which the Holding Company directly or indirectly controls, beneficially owns or holds more than 50 percent of its voting securities or otherwise has power to elect and appoint more than 50 percent of its directors. The financial statements of subsidiaries are included in the consolidated financial statements from the date control commences. The financial statements of the subsidiaries are consolidated on a line-by-line basis and the carrying value of investment held by the Holding Company is eliminated against the Holding Company’s share in paid up capital of the subsidiaries. The Group applies uniform accounting policies for like transactions and events in similar circumstances except where specified otherwise.
Non-controlling interests
Non-controlling interests are measured at their proportionate share of the acquiree’s identifiable net assets at the date of acquisition.
Changes in the Holding Company’s interest in the subsidiaries that do not result in a loss of control are
accounted for as a equity transactions. Transactions eliminated on consolidation
Intra-group balances and transactions, and any unrealised income and expenses arising from intra-group transactions are eliminated.
Associates
Entities in which the Group has significant influence but not control and which are neither subsidiaries nor joint ventures of the members of the Group are associates and are accounted for under the equity method of accounting (equity accounted investees).
These investments are initially recognized at cost. The consolidated financial statements include the
associates’ share of profit or loss and movements in other comprehensive income, after adjustments to align the accounting policies with those of the Group from the date that significant influence commences until the date it ceases. Share of post acquisition profit and loss of associates is recognized in the consolidated statement of profit or loss. Distributions received from associates reduce the carrying amount of investment. When the Group’s share of losses exceeds its interest in an equity accounted

JDW
Gro
up
134
investee, the carrying amount of that investment (including any long-term interests that, in substance, form part of the Group’s net investment in the associates) is reduced to nil and the recognition of further losses is discontinued.
The carrying amount of investments in associate is reviewed at each statement of financial position date
to determine whether there is any indication of impairment. If any such indication exists, the recoverable amount of the investments is estimated which is higher of its value in use and its fair value less costs to sell. An impairment loss is recognized if the carrying amount exceeds its recoverable amount and is charged to statement of profit or loss. An impairment loss is reversed if there has been a change in estimates used to determine the recoverable amount but limited to the extent of initial cost of the investments. A reversal of impairment loss is recognized in the consolidated statement of profit or loss.
5.2 Property, plant and equipment
Owned
Property, plant and equipment, except freehold land are stated at cost less accumulated depreciation and any identified impairment losses. Freehold land and capital work in progress are stated at cost less any identified impairment losses. Cost comprises purchase price, including import duties and non-refundable purchase taxes, after deducting trade discounts and rebates, and includes other costs directly attributable to the acquisition or construction, erection and installation. Cost in relation to certain property, plant and equipment signifies historical cost and borrowing costs as referred to in note 5.14.
Subsequent costs are included in the asset’s carrying amount or recognized as a separate asset, as
appropriate, only when it is probable that future economic benefits associated with the item will flow to the Group and the cost of the item can be measured reliably. Major repairs and improvements are capitalized. All other repair and maintenance costs are charged to statement of profit or loss during the period in which they are incurred.
The amendments to IAS 16 Property, plant and equipment and IAS 41 Agriculture define a bearer plant
and require biological assets that meet the definition of a bearer plant to be accounted for as property, plant and equipment in accordance with IAS 16, instead of IAS 41. In terms of the amendments, bearer plants can be measured using either the cost model or the revaluation model set out in IAS 16 and not at fair value as previously measured.
The Group’s sugarcane roots qualify as bearer plants under the definition in IAS 41 Agriculture and are
therefore accounted for under the rules for property, plant and equipment. Sugarcane roots are stated at cost less accumulated depreciation and accumulated impairment losses.
Costs capitalised to sugarcane roots include preparing the land, maintaining a source of seed cane, planting the seed cane and costs related to establishing new area under cane. Depreciation of bearer plants commence when they are ready for their intended use. Costs incurred for infilling including block infilling are generally recognized in the statement of profit or loss unless there is a significant increase in the yield of the sections, in which case such costs are capitalized and depreciated over the remaining useful life of the respective fields. Depreciation on bearer plants is recognised so as to write off its cost less residual values over useful lives, using the straight-line method. The estimated useful lives, residual values and depreciation method are reviewed at the end of each reporting period, with the effect of any changes in estimate accounted for on a prospective basis. Estimated useful lives of the bearer plants has been determined to be 6 years.
Depreciation is charged to statement of profit or loss on reducing balance method so as to write off
the written down value of assets over their estimated useful lives at rates disclosed in note 19.1, except that straight-line method is used for assets related to Corporate Farms. However, sometimes, the future economic benefits embodied in an asset are absorbed in producing other assets. In this case, the depreciation charge constitutes part of the cost of the other asset and is included in its carrying amount.
Depreciation on additions is charged from the date when the asset is available for use, while no
depreciation is charged on the date of disposal. The Group assesses at each statement of financial position date whether there is any indication that
property, plant and equipment may be impaired. If such indication exists, the carrying amounts of such
Notes to the Consolidated Financial StatementsFor the year ended 30 September 2018

Fina
ncia
l Sta
tem
ents
Oth
er In
form
atio
nC
ompa
ny R
evie
w
Ann
ual R
epor
t 201
8
135
assets are reviewed to assess whether they are recorded in excess of their recoverable amount. Where carrying values exceed the respective recoverable amount, assets are written down to their recoverable amounts and the resulting impairment loss is recognized in statement of profit or loss. The recoverable amount is the higher of an asset’s fair value less costs to sell and value in use. Where an impairment loss is recognized, the depreciation charge is adjusted in the future periods to allocate the asset’s revised carrying amount over its estimated useful life.
The gain or loss on disposal or retirement of an asset represented by the difference between the sale
proceeds and the carrying amount of the asset is recognized as an income or expense. Leased
Assets held under finance lease arrangements are initially recorded at the lower of present value of minimum lease payments under the lease agreements and the fair value of the leased assets. Depreciation on leased assets is charged by applying reducing balance method at the rates used for similar owned assets, so as to depreciate the assets over their estimated useful lives in view of certainty of ownership of assets at end of the lease term.
5.3 Intangibles
Goodwill
Goodwill arising on the acquisition of the subsidiaries is measured at cost less accumulated impairment losses.
Computer software
Expenditure incurred to acquire computer software is capitalized as an intangible asset and stated at cost less accumulated amortization (for finite useful life of intangible asset) and any identified impairment loss. The estimated useful life and amortization method is reviewed at the end of each annual reporting period, with effect of any changes in estimate being accounted for on a prospective basis.
Intangible assets with finite useful life are amortized using straight-line method over its useful period.
Amortization on additions to intangible assets is charged from the date when an asset is put to use and on disposal up to the date of disposal.
Subsequent expenditure is capitalized only when it increases the future economic benefits embodied in
the specific assets to which it relates. 5.4 Stores, spare parts and loose tools
These are stated at lower of cost and net realizable value. Cost is determined using the weighted average method. Items in transit are valued at cost comprising invoice value plus other charges paid thereon.
The Group reviews the stores and spare parts for possible impairment on an annual basis. Any change
in estimates in future years might affect the carrying amounts of respective items of stores and spare parts with a corresponding effect on provision.
5.5 Stock-in-trade
These are valued at the lower of weighted average cost and net realizable value except for stock in transit, which is valued at cost comprising invoice value and related expenses incurred thereon up to the statement of financial position date.
Cost is determined as follows:
Raw materials Average cost
Work-in-process and finished goods Average manufacturing cost
Molasses and bagasse - by products Net realizable value
Net realizable value signifies the estimated selling price in the ordinary course of business less cost of completion and other costs necessary to be incurred to make the sale.
The cost of harvested crops transferred from biological assets to stock-in-trade is its fair value less cost to sell at the date of harvest.

JDW
Gro
up
136
5.6 Biological assets
Consumable biological assets, comprising standing sugarcane, wheat and guar, are measured at their fair value determined by discounting future cash flows from operations over the estimated useful life of the biological assets using Holding Company’s weighted average cost of capital. Significant assumptions used are stated in note 25.1 to these consolidated financial statements. Fair value is deemed to approximate the cost when little biological transformation has taken place or the impact of the transformation on price is not expected to be material.
The sugarcane roots are bearer plants and are therefore presented and accounted for as property, plant and equipment. However, the standing cane, wheat and guar are accounted for as biological assets until the point of harvest. Sugarcane, wheat and guar are transferred to inventory at fair value less costs to sell when harvested. Changes in fair value of sugarcane, wheat and guar are recognized in the statement of profit or loss.
5.7 Employee benefits
Defined contribution plan
The Group operates approved contributory provident fund for its eligible employees. Equal monthly contribution is made both by the Group and employee to the fund at the rate of 10% of basic salary.
Defined benefit plans
The Holding Company and FPML operates an approved defined benefit gratuity plan and unfunded staff gratuity scheme, respectively, covering all of its eligible employees who have completed the minimum qualifying period. The calculation of defined benefit obligation is performed by qualified actuary by using the projected unit credit method and charge for the year other than on account of experience adjustment is included in statement of profit or loss.
Remeasurement of the net defined benefit liability, which comprise actuarial gains and losses, the
return on plan assets (excluding interest) and the effect of asset ceiling (if any, excluding interest), are recognized immediately in Other Comprehensive Income. The Group determines the net interest expense / (income) on the net defined liability / (asset) for the period by applying the discount rate used to measure the defined benefit obligation at the beginning of the annual period to the then - net defined benefit liability / (asset) during the period as a result of contributions and benefit payments. Net interest expense and other expenses related to defined benefit plans are recognized in statement of profit or loss.
5.8 Taxation
Income tax expense comprises current and deferred tax. Current
Provision of current tax is based on the taxable income for the year determined in accordance with the prevailing law for taxation of income. The charge for current tax is calculated using enacted or substantially enacted at the reporting date and after taking into account tax credits, rebates and exemptions, if any. The charge for current tax also includes adjustments, where considered necessary, to provision for tax made in previous years arising from assessments framed during the year for such years.
Deferred
Deferred tax is recognised in respect of temporary differences between the carrying amounts of assets and liabilities for financial reporting purposes and the amounts used for taxation purposes.
Deferred tax is not recognised for:
– temporary differences on the initial recognition of assets or liabilities in a transaction that is not a business combination and that affects neither accounting nor taxable profit or loss;
– temporary differences related to investments in subsidiaries, associates and joint arrangements to the extent that the Group is able to control the timing of the reversal of the temporary differences and it is probable that they will not reverse in the foreseeable future; and
– taxable temporary differences arising on the initial recognition of goodwill.
Notes to the Consolidated Financial StatementsFor the year ended 30 September 2018

Fina
ncia
l Sta
tem
ents
Oth
er In
form
atio
nC
ompa
ny R
evie
w
Ann
ual R
epor
t 201
8
137
Deferred tax assets are recognised for unused tax losses, unused tax credits and deductible temporary differences to the extent that it is probable that future taxable profits will be available against which they can be used. Future taxable profits are determined based on the reversal of relevant taxable temporary differences. If the amount of taxable temporary differences is insufficient to recognise a deferred tax asset in full, then future taxable profits, adjusted for reversals of existing temporary differences, are considered. Deferred tax assets are reviewed at each reporting date and are reduced to the extent that it is no longer probable that the related tax benefit will be realized; such reductions are reversed when the probability of future taxable profits improves.
Unrecognised deferred tax assets are reassessed at each reporting date and recognised to the extent
that it has become probable that future taxable profits will be available against which they can be used.
Deferred tax is measured at the tax rates that are expected to be applied to temporary differences when they reverse, using tax rates enacted or substantively enacted at the reporting date.
The measurement of deferred tax reflects the tax consequences that would follow from the manner in
which the Group expects, at the reporting date, to recover or settle the carrying amount of its assets and liabilities. For this purpose, the carrying amount of investment property measured at fair value is presumed to be recovered through sale, and the Group has not rebutted this presumption.
5.9 Revenue recognition
Revenue from sale of goods is measured at fair value of the consideration received or receivable, net of discounts and applicable taxes. Revenue is recognized when the significant risks and rewards of ownership have been transferred to the customer, recovery of the consideration is probable, the associated costs and possible return of goods can be estimated reliably, there is no continuing involvement of management with the goods and the amount of revenue can be measured reliably.
– Revenue from sale of goods is recorded when significant risks and rewards of ownership are
transferred to the customer; sale of goods comprise the sale of sugar, agriculture produce and agri inputs;
– Revenue from the sale of electricity is recognized on transmission of electricity;
– Rental income are recognized on accrual basis and is disclosed under other income in the consolidated statement of profit or loss;
– Dividend income is recognized when the Group’s right to receive the dividend is established and included in operating profit in the statement of profit or loss as part of other income;
– Interest income is recognized as and when accrued on effective interest method. Interest income is disclosed under other income in the consolidated statement of profit or loss.
– Government incentive relating to export sales are recognized when the right to receive such incentives has been established and the underlying conditions are met.
NEPRA in its review decision in the matter of Quarterly Indexations of Tariff for all Bagasse Based Co-
Generation Power Plants including the Holding Company, identified that it has made an inadvertent calculation error in the debt servicing component approved in a number of quarterly indexation decisions of the Holding Company and decided to rectify the same under Section 7 of Regulation of Generation, Transmission and Distribution of Electric Power Act, 1997 read with Regulation 3 of National Electric Power Regulatory Authority (Review Procedure) Regulations, 2009. Accordingly, the debt servicing components were revised and deemed replaced retrospectively.
5.10 Provisions
Provisions are recognized when the Group has a present legal or constructive obligation as a result of past event and it is probable that an outflow of economic benefits will be required to settle the obligation and a reliable estimate can be made. Provisions are reviewed at each statement of financial position date and adjusted to reflect the current best estimate.
5.11 Leases
Leases are classified as finance lease whenever terms of the lease transfer substantially all risks and rewards of ownership to the lessee. All other leases are classified as operating leases.

JDW
Gro
up
138
Finance leases
Finance leases are stated at amounts equal to the fair value or, if lower, the present value of the minimum lease payments. The minimum lease payments are apportioned between the finance charge and the reduction of the outstanding liability. The finance cost is charged to statement of profit or loss.
The related rental obligations, net of finance costs, are included in liabilities against assets subject to
finance lease. The liabilities are classified as current and non-current depending upon the timing of the payment.
Operating lease / Ijarah contracts
Leases where a significant portion of the risks and rewards of ownership are retained by the lessor, are classified as operating leases. Payments made under operating leases (net of any incentives received from the lessor) are charged to profit on a straight-line basis over the lease / ijarah term unless another systematic basis is representative of the time pattern of the Group’s benefit.
5.12 Financial instruments
Financial instruments recognised on the statement of financial position include investments, long-term loans and receivables, derivative instruments, trade and other receivables, cash and cash equivalents, trade and other payables and interest-bearing debt.
The Group classifies its financial assets at fair value through profit or loss and loans and receivables.
The classification depends on the purpose for which the financial assets were acquired. Management determines the classification of its financial assets at initial recognition. The Group classifies its financial liabilities apart from derivatives as other financial liabilities. Derivative financial liabilities are classified as financial liabilities at fair value through profit or loss.
Financial assets at fair value through profit or loss
Financial assets at fair value through profit or loss comprise derivative instruments. A financial asset is classified in this category if acquired principally for the purpose of selling in the short-term. Assets in this category are classified as current assets. Gains or losses arising from changes in the fair value of the financial assets at fair value through profit or loss are recognised in the statement of profit or loss in the period in which they arise.
Financial assets carried at fair value through profit or loss are initially recognised at fair value and
transaction costs are expensed in the statement of profit or loss. Financial liabilities at fair value through profit or loss
Financial liabilities at fair value through profit or loss comprise derivative instruments. Gains or losses arising from changes in the fair value of the derivatives at fair value through profit or loss are recognised in the statement of profit or loss in the period in which they arise.
Financial liabilities carried at fair value through profit or loss are initially recognised at fair value and
transaction costs are expensed in the statement of profit or loss. Other financial liabilities
Other financial liabilities consist of trade and other payables and interest-bearing borrowings. These represent financial liabilities which are not classified as financial liabilities at fair value through profit or loss. They are included in current liabilities, except for maturities greater than 12 months after the end of the reporting period. These are classified as non-current liabilities.
Derecognition
Financial assets (or a portion thereof) are derecognised when the rights to receive cash flows from the asset have expired or have been transferred and the Group has substantially transferred all risks and rewards of ownership. On derecognition, the difference between the carrying amount of the financial asset and the proceeds receivable is included in the statement of profit or loss.
Financial liabilities (or a portion thereof) are derecognised when the obligation specified in the contract is discharged, cancelled or expires. On derecognition, the difference between the carrying amount of the financial liability, and any amount paid is included in the statement of profit or loss.
Notes to the Consolidated Financial StatementsFor the year ended 30 September 2018

Fina
ncia
l Sta
tem
ents
Oth
er In
form
atio
nC
ompa
ny R
evie
w
Ann
ual R
epor
t 201
8
139
Recognition and measurement
Investments are initially recognised at fair value plus transaction costs for all financial assets not carried at fair value through profit or loss. Financial assets and liabilities at fair value through profit or loss are subsequently carried at fair value. Loans and receivables and other financial liabilities are carried at amortised cost using the effective interest rate method.
Gains or losses arising from changes in the fair value of the financial assets at fair value through profit or
loss category are presented in the statement of profit or loss in the period in which they arise. Dividend income from these assets is recognised in the statement of profit or loss when the Group’s right to receive payment is established.
Impairment of financial assets
Assets carried at amortised cost
The Group assesses at the end of each reporting date whether there is objective evidence that a financial asset or group of financial assets is impaired. A financial asset or a group of financial assets is impaired and impairment losses are incurred only if there is objective evidence of impairment as a result of one or more events that occurred after the initial recognition of the asset (a loss event) and that loss event (or events) has an impact on the estimated future cash flows of the financial asset or group of financial assets that can be reliably estimated.
Evidence of impairment may include indications that the debtors or a group of debtors is experiencing
significant financial difficulty, default or delinquency in interest or principal payments, the probability that they will enter bankruptcy or other financial reorganisation, and where observable data indicate that there is a measurable decrease in the estimated future cash flows, such as changes in arrears or economic conditions that correlate with defaults.
For loans and receivables category, the amount of the loss is measured as the difference between the
asset’s carrying amount and the present value of estimated future cash flows (excluding future credit losses that have not been incurred), discounted at the financial asset’s original effective interest rate. The carrying amount of the asset is reduced and the amount of the loss is recognised in the statement of profit or loss. If a loan or held-to-maturity investment has a variable interest rate, the discount rate for measuring any impairment loss is the current effective interest rate determined under the contract.
If, in a subsequent period, the amount of the impairment loss decreases and the decrease can be
related objectively to an event occurring after the impairment was recognised (such as an improvement in the debtor’s credit rating), the reversal of the previously recognised impairment loss is recognised in the statement of profit or loss.
Loans and receivables
Loans and receivables are non-derivative financial assets with fixed or determinable payments that are not quoted in an active market.
Trade debts
Trade debts are stated initially at the fair value. Subsequent to initial recognition, these are stated at their amortized cost as reduced by appropriate provision for impairment, known impaired receivables are written off, while receivables considered doubtful are fully provided for.
Cash and cash equivalents
For the purpose of statement of cash flow, cash and cash equivalents comprise cash in hand, bank balances, running finances and morabaha finances which are stated in the statement of financial position at cost.
Mark-up bearing borrowings
Mark-up bearing borrowings are recognized initially at cost representing the fair value of consideration received less attributable transaction costs. Subsequent to initial recognition, mark-up bearing borrowings are stated at original cost less subsequent repayments, while the difference between the original recognized amounts (as reduced by periodic payments) and redemption value is recognized in the statement of profit or loss over the period of borrowings on an effective rate basis. The borrowing cost on qualifying asset is included in the cost of related asset.

JDW
Gro
up
140
Offsetting of financial assets and financial liabilities
Financial assets and financial liabilities are off set and the net amount is reported in the consolidated financial statements, when the Group has a legally enforceable right to off set the recognized amounts and the Group intends either to settle on net basis, or to realize the assets and to settle the liabilities simultaneously.
5.13 Business combination
Business combinations are accounted for by applying the acquisition method. The cost of acquisition is measured as the fair value of assets given, equity instruments issued and the liabilities incurred or assumed at the date of acquisition. The consideration transferred includes the fair value of any asset or liability resulting from a contingent consideration arrangement, if any. Acquisition-related costs are expensed as incurred. Identifiable assets acquired and liabilities and contingent liabilities assumed in a business combination are measured initially at their fair values at the acquisition date. The excess of the consideration transferred over the fair value of the identifiable net assets acquired is recorded as goodwill. If this is less than the fair value of the net assets acquired in the case of a bargain purchase, the difference is recognized directly in the statement of profit or loss.
5.14 Borrowing cost
Borrowing costs directly attributable to the acquisition, construction or production of qualifying assets, which are assets that necessarily take a substantial period of time to get ready for their intended use, are added to the cost of those assets, until such time as the assets are substantially ready for their intended use. All other borrowing costs are recognized in statement of profit or loss as incurred.
5.15 Foreign currency transactions
Transactions in foreign currencies are translated to the respective functional currencies of the Group at exchange rates at the dates of the transactions. Monetary assets and liabilities denominated in foreign currencies at the reporting date are retranslated to the functional currency at the exchange rate at the reporting date. The foreign currency gain or loss on monetary items is the difference between amortized cost in the functional currency at the beginning of the year, adjusted for effective interest and payments during the year, and the amortized cost in foreign currency translated at the exchange rate at the end of the year.
Non-monetary assets and liabilities that are measured at fair value in a foreign currency are retranslated
to the functional currency at the exchange rate at the date that the fair value was determined. Non-monetary items that are measured based on historical cost in a foreign currency are not translated again at the reporting date.
Foreign currency differences arising on retranslation are generally recognized in statement of profit or
loss. 5.16 Investment property
Investment property is property held either to earn rental income or for capital appreciation or for both, but not for sale in ordinary course of business, use in production or supply of goods or services as for administrative purpose.
The Group’s investment property comprises of land which is carried at cost less identified impairment
loss, if any. The Group assesses at each statement of financial position date whether there is any indication that investment property may be impaired. If such indication exists, the carrying amount of such assets are reviewed to assess whether they are recorded in excess of their recoverable amount. Where carrying value exceeds the respective recoverable amount, assets are written down to their recoverable amounts and the resulting impairment loss is recognized in the statement of profit or loss for the year. The recoverable amount is the higher of an asset’s fair value less costs to sell and value-in-use.
The gain or loss on disposal or retirement of an asset represented by the difference between the sale proceeds and the carrying amounts of the asset is recognized as an income or expense.
Notes to the Consolidated Financial StatementsFor the year ended 30 September 2018

Fina
ncia
l Sta
tem
ents
Oth
er In
form
atio
nC
ompa
ny R
evie
w
Ann
ual R
epor
t 201
8
141
5.17 Dividend
Dividend to ordinary shareholders is recognized as a deduction from accumulated profit in statement of changes in equity and as a liability in the Group’s financial statements in the year in which it is declared by the Group’s shareholders.
5.18 Operating segment
Segment reporting is based on the operating (business) segments of the Group. An operating segment is a component of the Group that engages in business activities from which it may earn revenues and incur expenses, including revenues and expenses that relate to transactions with any of the Group’s other components. An operating segment’s operating results are reviewed regularly by the chief operating decision maker to make decisions about resources to be allocated to the segment and assess its performance, and for which discrete financial information is available. Segment results that are reported to the chief operating decision maker include items directly attributable to a segment as well as those that can be allocated on a reasonable basis.
The business segments are engaged in providing products or services which are subject to risks
and rewards which differ from the risk and rewards of other segments. Segments reported are Sugar segment, Co-Generation segment, Corporate farms segment and Other segment.
6 STANDARDS, AMENDMENTS AND INTERPRETATIONS AND FORTH COMING REQUIREMENTS
6.1 Standards, amendments and interpretations to existing standards that are not yet effective but applicable / relevant to the Group’s operations.
6.1.1 IFRIC 4, ‘Determining Whether an Arrangement Contains a Lease’ is applicable for annual periods beginning on or after January 1, 2006, however, Securities and Exchange Commission of Pakistan (SECP) granted waiver from the application of IFRIC 4 to all companies including power sector companies. This interpretation provides guidance on determining whether arrangements that do not take the legal form of a lease should, nonetheless, be accounted for as a lease in accordance with IAS 17, ‘Leases’.
Consequently, the Group is not required to account for a portion of its Energy Purchase Agreement
(EPA) as a lease under IAS 17. If the Group were to follow IFRIC 4 and IAS 17, the effect on the financial statements would be as follows:
2018 2017 Rupees Rupees
De-recognition of property, plant and equipment (4,897,686,962) (5,188,050,413) Recognition of lease debtor 6,516,865,697 6,792,460,189 Increase in deferred tax liability 469,561,833 481,322,933 Increase in un-appropriated profit at beginning of the year 513,825,774 276,877,594 (Decrease) / increase in profit for the year (21,397,049) 236,948,180 Increase in un-appropriated profit at end of the year 492,428,725 513,825,774 6.2 New Companies Act, 2017 and new and revised approved accounting standards, interpretations
and amendments thereto
With effect from 1 January 2018, Companies Act, 2017 has become applicable. The new Act specified certain additional disclosures to be included in these consolidated financial statements. Accordingly, the Group has presented the required disclosures in these consolidated financial statements and represented certain comparatives. However there was no change in the reported amounts of consolidated statement of profit or loss and other comprehensive income or the amounts presented in the consolidated statement of financial position due to these re-presentations. Further, significant reclassifications / representations include unclaimed dividend and dividend payable which were previously classified under trade and other payables have now been presented separately in the consolidated statement of financial position.

JDW
Gro
up
142
The following standards, amendments and interpretations of approved accounting standards will be effective for accounting periods beginning on or after 01 October 2018:
– Classification and Measurement of Share-based Payment Transactions - amendments to IFRS 2
clarify the accounting for certain types of arrangements and are effective for annual periods beginning on or after 1 January 2018. The amendments cover three accounting areas (a) measurement of cash-settled share-based payments; (b) classification of share-based payments settled net of tax withholdings; and (c) accounting for a modification of a share-based payment from cash-settled to equity-settled. The new requirements could affect the classification and / or measurement of these arrangements and potentially the timing and amount of expense recognized for new and outstanding awards. The amendments are not likely to have an impact on Group’s financial statements.
– Transfers of Investment Property (Amendments to IAS 40 ‘Investment Property’ - effective for annual
periods beginning on or after 1 January 2018) clarifies that an entity shall transfer a property to, or from, investment property when, and only when there is a change in use. A change in use occurs when the property meets, or ceases to meet, the definition of investment property and there is evidence of the change in use. In isolation, a change in management’s intentions for the use of a property does not provide evidence of a change in use. The amendments are not likely to have an impact on Group’s financial statements.
Annual improvements to IFRS 2014-2016 cycle. The new cycle of improvements addresses
improvements to following approved accounting standards: – Amendments to IAS 28 ‘Investments in Associates and Joint Ventures’ (effective for annual periods
beginning on or after 1 January 2018) clarifies that a venture capital organization and other similar entities may elect to measure investments in associates and joint ventures at fair value through profit or loss, for each associate or joint venture separately at the time of initial recognition of investment. Furthermore, similar election is available to non-investment entity that has an interest in an associate or joint venture that is an investment entity, when applying the equity method, to retain the fair value measurement applied by that investment entity associate or joint venture to the investment entity associate’s or joint venture’s interests in subsidiaries. This election is made separately for each investment entity associate or joint venture. The amendments are not likely to have an impact on Group’s financial statements.
– IFRIC 22 ‘Foreign Currency Transactions and Advance Consideration’ (effective for annual periods
beginning on or after 1 January 2018) clarifies which date should be used for translation when a foreign currency transaction involves payment or receipt in advance of the item it relates to. The related item is translated using the exchange rate on the date the advance foreign currency is received or paid and the prepayment or deferred income is recognized. The date of the transaction for the purpose of determining the exchange rate to use on initial recognition of the related asset, expense or income (or part of it) would remain the date on which receipt of payment from advance consideration was recognized. If there are multiple payments or receipts in advance, the entity shall determine a date of the transaction for each payment or receipt of advance consideration. The application of interpretation is not likely to have an impact on Group’s financial statements.
– IFRIC 23 ‘Uncertainty over Income Tax Treatments’ (effective for annual periods beginning on or after
1 January 2019) clarifies the accounting for income tax when there is uncertainty over income tax treatments under IAS 12. The interpretation requires the uncertainty over tax treatment be reflected in the measurement of current and deferred tax. The application of interpretation is not likely to have an impact on Group’s financial statements.
– IFRS 15 ‘Revenue from contracts with customers’ (effective for annual periods beginning on or after
01 July 2018). IFRS 15 establishes a comprehensive framework for determining whether, how much and when revenue is recognized. It replaces existing revenue recognition guidance, including IAS 18 ‘Revenue’, IAS 11 ‘Construction Contracts’ and IFRIC 13 ‘Customer Loyalty Programmes’. The Group is currently in the process of analyzing the potential impact of changes required in revenue recognition policies on adoption of the standard.
Notes to the Consolidated Financial StatementsFor the year ended 30 September 2018

Fina
ncia
l Sta
tem
ents
Oth
er In
form
atio
nC
ompa
ny R
evie
w
Ann
ual R
epor
t 201
8
143
– IFRS 9 ‘Financial Instruments’ and amendment – Prepayment Features with Negative Compensation (effective for annual periods beginning on or after 01 July 2018 and 01 January 2019 respectively). IFRS 9 replaces the existing guidance in IAS 39 Financial Instruments: Recognition and Measurement. IFRS 9 includes revised guidance on the classification and measurement of financial instruments, a new expected credit loss model for calculating impairment on financial assets, and new general hedge accounting requirements. It also carries forward the guidance on recognition and derecognition of financial instruments from IAS 39.
– IFRS 16 ‘Leases’ (effective for annual period beginning on or after 01 January 2019). IFRS 16 replaces
existing leasing guidance, including IAS 17 ‘Leases’, IFRIC 4 ‘Determining whether an Arrangement contains a Lease’, SIC-15 ‘Operating Leases- Incentives’ and SIC-27 ‘Evaluating the Substance of Transactions Involving the Legal Form of a Lease’. IFRS 16 introduces a single, on-statement of financial position lease accounting model for lessees. A lessee recognizes a right-of-use asset representing its right to use the underlying asset and a lease liability representing its obligation to make lease payments. There are recognition exemptions for short-term leases and leases of low value items. Lessor accounting remains similar to the current standard i.e. lessors continue to classify leases as finance or operating leases. The Group is currently in the process of analyzing the potential impact of its lease arrangements that will result in recognition of right to use assets and liabilities on adoption of the standard.
– Amendment to IAS 28 ‘Investments in Associates and Joint Ventures’ - Long Term Interests in
Associates and Joint Ventures (effective for annual period beginning on or after 01 January 2019). The amendment will affect Group that finance such entities with preference shares or with loans for which repayment is not expected in the foreseeable future (referred to as long-term interests or ‘LTI’). The amendment and accompanying example state that LTI are in the scope of both IFRS 9 and IAS 28 and explain the annual sequence in which both standards are to be applied. The amendments are not likely to have an impact on Group’s financial statements.
– Amendments to IAS 19 ‘Employee Benefits’- Plan Amendment, Curtailment or Settlement (effective for
annual periods beginning on or after 01 January 2019). The amendments clarify that on amendment, curtailment or settlement of a defined benefit plan, a Group now uses updated actuarial assumptions to determine its current service cost and net interest for the period; and the effect of the asset ceiling is disregarded when calculating the gain or loss on any settlement of the plan and is dealt with separately in statement of other comprehensive income. The application of amendments is not likely to have an impact on Group’s financial statements.
Annual Improvements to IFRS 2015–2017 Cycle - the improvements address amendments to
following approved accounting standards: – IFRS 3 Business Combinations and IFRS 11 Joint Arrangement - the amendment aims to clarify the
accounting treatment when a Group increases its interest in a joint operation that meets the definition of a business. A Group remeasures its previously held interest in a joint operation when it obtains control of the business. A Group does not remeasure its previously held interest in a joint operation when it obtains joint control of the business.
– IAS 12 Income Taxes - the amendment clarifies that all income tax consequences of dividends
(including payments on financial instruments classified as equity) are recognized consistently with the transaction that generates the distributable profits.
– IAS 23 Borrowing Costs - the amendment clarifies that a Group treats as part of general borrowings
any borrowing originally made to develop an asset when the asset is ready for its intended use or sale
The above amendments are not likely to have an impact on Group’s financial statements.

JDW
Gro
up
144
2018 2017 Rupees Rupees
7 SHARE CAPITAL
7.1 Authorized share capital 75,000,000 (2017: 75,000,000) voting ordinary shares of Rs. 10 each 750,000,000 750,000,000 25,000,000 (2017: 25,000,000) preference shares of Rs. 10 each 250,000,000 250,000,000 1,000,000,000 1,000,000,000
7.2 Issued, subscribed and paid up share capital 32,145,725 (2017: 32,145,725) voting ordinary shares of Rs. 10 each fully paid in cash 321,457,250 321,457,250 27,630,936 (2017: 27,630,936) voting bonus shares of Rs. 10 each fully paid 276,309,360 276,309,360 597,766,610 597,766,610 Mr. Jahangir Khan Tareen (Executive Director) holds 12,802,293 (2017: 13,042,293) and Mukhdoom
Syed Ahmed Mahmud (Non-Executive Director) holds 15,843,932 (2017: 15,603,932) ordinary shares of Rs. 10 each representing 21.42% (2017: 21.82%) and 26.51% (2017: 26.10%) of the paid up capital of the Holding Company respectively.
8 SHARE PREMIUM RESERVE
This reserve can be utilized by the Group only for the purposes specified in section 81 (2) and 81 (3) of the Companies Act, 2017.
Note 2018 2017 Rupees Rupees
9 REDEEMABLE CAPITAL - SECURED
Privately Placed Term Finance Certificates - II 9.1 – 83,333,333 Current portion of non-current liabilities 15 – (83,333,333) – – 9.1 Privately Placed Term Finance Certificates - II
During the period, the Holding Company has fully repaid to TFC holders an amount of Rs. 83.33 million (2017: Rs. 111.11 million). These carried mark-up at three months KIBOR plus 100 bps per annum (2017: three months KIBOR plus 100 bps per annum).
Note 2018 2017 Rupees Rupees
10 LONG TERM FINANCES - SECURED
Markup-up bearing finances from conventional bank 10.1.1 9,950,302,716 11,036,355,145 Islamic mode of financing 10.1.2 5,706,160,271 2,495,929,882 10.1 & 10.2 15,656,462,987 13,532,285,027
Current maturity presented under current liabilities: - Mark-up bearing finances from conventional bank (3,394,290,948) (3,044,971,353)- Islamic mode of financing (1,215,227,568) (325,000,000) 15 (4,609,518,516) (3,369,971,353) 11,046,944,471 10,162,313,674
Notes to the Consolidated Financial StatementsFor the year ended 30 September 2018

Fina
ncia
l Sta
tem
ents
Oth
er In
form
atio
nC
ompa
ny R
evie
w
Ann
ual R
epor
t 201
8
145
10.1 Long term finances - secured
Mark-up Loan Grace
Year Principal Principal
basis
Limit duration period
of loan outstanding outstanding
maturity 2018 2017
Rupees Years Years Rupees Rupees
10.1.1 Mark-up bearing finances from conventional bank MCB Bank Limited - Led Syndicate MCB Bank Limited 3mk + 1.00 1,000,000,000 7 Years 1.5 Years 2020 363,636,363 545,454,545 United Bank Limited 3mk + 1.00 500,000,000 7 Years 1.5 Years 2020 181,818,179 272,727,273 Allied Bank Limited 3mk + 1.00 940,000,000 7 Years 1.5 Years 2020 341,818,180 512,727,272 Askari Bank Limited 3mk + 1.00 500,000,000 7 Years 1.5 Years 2020 181,818,179 272,727,271 Habib Metropolitan Bank 3mk + 1.00 100,000,000 7 Years 1.5 Years 2020 36,363,637 54,545,455 The Bank of Punjab 3mk + 1.00 800,000,000 7 Years 1.5 Years 2020 290,909,090 436,363,636 JS Bank Limited 3mk + 1.00 150,000,000 7 Years 1.5 Years 2020 54,545,459 81,818,185 Meezan Bank Limited 3mk + 1.00 350,000,000 7 Years 1.5 Years 2020 127,156,290 190,734,434 4,340,000,000 1,578,065,377 2,367,098,071 United Bank Limited - Led Syndicate United Bank Limited 3mk + 1.00 1,020,000,000 7 Years 1.5 Years 2018 – 40,772,080 Faysal Bank Limited 3mk + 1.00 700,000,000 7 Years 1.5 Years 2018 – 28,000,000 The Bank of Punjab 3mk + 1.00 340,000,000 7 Years 1.5 Years 2018 – 13,600,000 Soneri Bank Limited 3mk + 1.00 140,000,000 7 Years 1.5 Years 2018 – 5,600,000 Meezan Bank Limited 3mk + 1.00 250,000,000 7 Years 1.5 Years 2018 – 10,000,000 2,450,000,000 – 97,972,080
Pak Oman Investment Company Limited (I) 3mk + 1.00 500,000,000 06 Years 01 Year 2020 175,000,000 275,000,000 Pak Oman Investment Company Limited (II) 3mk + 1.00 500,000,000 06 Years 01 Year 2022 375,000,000 475,000,000 The Bank of Punjab (I) 3mk + 1.00 300,000,000 06 Years 01 Year 2020 119,985,680 179,985,680 The Bank of Punjab (II) 3mk + 1.00 700,000,000 06 Years 01 Year 2020 280,000,000 420,000,000 The Bank of Punjab (III) 3mk + 1.00 500,000,000 05 Years 01 Year 2021 375,000,000 500,000,000 The Bank of Punjab (IV) 3mk + 1.00 750,000,000 05 Years 01 Year 2023 749,885,094 – The Bank of Punjab (V) 3mk + 1.00 500,000,000 05 Years – 2021 300,000,000 400,000,000 MCB Bank Limited (NIB) 3mk + 1.00 500,000,000 05 Years – 2020 155,074,890 258,458,150 Pak Libya Holding Company Limited 3mk + 1.00 100,000,000 05 Years – 2020 45,000,000 65,000,000 National Bank of Pakistan Limited (I) 3mk + 1.00 1,000,000,000 05 Years 01 Year 2020 562,500,000 812,500,000 National Bank of Pakistan Limited (II) 3mk + 0.50 1,000,000,000 05 Years 01 Year 2022 1,000,000,000 965,966,161 Soneri Bank Limited (I) 3mk + 1.00 300,000,000 05 Years – 2021 180,000,000 240,000,000 Soneri Bank Limited (II) 3mk + 1.00 500,000,000 05 Years 01 Year 2022 500,000,000 500,000,000 Faysal Bank Limited (I) 6mk + 1.00 500,000,000 05 Years – 2018 – 125,000,000 Faysal Bank Limited (II) 3mk + 1.00 650,000,000 06 Years – 2020 189,583,339 297,916,671 Faysal Bank Limited (III) 3mk + 1.00 500,000,000 05 Years – 2018 – 166,666,664 Faysal Bank Limited (IV) 3mk + 1.00 1,000,000,000 03 Years – 2019 333,333,336 666,666,668 Pak Brunei Investment Company Limited (I) 3mk + 1.00 200,000,000 6.5 Years 1.5 Years 2017 – 3,750,000 Pak Brunei Investment Company Limited (II) 3mk + 1.00 500,000,000 06 Years 01 Year 2024 500,000,000 – Pak Brunei Investment Company (III) 3mk + 1.00 200,000,000 05 Years – 2020 70,000,000 110,000,000 Standard Chartered Bank (Pakistan) Limited 3mk + 1.00 1,000,000,000 05 Years – 2021 550,000,000 750,000,000 Askari Bank Limited (I) 3mk + 1.00 300,000,000 05 Years – 2021 165,000,000 225,000,000 Askari Bank Limited (II) 3mk + 1.00 500,000,000 05 Years 01 Year 2022 500,000,000 – Askari Bank Limited (III) 3mk + 1.00 175,000,000 05 Years 01 Year 2023 175,000,000 – MCB Bank Limited 3mk + 1.00 1,000,000,000 05 Years 02 Years 2021 634,375,000 634,375,000 Habib Bank Limited 6mk + 1.00 500,000,000 05 Years 01 Year 2021 437,500,000 500,000,000 14,175,000,000 8,372,237,339 8,571,284,994 20,965,000,000 9,950,302,716 11,036,355,145 10.1.2 Islamic mode of financing Dubai Islamic Bank Pakistan Limited (I) 3mk + 1.00 500,000,000 5.5 Years 0.5 Year 2020 134,000,000 234,000,000 Dubai Islamic Bank Pakistan Limited (II) 3mk + 1.00 500,000,000 05 Years 01 Year 2021 343,750,000 468,750,000 Askari Bank Limited (Islamic) (I) 6mk + 1.00 300,000,000 06 Years 01 Year 2020 120,000,000 180,000,000 Askari Bank Limited (Islamic) (II) 3mk + 1.00 200,000,000 05 Years – 2021 110,000,000 150,000,000 Askari Bank Limited (Islamic) (III) 3mk + 1.00 250,000,000 05 Years 01 Year 2023 250,000,000 – Faysal Bank Limited (Islamic) (I) 3mk + 1.00 750,000,000 05 Years 01 Year 2023 750,000,000 –

JDW
Gro
up
146
Mark-up Loan Grace
Year Principal Principal
basis
Limit duration period
of loan outstanding outstanding
maturity 2018 2017
Rupees Years Years Rupees Rupees
Faysal Bank Limited (Islamic) (II) 3mk + 1.00 500,000,000 05 Years 01 Year 2022 500,000,000 – Bank Alfalah Limited (Islamic) 3mk + 0.90 500,000,000 05 Years 01 Year 2022 498,410,271 463,179,882 National Bank of Pakistan (Islamic) 3mk + 0.50 1,000,000,000 05 Years 01 Year 2022 1,000,000,000 1,000,000,000 MCB Islamic Bank Limited 3mk + 0.85 1,000,000,000 05 Years 01 Year 2022 1,000,000,000 – Al Baraka Bank Limited 3mk + 0.80 1,000,000,000 05 Years 01 Year 2022 1,000,000,000 – 6,500,000,000 5,706,160,271 2,495,929,882 27,465,000,000 15,656,462,987 13,532,285,027
* 3 mk i.e. 3 months KIBOR
10.2 Long term loans are secured against ranking / joint parri passu charge on land, all present and future fixed assets, plant and machinery of the Group of Rs. 21,016 million (2017: Rs. 19,522 million) and personal guarantees of sponsor directors of the Group.
11 LIABILITIES AGAINST ASSETS SUBJECT TO FINANCE LEASE - SECURED
The amount of future minimum lease payments along with their present value and the periods during which they will fall due are:
2018
Present value Future Finance of future minimum cost for minimum lease future lease Note payments periods payments
Rupees Rupees Rupees
Less than one year 15 115,129,719 9,848,122 105,281,597 Between one and five years 152,863,012 8,185,098 144,677,914 267,992,731 18,033,220 249,959,511
2017
Present value Future Finance of future minimum cost for minimum lease future lease payments periods payments
Rupees Rupees Rupees
Less than one year 15 165,224,811 11,800,308 153,424,503 Between one and five years 158,215,952 5,168,278 153,047,674 323,440,763 16,968,586 306,472,177 Lease rentals are payable on quarterly / monthly basis and include finance cost ranging from three months
to one year KIBOR plus 100 bps per annum (2017: three months to one year KIBOR plus 100 to 300 bps per annum) which has been used as the discounting factor. The Group has the option to purchase the assets upon completion of lease period and has the intention to exercise such option.
Notes to the Consolidated Financial StatementsFor the year ended 30 September 2018

Fina
ncia
l Sta
tem
ents
Oth
er In
form
atio
nC
ompa
ny R
evie
w
Ann
ual R
epor
t 201
8
147
2018 2017 Rupees Rupees Restated
12 DEFERRED TAXATION
Deferred tax liability on taxable temporary differences arising in respect of: - accelerated tax depreciation on operating fixed assets 3,349,968,546 3,276,101,853 - leased assets 158,180,423 216,526,671 3,508,148,969 3,492,628,524 Deferred tax asset on deductible temporary differences arising in respect of: - liabilities against assets subject to finance lease (72,488,258) (91,941,653) - provisions for doubtful debts and obsolescence (24,557,833) (25,436,603) - impairment of investment in associate (26,100,000) (27,000,000) - provision for Workers’ Profit Participation Fund – (35,648,942) - retirement benefits (19,238,864) – - tax losses (674,921,187) (164,552,834) - tax credits (1,011,066,991) (1,404,075,570) (1,828,373,133) (1,748,655,602) 1,679,775,836 1,743,972,922 12.1 Movement in deferred tax balances is as follows: As at 01 October 1,743,972,922 1,869,360,530 Recognized in statement of profit or loss: - accelerated tax depreciation on operating fixed assets 73,866,693 287,600,676 - leased assets (58,346,248) (136,259,579) - liabilities against assets subject to finance lease 19,453,395 156,530,750 - provisions for doubtful debts and obsolescence 878,770 24,243,986 - impairment of investment in associate 900,000 431,437,430 - provision for Workers’ Profit Participation Fund 35,648,942 19,878,131 - retirement benefits (15,414,051) 33,294,931 - tax losses (510,368,353) (115,893,923) - derecognition / (recognition) of tax credits 393,008,579 (821,958,721) (60,372,273) (121,126,319) Recognized in other comprehensive income: - retirement benefits (3,824,813) (4,261,289) 1,679,775,836 1,743,972,922 13 RETIREMENT BENEFITS
The latest actuarial valuation of the Holding Company and FPML defined benefits were conducted on 30 September 2018 using projected unit credit method. Details of obligations are as follows:
Note 2018 2017 Rupees Rupees
Funded gratuity fund 13.1 53,784,119 29,618,756 Unfunded staff gratuity scheme 13.2 – 6,754,179 53,784,119 36,372,935

JDW
Gro
up
148
Note 2018 2017 Rupees Rupees
13.1 Funded retirement benefits The amounts recognised in the consolidated statement of financial position are as follows: Present value of defined benefit obligation 13.1.1 142,649,329 119,018,899 Fair value of plan assets 13.1.2 (88,865,210) (89,400,143) Liability as at 30 September 53,784,119 29,618,756 13.1.1 Movement in liability for funded defined benefit obligation Present value of defined benefit obligation at beginning of the year 119,018,899 101,168,252 Current service cost for the year 19,754,774 14,642,906 Interest cost for the year 8,880,532 7,746,250 Benefit paid during the year (8,190,955) (8,401,625) Actuarial loss on present value of defined benefit obligation 3,186,079 3,863,116 Present value of defined benefit obligation at end of the year 142,649,329 119,018,899 13.1.2 Movement in fair value of plan assets Balance at beginning of the year 89,400,143 – Return on plan assets excluding interest income 7,241,088 4,494,373 Contributions paid by the employer 10,417,866 103,648,576 Actuarial loss on defined benefit asset (10,002,932) (10,341,181) Benefits paid by the fund (8,190,955) (8,401,625) Fair value of plan assets at end of the year 88,865,210 89,400,143
Plan assets comprises of: Nafa Islamic Assets Allocation Fund 49,574,211 50,988,256 Nafa Assets Allocation Fund 38,059,164 37,928,056 Askari Bank Limited 1,231,835 483,831 88,865,210 89,400,143 13.1.3 Charge for the year Statement of profit or loss Current service cost 19,754,774 14,642,906 Interest cost for the year 8,880,532 7,746,250 Return on plan assets excluding interest income (7,241,088) (4,494,373) 21,394,218 17,894,783 Other comprehensive income Actuarial loss on obligation 3,186,079 3,863,116 Actuarial loss on defined benefit assets 10,002,932 10,341,181 34,583,229 32,099,080 13.1.4 Movement in actuarial losses Opening actuarial losses – – Actuarial loss during the year (13,189,011) (14,204,297) Charge to other comprehensive income 13,189,011 14,204,297 Closing actuarial losses – –
Notes to the Consolidated Financial StatementsFor the year ended 30 September 2018

Fina
ncia
l Sta
tem
ents
Oth
er In
form
atio
nC
ompa
ny R
evie
w
Ann
ual R
epor
t 201
8
149
13.1.5 Historical information 2018 2017 2016 2015 2014
Rupees Rupees Rupees Rupees Rupees Present value of defined obligations 142,649,329 119,018,899 101,168,252 75,844,689 68,256,699 Experience adjustment loss / (gain) 13,189,011 14,204,297 17,810,879 5,293,750 (3,281,607) 13.1.6 Expected expense for the next year
The Group expects to charge Rs. 19.72 million to consolidated statement of profit or loss on account of defined benefit plan in 2019.
13.1.7 Sensitivity analysis
Reasonably possible changes at the reporting date to one of the relevant actuarial assumptions, holding other assumptions constant, would have affected the defined benefit obligation by the amounts shown below.
Impact on defined benefit obligation 2018 2017 Change Increase Decrease Increase Decrease
Discount rate 100 BPS (11,281,262) 13,286,258 (8,438,481) 13,892,422 Salary growth rate 100 BPS 12,823,213 (11,095,841) 13,466,481 (8,269,646) Although the analysis does not take account of the full distribution of cash flows expected under the
plan, it does provide an approximation of the sensitivity of the assumptions shown.
2018 2017 Rupees Rupees
13.1.8 Actuarial assumptions Valuation discount rate 10% 8% Salary increase rate 10% 8% Expected return on plan assets 10% 8% Average expected remaining working life time of employees 9.15 9.28 Mortality rate SLIC 2001 - 2015 SLIC 2001 - 2015
13.2 Unfunded retirement benefits The amounts recognised in the consolidated statement of financial position are as follows: Present value of defined benefit obligation – 6,754,179

JDW
Gro
up
150
2018 2017 Rupees Rupees 13.2.1 Movement in liability for unfunded defined benefit obligation Present value of defined benefit obligation at beginning of the year 6,754,179 5,671,061 Current service cost – 1,241,944 Past service cost (income) (2,208,269) – Interest cost – 503,977 Benefits paid (92,400) (65,000) Benefits due but not paid (4,453,510) (154,863) Actuarial (gains) / losses – (442,940) – 6,754,179
13.2.2 The amounts recognized in the statement of comprehensive income are as follows: Current service cost – 1,241,944 Interest cost – 503,977 Past service cost (income) (2,208,269) – Total, included in salaries and wages - Administrative expenses (2,208,269) 1,745,921 13.2.3 Historical information
2018 2017 2016 2015 2014
Rupees Rupees Rupees Rupees Rupees Present value of defined obligations – 6,754,179 5,671,061 3,606,266 3,293,916
Note 2018 2017 Rupees Rupees
14 SHORT TERM BORROWINGS - SECURED
Mark-up based borrowings from conventional banks - Cash finances 14.1 15,649,822,876 9,128,652,000 - Running finances 14.2 3,776,593,833 1,603,330,583 - Inland bill discounting 14.3 1,599,999,999 884,999,998 - Finance against trust receipts 14.4 168,668,694 366,406,064 21,195,085,402 11,983,388,645 Islamic mode of financing - Morabaha finances 14.5 1,800,000,000 1,800,000,000 - Tijarah finances 14.6 439,999,568 – - Salam / Istisna finances 14.7 4,420,865,369 – 6,660,864,937 1,800,000,000 27,855,950,339 13,783,388,645 14.1 The Group has obtained these facilities from various banks and financial institutions aggregating
Rs. 23,188 million (2017: Rs. 21,650 million). The mark-up rates applicable during the year ranges from one to six months KIBOR plus 20 to 50 bps per annum (2017: one to six months KIBOR plus 20 to 100 bps per annum). These are secured against pledge of sugar and personal guarantees of sponsor directors of the Group.
Notes to the Consolidated Financial StatementsFor the year ended 30 September 2018

Fina
ncia
l Sta
tem
ents
Oth
er In
form
atio
nC
ompa
ny R
evie
w
Ann
ual R
epor
t 201
8
151
14.2 The Group has obtained running finance facilities aggregating Rs. 4,330 million (2017: Rs.2,730 million). The mark-up rates applicable during the year ranges from one to six months KIBOR plus 0 to 100 bps per annum (2017: one to six months KIBOR plus 20 to 100 bps per annum). These are secured against ranking charge / joint pari passu charge over present and future current assets of the Group and personal guarantees of the sponsor directors of the Group.
14.3 The Holding Company has obtained inland bill discounting facility aggregating Rs. 1,900 million (2017:
Rs. 1,100 million). The mark-up rate applicable during the year ranges from one to three months KIBOR plus 50 to 100 bps per annum (2017: one to three months KIBOR plus 50 bps per annum). These are secured against ranking charge / joint pari passu charge over present and future current assets of the Group and personal guarantees of the sponsor directors of the Group.
14.4 The limit of this facility is Rs. 1,150 million (2017: Rs. 1,050 million). It carries mark-up ranging from one
to six months KIBOR plus 50 to 250 bps per annum (2017: one to six months KIBOR plus 100 to 135 bps per annum). These are secured against ranking charge / joint pari passu charge over present and future current assets of the Group and personal guarantees of the sponsor directors of the Group.
14.5 The Group has obtained morabaha finance facilities aggregating Rs. 1,800 million (2017: Rs. 1,800
million). The mark-up rates applicable during the year ranges from three to six months KIBOR plus 50 to 75 bps per annum (2017: three to six months KIBOR plus 50 to 75 bps per annum). These are secured against ranking charge / joint pari passu charge over present and future current assets of the Group and personal guarantees of the sponsor directors of the Group.
14.6 The Holding Company has obtained tijarah finance facility from Meezan Bank Limited aggregating to
Rs. 500 million (2017: Rs. nil). The mark-up rate applicable during the year is three months KIBOR plus 55 bps per annum. These are secured against ranking charge / joint pari passu charge over present and future current assets of the Holding Company and personal guarantees of the sponsor directors of the Holding Company.
14.7 The Group has obtained salam / istisna finances facilities from various banks and financial institutions
aggregating to Rs. 7,985 million (2017: Rs. 5,135 million). It carries mark-up ranging from three to six months KIBOR plus 20 to 55 bps per annum. These are secured against pledge of sugar and personal guarantees of sponsor directors of the Group.
Note 2018 2017 Rupees Rupees
15 CURRENT PORTION OF NON-CURRENT LIABILITIES
Redeemable capital - secured 9 – 83,333,333 Long term finances - secured 10 4,609,518,516 3,369,971,353 Liabilities against assets subject to finance lease - secured 11 105,281,597 153,424,503 4,714,800,113 3,606,729,189

JDW
Gro
up
152
Note 2018 2017 Rupees Rupees Restated
16 TRADE AND OTHER PAYABLES
Advances from customers 8,837,156,257 7,202,669,958 Trade and other creditors 2,389,889,039 1,602,353,288 Due to related parties 16.1 879,078 828,159 Accrued expenses 246,298,911 208,097,930 Sales tax payable 83,459,590 – Retention money 35,464,423 16,203,439 Payable to Workers’ Profit Participation Fund 16.2 – 118,829,804 Payable to Workers’ Welfare Fund 16.3 26,574,555 26,574,555 Payables to Provident Fund 14,745,719 – Tax deducted at source 14,349,122 33,556,518 Other payables 74,868,045 76,104,010 11,723,684,739 9,285,217,661
16.1 This amount represents payable in respect of consultancy services provided by the key management personnel.
Note 2018 2017 Rupees Rupees Restated
16.2 Payable to Workers’ Profit Participation Fund Balance as at 01 October 118,829,804 185,090,244 Add: Allocation for the year 36 – 118,829,804 Interest on funds utilized 37 61,966,668 71,221,712 Prior year adjustment 36 5,237,703 – 186,034,175 375,141,760 Less: Paid during the year (186,034,175) (256,311,956) Balance as at 30 September – 118,829,804 16.3 Payable to Workers’ Welfare Fund Balance as at 01 October 26,574,555 45,745,525 Provision for the year 36 – 18,510,840 Reversal of prior year provision – (37,681,810) Balance as at 30 September 26,574,555 26,574,555 2018 2017 Rupees Rupees
17 ACCRUED PROFIT / INTEREST / MARK-UP
Mark-up on financing / borrowings from conventional banks - Redeemable capital - secured – 1,499,725 - Long term finances - secured 145,760,309 110,609,938 - Short term borrowings - secured 325,470,734 140,593,034 471,231,043 252,702,697 Profit on Islamic mode of financing - Long term finances - secured 32,845,789 8,723,410 - Short term borrowings - secured 138,419,746 15,815,524 171,265,535 24,538,934 642,496,578 277,241,631
Notes to the Consolidated Financial StatementsFor the year ended 30 September 2018

Fina
ncia
l Sta
tem
ents
Oth
er In
form
atio
nC
ompa
ny R
evie
w
Ann
ual R
epor
t 201
8
153
18 CONTINGENCIES AND COMMITMENTS
18.1 Contingencies
18.1.1 A sales tax demand was raised by the tax department for the year 2002-2003 on grounds of various observations. Alternative dispute resolution committee unanimously decided the matter partially in favor of the Holding Company and forwarded its recommendations to Federal Board of Revenue (“FBR”) for further necessary actions. FBR decided the case against the Holding Company on 29 November 2013 and raised a demand of Rs. 47.63 million out of which the Holding Company has deposited Rs. 47.5 million. However, the Holding Company has filed an appeal before Honorable Lahore High Court against the order passed by the Appellate Tribunal, and expects a favorable outcome in this case.
18.1.2 The tax department issued a show cause notice to the Holding Company on 09 April 2013 on the
grounds that the Holding Company has charged Federal Excise duty at the rate of 0.5% instead of 8% on local supplies made and raised a demand of Rs. 50.68 million. Consequently, the Holding Company filed a writ petition against this notice in the Honorable Lahore High Court (“Court”) on the basis that the rate of 0.5% has been charged as allowed by the FBR vide SRO 77(I)/2013 dated 07 February 2013. The Court suspended the proceedings of the notice vide its order dated 24 April 2013 and the final outcome of the case is pending. Management of the Holding Company expects a favorable outcome in this case.
18.1.3 The Holding Company was selected for audit u/s 177 of I.T.O 2001 for tax year 2008. Assistant
Commissioner of Inland Revenue (“ACIR”) passed order u/s 122(5) / 122(1) by making additions on different issues i.e. interest expense, salaries, sale, gain on sale of assets etc., amounting to Rs. 516 million by reducing brought forward losses. The Holding Company has filed appeal before Commissioner Inland Revenue (Appeals) (“CIR”), who vide order dated 06 April 2010 decided appeal in favor of the Holding Company on most of the issues. The department filed appeal before appellate tribunal (“ATIR”). Respectable ATIR passed an order in favor of the Holding Company except for two issues with an aggregate amount of Rs. 72.57 million. The Holding Company has filed an appeal before High Court, against the order of the ATIR. The management of the Holding Company is confident that this case will be decided in its favor.
18.1.4 The Holding Company was selected for audit u/s 177 of I.T.O 2001 for tax year 2014. Deputy Commissioner
Inland Revenue (“DCIR”) passed order u/s 122(1) by making additions on different expenses, amounting to Rs. 163.16 million. The Holding Company has filed appeal before Commissioner Inland Revenue (Appeals) (“CIR”) who vide order dated 07 March 2018 accepted the tax payer contention and has granted relief on major issues amounting Rs. 127.03 million and upheld the remaining issues amounting to Rs. 36.15 million. The Holding Company has filed second appeal before Appellate Tribunal Inland Revenue (“ATIR”) against the issues. The hearing of the same is pending. The management of the Holding Company is confident that this case will be decided in its favor.
18.1.5 The Holding Company was selected for audit u/s 72B of Sale Tax Act, 1990 for the period June 2013
to July 2014 by the Federal Board of Revenue (“FBR”). A sales tax demand was raised by the tax department on various grounds of Rs. 70.94 million. The Holding Company has filed appeal before Commissioner Inland Revenue (Appeals) (“CIR”) who vide order no. 1 dated 08 February 2018 has granted relief of an amount Rs. 57.37 and the issues with an aggregate amount of Rs. 12.62 million were upheld while remaining issues are remanded back. The Holding Company being aggrieved by the order of CIR (A) has filed second appeal before Appellate Tribunal Inland Revenue (ATIR). The management of the Holding Company is confident that this case will be decided in its favor.
18.1.6 The Holding Company (previously United Sugar Mills Limited) was selected for audit u/s 177 of I.T.O
2001 for tax year 2008. The Holding Company has filed Writ Petition before Honorable Lahore High Court (“Court”) against selection of audit which was rejected by the Court. Income tax department initiated audit proceeding and Deputy Commissioner Inland Revenue (“DCIR”) passed order u/s 122(4)/(5) by making additions on different issues and created a demand of Rs. 76.56 million vide order dated 22 December 2017. The Holding Company filed an appeal before CIR(A). The hearing of the same is

JDW
Gro
up
154
pending. However, taxpayer has been granted stay by the Court against the recovery of demand. The management of the Holding Company is confident that this case will be decided in its favor.
18.1.7 Additional Commissioner Inland Revenue (“ACIR”) issued show cause notice u/s 122(5A) of I.T.O
2001 for tax year 2011 confronting several matters. The said notice was duly complied and plea of the taxpayer was largely accepted by the department. ACIR passed order u/s 122(5A) by making additions on different issues and created a demand of Rs. 18.75 million vide order dated 30 June 2017. The Holding Company filed an appeal before CIR(A). The hearing of the same is pending. The management of the Holding Company is confident that this case will be decided in its favor.
18.1.8 The Subsidiary Company “DSML” is in a Constitutional Petition dated 01 March 2011 with the Additional
Secretary Industries and Commerce Department, Government of Sindh against cancelling of No Objection Certificate (collectively “Impugned Cancellation Order”). However the Honorable Sindh High Court has suspended the Impugned Cancellation Order and the respondents in the Constitutional Petition have been restrained from interfering in the construction of the sugar mill. The actual date of further hearing in this case is yet to be notified by the High Court. Whilst in the view of legal advisor the Subsidiary Company has an arguable case, and it is not possible at this stage to give a definitive opinion on the ultimate outcome or any losses that may be incurred by the Subsidiary Company.
18.1.9 The tax department issued a show cause notice to the Subsidiary Company “DSML” on 23 May 2013 on the grounds that the Subsidiary Company has charged Federal Excise duty at the rate of 0.5% instead of 8% on local supplies made. Consequently, the Subsidiary Company filed a writ petition against this notice in the Honorable Sindh High Court (“Court”) on the basis that the rate of 0.5% has been charged as allowed by the FBR vide SRO 77(I)/2013 dated 07 February 2013. The Court suspended the proceedings of the notice and the final outcome of the case is pending. Management of the Subsidiary Company expects a favorable outcome in this case. Hence no provision has been made in the consolidated financial statements.
18.1.10 The Petition WP NO. 704/2018, the Subsidiary Companies “SPL & GPL” vs. Federation of Pakistan, etc.
relates to the setting up of biomass / bagasse-based projects for sale of electricity to the national grid by the Petitioner Companies to the refusal by the Central Power Purchase Agency (Guarantee)Limited (CPPA-G) to act in accordance with the NEPRA 2013 Upfront Tariff Determination dated 29 May 2013 and the NEPRA Tariff Decision dated 11 September 2017. The CPPA-G’s refusal is further discriminatory, in violation of the NEPRA (Market Operator Registration, Standards and Procedure) Rules, 2015 and also contrary to an earlier decision passed by the Honorable Islamabad High Court titled ‘Access Solar (Pvt.) Limited and 2 Others vs. Federation of Pakistan and 3 Others’ reported as 2017 CLC 1259. The matter is pending adjudication. Keeping in view the provisions of the Constitution, the Law as well as Judicial Precedents – as the management of the Subsidiary Companies, based on the advice of its legal advisor handling the subject case, is of the opinion that matters shall be decided in the Subsidiary Companies’ favor.
18.1.11 Guarantees issued by the banks on behalf of the Holding Company in favor of various parties as at the reporting date amounts to Rs. 577 million (2017: Rs. 83 million).
18.1.12 Guarantees issued by the United Bank Limited on behalf of the Subsidiary Company “DSML” in favor of
various finance facilities as at reporting date amounts to Rs. 50 million (2017: Rs. 8 million).
Notes to the Consolidated Financial StatementsFor the year ended 30 September 2018

Fina
ncia
l Sta
tem
ents
Oth
er In
form
atio
nC
ompa
ny R
evie
w
Ann
ual R
epor
t 201
8
155
2018 2017 Rupees Rupees
18.2 Commitments 18.2.1 Letters of credit for import of machinery and its related components Holding Company - JDWSML 539,941,528 569,509,835 Subsidiary Company - DSML 33,558,902 17,449,232 18.2.2 The amount of future lease rentals on agricultural contract and the period in which payments will become
due are as follows:
2018 2017 Rupees Rupees
Less than one year 198,384,569 239,196,355 Between one and five years 671,882,706 805,075,014 More than five years 4,173,750 6,016,667 874,441,025 1,050,288,036 18.2.3 The amount of future ijarah rentals for ijarah financing and the period in which these payments will
become due are as follows:
2018 2017 Rupees Rupees
Less than one year 1,098,556 1,465,012 Between one and five years – 629,115 1,098,556 2,094,127 Note 2018 2017 Rupees Rupees Restated
19 PROPERTY, PLANT AND EQUIPMENT
Operating fixed assets 19.1 25,311,720,470 23,623,140,195 Capital work in progress 19.6 1,781,975,765 2,953,218,912 Stores, spare parts and loose tools held for capital expenditures 141,580,936 90,001,462 27,235,277,171 26,666,360,569

JDW
Gro
up
156
19
.1
Op
erat
ing
fixe
d a
sset
s
C
ost
Dep
reci
atio
n N
et b
ook
A
s at
A
dditi
ons
/ Tr
ansf
ers
As
at
A
s at
Tran
sfer
s /
As
at
valu
e as
at
01
Oct
ober
(d
elet
ions
) du
ring
30 S
epte
mbe
r R
ate
01 O
ctob
er
For t
he
(del
etio
ns) d
urin
g 30
Sep
tem
ber
30 S
epte
mbe
r
2017
du
ring
the
year
th
e ye
ar
2018
2017
ye
ar
the
year
20
18
2018
R
upee
s R
upee
s
Rup
ees
R
upee
s
%
Rup
ees
R
upee
s
Rup
ees
R
upee
s
Rup
ees
O
wne
d
Fr
eeho
ld la
nd
2,3
58,6
51,6
63
1,9
50,0
00
–
2,3
60,6
01,6
63
– –
–
– –
2,3
60,6
01,6
63
–
–
Fact
ory
build
ing
on
2,4
41,5
62,8
38
173
,844
,543
–
2
,615
,011
,366
10
1
,026
,724
,204
1
49,3
23,2
75
–
1,1
75,6
66,0
63
1,4
39,3
45,3
03
fre
ehol
d la
nd
(3
96,0
15)
(3
81,4
16)
Non
-fact
ory
build
ing
on
969
,102
,338
7
3,22
4,07
2
–
1,0
41,9
01,6
54
5-20
3
12,8
68,7
96
35,
863,
135
–
3
48,6
78,8
36
693
,222
,818
freeh
old
land
(424
,756
)
(53,
095)
Plan
t and
mac
hine
ry
22,
386,
685,
375
2
,812
,001
,605
2
54,1
67,3
34
24,
955,
684,
231
5-
20
5,7
50,8
69,6
74
987
,616
,183
5
5,09
2,06
6
6,5
86,2
45,9
03
18,
369,
438,
328
(497
,170
,083
)
(207
,332
,020
)
Suga
rcan
e ro
ots
604
,503
,978
3
62,3
82,3
03
–
673
,807
,851
17
2
01,2
16,3
45
112
,301
,308
–
186
,871
,335
4
86,9
36,5
16
(293
,078
,430
)
(126
,646
,318
)
Mot
or v
ehic
les
1,9
56,7
76,0
48
152
,033
,106
1
7,97
4,50
0
2,0
37,7
42,4
97
20
1,1
06,4
81,9
69
324
,494
,085
7
,022
,100
1
,371
,363
,694
6
66,3
78,8
03
(89,
041,
157)
(66,
634,
460)
El
ectri
cal i
nsta
llatio
n 1
69,7
66,3
68
8,9
04,5
12
–
178
,267
,492
10
6
4,71
3,82
8
11,
082,
290
–
7
5,54
8,96
6
102
,718
,526
(4
03,3
88)
(247
,152
)
Offi
ce e
quip
men
t 7
9,14
2,04
7
709
,518
–
7
5,47
3,08
5
20
42,
561,
085
8
,285
,574
–
47,
287,
111
2
8,18
5,97
4
(4
,378
,480
)
(3,5
59,5
48)
Tool
s an
d eq
uipm
ent
80,
534,
464
5
,317
,207
–
8
2,72
4,99
2
10-2
0 2
7,73
4,33
1
5,7
11,8
49
–
31,
702,
811
5
1,02
2,18
1
(3
,126
,679
)
(1,7
43,3
69)
Furn
iture
and
fixt
ure
28,
074,
361
1
,521
,917
–
2
7,74
7,32
2
10
11,
547,
149
2
,230
,109
–
1
2,41
1,13
8
15,
336,
184
(1,8
48,9
56)
(1
,366
,120
)
Wei
ghbr
idge
3
7,86
2,76
9
9,5
61,6
67
–
47,
424,
436
10
1
9,75
2,14
6
2,3
74,2
83
–
22,
126,
429
2
5,29
8,00
7
–
–
Notes to the Consolidated Financial StatementsFor the year ended 30 September 2018

Fina
ncia
l Sta
tem
ents
Oth
er In
form
atio
nC
ompa
ny R
evie
w
Ann
ual R
epor
t 201
8
157
C
ost
Dep
reci
atio
n N
et b
ook
A
s at
A
dditi
ons
/ Tr
ansf
ers
As
at
A
s at
Tran
sfer
s /
As
at
valu
e as
at
01
Oct
ober
(d
elet
ions
) du
ring
30 S
epte
mbe
r R
ate
01 O
ctob
er
For t
he
(del
etio
ns) d
urin
g 30
Sep
tem
ber
30 S
epte
mbe
r
2017
du
ring
the
year
th
e ye
ar
2018
2017
ye
ar
the
year
20
18
2018
R
upee
s R
upee
s
Rup
ees
R
upee
s
%
Rup
ees
R
upee
s
Rup
ees
R
upee
s
Rup
ees
Roa
ds a
nd b
ound
ary
wal
l 1
65,0
55,3
59
5,4
52,0
36
–
170
,152
,947
10
7
5,62
8,64
3
9,2
68,8
12
–
84,
592,
935
8
5,56
0,01
2
(3
54,4
48)
(3
04,5
20)
Arm
s an
d am
mun
ition
s 7
,907
,517
3
16,5
40
–
8,2
24,0
57
10
4,9
37,5
56
315
,642
–
5,2
53,1
98
2,9
70,8
59
–
–
Fire
figh
ting
equi
pmen
t 8
2,81
5,23
2
–
–
8
2,81
5,23
2
20
41,
223,
855
8
,318
,276
–
4
9,54
2,13
1
33,
273,
101
–
–
Airc
raft
4
69,9
81,8
24
225
,807
,775
–
6
24,4
53,4
03
10-2
5 2
68,0
59,0
69
26,
287,
369
–
2
52,0
76,8
03
372
,376
,600
(7
1,33
6,19
6)
(4
2,26
9,63
5)
Tube
wel
l 9
,833
,641
–
–
9
,833
,641
10
4
,251
,298
5
58,2
34
– 4
,809
,532
5
,024
,109
–
–
Com
pute
rs
40,
312,
133
2
8,49
1,03
7
–
67,
045,
989
33
2
8,61
3,38
2
11,
388,
071
–
3
8,46
4,23
7
28,
581,
752
(1,7
57,1
81)
(1
,537
,216
)
3
1,88
8,56
7,95
5
3,8
61,5
17,8
38
272
,141
,834
3
5,05
8,91
1,85
8
8
,987
,183
,330
1
,695
,418
,495
6
2,11
4,16
6
10,
292,
641,
122
2
4,76
6,27
0,73
6
(9
63,3
15,7
69)
(4
52,0
74,8
69)
Le
ased
Plan
t and
mac
hine
ry
713
,607
,138
–
(2
54,1
67,3
34)
459
,439
,804
5
102
,057
,346
3
0,57
7,49
0
(55,
092,
066)
7
7,54
2,77
0
381
,897
,034
–
–
Mot
or v
ehic
les
140
,574
,850
9
5,34
5,50
0
(17,
974,
500)
2
17,9
45,8
50
20
30,
369,
072
3
1,04
6,17
8
(7,0
22,1
00)
54,
393,
150
1
63,5
52,7
00
–
–
8
54,1
81,9
88
95,
345,
500
(2
72,1
41,8
34)
677
,385
,654
132
,426
,418
6
1,62
3,66
8
(62,
114,
166)
1
31,9
35,9
20
545
,449
,734
–
–
3
2,74
2,74
9,94
3
3,9
56,8
63,3
38
–
35,
736,
297,
512
9,1
19,6
09,7
48
1,7
57,0
42,1
63
–
10,
424,
577,
042
2
5,31
1,72
0,47
0
(9
63,3
15,7
69)
(4
52,0
74,8
69)
19
.2
Add
ition
s in
ope
ratin
g fix
ed a
sset
s in
clud
ed tr
ansf
er fr
om c
apita
l wor
k in
pro
gres
s am
ount
ing
to R
s. 2
,920
.12
mill
ion
(201
7: R
s. 1
,354
.47
mill
ion)
.
19
.2.1
Tr
ansf
ers
from
free
hold
land
repr
esen
ts tr
ansf
er o
f lan
d to
inve
stm
ent p
rope
rty o
f the
Hol
ding
Com
pany
dur
ing
the
year
am
ount
ing
to R
s. n
il (2
017:
Rs
38.2
9 m
illio
n)

JDW
Gro
up
158
O
wn
ed
F
reeh
old
land
1
,895
,679
,344
5
19,9
32,7
50
(38
,288
,435
) 2
,358
,651
,663
–
–
–
– –
2
,358
,651
,663
(
18,6
71,9
96)
–
–
–
–
–
Fac
tory
bui
ldin
g o
n 2
,400
,573
,289
6
8,78
5,23
9
–
2,4
41,5
62,8
38
10
908
,369
,456
1
45,0
66,2
16
–
1,0
26,7
24,2
04
1,4
14,8
38,6
34
fr
eeho
ld la
nd
–
24,
934,
276
–
(52
,729
,966
)
1
1,03
6,99
3
(37
,748
,461
)
No
n-fa
cto
ry b
uild
ing
on
9
37,3
06,1
26
2,4
76,8
23
–
969
,102
,338
5-
20
252
,660
,164
3
3,85
2,53
6
–
312
,868
,796
6
56,2
33,5
42
fr
eeho
ld la
nd
–
4
8,73
9,93
9
–
(
19,4
20,5
50)
34,
289,
721
(
7,93
3,62
5)
Pla
nt a
nd m
achi
nery
2
0,09
2,23
1,34
3
1,6
36,1
50,5
89
675
,141
,617
2
2,38
6,68
5,37
5
5-20
4
,804
,833
,405
8
61,8
30,5
88
104
,316
,444
5
,750
,869
,674
1
6,63
5,81
5,70
1
(
49,8
15,0
78)
69,
341,
192
(
45,0
15,6
75)
(
36,3
64,2
88)
39,
208,
290
(
14,3
03,3
78)
Sug
arca
ne r
oo
ts
540
,905
,484
2
55,0
49,2
14
–
604
,503
,978
17
1
70,8
87,7
51
100
,750
,663
–
2
01,2
16,3
45
403
,287
,633
(
191,
450,
720)
–
(
70,4
22,0
69)
–
–
–
Mo
tor
vehi
cles
1
,347
,906
,451
2
59,0
04,6
25
366
,242
,435
1
,956
,776
,048
20
7
28,5
83,1
48
255
,927
,640
1
39,6
15,2
92
1,1
06,4
81,9
69
850
,294
,079
(
57,9
32,8
61)
41,
555,
398
(
40,7
02,5
58)
–
2
3,05
8,44
7
–
Ele
ctric
al in
stal
latio
n 1
73,1
89,2
57
39,
016,
404
–
1
69,7
66,3
68
10
66,
685,
254
1
1,67
3,89
0
– 6
4,71
3,82
8
105
,052
,540
(
3,72
2,98
7)
46,
779,
839
(
2,39
2,70
9)
(
85,4
96,1
45)
31,
196,
892
(
42,4
49,4
99)
Offi
ce e
qui
pm
ent
125
,322
,745
2
,051
,001
–
7
9,14
2,04
7
20
64,
381,
021
1
2,67
1,14
9
– 4
2,56
1,08
5
36,
580,
962
(3,
747,
933)
(
1,51
3,75
1)
(3,
156,
600)
(42
,970
,015
)
(
1,21
5,48
0)
(30
,119
,005
)
Too
ls a
nd e
qui
pm
ent
67,
572,
095
1
2,70
9,18
2
–
80,
534,
464
10
-20
27,
672,
060
4
,702
,558
–
2
7,73
4,33
1
52,
800,
133
(2,
978,
849)
1
4,38
1,31
4
(1,
803,
091)
(11
,149
,278
)
5
,313
,960
(
8,15
1,15
6)
Ag
ri im
ple
men
ts
40,
369,
512
–
3
,960
,001
–
10
21,
134,
739
2
,396
,601
9
67,5
79
– –
–
(3,
395,
000)
–
(
40,9
34,5
13)
(1,
484,
496)
(
23,0
14,4
23)
Fur
nitu
re a
nd fi
xtur
e 4
4,07
7,50
6
2,4
00,2
57
– 2
8,07
4,36
1
10
19,
013,
903
2
,744
,635
–
1
1,54
7,14
9
16,
527,
212
(14
,929
,199
) 5
82,3
61
(7,
737,
555)
(4,
056,
564)
2
03,1
50
(2,
676,
984)
C
ost
Dep
reci
atio
n N
et b
ook
A
s at
A
dditi
ons
/ Tr
ansfe
rs /
adjus
tmen
ts A
s at
As
at
Tr
ansf
ers /
(del
etio
ns)
As
at
valu
e as
at
01
Oct
ober
(d
elet
ions
) in
/ (o
ut)
30 S
epte
mbe
r R
ate
01 O
ctob
er
For t
he
/ ad
just
men
ts in
/ (o
ut)
30 S
epte
mbe
r 30
Sep
tem
ber
20
16
durin
g th
e ye
ar
durin
g th
e ye
ar
2017
2016
ye
ar
durin
g th
e ye
ar
2017
20
17
R
upee
s R
upee
s
Rup
ees
R
upee
s
%
Rup
ees
R
upee
s
Rup
ees
R
upee
s
Rup
ees
Notes to the Consolidated Financial StatementsFor the year ended 30 September 2018

Fina
ncia
l Sta
tem
ents
Oth
er In
form
atio
nC
ompa
ny R
evie
w
Ann
ual R
epor
t 201
8
159
Wei
ghbr
idge
1
0,45
4,65
6
1,1
36,0
71
– 3
7,86
2,76
9
10
8,5
10,5
84
279
,690
–
1
9,75
2,14
6
18,
110,
623
–
26,
272,
042
–
–
1
0,96
1,87
2
–
Roa
ds a
nd b
ound
ary
wal
l 1
47,4
96,4
62
– –
165
,055
,359
10
5
6,38
8,72
4
9,1
10,7
74
–
75,
628,
643
8
9,42
6,71
6
–
1
7,55
8,89
7
10,
129,
145
–
–
–
Arm
s an
d am
mun
ition
s 7
,907
,517
–
–
7,9
07,5
17
10
4,6
07,5
60
329
,996
–
4
,937
,556
2
,969
,961
– –
–
–
–
–
Fire
figh
ting
equi
pmen
t 7
8,81
9,44
8
– –
8
2,81
5,23
2
10
29,
792,
590
9
,805
,372
–
4
1,22
3,85
5
41,
591,
377
–
3,9
95,7
84
–
–
1,6
25,8
93
–
Airc
raft
4
69,9
81,8
24
– –
4
69,9
81,8
24
20
237
,705
,084
3
0,35
3,98
5
–
268
,059
,069
2
01,9
22,7
55
–
–
–
–
–
–
Tube
wel
l 3
,436
,079
1
,075
,775
–
9
,833
,641
10
1
,734
,006
2
24,4
38
–
4,2
51,2
98
5,5
82,3
43
– 5
,321
,787
–
–
2,2
92,8
54
–
Com
pute
rs
42,
687,
717
2
,463
,223
–
4
0,31
2,13
3
33
25,
494,
104
6
,183
,226
–
2
8,61
3,38
2
11,
698,
751
(3,4
06,0
48)
4,2
10,7
77
(2,8
43,2
38)
(5
,643
,536
)
3
,734
,691
(3
,955
,401
)
2
8,42
5,91
6,85
5
2,8
02,2
51,1
53
1,0
07,0
55,6
18
31,
888,
567,
955
7,4
28,4
53,5
53
1,4
87,9
03,9
57
244
,899
,315
8
,987
,183
,330
2
2,90
1,38
4,62
5
(3
46,6
55,6
71)
(1
74,0
73,4
95)
Leas
ed
Pl
ant a
nd m
achi
nery
1
,388
,748
,755
–
(6
75,1
41,6
17)
713
,607
,138
5
162
,880
,403
4
3,49
3,38
7
(104
,316
,444
) 1
02,0
57,3
46
611
,549
,792
–
–
–
–
–
–
Agri
impl
emen
ts
3,9
60,0
01
–
(3,9
60,0
01)
–
10
878
,513
8
9,06
6
(967
,579
) –
–
–
–
–
–
–
–
Mot
or v
ehic
les
412
,970
,935
9
3,84
6,35
0
(366
,242
,435
) 1
40,5
74,8
50
20
117
,737
,652
5
2,24
6,71
2
(139
,615
,292
) 3
0,36
9,07
2
110
,205
,778
–
–
–
–
–
–
1
,805
,679
,691
9
3,84
6,35
0
(1,0
45,3
44,0
53)
854
,181
,988
281
,496
,568
9
5,82
9,16
5
(244
,899
,315
) 1
32,4
26,4
18
721
,755
,570
–
–
3
0,23
1,59
6,54
6
2,8
96,0
97,5
03
(38,
288,
435)
3
2,74
2,74
9,94
3
7
,709
,950
,121
1
,583
,733
,122
–
9
,119
,609
,749
2
3,62
3,14
0,19
5
(3
46,6
55,6
71)
(1
74,0
73,4
95)
C
ost
Dep
reci
atio
n N
et b
ook
A
s at
A
dditi
ons
/ Tr
ansfe
rs /
adjus
tmen
ts A
s at
As
at
Tr
ansf
ers /
(del
etio
ns)
As
at
valu
e as
at
01
Oct
ober
(d
elet
ions
) in
/ (o
ut)
30 S
epte
mbe
r R
ate
01 O
ctob
er
For t
he
/ ad
just
men
ts in
/ (o
ut)
30 S
epte
mbe
r 30
Sep
tem
ber
20
16
durin
g th
e ye
ar
durin
g th
e ye
ar
2017
2016
ye
ar
durin
g th
e ye
ar
2017
20
17
R
upee
s R
upee
s
Rup
ees
R
upee
s
%
Rup
ees
R
upee
s
Rup
ees
R
upee
s
Rup
ees

JDW
Gro
up
160
19.3 Particulars of immovable property (i.e. land and building) in the name of Group are as follows:
Usage of immovable Total area Location property (Acres)
Mauza Sharin, Jamal Din Wali, District Rahim Yar Khan Manufacturing facility 318.6 Machi Goth, Sadiqabad, District Rahim Yar Khan Manufacturing facility 186.72 Village Laluwali, District Ghotki Manufacturing facility 140.03 Mauza Kamoo Shaheed, Taluka Ubauro, Mirpur Mathelo, Ghotki Manufacturing facility 127.187 Mangowal, Gujrat Manufacturing facility 28.38 59-A, Gulberg, Lahore Record room/space for corporate office 0.65 29-B, Gulberg, Lahore Rest house 0.3
Agricultural Land - Punjab (various locations) Agriculture land 882.57
Agricultural Land - Sindh (various locations) Agriculture land 1,128.73
The buildings on freehold land and other immovable assets of the Group are constructed / located at
above mentioned freehold land.
Note 2018 2017 Rupees Rupees Restated
19.4 Depreciation charge for the year has been allocated as follows:
Cost of goods manufactured 32.1 & 32.1.1.1 1,431,578,760 1,280,036,749 Administrative expenses 33 69,719,521 54,603,750 Cost of growing crops 35.1.1 255,743,882 249,092,623 1,757,042,163 1,583,733,122
19.5 Disposal of operating fixed assets
Accumulated Book Sales Gain / Mode of Relationship
Description Particulars of purchaser Cost depreciation value value (loss) disposal with the Group
Rupees Rupees Rupees Rupees Rupees
Plant and machinery JK Sugar Mills (Pvt.) Ltd. 484,293,091 202,996,443 281,296,648 450,665,679 169,369,031 Negotiation Related Party Office EquipmentAir Conditioners Abbas Khan 214,990 151,441 63,549 15,000 (48,549) Negotiation Other party Photocopier Digital Business System 180,000 138,748 41,252 50,000 8,748 - do - Other party Shoot Gun Muhammad Sajid 35,311 33,546 1,765 41,667 39,902 - do - Other party Office equipment JK Sugar Mills (Pvt.) Ltd. 867,023 761,965 105,058 510,000 404,942 - do - Related Party Others Others 1,558,714 1,028,502 530,212 569,398 39,186 - do - Other party 2,856,038 2,114,202 741,836 1,186,065 444,229 Motor Vehicles Range Rover Toyota Royal Motors - RYK 26,621,250 20,877,837 5,743,413 8,500,000 2,756,587 Negotiation Other party Toyota Hilux Vigo JK Sugar Mills (Pvt.) Ltd. 2,925,000 2,307,128 617,872 2,100,000 1,482,128 - do - Related Party Toyota Hilux Vigo Muhammad Arif 2,450,000 2,154,141 295,859 1,568,182 1,272,323 - do - Other party Toyota Corolla Altis EFU General Insurance Ltd. 2,010,000 565,739 1,444,261 1,960,000 515,739 Insurance Claim Other party Toyota Land Cruiser Adnan Hafeez 1,888,254 1,699,429 188,825 1,350,000 1,161,175 Negotiation Other party Toyota Corolla Altis Israr Muhammad Khan 1,854,700 1,336,667 518,033 556,410 38,377 Company Policy Employee Toyota Corolla Altis Safdar Kanjoo 1,854,700 1,345,148 509,552 556,410 46,858 - do - Employee Toyota Corolla Altis Raja Mazhar Hussain 1,854,700 1,373,530 481,170 556,410 75,240 - do - Employee Toyota Corolla Altis Shahid Jamil 1,802,400 1,300,943 501,457 540,720 39,263 - do - Employee Toyota Corolla GLI Moin Khalid 1,720,000 1,157,025 562,975 1,377,272 814,297 Negotiation Other party Toyota Corolla GLI Afnan Arshad 1,689,500 1,196,766 492,734 675,800 183,066 Company Policy Employee Toyota Corolla GLI Muhammad Rafique Gohar 1,684,700 1,179,873 504,827 505,410 583 - do - Employee Honda City Khalid Rashid 1,629,000 1,149,454 479,546 488,700 9,154 - do - Employee Toyota Corolla GLI Tauseef Baig 1,619,700 1,129,838 489,862 485,910 (3,952) - do - Employee Toyota Corolla GLI Muhammid Khalid 1,619,700 1,146,486 473,214 485,910 12,696 - do - Employee Toyota Corolla GLI Safdar Ali Farooqi 1,587,400 1,184,008 403,392 1,250,000 846,608 - do - Employee Toyota Corolla XLI Aish Muhammad 1,549,700 1,066,841 482,859 619,880 137,021 - do - Employee Toyota Corolla XLI Syed Jaffar Hussain 1,549,700 1,095,414 454,286 619,880 165,594 - do - Employee Toyota Corolla XLI Mr. Jaffar Iqbal 1,549,700 1,103,635 446,065 619,880 173,815 - do - Employee Vehicle Mr. Shahid Akbar Faruk 1,444,560 1,270,063 174,497 1,000,000 825,503 Negotiation Related Party Toyota Corolla XLI Shabir Jamal 1,365,016 1,183,014 182,002 619,880 437,878 Company Policy Employee Toyota Corolla XLI Khalid aziz 1,280,575 1,109,832 170,743 582,960 412,217 - do - Employee Toyota Corolla XLI Nazeer Ahmed 1,280,575 1,109,832 170,743 582,960 412,217 - do - Employee Suzuki Liana Nadeem Haider 1,239,000 943,958 295,042 495,600 200,558 - do - Employee Suzuki Swift Rafique-ul-Haq 1,151,000 792,369 358,631 460,400 101,769 - do - Employee Suzuki Swift Najam-ud-Din 1,151,000 792,369 358,631 460,400 101,769 - do - Employee Suzuki Swift Rana Zafar Iqbal 1,151,000 878,931 272,069 460,400 188,331 - do - Employee
Notes to the Consolidated Financial StatementsFor the year ended 30 September 2018

Fina
ncia
l Sta
tem
ents
Oth
er In
form
atio
nC
ompa
ny R
evie
w
Ann
ual R
epor
t 201
8
161
Accumulated Book Sales Gain / Mode of Relationship
Description Particulars of purchaser Cost depreciation value value (loss) disposal with the Group
Rupees Rupees Rupees Rupees Rupees
Suzuki Swift DX Muhammad Iqbal Javed 1,131,000 790,024 340,976 452,400 111,424 - do - Employee Suzuki Cultus Adnan Hafeez 1,119,000 503,550 615,450 900,000 284,550 - do - Employee Mitsubishi Pajero Wasif Khan 1,110,000 1,106,239 3,761 590,000 586,239 Negotiation Other party Suzuki Swift Saif Ullah 1,096,000 770,251 325,749 438,400 112,651 Company Policy Ex-Employee Suzuki Swift Zulfiqar Ali 1,096,000 775,791 320,209 438,400 118,191 - do - Employee Suzuki Swift Muhammad Ajmal Khan 1,096,000 775,791 320,209 438,400 118,191 - do - Employee Suzuki Swift Shahzad Ahmed 1,096,000 775,791 320,209 438,400 118,191 - do - Employee Suzuki Swift Hafiz Farooq Ahmed 1,096,000 812,536 283,464 438,400 154,936 - do - Employee Suzuki Cultus Muhammad Jaffar 1,010,000 753,698 256,302 404,000 147,698 - do - Employee Suzuki Cultus Munawar Zarif 997,823 864,780 133,043 386,000 252,957 - do - Employee Suzuki Cultus Shahid Javed 990,000 681,534 308,466 396,400 87,934 - do - Employee Suzuki Cultus Zulfiqar Ali 711,515 616,646 94,869 364,400 269,531 - do - Employee Suzuki Pickup Khawar Muhammad Butt 699,000 345,859 353,141 470,000 116,859 Negotiation Other party Suzuki Bolan Qurban Ali 682,000 536,420 145,580 500,000 354,420 - do - Other party Suzuki Mehran Niaz Muhammad 612,000 434,231 177,769 244,800 67,031 Company Policy Employee Tractor Hassan Mehmood 604,967 473,891 131,076 725,000 593,924 Negotiation Other party Tractor Muhammad Ilyas 600,111 470,087 130,024 725,000 594,976 - do - Other party Tractor Hassan Mehmood 464,123 363,563 100,560 725,000 624,440 - do - Other party Suzuki Mehran Sheikh Waqas Shahid 409,800 78,064 331,736 594,545 262,809 - do - Other party Tractor Hassan Mehmood 351,000 274,950 76,050 725,000 648,950 - do - Other party Tractor Hassan Mehmood 351,000 274,950 76,050 725,000 648,950 - do - Other party Tractor Hassan Mehmood 351,000 274,950 76,050 725,000 648,950 - do - Other party Tractor Hassan Mehmood 312,000 244,400 67,600 725,000 657,400 - do - Other party Tractor Hassan Mehmood 312,000 244,400 67,600 725,000 657,400 - do - Other party Tractor Hassan Mehmood 312,000 244,400 67,600 725,000 657,400 - do - Other party Tractor Hassan Mehmood 312,000 244,400 67,600 725,000 657,400 - do - Other party Tractor Hassan Mehmood 312,000 244,400 67,600 725,000 657,400 - do - Other party Motorcycle Muhammad Sabir 86,000 41,721 44,279 34,000 (10,279) Company Policy Employee Motorcycle Syed Shehzad Ali 67,500 46,473 21,027 26,000 4,973 - do - Employee Motorcycle Amir Bux 52,774 50,135 2,639 40,041 37,402 - do - Employee Motorcycle Tariq Mehmood 36,214 34,403 1,811 11,770 9,959 - do - Employee Vehicle JK Sugar Mills (Pvt.) Ltd. 41,500 35,860 5,640 7,500 1,860 Negotiation Related Party 89,041,157 66,634,458 22,406,699 45,068,230 22,661,531Computers Laptop EFU General Insurance Ltd 146,500 100,226 46,274 66,500 20,226 Insurance Claim Other party Laptop JK Sugar Mills (Pvt.) Ltd. 85,500 28,690 56,810 65,000 8,190 Negotiation Related Party 232,000 128,916 103,084 131,500 28,416
Aircraft Lake City Holdings (Pvt.) Ltd. 71,336,196 42,269,635 29,066,561 59,829,060 30,762,499 Negotiation Other party
Assets - written off Sugarcane roots 293,078,430 126,646,318 166,432,112 – – Company Policy –Other assets 22,478,857 11,284,897 11,193,960 – – - do - – 315,557,287 137,931,215 177,626,072 – – 2018 963,315,769 452,074,869 511,240,900 556,880,534 223,265,706 2017 - restated 346,655,671 174,073,495 172,852,176 82,823,382 45,407,772
Note 2018 2017 Rupees Rupees Restated
19.6 Capital work in progress As at 1 October 2,953,218,912 1,968,331,366 Addition during the year 19.6.1 1,748,873,191 2,339,356,215 Transfer made during the year (2,920,116,338) (1,354,468,669) As at 30 September 1,781,975,765 2,953,218,912 Break-up of closing balances is as follows: – Plant and machinery 1,152,000,117 1,307,887,240 – Advances to suppliers 377,876,534 1,158,378,319 – Building 240,296,410 291,771,841 – Roads & boundary walls 715,193 6,021,815 – Sugarcane roots 11,087,511 14,483,645 – Advances against the purchase of aircraft – 174,676,052 1,781,975,765 2,953,218,912
19.6.1 Additions to capital work in progress also include borrowing costs of Rs. 62.50 million (2017: Rs. 28.47 million) relating to specific borrowings at the rates ranging from 6.65% to 9.43% per annum (2017: 6.65% to 7.14% per annum).

JDW
Gro
up
162
2018 2017 Rupees Rupees
20 INVESTMENT PROPERTY
Balance as at 01 October 218,599,597 196,467,698 Transferred from operating fixed assets – 38,288,435 Disposal of investment property – (16,156,536) Balance as at 30 September 218,599,597 218,599,597 20.1 Investment property represents agricultural land given on operating lease, the fair value of the investment
property is Rs. 530 million (2017: Rs. 374 million). The fair value of investment property was determined by internal assessment and was arrived at by reference to market evidence of transaction prices for similar properties.
20.2 The amount of future lease rentals on agricultural contract and the period in which payments will become
due are as follows:
2018 2017 Rupees Rupees
Less than one year 12,430,800 7,625,300 Note 2018 2017 Rupees Rupees
21 INTANGIBLES
Goodwill 21.1 1,063,350,995 1,063,350,995 Oracle computer software 21.2 10,596,847 12,665,266 1,073,947,842 1,076,016,261 21.1 For impairment testing, the recoverable amount has been determined based on the recent value in use
calculations by discounting the four years cash flow projections at 14.49% per annum. Assumptions used in preparing the cash flows are based on past trends. The calculation of value in use is sensitive to discount rate and local inflation rates.
Note 2018 2017 Rupees Rupees
21.2 Oracle computer software Cost 22,747,279 22,747,279 Acquired during the year – – 22,747,279 22,747,279 Accumulated amortization As at 01 October 10,082,013 7,999,463 Amortization for the year 33 2,068,419 2,082,550 12,150,432 10,082,013 As at 30 September 10,596,847 12,665,266 Rate of amortization 10.00% 10.00%
22 LONG TERM INVESTMENT
This represents investment of the Holding Company of 47.37% in the equity of JDW Power (Private) Limited “JDWPL”, an unquoted associated company. The cost of investment is Rs 90 million represented by 9 million shares of Rs. 10 each. The carrying value of the investment is Rs. nil (2017: Rs. nil) due to accumulated impairment allowance of Rs. 90 million charged in year ended 30 September 2012.
Notes to the Consolidated Financial StatementsFor the year ended 30 September 2018

Fina
ncia
l Sta
tem
ents
Oth
er In
form
atio
nC
ompa
ny R
evie
w
Ann
ual R
epor
t 201
8
163
23 LONG TERM ADVANCES
This represents interest free soft loan given to Multan Electric Power Company (“MEPCO”) to meet 100 % expenses of grid interconnection Unit II of the Holding Company for Co-Generation Power. The loan is recoverable in 36 equal monthly instalments started after eighteen months from the commercial operation date i.e. 12 June 2014 for Unit II.
24 LONG TERM DEPOSITS
These mainly comprise of security deposits with leasing companies in respect of leasing facilities availed. This also includes an advance amounting to Rs. 4.54 million (2017: Rs. 4.54 million) due from JDW Aviation
(Pvt.) Limited. The maximum aggregate amount outstanding during the year with respect to month end balances amounts to Rs. 4.54 million.
25 BIOLOGICAL ASSETS
30 September 2018
Note Growing cane Wheat Guar Cotton Total
Rupees
At the beginning of the year at fair value 2,282,737,798 – – – 2,282,737,798 Fair value recorded in profit or loss 35.1 1,983,490,606 38,110,114 3,106,308 – 2,024,707,028 Transfer to cost of sales 32.1.1 (2,282,737,798) – – – (2,282,737,798) At the end of the year at fair value 1,983,490,606 38,110,114 3,106,308 – 2,024,707,028 30 September 2017
Note Growing cane Wheat Guar Cotton Total
Rupees
At the beginning of the year at fair value 2,229,977,882 – – 10,988,225 2,240,966,107 Fair value recorded in profit or loss 35.1 2,282,737,798 – – – 2,282,737,798 Transfer to cost of sales 32.1.1 (2,229,977,882) – – (10,988,225) (2,240,966,107) At the end of the year at fair value 2,282,737,798 – – – 2,282,737,798
25.1 Measurement of fair values
25.1.1 Fair value hierarchy
In absence of active market for sugarcane standing crops, the fair value measurement for the standing crop has been categorized as Level 3 fair value based on the inputs to the valuation techniques used. Fair value has been determined on the basis of a discounted cash flow model. The valuation model considers the present value of net cash flows expected to be generated by the plantation. The cash flow projections include specific estimates for next year which mainly include crop’s expected yield. The expected cash flows are discounted using a risk adjusted discount rate.
25.1.2 Level 3 fair values
The following table shows a break down of the total gains recognized in respect of Level 3 fair values: Note 2018 2017 Rupees Rupees Restated
Net fair value (loss) / gain recognized in other income 35 (108,958,903) 241,293,644
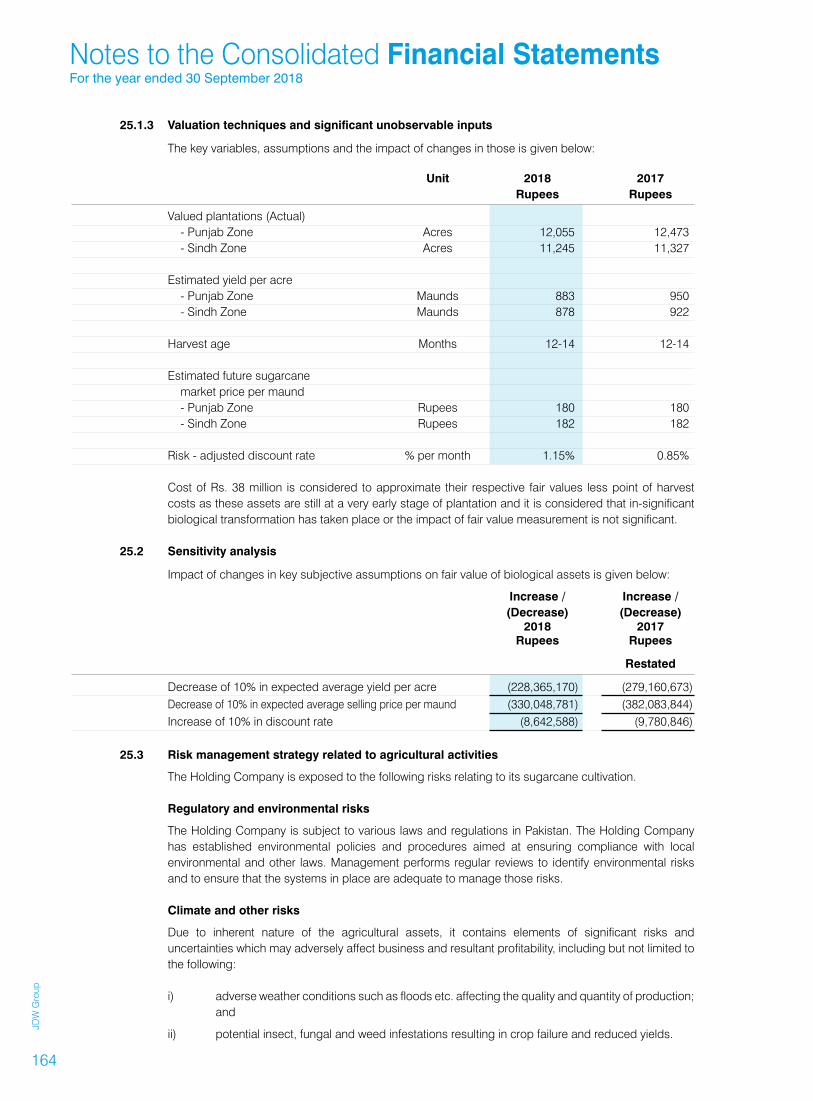
JDW
Gro
up
164
25.1.3 Valuation techniques and significant unobservable inputs
The key variables, assumptions and the impact of changes in those is given below: Unit 2018 2017 Rupees Rupees
Valued plantations (Actual) - Punjab Zone Acres 12,055 12,473 - Sindh Zone Acres 11,245 11,327 Estimated yield per acre - Punjab Zone Maunds 883 950 - Sindh Zone Maunds 878 922 Harvest age Months 12-14 12-14 Estimated future sugarcane market price per maund - Punjab Zone Rupees 180 180 - Sindh Zone Rupees 182 182 Risk - adjusted discount rate % per month 1.15% 0.85% Cost of Rs. 38 million is considered to approximate their respective fair values less point of harvest
costs as these assets are still at a very early stage of plantation and it is considered that in-significant biological transformation has taken place or the impact of fair value measurement is not significant.
25.2 Sensitivity analysis
Impact of changes in key subjective assumptions on fair value of biological assets is given below:
Increase / Increase / (Decrease) (Decrease) 2018 2017 Rupees Rupees
Restated
Decrease of 10% in expected average yield per acre (228,365,170) (279,160,673) Decrease of 10% in expected average selling price per maund (330,048,781) (382,083,844)
Increase of 10% in discount rate (8,642,588) (9,780,846) 25.3 Risk management strategy related to agricultural activities
The Holding Company is exposed to the following risks relating to its sugarcane cultivation. Regulatory and environmental risks
The Holding Company is subject to various laws and regulations in Pakistan. The Holding Company has established environmental policies and procedures aimed at ensuring compliance with local environmental and other laws. Management performs regular reviews to identify environmental risks and to ensure that the systems in place are adequate to manage those risks.
Climate and other risks
Due to inherent nature of the agricultural assets, it contains elements of significant risks and uncertainties which may adversely affect business and resultant profitability, including but not limited to the following:
i) adverse weather conditions such as floods etc. affecting the quality and quantity of production;
and
ii) potential insect, fungal and weed infestations resulting in crop failure and reduced yields.
Notes to the Consolidated Financial StatementsFor the year ended 30 September 2018

Fina
ncia
l Sta
tem
ents
Oth
er In
form
atio
nC
ompa
ny R
evie
w
Ann
ual R
epor
t 201
8
165
The Holding Company is principally dependent upon the Government’s measures for flood control. The Holding Company follows an effective preventive pesticide / insecticide / fungicide program and regularly monitors the crops for any infestations and takes immediate curative measures.
Supply and demand risk
The price of sugarcane is driven by consumer demand of sugar as well as Government’s intervention in setting of minimum / support price for the grower. Surplus production or bumper crop may result in a lower selling price hence affecting profitability of the Group adversely. The Group manages this risk by aligning its harvest volume to market supply and demand. Management performs regular industry trend analysis for projected harvest volume and analysis.
2018 2017 Rupees Rupees
26 STORES, SPARE PARTS AND LOOSE TOOLS
Stores - Sugar 751,784,481 773,107,446 - Co-Generation Power 74,458,884 99,173,556 - Corporate farms 289,409,796 258,111,983 1,115,653,161 1,130,392,985 Spares parts - Sugar 501,107,086 613,682,772 - Co-Generation Power 80,717,676 67,151,836 581,824,762 680,834,608 Loose tools - Sugar 39,233,770 35,601,660 - Co-Generation Power 12,293,655 11,902,009 51,527,425 47,503,669 1,749,005,348 1,858,731,262 Less: Provision for obsolescence (169,291,712) (146,318,585) 1,579,713,636 1,712,412,677
2018 2017 Rupees Rupees
27 STOCK-IN-TRADE
Sugar 22,919,216,684 10,787,855,518 Bagasse 1,333,717,228 530,172,587 Molasses – 13,762,764 24,252,933,912 11,331,790,869 27.1 Stock-in-trade upto a maximum amount of Rs. 20,071 million (2017: Rs. 9,129 million) are under
hypothecation of commercial banks as security for short term borrowings.

JDW
Gro
up
166
Note 2018 2017 Rupees Rupees Restated
28 TRADE DEBTS - UNSECURED
Considered good Local 28.1 5,684,669,588 3,294,827,101 Exports 28.2 433,847,528 – 6,118,517,116 3,294,827,101 Considered doubtful - local 39,203,083 39,203,083 6,157,720,199 3,334,030,184 Less: Provision for doubtful debts (39,203,083) (39,203,083) 6,118,517,116 3,294,827,101 28.1 This includes Rs. 3,241.66 million (2017: Rs. 1,321.04 million) receivable from Central Power Purchasing
Agency (Guarantee) Limited on account of sale of electricity under EPA. 28.2 This includes Rs. 433.84 million (2017: Rs. nil) receivable from foreign debtors in Asia. These are
secured against confirmed letter of credit.
Note 2018 2017 Rupees Rupees
29 ADVANCES, DEPOSITS, PREPAYMENTS AND OTHER RECEIVABLES
Advances to growers Unsecured - considered good 240,578,877 377,151,161 Unsecured - considered doubtful 4,937,966 4,937,966 245,516,843 382,089,127 Less: Provision for doubtful advances (4,937,966) (4,937,966) 240,578,877 377,151,161 Advances to suppliers and contractors Unsecured - considered good 531,819,641 412,115,175 Unsecured - considered doubtful 27,421,419 24,619,246 559,241,060 436,734,421 Less: Provision for doubtful advances (27,421,419) (24,619,246) 531,819,641 412,115,175 Advances to staff - unsecured, considered good - against salaries 29.1 & 29.2 10,845,725 11,727,993 - against expenses 4,663,254 7,504,071 Sugar export subsidy 1,975,978,100 43,800,000 Due from director - unsecured, considered good 29.3 22,372,086 – Due from related party 29.4 503,097,083 – Sales tax 197,135,371 792,010,998 Prepaid expenses 32,316,344 37,302,856 Current maturity of long term advances 23 5,166,670 19,088,890 Deposits 39,684,976 5,175,000 Receivables from provident fund – 10,162,266 Other receivables 19,955,252 18,575,626 3,583,613,379 1,734,614,036
Notes to the Consolidated Financial StatementsFor the year ended 30 September 2018

Fina
ncia
l Sta
tem
ents
Oth
er In
form
atio
nC
ompa
ny R
evie
w
Ann
ual R
epor
t 201
8
167
29.1 Advances given to staff are in accordance with the Holding Company’s policy. These advances are secured against provident fund. These includes an amount of Rs. 6.01 million (2017: Rs. 6.32 million) receivable from executives of the Holding Company.
29.2 These include advances made to employees of the Holding Company namely Safdar Kanjoo, Ghazanfar
Ali Syed and Zulfiqar Ali exceeding Rs. 1 million each. 29.3 This represents amount receivable on account of aircraft expenses amounting to Rs. 22.37 million
(2017: Rs. nil) due from Jahangir Khan Tareen, the director of the Group. The maximum aggregate amount outstanding during the year with respect to month end balances amounts to Rs. 22.37 million.
29.4 This amount includes receivables from JK Sugar Mills (Pvt.) Ltd., JK Dairies (Pvt.) Ltd. and ATF Mango
Farms (Pvt.) Ltd. of Rs. 466.157 million (2017: Rs. nil), Rs. 11.23 million (2017: Rs. nil) and Rs. 25.72 million (2017: Rs. nil) respectively.
Note 2018 2017 Rupees Rupees
30 CASH AND BANK BALANCES
At banks: - Current accounts - Balance with islamic banks 23,343,340 16,576,446 - Balance with conventional banks 96,288,517 146,274,759 119,631,857 162,851,205 - Saving accounts - Deposits with conventional banks 30.1 1,553,584 3,740,446 121,185,441 166,591,651 Cash in hand 4,444,576 4,113,245 125,630,017 170,704,896 30.1 The balances in saving accounts carry mark-up ranging from 3.75% to 5.5% per annum (2017: 3.75%
per annum).

JDW
Gro
up
168
Note 2018 2017 Rupees Rupees Restated
31 SALES - NET
Sugar 31.1 37,863,173,647 47,156,386,780 Agriculture produce 31.2 173,923,951 149,419,264 Electricity 31.3 4,775,322,653 4,523,028,533 Molasses - by product 31.4 3,158,894,485 3,222,800,417 Agri inputs 2,060,737,790 1,864,762,693 Bagasse - by product 433,025,114 137,317,872 48,465,077,640 57,053,715,559 Less: - Sales tax on sugar (3,429,356,070) (4,753,534,137) - Sales tax on electricity, bagasse, agri inputs and molasses (486,652,439) (651,866,076) - Commission and others (18,375,081) (17,013,034) (3,934,383,590) (5,422,413,247) 44,530,694,050 51,631,302,312 31.1 Sugar Local 27,701,904,069 43,008,505,478 Export 31.1.1 10,161,269,578 4,147,881,302 37,863,173,647 47,156,386,780 31.1.1 This includes sugar export subsidy of Rs. 2,541.95 million (2017: Rs. nil). 2018 2017 Rupees Rupees Restated
31.2 Agriculture produce Sugarcane seed and others 173,923,951 149,419,264 31.3 Electricity Captive Power – 141,957,423 Co-Generation Power - variable energy price 2,872,566,392 2,769,747,989 - fixed energy price 1,902,756,261 1,611,323,121 4,775,322,653 4,381,071,110 4,775,322,653 4,523,028,533 31.4 Molasses - by product Sales under DTRE (Duty & Tax Remission for Exporters) 2,872,615,560 2,621,409,376 Others 286,278,925 601,391,041 3,158,894,485 3,222,800,417
Notes to the Consolidated Financial StatementsFor the year ended 30 September 2018

Fina
ncia
l Sta
tem
ents
Oth
er In
form
atio
nC
ompa
ny R
evie
w
Ann
ual R
epor
t 201
8
169
Note 2018 2017 Rupees Rupees Restated
32 COST OF SALES
Opening stock-in-trade 11,331,790,869 5,287,410,535 Add: Cost of goods manufactured 32.1 54,165,750,251 52,571,265,346 65,497,541,120 57,858,675,881 Less: Closing stock - Sugar (22,919,216,684) (10,787,855,518) - Bagasse (1,333,717,228) (530,172,587) - Molasses – (13,762,764) (24,252,933,912) (11,331,790,869) 41,244,607,208 46,526,885,012
32.1 Cost of goods manufactured Cost of crops consumed (including procurement and other costs) 32.1.1 45,913,608,365 45,237,306,865 Salaries, wages and other benefits 32.1.2 2,098,561,709 2,145,531,378 Cost of agri inputs 1,735,002,744 1,424,342,557 Depreciation 19.4 1,263,224,108 1,137,429,513 Store and spares consumed 1,186,552,336 859,909,650 Packing materials consumed 445,575,591 386,692,688 Chemicals consumed 316,468,557 265,469,467 Operation and maintenance costs 32.1.3 220,935,421 211,527,800 Sugarcane roots written off 166,432,112 121,028,651 Cost of bagasse consumed 152,288,185 100,181,711 Vehicle running expenses 152,182,135 123,239,856 Insurance 87,312,229 90,134,075 Oil, lubricants and fuel consumed 85,684,090 86,595,739 Electricity and power 77,818,667 62,291,300 Repairs and maintenance 58,309,232 45,069,053 Handling and storage 50,871,093 35,732,370 Mud and bagasse shifting expenses 39,423,325 71,844,648 Freight and octroi 24,136,598 28,388,643 Provision for obsolescence 22,973,126 22,385,801 Printing and stationery 11,808,257 12,612,888 Assets written off 10,837,173 14,137,913 Telephone and fax 8,409,738 8,569,325 Initial land preparation 3,482,786 20,979,798 Travelling and conveyance 3,001,315 4,003,401 Operating lease rentals 1,632,519 23,831,824 Other expenses 29,218,840 32,028,432 54,165,750,251 52,571,265,346
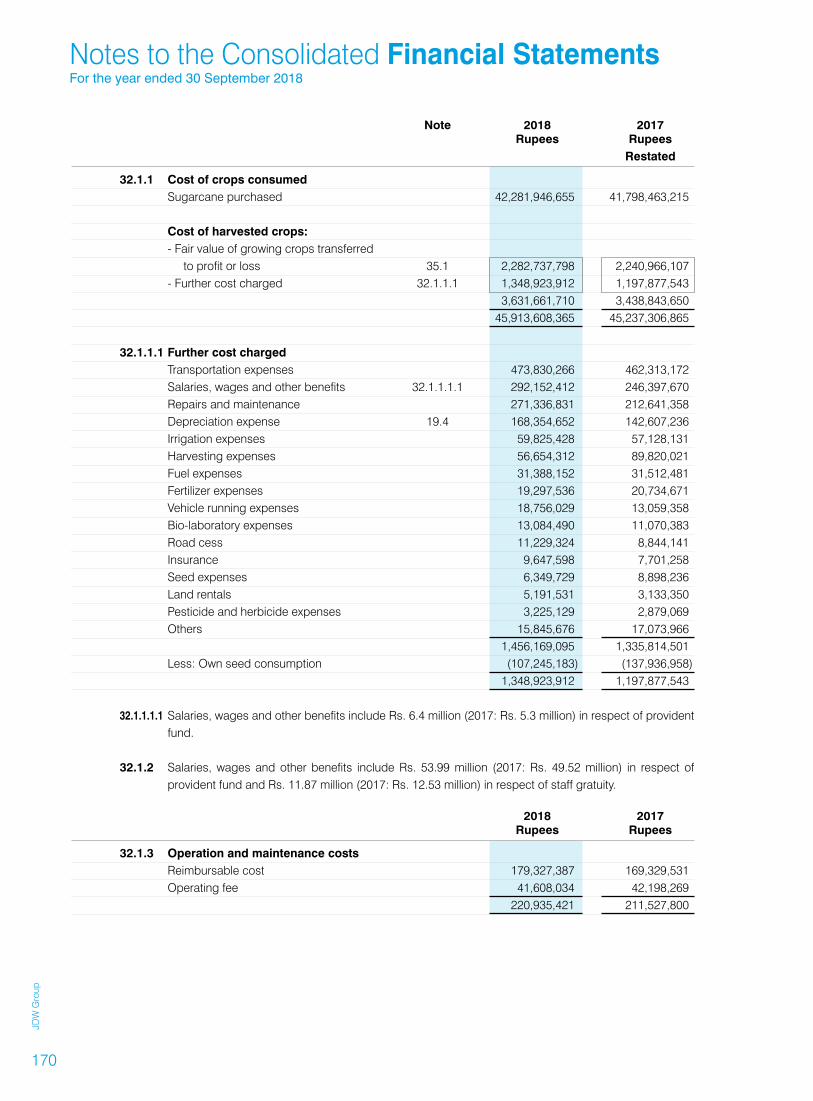
JDW
Gro
up
170
Note 2018 2017 Rupees Rupees Restated
32.1.1 Cost of crops consumed Sugarcane purchased 42,281,946,655 41,798,463,215 Cost of harvested crops: - Fair value of growing crops transferred to profit or loss 35.1 2,282,737,798 2,240,966,107 - Further cost charged 32.1.1.1 1,348,923,912 1,197,877,543 3,631,661,710 3,438,843,650 45,913,608,365 45,237,306,865
32.1.1.1 Further cost charged Transportation expenses 473,830,266 462,313,172 Salaries, wages and other benefits 32.1.1.1.1 292,152,412 246,397,670 Repairs and maintenance 271,336,831 212,641,358 Depreciation expense 19.4 168,354,652 142,607,236 Irrigation expenses 59,825,428 57,128,131 Harvesting expenses 56,654,312 89,820,021 Fuel expenses 31,388,152 31,512,481 Fertilizer expenses 19,297,536 20,734,671 Vehicle running expenses 18,756,029 13,059,358 Bio-laboratory expenses 13,084,490 11,070,383 Road cess 11,229,324 8,844,141 Insurance 9,647,598 7,701,258 Seed expenses 6,349,729 8,898,236 Land rentals 5,191,531 3,133,350 Pesticide and herbicide expenses 3,225,129 2,879,069 Others 15,845,676 17,073,966 1,456,169,095 1,335,814,501 Less: Own seed consumption (107,245,183) (137,936,958) 1,348,923,912 1,197,877,543 32.1.1.1.1 Salaries, wages and other benefits include Rs. 6.4 million (2017: Rs. 5.3 million) in respect of provident
fund. 32.1.2 Salaries, wages and other benefits include Rs. 53.99 million (2017: Rs. 49.52 million) in respect of
provident fund and Rs. 11.87 million (2017: Rs. 12.53 million) in respect of staff gratuity. 2018 2017 Rupees Rupees
32.1.3 Operation and maintenance costs Reimbursable cost 179,327,387 169,329,531 Operating fee 41,608,034 42,198,269 220,935,421 211,527,800
Notes to the Consolidated Financial StatementsFor the year ended 30 September 2018

Fina
ncia
l Sta
tem
ents
Oth
er In
form
atio
nC
ompa
ny R
evie
w
Ann
ual R
epor
t 201
8
171
Note 2018 2017 Rupees Rupees
33 ADMINISTRATIVE EXPENSES
Salaries, wages and other benefits 33.1 777,898,684 750,253,773 Charity and donations 33.2 76,372,530 161,148,270 Depreciation 19.4 69,719,521 54,603,750 Legal and professional services 47,905,319 73,092,853 Office rent and renovation 45,148,524 45,004,372 Travelling and conveyance 37,297,275 42,529,880 Vehicle running and maintenance 25,998,820 22,830,103 Repairs and maintenance 23,495,619 20,819,763 Fee and taxes 14,741,853 16,657,967 Subscription and renewals 13,608,823 6,334,696 Telephone, fax and postage 12,642,684 11,169,590 Insurance 11,957,973 11,172,537 Electricity and power 11,105,113 10,637,289 Printing and stationery 10,216,838 7,311,348 Auditors’ remuneration 33.3 6,677,800 6,475,350 Entertainment 4,415,485 4,096,377 Amortization 21.2 2,068,419 2,082,550 Advertisement 1,428,579 2,145,600 Assets written off 356,787 183,382 Arms and ammunition 258,900 – Newspapers, books and periodicals 178,213 203,422 Consultancy and advisory 35,676 4,613,299 Operating lease rentals – 3,863,095 Other expenses 2,149,867 16,315,758 1,195,679,302 1,273,545,024 33.1 Salaries, wages and other benefits include Rs. 20.07 million (2017: Rs. 18.68 million) in respect of
provident fund and Rs. 9.54 million (2017: Rs. 7.12 million) in respect of staff gratuity. 33.2 Donations for the year have been given to:
Note 2018 2017 Rupees Rupees
- Tareen Education Foundation 73,500,000 99,000,000 - National Rural Support Programme 1,372,530 6,348,270 - Lahore Race Club 850,000 – - Special Education and Training Centre – 1,000,000 - Shaukat Khanum Memorial Cancer Hospital and Research Centre – 20,000,000 - Lodhran Pilot Project – 29,000,000 - The Citizen Foundation – 5,000,000 - Others 33.2.1 650,000 800,000 76,372,530 161,148,270 None of the Directors of the Group or their spouses have any interest as Director in any of the recipients
of donations made by the Group during the year. 33.2.1 Others include donations paid to various institutions. The aggregate amount paid to a single institution
is less than Rs. 0.5 million.

JDW
Gro
up
172
2018 2017 Rupees Rupees
33.3 Auditors’ remuneration KPMG Taseer Hadi & Co. - Auditors’ of Holding Company Statutory audit 3,500,000 2,750,000 Half yearly review 500,000 500,000 Other certificates 740,000 198,500 Out of pocket expenses 250,000 285,000 Riaz Ahmed Saqib Gohar & Co. - Auditors’ of DSML, SPL & GPL Statutory audit 677,500 697,500 Tax certificates – 928,350 Other certificates 465,300 388,000 Out of pocket expenses 25,000 – A.F. Ferguson & Co. - Auditors’ of FPML Statutory audit 500,000 700,000 Out of pocket expenses 20,000 28,000 6,677,800 6,475,350 Note 2018 2017 Rupees Rupees
34 SELLING EXPENSES
Freight outwards and port charges 368,339,976 33,275,046 Salaries, wages and other benefits 34.1 38,167,656 35,363,483 Other selling expenses 32,679,924 21,882,146 439,187,556 90,520,675 34.1 Salaries, wages and other benefits include Rs. 0.53 million (2017: Rs. 0.64 million) in respect of provident
fund. Note 2018 2017 Rupees Rupees Restated
35 OTHER INCOME
Income from financial assets Foreign exchange gain 166,170,145 10,465,107 Mark-up on delayed payment from Central Power Purchasing Agency (Guarantee) Limited 44,305,469 32,133,474 Interest income on bank deposits 737,696 1,131,772 211,213,310 43,730,353 Income from non-financial assets Gain on sale of operating fixed assets 223,888,762 45,407,772 Sale of mud 161,479,471 107,374,023 Scrap sales 30,790,862 91,738,177 Rental income from investment property 12,430,800 7,625,300 Net fair value (loss) / gain on biological assets 25.1.2 & 35.1 (108,958,903) 241,293,644 Gain on sale of investment property – 21,280,886 Reversal of prior year provision of Workers’ Welfare Fund – 37,681,810 Others 3,392,287 2,766,374 323,023,279 555,167,986 534,236,589 598,898,339
Notes to the Consolidated Financial StatementsFor the year ended 30 September 2018

Fina
ncia
l Sta
tem
ents
Oth
er In
form
atio
nC
ompa
ny R
evie
w
Ann
ual R
epor
t 201
8
173
Note 2018 2017 Rupees Rupees Restated
35.1 Fair value (loss) / gain on biological assets - Fair value of growing crops 2,024,707,028 2,282,737,798 - Cost of growing crops 35.1.1 (2,133,665,931) (2,041,444,154) (108,958,903) 241,293,644 35.1.1 Cost of growing crops Land rentals 726,608,788 758,259,225 Irrigation expenses 317,981,533 247,612,968 Fertilizer expenses 274,164,272 230,703,159 Depreciation expense 19.4 255,743,882 249,092,623 Salaries, wages and other benefits 35.1.1.1 224,696,329 273,588,344 Repairs and maintenance 143,060,220 116,336,278 Pesticide and herbicide expenses 109,799,466 79,674,850 Fuel expenses 38,874,570 32,343,176 Vehicle running expenses 16,685,108 19,693,746 Bio-laboratory expenses 13,268,970 14,558,992 Insurance 3,892,070 12,695,863 Others 8,890,723 6,884,930 2,133,665,931 2,041,444,154 35.1.1.1 Salaries, wages and other benefits include Rs. 6.3 million (2017: Rs. 6.8 million) in respect of provident
fund.
Note 2018 2017 Rupees Rupees Restated
36 OTHER EXPENSES
Prior year adjustment of Workers’ Profit Participation Fund 16.2 5,237,703 – Loss on disposal of operating fixed asset 623,056 – Workers’ Profit Participation Fund 16.2 – 118,829,804 Workers’ Welfare Fund 16.3 – 18,510,840 Provision for doubtful trade debts / advances – 26,909,293 Others 1,719,837 5,136,698 7,580,596 169,386,635

JDW
Gro
up
174
Note 2018 2017 Rupees Rupees
37 FINANCE COST
Mark-up based loans from conventional banks - short term borrowings - secured 1,126,277,956 728,319,164 - long term finances - secured 737,347,545 795,524,941 - redeemable capital - secured 1,495,987 8,867,880 - finance leases 17,037,141 42,304,481 1,882,158,629 1,575,016,466 Islamic mode of financing - short term borrowings - secured 435,592,614 210,977,571 - long term finances - secured 345,756,831 85,621,985 781,349,445 296,599,556 Workers’ Profit Participation Fund 16.2 61,966,668 71,221,712 Bank charges and commission 59,040,146 42,271,339 121,006,814 113,493,051 Less: Borrowing costs capitalized (62,496,476) (28,471,915) 2,722,018,412 1,956,637,158
2018 2017 Rupees Rupees Restated
38 Taxation
Income tax - current year 231,108,589 444,737,947 - change in estimate related to prior years 45,309,573 61,332,787 276,418,162 506,070,734 Deferred tax (60,372,273) (121,126,327) 216,045,889 384,944,407 38.1 Tax Charge Reconciliation
Numerical reconciliation between tax expense and accounting profit:
(Loss) / profit before taxation (544,142,435) 2,213,226,147 Tax at 29% (2017: 30%) (157,801,306) 663,967,844 Tax effect of: - tax credits (278,312,616) (183,935,631) - permanent differences & not adjustable for tax purposes (306,183,027) (119,385,471) - income under final tax regime (FTR) 104,919,399 14,069,978 - minimum tax 402,199,799 – - change in estimate related to prior years 45,309,573 52,632,880 - asset not recognised on tax losses 146,983,767 – - deferred tax asset recognized on tax losses 255,226,838 – - others 3,703,462 (42,405,193) 216,045,889 384,944,407 38.2 As per management’s assessment, the provision for tax made in the consolidated financial statements
is sufficient. A comparison of last two years of income tax provisions with tax assessment is presented below:
Notes to the Consolidated Financial StatementsFor the year ended 30 September 2018

Fina
ncia
l Sta
tem
ents
Oth
er In
form
atio
nC
ompa
ny R
evie
w
Ann
ual R
epor
t 201
8
175
Tax provision Tax as per as per financial assessment / statements return Rupees Rupees
Tax Years 2017 138,419,011 160,350,460 2018 444,737,947 506,582,737 38.3 The two new high-pressure Co-Generation Power Plants have been set up by the Holding Company
under the Federal Government’s Framework for Power Co-Generation 2013 read with the Policy for Development of Renewable Energy for Power Generation, 2006.
As per the aforementioned policies, the Holding Company’s sale of electricity from the power plants to Central Power Purchasing Agency (Guarantee) Limited is exempt from income tax including turnover tax and withholding tax on imports, and for this purpose the new power generation units of the Holding Company shall be treated as separate entities.
However, the Holding Company is seeking clarification on whether existing notified exemptions for other power projects shall also apply to the Holding Company’s power projects or new exemptions shall be notified. In the meantime, the financial statements of the Holding Company including the power projects are being prepared under normal taxation regime.
38.4 For tax contingencies, refer note 18.1.
2018 2017 Rupees Rupees Restated
39 CASH GENERATED FROM OPERATIONS
(Loss) / profit before taxation (544,142,435) 2,213,226,147 Adjustments for non-cash and other items: Finance cost 2,714,652,728 1,956,637,158 Depreciation 1,750,390,905 1,482,961,864 Assets written off 177,283,482 135,349,946 Staff retirement benefits 123,412,006 101,250,458 Fair value loss / (gain) on biological assets 108,958,903 (241,293,644) Provision for obsolescence 22,973,127 22,385,801 Prior year adjustment of Workers’ Profit Participation Fund 5,237,703 – Amortization of intangibles 2,068,419 2,082,550 Gain on disposal of operating fixed assets (222,781,047) (45,407,772) Workers’ Profit Participation Fund – 118,829,804 Workers’ Welfare Fund – 18,510,840 Provision for doubtful trade debts / advances – 27,091,115 Gain on disposal of investment property – (21,280,886) Reversal of prior year provision of Workers’ Welfare Fund – (37,681,810) 4,682,196,226 3,519,435,424 Operating profit before working capital changes 4,138,053,791 5,732,661,571 (Increase) / decrease in current assets Stock-in-trade (12,921,143,043) (6,044,380,334) Biological assets 149,071,867 199,521,953 Trade debts (2,823,772,171) (2,428,720,434) Stores, spare parts and loose tools 109,725,914 (399,764,666) Advances, deposits, prepayments and other receivables (1,857,749,624) (215,549,715) (17,343,867,057) (8,888,893,196) Increase in current liabilities Trade and other payables 2,541,628,357 1,436,151,994 Cash used in operations (10,664,184,909) (1,720,079,631)

JDW
Gro
up
176
40 REMUNERATION OF CHIEF EXECUTIVE, DIRECTORS AND EXECUTIVES
The aggregate amount charged in the consolidated financial statements for the year for remuneration, including all benefits to the Chief Executive, Directors and Executives of the Group is as follows:
Directors
Chief Executive Executive Non - Executives Executives
2018 2017 2018 2017 2018 2017 2018 2017
Rupees Rupees Rupees Rupees Rupees Rupees Rupees Rupees
Managerial remuneration 840,000 840,000 80,000,000 85,000,000 54,200,000 56,500,000 306,865,560 264,557,571
House allowance 336,000 336,000 32,000,000 34,000,000 21,680,000 22,600,000 122,746,224 105,823,028
Utilities 84,000 84,000 8,000,000 8,500,000 5,420,000 5,650,000 30,686,556 26,455,757
Bonus - - 33,333,335 46,666,669 22,500,000 31,500,000 175,865,337 291,540,700
Group’s contribution towards provident fund - - - - - - 28,595,124 26,495,018
Staff retirement benefit - gratuity - - - - - - 2,230,502 2,824,587
1,260,000 1,260,000 153,333,335 174,166,669 103,800,000 116,250,000 666,989,303 717,696,661
Number of persons 1 1 1 1 2 2 69 58
In addition to the above, Chief Executive, one Director and some of the Executives are provided with free use of
Group’s maintained cars.
No meeting fee was paid to directors during the year (2017: Rs. nil).
Director is permitted to use the Holding Company maintained aircraft for private trips, subject to availability, for which the proportionate share of expenses is reimbursed to the Holding Company. During the year, the Director was charged Rs. 78.81 million (2017: Rs. 62.61 million) for the use of aircraft.
41 FINANCIAL INSTRUMENTS
The Group has exposure to the following risks from its use of financial instruments:
- Credit risk - Liquidity risk - Market risk
The Group’s overall risk management policy focuses on the unpredictability of financial markets and seeks to minimize potential adverse effects on the Group’s financial performance.
41.1 Risk management framework
The Board of Directors has overall responsibility for establishment and an oversight of the Group’s risk management framework. The executive management team is responsible for developing and monitoring the Group’s risk management policies. The team regularly meets and any changes and compliance issues are reported to the Board of Directors through the audit committee.
Risk management systems are reviewed regularly by the executive management team to reflect changes
in market conditions and the Group’s activities. The Group, through its training and management standards and procedures, aims to develop a disciplined and constructive control environment in which all employees understand their roles and obligations.
The audit committee oversees compliance by management with the Group’s risk management policies and procedures, and reviews the adequacy of the risk management framework in relation to the risks faced by the Group.
41.2 Credit risk
Credit risk is the risk of financial loss to the Group if a customer or counterparty to a financial instrument fails to meet its contractual obligations. To manage credit risk the Group maintains procedures covering the application for credit approvals, granting and renewal of counterparty limits and monitoring of exposures against these limits. As part of these processes the financial viability of all counterparties are regularly monitored and assessed.
Notes to the Consolidated Financial StatementsFor the year ended 30 September 2018

Fina
ncia
l Sta
tem
ents
Oth
er In
form
atio
nC
ompa
ny R
evie
w
Ann
ual R
epor
t 201
8
177
41.2.1 Exposure to credit risk
The carrying amount of financial assets represents the maximum credit exposure. The maximum exposure to credit risk at the statement of financial position date was:
2018 2017 Rupees Rupees
Long term advances – 3,272,223 Long term deposits 37,552,439 55,042,065 Trade debts 6,118,517,116 3,294,827,101 Advances, deposits and other receivables 601,121,792 54,567,509 Bank balances 121,185,441 166,591,651 6,878,376,788 3,574,300,549
41.2.2 Concentration of credit risk
The Group identifies concentration of credit risk by reference to type of counterparty. Maximum exposure to credit risk by type of counterparty is as follows:
2018 2017 Rupees Rupees
Customers 6,118,517,116 3,294,827,101 Banking companies 121,185,441 166,591,651 Others 638,674,231 112,881,797 6,878,376,788 3,574,300,549
41.2.3 Credit quality of financial assets
The credit quality of financial assets that are neither past due nor impaired can be assessed by reference to external credit ratings or to historical information about counterparty.
41.2.3.1 Trade debts - considered good
Majority of the Group’s sales are on advance basis and trade debts mainly represents receivable from Central Power Purchasing Agency (Guarantee) Limited a Government owned entity. Hence the management believes that no impairment allowance is necessary in respect of these trade debts.
2018 2017
Gross Accumulated Gross Accumulated carrying amount impairment carrying amount impairment
Rupees Rupees Rupees Rupees
The aging of trade receivables at the reporting date is:
Neither past due nor impaired 6,118,517,116 – 3,294,827,101 – Past due more than 365 days 39,203,083 39,203,083 39,203,083 39,203,083 6,157,720,199 39,203,083 3,334,030,184 39,203,083
Customer credit risk is managed subject to the Group’s established policy, procedures and controls
relating to customer credit risk management. Based on past experience the management believes that no further impairment allowance is necessary in respect of trade receivables as some receivables have been recovered subsequent to the year end and for other receivables there are reasonable grounds to believe that the amounts will be recovered in short course of time.

JDW
Gro
up
178
Bank balances
The Group’s exposure to credit risk against balances with various commercial banks is as follows: 2018 2017 Rupees Rupees
At banks: Current accounts 119,631,857 162,851,205 Saving accounts 1,553,584 3,740,446 121,185,441 166,591,651
The credit quality of Group’s bank balances can be assessed with reference to external credit rating agencies as follows:
Rating Rating 2018 2017
Long term Short term Agency Rupees Rupees Banks
Al-Baraka Bank (Pakistan) Limited A A1 PACRA 84,167 64,502 Allied Bank Limited AAA A1+ PACRA 946,450 9,167,236 Askari Bank Limited AA+ A1+ PACRA 915,060 185,206 Askari Bank Islamic Limited AA+ A1+ PACRA 8,365,715 34,475 Bank Al Habib Limited AA+ A1+ PACRA 76,815 17,691 Bank Alfalah Limited AA+ A1+ PACRA 635,561 2,793,911 Bank Alfalah Islamic Limited AA+ A1+ PACRA 3,189,309 9,748,089 Bank Islami Pakistan Limited A+ A1 PACRA 213,399 245,618 Dubai Islamic Bank Pakistan Limited AA- A-1 JCR-VIS 31,504 27,802 Faysal Bank Limited AA A1+ PACRA 181,086 20,196,877 Faysal Bank Limited (Islamic) AA A1+ PACRA 27,945 - Habib Bank Limited AAA A-1+ JCR-VIS 2,064,551 7,015,523 Habib Metropolitan Bank Limited AA+ A1+ PACRA 1,412,328 1,461,676 JS Bank Limited AA- A1+ PACRA 796,333 434,370 MCB Bank Limited AAA A1+ PACRA 37,353,253 33,811,773 MCB Islamic Bank Limited A A1 PACRA 3,035,674 3,534,295 Meezan Bank Limited AA+ A-1+ JCR-VIS 6,862,374 2,623,414 National Bank of Pakistan AAA A1+ PACRA 15,214,992 57,574,575 National Bank of Pakistan (Islamic) AAA A1+ PACRA 1,184,425 295,399 Silk Bank Limited A- A-2 JCR-VIS 28,420 20,571 Sindh Bank Limited AA A-1+ JCR-VIS 29,478 17,071 Soneri Bank Limited AA- A1+ PACRA 25,470 4,925,125 Summit Bank Limited A- A-1 JCR-VIS 10,251,810 2,562,677 The Bank of Khyber A A1 PACRA 92,747 24,030 The Bank of Punjab AA A1+ PACRA 26,347,356 9,397,725 The First Micro Finance Bank Limited A+ A-1 JCR-VIS 50,464 10,907 Tameer Bank Limited A+ A1 PACRA 38,458 38,905 United Bank Limited AAA A-1+ JCR-VIS 1,730,297 266,602 Standard Chartered Bank (Pakistan) Limited AAA A1+ PACRA – 95,606 121,185,441 166,591,651
Due to the Group’s long standing business relationships with these counterparties and after giving due
consideration to their strong financial standing, management does not expect non performance by these counterparties on their obligations to the Group. Accordingly, the credit risk is minimal.
Notes to the Consolidated Financial StatementsFor the year ended 30 September 2018

Fina
ncia
l Sta
tem
ents
Oth
er In
form
atio
nC
ompa
ny R
evie
w
Ann
ual R
epor
t 201
8
179
41.3 Liquidity risk
Liquidity risk is the risk that the Group will not be able to meet its financial obligations as they fall due. The Group’s approach to managing liquidity is to ensure, as far as possible, that it will always have sufficient liquidity to meet its liabilities when due, under both normal and stressed conditions. For this purpose the Group has sufficient running finance facilities available from various commercial banks to meet its liquidity requirements. Further liquidity position of the Group is closely monitored through budgets, cash flow projections and comparison with actual results by the Board.
41.3.1 Exposure to liquidity risk
41.3.1(a) Contractual maturities of financial liabilities, including estimated interest payments.
2018
Carrying Contractual One year One to More than amount cash flows or less five years five years
Rupees
Non-derivative financial liabilities Long term finances - secured 15,656,462,987 19,084,281,474 6,236,952,774 12,847,328,700 – Short term borrowings - secured 27,855,950,339 28,319,840,819 28,319,840,819 – – Liabilities against assets subject to finance lease - secured 249,959,511 267,992,731 115,129,719 152,863,012 – Accrued profit / interest / mark-up 642,496,578 642,496,578 642,496,578 – – Trade and other payables 2,747,399,496 2,747,399,496 2,747,399,496 – – 47,152,268,911 51,062,011,098 38,061,819,386 13,000,191,712 –
2017
Carrying Contractual One year One to More than amount cash flows or less five years five years
Rupees
Non-derivative financial liabilities Redeemable capital - secured 83,333,333 84,818,000 84,818,000 – – Long term finances - secured 13,532,285,027 15,585,355,493 4,273,226,380 11,312,129,113 – Short term borrowings - secured 13,783,388,645 14,014,094,811 14,014,094,811 – – Liabilities against assets subject to finance lease - secured 306,472,177 323,440,763 165,224,811 158,215,952 – Accrued profit / interest / mark-up 277,241,631 277,241,631 277,241,631 – – Trade and other payables 1,903,586,826 1,903,586,826 1,903,586,826 – – 29,886,307,639 32,188,537,524 20,718,192,459 11,470,345,065 –
41.4 Market risk
Market risk is the risk that changes in market prices, such as foreign exchange rates, interest rates and equity prices will affect the Group’s income or the value of its holdings of financial instruments. The objective of market risk management is to manage and control market risk exposures within acceptable parameters, while optimizing the return.
41.4.1 Currency risk
Currency risk is the risk that fair values or future cash flows of a financial instrument will fluctuate because of changes in foreign exchange rates. Currency risk arises from sales, purchases and resulting balances that are denominated in a currency other than functional currency. The Group is not exposed to foreign currency risk as at the reporting date.

JDW
Gro
up
180
41.4.2 Interest rate risk
The effective interest / mark-up rates for interest / mark-up bearing financial instruments are mentioned in relevant notes to the financial statements. The Group’s interest / mark-up bearing financial instruments as at the reporting date are as follows:
2018 2017
Financial Financial Financial Financial asset liability asset liability
Non-derivative financial instruments Note Rupees Rupees Rupees Rupees
Redeemable capital - secured 9 – – – 83,333,333 Long term finances - secured 10 – 15,656,462,987 – 13,532,285,027 Liabilities against assets subject to finance lease - secured 11 – 249,959,511 – 306,472,177 Short term borrowings - secured 14 – 27,855,950,339 – 13,783,388,645 Cash at bank 30.1 1,553,584 – 3,740,446 – Variable rate instruments 1,553,584 43,762,372,837 3,740,446 27,705,479,182 The Group does not account for any fixed rate financial assets and liabilities at fair value through profit
or loss. Therefore a change in interest rates at the reporting date would not affect statement of profit or loss.
Cash flow sensitivity analysis for variable rate instruments A change of 100 basis points in interest rates at the reporting date would have increased / (decreased)
profit for the year by the amounts shown below. This analysis assumes that all other variables, in particular foreign currency rates, remain constant. The analysis is performed on the same basis for 2018.
Profit or loss 100 bps
2018 2017 Increase Decrease Increase Decrease Rupees
(437,608,193) 437,608,193 (277,017,387) 277,017,387 The sensitivity analysis prepared is not necessarily indicative of the effects on profit for the year and
assets / liabilities of the Group. 41.4.3 Interest rate risk management
The Group manages these mismatches through risk management strategies where significant changes in gap position can be adjusted. The long and short term borrowing and loans and advances by the Group has variable rate pricing that is mostly dependent on Karachi Inter Bank Offered Rate (“KIBOR”) as indicated in respective notes.
41.4.4 Other price risk
Other price risk is the risk that the fair value or future cash flows of a financial instrument will fluctuate because of changes in market prices (other than those arising from interest rate risk or currency risk). The Group is not exposed to other price risk.
Notes to the Consolidated Financial StatementsFor the year ended 30 September 2018

Fina
ncia
l Sta
tem
ents
Oth
er In
form
atio
nC
ompa
ny R
evie
w
Ann
ual R
epor
t 201
8
181
41.4.5 Fair values
Fair value is the price that would be received to sell an asset or paid to transfer a liability in an orderly transaction between market participants at the measurement date.
Underlying the definition of fair value is the presumption that the Group is a going concern without any intention or requirement to curtail materially the scale of its operations or to undertake a transaction on adverse terms.
The fair value of financial assets and liabilities traded in active markets i.e. listed equity shares are based on the quoted market prices at the close of trading on the period end date. The quoted market prices used for financial assets held by the Group is current bid price.
A financial instrument is regarded as quoted in an active market if quoted prices are readily and regularly available from an exchange, dealer, broker, industry group, pricing service or regulatory agency and those prices represent actual and regularly occurring market transactions on an arm’s length basis.
IFRS 13, ‘Fair Value Measurements’ requires the Group to classify fair value measurements using a fair value hierarchy that reflects the significance of the inputs used in making the measurements. The fair value hierarchy has the following levels:
- Quoted prices (unadjusted) in active markets for identical assets or liabilities that the entity can
access at the measurement date (level 1).
- Inputs other than quoted prices included within Level 1 that are observable for the asset or liability, either directly or indirectly (level 2).
- Unobservable inputs for the asset or liability (level 3).
41.4.5.1 Fair value measurement of financial instruments
The following table shows the carrying amounts and fair values of financial instruments and non-financial instruments including their levels in the fair value hierarchy:
Carrying amount Fair value
Loans and Financial
receivables at liabilities at Total Level 1 Level 2 Level 3
Note amortized cost amortized cost
On-balance sheet financial instruments Rupees
30 September 2018
Financial assets measured at fair value – – – – – –
Financial assets not measured at fair value
Long term advances – – – – – –
Long term deposits 37,552,439 – 37,552,439 – – –
Trade debts - unsecured considered good 6,118,517,116 – 6,118,517,116 – – –
Advances, deposits and other receivables 601,121,792 – 601,121,792 – – –
Cash and bank balances 125,630,017 – 125,630,017 – – –
41.4.5.2 6,882,821,364 – 6,882,821,364 – – –
Financial liabilities measured at fair value – – – – – –
Financial liabilities not measured at fair value
Redeemable capital - secured – – – – – –
Long term finances - secured – 15,656,462,987 15,656,462,987 – – –
Short term borrowings - secured – 27,855,950,339 27,855,950,339 – – –
Liabilities against assets
subject to finance lease - secured – 249,959,511 249,959,511 – – –
Accrued profit / interest / mark-up – 642,496,578 642,496,578 – – –
Trade and other payables – 2,747,399,496 2,747,399,496 – – –
41.4.5.2 – 47,152,268,911 47,152,268,911 – – –

JDW
Gro
up
182
Carrying amount Fair value
Loans and Financial
receivables at liabilities at Total Level 1 Level 2 Level 3
Note amortized cost amortized cost
On-balance sheet financial instruments Rupees 30 September 2017
Financial assets measured at fair value – – – – – –
Financial assets not measured at fair value
Long term advances 3,272,223 – 3,272,223 – – –
Long term deposits 55,042,065 – 55,042,065 – – –
Trade debts - unsecured considered good 3,294,827,101 – 3,294,827,101 – – –
Advances, deposits and other receivables 54,567,509 – 54,567,509 – – –
Cash and bank balances 170,704,896 – 170,704,896 – – –
42.4.5.2 3,578,413,794 – 3,578,413,794 – – –
Financial liabilities measured at fair value – – – – – –
Financial liabilities not measured at fair value
Redeemable capital - secured – 83,333,333 83,333,333 – – –
Long term finances - secured – 13,532,285,027 13,532,285,027 – – –
Short term borrowings - secured – 13,783,388,645 13,783,388,645 – – –
Liabilities against assets
subject to finance lease - secured – 306,472,177 306,472,177 – – –
Accrued profit / interest / mark-up – 277,241,631 277,241,631 – – –
Trade and other payables – 1,903,586,826 1,903,586,826 – – –
42.4.5.2 – 29,886,307,639 29,886,307,639 – – –
41.4.5.2 Fair value versus carrying amounts
The Group has not disclosed the fair values of these financial assets and liabilities as these are for short term or repriced over short term. Therefore, their carrying amounts are reasonable approximation of fair value.
42 CAPITAL MANAGEMENT
The Board’s policy is to maintain an efficient capital base so as to maintain investor, creditor and market confidence and to sustain the future development of its business. The Board of Directors monitors the return on capital employed, which the Group defines as operating income divided by total capital employed. The Board of Directors also monitors the level of dividends to ordinary shareholders.
The Group’s objectives when managing capital are:
a) to safeguard the entity’s ability to continue as a going concern, so that it can continue to provide returns for shareholders and benefits for other stakeholders, and
b) to provide an adequate return to shareholders.
The Group manages the capital structure in the context of economic conditions and the risk characteristics of the underlying assets. In order to maintain or adjust the capital structure, the Group may, for example, adjust the amount of dividends paid to shareholders, issue new shares, or sell assets to reduce debt.
2018 2017 Rupees Rupees
Total Debt 44,404,869,415 27,982,720,813 Less: Cash and bank balances (125,630,017) (170,704,896)Net Debt 44,279,239,398 27,812,015,917 Total Equity 8,829,313,675 9,776,016,698 Total Capital Employed 53,108,553,073 37,588,032,615
Gearing 83% 74%
Total debt comprises of long term loans from banking companies, liabilities against assets subject to finance lease, short term borrowings and accrued mark-up.
Total equity includes issued, subscribed and paid-up share capital, share premium reserves and accumulated profits.
Notes to the Consolidated Financial StatementsFor the year ended 30 September 2018

Fina
ncia
l Sta
tem
ents
Oth
er In
form
atio
nC
ompa
ny R
evie
w
Ann
ual R
epor
t 201
8
183
2018 2017 Rupees Rupees
43 NON-CONTROLLING INTEREST (NCI)
NCI percentage 41.10% 41.10% Non-current assets 1,108,304,542 1,118,283,814 Current assets 104,339,007 103,251,395 Non-current liabilities – (6,754,179) Current liabilities (42,335,367) (38,881,941) Net assets 1,170,308,182 1,175,899,089 Net assets attributable to NCI 480,996,663 483,294,526
Revenue – – Loss (5,302,875) (8,360,225) Other comprehensive income (OCI) – 442,940 Total comprehensive income (5,302,875) (7,917,285) Loss allocated to NCI (2,179,482) (3,436,052) OCI allocated to NCI – 182,048
Cash flows from operating activities (6,604,972) (11,193,237) Cash flows from investment activities 7,564,130 10,482,500 Net increase in cash and cash equivalents 959,158 (710,737)
44 TRANSACTIONS WITH RELATED PARTIES
The related parties comprise of associated company, other related companies, directors of the Group and entities under common directorship, key management personnel and post employment benefit plans. Amounts due from and due to related parties are shown under respective notes to these consolidated financial statements. Other significant transactions with related parties except those disclosed elsewhere are as follows:
2018 2017 Relationship Nature of transactions Rupees Rupees
Associated Company (Common directorship)
- JDW Aviation (Pvt.) Limited Reimbursement of expenses 13,580,726 15,435,344 - ATF Mango Farms (Pvt.) Limited Sale of property plant and equipment 27,400 –
Other Related Parties
- Post Employment Benefit Plans Provident fund contribution 178,976,571 164,813,441 Payment to recognised gratuity fund 10,417,866 103,648,576 - Key Management Personnel Consultancy services 11,495,496 13,091,751
For remuneration and other benefits of Chief Executive, Executive Director and Non-Executive Directors, refer note 40.
2018 2017 Tonnes Tonnes
45 CAPACITY AND PRODUCTION
Sugar Holding Company: a) Unit I - Crushing capacity 3,000,000 3,000,000 - Sugar production 409,507 357,733 b) Unit II - Crushing capacity 1,500,000 1,500,000 - Sugar production 255,879 247,926

JDW
Gro
up
184
2018 2017 Tonnes Tonnes
c) Unit III - Crushing capacity 2,100,000 2,100,000 - Sugar production 223,325 207,747
Subsidiary Company - DSML: - Crushing capacity 1,950,000 1,950,000 - Sugar production 205,788 205,041 The crushing capacity is based on 150 days (2017: 150 days).
2018 2017 MWh MWh
Co - Generation Power: a) Unit II - Installed capacity (based on 8,760 hours) 233,016 233,016 - Energy generated / produced 211,109 210,593 - Energy delivered to Central Power Purchasing Agency (Guarantee) Limited 176,740 176,561 b) Unit III - Installed capacity (based on 8,760 hours) 235,031 235,031 - Energy generated / produced 210,533 199,005 - Energy delivered to Central Power Purchasing Agency (Guarantee) Limited 187,007 169,778
2018 2017
Corporate Farms Area Acres Area Acres
Land Punjab & Sindh 30,590 Punjab & Sindh 32,287 Land under cultivation Punjab & Sindh 23,300 Punjab & Sindh 22,208
Capacity Actual production Metric Tonnes Metric Tonnes Paper Pulp 2018 2017 2018 2017 Subsidiary Company - FPML 47,600 47,600 – – 46 BUSINESS SEGMENT INFORMATION
46.1 The Group has four reportable segments, as described below, which are the Group’s strategic divisions. The strategic divisions offer different products and services, and are managed separately because they require different technology and marketing strategies. Information reported to the Group’s chief operating decision maker for the purpose of resource allocation and assessment of segment performance is focused on type of goods supplied. The following summary describes the operations in each of the Group’s reportable segments that is submitted to chief operating decision maker:
Reportable Segment Operations
Sugar Production and sale of crystalline sugar and other related joint and by- products. Co-Generation Generation and sale of electricity to Central Power Purchasing Agency (Guarantee) Limited Corporate farms Managing corporate farms for cultivation of sugarcane and the small quantity of cotton, guar and wheat. Others Project under construction for manufacture / generation and sale of wood pulp and electricity.
Notes to the Consolidated Financial StatementsFor the year ended 30 September 2018

Fina
ncia
l Sta
tem
ents
Oth
er In
form
atio
nC
ompa
ny R
evie
w
Ann
ual R
epor
t 201
8
185
46.2
In
form
atio
n re
gard
ing
the
Gro
up’s
repo
rtab
le s
egm
ents
is p
rese
nted
bel
ow:
Suga
r C
o-G
ener
atio
n C
orpo
rate
farm
s O
ther
In
ter s
egm
ent r
econ
cilia
tion
Tota
l
2018
20
17
2018
20
17
2018
20
17
2018
20
17
2018
20
17
2018
20
17
R
upee
s R
upee
s R
upee
s R
upee
s R
upee
s R
upee
s R
upee
s R
upee
s R
upee
s R
upee
s R
upee
s R
upee
s
Res
tate
d
Res
tate
d
Res
tate
d
Res
tate
d
Res
tate
d
Res
tate
d
46.2
.1
Segm
ent r
even
ue a
nd re
sults
Ne
t exte
rnal
reve
nue
39,
999,
345,
222
4
7,50
2,73
7,61
8
4,3
57,4
24,8
77
3,9
79,1
45,4
29
173
,923
,951
1
49,4
19,2
65
–
–
–
–
44,5
30,6
94,0
50
51,
631,
302,
312
In
ter–
segm
ent r
even
ue
2,4
06,5
09,6
98
2,3
43,0
71,0
77
1,2
17,3
96,1
27
1,4
89,1
15,3
01
3,0
85,4
05,7
21
3,4
85,9
68,1
13
–
–
(6,7
09,3
11,5
46)
(7,3
18,1
54,4
91)
–
–
Re
porta
ble
segm
ent r
even
ue
42,
405,
854,
920
4
9,84
5,80
8,69
5
5,5
74,8
21,0
04
5,4
68,2
60,7
30
3,2
59,3
29,6
72
3,6
35,3
87,3
78
–
–
(6,7
09,3
11,5
46)
(7,3
18,1
54,4
91)
44,
530,
694,
050
5
1,63
1,30
2,31
2
De
prec
iatio
n 1
,035
,481
,079
8
78,1
86,9
75
293
,496
,200
3
12,9
48,8
59
425
,150
,942
3
92,5
97,2
88
2,9
13,9
42
–
–
–
1
,757
,042
,163
1
,583
,733
,122
Fi
nanc
e co
st
2,1
34,6
85,5
89
1,4
30,5
53,9
85
398
,204
,643
3
36,2
55,4
41
188
,904
,266
1
89,7
61,0
00
223
,914
6
6,73
2
–
–
2,7
22,0
18,4
12
1,9
56,6
37,1
58
Se
gmen
t (lo
ss) /
pro
fit be
fore
tax
(1,5
93,3
67,0
27)
115
,818
,436
1
,910
,423
,319
2
,039
,658
,102
(8
48,6
25,9
35)
83,
834,
253
(1
2,57
2,79
2)
(26,
084,
644)
–
–
(5
44,1
42,4
35)
2,2
13,2
26,1
47
46.2
.2
Inte
r-se
gmen
t sal
es a
nd p
urch
ases
In
ter-s
egm
ent s
ales
and
pur
chas
es h
ave
been
elim
inat
ed fr
om to
tal fi
gure
s.
46.2
.3
Bas
is o
f int
er-s
egm
ent p
ricin
g
In
ter-s
egm
ent p
ricin
g is
det
erm
ined
on
an a
rm’s
leng
th b
asis
.
46.2
.4
Segm
ent a
sset
s &
liab
ilitie
s
Suga
r
Co-
Gen
erat
ion
Cor
pora
te fa
rms
Oth
er
Inte
r seg
men
t rec
onci
liatio
n To
tal
2018
20
17
2018
20
17
2018
20
17
2018
20
17
2018
20
17
2018
20
17
R
upee
s R
upee
s R
upee
s R
upee
s R
upee
s R
upee
s R
upee
s R
upee
s R
upee
s R
upee
s R
upee
s R
upee
s
Res
tate
d
Res
tate
d
Res
tate
d
Res
tate
d
Res
tate
d
Res
tate
d
Tota
l ass
ets
for r
epor
tabl
e se
gmen
t 5
4,60
5,37
4,88
8
37,9
97,1
10,1
68
9,5
91,9
57,4
32
8,1
90,6
23,6
44
7,5
48,0
35,3
84
8,3
31,0
80,5
44
2,1
70,4
41,1
03
2,1
71,0
65,7
10
(6,7
09,3
11,5
46)
(7,3
18,1
54,4
91)
67,
206,
497,
261
4
9,37
1,72
5,57
5
To
tal li
abilit
ies fo
r rep
orta
ble
segm
ent
57,
937,
838,
310
3
9,89
7,38
1,65
0
5,9
18,8
11,0
96
5,7
33,7
69,7
19
706
,192
,037
7
53,8
99,7
35
42,
657,
027
4
5,63
6,12
0
(6,7
09,3
11,5
46)
(7,3
18,1
54,4
91)
57,
896,
186,
924
3
9,11
2,53
2,73
3
Ca
pita
l exp
endi
ture
3
,496
,410
,942
2
,302
,881
,168
3
,132
,752
9
,241
,885
4
57,3
19,6
44
583
,974
,450
–
–
–
–
3
,956
,863
,338
2
,896
,097
,503

JDW
Gro
up
186
2018 2017 Rupees Rupees Restated
46.3 Reconciliation of reportable segment profit or loss Total (loss) / profit before tax for reportable segments (544,142,435) 2,213,226,147 Unallocated corporate expenses (216,045,889) (384,944,407) (Loss) / profit after taxation (760,188,324) 1,828,281,740 46.4 Geographical information
The segments of the Group are managed on nationwide basis except export sale. Geographical information relating to segment is presented below:
2018 2017 Rupees Rupees Restated
46.4.1 Revenue Foreign revenue Asia and Africa 10,161,269,578 4,147,881,302 Local revenue Pakistan 38,303,808,062 52,905,834,257 48,465,077,640 57,053,715,559 46.4.2 Non-current assets All non-current assets of the Group as at 30 September 2018 are located in Pakistan.
47 PROVIDENT FUND TRUST
The following information is based on latest audited financial statements of Provident Fund Trust of the Group. 30 June 30 June
Unit 2018 2017
Size of fund - total assets Rupees 568,589,261 588,111,988 Cost of investments made Rupees 532,508,176 530,052,024 Percentage of investments made Percentage 93.65% 90.13% Fair value of investment Rupees 536,805,343 564,976,492 The breakup of cost of investments is as follows:
30 June 2018 30 June 2017
Rupees Percentage Rupees Percentage
Investments in mutual funds 119,500,000 22.44% 265,500,000 50.09%Certificate of investment and term deposits receipts 175,733,562 33.00% 137,068,994 25.86%Shares in listed companies 17,465,713 3.28% 16,286,227 3.07%Cash at bank 219,808,901 41.28% 111,196,803 20.98% 532,508,176 100% 530,052,024 100%
The investments of the Provident Fund Trust are in compliance with the provision of section 218 of the Companies Act, 2017 and the rules formulated for this purpose.
Notes to the Consolidated Financial StatementsFor the year ended 30 September 2018

Fina
ncia
l Sta
tem
ents
Oth
er In
form
atio
nC
ompa
ny R
evie
w
Ann
ual R
epor
t 201
8
187
48
RE
CO
NC
ILIA
TIO
N O
F M
OV
EM
EN
TS O
F LI
AB
ILIT
IES
TO
CA
SH
FLO
WS
AR
ISIN
G F
RO
M F
INA
NC
ING
AC
TIV
ITIE
S
2018
Eq
uity
Li
abili
ties
Issu
ed,
Shar
e Un
clai
med
Re
deem
able
Lo
ng te
rm
Liab
ilitie
s Sh
ort t
erm
Ac
crue
d
su
bscr
ibed
pr
emiu
m
Divi
dend
ca
pita
l -
finan
ces
- ag
ains
t bo
rrow
ings
pr
ofit /
and
paid
- up
se
cure
d se
cure
d as
sets
sub
ject
- s
ecur
ed
inte
rest
/
ca
pita
l
to
fina
ncia
l
mar
k-up
le
ase
- sec
ured
Rupe
es
Ba
lanc
e as
at 0
1 O
ctob
er 2
017
597
,766
,610
6
78,3
16,9
28
64,
248,
402
8
3,33
3,33
3
13,
532,
285,
027
3
06,4
72,1
77
13,
783,
388,
645
2
77,2
41,6
31
Ch
ange
s fro
m fi
nanc
ing
cash
flow
s
Lo
ans
rece
ived
durin
g th
e ye
ar
–
–
– –
5
,494
,149
,322
–
4
2,70
2,70
0,65
7
–
Di
viden
ds p
aid
– –
(209
,505
,570
) –
– –
– –
Lo
an re
paid
dur
ing th
e ye
ar
– –
–
(8
3,33
3,33
3)
(3,3
69,9
71,3
62)
(167
,527
,210
) (3
0,80
3,40
2,21
3)
–
–
–
(209
,505
,570
) (8
3,33
3,33
3)
2,1
24,1
77,9
60
(167
,527
,210
) 1
1,89
9,29
8,44
4
–
O
ther
cha
nges
- Li
abili
ty re
late
d
In
tere
st e
xpen
se fo
r the
year
–
–
–
–
–
–
–
2,6
97,0
59,9
43
In
tere
st p
aid d
uring
the
year
–
–
–
–
–
–
–
(2
,331
,804
,996
)
Di
viden
d ap
prov
ed
–
–
1
79,3
29,9
83
–
–
–
–
–
Ne
t cha
nge
in ca
sh a
nd c
ash
equiv
alent
–
–
–
–
–
–
2,1
73,2
63,2
50
–
As
sets
acq
uired
on
finan
ce le
ase
–
–
–
–
–
111
,014
,544
–
–
To
tal l
iabi
lity-
rela
ted
othe
r cha
nges
–
–
1
79,3
29,9
83
–
–
111
,014
,544
2
,173
,263
,250
3
65,2
54,9
47
Ba
lanc
e as
at 3
0 Se
ptem
ber 2
018
597
,766
,610
6
78,3
16,9
28
34,
072,
815
–
1
5,65
6,46
2,98
7
249
,959
,511
2
7,85
5,95
0,33
9
642
,496
,578

JDW
Gro
up
188
49 IMPACT OF RESTATEMENTS ON FINANCIAL STATEMENTS
The impact of the application of the revised standards as stated in note 5.2 and the impact of rate revision by NEPRA as stated in 5.9 on the Group’s financial results and financial position is disclosed below:
Effects of restatement on financial statements as at 30 September 2016
As per audited Effect of Restated financial statements restatements amount
Rupees
Statement of financial position Accumulated profit 7,957,485,567 214,828,442 8,172,314,009 Trade debts - unsecured 1,046,012,899 (155,189,290) 890,823,609 Biological assets - non-current assets 7,279,311 (7,279,311) – Property, plant and equipment 24,203,769,418 377,297,043 24,581,066,461
Effects of restatement on financial statements for the year ended 30 September 2017
As per audited Effect of Restated financial statements restatements amount
Rupees
Statement of financial position Accumulated profit 8,309,276,127 190,657,033 8,499,933,160 Property, plant and equipment 26,248,589,291 417,771,278 26,666,360,569 Trade debts - unsecured 3,588,040,356 (293,213,255) 3,294,827,101 Biological assets - non-current assets 14,595,399 (14,595,399) – Advance tax - net 818,893,090 6,454,393 825,347,483 Deferred taxation 1,808,456,552 (64,483,630) 1,743,972,922 Trade and other payables 9,294,974,047 (9,756,386) 9,285,217,661 Statement of Profit or loss Gross sales 57,191,739,524 (138,023,965) 57,053,715,559 Cost of sales (46,396,148,583) (130,736,429) (46,526,885,012) Other expenses (152,233,728) (17,152,907) (169,386,635) Other income 435,003,763 163,894,576 598,898,339 Taxation (455,882,430) 70,938,023 (384,944,407) Statement of Cash flow Profit before taxation 2,308,335,579 (95,109,432) 2,213,226,147 Adjustments for non-cash and other items 3,572,078,330 (52,642,906) 3,519,435,424 (Increase) / decrease in current assets (9,198,127,825) 309,234,629 (8,888,893,196) Cash flows from investing activities (3,295,819,928) (161,482,291) (3,457,302,219)
Notes to the Consolidated Financial StatementsFor the year ended 30 September 2018

Fina
ncia
l Sta
tem
ents
Oth
er In
form
atio
nC
ompa
ny R
evie
w
Ann
ual R
epor
t 201
8
189
50 NUMBER OF EMPLOYEES
The average and total number of employees are as follows:
Total employees
2018 2017 Average number of employees during the year 8,249 9,351 Total number of employees as at 30 September 6,968 7,590 Factory employees
2018 2017 Average number of employees during the year 7,985 9,091 Total number of employees as at 30 September 6,707 7,322 51 DATE OF AUTHORIZATION FOR ISSUE
These consolidated financial statements were authorized for issue on 07 January 2019 by the Board of Directors of the Group.
52 CORRESPONDING FIGURES
Corresponding figures have been re-arranged and re-classified, wherever necessary, for the purposes of comparison and better presentation as per reporting framework however, no significant re-arrangements have been made, except for as required by additional requirements of Companies Act, 2017.
Chief Financial Officer Chief Executive Director


Fina
ncia
l Sta
tem
ents
Oth
er In
form
atio
nC
ompa
ny R
evie
w
OtherInformation

Investor’s AwarenessIn pursuance of SRO 924(1)/2015 dated 09 September 2015 issued by the Securities and Exchange Commission of
Pakistan (SECP), the following informational message has been reproduced to educate investors:

Fina
ncia
l Sta
tem
ents
Oth
er In
form
atio
nC
ompa
ny R
evie
wI/We of
in the district of being a member/members of JDW Sugar Mills Limited
holding shares of Rs.10 each, hereby appoint Mr./Ms.
of failing him / her,
of as my/our proxy to vote for me/us and on my/our behalf at the 29th
Annual General Meeting of the Company to be held on the Monday, January 28, 2019 at 9:30 a.m., at Qasr-e-Zauk,
1E-3, Main Boulevard (Next to UC Hospital), Gulberg III, Lahore and at any adjournment thereof or of any ballot to
be taken in consequence thereof.
Signed this day of January, 2019.
Affix Revenue(Member’s Signature) stamp of Rs. 5/-
Witnesses:
Signature: 1. 2.
Name:
CNIC:
Address:
Note:
All Proxy Form, in order to be effective must be received at the Company’s registered office not less than forty eight (48) hours before the time fixed for holding the Annual General Meeting and must be duly stamped, signed and witnessed as required.
Folio No./CDC A/c No.
Proxy Form
JDW Sugar Mills Limited29th Annual General Meeting

The Company Secretary
JDW Sugar Mills LimitedRegistered Office: 17– Abid Majeed Road,
Lahore Cantonment, Lahore Pakistan.
AFFIXCORRECTPOSTAGE

Fina
ncia
l Sta
tem
ents
Oth
er In
form
atio
nC
ompa
ny R
evie
w

The Company Secretary
JDW Sugar Mills LimitedRegistered Office: 17– Abid Majeed Road,
Lahore Cantonment, Lahore Pakistan.
AFFIXCORRECTPOSTAGE

Farmers’ First Choice


