15
Out of Home Consumption of Edible Oils in India Presented By: GG Patel & Nirav Desai 2010-11
| Date post: | 13-Aug-2015 |
| Category: |
Presentations & Public Speaking |
| Upload: | gg-patel-nikhil-research-company |
| View: | 151 times |
| Download: | 4 times |

Out of Home Consumption of Edible Oils in India
Presented By: GG Patel & Nirav Desai2010-11

Initiative:
It has been our endeavor to bring out a topic which has been there in the back of the mind of the industry but nobody has done a study to bring out facts.
In the past we had contributed:– •Farmer’s Perspective on Shifting Acreage of Crops
•How India Became The Biggest Palm Oil Importer & Consumer Behavior.
This year we have tried to sum up data on the Out of Home Consumption of Edible Oils.
Objective:
- Identify & categorize the segments using edible oils, other than the Household.
Survey Facts:
We at GGN Research Co, decided to prepare a study on the consumption pattern of edible oils in the Out of Home category. Like the last survey our team travelled pan India to gather information from the source. The survey was divided in four regions i.e. North, South, East & West, which was further divided into 100 sample town & villages in proportion of the Urban and Rural population in India. Then the data was collected from there to reach ground figure. We also gathered information from the end users of the category and the Industry’s most knowledgeable people catering to this niche.
.

Out of Home Consumption
We can bifurcate the edible oil industry in 2 major categories :
1.) Out of Home Consumption (OHC) 2.) Household Consumption (HHC).
Though Out of Home Consumers are a big volume maker in the industry, but are less talked about in India. This sector will become more and more significant for the Indian edible oil industry in the coming years. It covers Manufacturers of Chips, Savories, Biscuits or Restaurants, Hawkers, & non edible users like Paints, Hair oil etc.
The annual consumption of edible oils in Out of Home is 45 Lac Tons (4.5 mln tons) in India.
And still far behind USA & China. Out of Home consumption of edible oil in USA Vs China
Vs India
.
Out of Home House Hold

Growth rate of OHC v/s HHC
OHC is growing at a faster pace than HHC. The next few studies would give a clear picture.
The survey team while visiting different categories & sub categories of OHC, got various responses as to what kind of growth have they seen in last 2-3 years.
Below mentioned was the response received by our survey team.
We found that 65% of the respondents have seen higher growth rate.

Indian Biscuit industry’s is Growing above 14 % from 2003
In past 6 years Biscuit sales has seen a phenomenal growth rate of 15% (Avg.) which is explained in the below mentioned graph. Last two years shows much more promising figures, which supports the growth rate is even higher now than earlier.
Source : Indian Biscuit Manufacturers Association

White Paper Survey - Indian RestaurantWhite Paper Survey done on Indian restaurant industry (Urban area) has revealed some fact which are as follows :
40 % is the rate at which the fast food industry is growing in the country
80 % of urban Indians eat out seven times a month, up from thrice in 2003
2 out of 3 families order food from outside at least once a month.
55 % kids are served chips n Kurkure as munch- ons in between meals.
80 % of visitors to a shopping mall end up visiting food court
To Sum up the growth rate in Out of Home sector is 2 to 3 times more than the home consumption rate.

Out Of Home Consumption CategoriesWe have categorized the Out of Home Consumption in the Below Categories & Sub Categories
Categories Sub - Categories
Food outletsRestaurant/ CanteenSnacks shop/HawkerMarriages & Banquets
Fried food mfg Namkeens Savories & SweetsPotato chips
Non Fried food mfg
Bakery ProductsConfectioneryIce creamDairyPickles, etc
Non Edible Use
Hair OilSoapsCosmeticsPaints/inks, etc.

CategoryOHC Share
Lac MT(‘00 000) Sub- Category
Share in Category
OHC Share
Lac MT(‘00 000)
Food Outlets 40% 18
Snack Shop/Hawkers 50% 50% 9Restaurants/ Canteen 30% 12% 5.4
Banquets/ Caterors 20% 8% 3.6
Fried Food 28% 12.6 Namkeen/ Savories 70% 20% 8.8
30% 8% 3.8
Non-Fried food
20% 9
Bakery Products(Out of which 50% is Biscuit) 65% 13% 5.9
Others* 35% 7% 3.1
Non edible uses
12% 5.4Hair Oil 60% 8% 3.2
Others ** 40% 4% 2.2
Total 100% 45 100% 45
* Confectionary, Pickles, Tables Margarine & Mayonnaise, Deserts, Ice cream, Dairy
** Soap, Cosmetics, Paints
Estimate of Share of Each Categories for India

OBSERVATIONSIndia is a rural based economy where 70 % of it’s population lives in villages and small
towns. While surveying we noticed that, there are small Snack shops or
Hawkers who sells snacks, namkeen (Savories) & Sweets from the same shop,
therefore, when we add snacks shop category & Namkeen/Sweets category
together in rural area, it account for whooping 40 % of the total edible oil sale in the
OHC category.
The above point clearly says that the Snacks shop is the biggest consumer in the
OHC sales in the rural area.
Snack shop Hawker

Difference Between Urban & Rural OHC ?
Rural OHC is quiet low in front of URBAN consumption.
Restaurants are the biggest sub category in Urban India, where as Snacks shop are the
biggest category in Rural India
Consumption of Bakery (other than BISCUITS), confectionary, Chips is much lower in
Rural India.
Because 70 % of population in India is Rural population, hence our depiction has more
weightage to the Rural Trend.
URBAN RURAL
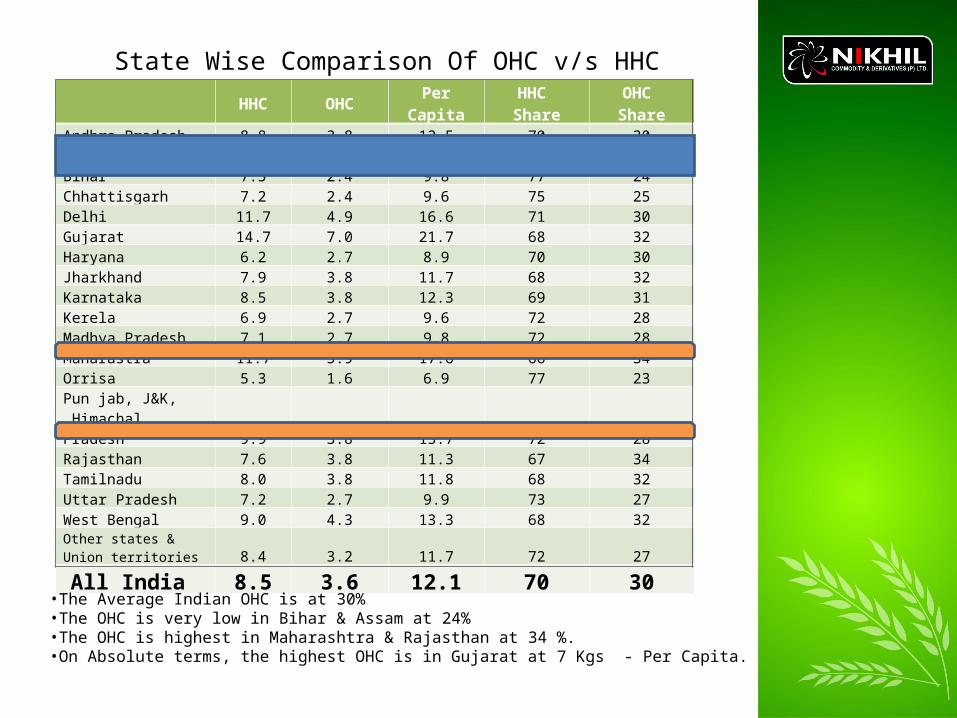
State Wise Comparison Of OHC v/s HHC
HHC OHCPer
CapitaHHC Share
OHC Share
Andhra Pradesh 8.8 3.8 12.5 70 30Assam 7.6 2.4 9.9 77 24Bihar 7.5 2.4 9.8 77 24Chhattisgarh 7.2 2.4 9.6 75 25Delhi 11.7 4.9 16.6 71 30Gujarat 14.7 7.0 21.7 68 32Haryana 6.2 2.7 8.9 70 30Jharkhand 7.9 3.8 11.7 68 32Karnataka 8.5 3.8 12.3 69 31Kerela 6.9 2.7 9.6 72 28Madhya Pradesh 7.1 2.7 9.8 72 28Maharastra 11.7 5.9 17.6 66 34Orrisa 5.3 1.6 6.9 77 23Pun jab, J&K, Himachal Pradesh 9.9 3.8 13.7 72 28Rajasthan 7.6 3.8 11.3 67 34Tamilnadu 8.0 3.8 11.8 68 32Uttar Pradesh 7.2 2.7 9.9 73 27West Bengal 9.0 4.3 13.3 68 32Other states & Union territories 8.4 3.2 11.7 72 27
All India 8.5 3.6 12.1 70 30•The Average Indian OHC is at 30%•The OHC is very low in Bihar & Assam at 24%•The OHC is highest in Maharashtra & Rajasthan at 34 %.•On Absolute terms, the highest OHC is in Gujarat at 7 Kgs - Per Capita.

CategoriesOil Preference Why ?
Where do they Buy from ?
buying pattern ?
Growth Witnessed
Oil Absorption
Production per 1kg of oil
Restaurant/ Canteen
Palm
Cost Benefit High smoke point Reusability
Whole-Sellers(80%),
Retailers(20%)Weekly High Growth
in all regions 15-25 % per plate
35-40 Plates
Soya
Better Finish Low cloud point
Snacks shop HawkersRakdiwala
Palm
Cost Benefit High smoke point Reusability
Whole -Sellers(50%),
Retailers(50)
Daily orIn 2 days
High Growth in all regions
15-25% Non Fried
3-4 KgsOf fried Snacks
Soya
When no alternate is available
20 -40 % in Fried Food
2 - 3 KgOf fried snacks
Caterers Marriage Banquets
Vanaspati(Palm)
Cost Benefit Crispier finish Use in Sweets
Whole- Sellers(60%),
Retailers(40%)
As per Demand
Avg. growth in all region
Depends on customers 35-45 Plates
Soya Better Finish Low cloud point
GroundnutSunflower
Used only in upper class banquets Better Aroma Better taste
Fact Sheet of Individual Sub Category

CategoriesOil Preference Why ?
Where do hey Buy from ?
buying pattern ?
Growth witnessed
Oil Absorption
Production per 1kg of oil
NamkeenSweetsChips
Palm Cost Benefit High smoke point Reusability
Whole- Sellers(70%)
Refiners (30%)Daily or once in 2 days
High Growth in West
Low Growth in Rest of the regions.(except chips)
25-35% 3-4 Kg of fried foodcotton
Better Finish Low cloud point Shelf Life
Whole- Sellers
Rice Bran Better Finish Health Benefit Refiners(100%)
Bakery ProdBakery Shortening(Palm)
Specialized requirement for bakery
Whole-Sellers(70%)
Refiners (30%)
Twice a week High Growth 15-35% 3-6 Kgs.
Of fried food
Confectionery Palm Product
Specialised requirement for Chocolates
Distributors (40%)
Refiners (60%)
Once a month
High Growth 25 - 35 % 3-4 kgs
Pickles Mustard Aroma Pungent Taste Pickles
Whole- Sellers Twice a Month
Moderate Growth 15-35% 3-5 Kgs
ice cream Palm Kernel Coconut oil
Very Low Melting Point
Distributors (60%)
Refiners(40%)
Twice a Month High Growth 20-35 % 3-4 Kgs
Hair Oil Coconut oil Traditional use Millers
Twice a week
Moderate Growth
100 % 1 : 1
SEGN oil* Odorless Less sticky
Refiners 90- 98 % 1 : 1
Soya Oil Refiners 90- 98 % 1 : 1

Take Back Points for Marketers :The OHC category is presently having a 30% share in the total edible
oil sales and only a handful marketers are targeting to this segment.
Marketers can focus on OHC with existing product line to :• Restaurants• Namkeen Manufacturers
Marketers can focus on with Special product line to :• Bakery• Confectionery• Dairy
Institutional Segments Marketers can focus on : • Hair Oil• T. Soap• Paints/inks

Thank You Shri Govind bhai Patel
422, Shivam Complex, Sarveshwar Chowk Dr. Yagnik Road, Rajkot, Gujarat - 360001, India,Ph. : +91 281 2468592, 6621200, 3043463, Fax +91 281 2468593,
Mr. Nirav Desai401, Princess Empire, 12, Racecouse Road, Indore, MP - 452001, India, Ph. :+91 731 4015001/05 Fax : +91 731 253 3147,
email : [email protected]


