Page | 1 Outcome-Based Predictive Admissions Models using LSAT and UGPA (March 2015) Introduction For many years, Western Michigan University Thomas M. Cooley Law School admitted students based on either of two alternatives: (1) the applicant’s LSAT score alone or (2) the student’s Cooley Admissions Index, which is the sum of the applicant’s undergraduate grade point average multiplied by 15, plus the applicant’s LSAT score. In mathematical terms, the index is expressed by the following equation: Index = (UGPA x 15) + LSAT. We granted admission to applicants based on where their individual LSAT score or their individual Index number fell in relation to more or less subjectively established LSAT score or Index score cutoff numbers. Our inquiry into the validity of our process was stimulated by the comprehensive revision of the American Bar Association Standards, which emphasized assessment of outcome measures and deemphasized input measures. This in turn led to our reexamination of ABA Standard 503, which requires schools to employ a “valid and reliable admissions test to assist the school and the applicant in assessing an applicant’s capability of satisfactorily completing the school’s program of legal education.” That implies looking at the output—completing the program—and it implies that the measure is the particular school to which the applicant applies, rather than some general notion about the assessment test itself or the results at all schools. The ABA further requires that in making admissions decisions schools “use the test results in a manner consistent with the current guidelines regarding proper use of the test results provided by the agency that developed the test.” Of course, the LSAT is one such valid and reliable test that helps schools predict academic success. The Law School Admissions Council, which developed the LSAT, states that the test “purports to be useful for the limited purpose of predicting academic success in law school.” 1 The LSAT is by far the most commonly used test; its developer, the Law School Admissions Council, has established “cautionary policies” for its use; and the LSAC has made it clear that the LSAT was designed to serve admissions functions only and has not been validated for any other purpose. Most significantly, the LSAC has noted that schools should not use the LSAT as the sole criterion for admission. Even though WMU-Cooley’s past use of the LSAT as the sole criteria for admissions was only one of two alternatives, the LSAT-only alternative might be seen as inconsistent with this cautionary policy. The LSAC also advises schools to evaluate the predictive utility of the LSAT at their particular school, which is generally accomplished by conducting a correlation study. Fortunately, the LSAC provides correlation study services to its member institutions at no charge. Each year, law schools can provide their student data to the LSAC, which conducts the correlation study and provides the results to the individual schools, along with the combined results for all schools that participated, for comparative purposes. WMU-Cooley has participated in LSAC correlation studies on an annual basis since at least the early 1990s. Very consistently over the years, the LSAC correlation studies have shown that a student’s LSAT score alone is predictive, that the UGPA alone is predictive, but that neither factor by itself is more predictive than the two factors combined. The correlation studies done by LSAC show each school how to weight both the LSAT score and the UGPA to maximize predictive value for that particular school, using its actual academic success data from the previous fall entering class. Because the Cooley Index combines LSAT and UGPA, it similarly should predict academic success at WMU-Cooley better than the LSAT or UGPA alone. Given the combination of the LSAC cautionary policy and the LSAC determination that using a combination of LSAT and UGPA is superior to the use of the LSAT alone, it appeared advisable to discontinue our practice of using the LSAT-only alternative. That left only the initial question of whether to use the WMU-Cooley Index or to adopt the LSAC weighting formula, itself an index. The first goal of this project was to validate and, if necessary, refine WMU-Cooley’s current Admission Index. We set out to test whether the weighting of the LSAT score and UGPA that we use in our WMU-Cooley Index was more or less predictive than the weighting formula or index provided by the LSAC in the latest correlation study. Our study showed that the LSAC formula was more predictive than the WMU-Cooley Index. 1 LSAC Technical Report 13-03, Predictive Validity of the LSAT: A National Summary of the 2011 and 2012 LSAT Correlation Studies, November 2013 p.2.
Transcript
Page | 1
Outcome-Based Predictive Admissions Models using LSAT and UGPA (March 2015) Introduction For many years, Western Michigan University Thomas M. Cooley Law School admitted students based on either of two alternatives: (1) the applicant’s LSAT score alone or (2) the student’s Cooley Admissions Index, which is the sum of the applicant’s undergraduate grade point average multiplied by 15, plus the applicant’s LSAT score. In mathematical terms, the index is expressed by the following equation: Index = (UGPA x 15) + LSAT. We granted admission to applicants based on where their individual LSAT score or their individual Index number fell in relation to more or less subjectively established LSAT score or Index score cutoff numbers. Our inquiry into the validity of our process was stimulated by the comprehensive revision of the American Bar Association Standards, which emphasized assessment of outcome measures and deemphasized input measures. This in turn led to our reexamination of ABA Standard 503, which requires schools to employ a “valid and reliable admissions test to assist the school and the applicant in assessing an applicant’s capability of satisfactorily completing the school’s program of legal education.” That implies looking at the output—completing the program—and it implies that the measure is the particular school to which the applicant applies, rather than some general notion about the assessment test itself or the results at all schools. The ABA further requires that in making admissions decisions schools “use the test results in a manner consistent with the current guidelines regarding proper use of the test results provided by the agency that developed the test.” Of course, the LSAT is one such valid and reliable test that helps schools predict academic success. The Law School Admissions Council, which developed the LSAT, states that the test “purports to be useful for the limited purpose of predicting academic success in law school.”
1 The LSAT is by far the most commonly used test; its developer, the Law School Admissions Council, has
established “cautionary policies” for its use; and the LSAC has made it clear that the LSAT was designed to serve admissions functions only and has not been validated for any other purpose. Most significantly, the LSAC has noted that schools should not use the LSAT as the sole criterion for admission. Even though WMU-Cooley’s past use of the LSAT as the sole criteria for admissions was only one of two alternatives, the LSAT-only alternative might be seen as inconsistent with this cautionary policy. The LSAC also advises schools to evaluate the predictive utility of the LSAT at their particular school, which is generally accomplished by conducting a correlation study. Fortunately, the LSAC provides correlation study services to its member institutions at no charge. Each year, law schools can provide their student data to the LSAC, which conducts the correlation study and provides the results to the individual schools, along with the combined results for all schools that participated, for comparative purposes. WMU-Cooley has participated in LSAC correlation studies on an annual basis since at least the early 1990s. Very consistently over the years, the LSAC correlation studies have shown that a student’s LSAT score alone is predictive, that the UGPA alone is predictive, but that neither factor by itself is more predictive than the two factors combined. The correlation studies done by LSAC show each school how to weight both the LSAT score and the UGPA to maximize predictive value for that particular school, using its actual academic success data from the previous fall entering class. Because the Cooley Index combines LSAT and UGPA, it similarly should predict academic success at WMU-Cooley better than the LSAT or UGPA alone. Given the combination of the LSAC cautionary policy and the LSAC determination that using a combination of LSAT and UGPA is superior to the use of the LSAT alone, it appeared advisable to discontinue our practice of using the LSAT-only alternative. That left only the initial question of whether to use the WMU-Cooley Index or to adopt the LSAC weighting formula, itself an index. The first goal of this project was to validate and, if necessary, refine WMU-Cooley’s current Admission Index. We set out to test whether the weighting of the LSAT score and UGPA that we use in our WMU-Cooley Index was more or less predictive than the weighting formula or index provided by the LSAC in the latest correlation study. Our study showed that the LSAC formula was more predictive than the WMU-Cooley Index.
1 LSAC Technical Report 13-03, Predictive Validity of the LSAT: A National Summary of the 2011 and 2012 LSAT Correlation Studies,
November 2013 p.2.
Page | 2
Once the first project goal was met, the second goal of this project was to determine whether an even more predictive formula than either the LSAC formula or the WMU-Cooley Index could be created using the same historical factors relied upon by both the LSAC and the Admissions Index – LSAT and UGPA. Indeed, we discovered that by using the same process used by LSAC, but with a more complete dataset and a more conservative definition of academic success, we were able to create a model that was even more predictive than the LSAC formula.
A. The LSAC CORRELATION STUDY Because the ABA endorses the LSAC correlation study as a valid means of demonstrating the relationship between LSAT and UGPA in predicting performance in law school, it made sense to follow LSAC’s process in our own exploration of the relationship between those factors at WMU-Cooley. The first step in our analysis was to closely examine how LSAC conducts its correlation studies. Simply put, the LSAC correlation study uses a mathematical process known as statistical regression to compare how well the LSAT score alone, UGPA alone, and the LSAT score combined with UGPA predict academic success in law school. When you apply the equation that results from the LSAC statistical regression process to each applicant’s entering LSAT and UGPA figures, the equation yields a predicted first-year GPA. We reviewed both the LSAC study dataset cohort (the students included in the analysis) and LSAC’s benchmark of academic success (“the criterion variable”), and then we looked at how well the LSAC-defined factors match the WMU-Cooley student population and our institutional definition of academic success. The methodology of the LSAC correlation is sound, but our analysis suggested that by using the same statistical regression methodology, but tweaking both the student population included in the study and the benchmark for measuring their academic success to better match how WMU-Cooley operates, we would likely end up with a LSAT/UGPA weighting formula that was even more predictive than the latest formula provided to us by the LSAC. The next sections explain why the LSAC’s study cohort and definition of academic success caused their resulting LSAT/UGPA weighting formula to be flawed for WMU-Cooley, even though it was better than the Cooley Index. Issue 1: The Students Included in the LSAC Correlation Study The first task was to examine the students included in the LSAC correlation study, or perhaps more importantly, to find out which students were not included in it. The LSAC study examines the relationship between LSAT score, UGPA, and first-year grade point average (“FYA”) for students who have completed the first year of study.
2 LSAC excludes all students who did
not complete their first year from the study cohort, regardless of the reason they did not complete it. This means that all students who were academically dismissed or voluntarily withdrew on probation during their first WMU-Cooley three terms were excluded from the study. Students who transferred, withdrew for other reasons, or took temporary leaves of absence were also excluded from the LSAC study, regardless of the number of credit hours they had earned. The LSAC study only includes full-time students who matriculated in the fall. LSAC’s definition of full-time is 12 or more credit hours per semester for two semesters. LSAC assumes that full-time students will earn 24 credits or more in their first academic year. The LSAC student cohort excluded students who entered in January and May. The exclusion of part-time students and students who did not complete the first year could have skewed the LSAC formula. Finally, WMU-Cooley students who take larger credit loads during the first year also tend to be our higher-profile entering students, since matriculants with below certain LSAT or Index scores are restricted to part-time study, at least in their first semester. Because our higher-profile students tend to perform better in the classroom, their academic success rates may be higher than the success rates of our part-time students. Their corresponding higher academic success rates could skew the weighting of LSAT score and UGPA in the prediction formula. Having examined the students included in the LSAC study and finding that the cohort did not accurately reflect the actual student body at WMU-Cooley, we theorized that the resulting LSAC/UGPA formula might not be as predictive as it should. A study cohort that was larger and more reflective of our actual student body would likely yield a more predictive LSAT/UGPA formula. Issue 2: The Definition of Academic Success In its correlation studies, the benchmark the LSAC uses to test how well these factors predict academic success in law school is first-year law school grade point average (“FYA”). This benchmark is known as the criterion variable. The LSAC recognizes that FYA is not the only useful criterion of academic success that it could have used.
3 In its most recently
published summary of correlation studies, the LSAC details the reasons it chose FYA as the criterion variable over other options:
2 Fall 2013 LSAC Correlation Study for TMCLS (p.3)
3 See LSAC Technical Report, supra.
Page | 3
“FYA is not the only criterion that could be used, but it has several advantages that have shown it to be a useful criterion. First, it represents a composite of the academic performance of a student after 1 year of law school. Some of the courses taken may have been easier than others, some professors more lenient in grading than others. By using the average of all grades received, these differences in course difficulty and grading stringency tend to average out. Second, for law students, the FYA tends to represent basically the same curriculum for all of the law students in the school. In subsequent years, different elective choices are represented in the composite average. Third, FYA data are available within 1 year, whereas other criteria might require a delay of 2, 3, or more years before a study can be conducted.”
4
Understandably, the Law School Admissions Council chose FYA as its criterion variable because it fits the way the vast majority of law schools operate. The LSAC study assumes that most law schools enter a single class in the fall, that those fall entering students are enrolled full-time, and that those same students have completed their first-year courses within that first academic year, which is two semesters long. Because WMU-Cooley does not operate like the vast majority of law schools, the academic success benchmark that the LSAC chose does not fit our part-time, multiple-schedule-option model particularly well. At this law school, a good number of students have not completed the entire first-year curriculum even by the end of their first calendar year of enrollment. In addition, because we have 66 required credit hours,
5 we have less
variation in courses taken by our students than other law schools have after the first year. The LSAC study also assumes that most law students who fail academically will have done so by the end of the first year of study, which traditionally starts in September and ends in May. At WMU-Cooley, the bulk of our academic attrition also occurs within the first year, but we define the first year of study in terms of credits earned, not by the number of terms or months attended. All students take the same required first-year classes, but they don’t all take them in the same sequence or at the same pace, so defining the first year in terms of the amount of time that has passed makes no sense for us. At the two extremes, a part-time student following our PT-60 schedule will have completed only 18 credits after one calendar year, whereas a student following the accelerated FT-24 schedule will have completed 45 credits in the same timeframe. For WMU-Cooley, a correlation study cohort that contains students who entered in September will have completed a wide range of credit hours during their first twelve months. This means that a large number of our students will not have completed the first year of study within the time period used by the Law School Admissions Council in its correlation studies to measure success. It makes much more sense for us to look at how our students performed academically after the vast majority of them have been enrolled long enough to have earned at least 27 credits. Only when we define the first year in like terms is our predictive analysis an apples-to-apples comparison to that at other law schools. Using FYA as the criterion variable for WMU-Cooley fails to capture the students who are academically dismissed after earning 24 credits. If we are using the resulting LSAT/UGPA formula to predict success, we want that formula to be based on a criterion variable that is meaningful to our institution. WMU-Cooley defines “academic success” to mean either graduating from the Law School or leaving the School with a cumulative grade point average (“CPGA”) of 2.0 or better. We predicted that using each student’s final CGPA instead of FYA would likely lead to a more predictive LSAT/UGPA formula for our institution. Using final CGPA instead of FYA means that more students in the dataset will have been academically dismissed, and that larger number of students with <2.0 will yield a more conservative predictive formula. Because of these two issues with the LSAC methodology and definitions, it appeared likely that by following the LSAC correlation process but using both a student cohort and criterion variable more reflective of WMU-Cooley, that we could find a LSAT/UGPA formula that better predicted academic success for our institution.
B. TWO REGRESSION OPTIONS (Binary vs. Continuous Variable Regressions) The LSAC correlation study uses the Ordinary Least Squares (OLS) linear regression technique. This technique is used when the “Y” value (or “criterion variable”) you are using is a continuous variable. A continuous variable can take on any value in a range, such as a grade-point average.
6 A different regression technique is used when the “Y” value (or “criterion
variable”) is a binary variable. A binary variable has only two possible outcomes, such as “successful” or “not successful.” We opted to evaluate the WMU-Cooley Index and any new models using both regression techniques. In our analyses, the OLS regression yields a formula that results in an individual’s predicted overall law school GPA (CGPA). By contrast, the
4 See LSAC Technical Report, supra.
5 63 credits were required until recently.
6 LSAC uses FYA, a continuous variable, as its “Y” value.
Page | 4
binary regression formula yields a predictive success score between 0 and 1, which is essentially a percentile score that describes the individual’s probability of academic success in law school.
7
Binary regression leads to a correlation factor known as “% Concordant.” Generally, binary models with a higher % concordance are better, so long as the decile analysis also has the desired staircase effect.
8
OLS regression leads to a correlation factor known as “R-Squared,” the square root of which is the correlation coefficient. Generally, OLS models with higher correlation coefficients are more predictive than ones with lower correlation coefficients.
C. BUILDING THE DATASET and TESTING ASSUMPTIONS We had to build a common dataset of students in order to test the LSAC model and the WMU-Index as well as to compare their predictive utility to any new models. In building the dataset and testing the predictive formulae, we utilized the following assumptions:
The dataset used should include only regular matriculants—those who have never been in law school before (restarts, readmits, or transfers-in were excluded).
Since most academic dismissals occur within the first 27 credits, nearly all students in the dataset still listed as enrolled students must have earned 27 or more credits. Sep-12 was determined to be the most recent term in which the vast majority of enrolled students had earned at least 27 credits. Only nine enrolled Sep-12 matriculants had fewer than 27 credits (0.2%), so 99.8% of this class met the criteria.
9 Using more recent matric classes meant
that too many students had not yet completed at least the 1L curriculum.
We should build several models based on different datasets and see which gives most predictive result. We did not know how many entering classes combined would result in the best predictive model, so we tested a variety of entering class combinations, ranging from 6 terms to 10 terms worth of matriculant data, always with Sep-12 as the most recent matriculant cohort.
1,000 students was the minimum dataset size.
Academic success was defined by CGPA at last date of enrollment. To be considered academically successful, CGPA must be at least 2.00.
Students who withdrew first term without grades were eliminated from the dataset, because their CGPA is (inaccurately) listed as 0.00 in CAMS. We don’t know whether they would have been academically successful or not.
We should choose the most conservative model (i.e., the model that would exclude the most applicants) that resulted from the analysis.
In order to recommend the resulting formula for any chosen model, it must be more predictive than both the current WMU-Cooley Index model and the Fall 2013 LSAC model, when applied to the same dataset.
Testing a Predictive Model: The Decile Analysis There are several ways to determine how well a predictive model describes your data. One visual way to get an idea of how well any model fits your data is by examining the decile analysis. The decile analysis is created to test the model’s ability to predict the intended outcome. For the WMU-Cooley, the LSAC formula, and all new models, we used decile analyses to test each formula’s ability to predict the outcome and compared those analyses. Decile analyses can be created for both binary and continuous Y criterion variables. How a Decile Analysis is Calculated
1. The validation sample is scored according to the model being tested. 2. The records are sorted by their predicted scores in descending order and divided into ten equal-sized bins or
deciles. The top decile contains the 10% of the population most likely to succeed and the bottom decile contains the 10% of the population least likely to succeed, based on the model scores.
3. The deciles and their actual success rates are graphed on the x and y axes, respectively.
7 Academic success is defined as exiting WMU-Cooley with a 2.00 CGPA or better.
8 For a discussion of the decile analysis generally, see Section C, infra.
9 Of those nine students with less than 27 credits, 5 had >= 2.0 and 4 were < 2.0 and on probation. Five had earned 24 credits, 3 had
earned 21 credits, and 1 had earned 15 credits. Two other matriculants had also not earned 27 credits. One Jan-12 matric has not been enrolled since Jan-12, and one May-12 matric had only 18 credits.
Page | 5
Each column in a decile analysis chart represents a collection of records that have been scored using the model. The height of each column represents the average of those records’ actual behavior. After the decile analysis is built, you look at the height of the bars in relation to one another. Deciding whether a model is worth moving forward with depends on the pattern you see when viewing the decile analysis. Ideally, you will see a staircase effect; that is, the bars or “bins” descend in order from left to right, as shown below.
This ideal staircase effect tells you that the model is “binning” your constituents correctly from most likely to succeed to least likely to succeed. A model with a decile analysis that exhibits a good staircase is more predictive than one without a good staircase. By contrast, if the bars seem to be out of order (as shown below), the decile analysis is telling you that the model is not doing a very good job of predicting success. If the bars seem to be the same height, or the decile analysis looks “flat”, it is telling you that the model isn’t performing any better than randomly binning people into deciles would. In both cases, your model should be improved before moving forward with it.
10
D. REGRESSION ANALYSIS OF THE WMU-COOLEY INDEX and LSAC FORMULA One goal of this statistical study was to compare the predicative utility of the Cooley Index to that of the most recent LSAC formula. We know from the LSAC correlation studies over the years that the LSAT score is most predictive of student academic success when combined with UGPA. The WMU-Cooley Index does combine these two factors, and being mindful of ABA and LSAC requirements and guidance, over the years we have independently reviewed our use of the Index and confirmed that it is predictive of student success. The second step in our overall analysis was to apply the same statistical regression methodology used in the LSAC study to the WMU-Cooley Index to determine whether it predicted academic success better than the LSAC formula. The binary and OLS regression and decile analyses of the WMU-Cooley Index and the academic performance of thousands of our students over the last several years showed that the Cooley Index was not as predictive as weighted combinations of LSAT and UGPA determined through statistical regression. WMU-COOLEY INDEX Binary Regression Decile Analysis (62.7% Concordant) The decile analysis of the binary regression showed that the WMU-Cooley Index over-predicted academic success for students whose scores fell in the Deciles 3 through 7 and under-predicted academic success for students whose scores were in Deciles 8, 9, and 10. The ideal staircase effect is not present. You can easily see the differences between actual and
10
See http://www.rapidinsightinc.com/how-to-interpret-a-decile-analysis/.
Page | 6
predicted success when you look at the chart below. The red bars represent the actual academic success and the blue bars represent the predicted academic success, using the WMU-Cooley Index.
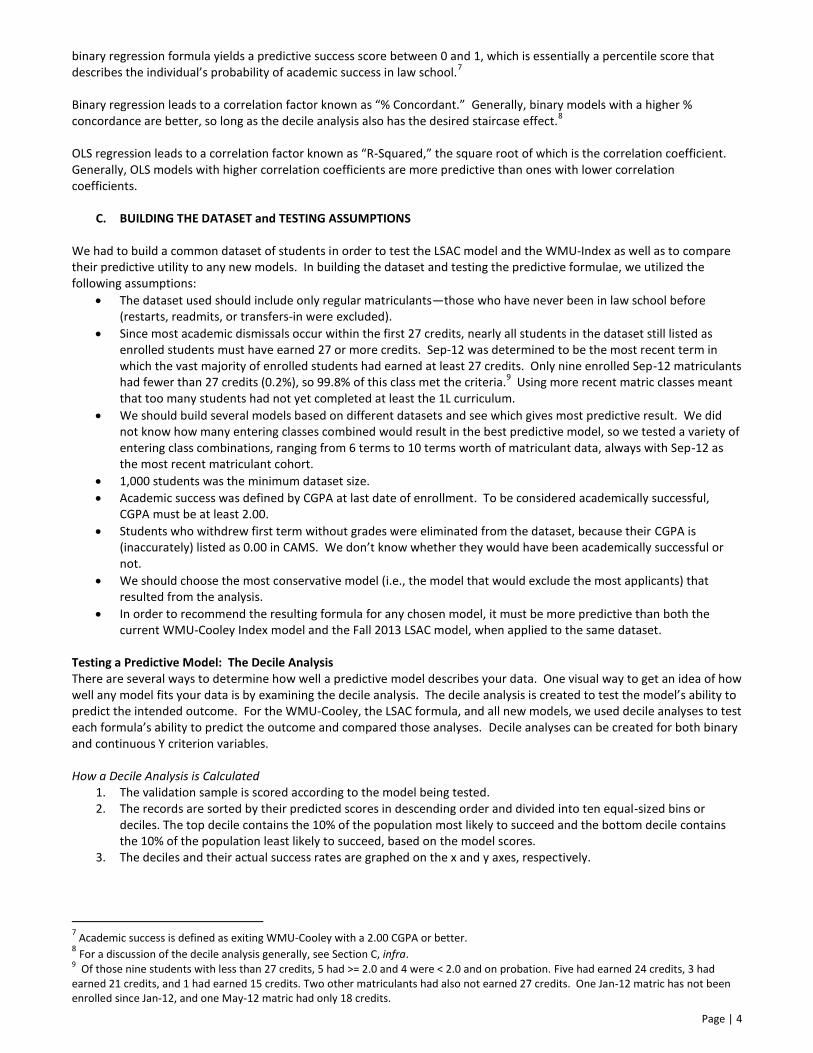
OLS Regression Decile Analysis (R-Squared=0.1690. Correlation Coefficient=0.411) The decile analysis of the OLS regression showed that the WMU-Cooley Index over-predicted academic success for students whose scores fell in Deciles 3 through 8 and under-predicted academic success for students whose scores were in Deciles 9 and 10. You can again see the differences between actual and predicted success when you look at the chart below. The red bars represent the actual academic success and the blue bars represent the predicted academic success, using the WMU-Cooley Index.
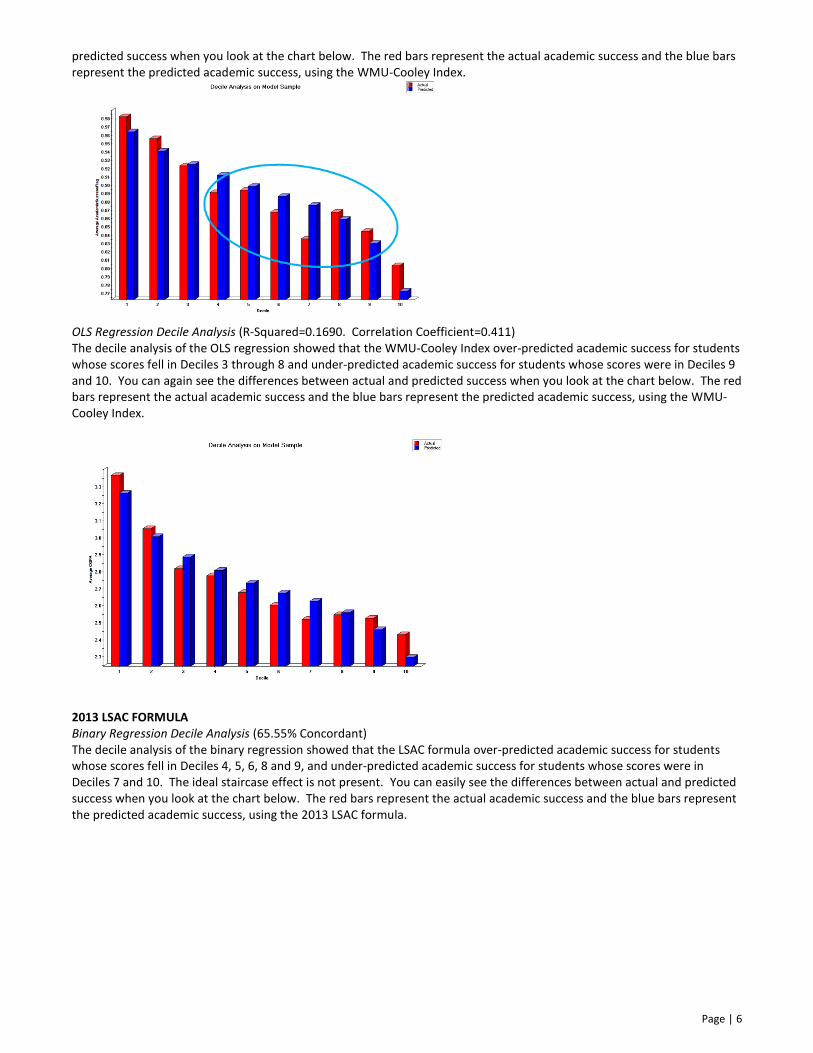
2013 LSAC FORMULA Binary Regression Decile Analysis (65.55% Concordant) The decile analysis of the binary regression showed that the LSAC formula over-predicted academic success for students whose scores fell in Deciles 4, 5, 6, 8 and 9, and under-predicted academic success for students whose scores were in Deciles 7 and 10. The ideal staircase effect is not present. You can easily see the differences between actual and predicted success when you look at the chart below. The red bars represent the actual academic success and the blue bars represent the predicted academic success, using the 2013 LSAC formula.
Page | 7
OLS Regression Decile Analysis (R-Squared=0.1952. Correlation Coefficient=0.442) The decile analysis of the OLS regression showed that the 2013 LSAC formula over-predicted academic success for students whose scores fell in the Deciles 4 through 9 and under-predicted academic success for students whose scores were in Decile 10. You can again see the differences between actual and predicted success when you look at the chart below. The red bars represent the actual academic success and the blue bars represent the predicted academic success, using the 2013 LSAC formula.
Our analyses also showed that the most recent LSAC formula--despite its shortcomings in student cohort--predicted academic success better than the Cooley Index. Note that the correlation coefficient for the 2013 LSAC formula using the dataset in the 2013 LSAC correlation study report was only 0.436 (R-squared=0.1900), so we were able to show that improving the dataset and changing the criterion variable from FYA to CGPA improved the predictive utility of the LSAC formula. A More Predictive Admission Formula The Cooley models were all built using the same regression techniques as the LSAC model, but used more inclusive data and were designed to predict academic success in law school, not just in the first year. Presumably, using this broader definition includes a higher number of those that were not academically successful that using first-year academic success data alone, therefore yielding a more conservative prediction model. The Models We built several models. The best binary variable model resulted from the Jan-10 to Sep-12 dataset--the nine most recent entering classes that met our assumption--which included 3,410 matriculants, 386 of whom were not academically
Page | 8
successful (11.3%). The next best models are included in Appendix A. The best continuous variable (OLS) model also resulted from the same Jan-10 to Sep-12 dataset. Not surprisingly, given what we knew from the LSAC correlation study and our own experience at WMU-Cooley, we confirmed that our current Index calculation is predictive of academic success in law school. However, the results showed that the Index is not as predictive as using formula built from LSAT and UGPA combined through regression. One of the main reasons that the Cooley Index is less predictive is because it combines LSAT and UGPA into a single variable. Formulas resulting from regression analysis, on the other hand, factor in each variable’s unique relationship with CGPA. We chose the best model built via continuous variable (OLS) regression and the best model built via binary variable regression. The OLS regression formula yields a Predicted CGPA for each applicant. The binary regression model yields a percentile score that describes the probability of academic success in law school.
11 The result is an individual predictive
success score between 0 and 1. Because the equations are built using two different regression techniques, they are not the same.
12
The OLS regression equation is: [LSAT(.04054) + UGPA(.2934)] -4.099
The binary regression base equation is: [LSAT(.09940) + UGPA(.6597)] -14.3513
The correlation coefficient for the OLS equation is 0.443 (R-square Value=0.1962), more predictive than the Cooley Index correlation coefficient of 0.411 and the LSAC formula’s correlation coefficient of 0.436. Similarly, the binary equation is 65.56% concordant, which means that x and y are concordant pairs 65.56% of the time.
14 The Jan-10 to Sep-12 model had
the highest percent concordance of all the models tested; it was higher than both the current Cooley Index model (62.7% concordant) and the LSAC model (65.55% concordant). While the LSAC model was nearly as concordant, its decile analysis did not have the desired staircase effect (see LSAC binary analysis on page 7, above). The Jan-10 to Sep-12 Model also had the best decile analysis of all the developed models. The OLS model will be the primary model because:
(1) it results in a more conservative decile analysis than the binary model, especially for lower-profiled applicants; and (2) it is based on the same regression analysis process that is used by LSAC.
The binary model will be used as a secondary factor to inform admissions decisions. Decile Analyses for Our Models We followed the same basic process as LSAC does in its correlation studies. The main differences between the LSAC correlation study and our study are 1) we used a larger and more accurate dataset that better fits WMU-Cooley operations; and 2) we predict overall academic success instead of FYA, which gives us a more conservative predictive model than the LSAC model. We tested the LSAC model and compared our results to the Jan-10 to Sep-12 model. We also ran correlation analyses to predict CGPA using LSAT and UGPA, just like LSAC does to predict FYA. Correlation coefficients for this formula applied to this dataset were LSAT Only = .383, UGPA Only = .187, LSAT and UGPA Combined = .443.
15 This model would
have excluded fewer matriculants than our chosen model, so we recommend the more conservative approach of the Jan-10 to Sep-12 Model. Predicted CGPA Model (Primary Model) (R-Squared=0.1962. Correlation Coefficient=0.443) The decile analysis for the Jan-10 to Sep-12 Predicted CGPA Model is shown below. The red bars are the actual CGPAs for all 3,410 matriculants in the cohort, and the blue bars are the Predicted CGPAs for the same group using the model equation. The Jan-10 to Sep-12 Model had the best “staircase effect” of the models tested. Several other models resulted in a decent staircase effect, but the Jan-10 to Sep-12 Model was the most conservative predictor of success among all the developed models.
11
Academic success is defined as exiting WMU-Cooley with a 2.00 CGPA or better. 12
Note the multiplier values are truncated for purposes of this document. 13
There is also an EXP function applied to this base equation. 14
A pair is concordant if x and y variables are moving in the same direction. 15
Cf, LSAC Fall 2013 model: LSAT Only = 0.361, UGPA Only = 0.223, LSAT and UGPA = 0.436. LSAC’s median correlation coefficients for all law schools were LSAT Only = 0.36, UGPA Only = 0.27, LSAT and UGPA = 0.46.
Page | 9
The mean Predicted CGPA, Minimum and Maximum predicted CGPA, LSAT, UGPA, and actual CGPA for each decile are included in the table below. Note that the model’s mean predicted CGPA for each decile is very close to the actual mean CGPA attained by the students in that decile group. In the 10th decile, which represents the lowest-profile students, the model is very conservative, with predicted CGPA (blue) lower than actual CGPA (red).
Bin Count Mean
Predicted CGPA
Min. Predicted
CGPA
Max. Predicted
CGPA
Mean Actual CGPA
Mean LSAT
Mean UGPA
1 341 3.336 3.146 3.822 3.36 159 3.37
2 341 3.037 2.955 3.144 3.09 153 3.13
3 341 2.892 2.838 2.955 2.88 150 3.10
4 341 2.794 2.752 2.837 2.80 148 3.07
5 341 2.713 2.678 2.752 2.67 146 3.05
6 341 2.647 2.260 2.677 2.56 145 2.96
7 341 2.591 2.565 2.619 2.57 144 2.94
8 341 2.537 2.506 2.565 2.53 143 2.85
9 341 2.472 2.430 2.506 2.45 142 2.76
10 341 2.308 1.745 2.429 2.42 140 2.54
Academic Success Probability Model (Secondary Model) (65.56% Concordant) The decile analysis for the Jan-10 to Sep-12 Academic Success Probability Model is shown below. The red bars are the actual academic success for all 3,410 matriculants in the cohort, and the blue bars are the predicted academic success for the same group using the model equation. The Jan-10 to Sep-12 Model had the best “staircase effect” of the models tested. Several other models resulted in a decent staircase effect, but the Jan-10 to Sep-12 Model was the most conservative predictor of success among all the developed models.
Page | 10
For deciles 4-7 and 9, the model’s predicted academic success was greater than actual success, but the degree is less than with other models. In addition, the matriculants that fall into those middle deciles would have been admitted under the current WMU-Cooley Index Model. In the 10th decile, which represents the lowest-profile students, the model is very conservative, with predicted success (blue) below actual success (red). The mean LSAT, UGPA, and actual CGPA for each decile are shown in the table below.
Bin Count
Predicted Academic Success Score
Min Predicted Success
Max Predicted Success
Mean LSAT
Mean UGPA
Mean Actual CGPA
1 341 0.97412 0.96113 0.99242 159 3.36 3.35
2 341 0.95052 0.94076 0.96099 153 3.12 3.10
3 341 0.93126 0.92233 0.94064 150 3.06 2.86
4 341 0.91439 0.90616 0.92226 148 3.07 2.80
5 341 0.89766 0.88932 0.90595 146 3.04 2.66
6 341 0.88245 0.87498 0.88923 145 2.96 2.60
7 341 0.86749 0.85977 0.87498 144 2.92 2.55
8 341 0.85217 0.84309 0.85977 143 2.87 2.52
9 341 0.83141 0.81668 0.84309 142 2.78 2.46
10 341 0.76658 0.46169 0.81610 139 2.59 2.42
Using the Predictive Model The equations that result from the predictive models will be applied to applicant data, and each applicant will end up with both a predicted CGPA and a score for probability of academic success (Academic Success Score). The Predicted CGPA Model will be the primary means of assessing admission eligibility, type of admission, and honor scholarship offer. The Academic Success Score will be an additional factor considered when an applicant is selected to undergo an individual file review. Admission Eligibility Proposal: Presumptive In/Presumptive Out Model One key purpose of building a new admission index model is to provide additional evidence to support the conclusion that WMU-Cooley’s admissions practices satisfy ABA Standards. WMU-Cooley has always held the belief that if two out of three admitted students were academically successful, that presumptively meets Standard 501(b). With these two new models, we will now have tested and statistically reliable mathematical formulae to predict this level of success on the front end, instead of using attrition data to evidence our student academic success rate after the fact. The models predict law school GPA and tell us which individual applicants have a 67% or better likelihood of academic success.
Page | 11
We can base our admission eligibility benchmarks on applicant Predicted CGPA score, and use the academic success probability score as a secondary factor for applicants whose Predicted CGPAs fall in the Individual Review groups. After studying several different cohorts of applicants’ Predicted CGPAs the President and Dean proposed the following admissions eligibility and scholarship benchmarks. Note that for implementation purposes, the results of the study are rounded to the nearest 1/100th (0.01) to reflect the common practice followed in displaying grade point averages.
APPENDIX A: OTHER DEVELOPED AND TESTED MODELS DISCARDED MODEL A: Sep09 to Sep12 (n=4,400) 64.96% concordant [LSAT(.09961) + UGPA(.6702)] -14.38
DISCARDED MODEL B: Sep09 to May12 (n=3,901) 64.55% concordant [LSAT(.09592) + UGPA(.6530)] -13.77
Page | 13
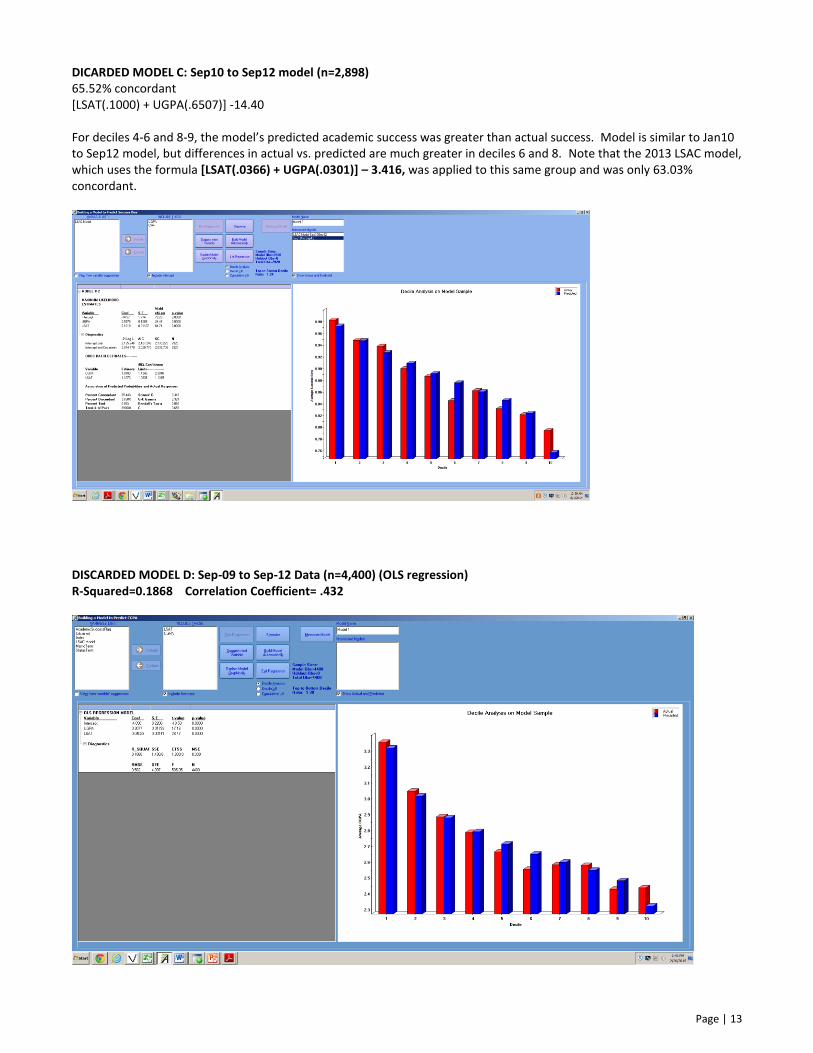
DICARDED MODEL C: Sep10 to Sep12 model (n=2,898) 65.52% concordant [LSAT(.1000) + UGPA(.6507)] -14.40 For deciles 4-6 and 8-9, the model’s predicted academic success was greater than actual success. Model is similar to Jan10 to Sep12 model, but differences in actual vs. predicted are much greater in deciles 6 and 8. Note that the 2013 LSAC model, which uses the formula [LSAT(.0366) + UGPA(.0301)] – 3.416, was applied to this same group and was only 63.03% concordant.
DISCARDED MODEL D: Sep-09 to Sep-12 Data (n=4,400) (OLS regression) R-Squared=0.1868 Correlation Coefficient= .432
Page | 14
Comparison to Discarded Model D: 2013 LSAC Model on Sep-09 to Sep-12 Data (n=4,400) (OLS regression) R-Squared=0.1864 Correlation Coefficient= .432
Comparison to Discarded Model D: WMU-Cooley Index Model on Sep-09 to Sep-12 Data (n=4,400) (OLS regression) R-Squared=0.1629 Correlation Coefficient= .404