71
OUTCOMES MEASUREMENT FOR DUMMIES…AND SMARTIES MARCH 2011
| Date post: | 20-Feb-2019 |
| Category: |
Documents |
| Upload: | nguyenminh |
| View: | 215 times |
| Download: | 0 times |
OUTCOMES MEASUREMENT FOR DUMMIES…AND SMARTIES
MARCH 2011
Don’t listen to a word I say
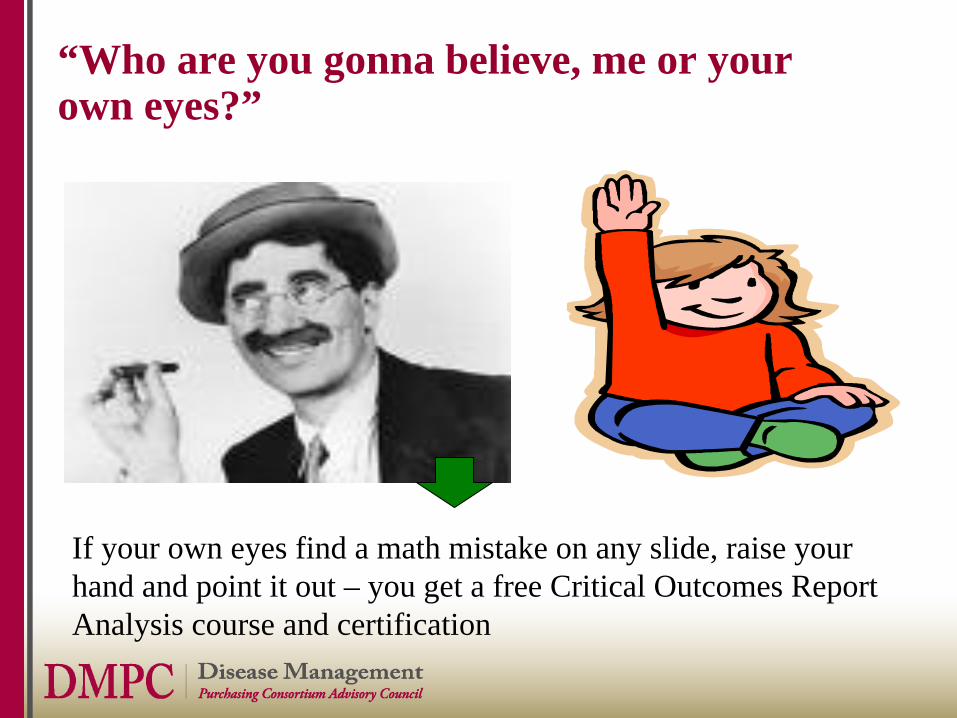
“Who are you gonna believe, me or your own eyes?”
If your own eyes find a math mistake on any slide, raise yourhand and point it out – you get a free Critical Outcomes Report Analysis course and certification
(c) 2011 DMPC www.dismgmt.com [email protected] 781 856 3962
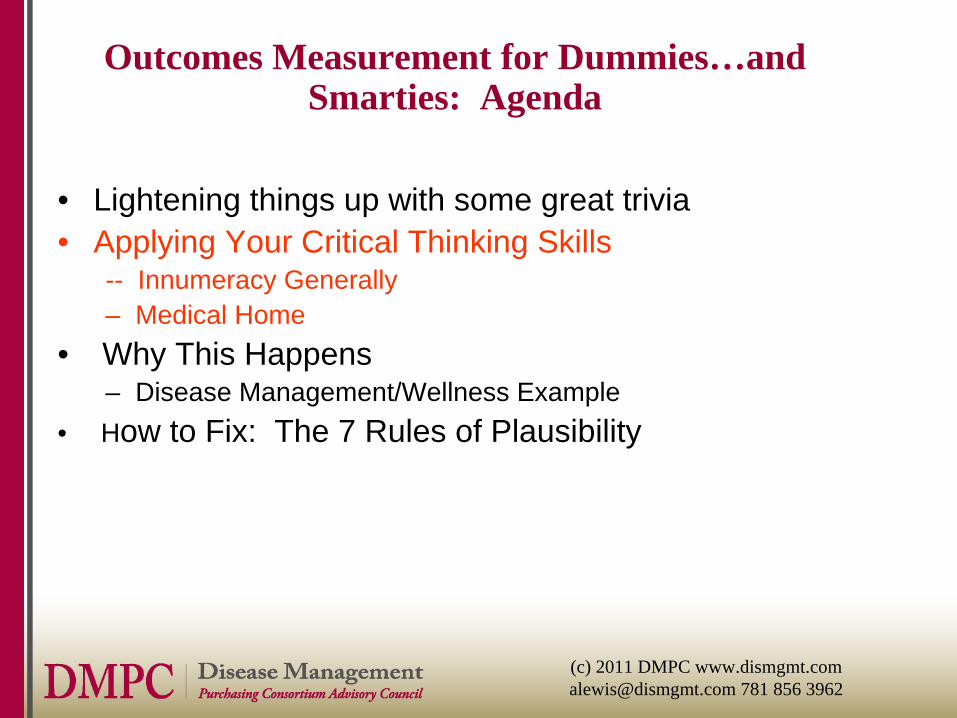
Outcomes Measurement for Dummies…and Smarties: Agenda
• Lightening things up with some great trivia• Applying Your Critical Thinking Skills
-- Innumeracy Generally– Medical Home– Disease Management/Wellness
• Why This Happens• The Seven Rules of Plausibility

#1 New York Times Bestseller
Let’s look at some of the morequantitative facts
9
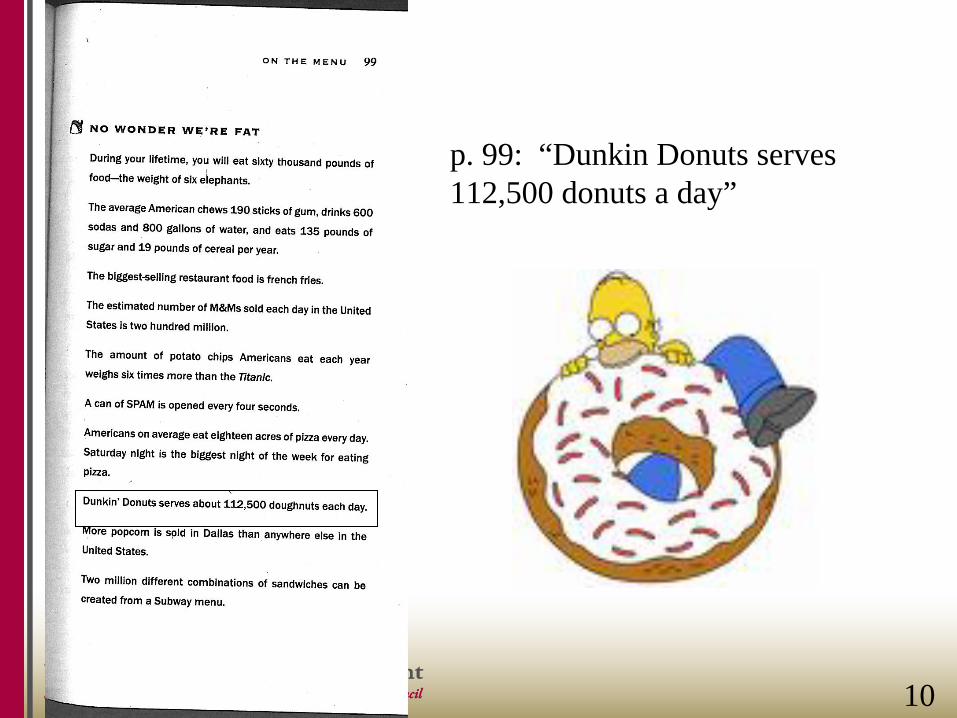
p. 99: “Dunkin Donuts serves 112,500 donuts a day”
10
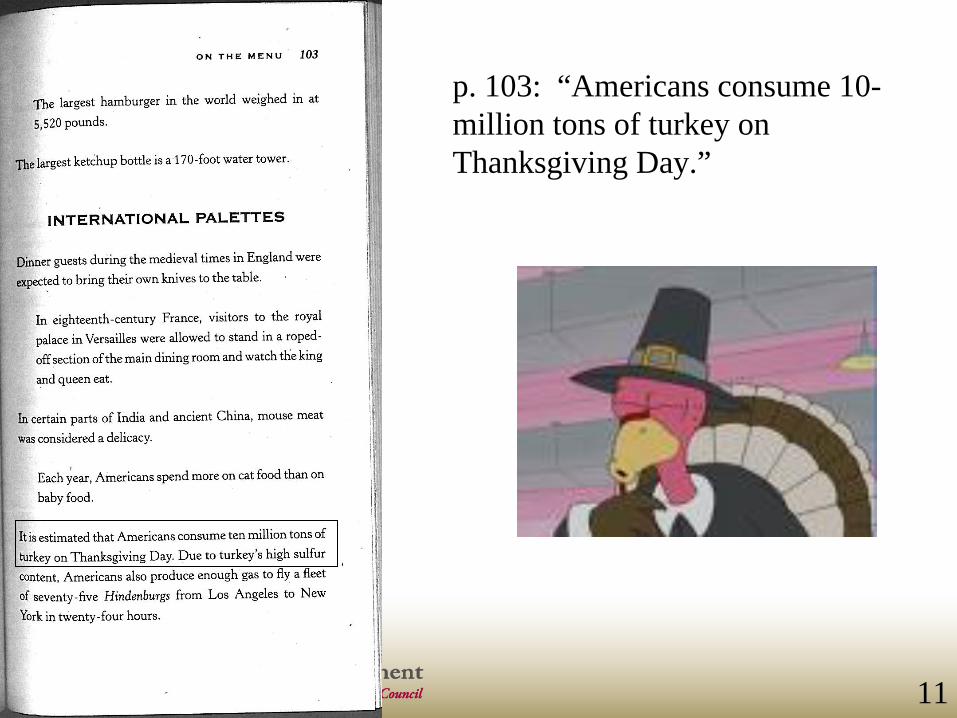
p. 103: “Americans consume 10- million tons of turkey on Thanksgiving Day.”
11

p. 111: “The original [1967] Australian fifty-cent piece had $100 of silver in it.”
12
Let’s Go On with the Show
• Back to the agenda. If there aren’t any questions or comments, we’ll get on with Outcomes Measurement for Dummies…and Smarties
(c) 2011 DMPC www.dismgmt.com [email protected] 781 856 3962
Let’s Go On with the Show
• Back to the agenda. If there aren’t any questions we’ll get on with outcomes measurement for dummies…and smarties
(c) 2011 DMPC www.dismgmt.com [email protected] 781 856 3962
Here’s Why: All these “facts” are dead wrong
• Each is off by almost TWO orders of magnitude
(c) 2011 DMPC www.dismgmt.com [email protected] 781 856 3962
And yet no reader, no reviewer, no editor noticed…and the book has been in print for 5 years. Everyone assumed thatif experts said it, it had to be right.
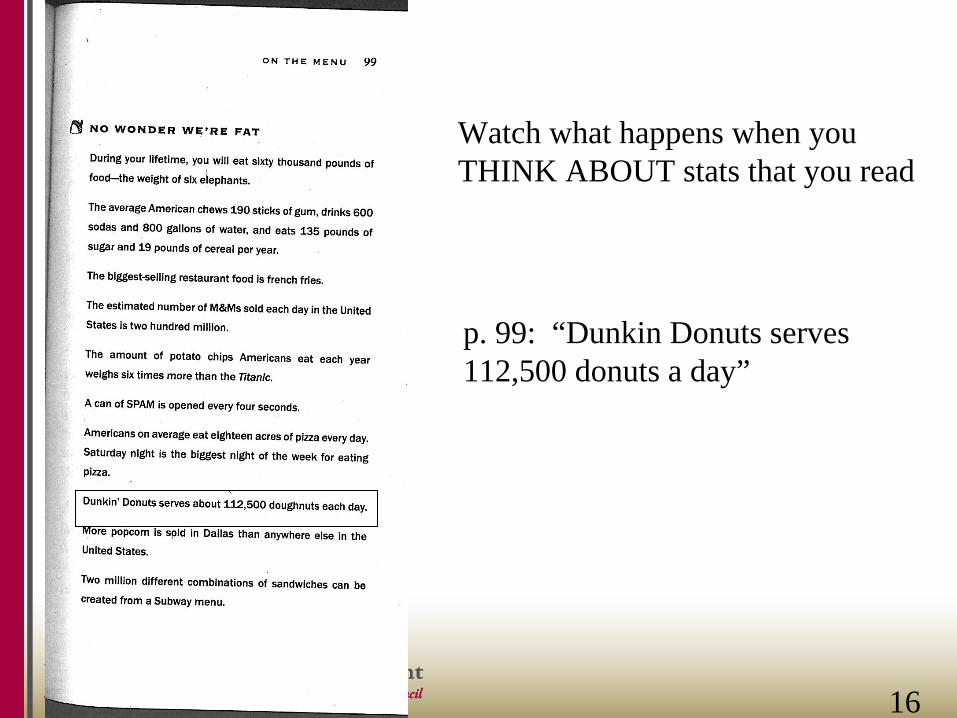
p. 99: “Dunkin Donuts serves 112,500 donuts a day”
Watch what happens when youTHINK ABOUT stats that you read
16
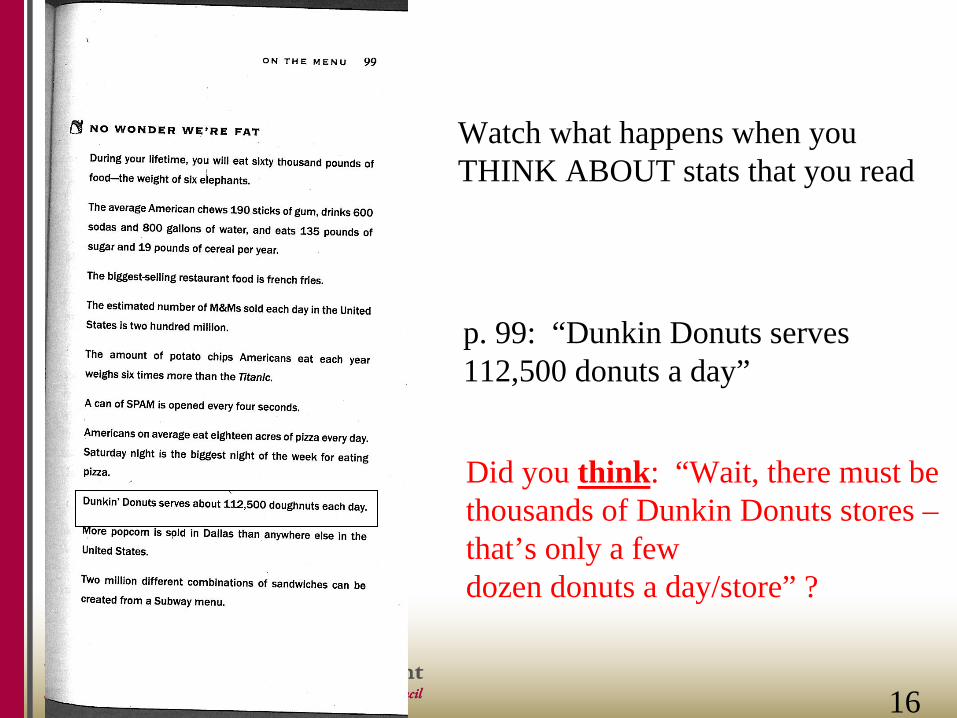
p. 99: “Dunkin Donuts serves 112,500 donuts a day”
Did you think: “Wait, there must be thousands of Dunkin Donuts stores –that’s only a few dozen donuts a day/store” ?
Watch what happens when youTHINK ABOUT stats that you read
16
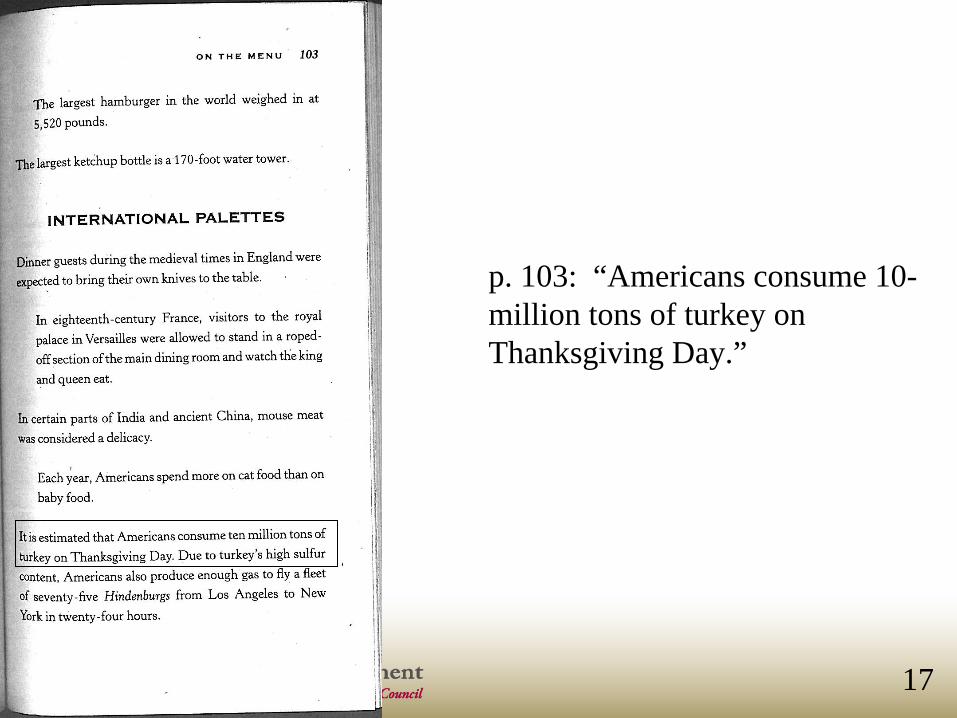
p. 103: “Americans consume 10- million tons of turkey on Thanksgiving Day.”
17
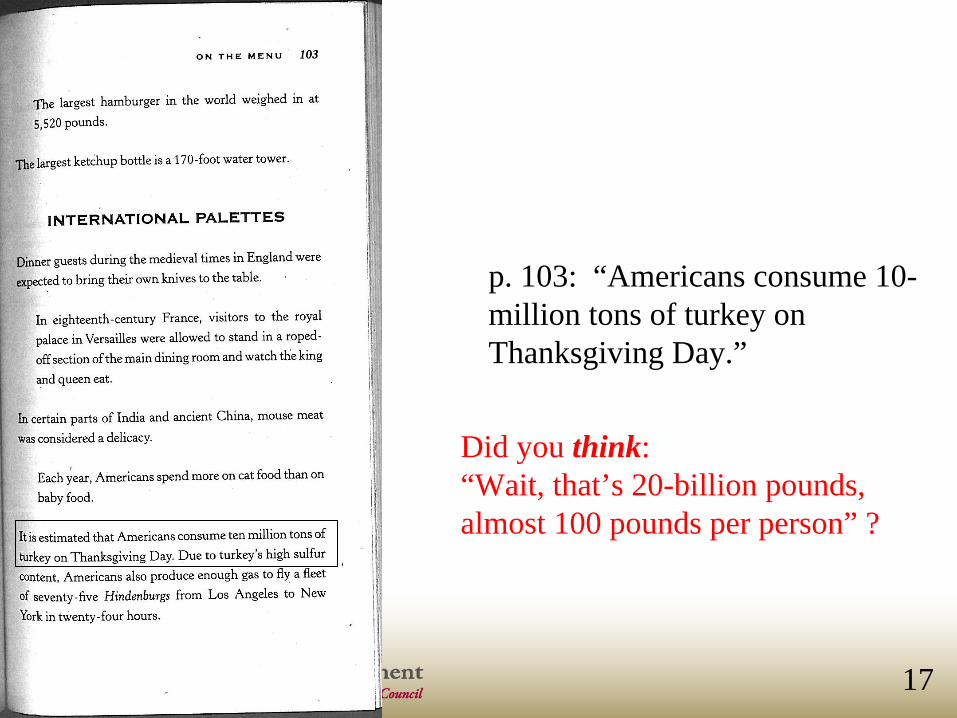
p. 103: “Americans consume 10- million tons of turkey on Thanksgiving Day.”
Did you think: “Wait, that’s 20-billion pounds,almost 100 pounds per person” ?
17
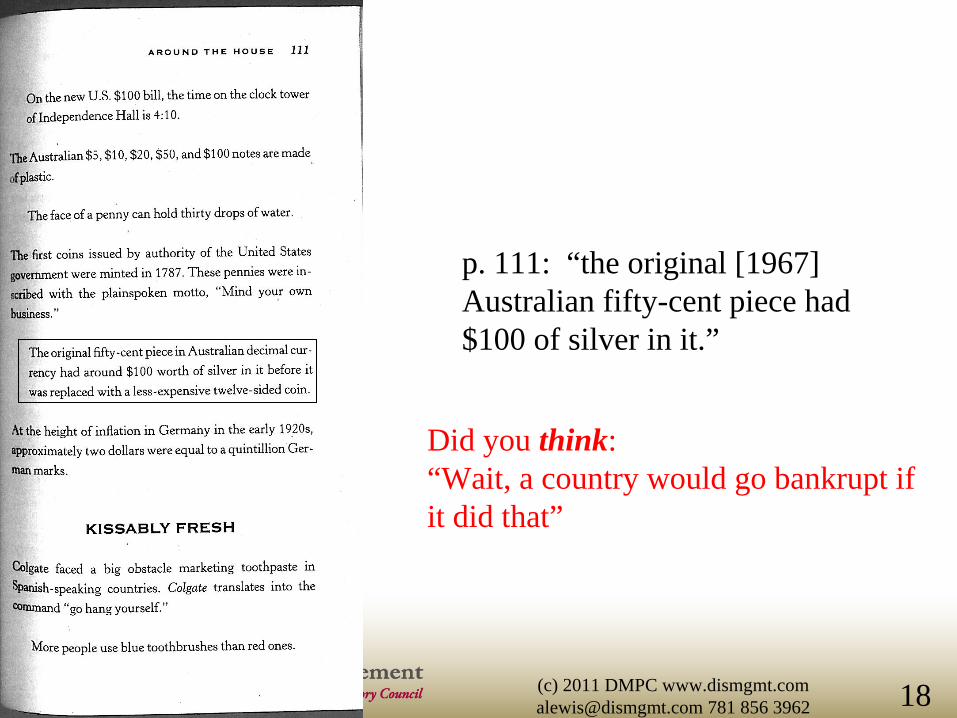
p. 111: “the original [1967] Australian fifty-cent piece had $100 of silver in it.”
Did you think:“Wait, a country would go bankrupt ifit did that”
18(c) 2011 DMPC www.dismgmt.com [email protected] 781 856 3962
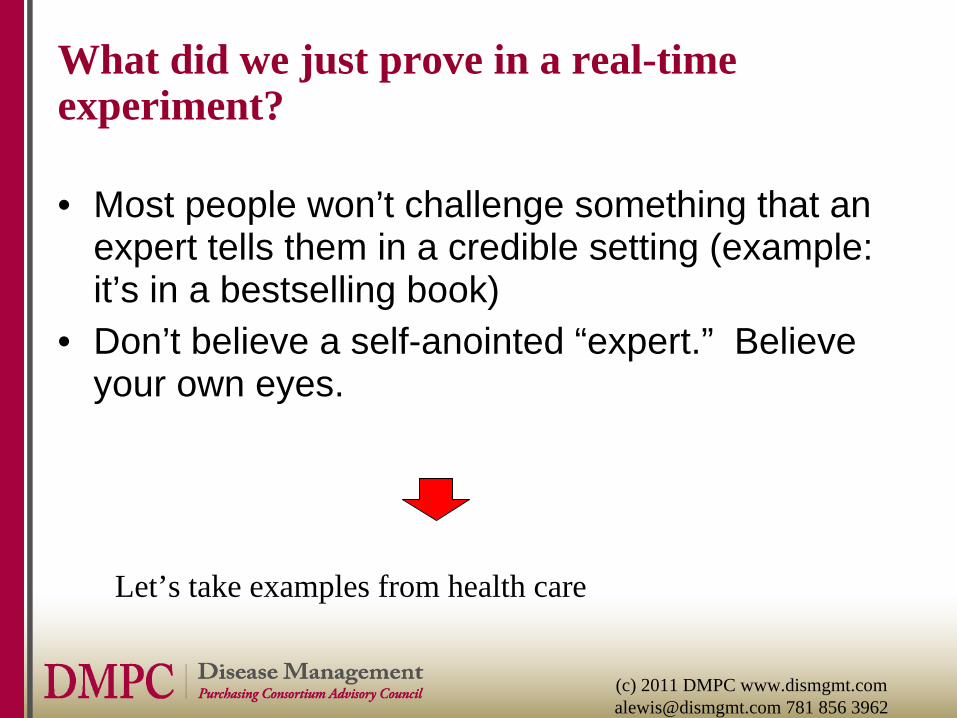
What did we just prove in a real-time experiment?
• Most people won’t challenge something that an expert tells them in a credible setting (example: it’s in a bestselling book)
• Don’t believe a self-anointed “expert.” Believe your own eyes.
(c) 2011 DMPC www.dismgmt.com [email protected] 781 856 3962
Let’s take examples from health care
(c) 2011 DMPC www.dismgmt.com [email protected] 781 856 3962
Outcomes Measurement for Dummies…and Smarties: Agenda
• Lightening things up with some great trivia• Applying Your Critical Thinking Skills
-- Innumeracy Generally– Medical Home
• Why This Happens– Disease Management/Wellness Example
• How to Fix: The 7 Rules of Plausibility
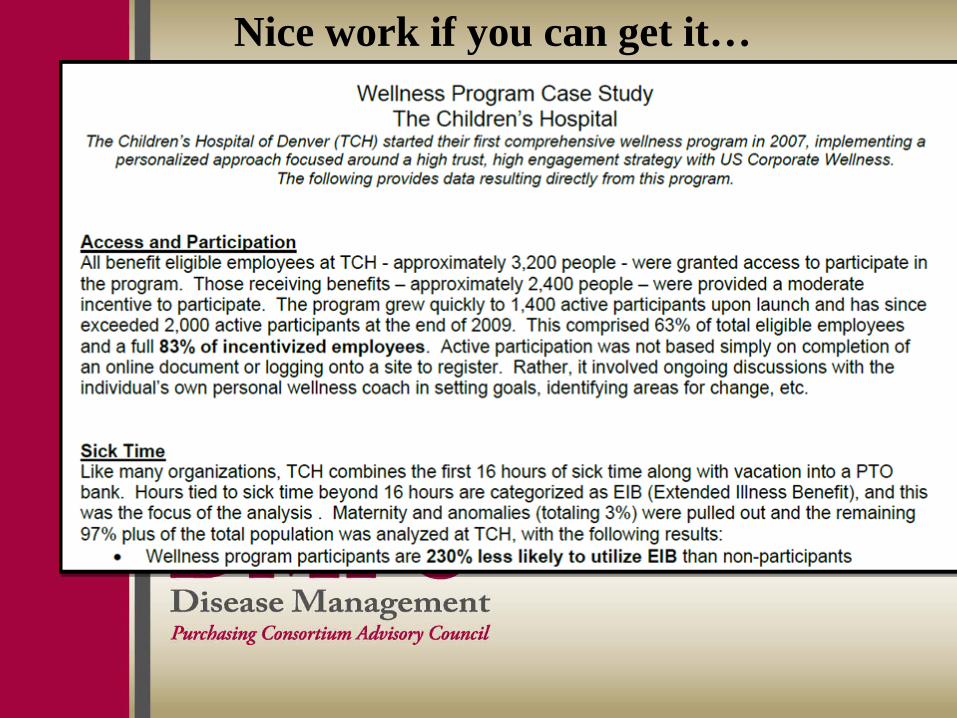
Nice work if you can get it…
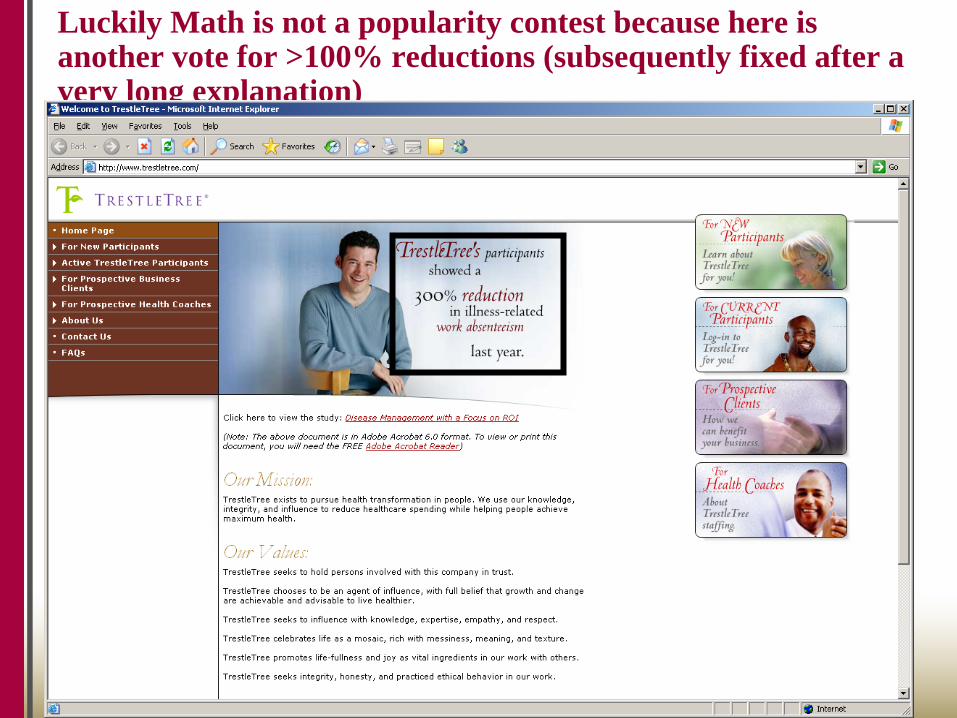
Luckily Math is not a popularity contest because here is another vote for >100% reductions (subsequently fixed after a very long explanation)
(c) 2011 DMPC www.dismgmt.com [email protected] 781 856 3962
Next example: Medical Homes
(c) 2011 DMPC www.dismgmt.com [email protected] 781 856 3962
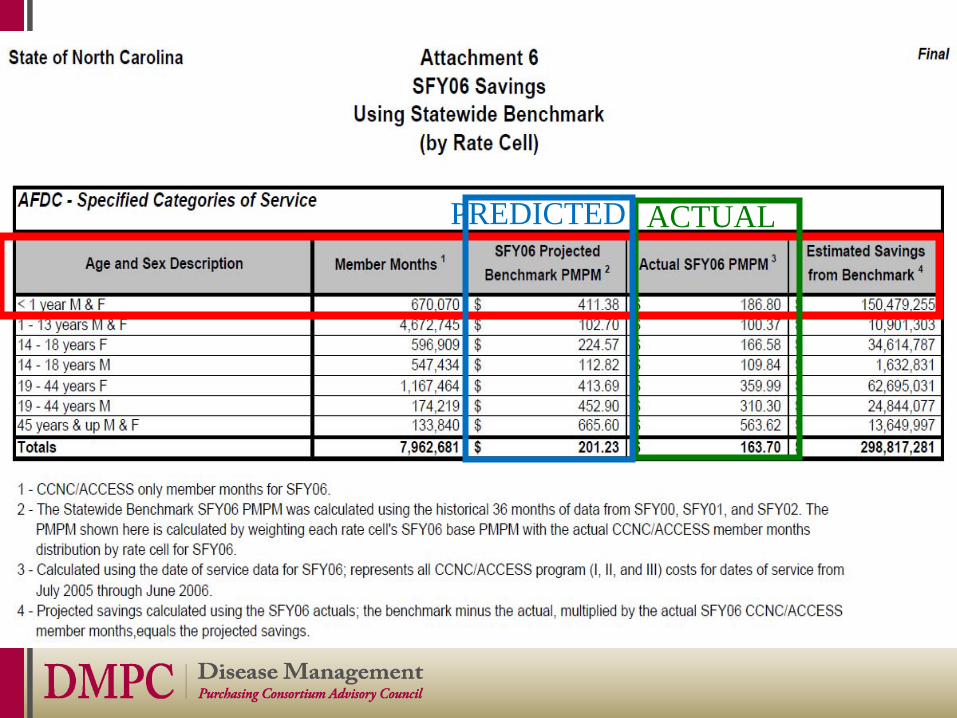
•Mercer analysis for North Carolina Medicaid
•Finding was: “The [state] saved $284-million to $314-million in [fiscal] 2006 (the last year studied)”, vs. prediction
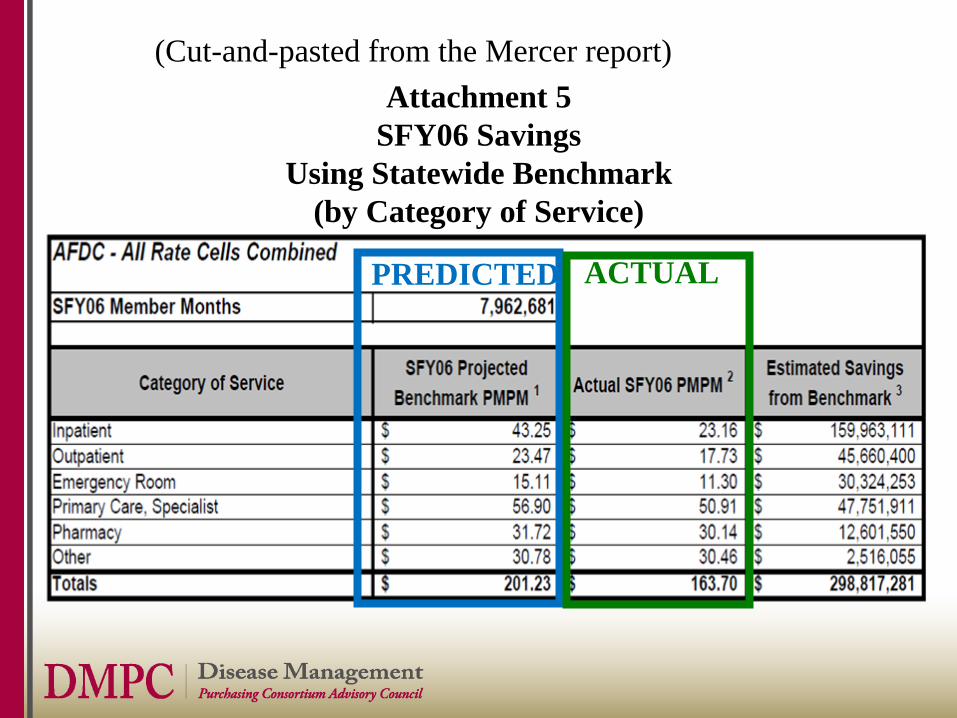
Attachment 5SFY06 Savings
Using Statewide Benchmark(by Category of Service)
(Cut-and-pasted from the Mercer report)
PREDICTED ACTUAL
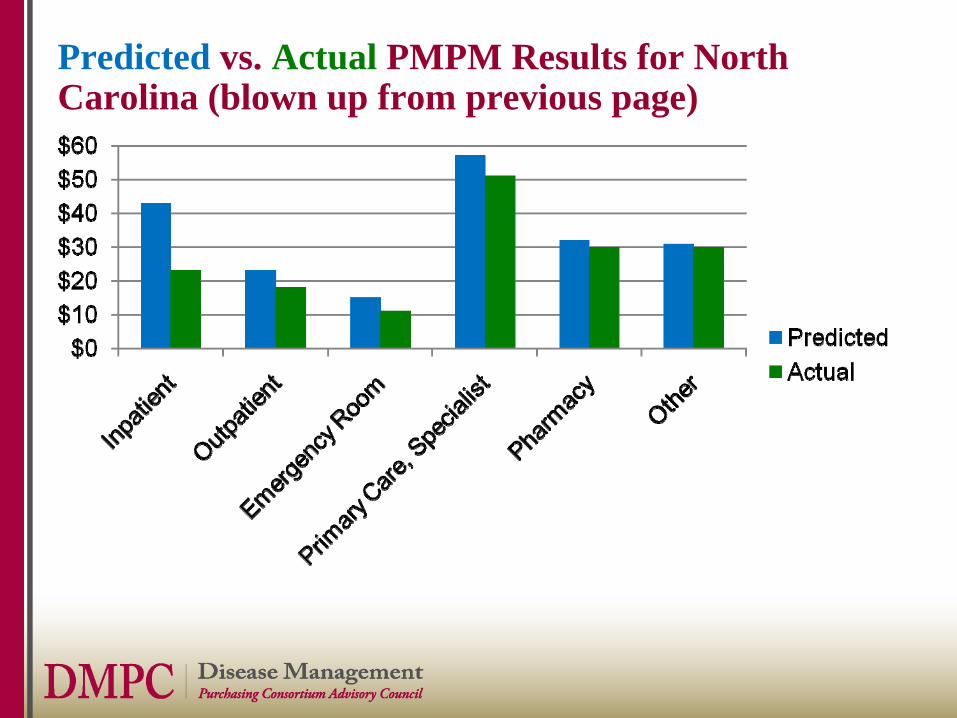
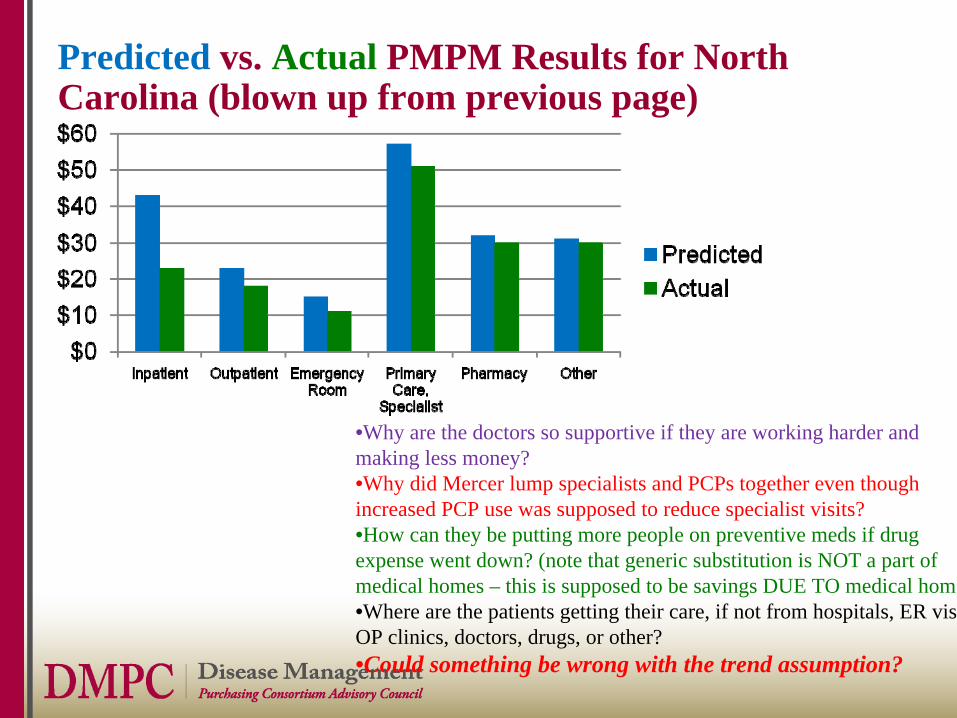
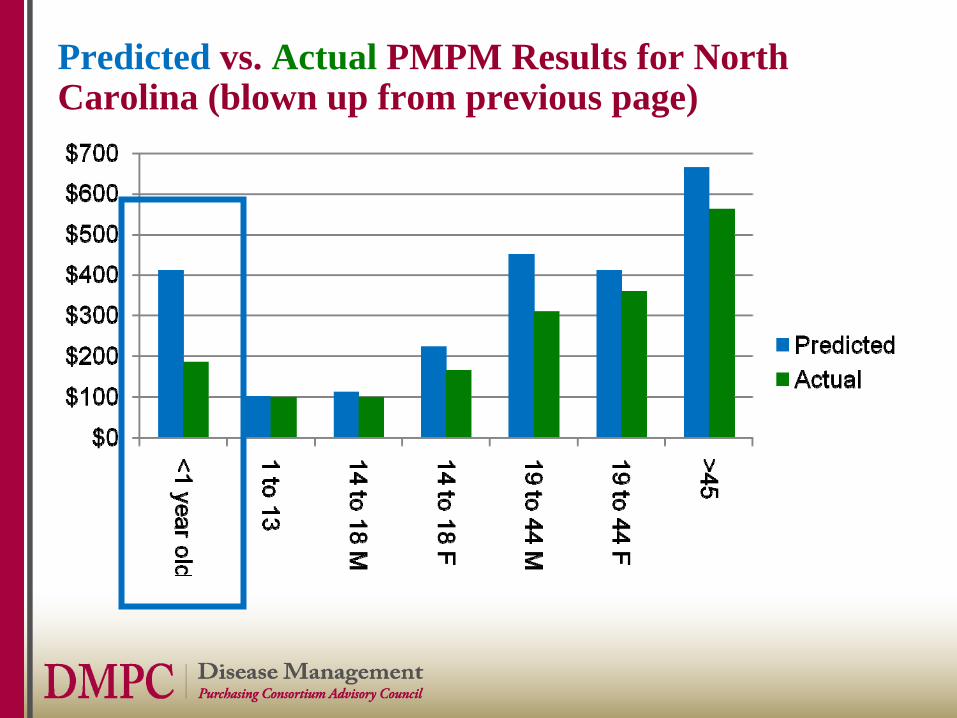
Predicted vs. Actual PMPM Results for North Carolina (blown up from previous page)
Predicted vs. Actual PMPM Results for North Carolina (blown up from previous page)
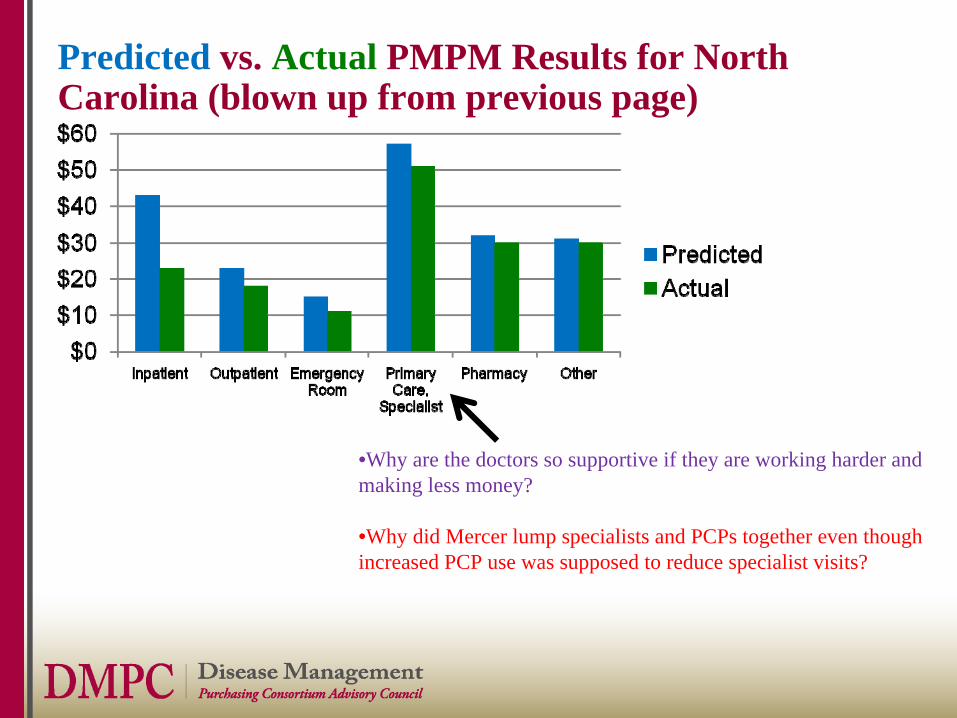
•Why are the doctors so supportive if they are working harder and making less money?
•Why did Mercer lump specialists and PCPs together even though increased PCP use was supposed to reduce specialist visits?
Predicted vs. Actual PMPM Results for North Carolina (blown up from previous page)
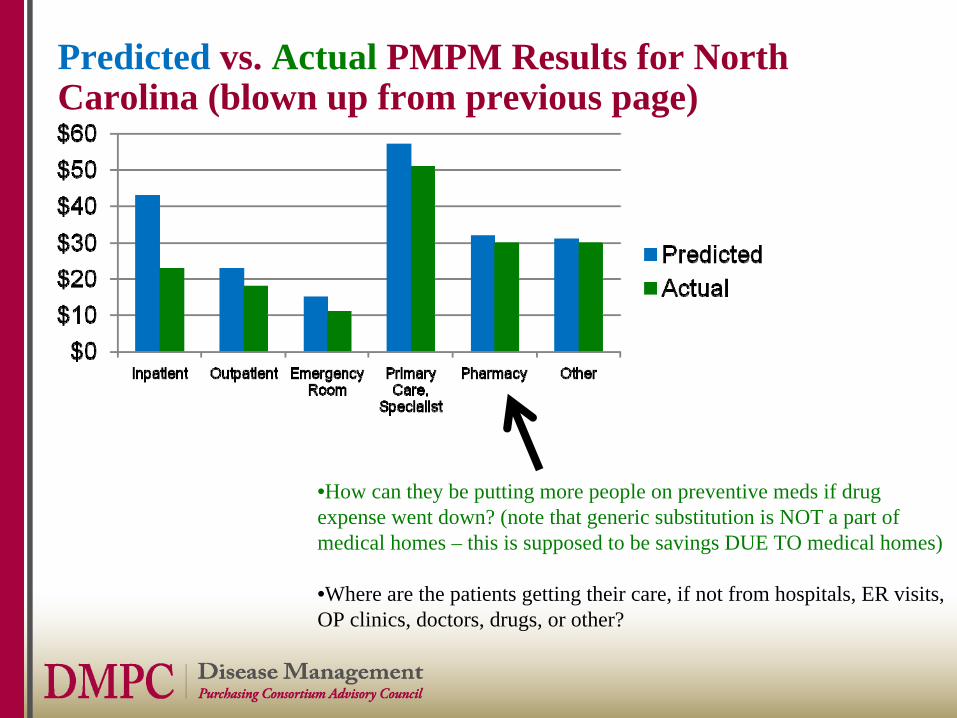
•How can they be putting more people on preventive meds if drug expense went down? (note that generic substitution is NOT a part of medical homes – this is supposed to be savings DUE TO medical homes)
•Where are the patients getting their care, if not from hospitals, ER visits, OP clinics, doctors, drugs, or other?
Predicted vs. Actual PMPM Results for North Carolina (blown up from previous page)
•Why are the doctors so supportive if they are working harder and making less money?•Why did Mercer lump specialists and PCPs together even though increased PCP use was supposed to reduce specialist visits?•How can they be putting more people on preventive meds if drug expense went down? (note that generic substitution is NOT a part of medical homes – this is supposed to be savings DUE TO medical home•Where are the patients getting their care, if not from hospitals, ER vis OP clinics, doctors, drugs, or other?•Could something be wrong with the trend assumption?
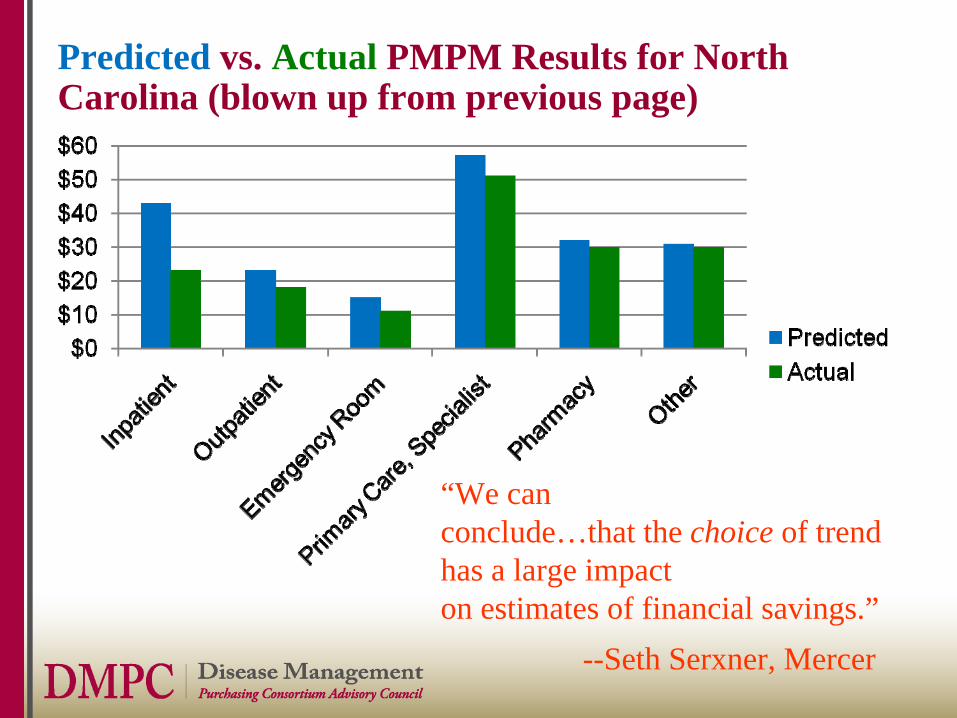
Predicted vs. Actual PMPM Results for North Carolina (blown up from previous page)
“We canconclude…that the choice of trend has a large impacton estimates of financial savings.”
--Seth Serxner, Mercer
Draw Your Own Conclusions – Use Your Own Eyes
• Can uses of all resources decline?• Could the “choice” of trend have been
influenced by the desired outcome?
Now let’s apply the one of the Rules of Plausibility: The 100% Rule (like US Corporate Wellness and Trestletree)
• When you are looking to determine if a savings outcome is wrong, you focus on the biggest number.
• If that number is wrong, so are all the others (analysis all done the same way)
• Let’s see if we can find a 100% Rule violation in the biggest number
PREDICTED ACTUAL
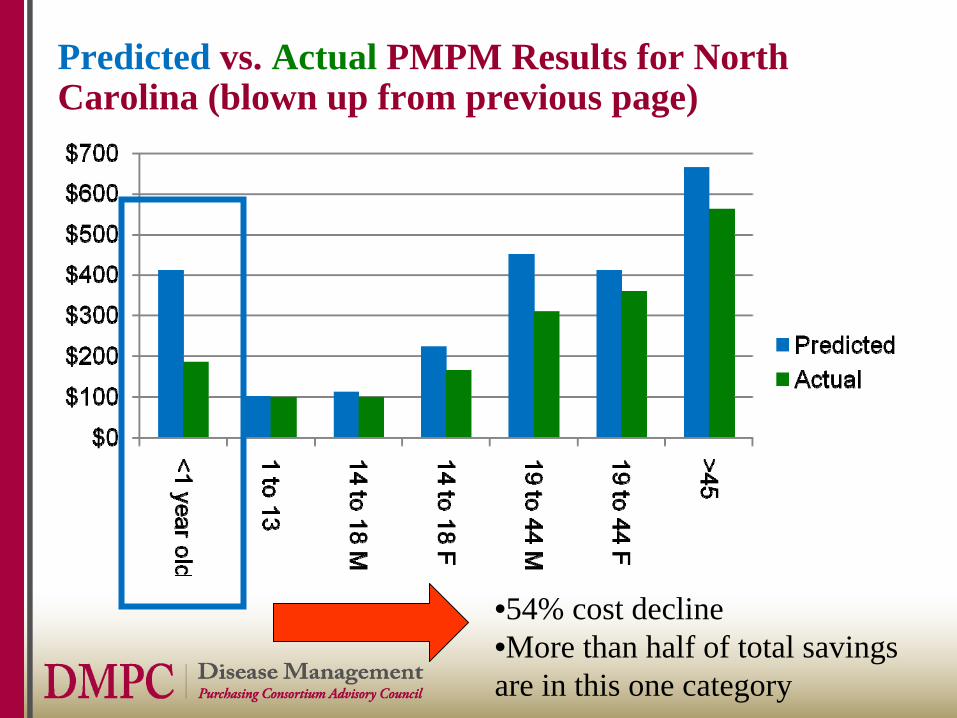
Predicted vs. Actual PMPM Results for North Carolina (blown up from previous page)
Predicted vs. Actual PMPM Results for North Carolina (blown up from previous page)
•54% cost decline•More than half of total savingsare in this one category
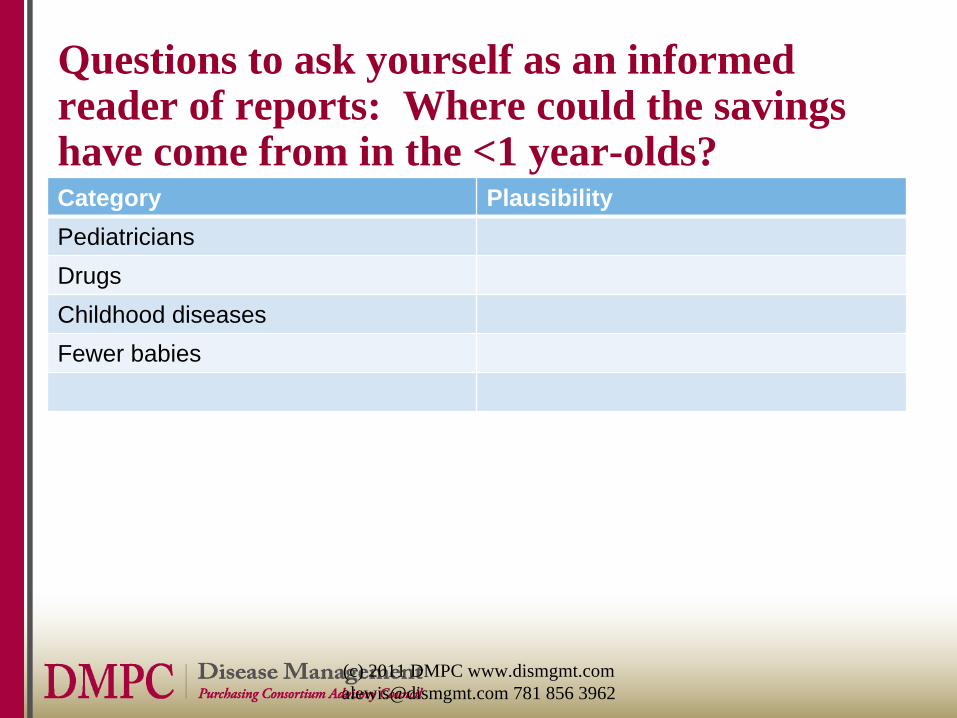
Questions to ask yourself as an informed reader of reports: Where could the savings have come from in the <1 year-olds?Category Plausibility PediatriciansDrugsChildhood diseasesFewer babies
(c) 2011 DMPC www.dismgmt.com [email protected] 781 856 3962
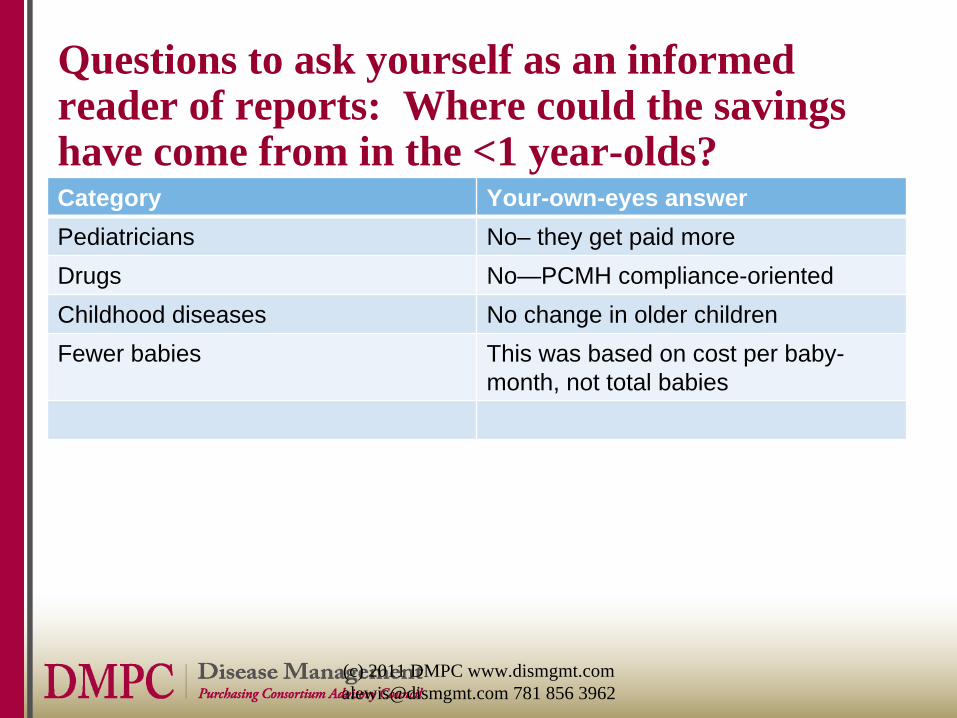
Questions to ask yourself as an informed reader of reports: Where could the savings have come from in the <1 year-olds?Category Your-own-eyes answerPediatricians No– they get paid moreDrugs No—PCMH compliance-orientedChildhood diseases No change in older childrenFewer babies This was based on cost per baby-
month, not total babies
(c) 2011 DMPC www.dismgmt.com [email protected] 781 856 3962
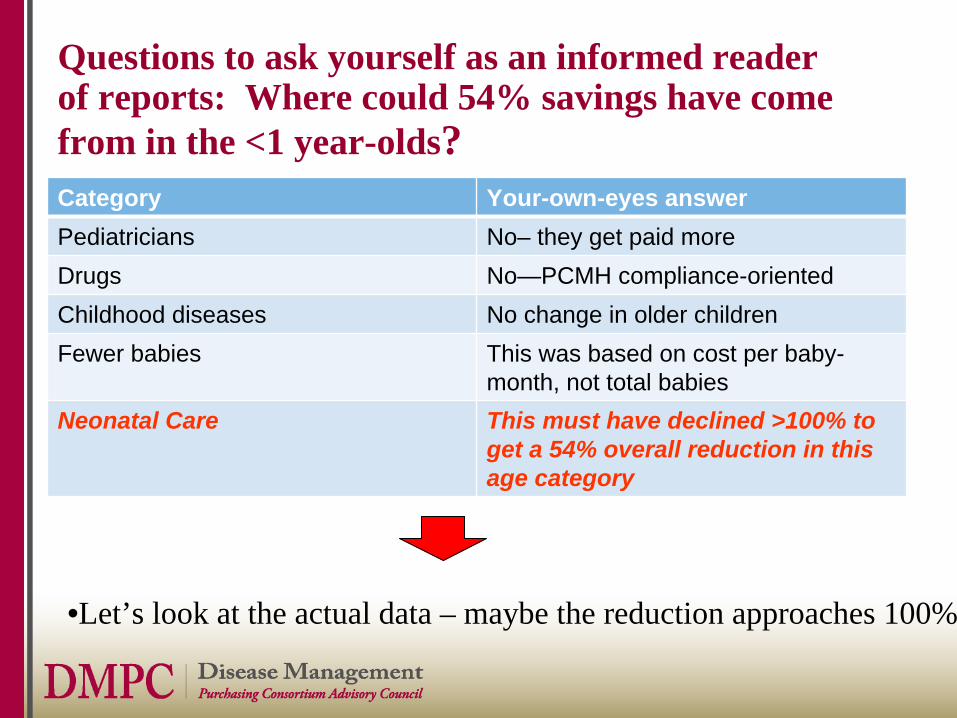
Questions to ask yourself as an informed reader of reports: Where could 54% savings have come from in the <1 year-olds?Category Your-own-eyes answerPediatricians No– they get paid moreDrugs No—PCMH compliance-orientedChildhood diseases No change in older childrenFewer babies This was based on cost per baby-
month, not total babiesNeonatal Care This must have declined >100% to
get a 54% overall reduction in this age category
•Let’s look at the actual data – maybe the reduction approaches 100%
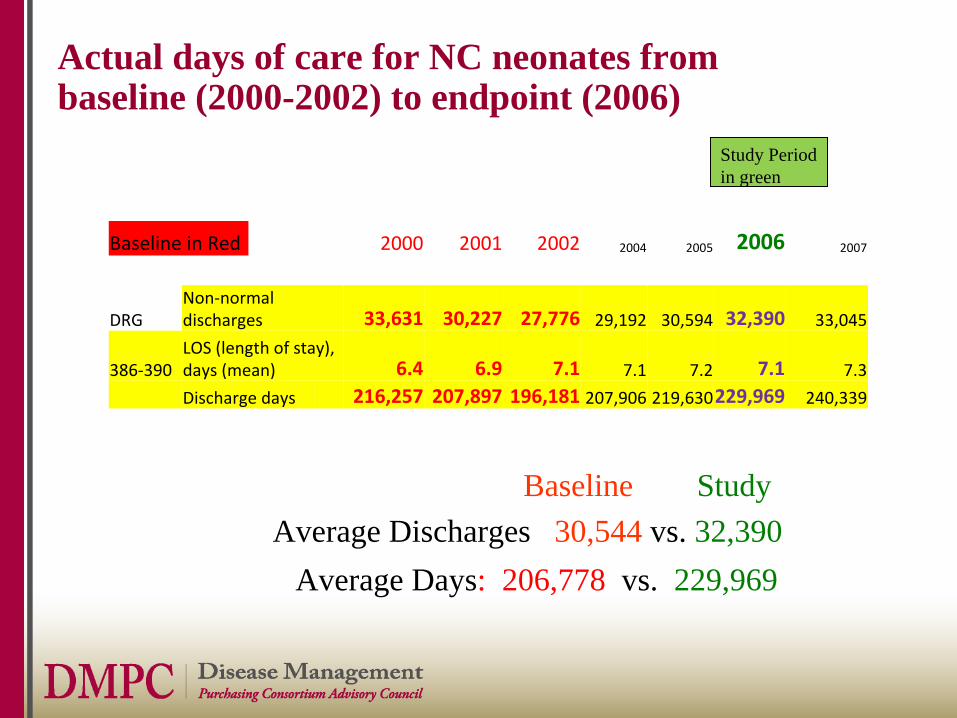
Actual days of care for NC neonates from baseline (2000-2002) to endpoint (2006)
Baseline in Red 2000 2001 2002 2004 2005 2006 2007
DRGNon‐normal
discharges 33,631 30,227 27,776 29,192 30,594 32,390 33,045
386‐390LOS (length of stay),
days (mean) 6.4 6.9 7.1 7.1 7.2 7.1 7.3
Discharge days 216,257 207,897 196,181 207,906 219,630229,969 240,339
Study Period in green
Average Days: 206,778 vs. 229,969Average Discharges 30,544 vs. 32,390
Baseline Study
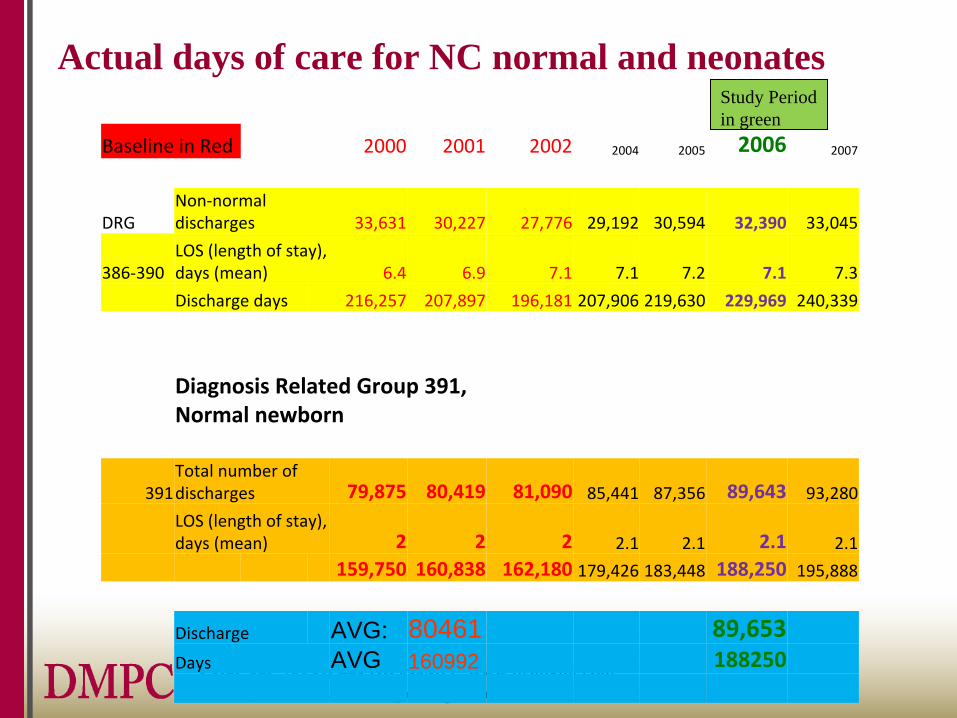
Actual days of care for NC normal and neonates
(c) 2011 DMPC www.dismgmt.com [email protected] 781 856 3962
Baseline in Red 2000 2001 2002 2004 2005 2006 2007
DRGNon‐normal
discharges 33,631 30,227 27,776 29,192 30,594 32,390 33,045
386‐390LOS (length of stay),
days (mean) 6.4 6.9 7.1 7.1 7.2 7.1 7.3
Discharge days 216,257 207,897 196,181 207,906 219,630 229,969 240,339
Diagnosis Related Group 391,
Normal newborn
391Total number of
discharges 79,875 80,419 81,090 85,441 87,356 89,643 93,280
LOS (length of stay),
days (mean) 2 2 2 2.1 2.1 2.1 2.1
159,750 160,838 162,180 179,426 183,448 188,250 195,888
Discharge AVG: 80461 89,653Days AVG 160992 188250
Study Period in green
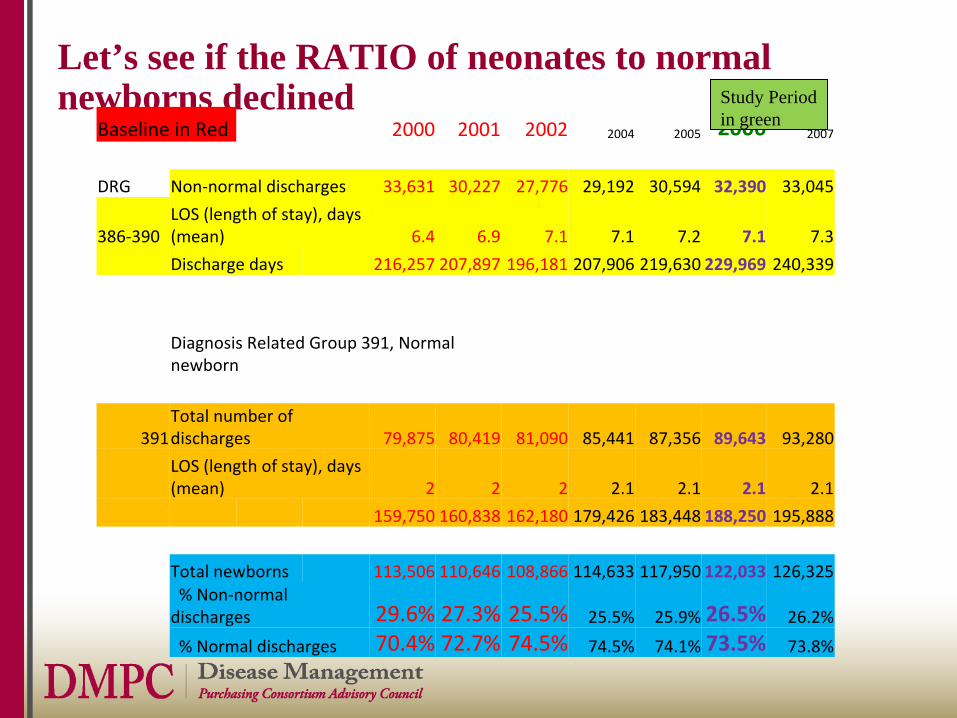
Let’s see if the RATIO of neonates to normal newborns declined
Baseline in Red 2000 2001 2002 2004 2005 2006 2007
DRG Non‐normal discharges 33,631 30,227 27,776 29,192 30,594 32,390 33,045
386‐390LOS (length of stay), days
(mean) 6.4 6.9 7.1 7.1 7.2 7.1 7.3
Discharge days 216,257 207,897 196,181 207,906 219,630 229,969 240,339
Diagnosis Related Group 391, Normal
newborn
391Total number of
discharges 79,875 80,419 81,090 85,441 87,356 89,643 93,280
LOS (length of stay), days
(mean) 2 2 2 2.1 2.1 2.1 2.1
159,750 160,838 162,180 179,426 183,448 188,250 195,888
Total newborns 113,506 110,646 108,866 114,633 117,950 122,033 126,325% Non‐normal
discharges 29.6% 27.3% 25.5% 25.5% 25.9% 26.5% 26.2%
% Normal discharges 70.4% 72.7% 74.5% 74.5% 74.1% 73.5% 73.8%
Study Period in green
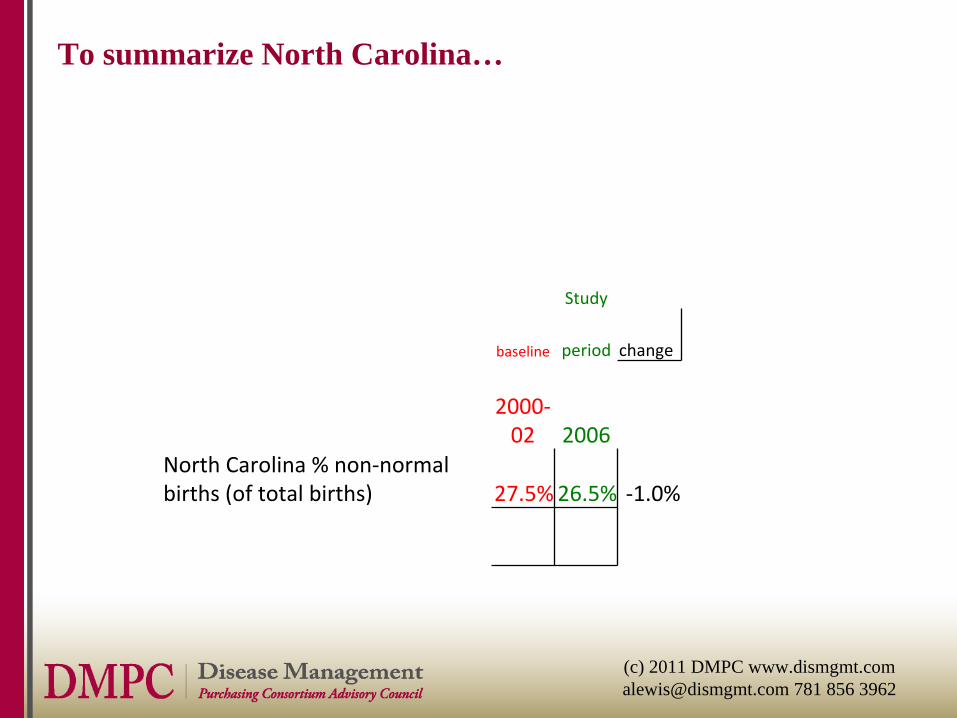
To summarize North Carolina…
(c) 2011 DMPC www.dismgmt.com [email protected] 781 856 3962
Study
baseline period change
2000‐
02 2006
North Carolina % non‐normal
births (of total births) 27.5%26.5% ‐1.0%
North Carolina: >100% needed, 1% found*
• Maybe the neonatal rate would have gone way up absent medical home
• Let’s compare North Carolina to South Carolina to test that hypothesis
(c) 2011 DMPC www.dismgmt.com [email protected] 781 856 3962
*technically speaking, that is 1 percentage point, not 1%
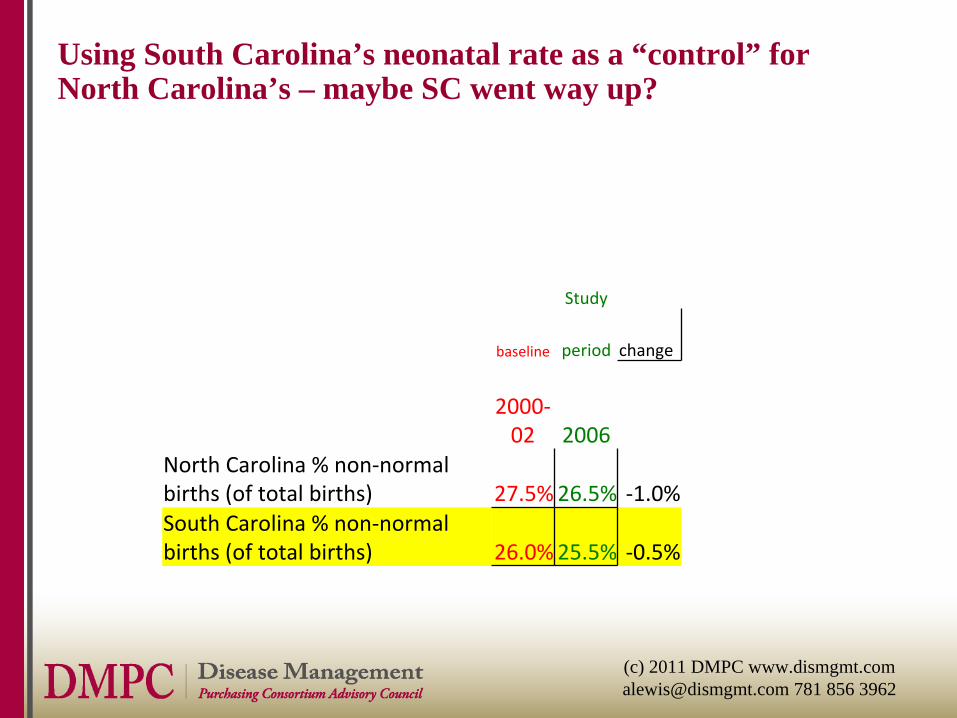
Using South Carolina’s neonatal rate as a “control” for North Carolina’s – maybe SC went way up?
(c) 2011 DMPC www.dismgmt.com [email protected] 781 856 3962
Study
baseline period change
2000‐
02 2006
North Carolina % non‐normal
births (of total births) 27.5%26.5% ‐1.0%South Carolina % non‐normal
births (of total births) 26.0%25.5% ‐0.5%
Which do you believe?
• Mercer’s NC analysis• Your own eyes
(c) 2011 DMPC www.dismgmt.com [email protected] 781 856 3962
Which do you believe?
• Mercer’s analysis • Your own eyes
(c) 2011 DMPC www.dismgmt.com [email protected] 781 856 3962
Why might there be a large gap between your own eyesAnd what vendors/consultants tell you?
(c) 2011 DMPC www.dismgmt.com [email protected] 781 856 3962
Outcomes Measurement for Dummies…and Smarties: Agenda
• Lightening things up with some great trivia• Applying Your Critical Thinking Skills
-- Innumeracy Generally– Medical Home
• Why This Happens– Disease Management/Wellness Example
• How to Fix: The 7 Rules of Plausibility
“Whole disease population” is usually the basis for measuring any chronic disease program
• All Identifiable members with the disease in question
“Whole Disease Population” ? Really? Could there be people with the disease you can’t identify…
• …Who might have a condition though they are not identifiable?– Let’s call these people “tails”– “Tails” have lower cost since they don’t have enough
claims to be identified
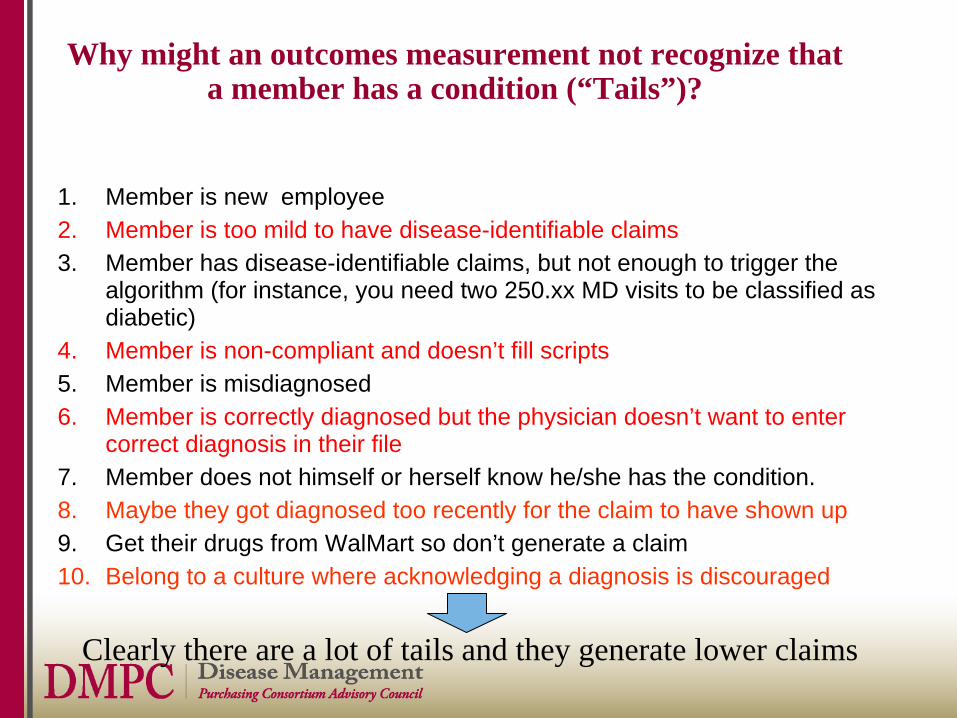
Why might an outcomes measurement not recognize that a member has a condition (“Tails”)?
1. Member is new employee2. Member is too mild to have disease-identifiable claims3. Member has disease-identifiable claims, but not enough to trigger the
algorithm (for instance, you need two 250.xx MD visits to be classified as diabetic)
4. Member is non-compliant and doesn’t fill scripts5. Member is misdiagnosed6. Member is correctly diagnosed but the physician doesn’t want to enter
correct diagnosis in their file7. Member does not himself or herself know he/she has the condition.8. Maybe they got diagnosed too recently for the claim to have shown up9. Get their drugs from WalMart so don’t generate a claim10. Belong to a culture where acknowledging a diagnosis is discouraged
Clearly there are a lot of tails and they generate lower claims
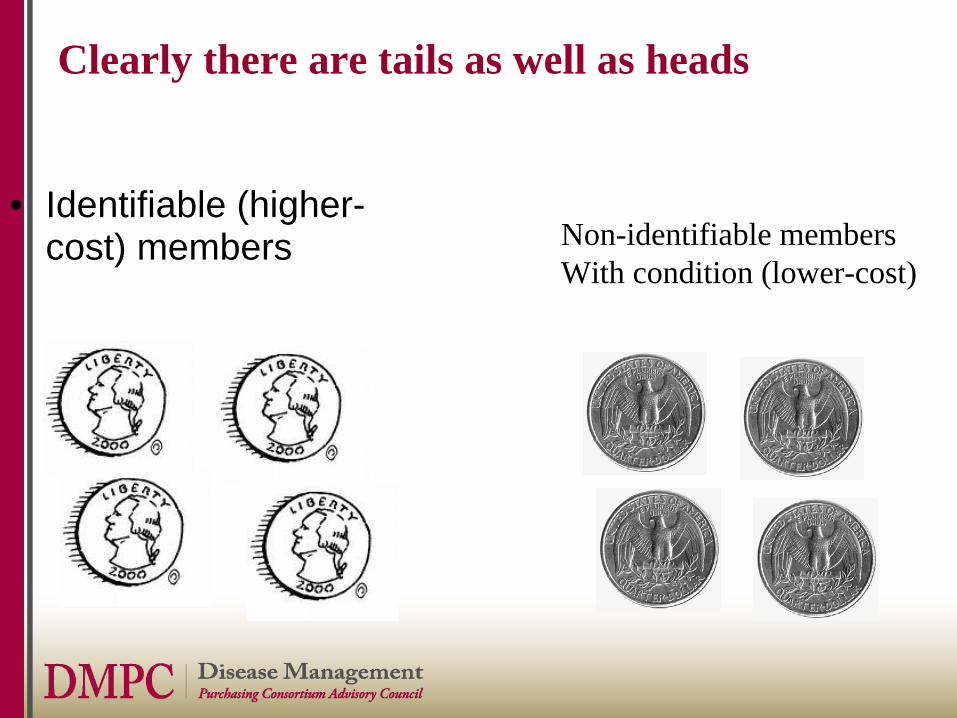
Clearly there are tails as well as heads
• Identifiable (higher- cost) members Non-identifiable members
With condition (lower-cost)
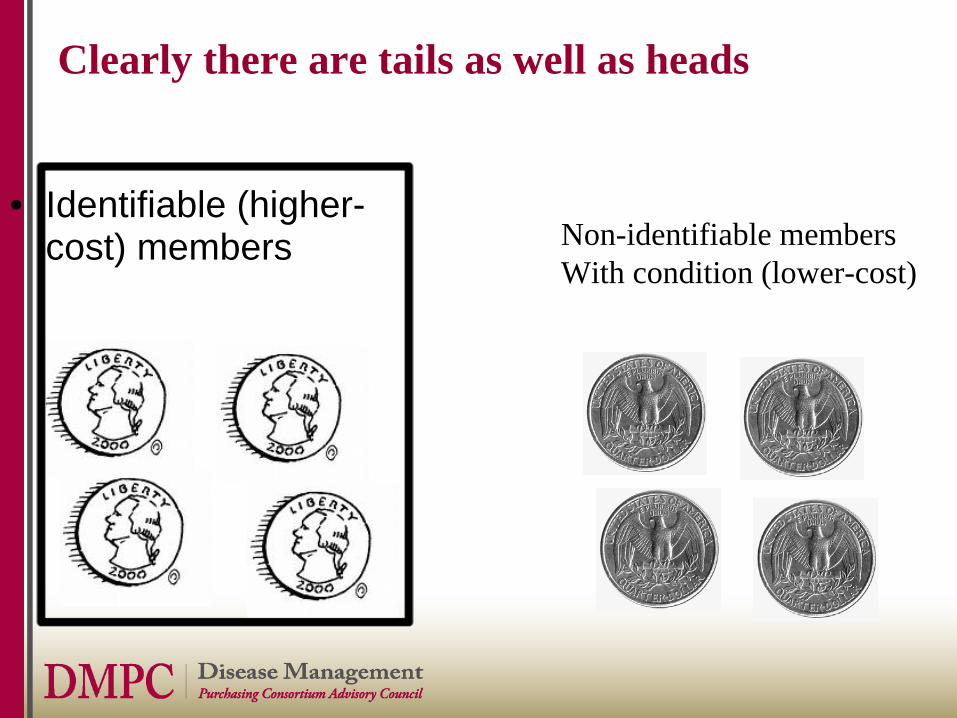
Clearly there are tails as well as heads
• Identifiable (higher- cost) members Non-identifiable members
With condition (lower-cost)
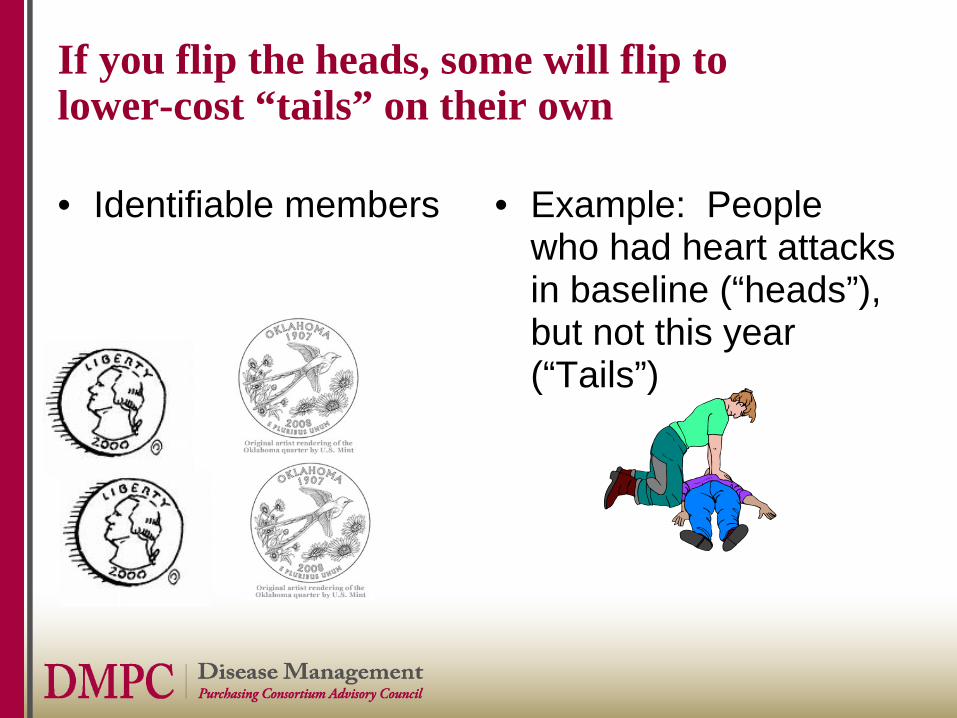
If you flip the heads, some will flip to lower-cost “tails” on their own
• Identifiable members • Example: People who had heart attacks in baseline (“heads”), but not this year (“Tails”)
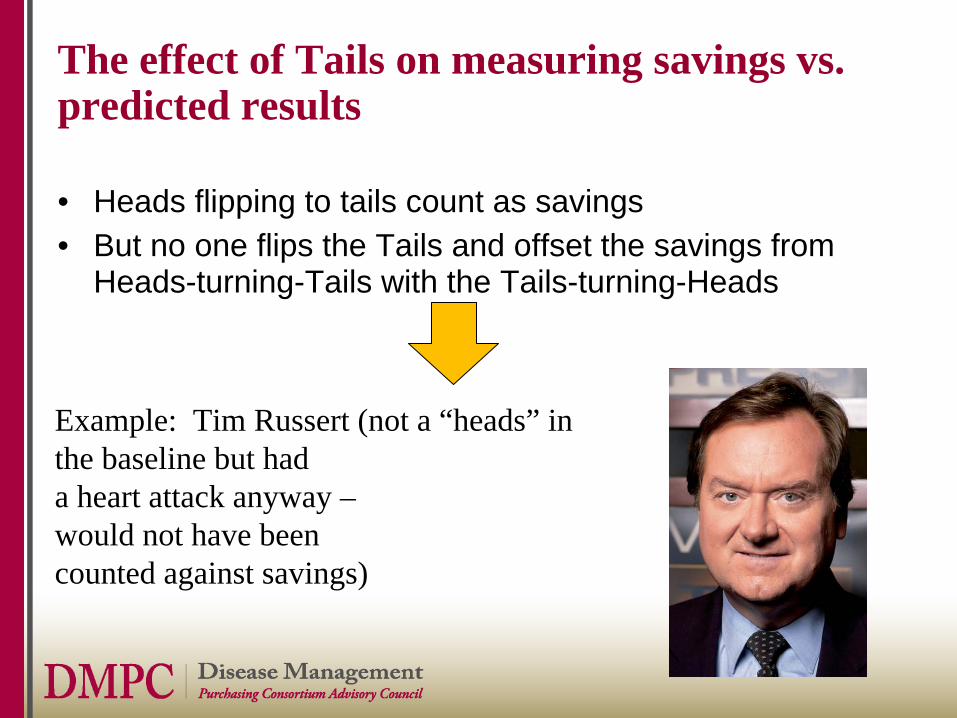
The effect of Tails on measuring savings vs. predicted results
• Heads flipping to tails count as savings• But no one flips the Tails and offset the savings from
Heads-turning-Tails with the Tails-turning-Heads
Example: Tim Russert (not a “heads” in the baseline but had a heart attack anyway –would not have been counted against savings)
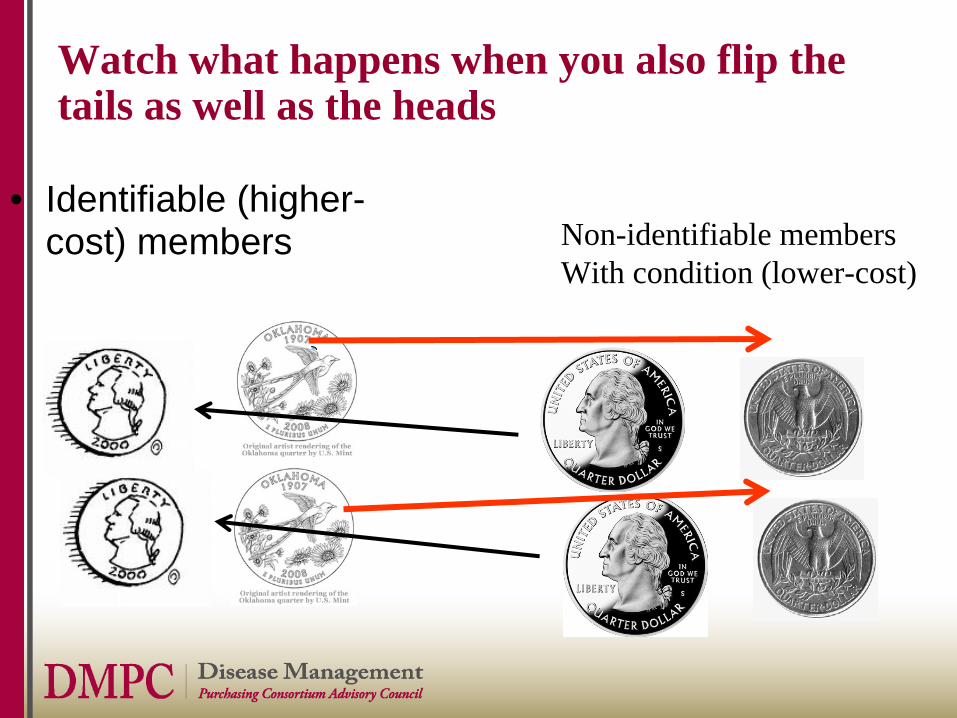
Watch what happens when you also flip the tails as well as the heads
• Identifiable (higher- cost) members Non-identifiable members
With condition (lower-cost)
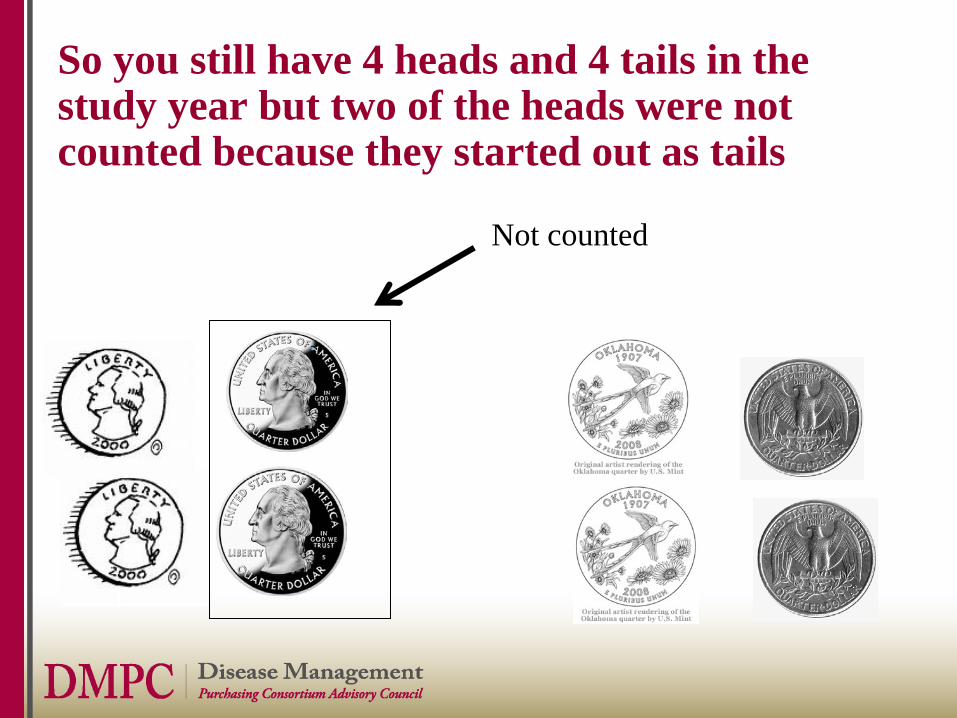
So you still have 4 heads and 4 tails in the study year but two of the heads were not counted because they started out as tails
Not counted
Example of Using Heads-to-Tails to Create Guaranteed Savings: XXX Wellness
• XXX guarantees a 30% shift from high/medium risk to low risk
• Note in the following slides that only the heads- to-tails (risk reduction in high-risk people) is counted, not the tails to heads (risk increase in low-risk people)
Asthmatic #2 was only counted –going forward -- AFTER he flipped to “Heads”
• Heads-Tails happens in wellness too, not just DM– Smoking hypothetical– Navistar obesity program
• Let’s look at a two real cases of heads-tails– Note: heads/tails also invalidates trend, which is why
the Mercer numbers were so far off, but that’s too much detail for this keynote
(c) 2011 DMPC www.dismgmt.com [email protected] 781 856 3962
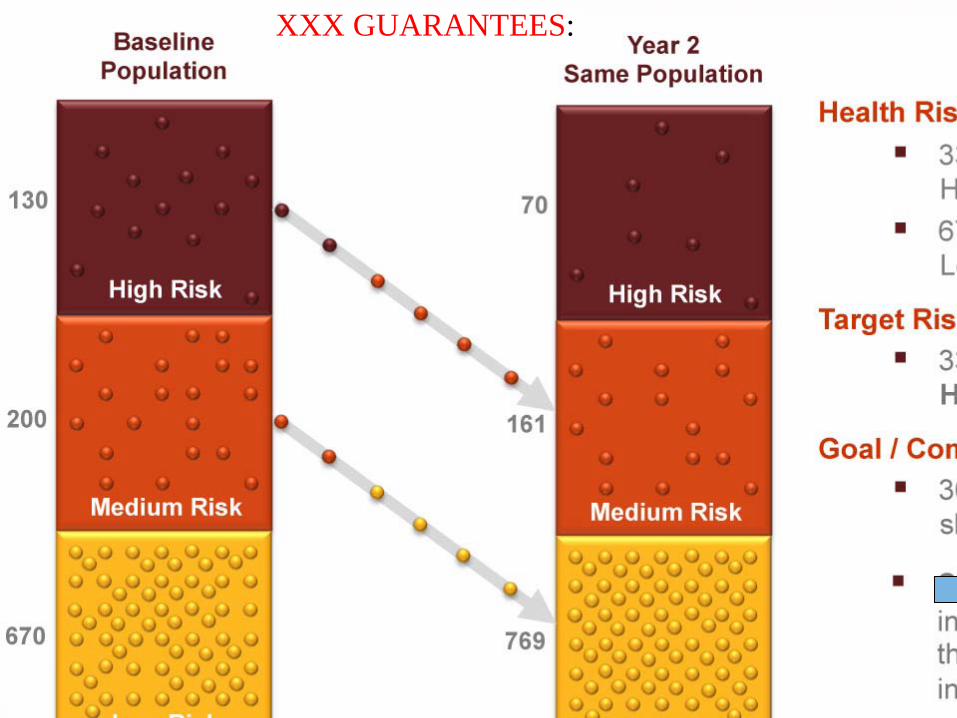
XXX GUARANTEES:
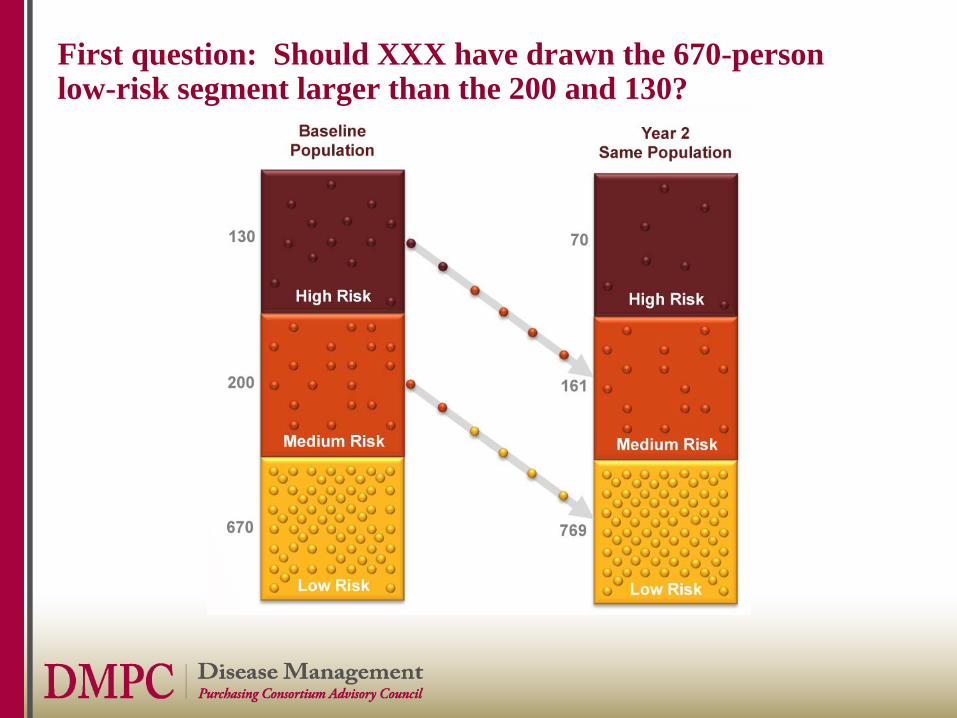
First question: Should XXX have drawn the 670-person low-risk segment larger than the 200 and 130?
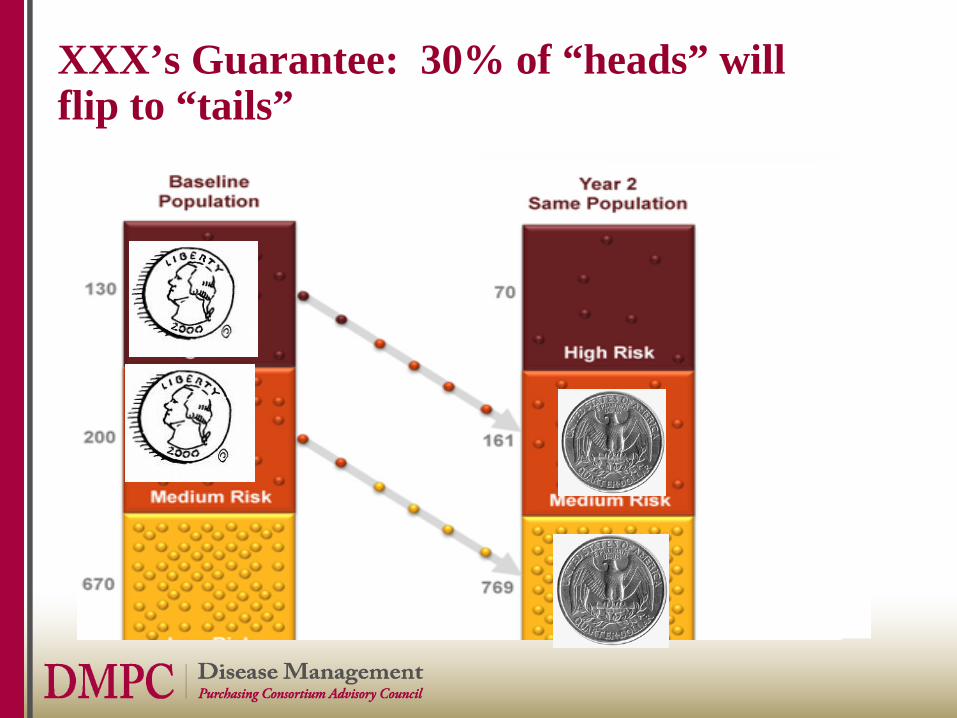
XXX’s Guarantee: 30% of “heads” will flip to “tails”
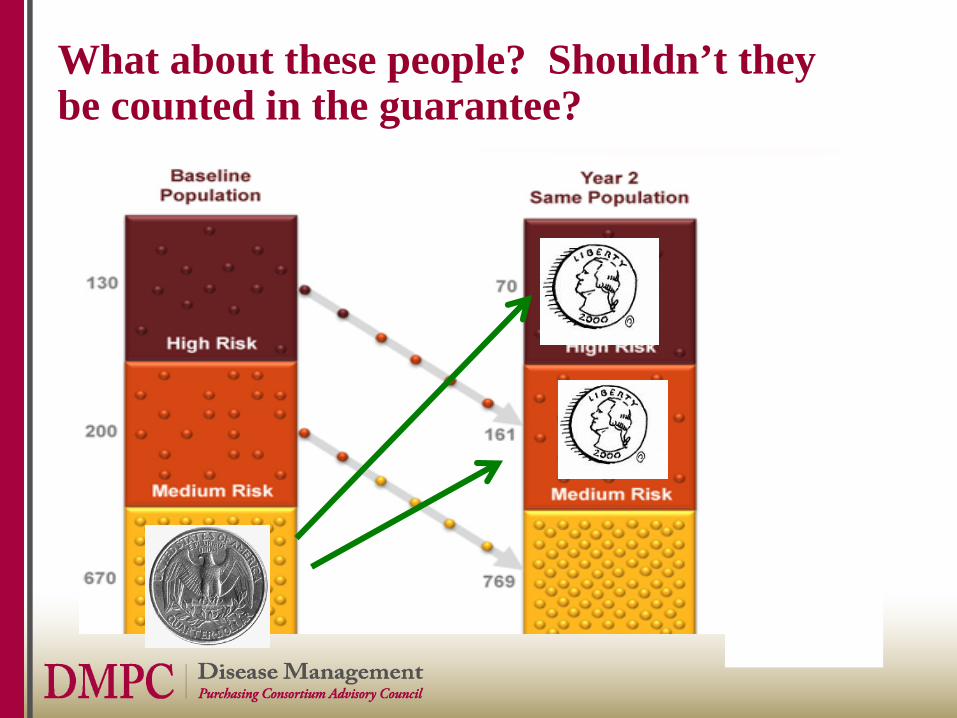
What about these people? Shouldn’t they be counted in the guarantee?
Example from Wellness using XXX methodology: Smoking Cessation
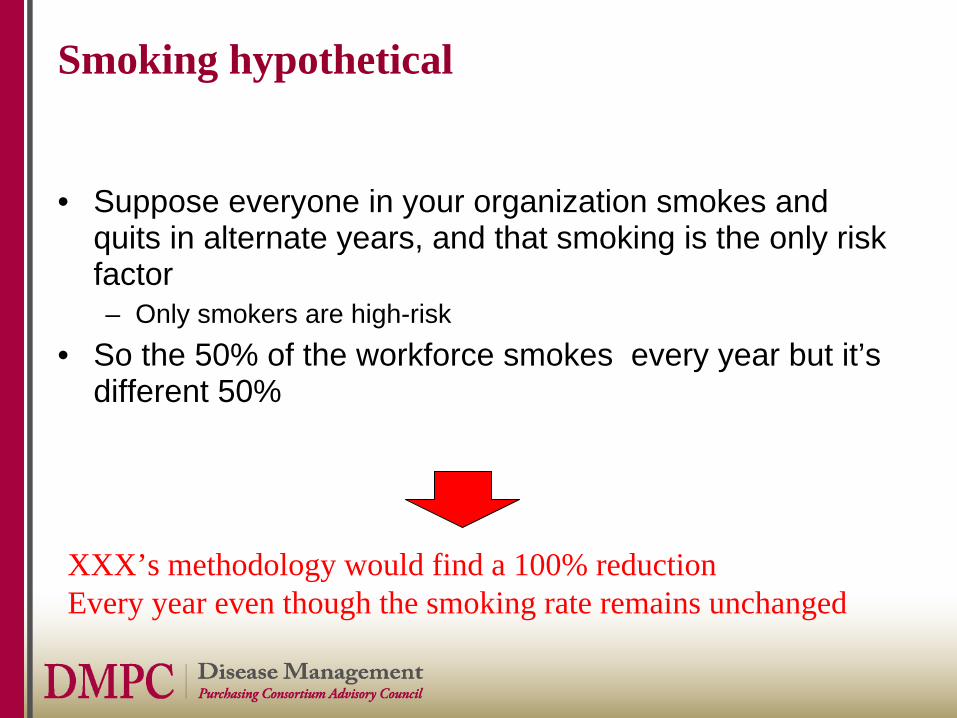
Smoking hypothetical
• Suppose everyone in your organization smokes and quits in alternate years, and that smoking is the only risk factor
• So the 50% of the workforce smokes every year but it’s a different 50% each year
Smoking hypothetical
• Suppose everyone in your organization smokes and quits in alternate years, and that smoking is the only risk factor– Only smokers are high-risk
• So the 50% of the workforce smokes every year but it’s different 50%
XXX’s methodology would find a 100% reductionEvery year even though the smoking rate remains unchanged
(c) 2011 DMPC www.dismgmt.com [email protected] 781 856 3962
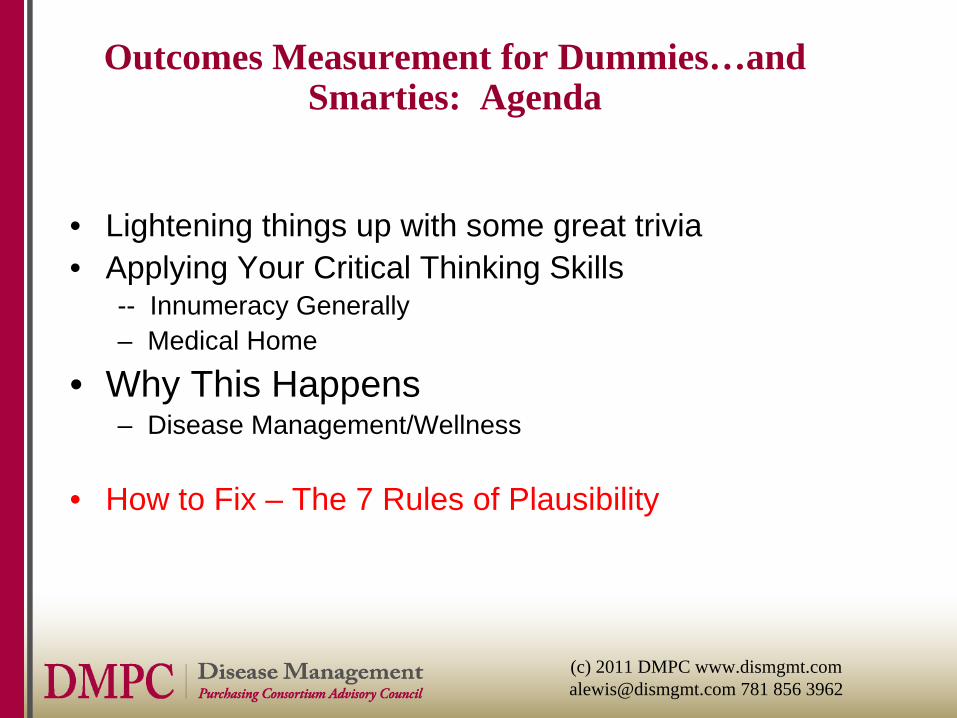
Outcomes Measurement for Dummies…and Smarties: Agenda
• Lightening things up with some great trivia• Applying Your Critical Thinking Skills
-- Innumeracy Generally– Medical Home
• Why This Happens– Disease Management/Wellness
• How to Fix – The 7 Rules of Plausibility
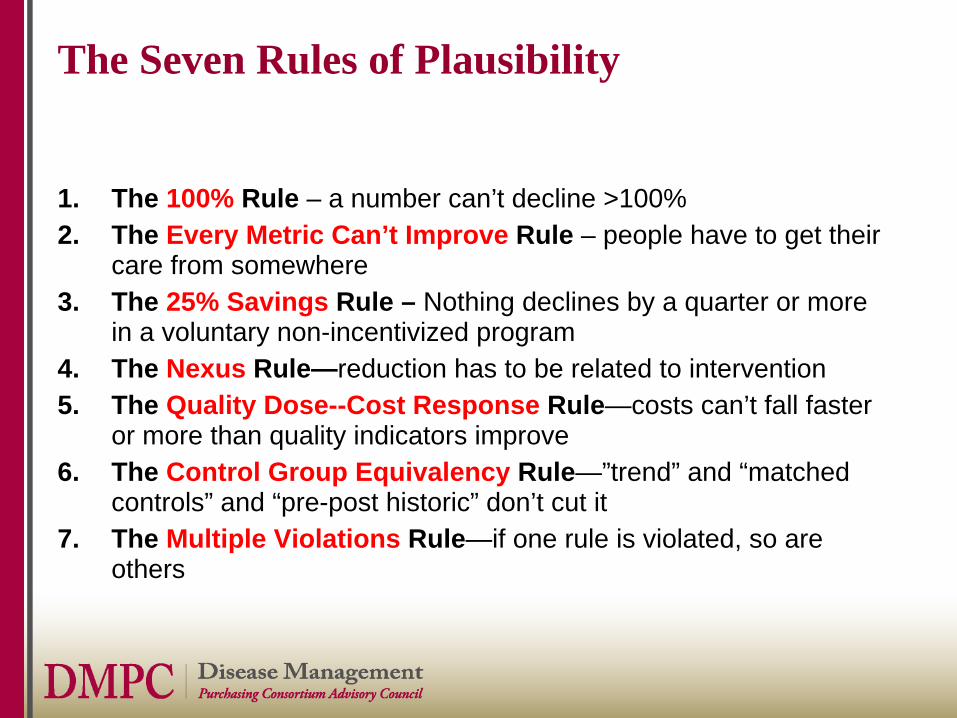
The Seven Rules of Plausibility
1. The 100% Rule – a number can’t decline >100%2. The Every Metric Can’t Improve Rule – people have to get their
care from somewhere3. The 25% Savings Rule – Nothing declines by a quarter or more
in a voluntary non-incentivized program 4. The Nexus Rule—reduction has to be related to intervention5. The Quality Dose--Cost Response Rule—costs can’t fall faster
or more than quality indicators improve 6. The Control Group Equivalency Rule—”trend” and “matched
controls” and “pre-post historic” don’t cut it7. The Multiple Violations Rule—if one rule is violated, so are
others
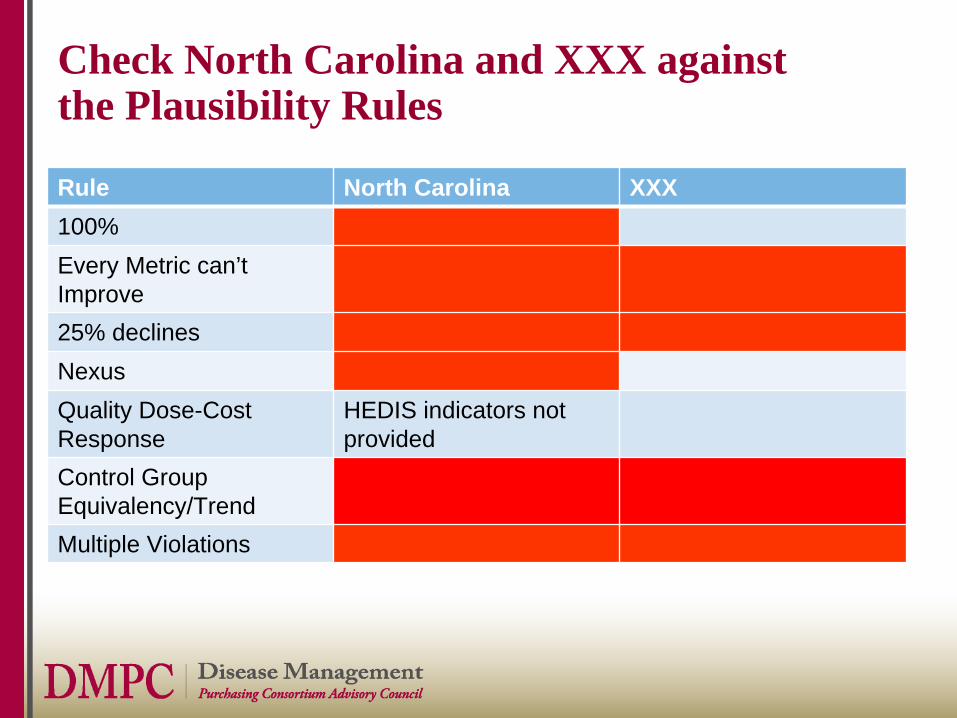
Check North Carolina and XXX against the Plausibility Rules
Rule North Carolina XXX100%Every Metric can’t Improve25% declinesNexusQuality Dose-Cost Response
HEDIS indicators not provided
Control Group Equivalency/TrendMultiple Violations
Plenty More Examples Where These Two Came From—Most of You Can Have the Whole Report
Impact from using your own eyes (meaning plausibility analysis) to validate results
• Chances of your vendors taking advantage of you: lower • Chances of your organizationsaving money and improving outcomes: higher
(c) 2011 DMPC www.dismgmt.com [email protected] 781 856 3962
Impact from using your own eyes (meaning plausibility analysis) to validate results
• Chances of your vendors taking advantage of you: lower • Chances of your organizationsaving money and improving outcomes: higher
(c) 2011 DMPC www.dismgmt.com [email protected] 781 856 3962
Your own credibility:
Impact from using your own eyes (meaning plausibility analysis) to validate results
• Chances of your vendors taking advantage of you: lower • Chances of your organizationsaving money and improving outcomes: higher
(c) 2011 DMPC www.dismgmt.com [email protected] 781 856 3962
Your own credibility: priceless


