Outcomes of Doctoral Program Graduates: Pilot Test of a Strategy to Measure Outcomes Using Exit and Alumni Surveys Linda T. Miller, Crystal Middaugh & Tom Broniewicz, The School of Graduate & Postdoctoral Studies, Western University
Transcript
Outcomes of Doctoral Program Graduates: Pilot Test of a Strategy to Measure Outcomes Using Exit and Alumni Surveys Linda T. Miller, Crystal Middaugh & Tom Broniewicz, The School of Graduate & Postdoctoral Studies, Western University
Cite this publication in the following format: Miller, L. T., Middaugh, C., & Broniewicz, T. (2014). Outcomes of Doctoral Program Graduates: Pilot Test of a Strategy to Measure Outcomes Using Exit and Alumni Surveys. Toronto: Higher Education Quality Council of Ontario.
Outcomes of Doctoral Program Graduates: Pilot Test of a Strategy to Measure Outcomes Using Exit and Alumni Surveys
Higher Education Quality Council of Ontario 2
Table of Contents Executive Summary ............................................................................................................................................ 4
Introduction ......................................................................................................................................................... 6 Support for Increased Graduate Enrolment ................................................................................................. 6 Evidence of Increased Graduate Enrolment ................................................................................................ 6 Employment Expectations and Trends ........................................................................................................ 7 Preparing Graduates for the Current Job Market ........................................................................................ 8 Current Project ............................................................................................................................................. 8
Overview of Approach ......................................................................................................................................... 8 Graduate Studies Completing Students ...................................................................................................... 9 Graduate Studies Alumni ............................................................................................................................. 9 The Surveys ................................................................................................................................................. 9 Graduate Studies Exit Survey ................................................................................................................. 10 Graduate Studies Alumni Survey ............................................................................................................ 10 Analysis of Survey Responses .................................................................................................................. 11
Graduate Studies Exit Survey Results .............................................................................................................. 11 Response Rates and Demographics ......................................................................................................... 11 Employment Plans ..................................................................................................................................... 13 Career Preparation and Learning Outcomes ............................................................................................. 15
Graduate Studies Alumni Survey Results ......................................................................................................... 17 Response Rates and Demographics ......................................................................................................... 17 Employment Results for the Full Alumni Sample ....................................................................................... 18 Analysis of Employment by Year of Graduation ........................................................................................ 23 Analysis by Disciplinary Groups: Arts, Humanities and Social Science, and Health Sciences ................. 26
and Medicine Perceptions of the Impact of Graduate Education on Career Preparation across all Respondents .......... 30
Overall Summary and Recommendations ........................................................................................................ 32 Ongoing Accumulation of Career Outcome Data ...................................................................................... 32 Preliminary Findings Using Surveys .......................................................................................................... 33 Exit Survey .............................................................................................................................................. 33 Alumni Survey ......................................................................................................................................... 34 Findings across Years of Completion ................................................................................................. 34 Findings across Disciplinary Groups .................................................................................................. 34 Impact of Graduate Education on Career Preparation ....................................................................... 35 Recommendations ..................................................................................................................................... 35
Table 17: Graduate Studies Alumni Survey – Importance of Aspects of Graduate Education ...................... 31
Table 18: Graduate Studies Alumni Survey – Preparation for Career ........................................................... 32
Outcomes of Doctoral Program Graduates: Pilot Test of a Strategy to Measure Outcomes Using Exit and Alumni Surveys
Higher Education Quality Council of Ontario 4
Executive Summary Enrolments in graduate programs in Ontario and across Canada have grown substantially over the past 15 years. This growth has been supported and encouraged by strategic investments from provincial and federal governments. Although it has been argued that an increase in the number of Canadians with master’s- or PhD-level education is needed to support increased innovation and economic advancement, there is a growing view that many recent master’s and doctoral graduates are unemployed or underemployed. The current lack of evidence regarding the employment outcomes of master’s and doctoral graduates makes it difficult to evaluate the extent to which this might actually be the case. Several reports have highlighted the need for universities to document and report on the employment outcomes of master’s and doctoral graduates. The purpose of this project was to pilot test the feasibility and process of obtaining information about the career outcomes of doctoral graduates and alumni of Western University. The process included two surveys, a Graduate Studies Exit Survey and a Graduate Studies Alumni Survey. The surveys were designed with the intent that they would form the basis of ongoing collection of outcome data from graduating students and alumni. Invitations to complete the exit survey were sent to graduate students completing the final requirements of their degree, and invitations to complete the alumni survey were sent to alumni who completed a graduate degree at Western between 2008 and 2013. Although master’s program graduates and alumni were invited to complete the surveys, only responses from graduates and alumni of doctoral programs are included in this report. Response rates for both surveys were less than desirable. The exit survey yielded an overall response rate of 16% (25 responses from 156 invitations), with the highest rates among students completing doctoral degrees in health sciences and medicine (28%) and in arts, humanities and social science (25%). With an overall response rate of approximately 9% (135 of 1,546), the alumni survey also yielded the highest proportion of respondents from health science and medicine, and arts, humanities and social science. The results obtained using the exit and alumni surveys are preliminary and must be interpreted with caution due to the modest response rates and the pilot nature of the project. Ongoing use of the surveys, with efforts to increase response rates, is required to achieve stability of the results and to support interpretation of the findings. At present, the preliminary findings of the pilot administration should be interpreted as illustrative of the possible range of responses, as opposed to being indicative of actual prevalence of outcomes. The pilot results of the exit survey suggest that approximately three quarters of doctoral respondents had begun a job search by the time they were completing the final requirements of their degree. Of those who had started a job search, about 40% had secured employment at the time of the survey; in all cases, the employment was related to the student’s area of study and about three quarters of the employment was in Ontario. Respondents to the exit survey tended to indicate that they felt that their graduate education best prepared them for careers in academia and provided the least preparation for careers in industry, business or entrepreneurship. Overall, respondents tended to agree that the major learning outcomes of their program had been achieved, with one notable exception: respondents tended to disagree that their programs prepared them to become entrepreneurs. The findings regarding preparation for entrepreneurship and lack of preparation for industry or business careers are consistent with the findings of Sekuler, Crow and Annan (2013). The pilot results of the alumni survey indicate that about 5% of doctoral alumni respondents who graduated between 2008 and 2013 were unemployed and looking for employment at the time of the survey. The earliest graduates (i.e., those who graduated in 2008, 2009 and 2010) reported the highest rate of full-time employment at 89%, with 6% reporting part-time employment and 3% reporting being unemployed and
Outcomes of Doctoral Program Graduates: Pilot Test of a Strategy to Measure Outcomes Using Exit and Alumni Surveys
Higher Education Quality Council of Ontario 5
looking for employment. Revision to the survey is required for future use in order to determine whether part-time employment is the preferred status for those who reported being employed part-time. 95% of those employed indicated that their employment is related to their graduate education and 90% reported that they are satisfied or very satisfied with their employment. 48% of respondents are employed in Ontario and the most frequently reported salary range was $70,000 to $84,999. The most frequently reported employer type was university, with 58% of respondents indicating employment at a university; the second most frequently reported employer type was health care, with 16% of alumni respondents overall reporting employment in health care. The most frequently reported job title was Assistant/Associate/Tenure-Stream Professor, with 25% of all alumni respondents indicating this job title. The proportion of respondents indicating Assistant/Associate/Tenure-Stream Professor as their job title was highest among the earliest graduates, with 45% of these respondents reporting this job title. Overall, 20% of alumni respondents report holding a postdoctoral position; the percentage of postdoctoral positions was highest among the most recent graduates (30% for graduates of 2013). Sessional or term instructor appointments were only reported by respondents who are among the most recent graduates (12% in 2013; 10% in 2012). Analysis of the alumni survey responses across the two disciplinary groups with the highest response rates suggests that doctoral alumni respondents from health science and medicine programs report a higher rate of full-time employment (83%) than alumni respondents from arts, humanities and social science programs (71%). Both groups tended to report high levels of satisfaction with their employment and a high degree of relationship between their employment and area of study. Salary ranges reported by health sciences and medicine respondents tend to be somewhat higher than their counterparts in arts, humanities and social science; however, this likely reflects the lower rate of full-time employment and higher rate of part-time employment among the arts, humanities and social science respondents. Health sciences and medicine respondents tended to report a higher level of postdoctoral appointments, whereas sessional or term instructor appointments were reported only by arts, humanities and social science respondents. Universities tended to be the most frequently reported employer type for both groups. Across disciplines, doctoral alumni respondents tended to indicate that presenting seminars or research presentations, writing a major paper or thesis, writing manuscripts for publication, preparing conference presentations, collaborating with faculty members and working as part of a collaborative team were the aspects of their graduate education that were most important in preparing them for their careers. Similar to the tendency seen in the preliminary results of the exit survey, alumni respondents tended to report that their graduate studies did not prepare them to be entrepreneurs. As a pilot test of a strategy for ongoing accumulation of career outcome data for doctoral graduates, the surveys yielded informative preliminary results. The findings across years since graduation and across disciplinary groups suggest that the alumni survey effectively obtains employment-related information across time and discipline, supporting future use of the survey to gather doctoral outcome information. Similarly, the consistency of findings across the exit and alumni surveys, as well as the corroboration of the findings of previous research, lend support for the validity of the exit survey and the alumni survey. It is recommended that revisions to the surveys be made to allow respondents who are employed part-time to indicate whether this is their preferred status. It is further recommended that reminder emails should be automated into the survey process to encourage more optimal response rates and that timing of the email invitations should avoid periods of high email traffic and peak holiday times. With these recommendations, both surveys should be implemented for use on an ongoing basis, with the exit survey used continuously with students completing graduate studies and the alumni survey administered every two to three years to focus on alumni who graduated within the past three years; this strategy should yield samples of sufficient size and stability upon which to base more conclusive interpretations.
Outcomes of Doctoral Program Graduates: Pilot Test of a Strategy to Measure Outcomes Using Exit and Alumni Surveys
Higher Education Quality Council of Ontario 6
Introduction Support for Increased Graduate Enrolment Both the Government of Canada and the Government of Ontario have encouraged and supported growth in graduate enrolment over the past decade and a half (Hall & Arnold, 2013; Wiggers, Lennon & Frank, 2011). In 2002, the Federal Government introduced its Innovation Strategy (Industry Canada, 2002), a key element of which focused on graduate education. In particular, the strategy aimed to increase the numbers of students completing graduate degrees in Canada, to keep the best and brightest graduate students in Canada and to recruit outstanding international graduate students to Canadian universities. The strategy called for an increase in admissions to master’s and doctoral programs of 5% annually through 2010. The objective of this target was to increase Canada’s productivity and innovation, in part by increasing the supply of highly qualified people. The Federal Government supported its Innovation Strategy with an increased number of scholarships and fellowships for master’s and doctoral students through the three major granting councils: the Canadian Institutes of Health Research (CIHR), the Natural Sciences and Engineering Research Council (NSERC) and the Social Sciences and Humanities Research Council (SSHRC). Through the granting councils, the Federal Government introduced the Canada Graduate Scholarships and the Vanier Doctoral Scholarships, leading to an increase that more than doubled the number of scholarship recipients from 2002 to 2010 (Hall & Arnold, 2013). The Government of Ontario supported growth in graduate enrolment through a number of initiatives, most notably the Graduate Accessibility Envelope, introduced in 2001, followed by the Reaching Higher initiative, introduced in 2004. These initiatives directed operating funding to universities in direct support of increasing graduate enrolment. In addition to operating support, the Government of Ontario also restructured and increased its budget for the Ontario Graduate Scholarships, introduced the Ontario Graduate Scholarships in Science and Technology (later renamed the Queen Elizabeth II Scholarships) and created endowments in support of Ontario Graduate Fellowships to enable universities to better support graduate students. Overall, Ontario’s support for graduate enrolment growth over the past decade and a half has been substantial, leading to an increase of almost 15,000 graduate students between 1998 and 2011-2012 (Hall & Arnold, 2013). Evidence of Increased Graduate Enrolment In a detailed analysis of graduate enrolment, Hall and Arnold (2013) report that national doctoral enrolment increased at an average rate of 6.1% annually from 2002 to 2010. The rate of master’s enrolment growth was less pronounced, with a national average rate of 3.0% annually over the same period. Looking at enrolment growth by discipline groups, Hall and Arnold note that master’s-level growth was greatest in “Business, Management and Public Administration,” followed by “Health Professions and Related Clinical Sciences” and “Social and Behavioural Sciences and Law.” At the doctoral level, growth was greatest in “Physical and Life Sciences and Technologies,” followed by “Social and Behavioural Sciences and Law” and “Engineering.” Wiggers et al. (2011) note that between 1999 and 2008, the rate of graduate enrolment growth in Ontario exceeded the national rate. During this time period, enrolment in master’s programs in Ontario grew by 51%, compared to 38% nationally, and enrolment in doctoral programs in Ontario grew by 67%, compared to 61% nationally. Wiggers et al. further describe that the rate of enrolment growth (without distinguishing between master’s and doctoral enrolment) varied across disciplines. Three disciplinary groups saw enrolments increase by 100% or more: “Health, Parks, Recreation and Fitness,” “Architecture, Engineering and Related Technologies” and “Visual and Performing Arts and Communications Technologies.” Enrolment growth of 50 to 85% was seen in three disciplinary groups: “Mathematics, Computer and Information Sciences,” “Social and Behavioural Sciences and Law” and “Physical and Life Sciences.” Smaller enrolment growth was noted in
Outcomes of Doctoral Program Graduates: Pilot Test of a Strategy to Measure Outcomes Using Exit and Alumni Surveys
Higher Education Quality Council of Ontario 7
“Agriculture, Natural Resources and Conservation,” “Humanities” and “Business, Management and Public Administration,” with the least growth seen in “Education.” Despite the growth in graduate enrolments over the past 15 years, Canada continues to lag behind other countries in terms of the number of PhD graduates produced. With 15.9 doctoral graduates per 100,000 population in 2010, Canada ranked 21st among the 26 Organisation for Economic Co-operation and Development (OECD) countries; only Hungary, Japan, Iceland, Turkey and Mexico produced fewer doctoral graduates per 100,000 population. Focusing on science, technology, engineering and mathematics (STEM) disciplines only, Canada ranked 15th among the OECD countries with respect to doctoral graduates (Science, Technology and Innovation Council, 2013). Considering that doctoral graduates comprise the greatest asset to innovation and development, Canada’s innovation potential continues to lag behind that of its peer countries, despite considerable government investment. Employment Expectations and Trends The modest proportion of Canada’s population that has graduated with a doctoral degree relative to other countries raises concerns regarding Canada’s potential for innovation and advancement. Commenting on the release of the Science, Technology and Innovation Council’s State of the Nation 2012 report, McKenna (2013) notes that Canada is not keeping pace with other countries in terms of its research and development and its potential for innovation. A more recent article in the Globe and Mail (Hellinga, 2013) suggests that Canada’s relative ranking with respect to doctoral graduates in engineering could hinder its ability to address the many engineering challenges it faces across a range of specializations, including health care, computing and information systems, clean water and renewable energy. In the US, the Council of Graduate Studies reported in early 2012 (Bell, 2012) that the Bureau of Labor Statistics projected a 20% increase from 2010 to 2020 in the number of jobs requiring a doctorate or professional degree, and a 22% increase in the number of jobs requiring a master’s degree. These projected increases are higher than the increases projected for all other educational attainment groups. The largest increase in jobs was projected for the health care and social services fields. Although Canada’s Innovation Strategy (Industry Canada, 2002) and Ontario’s Rae Report (Rae, 2005) both projected a shortage of university faculty in Ontario and Canada, a recent report (Maldonado, Wiggers & Arnold, 2013) suggests that the current supply of PhDs exceeds the number of available faculty positions. According to Desjardins (2012), about 65% of PhD students in Ontario aspire to faculty appointments; in the humanities, 86% of PhD students in Ontario report pursuing PhD studies with the intent to enter the professoriate. Despite the declining availability of tenure-stream faculty positions, Desjardins (2012) reports that in 2007, only 7% of PhDs were unemployed, with no differences reported across fields of study. A recent report (Council of Ontario Universities, 2014) notes that since 2004, PhD and master’s graduates have had the lowest unemployment rates in Ontario, with a rate of 5% in 2012. Further, the Council of Ontario Universities (2014) reports that the number of master’s and PhD graduates employed in Ontario increased 68% between 2002 and 2012. This is the largest increase reported for any educational attainment group and exceeds the 64% increase in the number of master’s and PhD graduates during the same time period. Of all educational attainment groups, master’s and PhD graduates experienced the highest increase (31.9%) in employment since the 2008 economic crisis. A recent report from Statistics Canada (Uppal & LaRochelle-Côté, 2014) analyzed the rate of underemployment or over-qualification of university graduates in 1991 and 2011. Its findings indicate that the rate of over-qualification of 25 to 34 year old university graduates in 2011 was similar to the rate in 1991. In addition, the authors report that master’s and doctoral graduates are only half as likely as bachelor’s graduates to be overqualified for their employment.
Outcomes of Doctoral Program Graduates: Pilot Test of a Strategy to Measure Outcomes Using Exit and Alumni Surveys
Higher Education Quality Council of Ontario 8
Preparing Graduates for the Current Job Market Historically, universities have educated and trained graduate students, particularly PhD students, with a focus largely on academic careers. There is increasing recognition that universities must realign graduate education to meet the needs of the current job market and to address current societal needs (Carr, 2012; Fullick, 2013; Sekuler, Crow & Annan, 2013). Over the past decade universities in Ontario have introduced an array of professional development opportunities for graduate students directed at developing “soft skills” (Rose, 2012). A recent report by Sekuler, Crow and Annan (2013) calls for further efforts along these lines, including opportunities for internships and investment in graduate-focused career services. Ideally, professional development opportunities and career services for graduate students should be developed in consultation with current graduate students and recent graduates. To best prepare their graduates, universities must understand the society and job market that their graduates will enter and must be open to learning from the experiences and career outcomes of their graduates. In this respect, universities face a common challenge: career outcomes of master’s and PhD graduates are not documented by the universities from which they graduate. Although most PhD supervisors can report anecdotally on the outcome of the students they have supervised, systematic efforts to track the career outcomes of graduate students are widely lacking. Wiggers et al. (2011) note the need for information regarding the career paths of PhD graduates and call for research on the labour market outcomes of graduate students. Hall and Arnold (2013) report the lack of employment data for master’s and doctoral graduates and acknowledge the limitation this places on evaluating fully the success of Canada’s and Ontario’s investment in graduate expansion. This lack of data regarding career paths and labour market outcomes for graduate students is not unique to Ontario or to Canada. The Council of Graduate Schools in the US recently announced a project to investigate the feasibility of tracking career pathways of doctoral students (CGS, 2013). The lack of labour market outcome data for graduate students is widely recognized as a serious gap that requires attention if universities are to improve their programs and to enable students to make informed decisions. Current Project The purpose of this project was to initiate a process for obtaining information about the career plans and outcomes of doctoral graduates and alumni at Western University. We developed two surveys: a Graduate Studies Exit Survey and a Graduate Studies Alumni Survey. The objective of the surveys was to collect information about satisfaction with graduate studies, perceptions of how well graduate education prepared graduates for their careers (or subsequent studies), and current employment or plans for employment. The Graduate Studies Exit Survey was designed to measure satisfaction with aspects of graduate studies and immediate career (or study) plans. The Graduate Alumni Survey was designed to measure current employment and career pathways, as well as the impact of graduate education on career achievement and progression. The intent was that this project would form the basis for ongoing evaluation of graduate education outcomes at Western, and potentially other Ontario universities. As such, this project serves as a pilot test for the implementation of a strategy of ongoing accumulation of career outcome data for doctoral studies.
Overview of Approach A Graduate Studies Exit Survey was used to collect data from students at the point of completing the final requirements of their graduate studies program, and a Graduate Studies Alumni Survey was used to collect data from alumni who had completed a graduate program at Western. The surveys were administered to master’s and doctoral students and alumni; however, this project focuses exclusively on the data collected from completing doctoral students and doctoral alumni. Western University currently offers 50 doctoral
Outcomes of Doctoral Program Graduates: Pilot Test of a Strategy to Measure Outcomes Using Exit and Alumni Surveys
Higher Education Quality Council of Ontario 9
programs across 11 faculties: Arts and Humanities, Business, Education, Engineering, Health Sciences, Information and Media Studies, Law, Medicine and Dentistry, Music, Science, and Social Science. The doctoral program in the Faculty of Law was only recently introduced and does not yet have any alumni or completing students. This project received approval from the ethics review board at Western University. Graduate Studies Completing Students Students who completed a PhD program at Western between September 1, 2013 and April 21, 2014 were invited to complete the exit survey. The invitation to complete the survey was sent by the School of Graduate and Postdoctoral Studies via email to each student upon completion of all program requirements. Specifically, upon determination of the student’s eligibility to graduate, an email was sent to the student inviting completion of the survey. Emails were distributed on an ongoing basis beginning December 10, 2013. On December 10, 2013, all students who had completed their program requirements between September 1 and December 10 were sent the invitation. Following December 10, a batch of email invitations was sent to completing students on a weekly basis. In total 156 invitations to complete the exit survey were distributed to students completing a PhD program. A total of 25 students completed the survey, for a response rate of 16%. This response rate may be an underestimate due to the fact that all students who completed between September 1 and December 10 received the invitation to participate, via their university email address, after they had already departed campus. It is possible that some of these graduates no longer actively maintained their university email address and, consequently, did not receive or read the invitation. Graduate Studies Alumni Alumni who completed a graduate degree at Western between January 1, 2008 and August 31, 2013 were invited by email to complete the survey. The invitation to complete the survey was distributed by Western’s Alumni Relations & Advancement Services Office. Only alumni who had previously indicated an interest in receiving email communication from the university and, in particular, had not requested to be omitted from any invitations to complete surveys were included in the email distribution. It is not known if the email addresses recorded by Western’s Alumni Relations & Advancement Services were active and currently in use by alumni. A total of 1,546 alumni who had completed a PhD at Western (some of these alumni may also have completed a master’s degree at Western) were sent an email on December 12, 2013 that included a letter of information explaining the project and a link to the survey. Approximately 1% of the email invitations “bounced back” or were undeliverable and approximately 27% of the email invitations were opened. A second email invitation was sent on January 22, 2014 to only those alumni who did not open the email sent on December 12, 2013. Approximately 34% of the second email invitations were opened. In total, 135 PhD alumni completed the survey, for an overall response rate of 9%. This response rate is likely an underestimate because of the probable inclusion of inactive email addresses (as inferred from the “bounce backs” and unopened messages). The Surveys Two surveys were developed, a Graduate Studies Exit Survey for students completing the requirements of their degree and a Graduate Studies Alumni Survey for past graduates of Western graduate programs. In addition to demographic information, the surveys included questions regarding employment and perceptions of aspects of the graduate studies experience. Graduate studies exit and alumni surveys used at other institutions were reviewed and served as guides for the development of the survey questions. Although
Outcomes of Doctoral Program Graduates: Pilot Test of a Strategy to Measure Outcomes Using Exit and Alumni Surveys
Higher Education Quality Council of Ontario 10
examples of exit surveys were identified at some Canadian universities, the alumni surveys reviewed to guide development of our alumni survey were primarily from US universities. In particular, the exit surveys used at Dalhousie University and at University of Alberta, as well as the exit survey developed by the Council of Graduate Schools in the US for the PhD Completion Project, informed the development of our exit survey. The alumni surveys used at University of Pennsylvania, University of Kentucky, Arizona State University, and Georgia Institute of Technology informed the development of our alumni survey. In addition, the content of the Canadian Graduate and Professional Student Survey was reviewed and informed the development of questions pertaining to the graduate studies experience. No existing surveys were found that included evaluation of learning outcomes. As learning outcomes vary across programs, the Graduate Degree Level Expectations (Ontario Universities Council on Quality Assurance, 2012) were used to guide the development of general questions pertaining to learning outcomes that can be assumed to be relevant across graduate degrees; these questions were included in the Graduate Studies Exit Survey. The content of the two surveys was reviewed by three staff members of the School of Graduate and Postdoctoral Studies at Western with extensive knowledge of graduate education and by three faculty members with extensive experience in the administration of graduate programs. On the basis of these expert reviews, both surveys were revised, including the addition of open response options to some items, deletion of some items and revision or rewording of others. A list of the item content for the final versions of both surveys is provided below. Graduate Studies Exit Survey The Graduate Studies Exit Survey included questions pertaining to:
• Demographics (gender, age, citizenship, marital status, dependents) • Program information (program and degree, enrolment status, time to completion, teaching assistant
and research assistant opportunities) • Quality of graduate program and supervision (if applicable), and university services • Participation in and quality of professional development opportunities • Career preparation • Plans following graduation • Graduate learning outcomes
The survey also included opportunities for written comments. Graduate Studies Alumni Survey The Graduate Studies Alumni Survey included questions pertaining to:
• Demographics (gender, age, citizenship) • Program information (program and degree) • Employment and career path (number of jobs since graduating, current job, relevance of graduate
studies to job, type of job and employer, salary) • Continuing education and professional development • Quality and impact of graduate education
The survey also included opportunities for written comments. The Graduate Studies Exit Survey and Graduate Studies Alumni Survey were distributed electronically via a link in the email invitation distributed to those meeting the criteria for the project. All surveys were completed online. The surveys were housed on the web server of the School of Graduate and Postdoctoral Studies and data from completed surveys were stored on a secure site on the server. Each respondent was assigned a survey code to maintain anonymity. The surveys could only be accessed through the link provided in the email invitations.
Outcomes of Doctoral Program Graduates: Pilot Test of a Strategy to Measure Outcomes Using Exit and Alumni Surveys
Higher Education Quality Council of Ontario 11
Analysis of Survey Responses Survey responses were analyzed and summarized using descriptive statistics. Because the focus of this project was to initiate a process for gathering doctoral outcome data on an ongoing basis, the analyses were directed at understanding the appropriateness of the surveys and their method of administration. Due to the small number of completed surveys, results of the Graduate Studies Exit Survey are presented without distinguishing among disciplines. Results of the Graduate Studies Alumni Survey are presented by graduating year cohorts and also by disciplinary groups. As aspects of current employment could reasonably be expected to vary in relation to time since graduation, data are summarized for graduating year cohorts in order to consider the survey’s ability to detect variations as a function of time since graduation. Also, as variations in aspects of employment as a function of discipline have been suggested in reports and the media, results of the Graduate Studies Alumni Survey are summarized by disciplinary area in order to consider the survey’s ability to detect variations across disciplines.
Disciplinary Group Number of Respondents Percent of
Total Sample
Response Rate (based
on emails sent)
Arts and Humanities, Social Science 9 36 25%
Engineering, Science 6 24 8%
Health Science, Medicine 7 28 28%
Education, Information and Media Studies, Business 1 4 14%
Interdisciplinary 1 4 9%
Not Indicated 1 4 -
Total 25 100 16%
The overall response rate for the exit survey (16%) is modest, indicating that strategies are needed to increase the response rate. The response rate varies considerably across disciplinary areas, with the highest rates in health science and medicine (28%), followed by arts, humanities and social science (25%). The engineering and science disciplinary group has the lowest response rate (8%).
Outcomes of Doctoral Program Graduates: Pilot Test of a Strategy to Measure Outcomes Using Exit and Alumni Surveys
The sample of exit survey respondents comprised a larger proportion of men (64%) than women. In recent years, doctoral enrolments at Western have been relatively balanced between men and women; consequently, the survey demographics may reflect a slightly disproportionate gender balance. In terms of citizenship, the sample is a reasonable reflection of Western’s percentage of international doctoral enrolment. However, the largest international doctoral enrolments at Western are in engineering and science programs, which had the lowest survey response rates. This suggests that a disproportionately large number of international students in arts and humanities, social science, health science and medicine completed the survey. With 84% of respondents indicating that they were under 40 years of age, the sample is a reasonable reflection of Western’s overall doctoral enrolment. 56% of the respondents indicated that they were not the first member of their family to pursue a graduate degree, suggesting that half of the respondents had some previous familiarity with graduate education.
PhD Respondents (N = 25)
Demographics n Percent
Gender
Male 16 64
Female 9 36
Current Citizenship
Canadian 19 76
Permanent Resident 1 4
International 5 20
Current Age (in years)
25-29 3 12
30-34 10 40
35-39 8 32
40-44 1 4
45-49 1 4
50-54 1 4
55-59 1 4
Are you the first of your family to complete a graduate degree?
No 14 56
Yes 11 44
Outcomes of Doctoral Program Graduates: Pilot Test of a Strategy to Measure Outcomes Using Exit and Alumni Surveys
Did you begin a job search during your graduate studies?
No 6 24
Yes 19 76
What are your plans following graduation?
Further education 1 4
Have secured employment 8 32
Looking for employment 11 44
Other 5 20
19 of the 25 respondents (76%) completing their PhD had begun a job search prior to completing their degree; 6 (24%) had not begun looking for a job at the time of completing the survey. Eight respondents (32% of the full sample, 42% of those who had initiated a job search) had secured employment at the time of completing the survey (i.e., prior to formally graduating). Looking only at the 8 respondents who indicated that they had already secured employment, all 8 indicated that the employment was related to their area of study; in addition, 5 indicated that the employment was in the public sector, and 3 indicated that the employment was in the private sector. When asked if their salary was commensurate with their expectations following completion of a doctoral degree, 7 of the 8 who had secured employment responded “yes” and 1 indicated that they were “not sure.” Six of those who had secured employment indicated that the employment was in Ontario, 1 indicated it was outside of Ontario but within Canada, and 1 indicated that it was outside of Canada. Looking only at the 11 respondents who indicated that they are looking for employment, only 1 indicated looking for employment in the private sector. The remaining 10 respondents indicated that they were looking for employment in either the public or private sector.
Outcomes of Doctoral Program Graduates: Pilot Test of a Strategy to Measure Outcomes Using Exit and Alumni Surveys
Higher Education Quality Council of Ontario 14
Table 4: Graduate Studies Exit Survey – Resources Used in Job Search
PhD Respondents Who Had Begun Job Search (N = 19)
Resources No Yes Did not Indicate
Mean Rating of Effectiveness*
1 = poor
5 = excellent
Job opportunities posted or distributed by graduate program
10
53%
7
37%
2
10% 2.36
Advertisements in academic journals 12
63%
5
26%
2
10% 2.56
Advertisements in professional publications
13
68%
4
21%
2
10% 3.40
Websites for professional organizations in your field
6
32%
11
58%
2
10% 3.18
Employer websites 7
37%
10
53%
2
10% 3.23
Employer recruitment events 14
74%
3
16%
2
10% 1.38
University-hosted career fairs 14
74%
3
16%
2
10% 1.30
Personal contacts 2
10%
15
79%
2
10% 3.70
Western’s Career Central 14
74%
3
16%
2
10% 2.45
Social media 13
68%
4
21%
2
10% 3.08
* Based on only those who used the resource The most frequently used job search resource among respondents was personal contacts, which was also the most positively rated resource. Very few respondents reported using university resources, including university-hosted career fairs and university-based career services; ratings suggest that those respondents who did use these resources did not find them very helpful.
Outcomes of Doctoral Program Graduates: Pilot Test of a Strategy to Measure Outcomes Using Exit and Alumni Surveys
Higher Education Quality Council of Ontario 15
Career Preparation and Learning Outcomes Table 5: Graduate Studies Exit Survey – Career Preparation
PhD Respondents (N = 25)
My graduate program has prepared me to begin a career in my field/discipline
Mean on 5-point Scale
1 = strongly disagree
5 = strongly agree
In academia 4.08
In industry/business 2.76
In government 3.15
In professional practice 3.11
In a policy-related setting 2.95
In a non-governmental organization 3.27
As an entrepreneur 2.71
When asked about how well their graduate education prepared them for various careers, respondents indicated the strongest preparation for careers in academia. Respondents indicated the least preparation for careers as entrepreneurs and careers in industry or business.
Outcomes of Doctoral Program Graduates: Pilot Test of a Strategy to Measure Outcomes Using Exit and Alumni Surveys
My graduate education and experiences have prepared me to:
Mean on 5-point Scale
1 = strongly disagree
5 = strongly agree
Think analytically and critically 4.42
Understand the ethics and professional standards of my field 4.18
Understand the current and emerging issues and challenges in my field 4.13
Understand the relevance of my field to other fields 3.71
Critically evaluate research in my field 4.42
Apply the primary techniques, skills, methods and/or tools of my field 4.13
Prepare a research or project proposal 4.12
Conduct research in my field 4.38
Write for academic or professional publications 4.38
Write technical reports 3.28
Write grant proposals 3.30
Communicate in a professional environment 3.88
Communicate technical information to others outside my field 3.70
Deliver a professional presentation 4.25
Function as a member of an interdisciplinary or multi-disciplinary team 3.83
Function in culturally diverse environments 3.91
Develop new techniques, practices or theories in my field 4.21
Engage in lifelong learning 4.17
Teach a course in my field 4.26
Compete for career opportunities in my field 3.75
Demonstrate leadership 4.00
Mentor others 3.88
Manage projects 3.68
Become an entrepreneur 2.50
Outcomes of Doctoral Program Graduates: Pilot Test of a Strategy to Measure Outcomes Using Exit and Alumni Surveys
Higher Education Quality Council of Ontario 17
Overall, there is a tendency among respondents toward agreement that doctoral education addressed the anticipated general learning outcomes. A notable exception to this tendency, however, is preparation for entrepreneurship: respondents tended to express disagreement or indecision regarding their preparation for entrepreneurship. Respondents expressed the strongest agreement that their program and experiences had prepared them to think analytically and critically, to evaluate critically research in their field, to conduct research in their field, and to write for academic or professional publications.
Graduate Studies Alumni Survey Results Response Rates and Demographics Table 7: Graduate Studies Alumni Survey – Response Rates by Graduating Year
PhD Respondents (N = 135)
Year of Graduation Number of Respondents Percent of
Total Sample
Response Rate (based on emails
sent)
2008 9 7 4%
2009 11 8 4%
2010 16 12 6%
2011 26 19 9%
2012 36 27 12%
2013 36 27 16%
Not indicated 1 1 -
Total 135 100 9%
Overall, the response rate to the alumni survey was modest, conservatively estimated at about 9%. This is likely due to several factors, including less than optimal timing of the email invitations and the absence of reminder emails. Response rates were lowest for the earliest graduates and best for more recent graduates.
Outcomes of Doctoral Program Graduates: Pilot Test of a Strategy to Measure Outcomes Using Exit and Alumni Surveys
Higher Education Quality Council of Ontario 18
Table 8: Graduate Studies Alumni Survey – Representation of Disciplines in the Sample
PhD Respondents (N = 135)
Disciplinary Group Number of Respondents Percent
Arts and Humanities, Social Science 31 23
Engineering, Science 26 19
Health Science, Medicine 53 39
Education, Information and Media Studies, Business 16 12
Interdisciplinary 5 4
Not indicated 4 3
The largest proportions of alumni respondents were from the health science and medicine discipline group and the arts and humanities and social science discipline group. Employment Results for the Full Alumni Sample Table 9: Graduate Studies Alumni Survey – Employment Status
PhD Respondents (N = 135)
Current Employment Status Number of Respondents Percent
(based on those who indicated)
Employed full-time 106 79
Employed part-time 17 13
Not employed and looking for employment 7 5
Not employed and not looking for employment 4 3
Not indicated 1
Of the full sample of respondents, 3% indicated that they are not employed and not looking for employment. When the percentages of those employed or looking for employment are corrected to account for those who are not seeking employment, 82% of respondents are employed full-time, 13% are employed part-time, and 5% are unemployed and seeking employment. Unfortunately, the survey did not ask those who indicated that they are employed part-time if they are seeking full-time employment. Consequently, the extent to which the 13% who are employed part-time are content with their part-time employment is not known directly. For future use, revision to the survey is required to address this oversight.
Outcomes of Doctoral Program Graduates: Pilot Test of a Strategy to Measure Outcomes Using Exit and Alumni Surveys
Relevance and Satisfaction Number of Respondents Percent
(based on those who indicated)
Relation of Employment to Graduate Studies
Closely related 89 73
Somewhat related 27 22
Not related 6 5
Not indicated 1
Satisfaction with Employment
Very satisfied 60 49
Satisfied 50 41
Dissatisfied 10 8
Very dissatisfied 2 2
Not indicated 1
95% of the respondents report that their employment is related to their doctoral studies, with 73% indicating that their employment is closely related. In terms of satisfaction with their employment, 90% of respondents indicate that they are satisfied or very satisfied with their employment. A chi-squared analysis to test the relationship between employment status and satisfaction revealed a significant relationship (Χ2 (3) = 12.52, p = .006). Those employed full-time were more likely to report being very satisfied or satisfied, whereas those employed part-time were more likely to report being satisfied or dissatisfied.
Outcomes of Doctoral Program Graduates: Pilot Test of a Strategy to Measure Outcomes Using Exit and Alumni Surveys
There is considerable variability in the salaries reported by respondents, ranging from $24,999 or less to $145,000-$159,000. To some extent, this broad range likely reflects the fact that 13% of the respondents are employed part-time. Looking only at those respondents who indicated an annual salary of $24,999 or less, 75% of them are employed part-time. Overall, of those who specified a salary, 17% reported salaries of $39,999 or less, 39% reported salaries between $40,000 and $69,999, 35% reported salaries between $70,000 and $99,999, and 8% reported salaries between $100,000 and $159,999.
Outcomes of Doctoral Program Graduates: Pilot Test of a Strategy to Measure Outcomes Using Exit and Alumni Surveys
Higher Education Quality Council of Ontario 21
Looking only at respondents who are employed full-time and who specified an annual salary, 8% reported a salary of $39,999 or less. 43% reported salaries between $40,000 and $69,999, 41% reported salaries between $70,000 and $99,999, and 8% reported salaries between $100,000 and $159,999. The most frequently reported salary ranges for respondents employed full-time align with expectations based on Desjardins (2012), who reported that the median full-time salary of doctoral graduates of the class of 2005 was $67,500. Table 12: Graduate Studies Alumni Survey – Location of Employment
PhD Respondents Employed (N = 123)
Location Number of Respondents Percent
Ontario 65 48
Outside of Ontario but in Canada 22 16
Outside of Canada 36 27
Almost half (48%) of those employed are working in Ontario, 16% are employed outside of Ontario but within Canada, and 27% are employed outside of Canada.
Outcomes of Doctoral Program Graduates: Pilot Test of a Strategy to Measure Outcomes Using Exit and Alumni Surveys
Higher Education Quality Council of Ontario 22
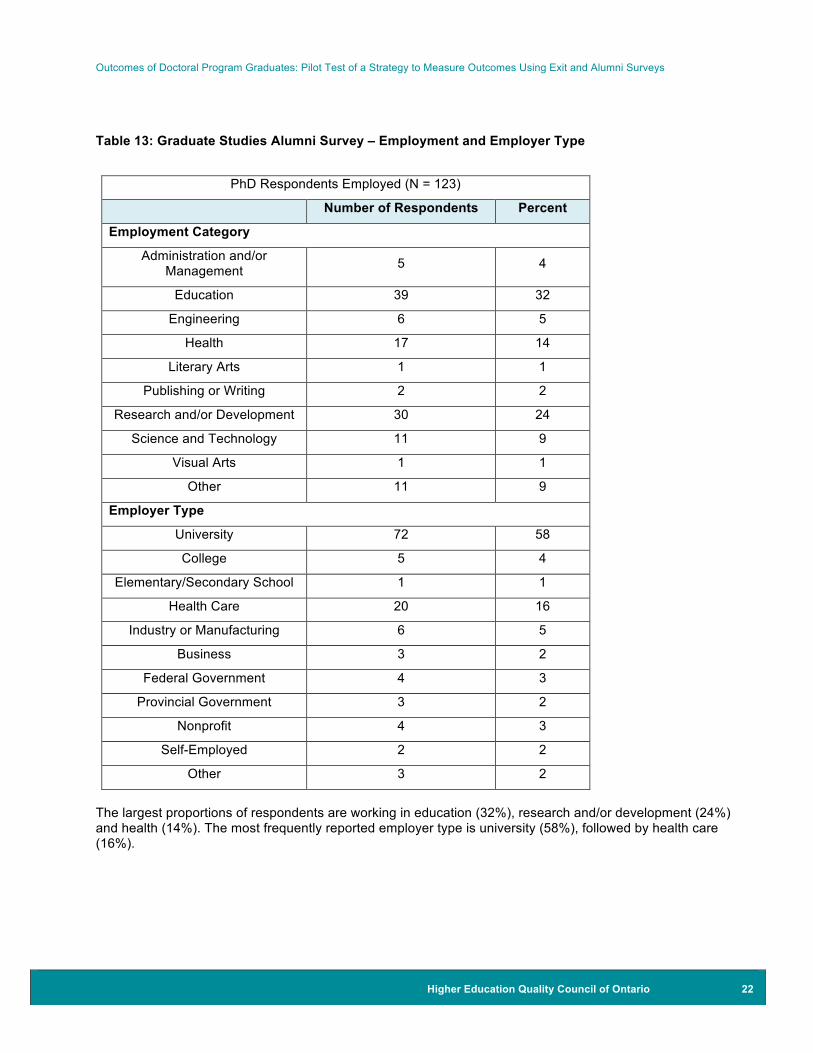
Table 13: Graduate Studies Alumni Survey – Employment and Employer Type
PhD Respondents Employed (N = 123)
Number of Respondents Percent
Employment Category
Administration and/or Management 5 4
Education 39 32
Engineering 6 5
Health 17 14
Literary Arts 1 1
Publishing or Writing 2 2
Research and/or Development 30 24
Science and Technology 11 9
Visual Arts 1 1
Other 11 9
Employer Type
University 72 58
College 5 4
Elementary/Secondary School 1 1
Health Care 20 16
Industry or Manufacturing 6 5
Business 3 2
Federal Government 4 3
Provincial Government 3 2
Nonprofit 4 3
Self-Employed 2 2
Other 3 2
The largest proportions of respondents are working in education (32%), research and/or development (24%) and health (14%). The most frequently reported employer type is university (58%), followed by health care (16%).
Outcomes of Doctoral Program Graduates: Pilot Test of a Strategy to Measure Outcomes Using Exit and Alumni Surveys
Of those respondents who provided job titles (N = 118), the largest percentage (25%) reported being an assistant, associate or tenure-stream professor. The second largest percentage (20%) reported being a postdoctoral associate, scientist or fellow. These jobs titles were followed by adjunct, sessional and/or term instructor positions (6%), program/project/research coordinator/manager/director (5%), research associate (4%) and engineer (4%). The “Other” category, accounting for 20% of reported job titles, includes job titles that were each reported by only one respondent; these titles include: archaeologist, clinical fellow, concert manager, curriculum and e-learning specialist, dietician, director, educational developer, employment counsellor, epidemiologist, librarian, medical physicist, national/regional manager, neuroimaging programmer, nurse practitioner, office manager, pharmacist, physicist, research/adjunct professor, contract professor, psychologist, radiology resident, teacher, telescope specialist and writing consultant. Analysis of Employment by Year of Graduation Due to the small number of respondents who graduated in 2008, 2009 and 2010, respondents for these three years are grouped together for reporting purposes. However, despite grouping respondents from 2008, 2009 and 2010 together, response rates and numbers are still relatively small and less than desirable. Therefore, these results should be interpreted cautiously. Percentages are only based on those who indicated a response.
Outcomes of Doctoral Program Graduates: Pilot Test of a Strategy to Measure Outcomes Using Exit and Alumni Surveys
Higher Education Quality Council of Ontario 24
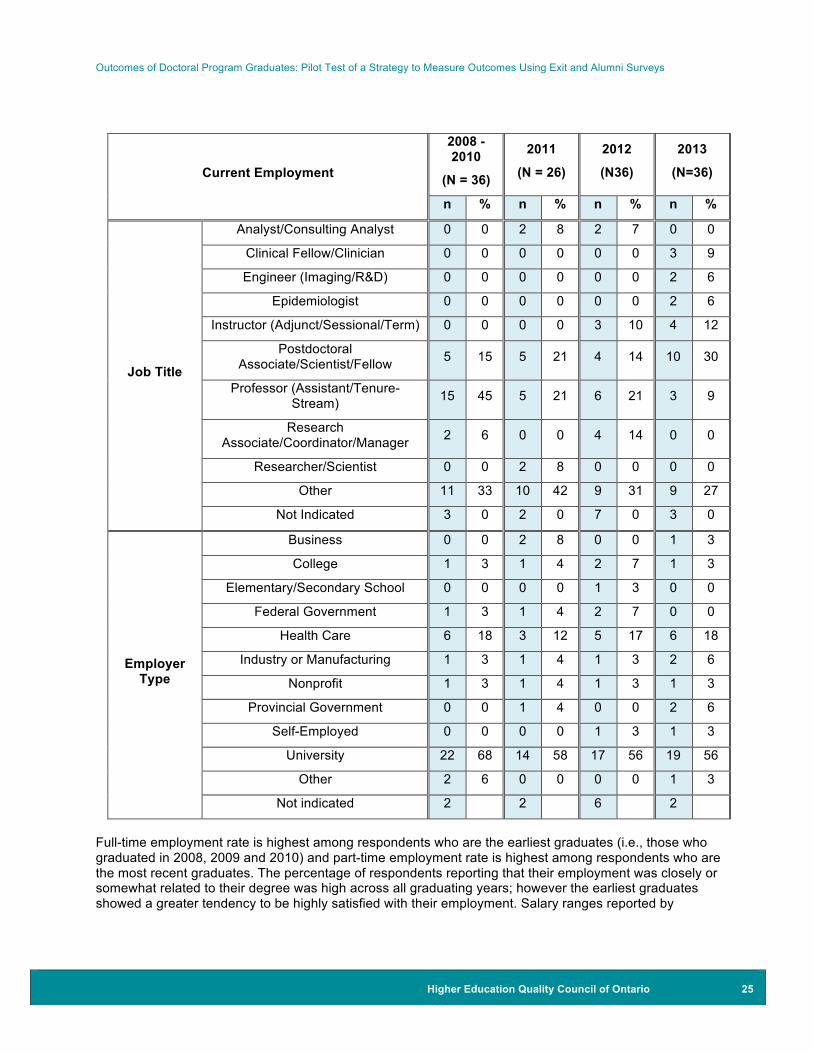
Table 15: Graduate Studies Alumni Survey – Employment Details of PhD Graduates by Time of Graduation (percentages based on those who indicated a response)
Current Employment
2008 -2010
(N = 36)
2011
(N = 26)
2012
(N36)
2013
(N=36)
n % n % n % n %
Current Employment
Status
Employed full-time 32 89 20 77 26 74 27 75
Employed part-time 2 6 4 15 4 11 7 19
Not employed and looking 1 3 1 4 4 11 1 3
Not employed and not looking 1 3 1 4 1 3 1 3
Not indicated 0 0 1 0
Relation of Employment to Graduate
Studies
Closely related 26 76 20 83 17 57 26 79
Somewhat related 8 24 1 4 11 37 6 18
Not related 0 0 3 12 2 7 1 3
Not indicated 2 2 6 3
Satisfaction with
Employment
Very satisfied 26 76 10 42 11 38 13 38
Satisfied 4 12 11 46 16 55 18 53
Dissatisfied 3 9 3 12 2 7 2 3
Very dissatisfied 1 3 0 0 0 0 1 3
Not indicated 2 2 7 2
Current Salary
$24,999 or less 1 3 0 0 2 7 5 15
$25,000 - $39,999 1 3 2 8 5 18 3 9
$40,000 - $54,999 5 17 8 31 4 15 10 29
$55,000 - $69,999 5 17 4 15 5 18 5 15
$70,000 - $84,999 12 40 3 12 7 26 6 18
$85,000 - $99,999 4 13 4 15 3 11 2 6
$100,000 - $114,999 1 3 1 4 0 0 1 3
$115,000 - $129,999 0 0 1 4 1 4 2 6
$130,000 - $144,999 1 3 0 0 0 0 0 0
$145,000 - $159,999 0 0 1 4 0 0 0 0
Prefer not to specify 6 2 9 2
Outcomes of Doctoral Program Graduates: Pilot Test of a Strategy to Measure Outcomes Using Exit and Alumni Surveys
Professor (Assistant/Tenure-Stream) 15 45 5 21 6 21 3 9
Research Associate/Coordinator/Manager 2 6 0 0 4 14 0 0
Researcher/Scientist 0 0 2 8 0 0 0 0
Other 11 33 10 42 9 31 9 27
Not Indicated 3 0 2 0 7 0 3 0
Employer Type
Business 0 0 2 8 0 0 1 3
College 1 3 1 4 2 7 1 3
Elementary/Secondary School 0 0 0 0 1 3 0 0
Federal Government 1 3 1 4 2 7 0 0
Health Care 6 18 3 12 5 17 6 18
Industry or Manufacturing 1 3 1 4 1 3 2 6
Nonprofit 1 3 1 4 1 3 1 3
Provincial Government 0 0 1 4 0 0 2 6
Self-Employed 0 0 0 0 1 3 1 3
University 22 68 14 58 17 56 19 56
Other 2 6 0 0 0 0 1 3
Not indicated 2 2 6 2
Full-time employment rate is highest among respondents who are the earliest graduates (i.e., those who graduated in 2008, 2009 and 2010) and part-time employment rate is highest among respondents who are the most recent graduates. The percentage of respondents reporting that their employment was closely or somewhat related to their degree was high across all graduating years; however the earliest graduates showed a greater tendency to be highly satisfied with their employment. Salary ranges reported by
Outcomes of Doctoral Program Graduates: Pilot Test of a Strategy to Measure Outcomes Using Exit and Alumni Surveys
Higher Education Quality Council of Ontario 26
respondents vary considerably both within graduating cohorts and across cohorts; however, the most frequently reported salary ranges tend to be highest among the earliest graduates, with approximately 60% of the earliest graduates reporting salary ranges of $70,000-$84,999 and higher. Respondents who are among the earliest graduates reported a greater tendency to be employed in academic positions as assistant or tenure-stream professors; whereas respondents who are among the most recent graduates reported a greater tendency to hold postdoctoral appointments. Employment as an instructor (adjunct/sessional/term) was reported only by respondents who graduated in the most recent two years (2012 and 2013). These trends in the results across time since graduation suggest that the alumni survey is effective in capturing employment variation across time since graduation. Analysis by Disciplinary Groups: Arts, Humanities and Social Science, and Health Sciences and Medicine The number of respondents was highest for the arts, humanities and social science (AH&SS) and the health sciences and medicine (HS&M) disciplinary groups. Therefore, more detailed results are reported for these two disciplinary groups. However, because the number of respondents in each of these groups is still relatively small, with less than desirable response rates, these results should be interpreted cautiously. Table 16a: Graduate Studies Alumni Survey – Response Rates by Disciplinary Clusters
Year of Graduation
PhD Graduates of Arts, Humanities and Social Science (N = 31)
PhD Graduates of Health Sciences and Medicine (N = 53)
n % Response Rate (based on emails
sent) n %
Response Rate (based on emails
sent)
2008 2 6 4% 3 6 9%
2009 1 3 2% 5 9 9%
2010 2 6 3% 7 13 11%
2011 7 23 10% 11 21 15%
2012 9 29 14% 12 23 17%
2013 10 32 17% 15 28 30%
Outcomes of Doctoral Program Graduates: Pilot Test of a Strategy to Measure Outcomes Using Exit and Alumni Surveys
Higher Education Quality Council of Ontario 27
Table 16b: Graduate Studies Alumni Survey – Time to First Full-Time Job by Disciplinary Clusters
Time to Obtain First FT Job
PhD Graduates of Arts, Humanities and Social
Science (N = 31)
PhD Graduates of Health Sciences and Medicine
(N = 53)
N % N %
Had job prior to completing degree 7 23 11 21
Accepted job upon completing degree 6 19 20 38
1-3 months 3 10 4 8
4-6 months 1 3 4 8
7-12 months 2 6 0 0
More than a year 3 10 5 9
Have not yet obtained FT job 7 23 7 13
Have not looked for FT job 2 6 2 4
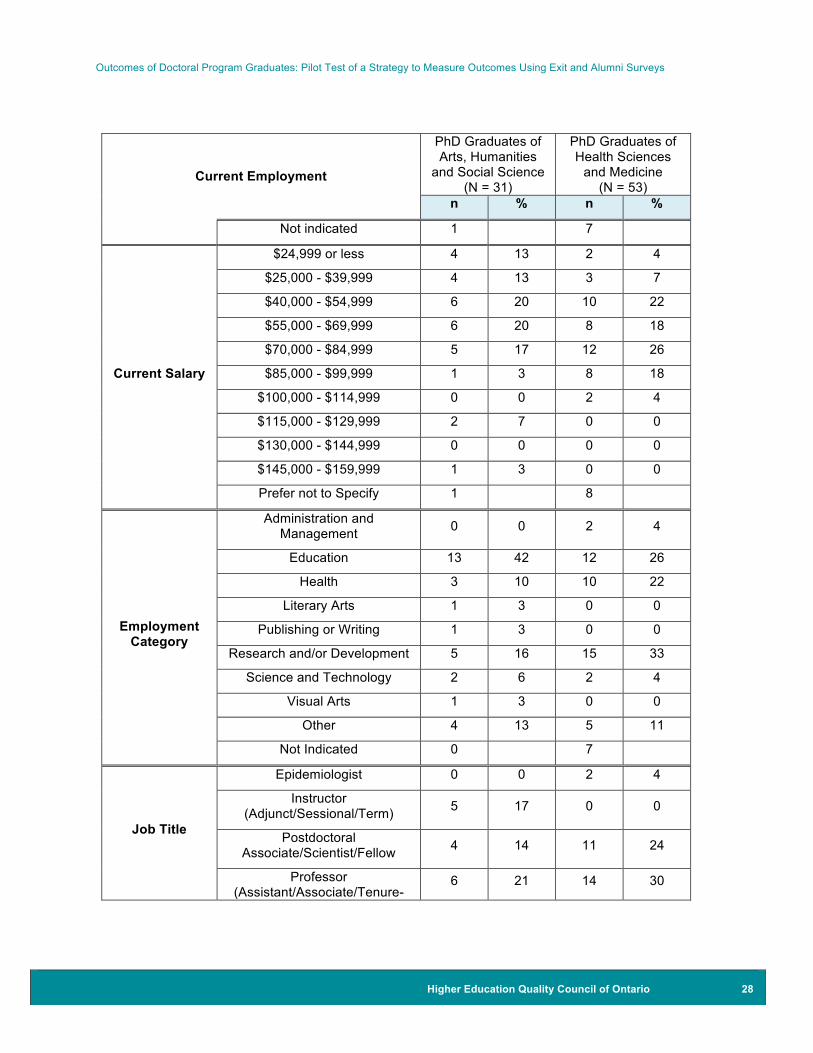
Table 16c: Graduate Studies Alumni Survey – Employment Details by Disciplinary Clusters (based on those who indicated)
Current Employment
PhD Graduates of Arts, Humanities
and Social Science (N = 31)
PhD Graduates of Health Sciences
and Medicine (N = 53)
n % n %
Current Employment
Status
Employed full-time 22 71 43 83
Employed part-time 8 26 3 6
Not employed and looking 1 3 3 6
Not employed and not looking 0 0 3 6
Not indicated 0 1
Relation of Employment to
Graduate Studies
Closely related 22 76 37 80
Somewhat related 7 24 8 17
Not related 0 0 1 2
Not indicated 2 7
Satisfaction with
Employment
Very satisfied 14 47 20 43
Satisfied 11 37 23 50
Dissatisfied 4 13 2 4
Very dissatisfied 1 3 1 2
Outcomes of Doctoral Program Graduates: Pilot Test of a Strategy to Measure Outcomes Using Exit and Alumni Surveys
Outcomes of Doctoral Program Graduates: Pilot Test of a Strategy to Measure Outcomes Using Exit and Alumni Surveys
Higher Education Quality Council of Ontario 29
Current Employment
PhD Graduates of Arts, Humanities
and Social Science (N = 31)
PhD Graduates of Health Sciences
and Medicine (N = 53)
n % n %
Stream)
Research Assistant 0 0 2 4
Research Associate 0 0 2 4
Research Coordinator/Manager 0 0 2 4
Researcher/Scientist 0 0 2 4
Other 13 29 11 46
Not Indicated 2 7
Employer Type
Business 2 7 0 0
College 3 10 1 2
Federal Government 1 3 1 2
Health Care 3 10 12 26
Industry or Manufacturing 0 0 1 2
Nonprofit 1 3 2 4
Provincial Government 2 7 1 2
University 18 60 26 56
Other 0 0 2 4
Not indicated 1 7
Relative to respondents who are graduates of Arts, Humanities and Social Science (AH&SS), respondents who are graduates of Health Sciences and Medicine (HS&M) reported a greater tendency to have obtained their first full-time job prior to, or upon, completion of their degree. The rate of full-time employment is higher for HS&M respondents than for AH&SS respondents and a larger proportion of AH&SS respondents report being employed part-time. Respondents in both disciplinary groups tended to report that their employment is related to their graduate studies, but HS&M respondents are somewhat more likely to report satisfaction with their current employment. The most frequently reported salary range for the HS&M group was $70,000 to $84,999; for the AH&SS group, the most frequently reported salary ranges were $40,000 to $54,999 and $55,000 to $69,999. The lower modal salary for AH&SS graduates may be due at least in part to the fact that the proportion of respondents from the most recent graduating years was highest for this group; only 15% of respondents in the AH&SS group graduated prior to 2011, compared to 28% in the HS&M group. To evaluate the relationship between salary and employment status, an analysis was conducted for each disciplinary group to examine the relationship between employment status and annual salary range. In each of the two groups, the analysis yielded a significant relationship (AH&SS: Χ2 (8) = 26.16, p = .001; HS&M: Χ2
Outcomes of Doctoral Program Graduates: Pilot Test of a Strategy to Measure Outcomes Using Exit and Alumni Surveys
Higher Education Quality Council of Ontario 30
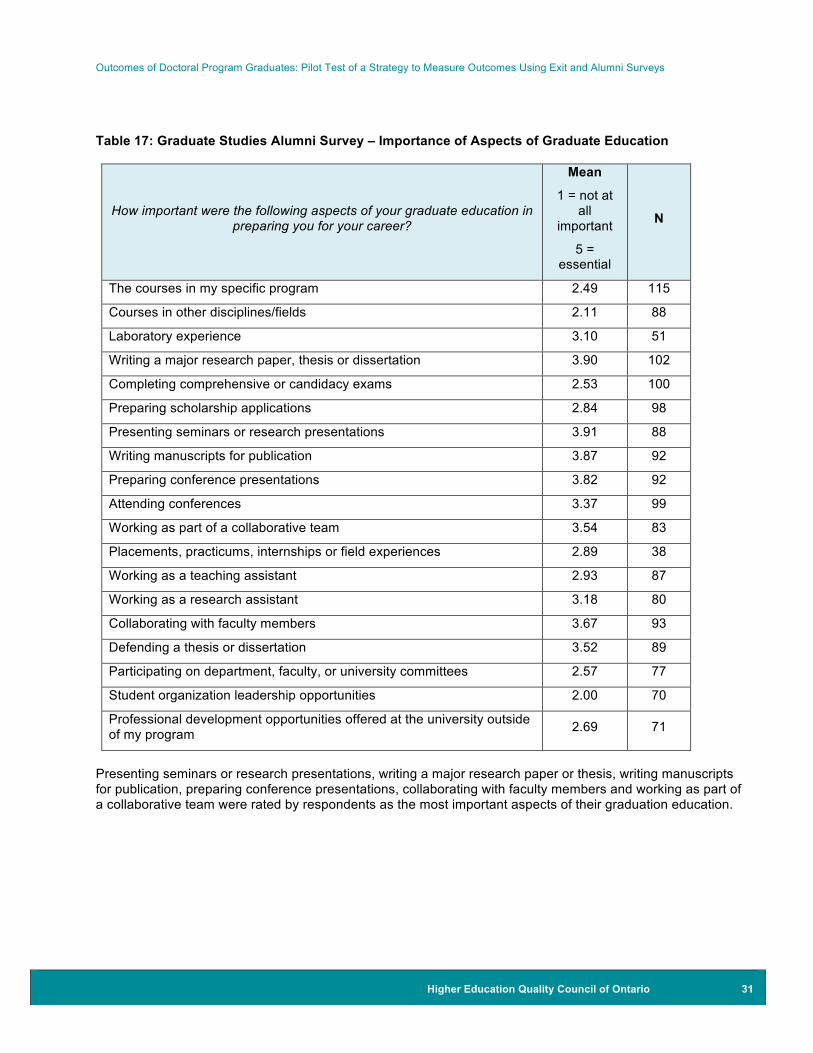
(7) = 26.86, p < .001), indicating that lower annual salary ranges were significantly related to part-time employment status. With a higher rate of part-time employment in AH&SS (26%) than in HS&M (6%), it is therefore not surprising that the reported annual salaries tend to be lower in the AH&SS group. The proportion of respondents who reported holding an appointment as an assistant, associate or tenure-stream professor was higher in the HS&M group than in the AH&SS group. Adjunct, sessional or term instructor appointments were reported only by respondents in the AH&SS group, again possibly due in part to the larger portion of more recent graduates in this group. A higher proportion of postdoctoral appointments was reported among HS&M respondents than among AH&SS respondents. For both disciplinary groups, universities were the most frequently reported employer type. The variation noted across disciplinary groups suggests that the survey is sensitive to differences across broad disciplinary areas. In addition, the relationship between employment status and salary that was observed in both groups indicates that the survey items are effective in measuring relevant variation in aspects of employment. Perceptions of the Impact of Graduate Education on Career Preparation Across All Respondents Respondents were asked to indicate the importance of aspects of their graduate education in preparing them for their career. These aspects were rated on a scale of 1 to 5, with higher scores indicating greater importance (1 = not at all important, 2 = somewhat important, 3 = important, 4 = very important, 5 = essential). The results for two items (“creating works for exhibit or performance” and “participating in performances”) in this section of the survey are not reported due to very small sample sizes as these items were relevant only to a small number of graduates. Respondents were also asked to indicate the extent to which they agreed that their graduate education had prepared them for various career demands. Agreement was rated on a scale of 1 to 5, with higher scores indicated stronger agreement (1 = strongly disagree, 2 = disagree, 3 = undecided, 4 = agree, 5 = strongly agree). The following tables present the mean ratings based on all respondents. Some items were not applicable to all respondents and some respondents did not provide responses to many of these items, so the sample size varies across items.
Outcomes of Doctoral Program Graduates: Pilot Test of a Strategy to Measure Outcomes Using Exit and Alumni Surveys
Higher Education Quality Council of Ontario 31
Table 17: Graduate Studies Alumni Survey – Importance of Aspects of Graduate Education
How important were the following aspects of your graduate education in preparing you for your career?
Mean
1 = not at all
important
5 = essential
N
The courses in my specific program 2.49 115
Courses in other disciplines/fields 2.11 88
Laboratory experience 3.10 51
Writing a major research paper, thesis or dissertation 3.90 102
Completing comprehensive or candidacy exams 2.53 100
Preparing scholarship applications 2.84 98
Presenting seminars or research presentations 3.91 88
Writing manuscripts for publication 3.87 92
Preparing conference presentations 3.82 92
Attending conferences 3.37 99
Working as part of a collaborative team 3.54 83
Placements, practicums, internships or field experiences 2.89 38
Working as a teaching assistant 2.93 87
Working as a research assistant 3.18 80
Collaborating with faculty members 3.67 93
Defending a thesis or dissertation 3.52 89
Participating on department, faculty, or university committees 2.57 77
Professional development opportunities offered at the university outside of my program 2.69 71
Presenting seminars or research presentations, writing a major research paper or thesis, writing manuscripts for publication, preparing conference presentations, collaborating with faculty members and working as part of a collaborative team were rated by respondents as the most important aspects of their graduation education.
Outcomes of Doctoral Program Graduates: Pilot Test of a Strategy to Measure Outcomes Using Exit and Alumni Surveys
Higher Education Quality Council of Ontario 32
Table 18: Graduate Studies Alumni Survey – Preparation for Career
My graduate education and experiences prepared me to:
Mean
1 = strongly disagree
5 = strongly agree
N
Think analytically and critically 3.80 69
Write professionally 3.69 70
Communicate effectively 3.75 76
Adapt to changing technologies 3.17 108
Work independently 3.84 67
Work as a member of a team 3.31 97
Supervise or mentor others 3.28 93
Think creatively 3.52 99
Apply my knowledge in new settings and/or situations 3.66 98
Assume a leadership role 3.16 99
Manage projects 3.40 90
Engage in lifelong learning 3.54 87
Make contacts in my career area 3.21 105
Compete for career opportunities in my field 3.20 103
Become an entrepreneur 2.14 84
Average ratings of agreement with the extent to which graduate studies provided preparation for career demands tended to fall between “undecided” and “agree,” with the highest average ratings reported for preparation to work independently, think analytically and critically, communicate effectively, write professionally and think creatively. On average, respondents did not agree that graduate studies prepared them to become an entrepreneur.
Overall Summary and Recommendations Ongoing Accumulation of Career Outcome Data This aim of this project was to pilot test the implementation of a strategy for the ongoing accumulation of career outcome data for graduate studies. The project initiated a process of obtaining information about the career plans and outcomes of doctoral graduates and alumni. Two surveys, designed to gather information about employment outcomes, satisfaction with graduate studies and perceptions of the impact of graduate studies on career outcomes were administered. One survey was specific to students completing their graduate studies, while the second was specific to graduate studies alumni. The intent was that this project would form the basis for ongoing evaluation of graduate education outcomes at Western. Sharing the results
Outcomes of Doctoral Program Graduates: Pilot Test of a Strategy to Measure Outcomes Using Exit and Alumni Surveys
Higher Education Quality Council of Ontario 33
and making the surveys available to other Ontario universities provides an opportunity for others to adapt and implement similar ongoing evaluation of graduate education outcomes. In general, the surveys yielded information that provides helpful insights into the strengths and challenges of graduate education in preparing graduates for careers. The surveys also yield helpful information about the career preparation and career outcomes of graduates. However, because the samples for both surveys were relatively small, the results presented in this report should be interpreted as illustrative of the likely range of responses in the population of PhD alumni and graduates; the survey findings should not be interpreted as conclusive. The low response rates to the surveys are problematic. Given that the poorest response rates to the alumni survey were noted for those who graduated prior to 2011, future efforts to survey alumni are likely to yield more optimal response rates by: 1) focusing on graduates who completed their degree within the past three years, 2) sending initial email invitations at a time of the year when the email is least likely to be overlooked due to high email volume, holidays or vacations, and 3) using reminder emails to prompt completion of the survey. As recommended by Dillman (2000), reminders to complete the survey should be integrated into future use of both the exit survey and the alumni survey to increase response rates. Timing of the invitation to complete the survey is critical. For alumni, careful consideration must be given to the timing of the invitations to complete the survey. It is critical that the invitations not be sent during peak email periods or during typical holiday or vacation times. Careful consideration should also be given to strategies to increase response rates for the exit survey. For example, linking the invitation to complete the survey to the completing student’s online thesis submission may improve response rates. Revision to the employment status question in both surveys is required to provide further insight into the nature of part-time employment. As piloted, it is not possible to determine whether those who report being employed part-time are content with their part-time employment status or whether they continue to search for full-time employment. Preliminary Findings Using Surveys Due to the modest response rates, the findings should be interpreted cautiously. Ongoing use of the surveys, accompanied by strategic efforts to improve response rates, is needed to substantiate these preliminary findings and support refocusing attention and resources. Exit Survey The best response rates for the exit survey were for students completing their PhD in the arts, humanities and social science discipline group and in the health sciences and medicine discipline group; the lowest response rate was for the engineering and science disciplinary group. Given that 76% of respondents indicated that they were Canadian citizens, with an additional 4% indicating that they were permanent residents, it is possible that the lower response rate in the engineering and science disciplines was related to the higher enrolment of international students in engineering and science. Efforts to improve response rates must give specific consideration to enhancing participation in disciplines with higher international enrolment. The findings from the pilot administration of the survey suggest that respondents experienced a reasonable level of success in securing relevant employment prior to completion of doctoral studies and a tendency for the employment to be located within Canada, particularly within Ontario; however, this may be a reflection of the fact that the sample of respondents was predominantly Canadian. Additional data are required to substantiate these preliminary findings.
Outcomes of Doctoral Program Graduates: Pilot Test of a Strategy to Measure Outcomes Using Exit and Alumni Surveys
Higher Education Quality Council of Ontario 34
Among respondents, personal contacts were the most frequently used and most positively rated job search resource. University-based resources were the least frequently used and tended to be the least positively rated resources. Although these results are preliminary due to the limited sample and pilot nature of this project, these findings regarding job search resources are consistent with the findings and recommendations of Sekuler, Crow and Annan (2013), who state, “Universities should invest in graduate-focused career services, recognizing that the needs of graduate students, and particularly PhD students, differ significantly from the needs of undergraduates” (p. 15). Exit survey respondents tended to indicate that they felt their graduate education provided the strongest preparation for careers in academia and the least preparation for careers in policy-related settings, industry or business, and entrepreneurship. This finding is also consistent with the findings of Sekuler, Crow and Annan (2103), who found that the doctoral participants in their study “did not believe that their graduate education adequately prepared them for careers outside of traditional academic paths” (p. 10). Responses to the questions regarding the extent to which respondents agreed that their graduate education met the learning outcomes of a doctoral degree indicated that respondents generally agreed that the learning outcomes had been achieved. However, an exception to this general finding is preparation to “become an entrepreneur”; again, respondents tended to indicate that they did not feel that their graduate education prepared them for entrepreneurship. Although many of the doctoral learning outcomes for which respondents indicated they felt prepared apply to careers outside of academia as well as to academic careers, the tendency for respondents to report a lack of preparation for careers outside of academia suggests that the relevance and applicability of these learning outcomes beyond academia is perhaps not being made explicit. Alumni Survey Findings across Years of Completion Looking at career outcomes as a function of time since completion of doctoral studies, full-time employment rates among alumni respondents tend to increase over time. With the exception of respondents who were graduates of 2012, the rate of those unemployed and seeking employment was 3 to 4%. The tendency to report full-time employment as an assistant/associate/tenure-stream professor increased across the years since graduation and across all years the most frequently reported employer type was university, followed by health care. More than half of the respondents of each graduating year cohort reported being employed by a university. Employment as a sessional or term instructor was reported only by respondents who were among the most recent graduates. Although Maldonado, Wiggers and Arnold (2013) report that “these temporary teaching opportunities have become a way of life” (p. 25) for many recent doctoral graduates, the pilot results of the alumni survey may suggest that sessional or term teaching positions are a temporary form of employment that leads to or bridges to other, more secure employment. Additional data through ongoing use of the survey are needed to support this interpretation. Findings across Disciplinary Groups Looking at alumni respondents in arts, humanities and social science (AH&SS) and alumni respondents in health sciences and medicine (HS&M), the two disciplinary groups with the highest response rates, revealed some disciplinary variation in career outcomes. Part-time employment was reported more frequently among AH&SS respondents than among HS&M respondents. Although full-time professorial appointments were reported by both AH&SS and HS&M respondents, sessional or term instructor employment was reported only by AH&SS respondents. This is consistent with Straumsheim’s (2013) observation that humanities doctoral graduates often turn to careers that have been referred to as alternative academic pathways (Maldonado, Wiggers & Arnold, 2013), including careers such as term and sessional instructor appointments. The finding
Outcomes of Doctoral Program Graduates: Pilot Test of a Strategy to Measure Outcomes Using Exit and Alumni Surveys
Higher Education Quality Council of Ontario 35
that a smaller percentage of AH&SS respondents held appointments as postdoctoral associates/scientists/fellows is consistent with the greater availability of postdoctoral opportunities in health and medicine related fields. For both disciplinary groups, universities were the reported employer type for more than half of all those employed. For HS&M respondents, health care was the second most frequently reported employer type; for AH&SS respondents, health care and colleges were tied as the second most frequently reported employer type. The finding that health care was the second most frequently reported employer type for both disciplinary groups supports the Council of Graduates Studies’ projection (Bell, 2012) that the largest increases in jobs for graduates of master’s and doctoral programs would be in the health care and social services fields. Impact of Graduate Education on Career Preparation Alumni respondents tended to rate the aspects of their graduate programs that supported development of presentation, writing and collaboration skills as most important in preparing for their careers. In addition, alumni respondents tended to most strongly agree that their graduate education provided them with effective communication and writing skills, as well as creative, analytical and critical thinking skills. Similar to the findings of the exit survey, the findings of the alumni survey suggest that alumni respondents did not feel that their graduate education prepared them with entrepreneurial skills. Overall, the findings suggest that the exit and alumni surveys provide feasible and relevant methods of accumulating employment outcome data for doctoral graduates. Although the pilot results should be interpreted cautiously and broad generalizations or conclusions should be avoided due to the modest response rates, the survey findings reflect meaningful variation, supporting ongoing use of the surveys. Recommendations Preliminary results obtained through pilot testing suggest that the exit survey and alumni survey yield meaningful and relevant career preparation and outcome information. Ongoing use of the surveys is recommended in order to cumulate outcome data to guide the design and content of professional development opportunities for graduate students, to identify the need for program modifications to optimize learning outcomes, and to understand the career paths of graduates. To enhance the relevance of the data obtained with the surveys, it is essential to implement strategies to enhance response rates. Ongoing, continuous use of the exit survey is recommended. It is recommended that the alumni survey be administered every two to three years, focusing on alumni who graduated within the past three years.
Outcomes of Doctoral Program Graduates: Pilot Test of a Strategy to Measure Outcomes Using Exit and Alumni Surveys
Higher Education Quality Council of Ontario 36
References Bell, N. E. (2012). Data sources: Strong employment growth expected for graduate degree recipients.
GradEdge, 1(2). Retrieved from http://www.cgsnet.org/march-2012 Carr, G. (2012, October 26). Graduate students need preparation for life outside university. The Globe and
Mail. Retrieved from http://www.theglobeandmail.com/news/national/graduate-students-need-preparation-for-life-outside-university/article4699319/#dashboard/follows/
Council of Graduate Schools (2013, December 6). CGS Launches Project to Study Feasibility of Tracking
PhD Career Pathways. Retrieved from http://www.cgsnet.org/cgs-launches-project-study-feasibility-tracking-phd-career-pathways
Council of Ontario Universities (2014). University Works. Retrieved from
http://www.cou.on.ca/publications/reports/pdfs/cou-university-works-report---february-2014 Desjardins, L. (2012). Profile and Labour Market Outcomes for Doctoral Graduates from Ontario Universities.
Ottawa: Statistics Canada. Catalogue no. 81-595-M—No.098. Retrieved from http://www.statcan.gc.ca/pub/81-595-m/81-595-m2012098-eng.pdf
Dillman, D. A. (2000). Mail and internet surveys: The tailored design method. New York: J. Wiley. Fullick, M. (2013, January 2). Today’s graduate students are not the elite of yesterday. The Globe and Mail.
Retrieved from http://www.theglobeandmail.com/news/national/education/todays-graduate-students-are-not-the-elites-of-yesterday/article6808727/#dashboard/follows/
Hall, F., & Arnold, H. (2013). Intentions For and Outcomes Following a Decade of Government Investment in
Graduate Education. Toronto: Higher Education Quality Council of Ontario. Hellinga, B. (2013, November 25). Without highly specialized engineers, Canada can kiss innovation
goodbye. The Globe and Mail. Retrieved from http://www.theglobeandmail.com/report-on-business/careers/career-advice/without-highly-trained-engineers-canada-can-kiss-innovation-goodbye/article15586318/
Industry Canada (2002). Achieving excellence: Investing in people, knowledge and opportunities. Canada’s
Innovation Strategy. Retrieved from http://publications.gc.ca/collections/Collection/C2-596-2001E.pdf Maldonado, V., Wiggers, R., & Arnold, C. (2013). So You Want to Earn a PhD? The Attraction, Realities, and
Outcomes of Pursuing a Doctorate. Toronto: Higher Education Quality Council of Ontario. McKenna, B. (2013, May 22). Why other countries are overtaking Canada ‘exponentially’ on innovation. The
Globe and Mail. Retrieved from http://www.theglobeandmail.com/news/politics/globe-politics-insider/why-other-countries-are-overtaking-canada-exponentially-on-innovation/article12057416/#dashboard/follows/
Ontario Universities Council on Quality Assurance (2012). OCAV’s Undergraduate and Graduate Degree
Level Expectations. Retrieved from http://oucqa.ca/framework/appendix-1/
Outcomes of Doctoral Program Graduates: Pilot Test of a Strategy to Measure Outcomes Using Exit and Alumni Surveys
Higher Education Quality Council of Ontario 37
Rae, B. (2005). Ontario: A leader in learning. Retrieved from http://www.tcu.gov.on.ca/eng/document/reports/postsec.pdf
Rose, M. (2012). Graduate Student Professional Development: A Survey with Recommendations. Canadian
Association for Graduate Studies. Retrieved from http://www.cags.ca/documents/publications/working/Report%20on%20Graduate%20Student%20Professional%20Development%20%20-%20A%20survey%20with%20recommendations%20FINAL%20Eng.OCT%202012.pdf
Science, Technology and Innovation Council (2013). State of the Nation 2012. Canada’s Science, Technology
and Innovation System: Aspiring to Global Leadership. Retrieved from http://www.stic-csti.ca/eic/site/stic-csti.nsf/eng/h_00058.html
Sekuler, A. B., Crow, B., & Annan, R. B. (2013). Beyond Labs and Libraries: Career Pathways for Doctoral
Students. Toronto: Higher Education Quality Council of Ontario. Straumsheim, C. (2013). Survey shows humanities grad students rarely expect to pursue alt-ac careers.
Inside Higher Ed. Retrieved from http://www.insidehighered.com/news/2013/04/30/survey-shows-humanities-grad-students-rarely-expect-pursue-alt-ac-careers#sthash.jUtegUVn.dpbs
Uppal, S., & LaRochelle, C. (2014). Overqualification Among Recent University Graduates in Canada.
Ottawa: Statistics Canada. Catalogue no. 75-006-X. Retrieved from http://www.statcan.gc.ca/pub/75-006-x/2014001/article/11916-eng.pdf
Wiggers, R., Lennon, M. C., & Frank, K. (2011). Expanding Opportunities for Graduate Studies: The Recent
Experience of Ontario. Toronto: Higher Education Quality Council of Ontario.