1 Comparative Comparative genomics genomics tools for tools for biological discovery biological discovery Inna Dubchak, Ph.D. Berkeley PGA, Bioinformatics Group Leader Lawrence Berkeley National Laboratory [email protected]http:/www-gsd.lbl.gov Outline What is comparative genomics? VISTA tools developed for comparative genomics. Related biological stories Large scale VISTA applications including automatic computational system for comparing whole vertebrate genomes
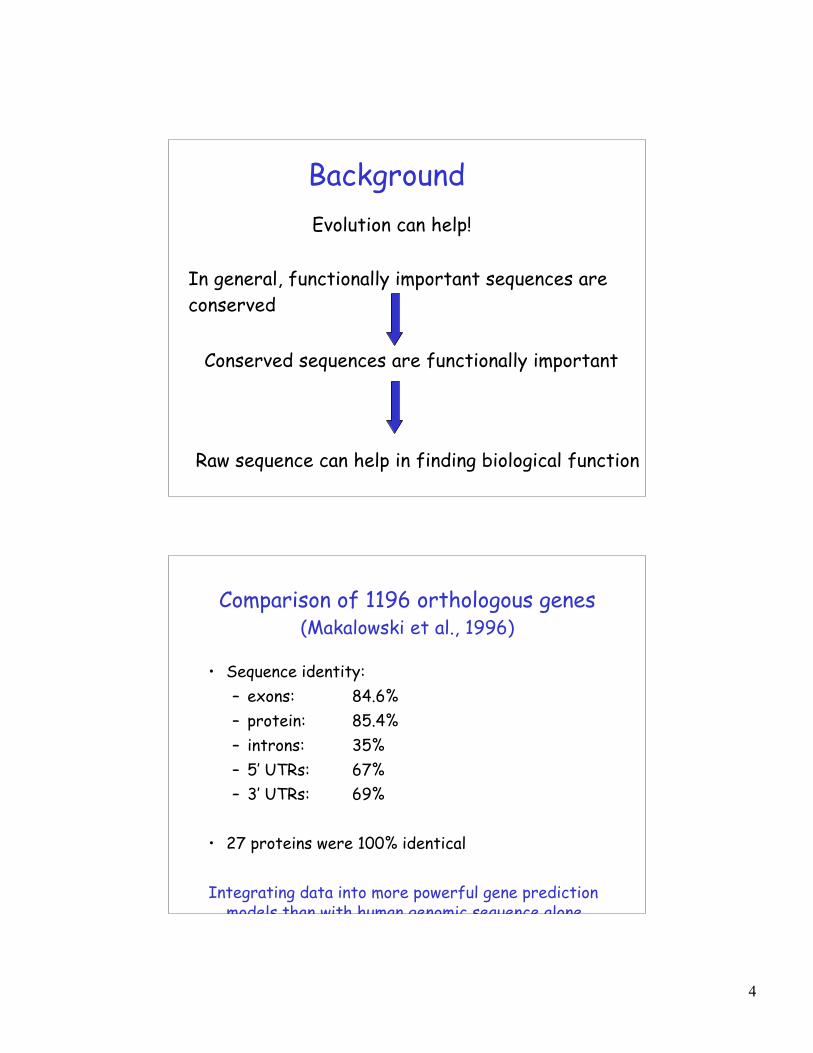
Integrating data into more powerful gene predictionmodels than with human genomic sequence alone
5
Comparing sequences of different organisms
• Helps in gene predictions
• Helps in understanding evolution
• Conserved between species non-coding sequencesare reliable guides to regulatory elements
• Differences between evolutionary closely relatedsequences help to discover gene functions
Sequence comparisons. How?
Three variations:
Find the best OVERALL alignment.Global alignment
Find ALL regions of similarity.Local alignment
Find the BEST region of similarity.Optimal local alignment
6
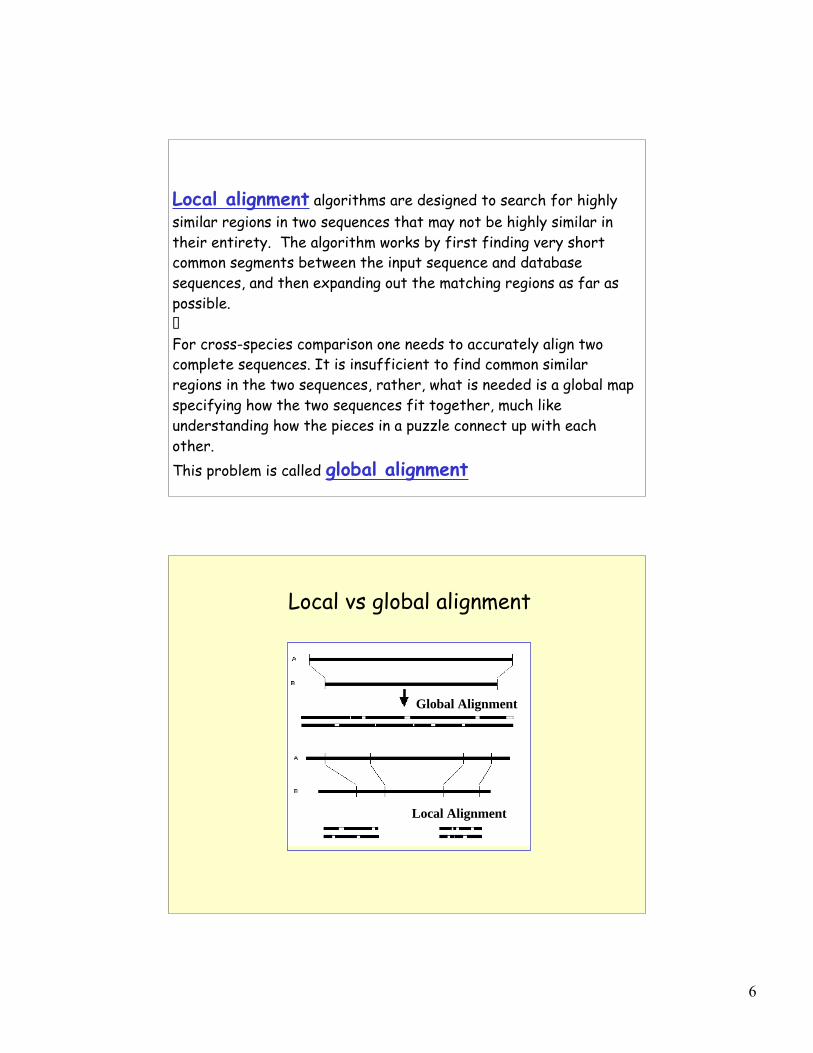
Local alignment algorithms are designed to search for highlysimilar regions in two sequences that may not be highly similar intheir entirety. The algorithm works by first finding very shortcommon segments between the input sequence and databasesequences, and then expanding out the matching regions as far aspossible.!For cross-species comparison one needs to accurately align twocomplete sequences. It is insufficient to find common similarregions in the two sequences, rather, what is needed is a global mapspecifying how the two sequences fit together, much likeunderstanding how the pieces in a puzzle connect up with eachother.This problem is called global alignment
Global Alignment
Local Alignment
Local vs global alignment
7
Challenges in aligning long genomicregions
• Long sequences lead to memory problems• Speed becomes an issue• Long alignments are very sensitive to parameters• Draft sequences present a nontrivial problem• Accuracy is difficult to measure and to achieve• Scaling up to the size of whole genomesß Sequence at different stages of completion, difficult to compare
Whole genome shotgunFinished BACs
Partial Assemblies
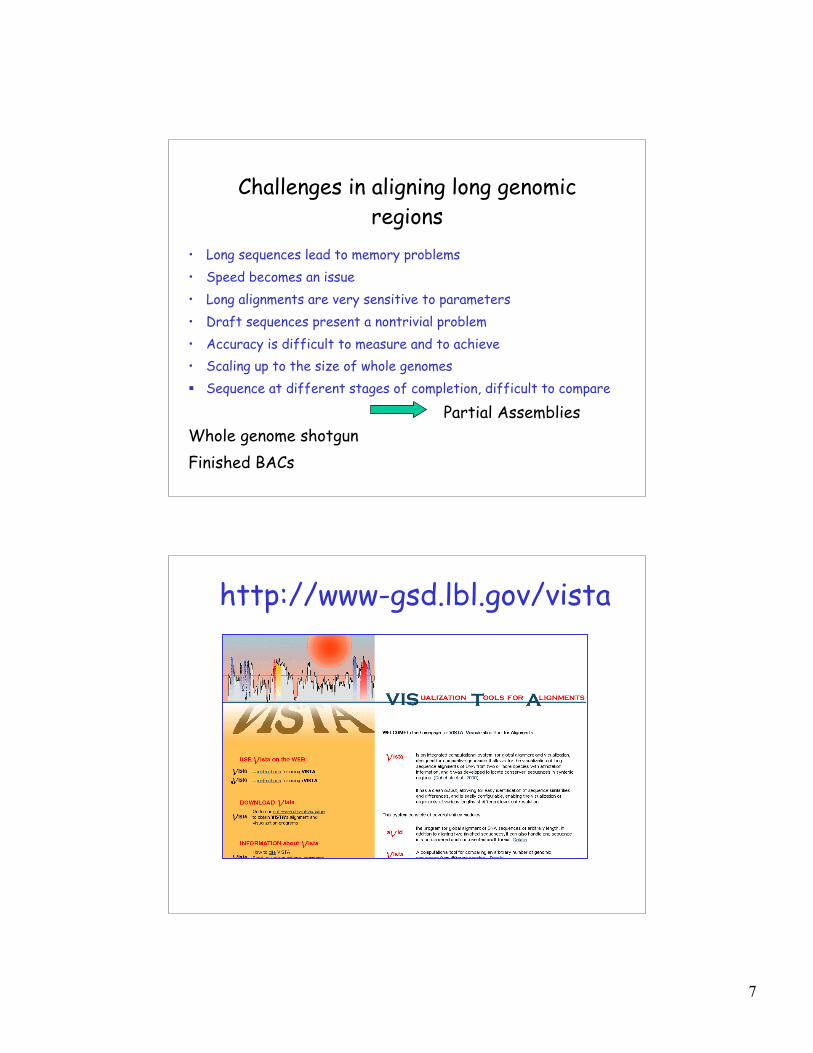
http://www-gsd.lbl.gov/vista
8
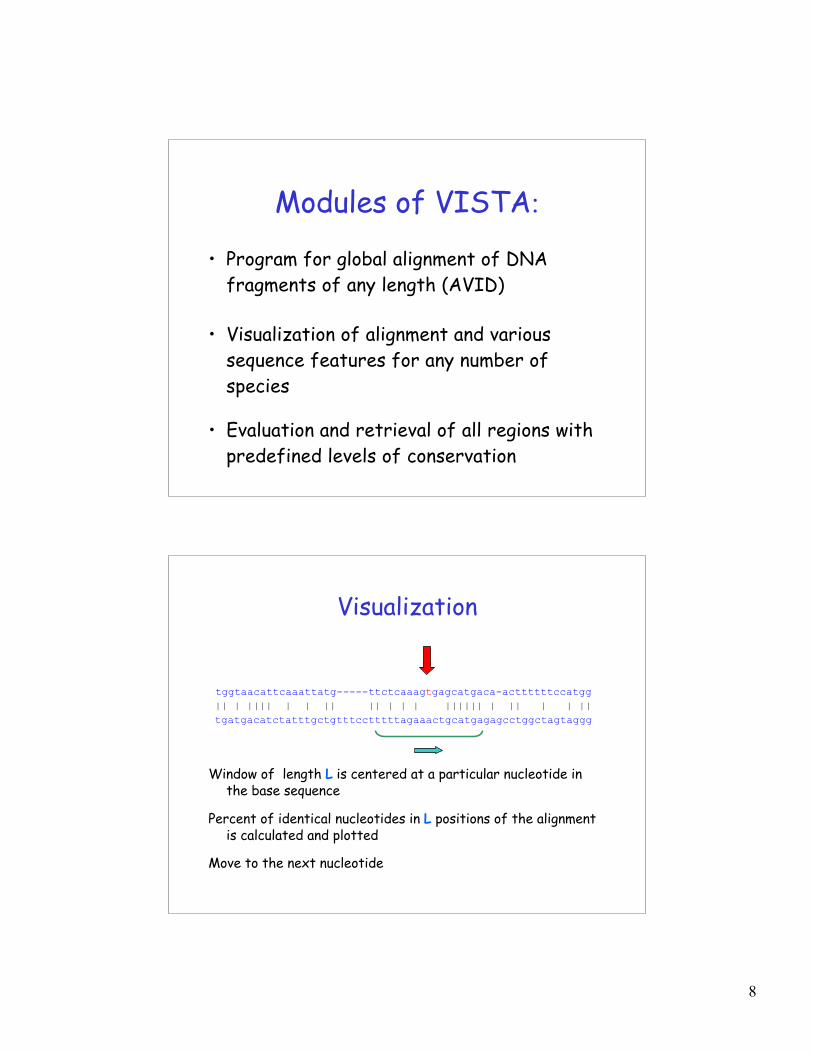
Modules of VISTA:
• Program for global alignment of DNAfragments of any length (AVID)
• Visualization of alignment and varioussequence features for any number ofspecies
• Evaluation and retrieval of all regions withpredefined levels of conservation
Window of length L is centered at a particular nucleotide inthe base sequence
Percent of identical nucleotides in L positions of the alignmentis calculated and plotted
Move to the next nucleotide!
9
Finding conserved regions withpercentage and length cutoffs
Conserved segments with percent identity X andlength Y - regions in which every contiguoussubsegment of length Y was at least X% identicalto its paired sequence. These segments aremerged to define the conserved regions.
Output:11054 - 11156 = 103bp at 77.670% NONCODING13241 - 13453 = 213bp at 87.793% EXON14698 - 14822 = 125bp at 84.800% EXON
80078 (149626) to 80171 (149724) = 99bp at 63.6% noncoding 159297 (158141) to 159379 (158223) = 83bp at 80.7% exon 179096 (159067) to 179253 (159224) = 158bp at 75.9% exon 189328 (159566) to 189382 (159620) = 55bp at 81.8% exon
VISTA output filesVISTA output filesAll pair wise alignments
> 27000 queries on-line, distributed > 1100 copies of the program in47 countries.
After VISTA publications at the end of 2000:
~60 papers cited VISTA and presented results obtained with the program
Discovering Interleukin Expression Switch
Loots GG, Locksley RM, Blankespoor CM, Wang ZE, Miller W, RubinEM, Frazer KA. Identification of a coordinate regulator ofinterleukins 4, 13, and 5 by cross-species sequence comparisons.Science. 2000 Apr 7;288(5463):136-40.
Biological story
12
CodingExons 3%
HS-
5910
82
IL Cluster MU Ch 11
LAC
s2
FMR
2 - h
omol
og
Cyc
lin I
- hom
olog
IL-3
Ubi
quito
ne-B
PG
DF-
9H
s.151
472
Hs.1
3308
Sept
in2
KIF
3
IL-4
IL-1
3R
AD
-50
IL-5
IRF-
1H
s.709
32
OC
TN1
P4-h
ydro
xyla
seal
pha
OC
TN2
GM
-CSF
IL Cluster HUM 5q31
IL-3
FMR
2 - h
omol
ogU
biqu
itone
-BP
GD
F-9
Hs.1
3308
Sept
in2
KIF
3
IL-4
IL-1
3R
AD
-50
IL-5
IRF-
1
OC
TN1
P4-h
ydro
xyla
seal
pha
OC
TN2
GM
-CSF
Cyc
lin I
- hom
olog
LAC
s2H
S-51
082
Conserved 2.6% (>100bp > 75%)
Non-Coding
AFilteringStrategy
13
Present in other species: Cow (86%), Dog (81%), Rabbit (73%)
Genomic position conserved in human, mouse, dog, baboon
Single copy in the human genome. Two hypersensitive sites mapped.
CNS-1
Functional Analysis of CNS1
KIF3 IL4 IL13 RAD50 IL5 IRF1 E3 E2 OCTN2
CNS 1
LoxP CNS1 LoxP
Generate Human 5q31 YAC Transgenic Mice
IL 4 IL 13
14
0
20
40
60
80
100
120
140
160
180
200
3 day 5 day
CNS-1 wtCNS-1 del
Human IL 4 Production in YAC TransgenicsContaining and Lacking CNS1
IL-5 & IL13 Expression is also reduced in CNS-1del miceP
g/m
l
KIF3
IL4
IL13
RAD50CNS-1
IL5
15
J Mol Cell Cardiol 34, 1345-1356 (2002)Myocardin: A Component of a Molecular Switch for Smooth Muscle Differentiation. J. Chen, C. M. Kitchen, J. W. Streb and J. M. Miano
University of Oxford
VSTA used to solve the gene structures of rat and human myocardin.
Results obtained with VISTAResults obtained with VISTA
Gene 293, 33–46 (2002)Molecular characterization of the murine SIGNR1 gene encoding a C-type lectin homologous to human DC-SIGN and DC-SIGNRS. A. Parent, T. Zhang, G. Chrebet, J. A. Clemas, D. J. Figueroa, B. Ky, R. A. Blevins,C. P. Austin and H. RosenMerck Research Laboratories.
16
Blood, 100, 3450-3456 (2002)Deletion of the mouse a -globin regulatory element (HS 26) has an unexpectedly mild phenotype E. Anguita, J. A. Sharpe, J. A. Sloane-Stanley, C. Tufarelli, D. R. Higgs, and W. G. Wood University of Oxford.
(HS 40) is necessary for high-level expression of the a-globin genes. A similarelement in the mouse (mHS 26) supposedly has similar functional properties.Knock out mHS26 instead of the expected severe a -thalassemia phenotype,produce the mice with a mild disease. These results may indicate differences in theregulation of the a -globin clusters in mice and humans.
Genome Research 11, 78 (2001)Human and Mouse - Synuclein Genes: Comparative Genomic Sequence Analysisand Identification of a Novel Gene Regulatory ElementJ. W. Touchman, et al. NIH Intramural Sequencing Center, National Institutes of Health
Synuclein gene involved in Alzheimer’s disease
17
EMBO reports 4:143 (2003) The kangaroo genome. Leaps and bounds in comparative genomics M. J. Wakefield and J. A. Marshall GravesResearch School of Biological Sciences, The Australian National University, Canberra, ACT 0200, Australia
‘The kangaroo genome is a rich and unique resource for comparative genomics, a treasure trove of comparative genomics data’.
Phylogenetic footprinting of 3’ untranslated region of the SLC16A2 gene
Liver enhancer
human/mouse 75%
50/100%
human/rabbit
50/100%75%
human/chicken 75%
50%
human/rat
50/100%75%
75%human/pig
50/100%
100%
75%50/100%
human/macaque
Apolipoprotein AI geneMulti-Species Comparative Analysis (VISTA)
18
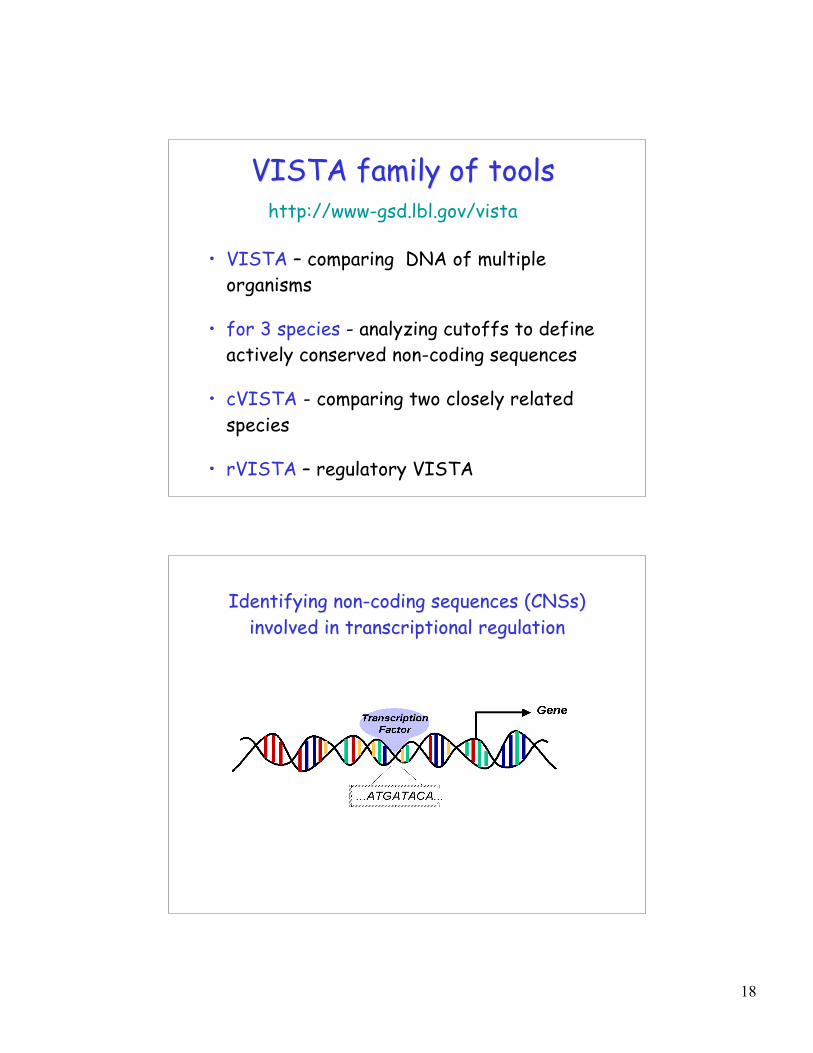
VISTA family of toolsVISTA family of tools
• VISTA – comparing DNA of multipleorganisms
• for 3 species - analyzing cutoffs to defineactively conserved non-coding sequences
• cVISTA - comparing two closely relatedspecies
• rVISTA – regulatory VISTA
http://www-gsd.lbl.gov/vista
Identifying non-coding sequences (Identifying non-coding sequences (CNSsCNSs))involved in transcriptional regulationinvolved in transcriptional regulation
19
rVISTA - prediction of transcriptionfactor binding sites
• Simultaneous searches of the major transcriptionfactor binding site database (Transfac) and theuse of global sequence alignment to sieve throughthe data
• Combination of database searches withcomparative sequence analysis reduces thenumber of predicted transcription factor bindingsites by several orders of magnitude
Human TGATTTCTCGGCAGCAAGGGAGGGCCCCATGACAAAGCCATTTGAAATCCCAGAAGCAATTTTCTACTTACGACCTCACTTTCTGTTGCTGTCTCTCCCTTCCCCTCTGMouse TGATTTCTCGGCAGCCAGGGAGGGCCCCATGACGAAGCCACTCGAAATCCCAGAAGCAATTTTCTACTTACGACCTCACTTTCTGTTGCTCTCTCTTCCTCCCCCTCCADog TGATTTCTCGGCAGCAAGGGAGGGCCCCATGACGAAGCCATTTGAAATCCCAGAAGCGATTTTCTACCTACGACCTCACTTTCTGTTGCGCTCACTCCCTTCCCCTGCARat TGATTTCTCGGCAGCCAGGGAGGGCCCCATGACGAAGCCACTCGAAATCCCAGAAGCAATTTTCTACTTACGACCTCACTTTCTGTTGTTCTCTCTTCCTCCCCCTCCACow TGATTTCTCGGCAGCCAGGGAGGGCCCCATGACGAAGCCATTTGAAATCCCAGAAGCAATTTTCTACTTACGACCTCACTTTCTGTTGCGTTCTCTCCCTTCCCCTCCTRabbit TGATTTCTCGGCAGCCAGGGAGGGCCCCACGAC-AAGCCATTCAAAATCCCAGAAGTGATTTTCTACTTACGACCTCACTTTCTGTTG----CTCTCTCCTTCCCTCCA
Ikaros-2 Ikaros-2 NFAT Ikaros-2
20 bp dynamic shifting window
>80% ID
1. Identify potential transcription factor binding sites foreach sequence using library of matrices (TRANSFAC)
2. Identify aligned sites using VISTA
3. Identify conserved sites using dynamic shifting window
Percentage of conserved sites of the total 3-5%
Regulatory VISTA (rVISTA)
20
~1 Meg region, 5q31Coding Noncoding
!
Human interval Transfac predictions for GATA sites 839 20654!
Aligned with the same predicted site in the mouse seq. 450 2618
Alligned sites conserved at 80% / 24 bp dynamic window 303 731!
Random DNA sequence of the same length 29280!
GATA-3 Conserved (4)
GATA-3 (28)
2 Exp. Verified GATA-3 Sites
IL 5
21
AP-1-conservedNFAT-conserved
GATA-3-conserved
100%
75%
50%
A
B
C
Ik-2-AllIk-2-Aligned
Ik-2-conserved
100%
75%
50%
AP-1-AllNFAT-All
AP-1-AlignedNFAT-Aligned
AP-1-ConservedNFAT-Conserved
100%
75%
50%
22
Sequence motif recognition+
multiple sequence alignment of syntenicregions,
a high throughput strategy for filtering andprioritizing putative DNA binding sites
genomically informed starting place forglobally investigating detailed regulation
Main features of VISTAMain features of VISTA
• Clear , configurable output
• Ability to visualize several globalalignments on the same scale
• Alignments up to several megabases
• Working with finished and draft sequences
• Available source code and WEB site
23
Reviews on comparative Reviews on comparative genomicsgenomics
• Hardison RC. 2000. Conserved noncoding sequences are reliableguides to regulatory elements. Trends Genet. 16: 369-72.
• Frazer, K.A, Elnitski, L., Church, D.M., Dubchak, I. , and Hardison,R.C.. Cross-species Sequence Comparisons: A Review of Methodsand Available Resources. (2003) Genome Res., 2003 Jan;13(1):1-12.
• Wei, L., Liu, I., Dubchak, I. Shon, J., and Park, J. Comparativegenomics approaches to study organism similarities anddifferences. J Biomed Inform.(2002) 35:142-50.
VISTA publications• I. Dubchak, M. Brudno, L.S. Pachter, G.G. Loots, C. Mayor, E. M.
Rubin, K. A. Frazer. (2000) Active conservation of noncodingsequences revealed by 3-way species comparisons. Genome Res.,10: 1304-1306.
• C. Mayor, M. Brudno, J. R. Schwartz, A. Poliakov, E. M. Rubin, K. A.Frazer, Lior S. Pachter, I. Dubchak. (2000) VISTA: Visualizingglobal DNA sequence alignments of arbitrary length.Bioinformatics, 16: 1046-1047.
• Bray, N., Dubchak, I., and Pachter, L. AVID: A Global AlignmentProgram. (2003) Genome Res. 2003 Jan;13(1):97-102.
• G. G. Loots, I. Ovcharenko, L. Pachter, I. Dubchak and E. M. Rubin.(2002) Comparative sequence-based approach to high-throughputdiscovery of functional regulatory elements. Genome Res.,12:832-839
24
Large scale VISTA applications:
The Berkeley Genome Pipeline – comparing complete genomes
What if you don’t have sequences of different species forthe genomic region of your interest?
Are there publicly available comparative genomics data?
Development of automatic computational systemDevelopment of automatic computational systemfor comparative analysis of whole genomesfor comparative analysis of whole genomes
2001 – Whole mouse genome assemblies became available Human genome – high quality draft
Precomputed alignments:Human Genome (Golden Path Assembly)againstMouse assemblies: Arachne, Phusion (2001) MGSC v3 (2002)Rat assemblies: January 2003, February 2003
----------------------------------------------------------D.Melanogaster vs D.Pseudoobscura February 2003
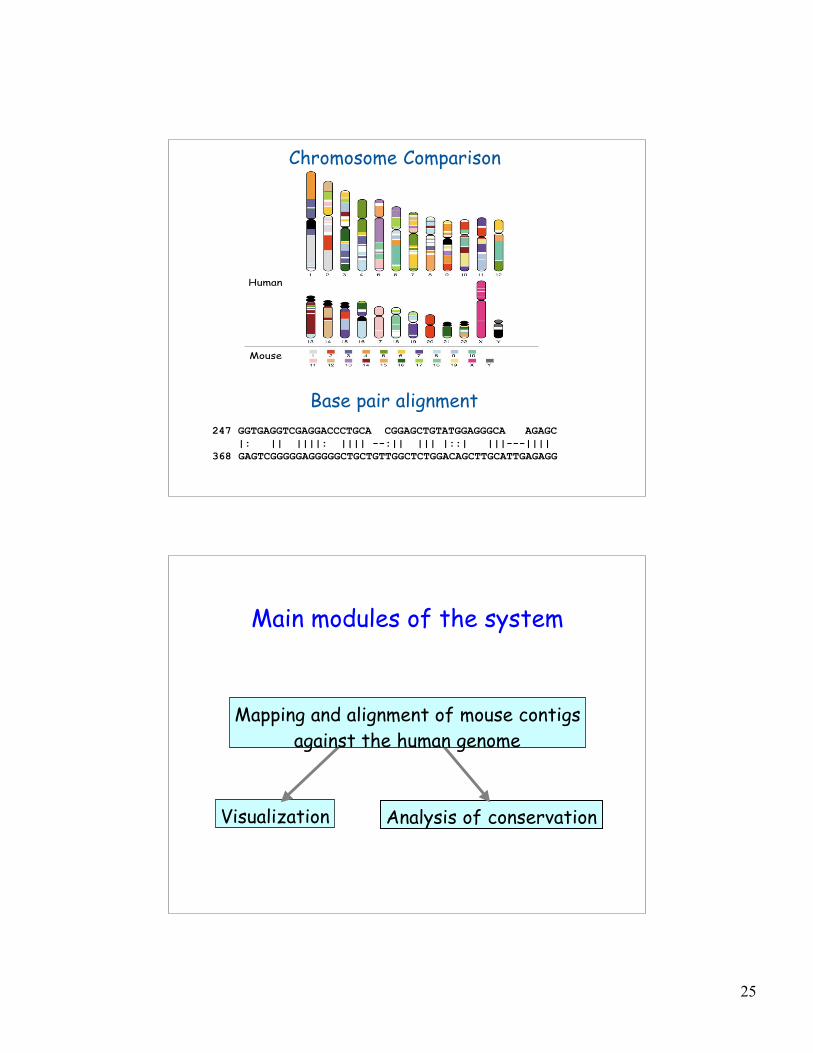
Mapping and alignment of mouse contigsagainst the human genome
26
Tandem Local/Global Alignment ApproachTandem Local/Global Alignment ApproachSequence fragment anchoring (DNA and/or translated BLAT) Multi-step verification of potential regions using global alignment (AVID or LAGAN)
Apolipoprotein(a) region. The expressed gene is confined to a subset ofprimates. Our method predicts that apoa(a) has no homology in the mousethat local alignment can’t detect.
Tandem approach in comparison with local alignment
Better specificity while preserving good sensitivity
27
http://pipeline.http://pipeline.lbllbl..govgov//
VISTA BrowserVISTA BrowserPreprocessed whole genome comparison forPreprocessed whole genome comparison forpairs of species (human/mouse/rat & pairs of species (human/mouse/rat & drosophilasdrosophilas))
VistaBrowser
28
Text browser
VistaBrowser
29
ABCA1 interval in UCSC human genomebrowser
VISTA Browser (Human/Mouse BRCA2 Comparison)VISTA Browser (Human/Mouse BRCA2 Comparison)
30
GenomeVista - is an interactive for comparingyour favorite sequence against the base genome
http://pipeline.http://pipeline.lbllbl..govgov//
GenomeVISTAGenomeVISTA
http://pipeline.http://pipeline.lbllbl..govgov//
Self-Input Sequence Comparison to either Human,Self-Input Sequence Comparison to either Human,Mouse, Rat, D.Mouse, Rat, D.MelanogasterMelanogaster Reference Genomes Reference Genomes
AC129066
opossumopossum
31
GenomeVISTAGenomeVISTARandom Random OpposumOpposum BAC versus Human Genome BAC versus Human Genome
Results of an on-line submission of a draft unannotated platypus sequenceAC130185 to Genome Vista.The gene has been correctly identified.
32
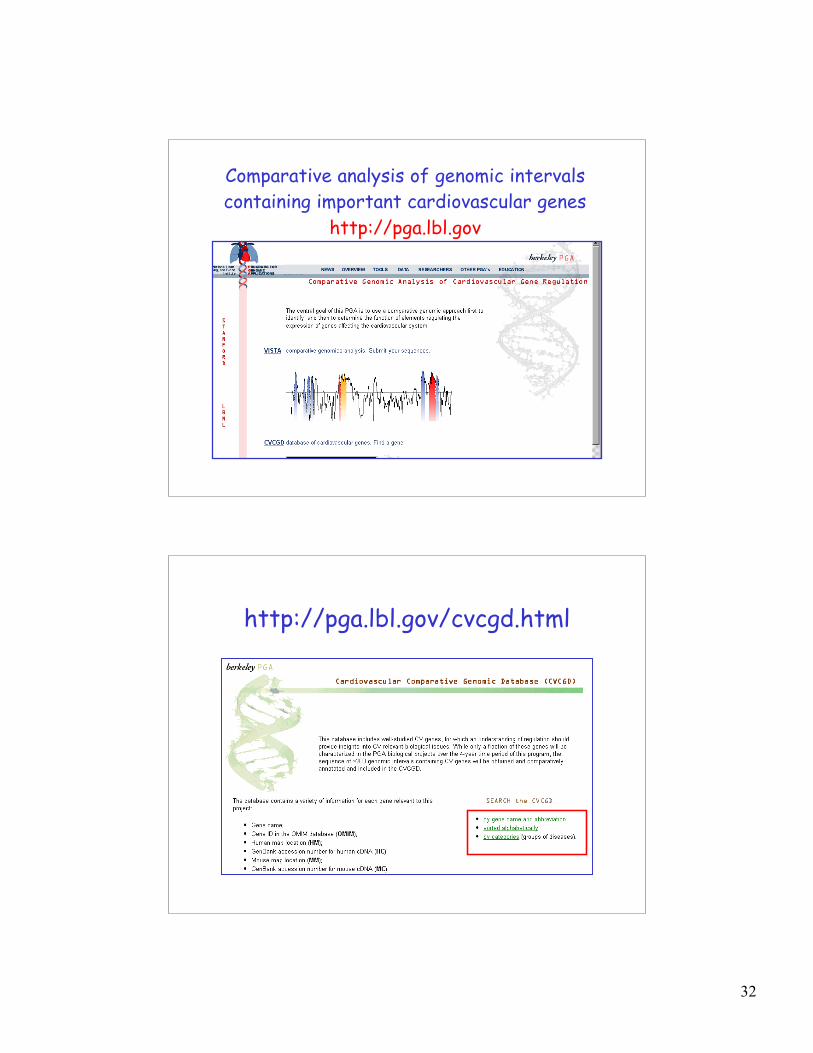
Comparative analysis of genomic intervalscontaining important cardiovascular genes
http://pga.lbl.gov
http://pga.lbl.gov/cvcgd.html
33
Search Results
Sequenced in Berkeley PGA
Links to wholegenome alignment
Example of CVCGD interval sequenced inBerkeley PGA
34
Short annotation of the region
VISTA plot of the region
35
multiVISTA plot of the region
Alignment
Conserved regions
36
SummarySummary
• Berkeley PGA http://pga.lbl.gov• VISTA family of tools


![Limited Number of Globin Genes in HumanDNA10-7, or 0.198 ngof globin DNA.FromEq. [1] wecan calculate the %hybridization, P, expected for anynumberof globin gene copiespresent.Forexample,inExp.1,](https://static.documents.pub/doc/80x56/60e570f3b76c9678502ef0c0/limited-number-of-globin-genes-in-humandna-10-7-or-0198-ngof-globin-dnafromeq.jpg)


![α Globin Hemoglobinopathy as A Case Study: Mutants and … · 2020. 7. 10. · Hemoglobinopathy is a term given for the mutants that compromise biologic function [9,10]. It is still](https://static.documents.pub/doc/80x56/60070fbad2cfdb4c6e36ffcc/-globin-hemoglobinopathy-as-a-case-study-mutants-and-2020-7-10-hemoglobinopathy.jpg)


