25
Stevens Azima & Patrick Mundler March 2020 Direct farm marketing in Canada Outline of a national survey
Stevens Azima & Patrick Mundler
March 2020
Direct farm marketing in Canada
Outline of a national survey
1
This summary presents the results of a research project funded by the Social Sciences and Humanities Research Council of Canada (SSHRC).
How to cite this
Azima S. & Mundler P. 2020. Direct farm marketing in Canada. Outline of a national survey. Laval University. 24 p.
Acknowledgments
We thank all the farmers who agreed to participate in our survey. We would also like to thank all the organizations committed to the development and promotion of short food chains who agreed to relay our survey within their networks.
Highlights
Between December 2018 and April 2019, we solicited information through a web survey from farmers who directly market their products in Canada. In total, we received 904 valid returns. According to the results of the survey:
- Almost half of respondents were women - 82.3% had pursued post-secondary studies - 77.2% had worked in another profession before becoming farmers - 73.7% had started their own farms - 72.2% sold three quarters or more of their output directly to consumers - 32% practiced organic farming - Respondents were generally satisfied with their farm businesses. The greatest perceived
benefits associated with direct marketing were social recognition (score of 3.8 out of 5), followed by economic satisfaction (3.6 out of 5) and work enjoyment (3.38 out of 5).
- High workloads, stress levels, and low pay were the main drawbacks of working in short food chains according to respondents.
- Respondents generally agreed that direct marketing contributes to territorial development. Specifically, they believed that short food chains facilitate the process of farm succession, enable female producers to play an active role on the farm, and boost the rural economy.
- Respondents shared a set of common values, with customer satisfaction being their most important priority. According to respondents, agriculture’s main purpose is to feed people and protect the environment.
- Farmgate sales followed by farmers’ markets were the two most widely used sales channels.
- On many issues, responses varied considerably from one province to another.

2
Contents
Introduction ..................................................................................................................................... 3
Sample characteristics ..................................................................................................................... 4
Profile of participants .................................................................................................................. 4
Participants’ beliefs and motivations .......................................................................................... 4
Size and types of farms ................................................................................................................ 5
Farm activities ............................................................................................................................. 6
Provincial distribution ................................................................................................................. 9
Satisfaction with direct-farm marketing ......................................................................................... 9
Overall results ............................................................................................................................ 10
Work enjoyment ........................................................................................................................ 10
Social recognition ...................................................................................................................... 11
Economic satisfaction ................................................................................................................ 12
The situation of women in short food chains ................................................................................ 13
Perceived contribution of short food chains to territorial development...................................... 14
Gender of participants .............................................................................................................. 15
Origin of the operation .............................................................................................................. 16
Gross annual revenue ................................................................................................................ 17
Net annual revenue ................................................................................................................... 18
Utilized categories of short food chains .................................................................................... 19
Location of sales in short food chains ....................................................................................... 20
Processing on the farm .............................................................................................................. 21
Farm hospitality ......................................................................................................................... 22
Organic farming ......................................................................................................................... 22
Conclusion ..................................................................................................................................... 23
3
Introduction Direct marketing, as a sales strategy, is garnering increasing interest from both farmers and consumers. Various political stakeholders and civil society organizations have shown their support for such initiatives, which aim at bringing farmers and consumers closer together. Direct marketing is said to create economic, social and environmental benefits for producers, consumers, and territories.
But what about in the case of Canada specifically? Our study seeks to answer this question.
Our research project was funded by the Social Sciences and Humanities Research Council of Canada (SSHRC) and titled, “Assumed virtues or tangible benefits? An analysis of the economic and social impacts of short food supply chains in Canada." As part of the study, we conducted during the winter of 2019 a survey of farmers who directly market their products. This summary presents the survey results.
In our study, we define direct marketing (or “short food chains”) as agricultural marketing channels that involve at most one middleman between the producer and the consumer. We looked at all 10 provinces in Canada and set out to determine whether short food chains improve the professional satisfaction of farmers.
To do so, we divided work-related satisfaction into three key areas:
- Work enjoyment: Do farmers like what they do? Or do they find that selling in short food chains comes with drawbacks?
- Social recognition: Do farmers in short food chains feel that their work is appreciated by others? Is the direct relationship with consumers rewarding or is it too demanding and not very motivating?
- Economic satisfaction: Do farmers in short food chains feel that they are fairly compensated for their efforts? Or do they feel that the financial returns from direct marketing are insufficient?
Our questionnaire also asked direct-market farmers about their values, how they organize their work, and the type of farm they run. The survey was distributed to more than 5,000 producers who advertised themselves on the internet as direct-market farmers. In total, we received 904 valid returns, and, of these, 610 were complete. The number of responses obtained, therefore, sometimes varied from one question to another. However, each table presented in this summary will specify the number of answers received (next to the letter “N”).
4
Sample characteristics
Profile of participants
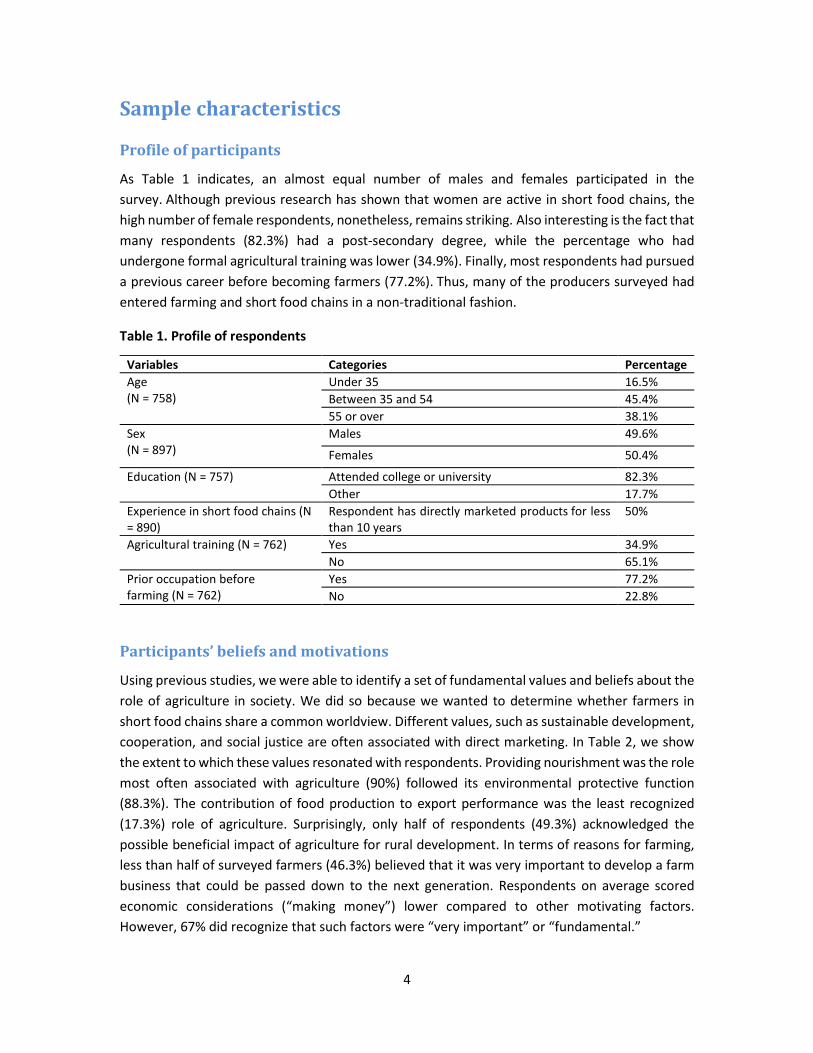
As Table 1 indicates, an almost equal number of males and females participated in the survey. Although previous research has shown that women are active in short food chains, the high number of female respondents, nonetheless, remains striking. Also interesting is the fact that many respondents (82.3%) had a post-secondary degree, while the percentage who had undergone formal agricultural training was lower (34.9%). Finally, most respondents had pursued a previous career before becoming farmers (77.2%). Thus, many of the producers surveyed had entered farming and short food chains in a non-traditional fashion.
Table 1. Profile of respondents
Variables Categories Percentage Age (N = 758)
Under 35 16.5% Between 35 and 54 45.4% 55 or over 38.1%
Sex (N = 897)
Males 49.6% Females 50.4%
Education (N = 757) Attended college or university 82.3% Other 17.7%
Experience in short food chains (N = 890)
Respondent has directly marketed products for less than 10 years
50%
Agricultural training (N = 762) Yes 34.9% No 65.1%
Prior occupation before farming (N = 762)
Yes 77.2% No 22.8%
Participants’ beliefs and motivations
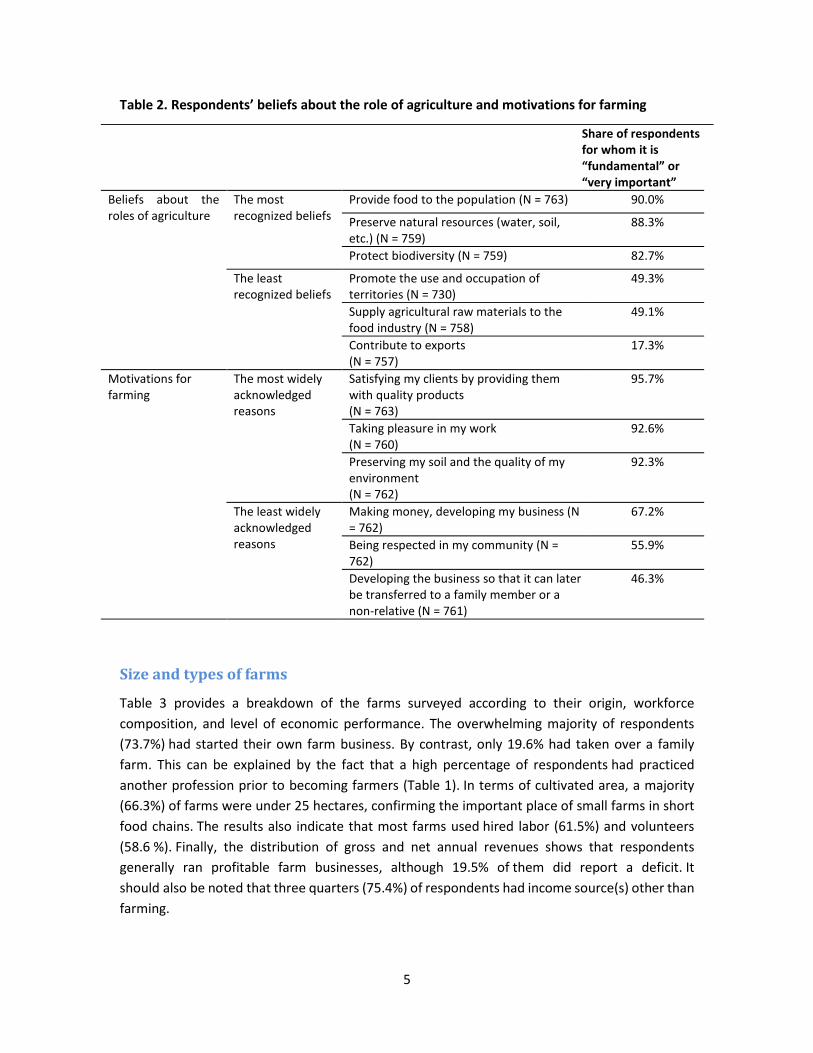
Using previous studies, we were able to identify a set of fundamental values and beliefs about the role of agriculture in society. We did so because we wanted to determine whether farmers in short food chains share a common worldview. Different values, such as sustainable development, cooperation, and social justice are often associated with direct marketing. In Table 2, we show the extent to which these values resonated with respondents. Providing nourishment was the role most often associated with agriculture (90%) followed its environmental protective function (88.3%). The contribution of food production to export performance was the least recognized (17.3%) role of agriculture. Surprisingly, only half of respondents (49.3%) acknowledged the possible beneficial impact of agriculture for rural development. In terms of reasons for farming, less than half of surveyed farmers (46.3%) believed that it was very important to develop a farm business that could be passed down to the next generation. Respondents on average scored economic considerations (“making money”) lower compared to other motivating factors. However, 67% did recognize that such factors were “very important” or “fundamental.”
5
Table 2. Respondents’ beliefs about the role of agriculture and motivations for farming
Share of respondents for whom it is “fundamental” or “very important”
Beliefs about the roles of agriculture
The most recognized beliefs
Provide food to the population (N = 763) 90.0% Preserve natural resources (water, soil, etc.) (N = 759)
88.3%
Protect biodiversity (N = 759) 82.7% The least recognized beliefs
Promote the use and occupation of territories (N = 730)
49.3%
Supply agricultural raw materials to the food industry (N = 758)
49.1%
Contribute to exports (N = 757)
17.3%
Motivations for farming
The most widely acknowledged reasons
Satisfying my clients by providing them with quality products (N = 763)
95.7%
Taking pleasure in my work (N = 760)
92.6%
Preserving my soil and the quality of my environment (N = 762)
92.3%
The least widely acknowledged reasons
Making money, developing my business (N = 762)
67.2%
Being respected in my community (N = 762)
55.9%
Developing the business so that it can later be transferred to a family member or a non-relative (N = 761)
46.3%
Size and types of farms
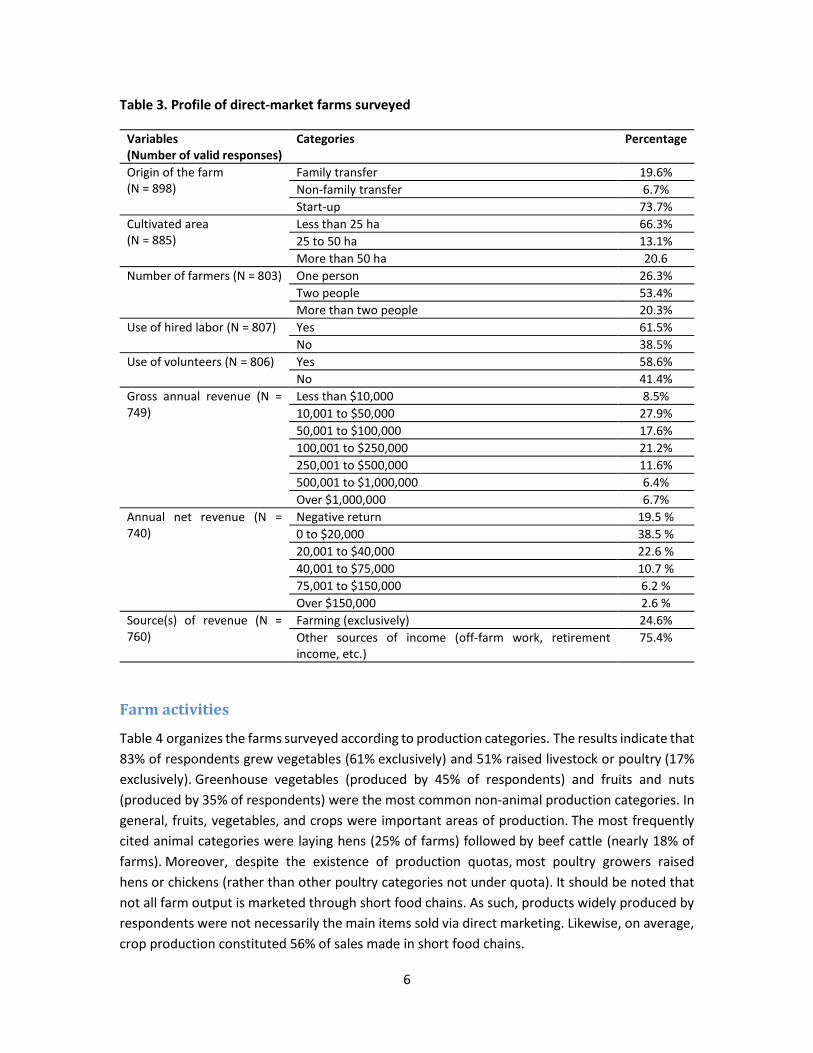
Table 3 provides a breakdown of the farms surveyed according to their origin, workforce composition, and level of economic performance. The overwhelming majority of respondents (73.7%) had started their own farm business. By contrast, only 19.6% had taken over a family farm. This can be explained by the fact that a high percentage of respondents had practiced another profession prior to becoming farmers (Table 1). In terms of cultivated area, a majority (66.3%) of farms were under 25 hectares, confirming the important place of small farms in short food chains. The results also indicate that most farms used hired labor (61.5%) and volunteers (58.6 %). Finally, the distribution of gross and net annual revenues shows that respondents generally ran profitable farm businesses, although 19.5% of them did report a deficit. It should also be noted that three quarters (75.4%) of respondents had income source(s) other than farming.
6
Table 3. Profile of direct-market farms surveyed
Variables (Number of valid responses)
Categories Percentage
Origin of the farm (N = 898)
Family transfer 19.6% Non-family transfer 6.7% Start-up 73.7%
Cultivated area (N = 885)
Less than 25 ha 66.3% 25 to 50 ha 13.1% More than 50 ha 20.6
Number of farmers (N = 803) One person 26.3% Two people 53.4% More than two people 20.3%
Use of hired labor (N = 807) Yes 61.5% No 38.5%
Use of volunteers (N = 806) Yes 58.6% No 41.4%
Gross annual revenue (N = 749)
Less than $10,000 8.5% 10,001 to $50,000 27.9% 50,001 to $100,000 17.6% 100,001 to $250,000 21.2% 250,001 to $500,000 11.6% 500,001 to $1,000,000 6.4% Over $1,000,000 6.7%
Annual net revenue (N = 740)
Negative return 19.5 % 0 to $20,000 38.5 % 20,001 to $40,000 22.6 % 40,001 to $75,000 10.7 % 75,001 to $150,000 6.2 % Over $150,000 2.6 %
Source(s) of revenue (N = 760)
Farming (exclusively) 24.6% Other sources of income (off-farm work, retirement income, etc.)
75.4%
Farm activities
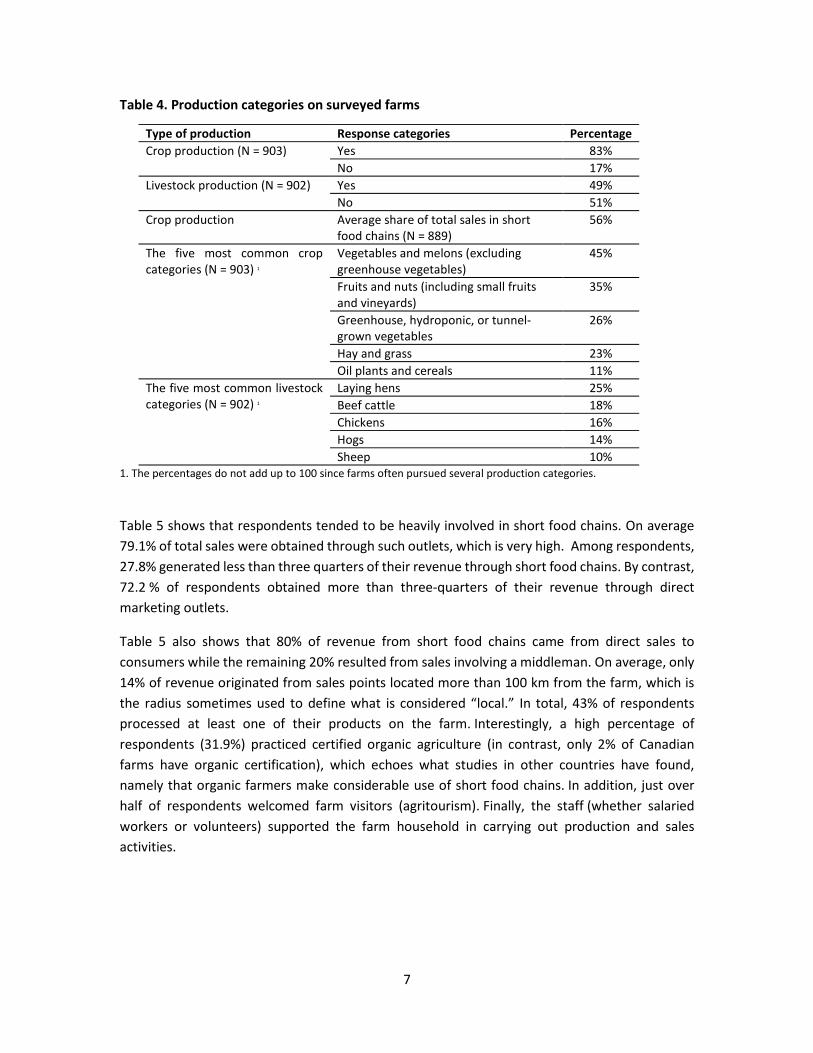
Table 4 organizes the farms surveyed according to production categories. The results indicate that 83% of respondents grew vegetables (61% exclusively) and 51% raised livestock or poultry (17% exclusively). Greenhouse vegetables (produced by 45% of respondents) and fruits and nuts (produced by 35% of respondents) were the most common non-animal production categories. In general, fruits, vegetables, and crops were important areas of production. The most frequently cited animal categories were laying hens (25% of farms) followed by beef cattle (nearly 18% of farms). Moreover, despite the existence of production quotas, most poultry growers raised hens or chickens (rather than other poultry categories not under quota). It should be noted that not all farm output is marketed through short food chains. As such, products widely produced by respondents were not necessarily the main items sold via direct marketing. Likewise, on average, crop production constituted 56% of sales made in short food chains.
7
Table 4. Production categories on surveyed farms
Type of production Response categories Percentage Crop production (N = 903) Yes 83%
No 17% Livestock production (N = 902) Yes 49%
No 51% Crop production Average share of total sales in short
food chains (N = 889) 56%
The five most common crop categories (N = 903) 1
Vegetables and melons (excluding greenhouse vegetables)
45%
Fruits and nuts (including small fruits and vineyards)
35%
Greenhouse, hydroponic, or tunnel-grown vegetables
26%
Hay and grass 23% Oil plants and cereals 11%
The five most common livestock categories (N = 902) 1
Laying hens 25% Beef cattle 18% Chickens 16% Hogs 14% Sheep 10%
1. The percentages do not add up to 100 since farms often pursued several production categories.
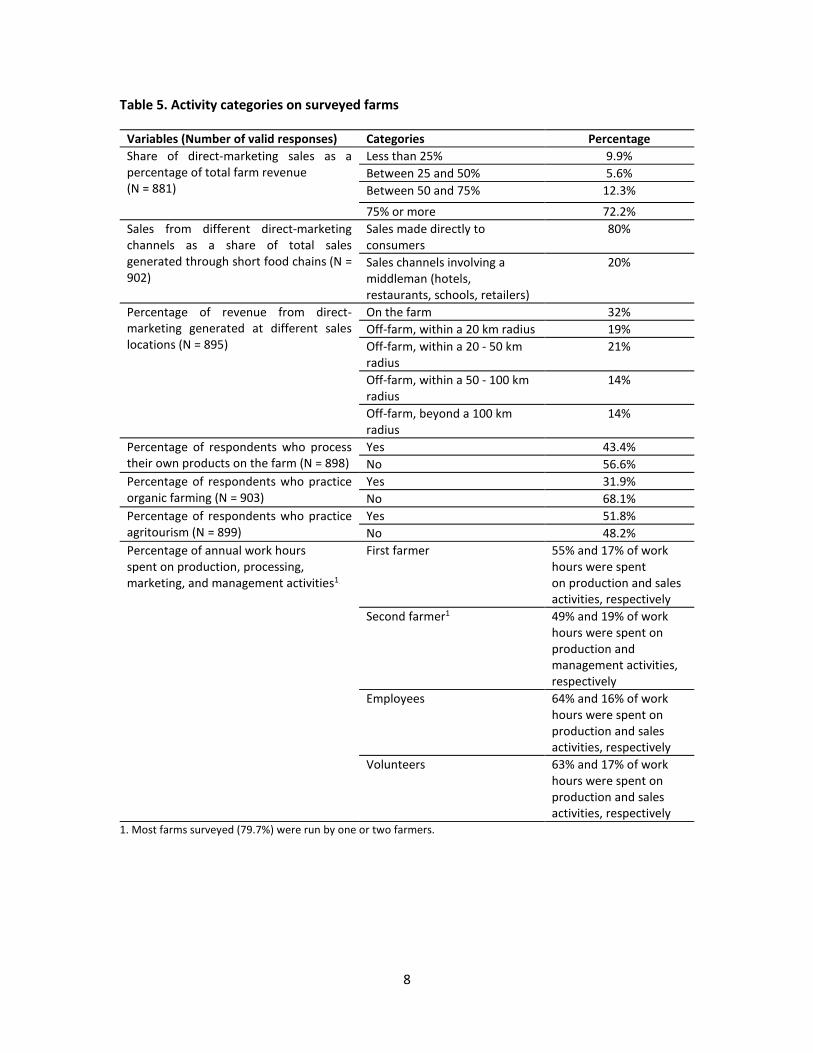
Table 5 shows that respondents tended to be heavily involved in short food chains. On average 79.1% of total sales were obtained through such outlets, which is very high. Among respondents, 27.8% generated less than three quarters of their revenue through short food chains. By contrast, 72.2 % of respondents obtained more than three-quarters of their revenue through direct marketing outlets.
Table 5 also shows that 80% of revenue from short food chains came from direct sales to consumers while the remaining 20% resulted from sales involving a middleman. On average, only 14% of revenue originated from sales points located more than 100 km from the farm, which is the radius sometimes used to define what is considered “local.” In total, 43% of respondents processed at least one of their products on the farm. Interestingly, a high percentage of respondents (31.9%) practiced certified organic agriculture (in contrast, only 2% of Canadian farms have organic certification), which echoes what studies in other countries have found, namely that organic farmers make considerable use of short food chains. In addition, just over half of respondents welcomed farm visitors (agritourism). Finally, the staff (whether salaried workers or volunteers) supported the farm household in carrying out production and sales activities.
8
Table 5. Activity categories on surveyed farms
Variables (Number of valid responses) Categories Percentage Share of direct-marketing sales as a percentage of total farm revenue (N = 881)
Less than 25% 9.9% Between 25 and 50% 5.6% Between 50 and 75% 12.3% 75% or more 72.2%
Sales from different direct-marketing channels as a share of total sales generated through short food chains (N = 902)
Sales made directly to consumers
80%
Sales channels involving a middleman (hotels, restaurants, schools, retailers)
20%
Percentage of revenue from direct-marketing generated at different sales locations (N = 895)
On the farm 32% Off-farm, within a 20 km radius 19% Off-farm, within a 20 - 50 km radius
21%
Off-farm, within a 50 - 100 km radius
14%
Off-farm, beyond a 100 km radius
14%
Percentage of respondents who process their own products on the farm (N = 898)
Yes 43.4% No 56.6%
Percentage of respondents who practice organic farming (N = 903)
Yes 31.9% No 68.1%
Percentage of respondents who practice agritourism (N = 899)
Yes 51.8% No 48.2%
Percentage of annual work hours spent on production, processing, marketing, and management activities1.
First farmer 55% and 17% of work hours were spent on production and sales activities, respectively
Second farmer1 49% and 19% of work hours were spent on production and management activities, respectively
Employees 64% and 16% of work hours were spent on production and sales activities, respectively
Volunteers 63% and 17% of work hours were spent on production and sales activities, respectively
1. Most farms surveyed (79.7%) were run by one or two farmers.
9
Provincial distribution
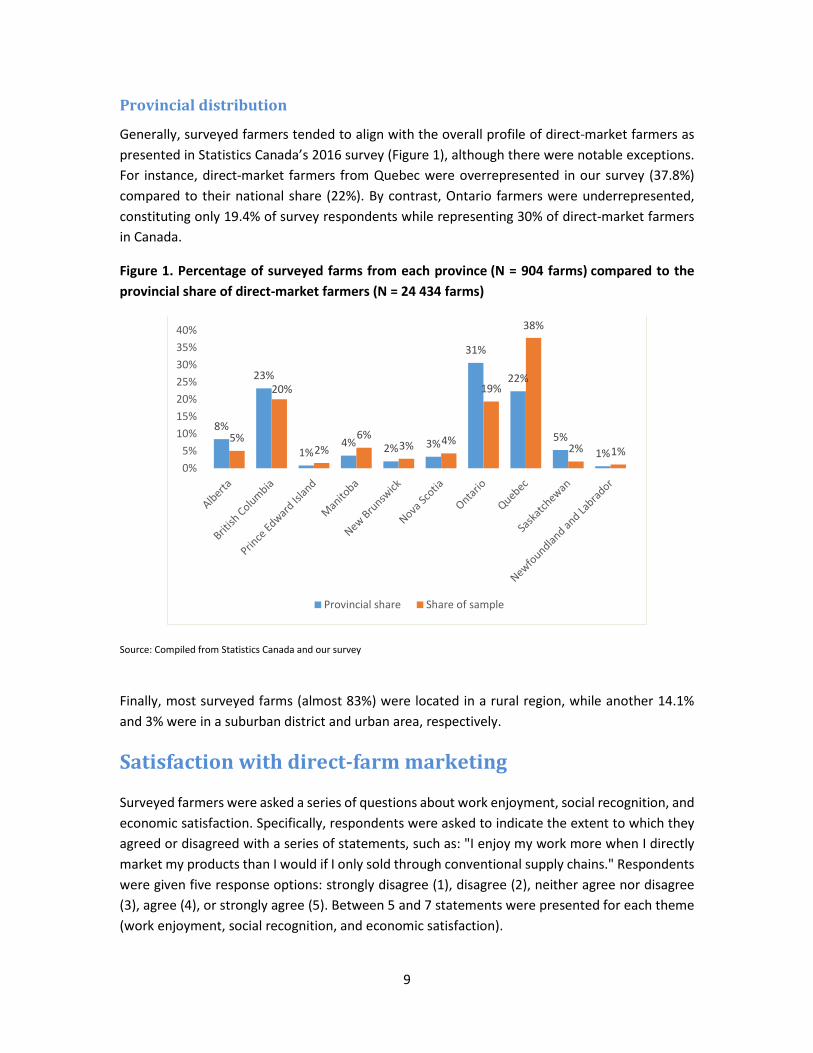
Generally, surveyed farmers tended to align with the overall profile of direct-market farmers as presented in Statistics Canada’s 2016 survey (Figure 1), although there were notable exceptions. For instance, direct-market farmers from Quebec were overrepresented in our survey (37.8%) compared to their national share (22%). By contrast, Ontario farmers were underrepresented, constituting only 19.4% of survey respondents while representing 30% of direct-market farmers in Canada.
Figure 1. Percentage of surveyed farms from each province (N = 904 farms) compared to the provincial share of direct-market farmers (N = 24 434 farms)
Source: Compiled from Statistics Canada and our survey
Finally, most surveyed farms (almost 83%) were located in a rural region, while another 14.1% and 3% were in a suburban district and urban area, respectively.
Satisfaction with direct-farm marketing
Surveyed farmers were asked a series of questions about work enjoyment, social recognition, and economic satisfaction. Specifically, respondents were asked to indicate the extent to which they agreed or disagreed with a series of statements, such as: "I enjoy my work more when I directly market my products than I would if I only sold through conventional supply chains." Respondents were given five response options: strongly disagree (1), disagree (2), neither agree nor disagree (3), agree (4), or strongly agree (5). Between 5 and 7 statements were presented for each theme (work enjoyment, social recognition, and economic satisfaction).
8%
23%
1%4% 2% 3%
31%
22%
5%1%
5%
20%
2%6%
3% 4%
19%
38%
2% 1%0%5%
10%15%20%25%30%35%40%
Provincial share Share of sample
10
Overall results
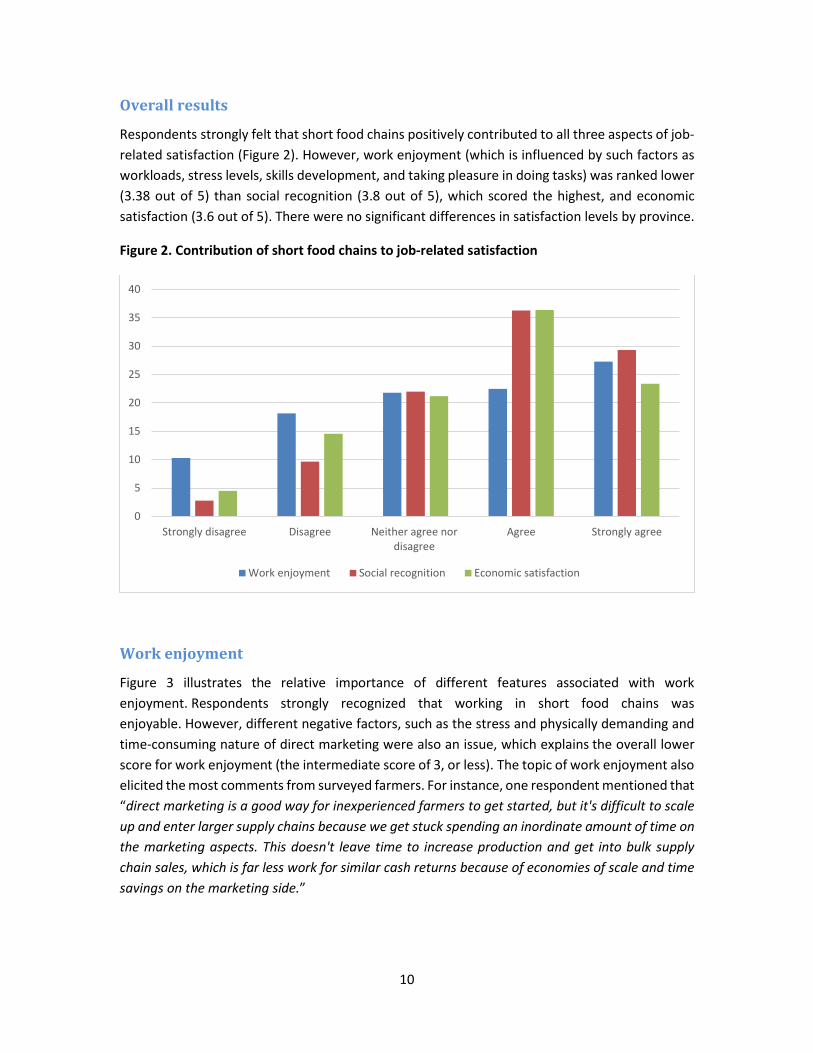
Respondents strongly felt that short food chains positively contributed to all three aspects of job-related satisfaction (Figure 2). However, work enjoyment (which is influenced by such factors as workloads, stress levels, skills development, and taking pleasure in doing tasks) was ranked lower (3.38 out of 5) than social recognition (3.8 out of 5), which scored the highest, and economic satisfaction (3.6 out of 5). There were no significant differences in satisfaction levels by province.
Figure 2. Contribution of short food chains to job-related satisfaction
Work enjoyment
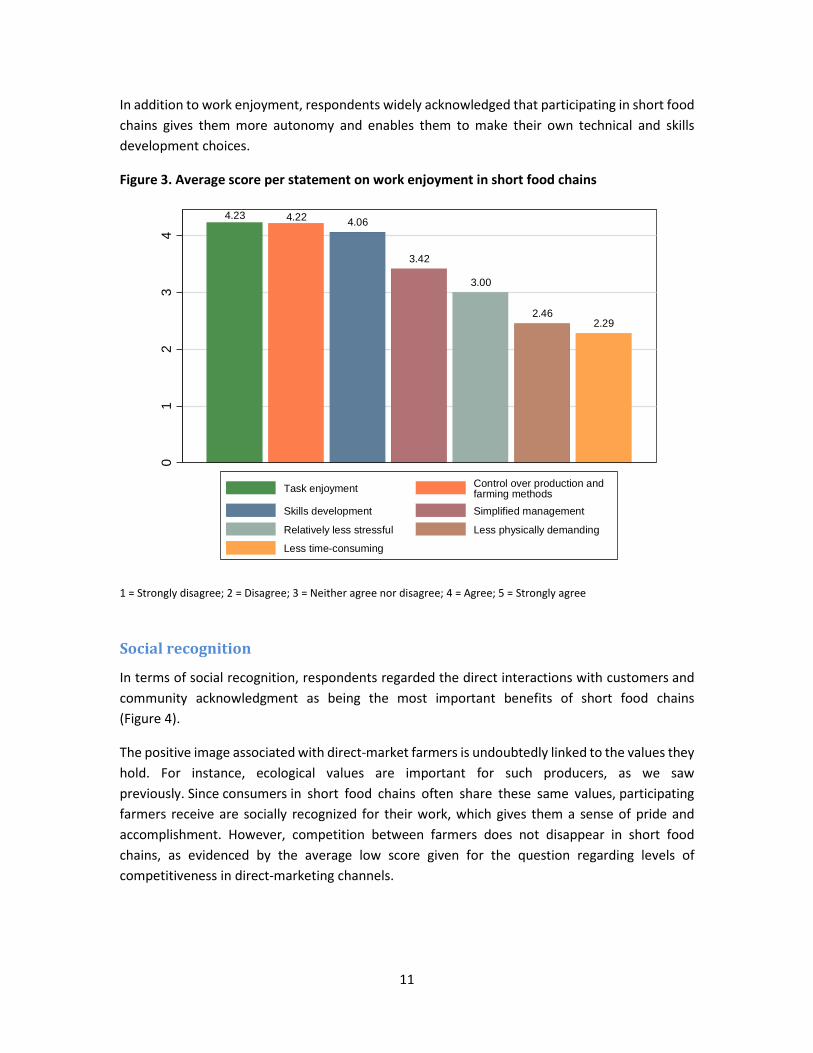
Figure 3 illustrates the relative importance of different features associated with work enjoyment. Respondents strongly recognized that working in short food chains was enjoyable. However, different negative factors, such as the stress and physically demanding and time-consuming nature of direct marketing were also an issue, which explains the overall lower score for work enjoyment (the intermediate score of 3, or less). The topic of work enjoyment also elicited the most comments from surveyed farmers. For instance, one respondent mentioned that “direct marketing is a good way for inexperienced farmers to get started, but it's difficult to scale up and enter larger supply chains because we get stuck spending an inordinate amount of time on the marketing aspects. This doesn't leave time to increase production and get into bulk supply chain sales, which is far less work for similar cash returns because of economies of scale and time savings on the marketing side.”
0
5
10
15
20
25
30
35
40
Strongly disagree Disagree Neither agree nordisagree
Agree Strongly agree
Work enjoyment Social recognition Economic satisfaction
11
In addition to work enjoyment, respondents widely acknowledged that participating in short food chains gives them more autonomy and enables them to make their own technical and skills development choices.
Figure 3. Average score per statement on work enjoyment in short food chains
1 = Strongly disagree; 2 = Disagree; 3 = Neither agree nor disagree; 4 = Agree; 5 = Strongly agree
Social recognition
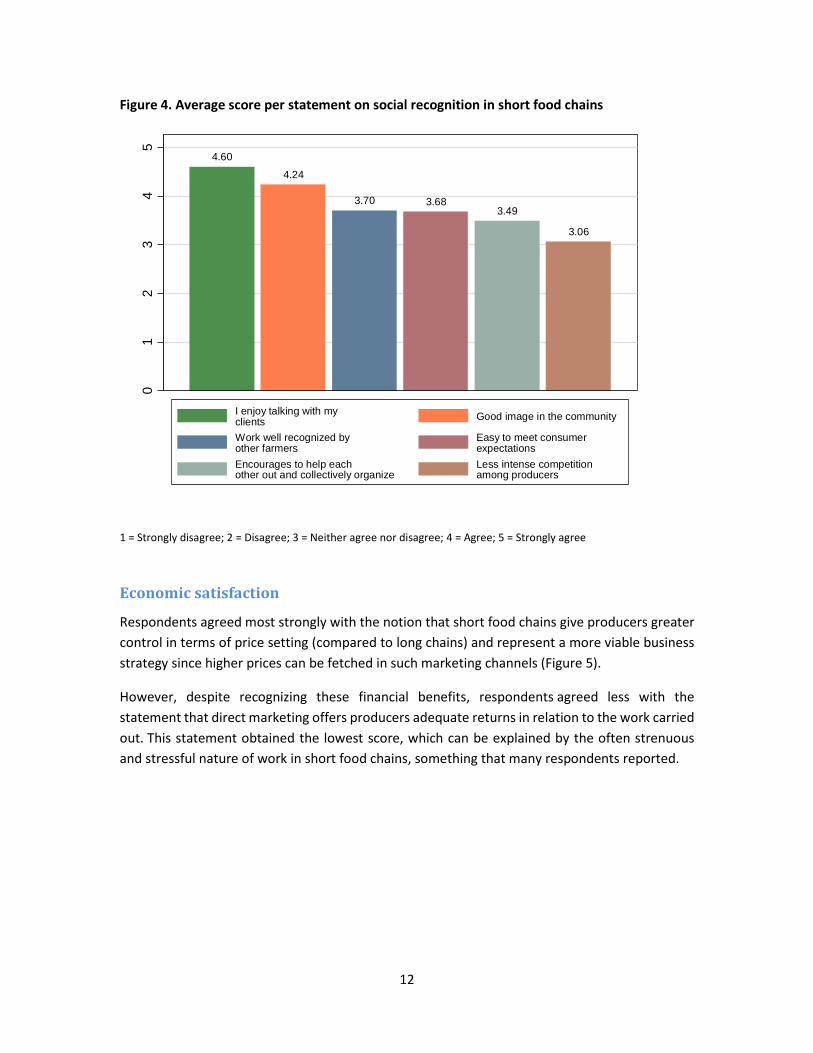
In terms of social recognition, respondents regarded the direct interactions with customers and community acknowledgment as being the most important benefits of short food chains (Figure 4).
The positive image associated with direct-market farmers is undoubtedly linked to the values they hold. For instance, ecological values are important for such producers, as we saw previously. Since consumers in short food chains often share these same values, participating farmers receive are socially recognized for their work, which gives them a sense of pride and accomplishment. However, competition between farmers does not disappear in short food chains, as evidenced by the average low score given for the question regarding levels of competitiveness in direct-marketing channels.
4.23 4.22 4.06
3.42
3.00
2.462.29
01
23
4
Task enjoyment Control over production and farming methods
Skills development Simplified management
Relatively less stressful Less physically demanding
Less time-consuming
12
Figure 4. Average score per statement on social recognition in short food chains
1 = Strongly disagree; 2 = Disagree; 3 = Neither agree nor disagree; 4 = Agree; 5 = Strongly agree
Economic satisfaction
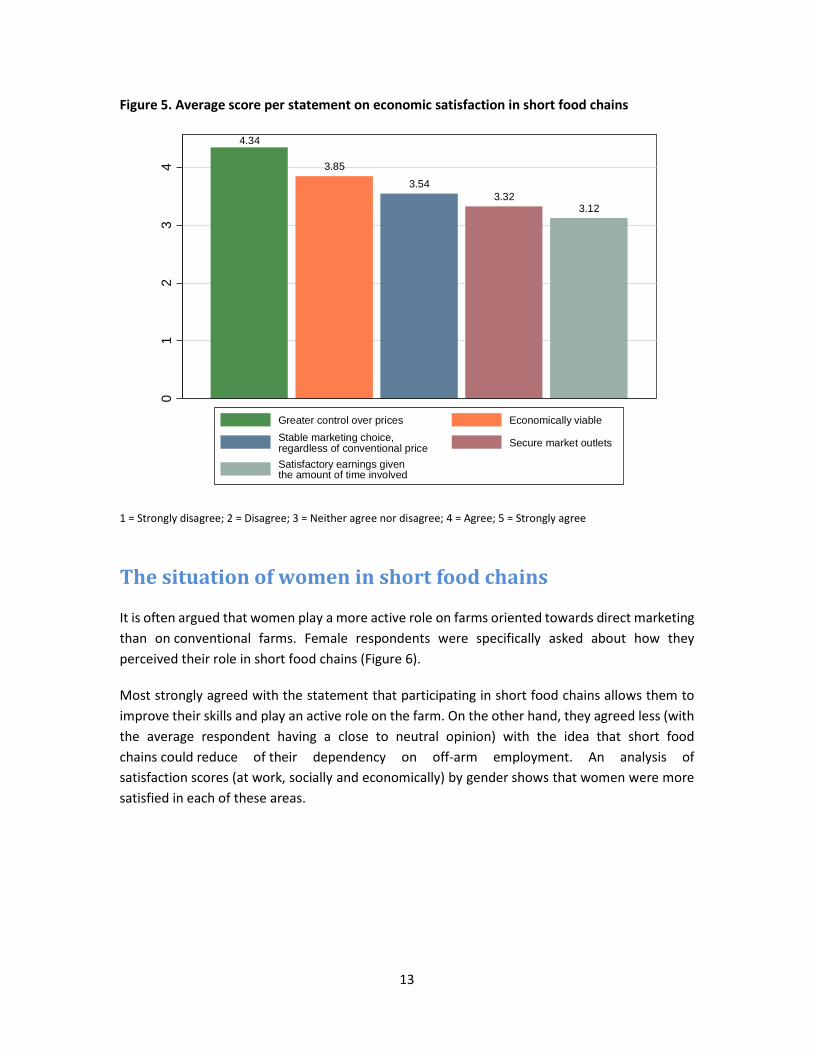
Respondents agreed most strongly with the notion that short food chains give producers greater control in terms of price setting (compared to long chains) and represent a more viable business strategy since higher prices can be fetched in such marketing channels (Figure 5).
However, despite recognizing these financial benefits, respondents agreed less with the statement that direct marketing offers producers adequate returns in relation to the work carried out. This statement obtained the lowest score, which can be explained by the often strenuous and stressful nature of work in short food chains, something that many respondents reported.
4.604.24
3.70 3.683.49
3.06
01
23
45
I enjoy talking with my clients Good image in the community
Work well recognized by other farmers
Easy to meet consumer expectations
Encourages to help each other out and collectively organize
Less intense competition among producers
13
Figure 5. Average score per statement on economic satisfaction in short food chains
1 = Strongly disagree; 2 = Disagree; 3 = Neither agree nor disagree; 4 = Agree; 5 = Strongly agree
The situation of women in short food chains
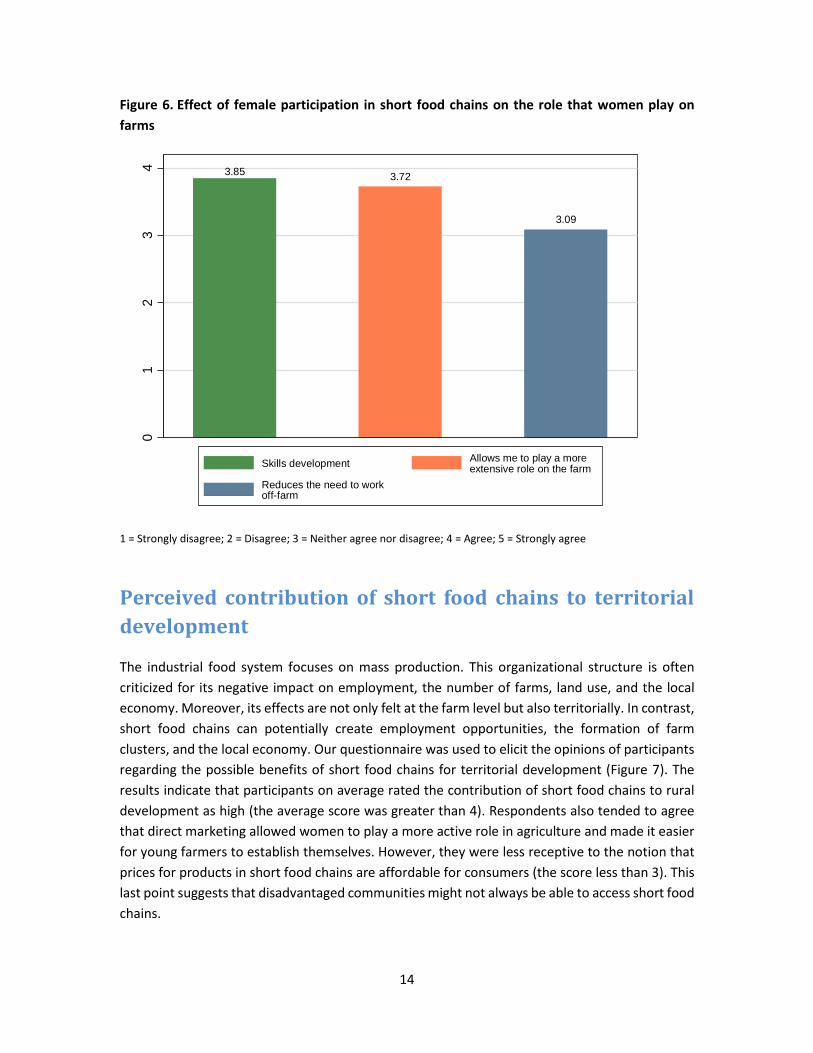
It is often argued that women play a more active role on farms oriented towards direct marketing than on conventional farms. Female respondents were specifically asked about how they perceived their role in short food chains (Figure 6).
Most strongly agreed with the statement that participating in short food chains allows them to improve their skills and play an active role on the farm. On the other hand, they agreed less (with the average respondent having a close to neutral opinion) with the idea that short food chains could reduce of their dependency on off-arm employment. An analysis of satisfaction scores (at work, socially and economically) by gender shows that women were more satisfied in each of these areas.
4.34
3.853.54
3.323.12
01
23
4
Greater control over prices Economically viableStable marketing choice,regardless of conventional price Secure market outlets
Satisfactory earnings giventhe amount of time involved
14
Figure 6. Effect of female participation in short food chains on the role that women play on farms
1 = Strongly disagree; 2 = Disagree; 3 = Neither agree nor disagree; 4 = Agree; 5 = Strongly agree
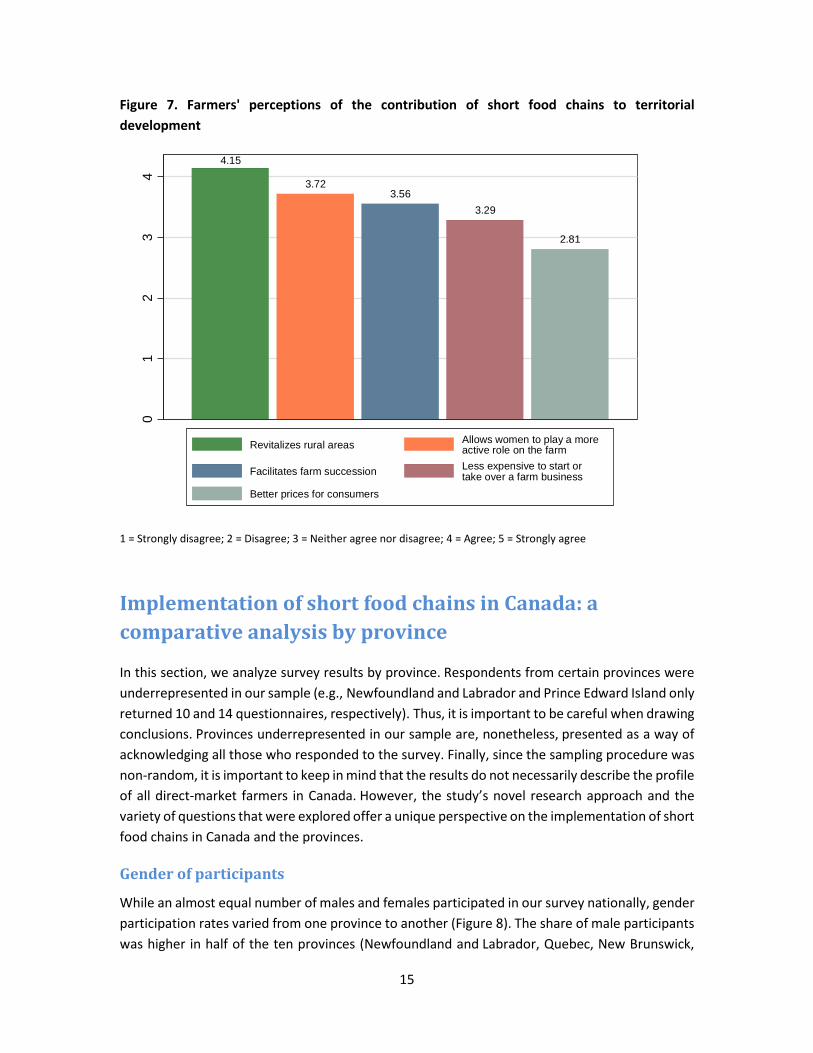
Perceived contribution of short food chains to territorial development
The industrial food system focuses on mass production. This organizational structure is often criticized for its negative impact on employment, the number of farms, land use, and the local economy. Moreover, its effects are not only felt at the farm level but also territorially. In contrast, short food chains can potentially create employment opportunities, the formation of farm clusters, and the local economy. Our questionnaire was used to elicit the opinions of participants regarding the possible benefits of short food chains for territorial development (Figure 7). The results indicate that participants on average rated the contribution of short food chains to rural development as high (the average score was greater than 4). Respondents also tended to agree that direct marketing allowed women to play a more active role in agriculture and made it easier for young farmers to establish themselves. However, they were less receptive to the notion that prices for products in short food chains are affordable for consumers (the score less than 3). This last point suggests that disadvantaged communities might not always be able to access short food chains.
3.85 3.72
3.09
01
23
4
Skills development Allows me to play a more extensive role on the farm
Reduces the need to work off-farm
15
Figure 7. Farmers' perceptions of the contribution of short food chains to territorial development
1 = Strongly disagree; 2 = Disagree; 3 = Neither agree nor disagree; 4 = Agree; 5 = Strongly agree
Implementation of short food chains in Canada: a comparative analysis by province
In this section, we analyze survey results by province. Respondents from certain provinces were underrepresented in our sample (e.g., Newfoundland and Labrador and Prince Edward Island only returned 10 and 14 questionnaires, respectively). Thus, it is important to be careful when drawing conclusions. Provinces underrepresented in our sample are, nonetheless, presented as a way of acknowledging all those who responded to the survey. Finally, since the sampling procedure was non-random, it is important to keep in mind that the results do not necessarily describe the profile of all direct-market farmers in Canada. However, the study’s novel research approach and the variety of questions that were explored offer a unique perspective on the implementation of short food chains in Canada and the provinces.
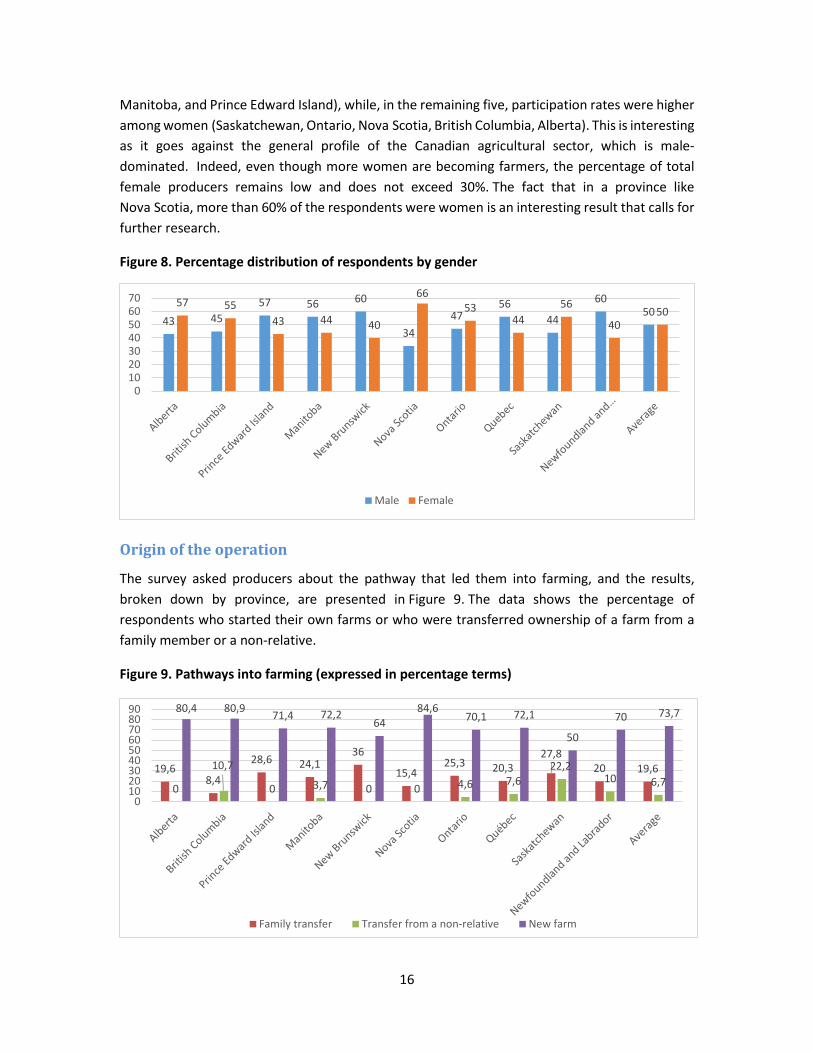
Gender of participants
While an almost equal number of males and females participated in our survey nationally, gender participation rates varied from one province to another (Figure 8). The share of male participants was higher in half of the ten provinces (Newfoundland and Labrador, Quebec, New Brunswick,
4.15
3.723.56
3.29
2.81
01
23
4
Revitalizes rural areas Allows women to play a more active role on the farm
Facilitates farm succession Less expensive to start or take over a farm business
Better prices for consumers
16
Manitoba, and Prince Edward Island), while, in the remaining five, participation rates were higher among women (Saskatchewan, Ontario, Nova Scotia, British Columbia, Alberta). This is interesting as it goes against the general profile of the Canadian agricultural sector, which is male-dominated. Indeed, even though more women are becoming farmers, the percentage of total female producers remains low and does not exceed 30%. The fact that in a province like Nova Scotia, more than 60% of the respondents were women is an interesting result that calls for further research.
Figure 8. Percentage distribution of respondents by gender
Origin of the operation
The survey asked producers about the pathway that led them into farming, and the results, broken down by province, are presented in Figure 9. The data shows the percentage of respondents who started their own farms or who were transferred ownership of a farm from a family member or a non-relative.
Figure 9. Pathways into farming (expressed in percentage terms)
43 4557 56 60
3447
5644
6050
57 5543 44 40
6653
4456
4050
010203040506070
Male Female
19,68,4
28,6 24,136
15,425,3 20,3
27,820 19,6
0
10,7
0 3,7 0 0 4,6 7,622,2
10 6,7
80,4 80,9 71,4 72,264
84,670,1 72,1
50
70 73,7
0102030405060708090
Family transfer Transfer from a non-relative New farm
17
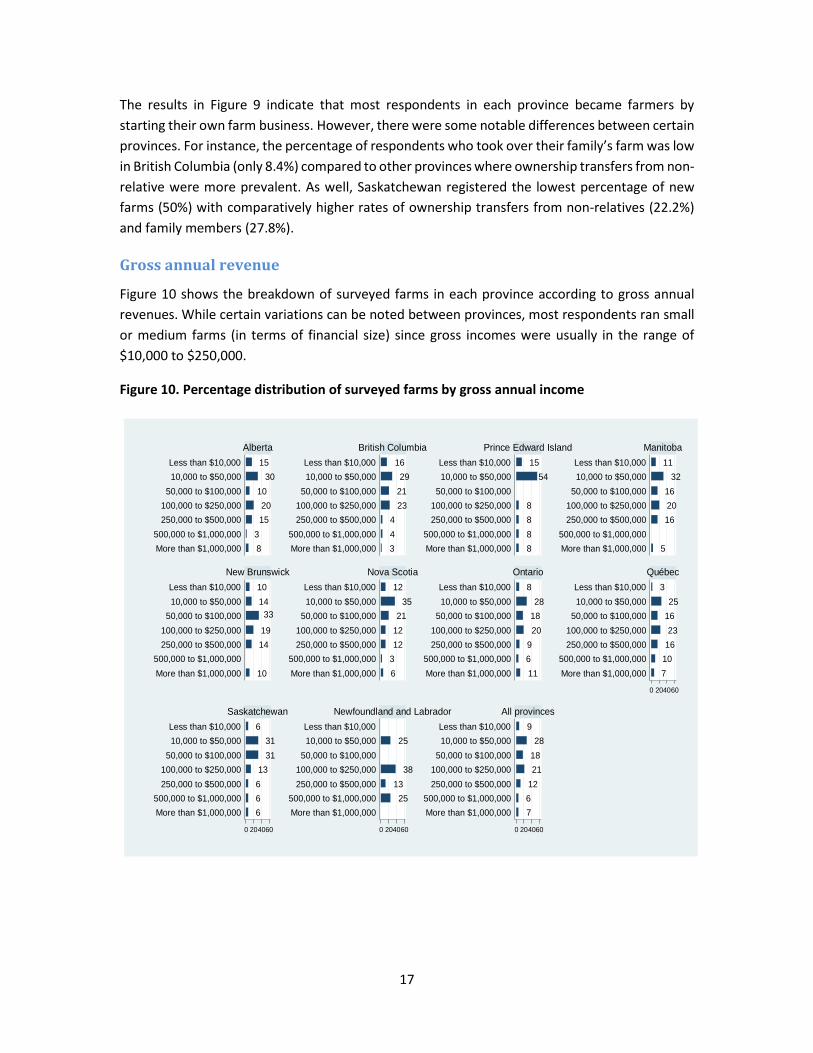
The results in Figure 9 indicate that most respondents in each province became farmers by starting their own farm business. However, there were some notable differences between certain provinces. For instance, the percentage of respondents who took over their family’s farm was low in British Columbia (only 8.4%) compared to other provinces where ownership transfers from non-relative were more prevalent. As well, Saskatchewan registered the lowest percentage of new farms (50%) with comparatively higher rates of ownership transfers from non-relatives (22.2%) and family members (27.8%).
Gross annual revenue
Figure 10 shows the breakdown of surveyed farms in each province according to gross annual revenues. While certain variations can be noted between provinces, most respondents ran small or medium farms (in terms of financial size) since gross incomes were usually in the range of $10,000 to $250,000.
Figure 10. Percentage distribution of surveyed farms by gross annual income
83
1520
1030
15
344
232129
16
8888
5415
5
162016
3211
10
1419
331410
63121221
3512
1169201828
8
7101623
1625
3
66613
3131
6
2513
38
25
7612211828
9
0 204060
0 204060 0 204060 0 204060
More than $1,000,000500,000 to $1,000,000
250,000 to $500,000100,000 to $250,000
50,000 to $100,00010,000 to $50,000Less than $10,000
More than $1,000,000500,000 to $1,000,000
250,000 to $500,000100,000 to $250,000
50,000 to $100,00010,000 to $50,000Less than $10,000
More than $1,000,000500,000 to $1,000,000
250,000 to $500,000100,000 to $250,000
50,000 to $100,00010,000 to $50,000Less than $10,000
More than $1,000,000500,000 to $1,000,000
250,000 to $500,000100,000 to $250,000
50,000 to $100,00010,000 to $50,000Less than $10,000
More than $1,000,000500,000 to $1,000,000
250,000 to $500,000100,000 to $250,000
50,000 to $100,00010,000 to $50,000Less than $10,000
More than $1,000,000500,000 to $1,000,000
250,000 to $500,000100,000 to $250,000
50,000 to $100,00010,000 to $50,000Less than $10,000
More than $1,000,000500,000 to $1,000,000
250,000 to $500,000100,000 to $250,000
50,000 to $100,00010,000 to $50,000Less than $10,000
More than $1,000,000500,000 to $1,000,000
250,000 to $500,000100,000 to $250,000
50,000 to $100,00010,000 to $50,000Less than $10,000
More than $1,000,000500,000 to $1,000,000
250,000 to $500,000100,000 to $250,000
50,000 to $100,00010,000 to $50,000Less than $10,000
More than $1,000,000500,000 to $1,000,000
250,000 to $500,000100,000 to $250,000
50,000 to $100,00010,000 to $50,000Less than $10,000
More than $1,000,000500,000 to $1,000,000
250,000 to $500,000100,000 to $250,000
50,000 to $100,00010,000 to $50,000Less than $10,000
Alberta British Columbia Prince Edward Island Manitoba
New Brunswick Nova Scotia Ontario Québec
Saskatchewan Newfoundland and Labrador All provinces
18
Net annual revenue
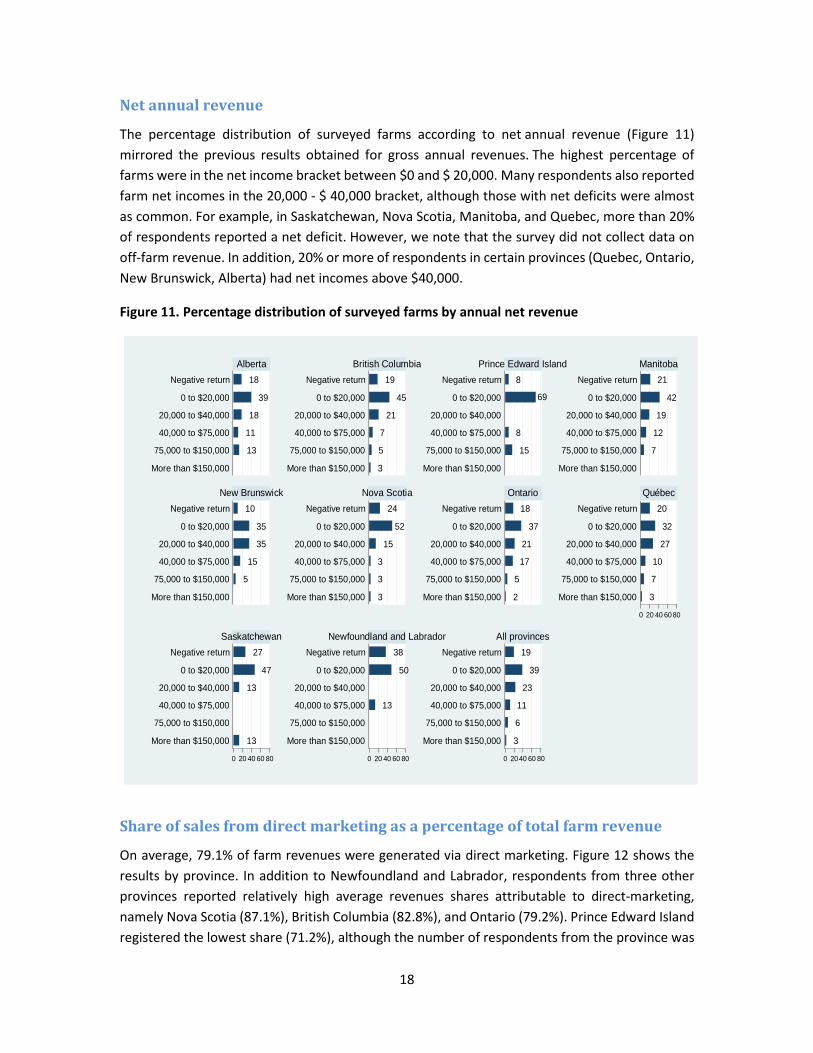
The percentage distribution of surveyed farms according to net annual revenue (Figure 11) mirrored the previous results obtained for gross annual revenues. The highest percentage of farms were in the net income bracket between $0 and $ 20,000. Many respondents also reported farm net incomes in the 20,000 - $ 40,000 bracket, although those with net deficits were almost as common. For example, in Saskatchewan, Nova Scotia, Manitoba, and Quebec, more than 20% of respondents reported a net deficit. However, we note that the survey did not collect data on off-farm revenue. In addition, 20% or more of respondents in certain provinces (Quebec, Ontario, New Brunswick, Alberta) had net incomes above $40,000.
Figure 11. Percentage distribution of surveyed farms by annual net revenue
Share of sales from direct marketing as a percentage of total farm revenue
On average, 79.1% of farm revenues were generated via direct marketing. Figure 12 shows the results by province. In addition to Newfoundland and Labrador, respondents from three other provinces reported relatively high average revenues shares attributable to direct-marketing, namely Nova Scotia (87.1%), British Columbia (82.8%), and Ontario (79.2%). Prince Edward Island registered the lowest share (71.2%), although the number of respondents from the province was
13
11
18
39
18
3
5
7
21
45
19
15
8
69
8
7
12
19
42
21
5
15
35
35
10
3
3
3
15
52
24
2
5
17
21
37
18
3
7
10
27
32
20
13
13
47
27
13
50
38
3
6
11
23
39
19
0 20 40 60 80
0 20 40 60 80 0 20 40 60 80 0 20 40 60 80
More than $150,000
75,000 to $150,000
40,000 to $75,000
20,000 to $40,000
0 to $20,000
Negative return
More than $150,000
75,000 to $150,000
40,000 to $75,000
20,000 to $40,000
0 to $20,000
Negative return
More than $150,000
75,000 to $150,000
40,000 to $75,000
20,000 to $40,000
0 to $20,000
Negative return
More than $150,000
75,000 to $150,000
40,000 to $75,000
20,000 to $40,000
0 to $20,000
Negative return
More than $150,000
75,000 to $150,000
40,000 to $75,000
20,000 to $40,000
0 to $20,000
Negative return
More than $150,000
75,000 to $150,000
40,000 to $75,000
20,000 to $40,000
0 to $20,000
Negative return
More than $150,000
75,000 to $150,000
40,000 to $75,000
20,000 to $40,000
0 to $20,000
Negative return
More than $150,000
75,000 to $150,000
40,000 to $75,000
20,000 to $40,000
0 to $20,000
Negative return
More than $150,000
75,000 to $150,000
40,000 to $75,000
20,000 to $40,000
0 to $20,000
Negative return
More than $150,000
75,000 to $150,000
40,000 to $75,000
20,000 to $40,000
0 to $20,000
Negative return
More than $150,000
75,000 to $150,000
40,000 to $75,000
20,000 to $40,000
0 to $20,000
Negative return
Alberta British Columbia Prince Edward Island Manitoba
New Brunswick Nova Scotia Ontario Québec
Saskatchewan Newfoundland and Labrador All provinces
19
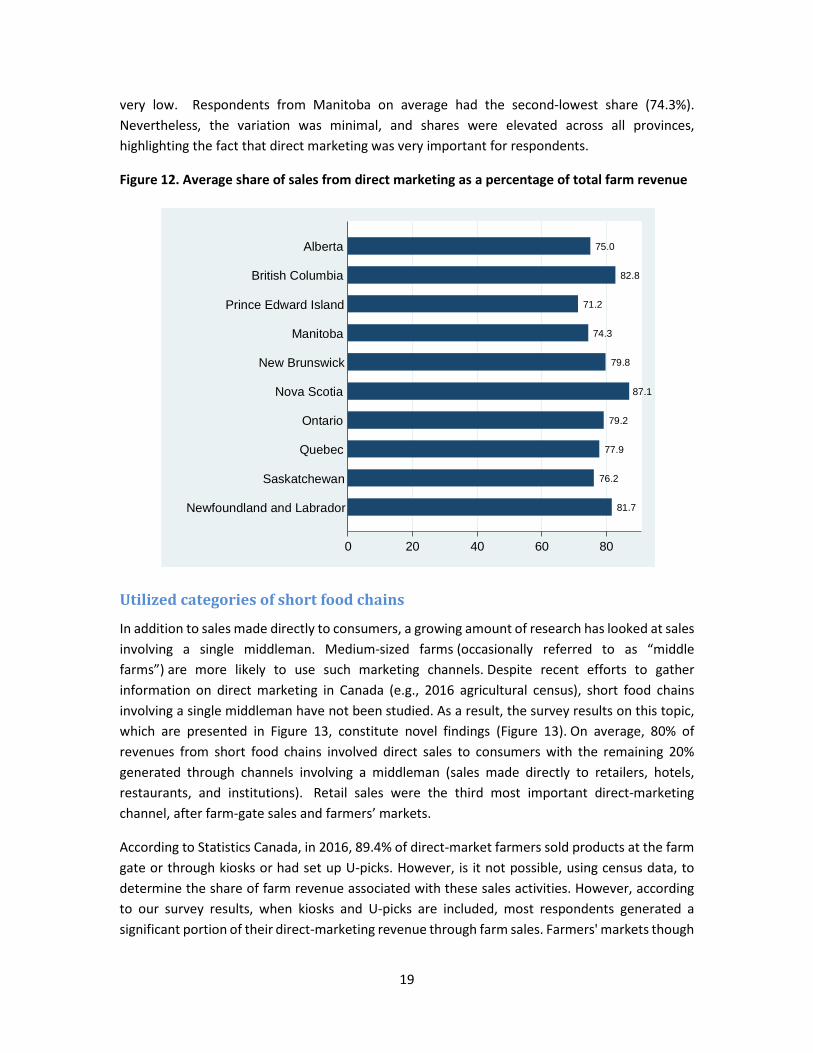
very low. Respondents from Manitoba on average had the second-lowest share (74.3%). Nevertheless, the variation was minimal, and shares were elevated across all provinces, highlighting the fact that direct marketing was very important for respondents.
Figure 12. Average share of sales from direct marketing as a percentage of total farm revenue
Utilized categories of short food chains
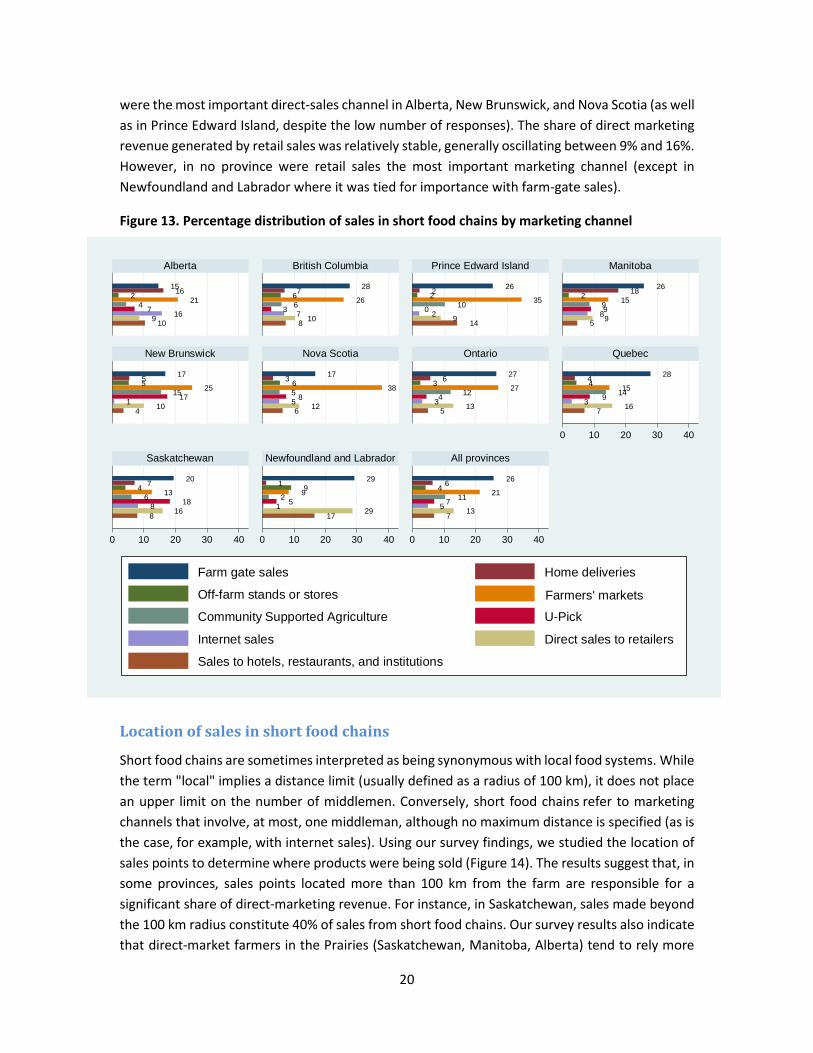
In addition to sales made directly to consumers, a growing amount of research has looked at sales involving a single middleman. Medium-sized farms (occasionally referred to as “middle farms”) are more likely to use such marketing channels. Despite recent efforts to gather information on direct marketing in Canada (e.g., 2016 agricultural census), short food chains involving a single middleman have not been studied. As a result, the survey results on this topic, which are presented in Figure 13, constitute novel findings (Figure 13). On average, 80% of revenues from short food chains involved direct sales to consumers with the remaining 20% generated through channels involving a middleman (sales made directly to retailers, hotels, restaurants, and institutions). Retail sales were the third most important direct-marketing channel, after farm-gate sales and farmers’ markets.
According to Statistics Canada, in 2016, 89.4% of direct-market farmers sold products at the farm gate or through kiosks or had set up U-picks. However, is it not possible, using census data, to determine the share of farm revenue associated with these sales activities. However, according to our survey results, when kiosks and U-picks are included, most respondents generated a significant portion of their direct-marketing revenue through farm sales. Farmers' markets though
81.7
76.2
77.9
79.2
87.1
79.8
74.3
71.2
82.8
75.0
0 20 40 60 80
Newfoundland and Labrador
Saskatchewan
Quebec
Ontario
Nova Scotia
New Brunswick
Manitoba
Prince Edward Island
British Columbia
Alberta
20
were the most important direct-sales channel in Alberta, New Brunswick, and Nova Scotia (as well as in Prince Edward Island, despite the low number of responses). The share of direct marketing revenue generated by retail sales was relatively stable, generally oscillating between 9% and 16%. However, in no province were retail sales the most important marketing channel (except in Newfoundland and Labrador where it was tied for importance with farm-gate sales).
Figure 13. Percentage distribution of sales in short food chains by marketing channel
Location of sales in short food chains
Short food chains are sometimes interpreted as being synonymous with local food systems. While the term "local" implies a distance limit (usually defined as a radius of 100 km), it does not place an upper limit on the number of middlemen. Conversely, short food chains refer to marketing channels that involve, at most, one middleman, although no maximum distance is specified (as is the case, for example, with internet sales). Using our survey findings, we studied the location of sales points to determine where products were being sold (Figure 14). The results suggest that, in some provinces, sales points located more than 100 km from the farm are responsible for a significant share of direct-marketing revenue. For instance, in Saskatchewan, sales made beyond the 100 km radius constitute 40% of sales from short food chains. Our survey results also indicate that direct-market farmers in the Prairies (Saskatchewan, Manitoba, Alberta) tend to rely more
109 1674 212 1615
8 1073 6 2667 28
14920 10 352226
5 9899152 18 26
4 101 1715 255517
6 125 85 3863 17
5 1334 12 273 6 27
7 163 9 14154428
8 168 186 134 7 20
17 291 52 991 29
7 135 7 11 214 6 26
0 10 20 30 40
0 10 20 30 40 0 10 20 30 40 0 10 20 30 40
Alberta British Columbia Prince Edward Island Manitoba
New Brunswick Nova Scotia Ontario Quebec
Saskatchewan Newfoundland and Labrador All provinces
Farm gate sales Home deliveries
Off-farm stands or stores Farmers' marketsCommunity Supported Agriculture U-Pick
Internet sales Direct sales to retailers
Sales to hotels, restaurants, and institutions
21
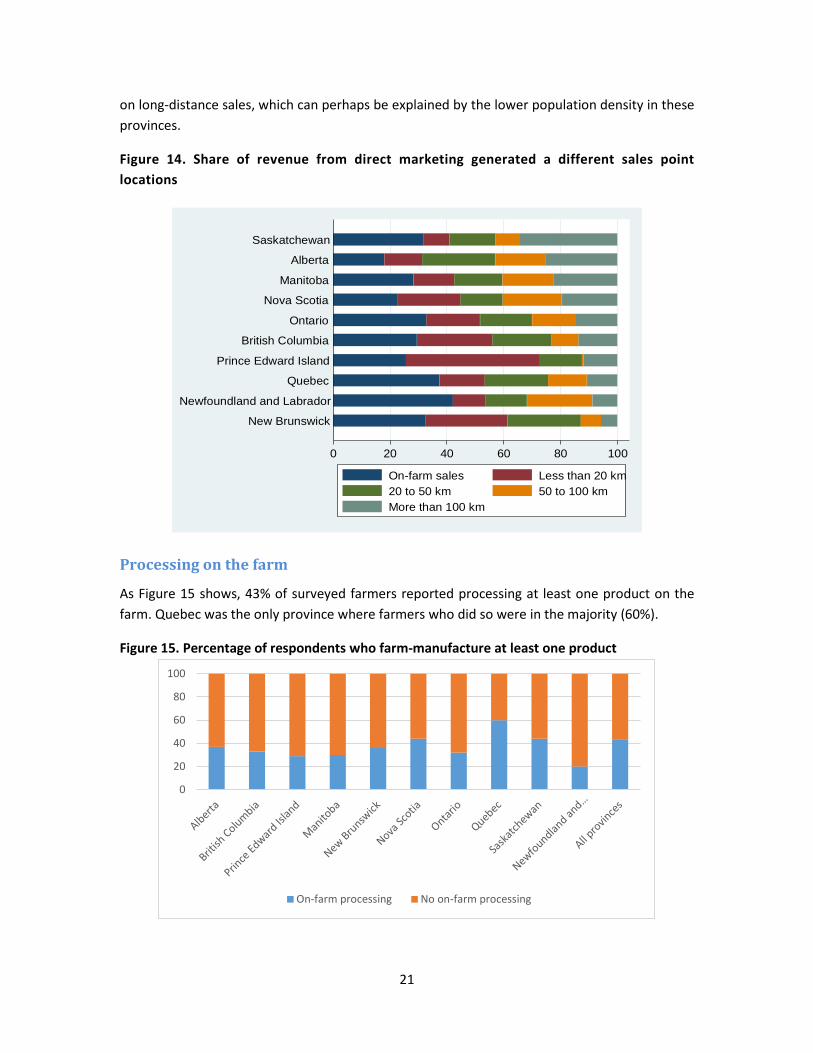
on long-distance sales, which can perhaps be explained by the lower population density in these provinces.
Figure 14. Share of revenue from direct marketing generated a different sales point locations
Processing on the farm
As Figure 15 shows, 43% of surveyed farmers reported processing at least one product on the farm. Quebec was the only province where farmers who did so were in the majority (60%).
Figure 15. Percentage of respondents who farm-manufacture at least one product
0 20 40 60 80 100
New Brunswick
Newfoundland and Labrador
Quebec
Prince Edward Island
British Columbia
Ontario
Nova Scotia
Manitoba
Alberta
Saskatchewan
On-farm sales Less than 20 km20 to 50 km 50 to 100 kmMore than 100 km
0
20
40
60
80
100
On-farm processing No on-farm processing
22
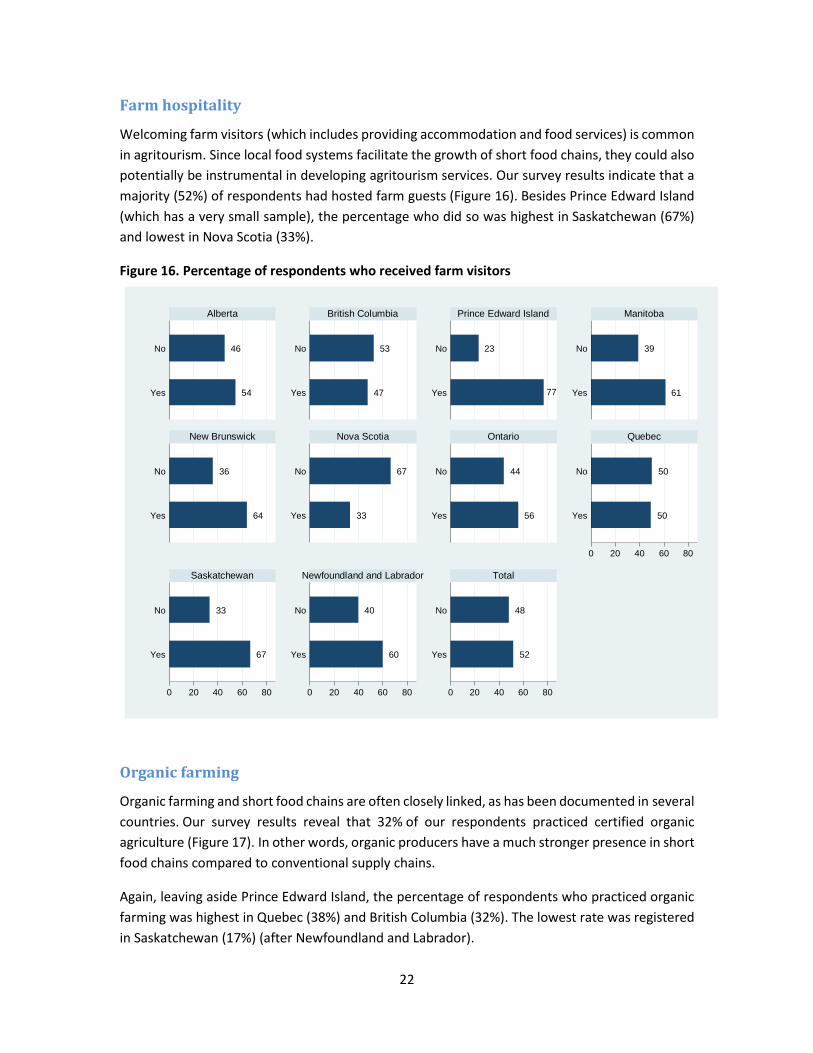
Farm hospitality
Welcoming farm visitors (which includes providing accommodation and food services) is common in agritourism. Since local food systems facilitate the growth of short food chains, they could also potentially be instrumental in developing agritourism services. Our survey results indicate that a majority (52%) of respondents had hosted farm guests (Figure 16). Besides Prince Edward Island (which has a very small sample), the percentage who did so was highest in Saskatchewan (67%) and lowest in Nova Scotia (33%).
Figure 16. Percentage of respondents who received farm visitors
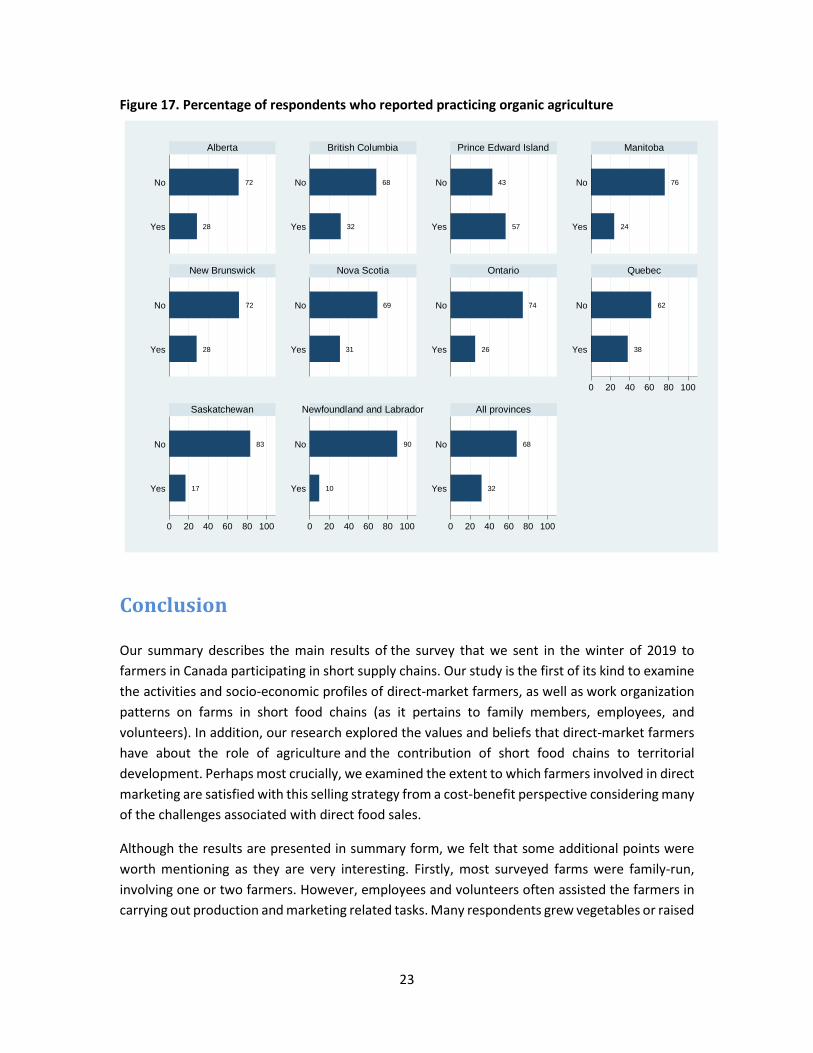
Organic farming
Organic farming and short food chains are often closely linked, as has been documented in several countries. Our survey results reveal that 32% of our respondents practiced certified organic agriculture (Figure 17). In other words, organic producers have a much stronger presence in short food chains compared to conventional supply chains.
Again, leaving aside Prince Edward Island, the percentage of respondents who practiced organic farming was highest in Quebec (38%) and British Columbia (32%). The lowest rate was registered in Saskatchewan (17%) (after Newfoundland and Labrador).
54
46
47
53
77
23
61
39
64
36
33
67
56
44
50
50
67
33
60
40
52
48
0 20 40 60 80
0 20 40 60 80 0 20 40 60 80 0 20 40 60 80
Yes
No
Yes
No
Yes
No
Yes
No
Yes
No
Yes
No
Yes
No
Yes
No
Yes
No
Yes
No
Yes
No
Alberta British Columbia Prince Edward Island Manitoba
New Brunswick Nova Scotia Ontario Quebec
Saskatchewan Newfoundland and Labrador Total
23
Figure 17. Percentage of respondents who reported practicing organic agriculture
Conclusion Our summary describes the main results of the survey that we sent in the winter of 2019 to farmers in Canada participating in short supply chains. Our study is the first of its kind to examine the activities and socio-economic profiles of direct-market farmers, as well as work organization patterns on farms in short food chains (as it pertains to family members, employees, and volunteers). In addition, our research explored the values and beliefs that direct-market farmers have about the role of agriculture and the contribution of short food chains to territorial development. Perhaps most crucially, we examined the extent to which farmers involved in direct marketing are satisfied with this selling strategy from a cost-benefit perspective considering many of the challenges associated with direct food sales.
Although the results are presented in summary form, we felt that some additional points were worth mentioning as they are very interesting. Firstly, most surveyed farms were family-run, involving one or two farmers. However, employees and volunteers often assisted the farmers in carrying out production and marketing related tasks. Many respondents grew vegetables or raised
28
72
32
68
57
43
24
76
28
72
31
69
26
74
38
62
17
83
10
90
32
68
0 20 40 60 80 100
0 20 40 60 80 100 0 20 40 60 80 100 0 20 40 60 80 100
Yes
No
Yes
No
Yes
No
Yes
No
Yes
No
Yes
No
Yes
No
Yes
No
Yes
No
Yes
No
Yes
No
Alberta British Columbia Prince Edward Island Manitoba
New Brunswick Nova Scotia Ontario Quebec
Saskatchewan Newfoundland and Labrador All provinces
24
poultry (especially hens and chickens). However, few of them exclusively produced livestock or poultry products.
The high percentage of women in our sample echoes previous findings regarding the important role of female producers in short food chains. In addition, we note that respondents had relatively high levels of educational attainment and that many of them had started their own farm business, which suggests that short food chains are attracting new entrants into agriculture via non-traditional pathways.
Respondents generally associated direct marketing with a wide range of benefits (in terms of work enjoyment, social recognition, and economic satisfaction). However, they also tended to agree that working in short food supply chains was stressful, arduous, and time-consuming. The most important benefit from short food chains, according to respondents, was social recognition. As for economic satisfaction, respondents generally believed that short food chains enabled them to be less dependent on price fluctuations and contributed to the economic viability of their farms. On the other hand, they were less satisfied with the revenue levels associated with direct marketing, which confirms the findings of previous studies, namely that farmers selling through short food channels are forced to take on a great deal of work and activities. Finally, respondents generally agreed that direct marketing contributes to territorial development although they also believed that prices in short food chains were not always affordable for consumers.
In addition to emphasizing the importance of customer satisfaction and taking pleasure in one’s work, respondents believed strongly in ecological values, which correlates with the over-representation of farmers in our sample who practiced organic agriculture. These beliefs underpin a vision of agriculture that emphasizes both its ecological and nourishing function (while downplaying its role in exports).
Finally, our survey results, while sometimes similar across provinces, could also vary, which raises several questions. For instance, what explains these differences? Can they be attributed to the unique agricultural history of each province? Are there provinces that share a similar profile? These questions will be explored in another part of our research project, which will make further comparisons to better understand the reality of short food chains in Canada.


