LABORATORY OF APPLIED THERMODYNAMICS ARISTOTLE UNIVERSITY THESSALONIKI SCHOOL OF ENGINEERING DEPT. OF MECHANICAL ENGINEERING 1 Zissis Samaras and Leonidas Ntziachristos Outline of the Correlation Exercise Input to the meeting of September 18, 2013
Transcript
LABORATORY OF APPLIED THERMODYNAMICS
ARISTOTLE UNIVERSITY THESSALONIKI
SCHOOL OF ENGINEERING
DEPT. OF MECHANICAL ENGINEERING
1
Zissis Samaras and Leonidas Ntziachristos
Outline of the Correlation Exercise
Input to the meeting of September 18, 2013
Main Work Packages
2
Inception phase – Set-up of the measurement and simulation schedule
Vehicle simulations
New testing to cover missing segments
Focus on future technology vehicles - PHEVs and/or range extenders
Management, reporting and participation to meetings
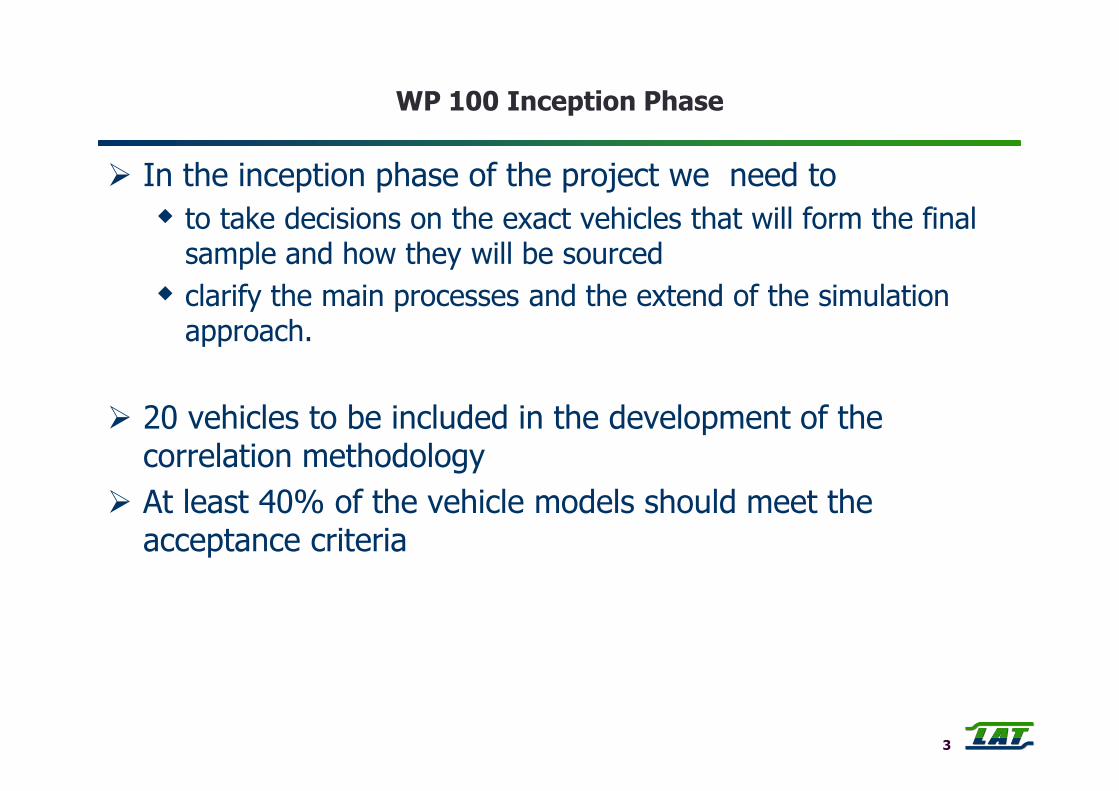
WP 100 Inception Phase
� In the inception phase of the project we need to
� to take decisions on the exact vehicles that will form the final sample and how they will be sourced
� clarify the main processes and the extend of the simulation approach.
� 20 vehicles to be included in the development of the correlation methodology
� At least 40% of the vehicle models should meet the acceptance criteria
3
Summary of vehicles to be tested
4
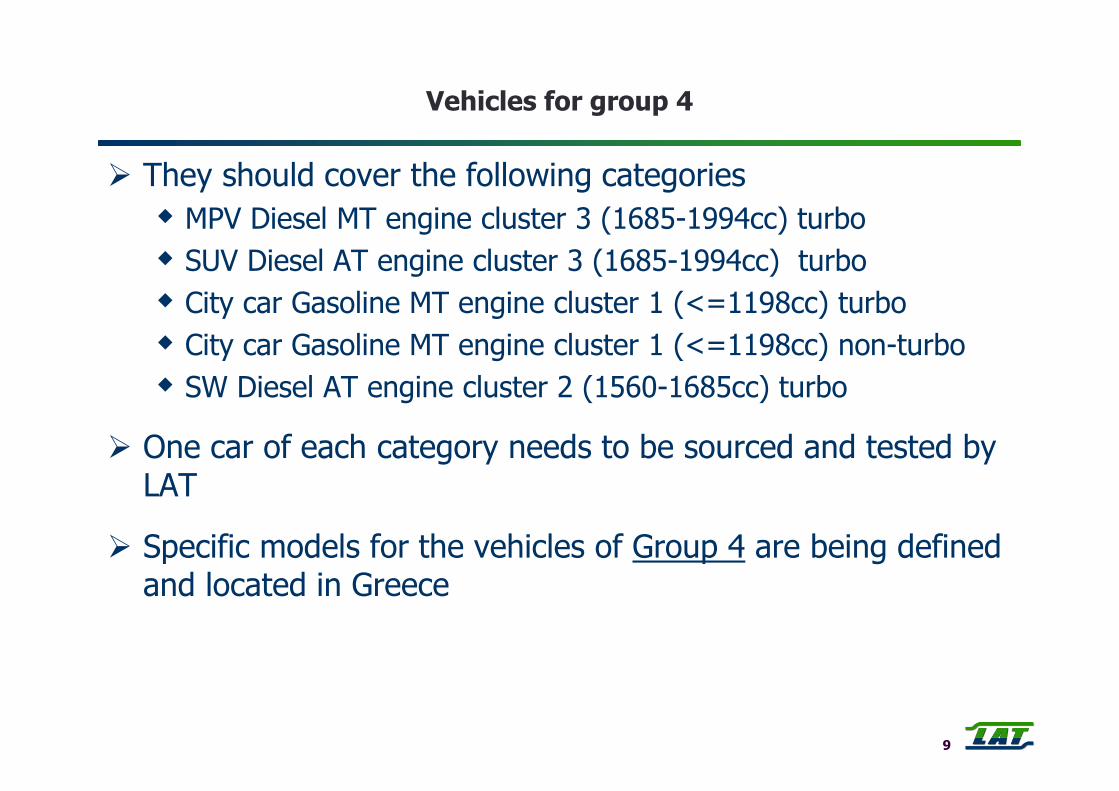
� Categorised in the following groups:
� Group 1: 6 vehicle models (calibrated and validated) available at LAT
� Group 2: 6 vehicle models provided by AVL
� Group 3: 3 vehicle models provided by JRC
� Group 4: 5 vehicles to be tested and simulated by LAT
Vehicles already available at LAT
# VehicleSegment
Fuel/Ele
c
Trans-mission
Hybrid-ization
Curb weight
[kg]
Displa-cement
[cc]
Max Power [PS@rpm]
Max torque [Nm@rpm]
Type approval FC [l/100 km]
1Alfa Romeo Mito 1.4 Turbo S&S (manual
transmission)C G MT (5) - 1135 1368
135 @ 5000
206 @ 1750
5.6
2Alfa Romeo Mito 1.4
Turbo S&S (TCT)C G DCT - 1170 1368
135 @ 5000
230 @ 1750 5.5
3BMW X1 sDrive20d efficient dynamics
J D MT (6)Micro HEV
1465 1995163 @ 4000
380 @ 1750
4.5
4Peugeot 308 1.6e-
HDi FAP 112C D MT (6) - 1318 1560
112 @ 3600
270 @ 1750
4.2
5 Toyota Auris HSD C G e-CVT Full HEV 1380 1798136 @ 5200
142 @ 4000
3.8
6 Toyota Avensis 1.6 C G MT (5) - 1423 1598128 @ 6400
160 @ 4400 6.6
7VW Golf 1.4 TSi 90
kWC G MT (6) - 1416 1390
120 @ 5000
200 @ 1500
6.5
8Toyota Prius PHEV
(2010)C G/E e-CVT PHEV 1390 1800
99 @ 5200
142 @ 2800
2.1
5
Vehicles for which simulation models are already available at AVL
# Vehicle Segment FuelTrans-
missionHybrid-ization
Hybrid Topology
Curb weight [kg]
9 Nissan Pathfinder 3.0L CVT J G m-CVT - - 2185
10 Mitsubishi i MiEV A E - EV - 1080
11 Audi A1 etron B G - REX - 1190
12 Volvo S60 D5 D D AMT - - 1490
13 AUDI A6 3.0 TFSI quattro E G DCT - - 1715
14Mercedes Benz S 400
HYBRIDF G AT Mild hybrid - 2100
15 Toyota Prius III C G e-CVT Full HEV Power Split 1380
16SMART Fortwo coupe 52
kW mhdA G AMT - - 750
17 Honda Civic Hybrid C G m-CVT Full HEV Parallel 1260
18 Fisker Karma E G - REX Serial 2400
19 BMW 116i C G MT - - 1385
20 Volvo C30 T5 C G AT - - 1450
21 Audi A3 1.4 TFSi C G MT - - 1175
6
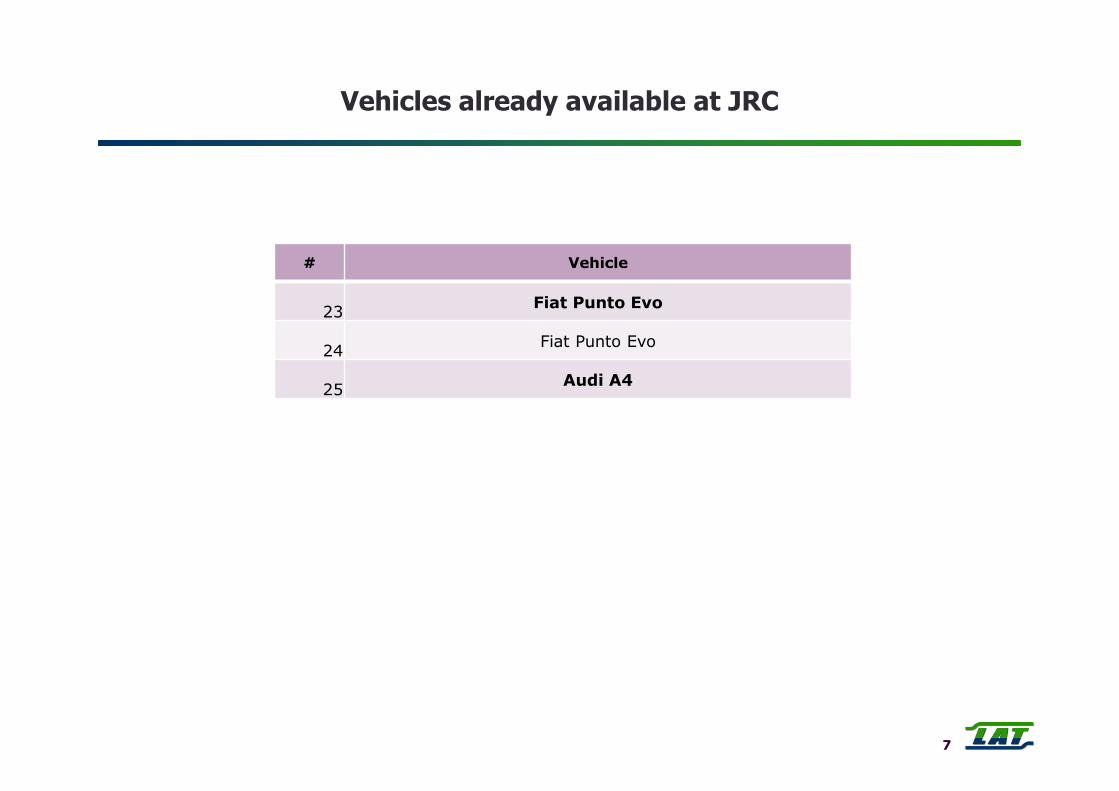
Vehicles already available at JRC
# Vehicle
23Fiat Punto Evo
24Fiat Punto Evo
25Audi A4
7
Vehicle sample composition
Source Vehicles Status Sample Category
Number of vehicles
Group 1
Provided by LAT
Table 1: #1, #4, #5, #7
Artemis Urban, Road, NEDC, simulation models under
developmentN 4
Table 1: #3, #8*Artemis Urban, Road, NEDC,
WLTC. Simulation models completed
N 2
Group 2
Provided by AVL
Table 2: #12, #13, #14, #16, #20,
#21
No driving cycles, simulation models completed N 6
Group 4
New vehicle tests by LAT
To be decided in the inception
phase
NEDC, WLTC, Artemis Urban, Artemis Road, other cycles
decided in the inception phaseS 5
Group 3
Provided by OEMs or the JRC
To be decided in the inception
phase
NEDC, WLTC, Calibration and Validation cycles as a
DriverStandard Cruise DriverShift Procedure (Acceleration and Clutch Pedal and Shifting Time)Pedal Map
Hybrid Strategy ControlBasic control strategy architectureBlack Box DLL built in Matlab & Simulink 12
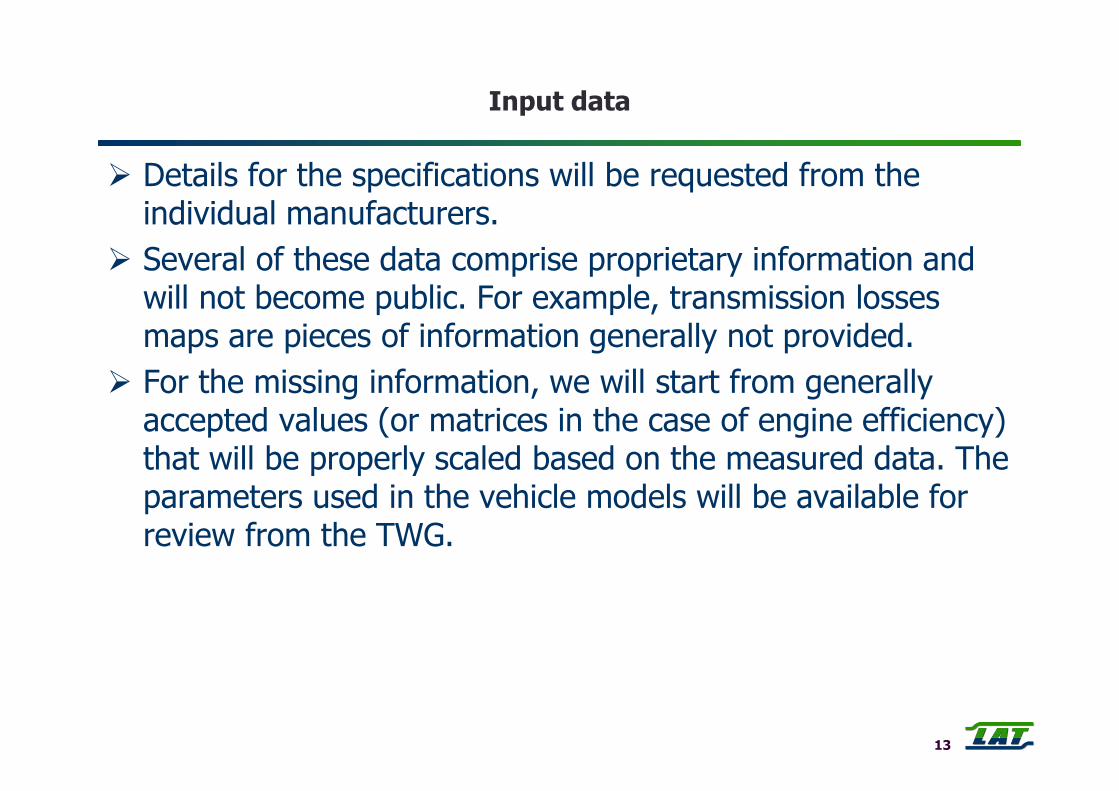
Input data
� Details for the specifications will be requested from the individual manufacturers.
� Several of these data comprise proprietary information and will not become public. For example, transmission losses maps are pieces of information generally not provided.
� For the missing information, we will start from generally accepted values (or matrices in the case of engine efficiency) that will be properly scaled based on the measured data. The parameters used in the vehicle models will be available for review from the TWG.
13
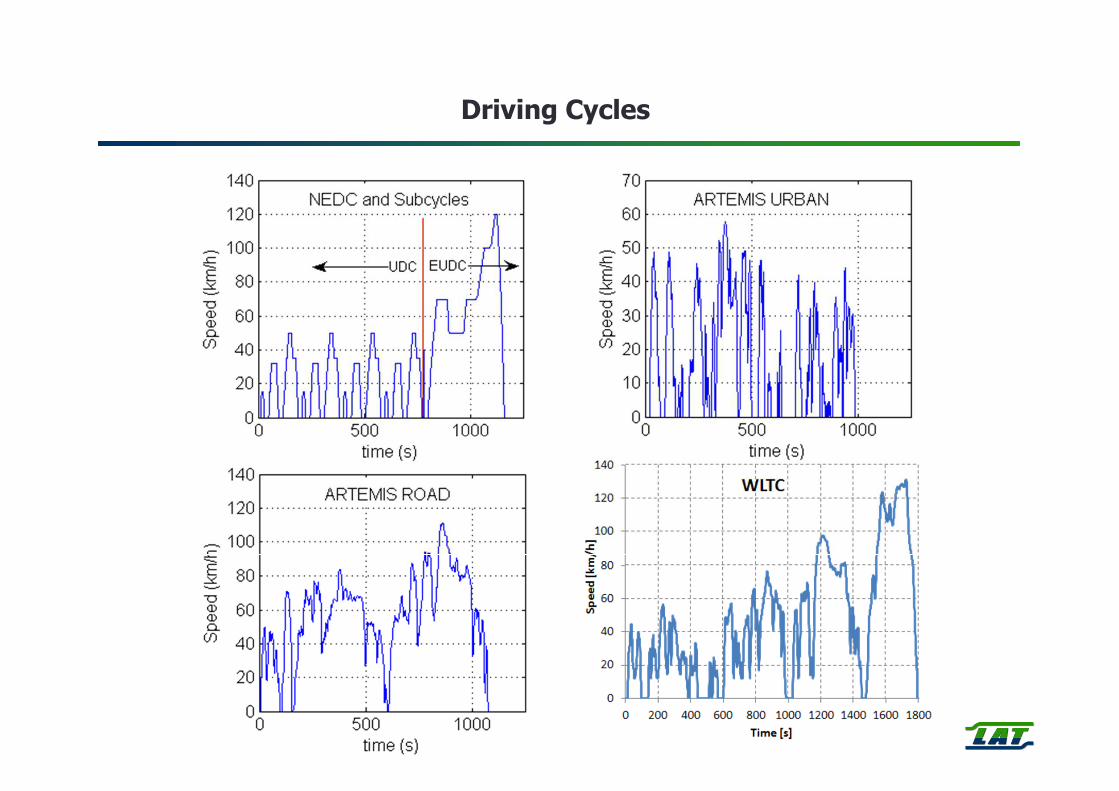
Driving Cycles
15
Driving Cycles
ERMES Cycle
JC08 Cycle
Calibration and Validation
� We will present with a couple of exemplary cases what are the possibilities when using alternative approaches for the calibration and the validation driving cycles.
� We consider that some mix of a cold-start and a hot-start cycle is required for calibrating the model.
� For example, the Artemis Urban and cold start NEDC could be used for calibration and then the Artemis Road could be used for the validation.
16
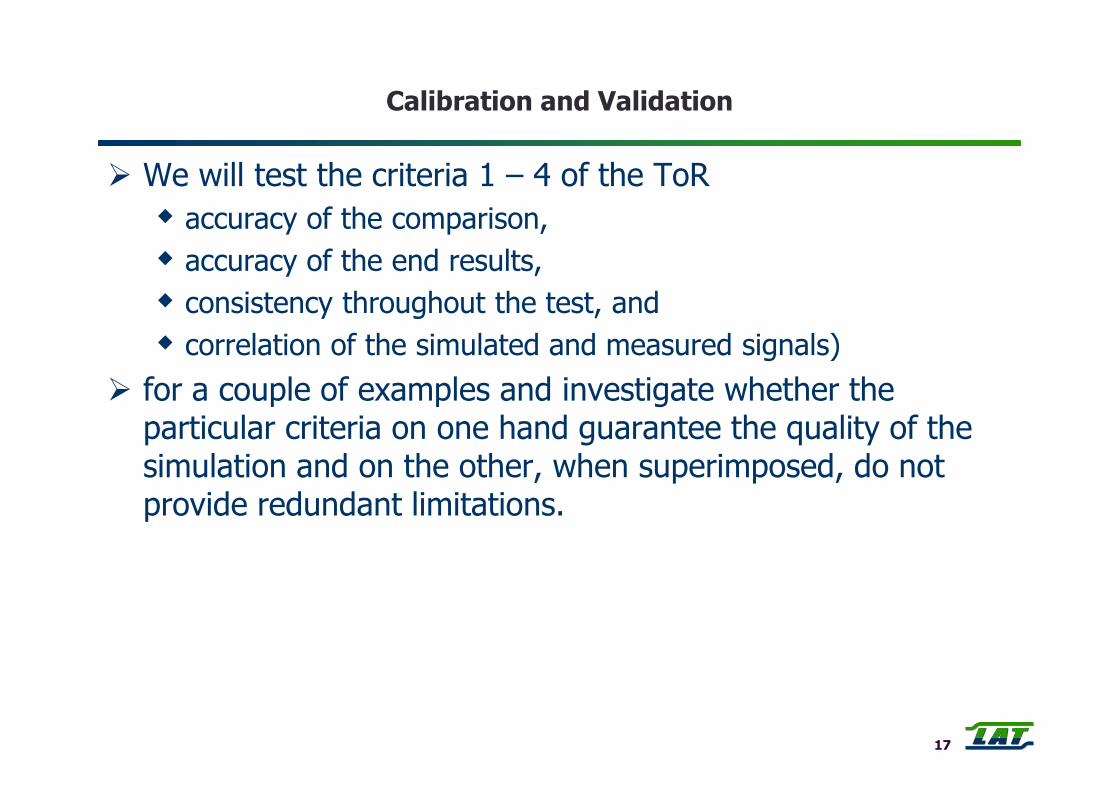
Calibration and Validation
� We will test the criteria 1 – 4 of the ToR
� accuracy of the comparison,
� accuracy of the end results,
� consistency throughout the test, and
� correlation of the simulated and measured signals)
� for a couple of examples and investigate whether the particular criteria on one hand guarantee the quality of the simulation and on the other, when superimposed, do not provide redundant limitations.
17
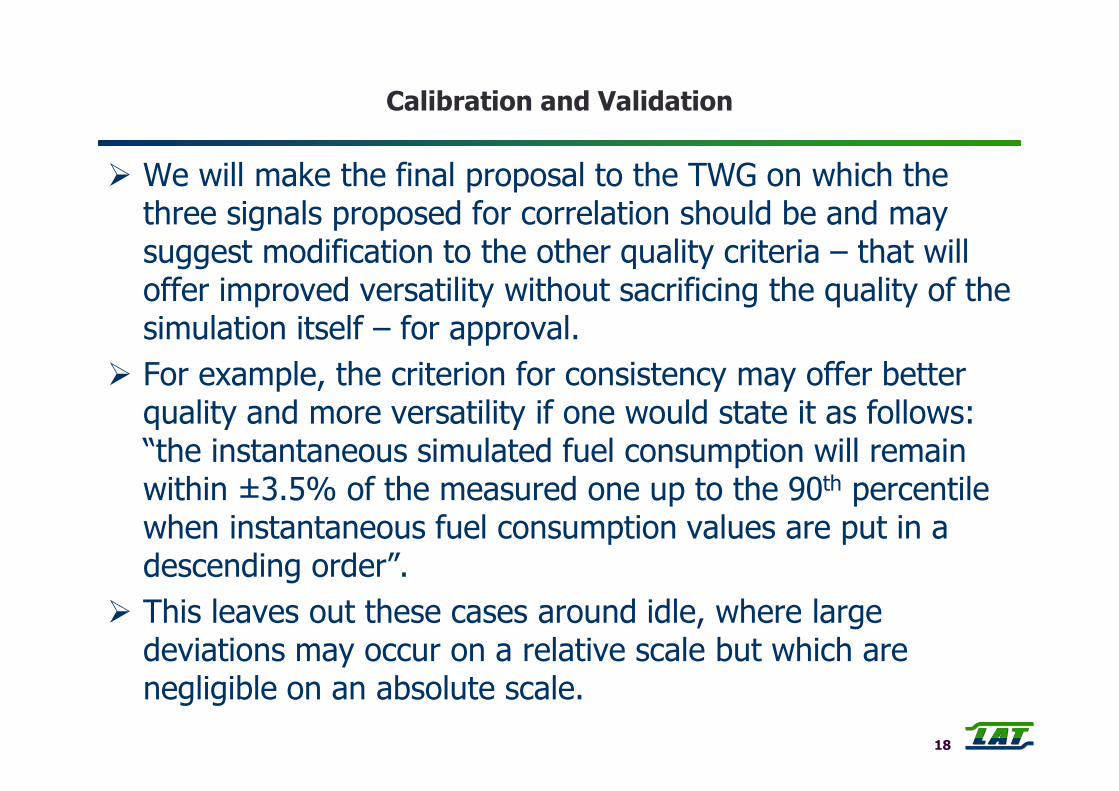
Calibration and Validation
� We will make the final proposal to the TWG on which the three signals proposed for correlation should be and may suggest modification to the other quality criteria – that will offer improved versatility without sacrificing the quality of the simulation itself – for approval.
� For example, the criterion for consistency may offer better quality and more versatility if one would state it as follows: “the instantaneous simulated fuel consumption will remain within ±3.5% of the measured one up to the 90th percentile when instantaneous fuel consumption values are put in a descending order”.
� This leaves out these cases around idle, where large deviations may occur on a relative scale but which are negligible on an absolute scale.
18
WP 300 and 400 – Vehicle Testing
19
� Chassis dynamometer adjustable to both legislative (e.g. NEDC) and real world driving cycles (e.g. Artemis)
� Complete emissions analysis according to legislation requirements:
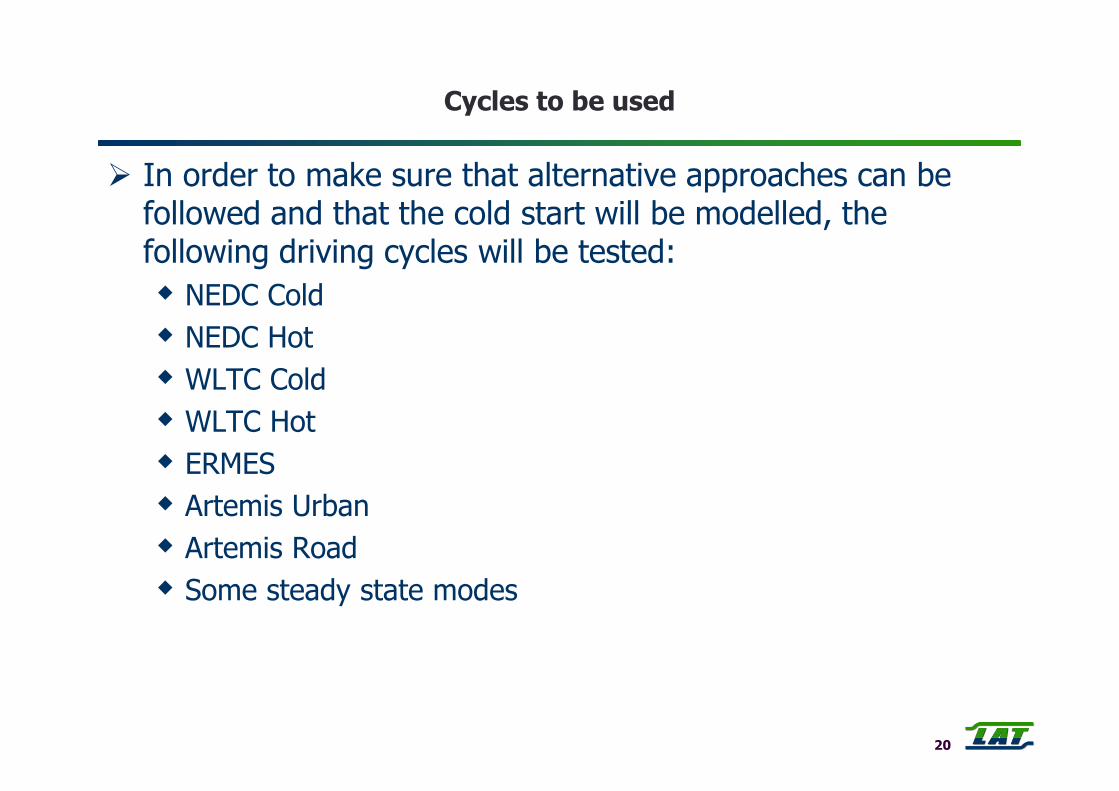
� In order to make sure that alternative approaches can be followed and that the cold start will be modelled, the following driving cycles will be tested:
� NEDC Cold
� NEDC Hot
� WLTC Cold
� WLTC Hot
� ERMES
� Artemis Urban
� Artemis Road
� Some steady state modes
20
Vehicle Test Protocol
21
Several driving cycles
Example here: the OBD (Lot 5) test
protocol
Timetable for the tests to be performed
� 1st car 1 to 15 October 2013
� 2nd car 16 to 31 October 2013
� 3rd car 1 to 15 November 2013
� 4th car 16 to 30 November 2013
� 5th car 1 to 15 December 2013
� We have foreseen a contingency for the PHEV or Range extender
22
Estimated Time Schedule
23
9 10 11 12 1 2 3 4 5 6 7WP TASKWP 100: Inception phase - Set-up of the measurement and simulation schedule110 WP 200: Simulations210WP 300: Testing to cover missing segments and particular areas/questions310WP 400: Focus on future technology vehicles: PHEVs and/or range extenders410WP 500 510 Data Analysis, Reporting, project meetings
ad-hoc support 520 Project Management 530 Framework Contract Management
DELIVERABLESinception reportfirst provisional databasedraft final report and the final databasefinal report
20142013
Back-up slides
24
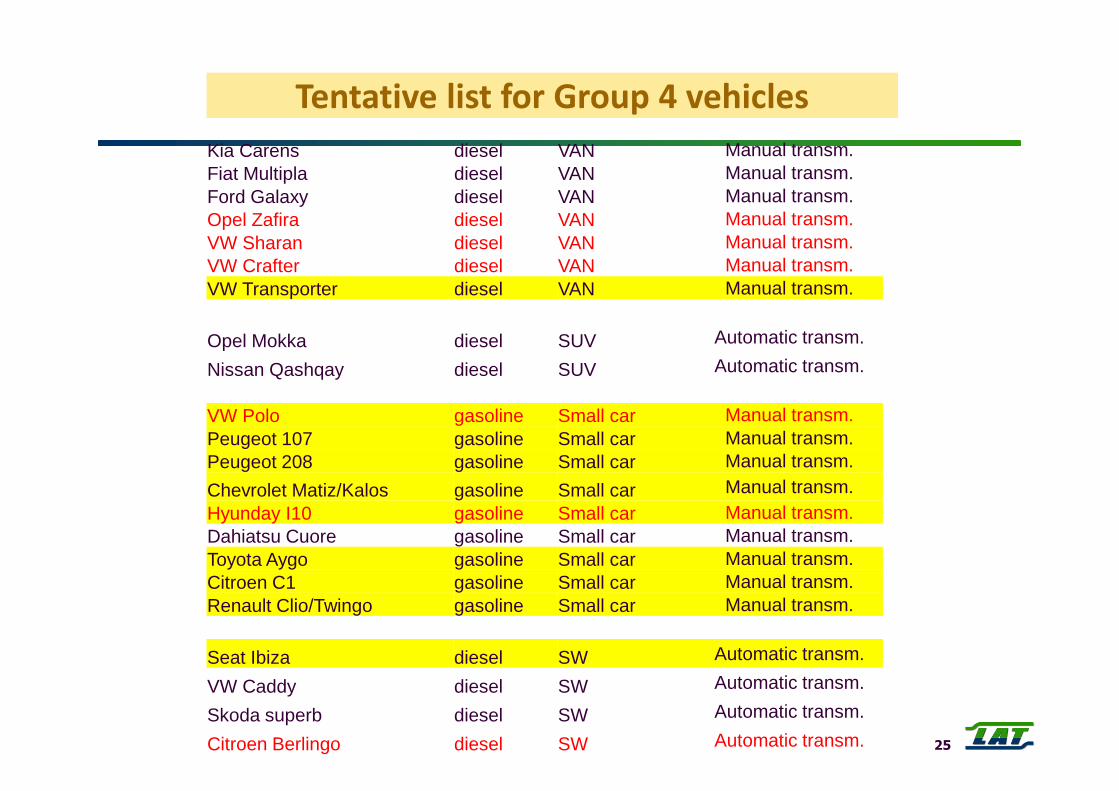
Tentative list for Group 4 vehicles
Kia Carens diesel VAN Manual transm.Fiat Multipla diesel VAN Manual transm.Ford Galaxy diesel VAN Manual transm.Opel Zafira diesel VAN Manual transm.VW Sharan diesel VAN Manual transm.VW Crafter diesel VAN Manual transm.VW Transporter diesel VAN Manual transm.
Opel Mokka diesel SUV Automatic transm.
Nissan Qashqay diesel SUV Automatic transm.
VW Polo gasoline Small car Manual transm.Peugeot 107 gasoline Small car Manual transm.Peugeot 208 gasoline Small car Manual transm.
Chevrolet Matiz/Kalos gasoline Small car Manual transm.Hyunday I10 gasoline Small car Manual transm.Dahiatsu Cuore gasoline Small car Manual transm.Toyota Aygo gasoline Small car Manual transm.Citroen C1 gasoline Small car Manual transm.Renault Clio/Twingo gasoline Small car Manual transm.
Seat Ibiza diesel SW Automatic transm.
VW Caddy diesel SW Automatic transm.
Skoda superb diesel SW Automatic transm.
Citroen Berlingo diesel SW Automatic transm. 25
Chassis dyno setting issues
26
List of test parameters and range of variation
Variable Dimension Set point Range of
variation
Notes
Test parameters – Representing the variables H and part of Z from the ToR
Test mass kg Kerb mass +
100
Set point ÷ TMH
Test
Temperature
°C 23 20 ÷ 30
Oil and coolant
Temperatures
°C 23 20 ÷ Tmax Oil,
Tmax Coolant
This will be
achieved by
carrying out
cold-start and
hot-start tests.
Road Load
Parameters
F0 [N]
F1 [N/kph]
F2[N/kph^2]
NEDC
manufacturer’s
data
Set point ÷
+25%
27
List of technologies and range of variation
Variable Dimension Set point Range of variation Notes
Technology (*) – Representing the variables K1 and part of Z from the ToR
Engine start-stop Off Off - On
MT/AT Manual T MT ÷ AT
MT/AT Automatic AT ÷ MT
Manual transmission Original vehicle
Gearbox
Set point ÷ 2 (additional
gears)
Transmission ratio Original vehicle
Gearbox
Set point ÷ one alternative
Automatic
transmission
Original AT 3 types
Downspeeding Original Setting Set point ÷ one alternative
Leanburn Stoichiometric Set Point ÷ Leanburn
VVT Original setting Set point ÷ one alternative
EGR Original setting Set point ÷ one alternative
Engine downsizing Original engine size Set point + one alternative
28
List of technologies and range of variation
Variable Dimension Set point Range of
variation
Notes
Technology (*) – Representing the variables K2 and part of Z from the ToR