42
Outlook 2016 “Moving from Macro to Micro”
| Date post: | 12-Apr-2018 |
| Category: |
Documents |
| Upload: | nguyenngoc |
| View: | 216 times |
| Download: | 2 times |

Outlook 2016
“Moving from Macro to Micro”

2015 Recap… Equity Markets
24000.00
25000.00
26000.00
27000.00
28000.00
29000.00
30000.00
Jän.15 Feb.15 Mär.15 Apr.15 Mai.15 Jun.15 Jul.15 Aug.15 Sep.15 Okt.15 Nov.15 Dez.15
S&P BSE Sensex Movement and Key Events Sensex crosses 30,000
poi ts o ‘BI s se o d surprise 25 bps rate cut
Minimum
Alternate
Tax issues
surface
RBI cuts repo rate
by 25 bps
Fears of
inclusion of
China A shares
in MSCI Index
Concern of Greece
exiting Eurozone
Concern on
Greece
continue
Monsoon
session
washout
Worries over
slowdown in
Chinese economy
China devalues
its currency
RBI cuts repo
rate by 50 bps US Fed
raises rate
by 25 bps
‘BI s surprise
25 bps
rate cut
NDA
defeated
in Bihar
elections
Union Budget
below market
expectations
Data Source: Bloomberg. Past Performance may or may not be sustained in the future. RBI – Reserve Bank of India. National Democratic Alliance

2015 Recap
Equity - What we said in 2015?
The equity markets will consolidate due to subdued earnings growth
We had recommended investing in Dynamic Asset Allocations funds that benefit from volatility
What Happened?
Life remained @ 26000 Sensex amid extreme volatility
Our top recommendation – Dynamic Asset Allocation Product - outperformed in 2015. (6.7% vs Sensex -5%)
Debt - What we said in 2015?
Macro indicators will improve further
Rate cuts imminent and can be sharper than expected
Duration funds will be a better play
What Happened?
Sharp 125-bps rate cuts by the RBI
Debt funds outperformed, but long duration funds gave up some gains towards end of the year amid Fed rate hike.
Data Source: Value Research. Past Performance may or may not be sustained in the future.

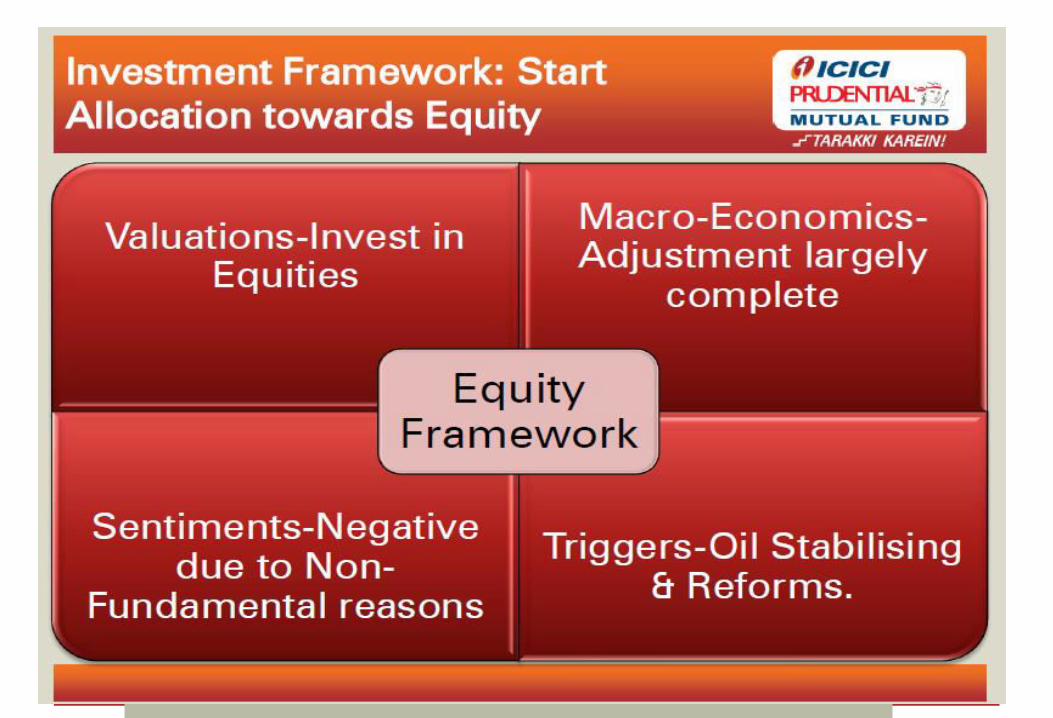
Macro adjustment largely complete…
Micro should start reviving too…
High quality assets can be risky, and low quality assets can be safe. It’s just a matter of the price paid for them. – Howard Marks

Macro Adjustment Largely Complete
FY-13 FY-14 FY-15 Dec 2015
Fiscal Deficit as % of GDP
4.9 4.4 4.1 3.9 (BE)
Current Account Deficit as % of GDP
4.7 1.7 1.3 1.60
CPI Inflation % (March end figures)
10.4 9.5 6.0 5.4
10 Year G-Sec % (March end figures)
7.96 8.80 7.75 7.75
USD/INR 54.3 59.9 62.5 66.1
Brent Crude Prices US$/bbl
109 107 63.4 36.4
RBI Policy Rate % (March end figures)
7.5 8 7.75 6.75
Data Source: Bloomberg. (BE) –Government budgeted Estimates


Micro Indicators – Slow Recovery Underway
Data Source: CEIC and Bloomberg. 2W-2 wheeler, 4W – 4 wheeler, M&HCV – Medium & Heavy Commercial Vehicles. YOY – Year on Year. 3mma – 3 month moving average
Consumer durable goods production
growth has started recovering
Auto Sales have started to pick up
-5%
0%
5%
10%
15%
20%
25%
30%
35%
40%
45%
2W 4W M&HCV
FY15 4Q15 1Q16 2Q16 Sep-Nov'15
Autos Demand Growth

Micro Indicators – Slow Recovery Underway
Data Source: CMIE, Bloomberg Contsr. & RE – Construction and Real Estate
Spending on National Highways in FY16e New project investment started to pick
up in power and transport sectors
0
5
10
15
20
25
2001 2003 2005 2007 2009 2011 2013 2015Metals Other Mfg. Power Transport Constr. & RE Others
0.0
0.1
0.2
0.3
0.4
0.5
0.6
0.7
0.8
0.9
1.0
2008 2009 2010 2011 2012 2013 2014 2015 2016E
Government Private Sector
Investment in
National Highways
INR tn
Government
spending is
higher in Road
sector

Government Reforms To Continue
The Government may focus more on 'executive decisions' to push reforms without
getting stuck in the legislative dilemma.
List of Prospective Reforms
Legislative
• Goods & Service Tax • Land Acquisition Bill
• Monetary Policy Committee • APMC Changes • Labor Reforms
Executive
• Railways and Roads projects • Power Sector Reforms • Industrial Corridors
• Clearing Stalled Projects • Smart Cities • Digital India
• Skill Development • FCI Restructuring
Data Source: Internal Research. APMC – Agricultural Produce Marketing Corporation. FCI – Food Corporation of India. SEB – State Electricity Boards
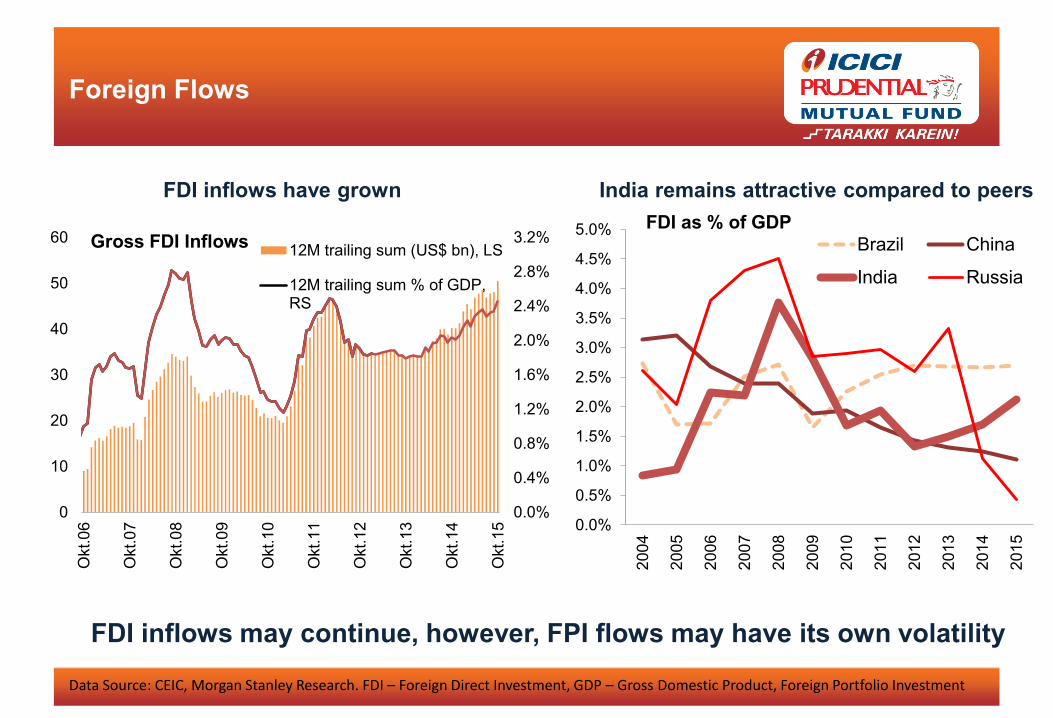
Foreign Flows
FDI inflows may continue, however, FPI flows may have its own volatility
0.0%
0.4%
0.8%
1.2%
1.6%
2.0%
2.4%
2.8%
3.2%
0
10
20
30
40
50
60
Okt.0
6
Okt.0
7
Okt.0
8
Okt.0
9
Okt.1
0
Okt.1
1
Okt.1
2
Okt.1
3
Okt.1
4
Okt.1
5
12M trailing sum (US$ bn), LS
12M trailing sum % of GDP,RS
Gross FDI Inflows
FDI inflows have grown
0.0%
0.5%
1.0%
1.5%
2.0%
2.5%
3.0%
3.5%
4.0%
4.5%
5.0%
200
4
200
5
200
6
200
7
200
8
200
9
201
0
201
1
201
2
201
3
201
4
201
5
Brazil China
India Russia
FDI as % of GDP
India remains attractive compared to peers
Data Source: CEIC, Morgan Stanley Research. FDI – Foreign Direct Investment, GDP – Gross Domestic Product, Foreign Portfolio Investment

Oil Prices May Stabilise By End Of 2016
Data Source: Bernstein Analysis. OPEC – Organisation of Petroleum Exporting Countries. CAPEX – Capital Expenditure.
Non-OPEC supply may start declining owing
to lower CAPEX
Demand has remained strong and may
further increase if prices remain low
Current prices are too low for the industry
and OPEC to be sustainable in the
long term
Supply minus
demand may turn
negative in mid
2016
Oil currently is
over supplied
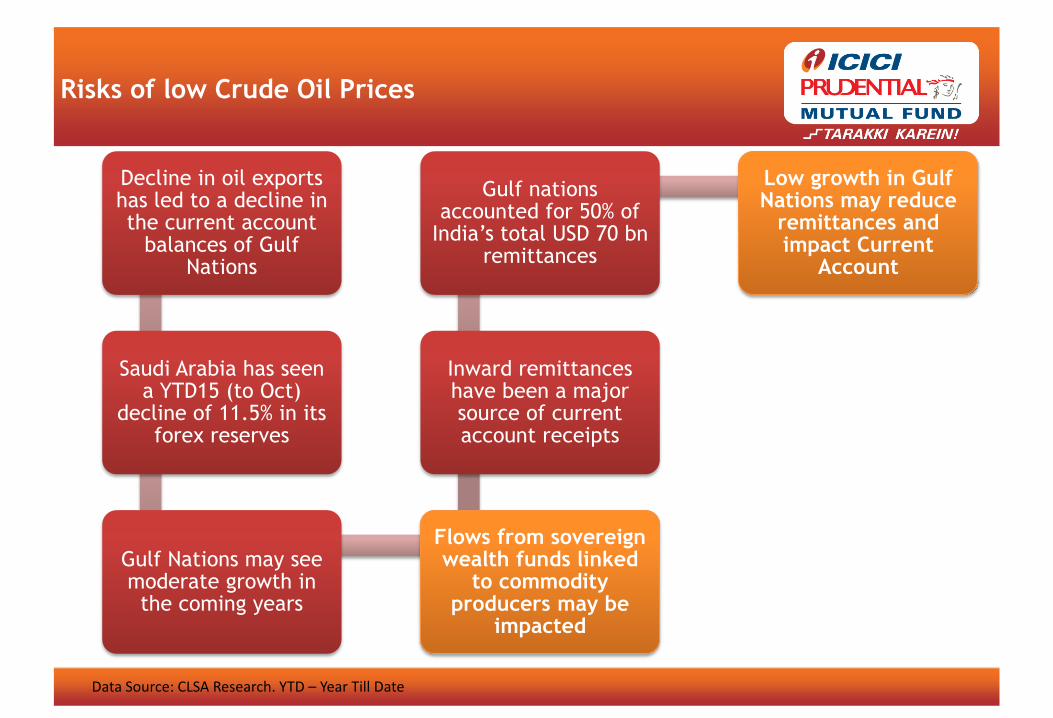
Risks of low Crude Oil Prices
Data Source: CLSA Research. YTD – Year Till Date
Decline in oil exports has led to a decline in the current account
balances of Gulf Nations
Saudi Arabia has seen a YTD15 (to Oct)
decline of 11.5% in its forex reserves
Gulf Nations may see moderate growth in
the coming years
Flows from sovereign wealth funds linked
to commodity producers may be
impacted
Inward remittances have been a major source of current account receipts
Gulf nations accounted for 50% of
India’s total USD 70 bn remittances
Low growth in Gulf Nations may reduce
remittances and impact Current
Account

Operating Leverage to Drive Earnings
Capacity utilization is at multi-year low
Earnings can improve owing to strong operating leverage
Earnings growth may be visible over next 3-4 quarters
Over the past five years companies have built in considerable operating leverage
Capacity
Utilisation;
71.5%
69%
72%
75%
78%
81%
JUN
.09
DE
Z.0
9
JUN
.10
DE
Z.1
0
JUN
.11
DE
Z.1
1
JUN
.12
DE
Z.1
2
JUN
.13
DE
Z.1
3
JUN
.14
DE
Z.1
4
JUN
.15
CA
PA
CIT
Y U
TIL
ISA
TIO
N
MANUFACTURING SECTOR CAPACITY UTILISATION
Source: RBI, Morgan Stanley Research

Factors That Favor Earnings Growth
The investment rate is going up, led by public investments, especially
in infrastructure
Real growth is ticking higher; industrial
growth is now at a five-year high
Households are also leveraging balance
sheets, which is promising for consumption
Terms of trade, which affect the current
account, are probably better than at any point over the past decade
Earnings will run into a favorable base effect in
the second half of F2016 and F2017
Real Broad Market Revenue Growth Accelerating
-6%
-1%
4%
9%
14%
19%
24%
29%
Se
p.0
6
Se
p.0
7
Se
p.0
8
Se
p.0
9
Se
p.1
0
Se
p.1
1
Se
p.1
2
Se
p.1
3
Se
p.1
4
Se
p.1
5
Broad Market Rev Growth (ex-energy, YoY%), deflated by WPI
ex. Primary Food
Source: Capital line, Morgan Stanley Research. WPI – Wholesale Price Index

India Growth Story: India shall continue to grow better
than the rest of the world
-2%
0%
2%
4%
6%
8%
10%
12%
2001 2003 2005 2007 2009 2011 2013 2015e
Global GDP Growth India Real GDP Growth
India's real growth vs World
Data Source: Bloomberg

Global Growth Important for India
53% of BSE 100 revenues are in foreign currency
This makes it all the more important for rest of the world to do well for a secular growth in earnings
Energy
43%
IT
15%
Materials
20%
Cons. Disc.
13%
Health
4%
Utilities
3%
Telecom
1%
Industrials
1%
Split of foreign BSE100 Revenues
Data Source: CS Research


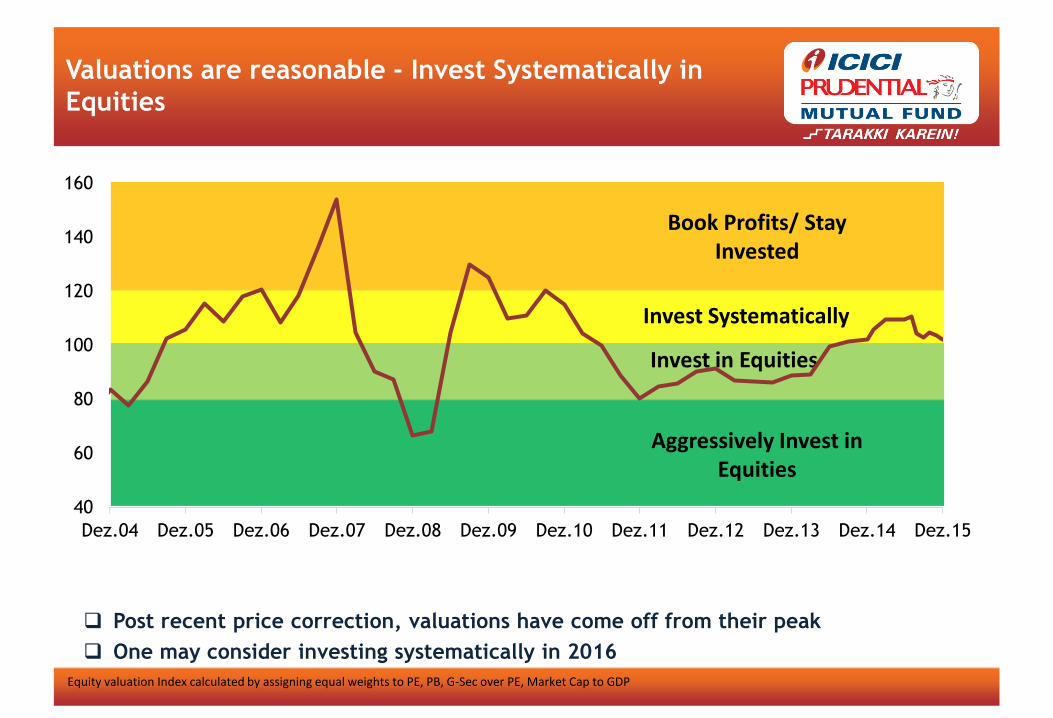
Valuations are reasonable - Invest Systematically in
Equities
Post recent price correction, valuations have come off from their peak
One may consider investing systematically in 2016
Equity valuation Index calculated by assigning equal weights to PE, PB, G-Sec over PE, Market Cap to GDP
Book Profits/ Stay
Invested
Invest Systematically
Invest in Equities
Aggressively Invest in
Equities
40
60
80
100
120
140
160
Dez.04 Dez.05 Dez.06 Dez.07 Dez.08 Dez.09 Dez.10 Dez.11 Dez.12 Dez.13 Dez.14 Dez.15

Core Investment Idea For 2016
Crude Oil prices likely to bottom
in 2016
Global Markets likely to remain unstable until crude bottoms
This may keep Indian Equity
Market volatile in the near term
2016 can be the year of Dynamic Asset Allocation Funds They also have ability to capitalize on opportunities in fixed income
market in a tax-efficient way.
Invest In Dynamic Asset Allocation Funds and
Invest Systematically In Pure Equity Funds

Potential Triggers in 2016
Triggers for 2016
Good Monsoon
Signs of Earnings Growth
Improvement in Bank NPAs
Speedy implementation
of Reforms
NPA – Non Performing Assets

To Sum up.. Equity Market Outlook for 2016
Macro-economic adjustment largely over; micro-economic indicators have
started improving
Long-term India Growth Story remains intact; India will continue to grow
faster than peers
Earnings can improve owing to operating leverage
Commodity prices likely to bottom in 2016; till then markets may remain
volatile
2016 will be the year for investing in Dynamic Asset Allocation Funds and
investing systematically in pure equity funds.
Risks in 2016
Risks
China Economy Slowdown
Crude prices remaining at current lows
US High Yield Bond Market

Become Overweight On Equities By
End Of 2016

Why India?
Data Source: Bloomberg. (BE) –Government budgeted Estimates
Demographics - India will remain young country for decades to come
IN = India
BR = Brazil
CN = China
ID = Indonesia
KR = South Korea
US = United States of America

Equities
Physical
Assets
Time to Start Moving Towards
Equity
Market Volatility
Timing of Investment
Challenges in Equity Investing Equity perform better in the
Long Term

Sour e: Bloo erg, Data fro De 8 – De 5. ‘etur s are o pou ded a ualised. Data based on yearly rolling. Rolling returns based on Sensex (1980-2015)
Invest for the Long Term In Equities
Longer The Period = Lower The Volatility

Ways Of Investing In Equities
Systematic
Investment Plan
Invest When Market
is Low
Dynamic Asset
Allocation Funds

Dynamic Asset Allocation
Funds are the Way Forward
Buys at Lower
Valuation,
Sells at Higher
Valuation
Reduces impact of
market volatility on
your investment
Keeps emotions
aside while
investing
Long-term investment in dynamic asset
allocation funds benefits in all market
cycles * Only for illustrative purpose
30.0%
35.0%
40.0%
45.0%
50.0%
55.0%
60.0%
65.0%
70.0%
75.0%
80.0%
15000
17000
19000
21000
23000
25000
27000
29000
31000
Mä
r.2
01
0
Jun
.20
10
Se
p.2
01
0
De
z.2
01
0
Mä
r.2
01
1
Jun
.20
11
Se
p.2
01
1
De
z.2
01
1
Mä
r.2
01
2
Jun
.20
12
Se
p.2
01
2
De
z.2
01
2
Mä
r.2
01
3
Jun
.20
13
Se
p.2
01
3
De
z.2
01
3
Mä
r.2
01
4
Jun
.20
14
Se
p.2
01
4
De
z.2
01
4
Mä
r.2
01
5
Jun
.20
15
Se
p.2
01
5
De
z.2
01
5
Sensex Levels Net Equity Exposure
Data Source - MFI

Mutual Fund investments are subject to market risks, read all scheme related documents
carefully. All figures and other data given in this document are as on 29th December 2015 unless stated otherwise. The same may or may not be relevant at a future date. The AMC takes no responsibility of updating any data/information in this material from time to time. The information shall not be altered in any way, transmitted to, copied or distributed, in part or in whole, to any other person or to the media or reproduced in any form, without prior written consent of ICICI Prudential Asset Management Company Limited. Prospective investors are advised to consult their own legal, tax and financial advisors to determine possible tax, legal and other financial implication or consequence of subscribing to the units of ICICI Prudential Mutual Fund. Data source: Bloomberg, except as mentioned specifically. Disclaimer: In the preparation of the material contained in this document, ICICI Prudential Asset Management Company Ltd. (the AMC) has used information that is publicly available, including information developed in-house. Some of the material used in the document may have been obtained from members/persons other than the AMC and/or its affiliates and which may have been made available to the AMC and/or to its affiliates. Information gathered and material used in this document is believed to be from reliable sources. The AMC however does not warrant the accuracy, reasonableness and / or completeness of any information. We have included statements / opinions / recommendations in this document, which contain words, or phrases such as “will”, “expect”, “should”, “believe” and similar expressions or variations of such expressions, that are “forward looking statements”. Actual results may differ materially from those suggested by the forward looking statements due to risk or uncertainties associated with our expectations with respect to, but not limited to, exposure to market risks, general economic and political conditions in India and other countries globally, which have an impact on our services and / or investments, the monetary and interest policies of India, inflation, deflation, unanticipated turbulence in interest rates, foreign exchange rates, equity prices or other rates or prices etc. ICICI Prudential Asset Management Company Limited (including its affiliates), the Mutual Fund, The Trust and any of its officers, directors, personnel and employees, shall not liable for any loss, damage of any nature, including but not limited to direct, indirect, punitive, special, exemplary, consequential, as also any loss of profit in any way arising from the use of this material in any manner. Further, the information contained herein should not be construed as forecast or promise. The recipient alone shall be fully responsible/are liable for any decision taken on this material.

Thank you!
![Doctor Vikatan Subliment 01-09-2013 [Www.freedomusertech.blogspot.com]](https://static.documents.pub/doc/80x56/55cf9ac1550346d033a343ce/doctor-vikatan-subliment-01-09-2013-wwwfreedomusertechblogspotcom.jpg)


