40
woodmac.com Trusted Intelligence January 2019 Outlook and Benefits of An Efficient U.S. Coal Fleet Final Report

woodmac.com
woodmac.comTrusted Intelligence
January 2019
Outlook and Benefits of An Efficient U.S. Coal Fleet
Final Report
woodmac.com
2
INTRODUCTION
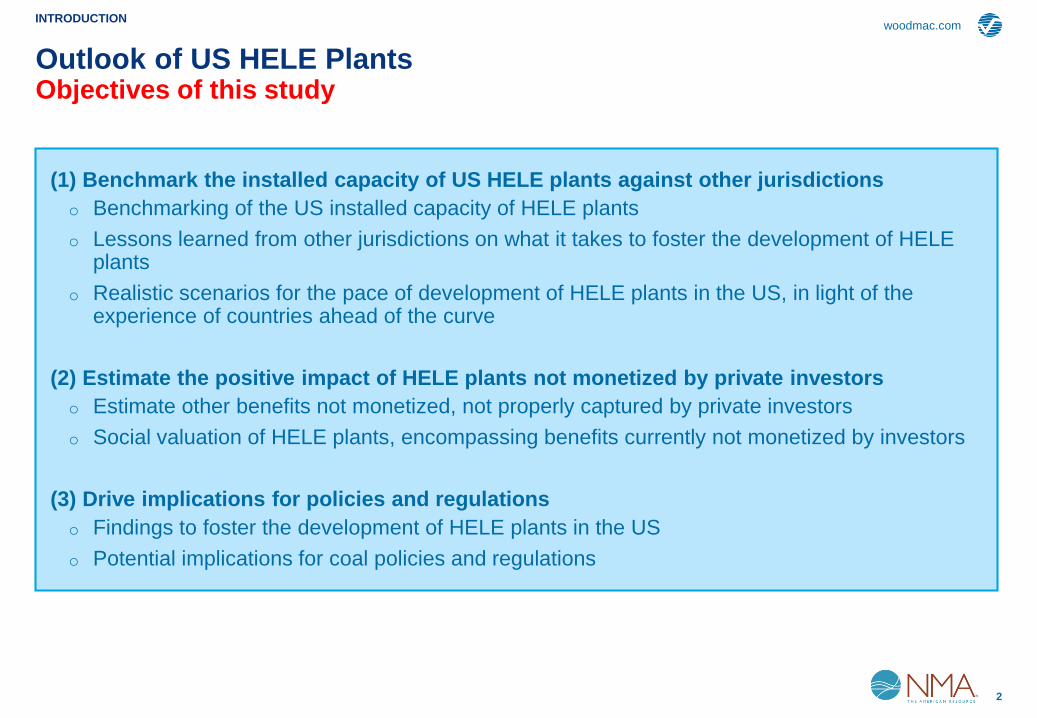
(1) Benchmark the installed capacity of US HELE plants against other jurisdictions
o Benchmarking of the US installed capacity of HELE plants
o Lessons learned from other jurisdictions on what it takes to foster the development of HELE plants
o Realistic scenarios for the pace of development of HELE plants in the US, in light of the experience of countries ahead of the curve
(2) Estimate the positive impact of HELE plants not monetized by private investors
o Estimate other benefits not monetized, not properly captured by private investors
o Social valuation of HELE plants, encompassing benefits currently not monetized by investors
(3) Drive implications for policies and regulations
o Findings to foster the development of HELE plants in the US
o Potential implications for coal policies and regulations
Outlook of US HELE PlantsObjectives of this study
woodmac.com
3
Global Coal-Fired Power Plants Installed Capacity
0
500
1,000
1,500
2,000
2,500
282
20
00
20
05
20
02
440
20
01
20
04
20
03
20
11
20
06
20
08
20
07
20
09
1,243
20
18
20
10
20
12
20
13
20
14
20
15
20
16
20
17
238
998
2,013
+62%
+2.7%
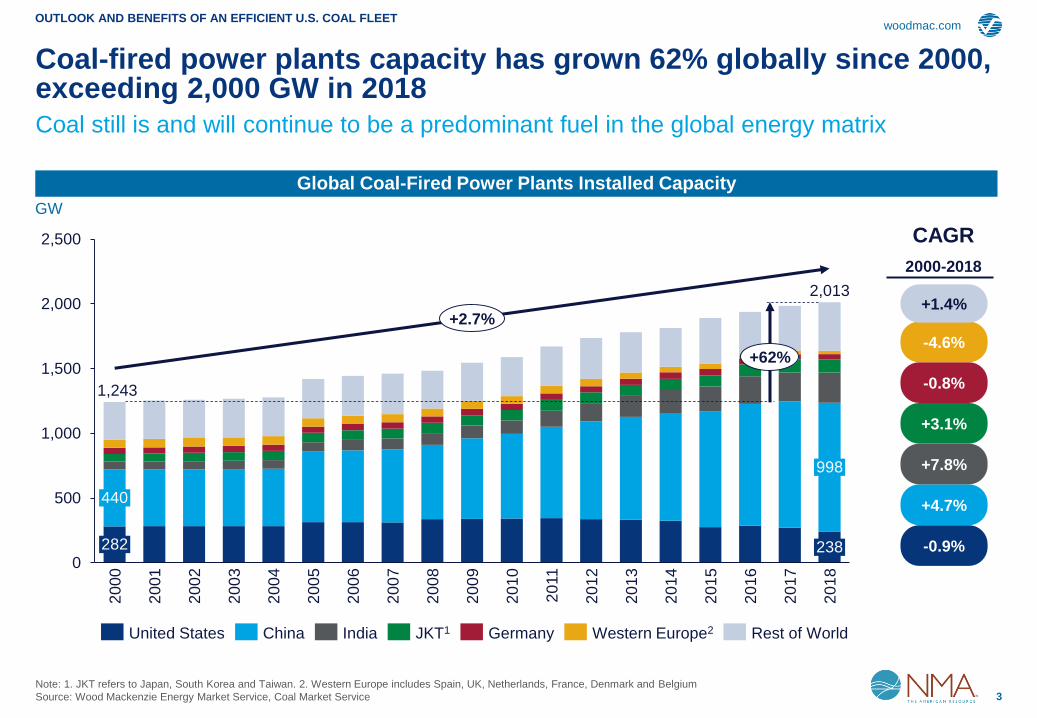
Coal-fired power plants capacity has grown 62% globally since 2000, exceeding 2,000 GW in 2018
OUTLOOK AND BENEFITS OF AN EFFICIENT U.S. COAL FLEET
Coal still is and will continue to be a predominant fuel in the global energy matrix
GW
Note: 1. JKT refers to Japan, South Korea and Taiwan. 2. Western Europe includes Spain, UK, Netherlands, France, Denmark and Belgium
Source: Wood Mackenzie Energy Market Service, Coal Market Service
GermanyUnited States China India JKT1 Western Europe2 Rest of World
-0.9%
CAGR
2000-2018
+4.7%
+7.8%
+3.1%
-0.8%
-4.6%
+1.4%

woodmac.com
4
2010-2020
Growth in coal plant capacity has been led by HELE power plants commissioned in the past decade
HELE Power Plant Definition Global Coal-Fired Power Plants Installed Capacity1
0
200
400
600
800
1,000
1,200
1,400
1,600
1,800
2,000
2,200
20
12
20
14
40
30
20
10
31
48
32
20
11
33
20
13
20
18
3438
20
20
20
15
40
20
16
20
17
20
19
4345
1,588
2,0132,092
+469
+989
OUTLOOK AND BENEFITS OF AN EFFICIENT U.S. COAL FLEET
HELE plant share of total coal-fired power capacity increased from 30% to over 40%, andis expected to continue rising as new HELE plants replace subcritical plants
Note: 1. Coal-fired power plant capacity forecast is based on the under construction and announced power plant projects and planned retirements
Source: Wood Mackenzie, World Coal Association, EIA
Subcritical
Supercritical
Ultra-supercritical
Advanced USC
HELE Penetration %
GW
CategoryEfficiency
RateCO2 Intensity
Coal
Consumption
Steam
Temperature
Advanced
ultra-
supercritical
More than
45%
670-740
g CO2/ kWh
290-320
g/kWh700oC+
Ultra-
supercriticalUp to 45%
740-800
g CO2/ kWh
320-340
g/kWh600oC+
Supercritical Up to 42%800-880
g CO2/ kWh
340-380
g/kWh
Approx.
550oC-600oC
Subcritical Up to 38%≥880
g CO2/ kWh
≥380
g/kWh<550oC
% HELE Penetration
-0.2%
4.4%
15.3%
18.1%
CAGR
HELE Plants

woodmac.com
5
HELE plants represent 43% of worldwide total coal-fired capacity
Among the major economies, Japan, Germany and China lead the world in coal plant efficiency
OUTLOOK AND BENEFITS OF AN EFFICIENT U.S. COAL FLEET
Source: Wood Mackenzie, EIA
HELE Share of Total Coal-Fired Installed Capacity
0 10 20 30 40 50 60 70 80 90 100
66%
79%
Italy
United States
Germany
Russia
United Kingdom
28%
Netherlands
Japan
Other Europe
France
China
11%
Spain
South Korea
Turkey
Poland
Canada
India
3%
36%
70%
100%
100%
83%
68%
74%
10%
45%
39%
3%
%
World-wide
average HELE
penetration at 43%
woodmac.com
6
20
40
60
80
100
120
140
20
40
60
80
100
120
140
20
40
60
80
100
120
140
20
40
60
80
100
120
140
2010 2012 2014 2016 2018 2020 2022 2024 2026 2028 2030
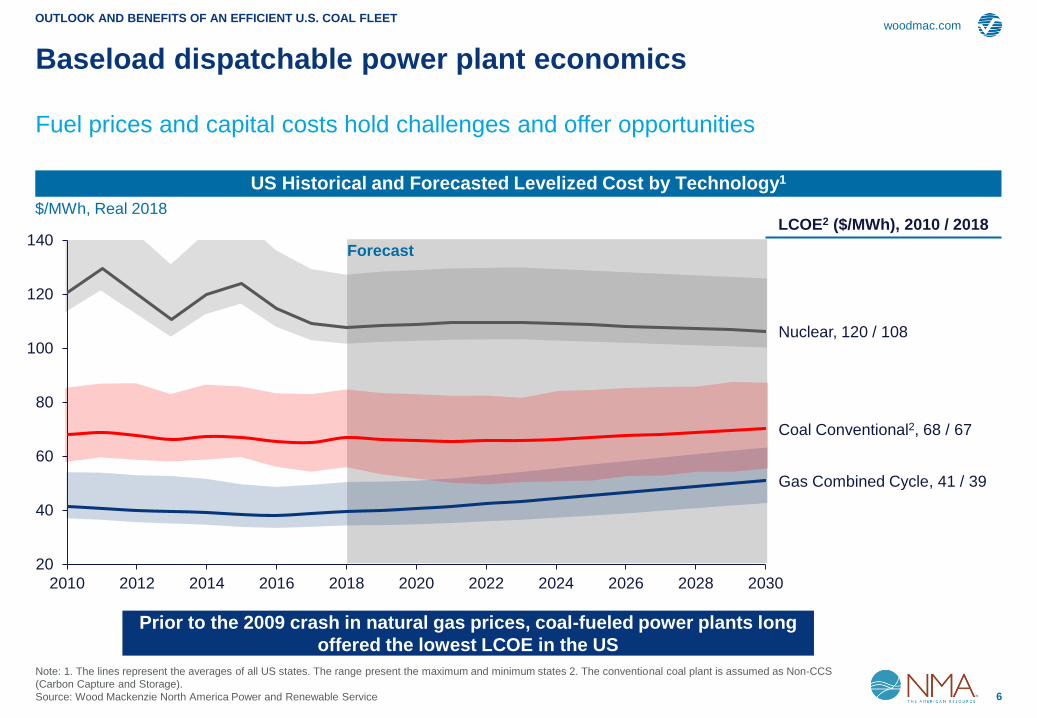
Nuclear, 120 / 108
Coal Conventional2, 68 / 67
Gas Combined Cycle, 41 / 39
Baseload dispatchable power plant economics
US Historical and Forecasted Levelized Cost by Technology1
Note: 1. The lines represent the averages of all US states. The range present the maximum and minimum states 2. The conventional coal plant is assumed as Non-CCS
(Carbon Capture and Storage).
Source: Wood Mackenzie North America Power and Renewable Service
OUTLOOK AND BENEFITS OF AN EFFICIENT U.S. COAL FLEET
$/MWh, Real 2018
Fuel prices and capital costs hold challenges and offer opportunities
LCOE2 ($/MWh), 2010 / 2018
Forecast
Prior to the 2009 crash in natural gas prices, coal-fueled power plants long
offered the lowest LCOE in the US
woodmac.com
7
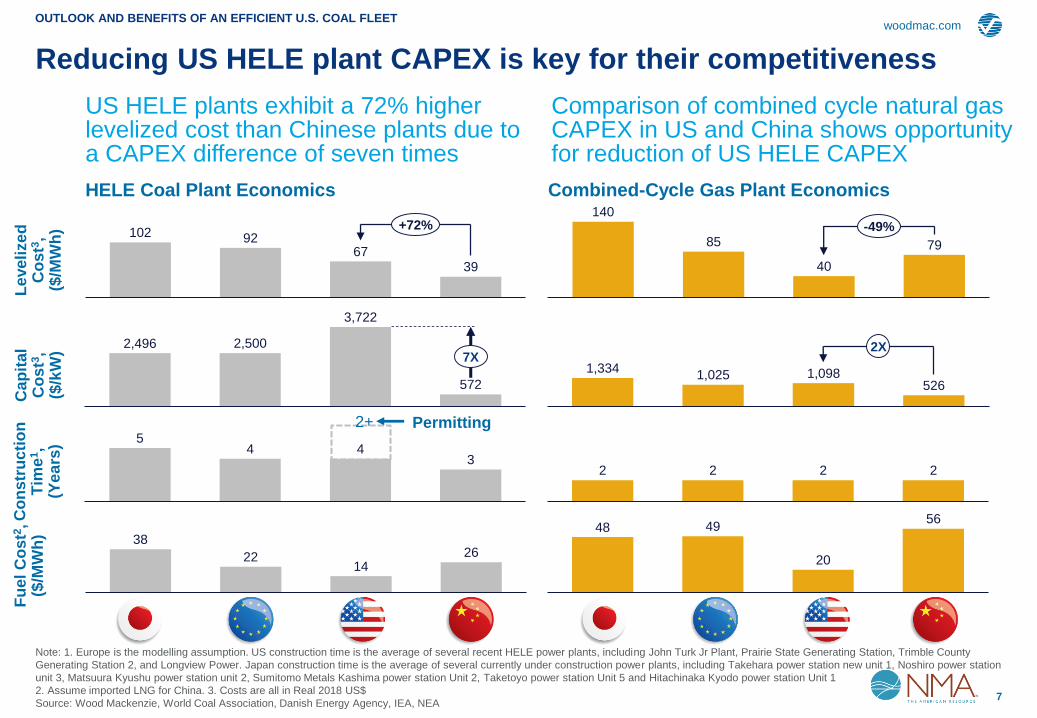
102 9267
39
+72%
Le
ve
lize
d
Co
st3
,($
/MW
h)
Reducing US HELE plant CAPEX is key for their competitiveness
Note: 1. Europe is the modelling assumption. US construction time is the average of several recent HELE power plants, including John Turk Jr Plant, Prairie State Generating Station, Trimble County
Generating Station 2, and Longview Power. Japan construction time is the average of several currently under construction power plants, including Takehara power station new unit 1, Noshiro power station
unit 3, Matsuura Kyushu power station unit 2, Sumitomo Metals Kashima power station Unit 2, Taketoyo power station Unit 5 and Hitachinaka Kyodo power station Unit 1
2. Assume imported LNG for China. 3. Costs are all in Real 2018 US$
Source: Wood Mackenzie, World Coal Association, Danish Energy Agency, IEA, NEA
2,496 2,500
3,722
572
7X
38
2214
26
54 4
3
OUTLOOK AND BENEFITS OF AN EFFICIENT U.S. COAL FLEET
US HELE plants exhibit a 72% higher levelized cost than Chinese plants due to a CAPEX difference of seven times
140
85
40
79
-49%
1,3341,025 1,098
526
2X
48 49
20
56
2 2 2 2
Cap
ital
Co
st3
,($
/kW
)
Co
ns
tru
cti
on
T
ime
1,
(Ye
ars
)
Fu
el
Co
st2
,($
/MW
h)
Comparison of combined cycle natural gas CAPEX in US and China shows opportunity for reduction of US HELE CAPEX
Permitting 2+
HELE Coal Plant Economics Combined-Cycle Gas Plant Economics
woodmac.com
8
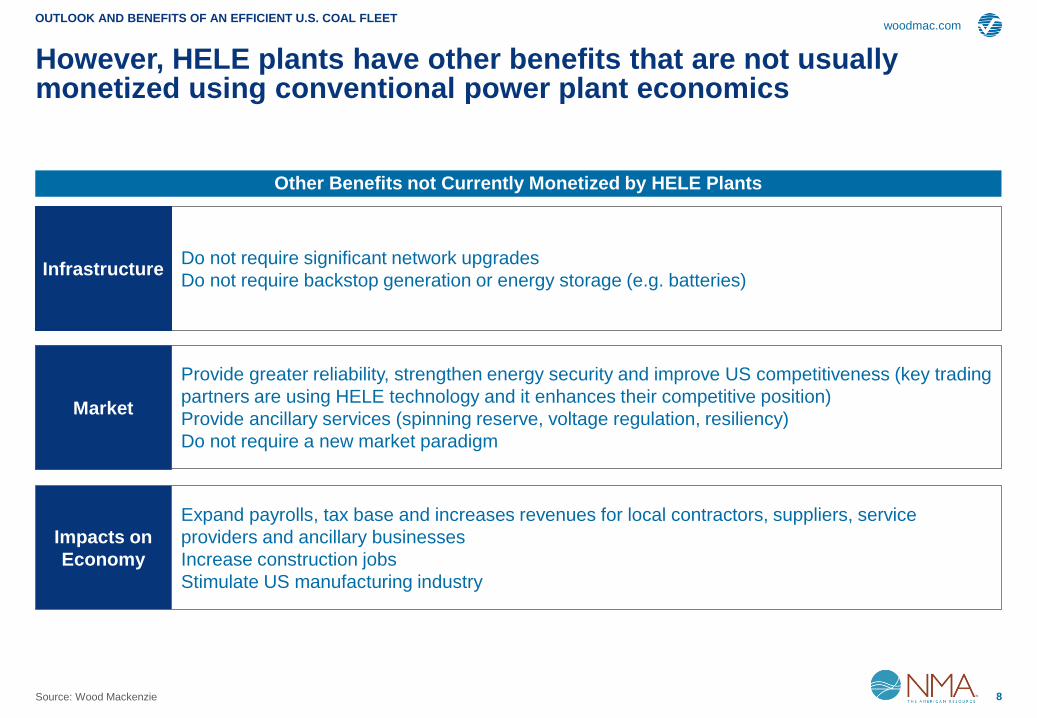
Other Benefits not Currently Monetized by HELE Plants
However, HELE plants have other benefits that are not usually monetized using conventional power plant economics
Provide greater reliability, strengthen energy security and improve US competitiveness (key trading
partners are using HELE technology and it enhances their competitive position)
Provide ancillary services (spinning reserve, voltage regulation, resiliency)
Do not require a new market paradigm
Market
Do not require significant network upgrades
Do not require backstop generation or energy storage (e.g. batteries)Infrastructure
Expand payrolls, tax base and increases revenues for local contractors, suppliers, service
providers and ancillary businesses
Increase construction jobs
Stimulate US manufacturing industry
Impacts on
Economy
OUTLOOK AND BENEFITS OF AN EFFICIENT U.S. COAL FLEET
Source: Wood Mackenzie

woodmac.com
9
• Feasibility: Challenges to integrate renewables into the current grid system, which is designed by the dispatch model.
• High cost: Renewables integration would require market redesign and additional investments in the grid.
• Resilience and reliability: Grid reliability issues as renewables (mostly solar and wind) are intermittent resources.
• Dependency on energy storage: Renewables depend on utility-scale battery technologies to mature.
Renewables integration into the grid1 Uncertainty
HELE power plants help reduce uncertainty in the power markets, a benefit not recognized by the industry and the public
OUTLOOK AND BENEFITS OF AN EFFICIENT U.S. COAL FLEET
Additionally, some market opportunities for HELE plants are not being properly considered
• Gas supply: a) Reduced supply due to increased fracking regulation, e.g. New York fracking ban and Colorado Proposition 112; b)
limitation on available shale drilling locations and c) worse than expected well performance.
• Domestic gas demand: Increased gas demand from the petrochemical industry.
• Gas exports: Rising LNG exports due to higher global gas demand and increasing US to Mexico piped exports.
• Infrastructure requirements: Investments required for interstate and intrastate gas pipeline projects in the US. Several large
pipeline projects have drawn opposition by local communities and environmental groups.
Higher natural gas prices1
• Lower capital cost: Leading HELE technology in the US, streamlined EPC process and domestically manufactured plant
equipment.
• Faster development time: More time-efficient plant construction, shortened HELE power plant permitting process and regulation
requirement.
HELE plant construction
Uncertainty
Opportunity
Note: 1. See appendix for details
Source: Wood Mackenzie
• Stronger economy and faster population growth: Higher GDP growth rate (seen in recent years) could drive up electricity
demand across all sectors.
• Electric vehicle and household electrification: Residential and transportation power demand could increase as a result.
• Digitization, automation and big data: Increase in industrial power demand.
Higher electricity demand Opportunity
woodmac.com
10
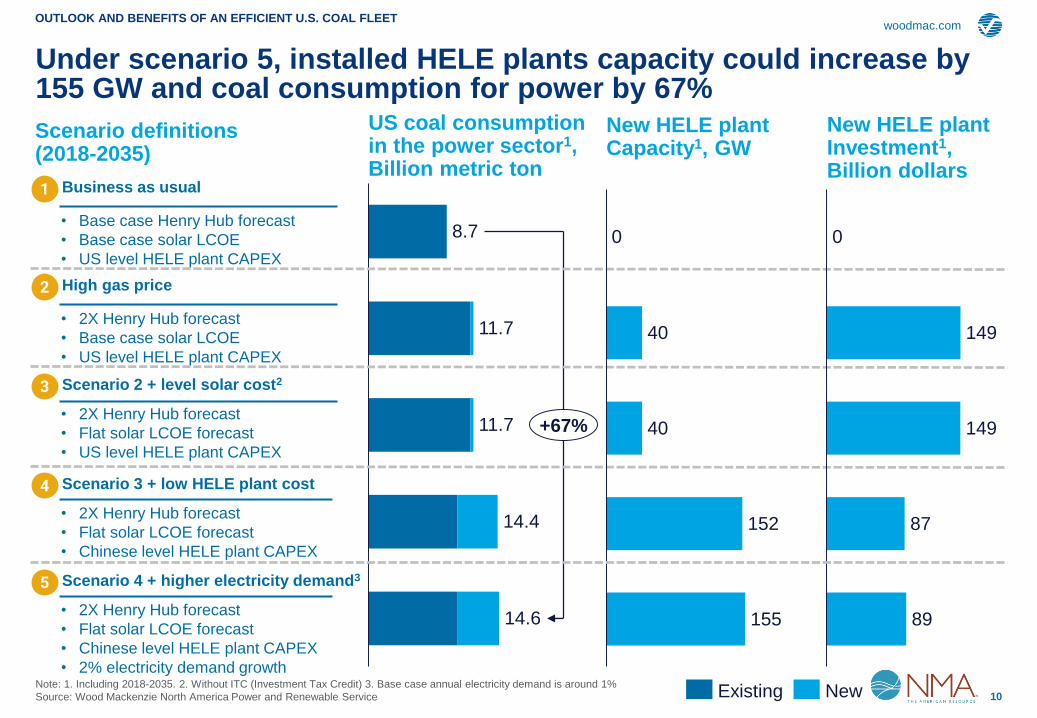
5 Scenario 4 + higher electricity demand3
• 2X Henry Hub forecast
• Flat solar LCOE forecast
• Chinese level HELE plant CAPEX
• 2% electricity demand growth
14.4
8.7
11.7
11.7
14.6
+67%
OUTLOOK AND BENEFITS OF AN EFFICIENT U.S. COAL FLEET
Under scenario 5, installed HELE plants capacity could increase by 155 GW and coal consumption for power by 67%
1 Business as usual
• Base case Henry Hub forecast
• Base case solar LCOE
• US level HELE plant CAPEX
2 High gas price
• 2X Henry Hub forecast
• Base case solar LCOE
• US level HELE plant CAPEX
3 Scenario 2 + level solar cost2
• 2X Henry Hub forecast
• Flat solar LCOE forecast
• US level HELE plant CAPEX
4 Scenario 3 + low HELE plant cost
• 2X Henry Hub forecast
• Flat solar LCOE forecast
• Chinese level HELE plant CAPEX
Scenario definitions (2018-2035)
US coal consumption in the power sector1, Billion metric ton
New HELE plant Capacity1, GW
Note: 1. Including 2018-2035. 2. Without ITC (Investment Tax Credit) 3. Base case annual electricity demand is around 1%
Source: Wood Mackenzie North America Power and Renewable Service
New HELE plant Investment1, Billion dollars
Existing New
40
40
152
155
0
149
149
87
89
0
woodmac.com
11
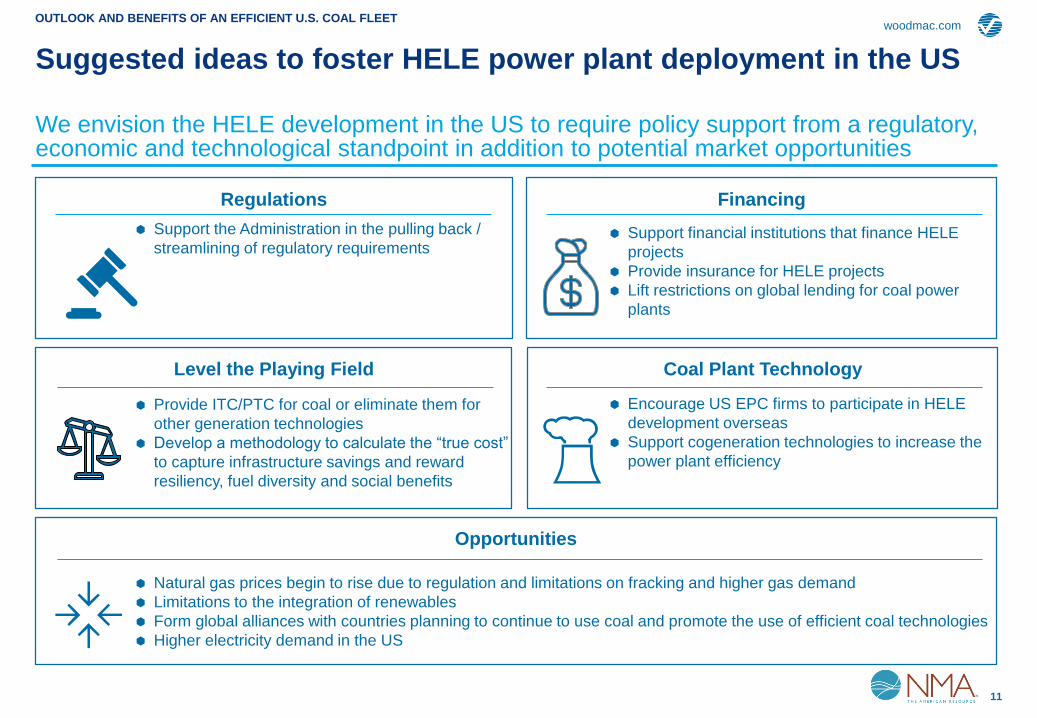
Suggested ideas to foster HELE power plant deployment in the US
Support the Administration in the pulling back /
streamlining of regulatory requirements Support financial institutions that finance HELE
projects
Provide insurance for HELE projects
Lift restrictions on global lending for coal power
plants
Provide ITC/PTC for coal or eliminate them for
other generation technologies
Develop a methodology to calculate the “true cost”
to capture infrastructure savings and reward
resiliency, fuel diversity and social benefits
Encourage US EPC firms to participate in HELE
development overseas
Support cogeneration technologies to increase the
power plant efficiency
Natural gas prices begin to rise due to regulation and limitations on fracking and higher gas demand
Limitations to the integration of renewables
Form global alliances with countries planning to continue to use coal and promote the use of efficient coal technologies
Higher electricity demand in the US
OUTLOOK AND BENEFITS OF AN EFFICIENT U.S. COAL FLEET
We envision the HELE development in the US to require policy support from a regulatory, economic and technological standpoint in addition to potential market opportunities
Regulations
Coal Plant Technology
Opportunities
Financing
Level the Playing Field
woodmac.com
13
Agenda
Appendix
HELE Plant Definitions
Benchmarking of US HELE Plants
HELE Plant Case Studies
Scenario Analysis

woodmac.com
14Source: Wood Mackenzie, World Coal Association, KPMG, Universidad del Callao: Mechanical Engineering Faculty
Fluidised Bed Combustion
Integrated Gasification Combined Cycle (IGCC)
Supercritical & Ultra-supercritical
HELE
Technologies
» Based on a pulverised coal
combustion system
» These technologies operate at
pressures and temperatures
where liquid water and gaseous
water are stable while coexisting.
At this point there is no difference
between both states
» The process results in lower heat
rates, hence higher efficiency
» It combines cycle technology that employs gas
and steam turbines. This integrated gasification
results in high temperatures with an efficiency of
up to 55%
» This technology uses a gasifier to convert coal
(or other carbon-based materials) to syngas
which powers the combined cycle turbine
» This technology allows a greater
flexibility in the use of fuels like
coal, waste and biomass
» The process consists of a mixture
of solid particles suspended in an
ascending gas flow, that together
have fluid properties
» The combustion takes place in
the bed with high calorific transfer
to the unit, but low combustion
temperatures
The technologies applied to achieve higher efficiency and low emission from coal-fired power plants include
What are the advanced coal technologies?
APPENDIX – HELE DEFINITIONS
woodmac.com
15
Global HELE Power Plant Definition – Excluding US
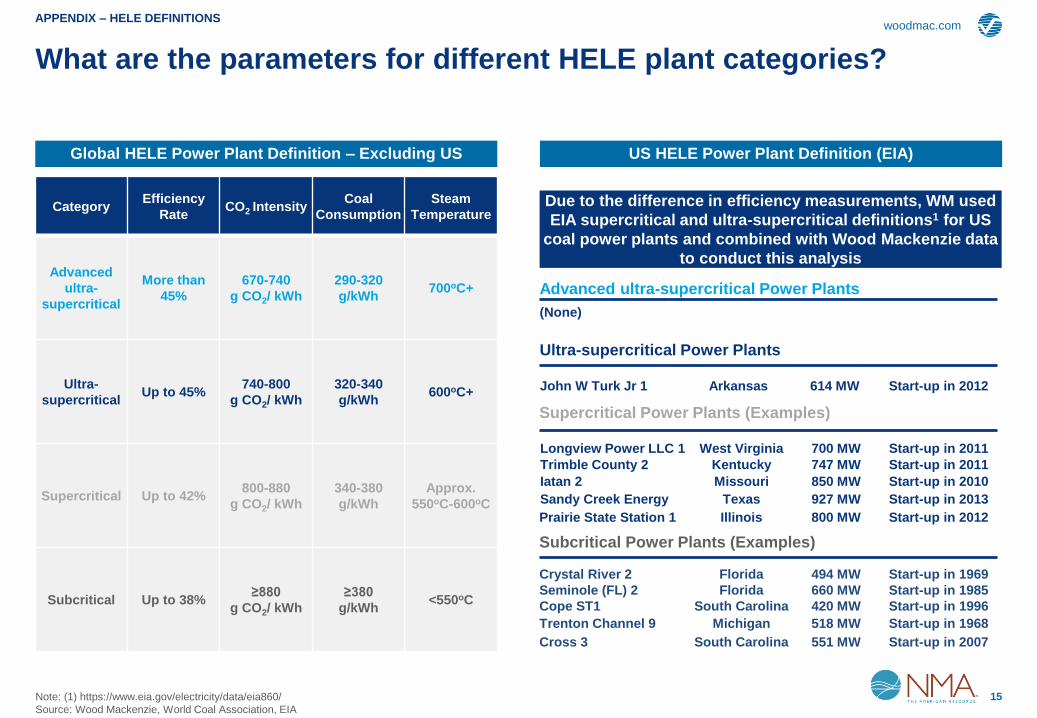
What are the parameters for different HELE plant categories?
APPENDIX – HELE DEFINITIONS
Note: (1) https://www.eia.gov/electricity/data/eia860/
Source: Wood Mackenzie, World Coal Association, EIA
CategoryEfficiency
RateCO2 Intensity
Coal
Consumption
Steam
Temperature
Advanced
ultra-
supercritical
More than
45%
670-740
g CO2/ kWh
290-320
g/kWh700oC+
Ultra-
supercriticalUp to 45%
740-800
g CO2/ kWh
320-340
g/kWh600oC+
Supercritical Up to 42%800-880
g CO2/ kWh
340-380
g/kWh
Approx.
550oC-600oC
Subcritical Up to 38%≥880
g CO2/ kWh
≥380
g/kWh<550oC
US HELE Power Plant Definition (EIA)
Ultra-supercritical Power Plants
Supercritical Power Plants (Examples)
Subcritical Power Plants (Examples)
Advanced ultra-supercritical Power Plants
(None)
John W Turk Jr 1 Arkansas 614 MW Start-up in 2012
Longview Power LLC 1 West Virginia 700 MW Start-up in 2011
Trimble County 2 Kentucky 747 MW Start-up in 2011
Iatan 2 Missouri 850 MW Start-up in 2010
Sandy Creek Energy Texas 927 MW Start-up in 2013
Prairie State Station 1 Illinois 800 MW Start-up in 2012
Crystal River 2 Florida 494 MW Start-up in 1969
Seminole (FL) 2 Florida 660 MW Start-up in 1985
Cope ST1 South Carolina 420 MW Start-up in 1996
Trenton Channel 9 Michigan 518 MW Start-up in 1968
Cross 3 South Carolina 551 MW Start-up in 2007
Due to the difference in efficiency measurements, WM used
EIA supercritical and ultra-supercritical definitions1 for US
coal power plants and combined with Wood Mackenzie data
to conduct this analysis

woodmac.com
16
Agenda
Appendix
HELE Plant Definitions
Benchmarking of US HELE Plants
HELE Plant Case Studies
Scenario Analysis
woodmac.com
17
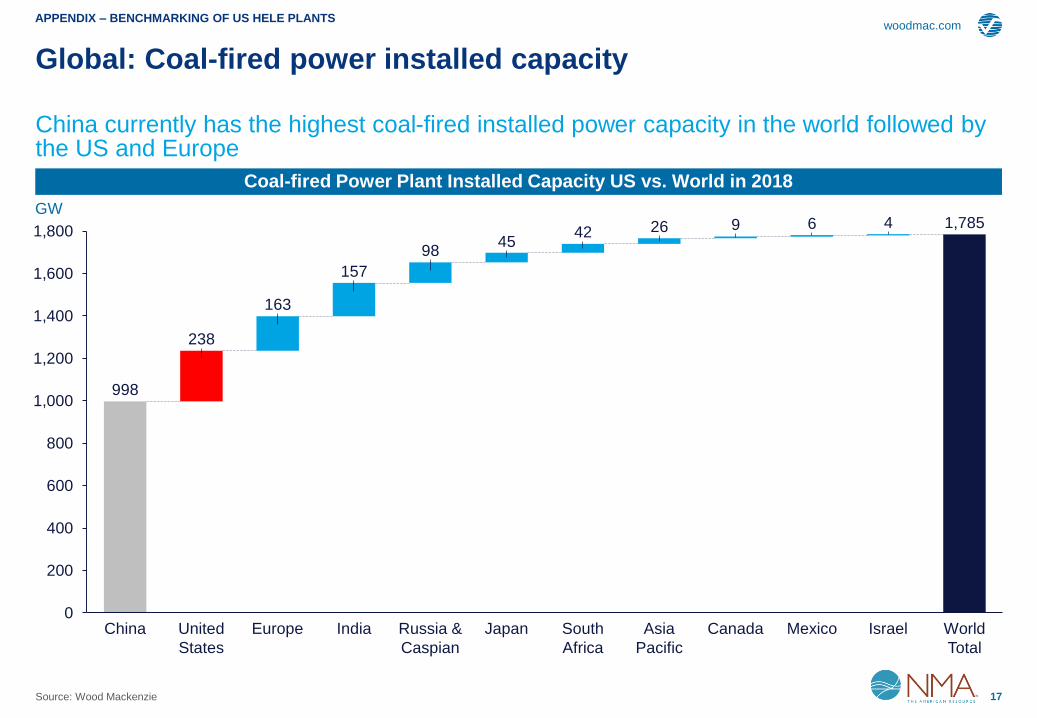
Global: Coal-fired power installed capacity
China currently has the highest coal-fired installed power capacity in the world followed by the US and Europe
APPENDIX – BENCHMARKING OF US HELE PLANTS
Source: Wood Mackenzie
Coal-fired Power Plant Installed Capacity US vs. World in 2018
998
1,785
238
163
157
9845
42 26 9 6 4
0
200
400
600
800
1,000
1,200
1,400
1,600
1,800
CanadaIndiaEuropeChina Japan South
Africa
Asia
Pacific
Mexico IsraelRussia &
Caspian
United
States
World
Total
GW

woodmac.com
18
Share of HELE plants in Total Coal-fired Installed Capacity (2018)
Today, HELE plants represent 43% of global coal-fired power plants capacity, including 16% ultra-supercritical or further advanced
APPENDIX – BENCHMARKING OF US HELE PLANTS
Note: 1. John W Turk Jr plant is the only Ultra-supercritical coal plant in the US, with 614 MW capacity. 2.West Europe includes UK, France, Belgium, Netherlands, Spain
Source: Wood Mackenzie, EIA
5%18%15%
23%6%
18%
27%
6%
27%
51%
58%
35%39%
35%
27%
10%
57%
26% 31% 29% 34%
59%72%
90%96% 98%
South
Korea
998
1%
World
0%
Western
EuropeJapan Germany
238
China USA Canada
4%
936
India
0%
Russia &
Caspian
100%
Mexico
100%
Israel
2,013GW 45 3443 159 98 6 4
Subcritical Supercritical Ultra-supercritical Advanced ultra-supercritical
43% 66% 28% 4%71% 2%69% 41% 10% 0% 0%
HELE Penetration
World-wide average HELE penetration at 43%
74%

woodmac.com
19
Coal-fired Power Plant Technology Share by State (2018)
64 360 0
Alabama
60 400 0
Arizona
8812 00
Arkansas
8317 0 0
Colorado
8218 0 0
Florida
4852
00
Georgia
7327 0 0
Illinois
57 430 0
Indiana
8416 0 0
Kansas
94
6 0
Kentucky
57 430 0
Maryland
96
4 0 0
Michigan
8317 00
Minnesota
928 0
Missouri
4258
0 0
New Mexico
59 4100
North Carolina
53 470 0
Ohio
8614 0 0
Oklahoma
59 410 0
Pennsylvania
87
13 0 0
South Carolina
8515 0 0
Tennessee
61 390 0
Texas
100
0 0 0
Virginia16
84
0 0
W. Virginia
62 380 0
Wisconsin
% of Installed Capacity
Note: (1) Supercritical and ultra-supercritical definitions are based on EIA categorization
Source: Wood Mackenzie, EIA
APPENDIX – BENCHMARKING OF US HELE PLANTS
Subcritical coal-fired power plants represent 72% of the total coal capacity; most states face a significant gap to achieving an efficient coal-fired power plant fleet
US: Coal-fired power plant share by technology by state
8416 0 0
Iowa
HELE Capacity
Only Subcritical Capacity
No Coal Capacity

woodmac.com
20Source: Wood Mackenzie, EIA
Top US HELE Coal-fired Power Plants by Efficiency
APPENDIX – BENCHMARKING OF US HELE PLANTS
US: Top operating coal-fired power plants by efficiency
John W. Turk, Jr coal power plant is the only ultra-supercritical plant in the US, but the Longview Power plant is the most efficient plant
Power Plant and Unit Status StateEIA HELE
CategoryCapacity MW
WM Estimated
Heat Rate Btu/kWh
WM Estimated
Efficiency %Start Year
Expected
Retirement Year
John W. Turk, Jr 1 Operating Arkansas Ultra-supercritical 614 9,000 38% 2012 2069
Longview Power LLC 1 Operating West Virginia Supercritical 700 8,600 40% 2011 2068
Trimble County 2 Operating Kentucky Supercritical 747 8,615 40% 2011 2068
Iatan 2 Operating Missouri Supercritical 850 8,845 39% 2010 2067
Sandy Creek Energy Station S01 Operating Texas Supercritical 927 8,850 39% 2013 2070
Prairie State Generating Stati PC1 Operating Illinois Supercritical 800 9,000 38% 2012 2069
Cliffside 6 Operating North Carolina Supercritical 800 9,000 38% 2012 2069
Prairie State Generating Stati PC2 Operating Illinois Supercritical 800 9,000 38% 2012 2069
Elm Road Generating Station 2 Operating Wisconsin Supercritical 634 9,027 38% 2011 2068
J K Spruce 2 Operating Texas Supercritical 780 9,060 38% 2010 2067
Marshall (NC-Catawba) 4 Operating North Carolina Supercritical 670 9,073 38% 1970 2027
Weston (WI) 4 Operating Wisconsin Supercritical 535 9,094 38% 2008 2065
Bull Run (TN) 1 Operating Tennessee Supercritical 888 9,095 38% 1967 2027
Morgantown Generating Plant ST2 Operating Maryland Supercritical 620 9,107 37% 1971 2028
Oak Grove (TX) OG1 Operating Texas Supercritical 817 9,130 37% 2009 2066
Oak Grove (TX) OG2 Operating Texas Supercritical 827 9,130 37% 2010 2067
Belews Creek 2 Operating North Carolina Supercritical 1,147 9,149 37% 1975 2032
Walter Scott Jr Energy Center 4 Operating Iowa Supercritical 816 9,229 37% 2007 2064
Rockport (IN) 1 Operating Indiana Supercritical 1,319 9,243 37% 1984 2026
Belews Creek 1 Operating North Carolina Supercritical 1,147 9,255 37% 1974 2031
HELE Coal-fired power plants
built in the last decade

woodmac.com
21
Agenda
Appendix
HELE Plant Definitions
Benchmarking of US HELE Plants
HELE Plant Case Studies
Scenario Analysis

woodmac.com
22
John W. Turk, Jr power plant is the only Ultra-supercritical plant in
the US
Fulton, Arkansas
Source: Wood Mackenzie, Southwestern Electric Power Company, WCA
American Electric Power operates the plant through its subsidiary Southwestern
Electric Power Co. (SWEPCO) with an ownership of 73%. Other holders include
Arkansas Electric Cooperative Corp 12%; East Texas Electric Cooperative 8%
and Oklahoma Municipal Power Authority 7%. Commissioning of the plant
culminated almost seven years of legal, regulatory, and construction work to bring
the $1.8 billion project to completion.
The plant started operations in December 2012 and is awarded for being one of
the cleanest and most efficient coal-fired power plants in the United States. Such
recognition is the result of applied air quality control systems that include a
selective catalytic reduction (SCR) system and low nitrogen oxide (NOx) burners
with close-coupled over-fire air for control of NOx; a dry flue gas desulfurization
(FGD) system and pulsejet fabric filter (baghouse) for sulfur dioxide and
particulate control; and activated carbon injection to reduce mercury emissions.
The plant burns low-sulphur subbituminous coal in a spiral-wound universal
pressure-type boiler, producing steam at 26.2 MPa (3789 psi) and 600o C.
Plant overview
United States: John W. Turk, Jr
Fuel Type Subbituminous Coal
Prime Mover Steam Turbine
Status Operating
Efficiency Type Ultra-supercritical
WM Estimated Heat Rate 9,000 Btu/kWh
Efficiency Rate 37.9%
John W. Turk, Jr 1
2018 installed capacity = 614 MW
Start-up year: 2012
APPENDIX – HELE PLANT CASE STUDY (US)

woodmac.com
23
Longview Power plant is regarded as one of the cleanest coal-fired
power plants in the United States
Source: Wood Mackenzie, Longview Power LCC
The construction of the plant began in January 2007, after approval of final
permits for the project. In 2011, operations started and Longview became the first
new power plant to initiate operation in West Virginia in 18 years.
The plant cost approximately $2.2Bn, and its ownership is divided as follows: Bain
Capital 35%, Kohlberg Kravis Roberts & Co (KKR) 30%, Centerbridge Partners
11%, American Securities 11%, Longview Power 10% and Affiliated Managers
Group 3%.
The plant uses best-in-class air pollution control systems that effectively maintain
emissions well below its environmental permit limits, which are among the most
stringent in the nation for coal plants. Furthermore, Longview’s CO2 output is
15%. It also was certified by the West Virginia Public Service Commission to
have the lowest CO2 emissions of any coal-fired plant in West Virginia.
Plant overview
United States: Longview Power LLC
Fuel Type Bituminous Coal
Prime Mover Steam Turbine
Status Operating
Efficiency Type Supercritical
WM Estimated Heat Rate 8,600 Btu/kWh
Efficiency Rate 39.7%
Longview Power LLC
2018 installed capacity = 700 MW
Start-up year: 2011
APPENDIX – HELE PLANT CASE STUDY (US)
Maidsville, West Virginia

woodmac.com
24
The Baima 600M WCFB (Unit 2) demonstration power station boiler was
independently developed and designed by Dongfang Boiler Group Co., Ltd. It is
the world's first 600MW supercritical circulating fluidized bed boiler with the
largest capacity of its class.
It combines the advantages of CFB combustion technology and supercritical
steam cycle. The design coal for the 600 MW SCCFB unit is a high-ash-content,
high-sulfur and low-grade lean coal. The ash content is 43.82%, the sulphur
content is 3.3% and the LHVaris 15173 kJ/kg. The desulfurization efficiency
reached 97.12%, and the NOx emission concentration was 111.94 mg/Nm3..
Sichuan Baima Unit 2 (CFB) started operation in 2000 and was the
first 600MW supercritical plant with the largest capacity of its class
Neijiang, Sichuan, China
Note: 1. The Sichuan Baima power station is a 900 MW complex constituted by two CFB demonstration units. The first is a 300 MW unit completed in 2006 and the second is
a 600 MW unit that started operations in 2013.
Source: Wood Mackenzie, China Energy Investment Corporation
Plant overview
China: Sichuan Baima Unit 2
Start Year 2000
Status Operating
Main Fuel Type Hard Coal
Main Steam Temperature 571o C
Efficiency Type Supercritical
Efficiency Rate -
Sichuan Baima Unit 2
Current capacity = 600 MW
APPENDIX – HELE PLANT CASE STUDY (CHINA)
woodmac.com
25
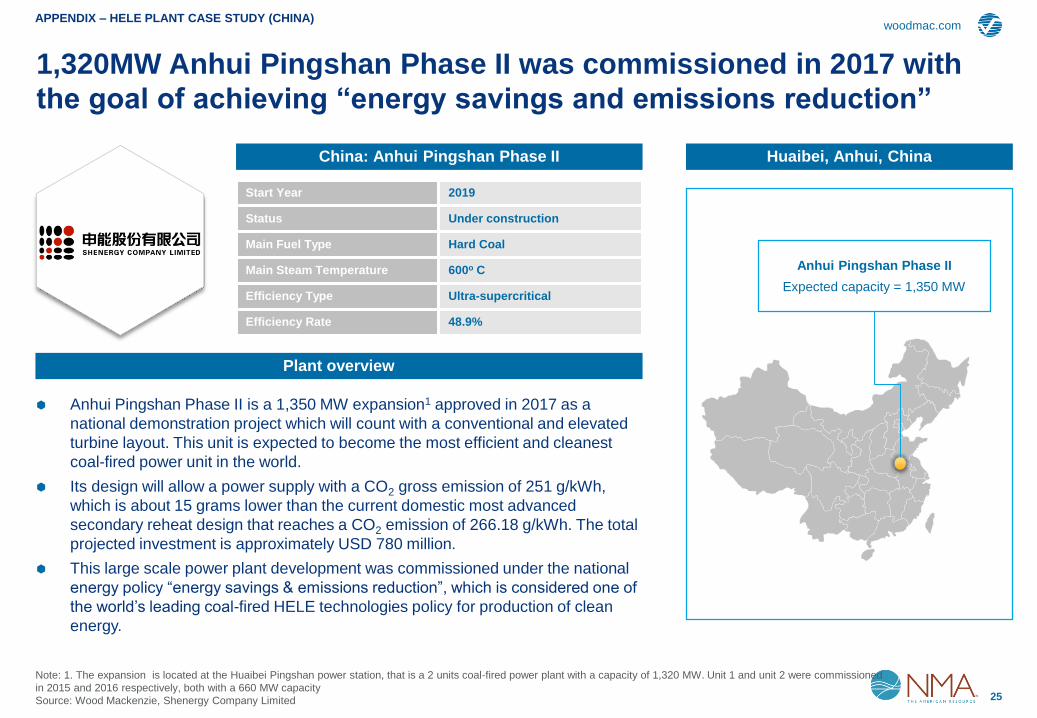
1,320MW Anhui Pingshan Phase II was commissioned in 2017 with
the goal of achieving “energy savings and emissions reduction”
Huaibei, Anhui, China
Note: 1. The expansion is located at the Huaibei Pingshan power station, that is a 2 units coal-fired power plant with a capacity of 1,320 MW. Unit 1 and unit 2 were commissioned
in 2015 and 2016 respectively, both with a 660 MW capacity
Source: Wood Mackenzie, Shenergy Company Limited
Anhui Pingshan Phase II is a 1,350 MW expansion1 approved in 2017 as a
national demonstration project which will count with a conventional and elevated
turbine layout. This unit is expected to become the most efficient and cleanest
coal-fired power unit in the world.
Its design will allow a power supply with a CO2 gross emission of 251 g/kWh,
which is about 15 grams lower than the current domestic most advanced
secondary reheat design that reaches a CO2 emission of 266.18 g/kWh. The total
projected investment is approximately USD 780 million.
This large scale power plant development was commissioned under the national
energy policy “energy savings & emissions reduction”, which is considered one of
the world’s leading coal-fired HELE technologies policy for production of clean
energy.
Plant overview
China: Anhui Pingshan Phase II
Start Year 2019
Status Under construction
Main Fuel Type Hard Coal
Main Steam Temperature 600o C
Efficiency Type Ultra-supercritical
Efficiency Rate 48.9%
Anhui Pingshan Phase II
Expected capacity = 1,350 MW
APPENDIX – HELE PLANT CASE STUDY (CHINA)

woodmac.com
26
2,100 MW Tachibana-Wan power plant has 2 ultra-supercritical units,
with the largest single-unit output in Japan of 1,050 MW
Anan, Tokushima Prefecture, Japan
Source: Wood Mackenzie, J Power
It is a coal-fired power station that comprises two 1,050 MW units that have been
in operation since 2000.
The power station’s technology supports a temperature of 600o C for main steam,
610o C for reheat steam and a pressure of up to 25.0 Mpa.
The single-unit output of 1,050 MW is the largest in the country and the electricity
generated is sent not only to Shikoku but also to the Kansai, China and Kyushu
districts.
The applied technologies include large-capacity MPS-300 pulverisers, large-
capacity low-NOx Hitachi NR2-burners, spirally wound water-wall of multi-ribbed
tubes, high-strength austenitic steel tubes, high-strength ferritic steel piping, multi-
stage super-heater spray systems, large capacity steam-water separators.
Plant overview
Japan: Tachibana-wan Power Station Unit 1 and 2
Start Year 2000
End Year Operating
Main Fuel Type Bituminous Coal
Processing Type 610o C
Efficiency Type Ultra-supercritical
Efficiency 45.0%
Tachibana-wan power station
Unit 1 and 2
Current capacity = 2,100 MW
APPENDIX – HELE PLANT CASE STUDY (JAPAN)

woodmac.com
27
It is a proposed USC 650 MW coal-fired power plant with a projected
commissioning date of 2020-2021 and is currently under construction at TEPCO's
2,000 MW Hitachinaka Thermal Power Station.
The project will be operated by Hitachinaka Generation Co., Inc. which its
ownership is divided between Chubu Electric Power (96.55%) and Tokyo Electric
Power Co. TEPCO (3.45%).
Japan’s Ministry of Economy, Trade and Industry (METI) and Ministry of
Environment (MoE) published in April 2013 the “Best Available Technology (BAT)”.
This guideline is based on best practice for thermal power plants to control GHG
emission and no new installation or plan can be approved unless power
producers meet these standards.
The project assessment speeding process and posterior endorsement of the unit
by Japan’s environment minister Tamayo Marukawa in 2016, came as result of
the USC technology that the station will apply, which meet BAT requirements.
.
Hitachinaka Kyodo plant was one of several new proposed HELE
plants due to nuclear retirements after the Fukushima earthquake
Okai-mura, Naka-gun, Ibaraki, Japan
Source: Wood Mackenzie, Chubu Electric Power, Bloomberg, Sourcewatch
Plant overview
Japan: Hitachinaka Kyodo Power Station Unit 1
Start Year 2020-2021
Status Under construction
Main Fuel Type Hard Coal
Main Steam Temperature 600o C
Efficiency Type Ultra-supercritical
Efficiency Rate 43.0 %
Hitachinaka Kyodo Unit 1
Expected capacity = 650 MW
APPENDIX – HELE PLANT CASE STUDY (JAPAN)

woodmac.com
28
Wilhelmshaven power plant is one of the most modern coal-fired
plants in Germany
Wilhelmshaven, Germany
Source: Wood Mackenzie, BKW Energie AG
BKW has a 33% holding in a coal-fired power plant currently operated by Engie
(previously known as GDF Suez) in north Germany. This plant has a gross
installed capacity of 800 MW. With a projected thermal efficiency of over 46%
Wilhelmshaven power plant is one of the most technologically advanced facilities
in Europe. It produces electricity with significantly lower CO2 emissions than
existing coal-fired power plants that achieve an efficiency of almost 40%.
The plant can be used very flexibly and is located right on the north German
coast, a fact which has two distinct advantages: first, the plant can easily be
supplied by sea with coal from all over the world; second, it can be cooled by sea
water, thus helping to protect local freshwater resources. Operating figures and
data for the plant are as much as 50% below Germany’s strict environmental
limits.
Plant overview
Germany: Wilhelmshaven Power Plant
Start Year 2014
End Year 2037
Fuel Type Hard Coal
Processing Type PCC
Efficiency Type Advanced ultra-supercritical
Efficiency 46%
Wilhelmshaven_2
2018 installed capacity = 800 MW
APPENDIX – HELE PLANT CASE STUDY (GERMANY)

woodmac.com
29
Tiefstack HKW power plant is a cogeneration power plant that
achieves advanced ultra-supercritical efficiency
Hamburg, Germany
Source: Wood Mackenzie, Vattenfall
The Tiefstack cogeneration plant covers almost half of Hamburg's total district
heating needs. The power plant is located on a historical site at the point where
Hamburgische Electricitäts-Werke AG opened its first major power plant in 1917.
The current power plant was put into operation in 1993. In 2009 Tiefstack's
electricity and heat capacity was expanded by a natural gas-fired combined cycle
power plant.
Cogeneration: The baseload unit uses hard coal as fuel, whereas two heating
boilers for peak-load demand use natural gas and oil.
The power plant is equipped for both base load and peak load production. The
power plants are equipped with state-of-the-art flue gas cleaning systems. These
ensure that the flue gases emitted from the 120-meter-high chimney fall well
below the permissible limit values.
Plant overview
Germany: Tiefstack HKW Power Plant
Start Year 2009
End Year 2038
Main Fuel Type Hard Coal
Processing Type CHP
Efficiency Type Advanced ultra-supercritical
Efficiency 55%
Tiefstack HKW
2018 installed capacity = 200 MW
APPENDIX – HELE PLANT CASE STUDY (GERMANY)
woodmac.com
30
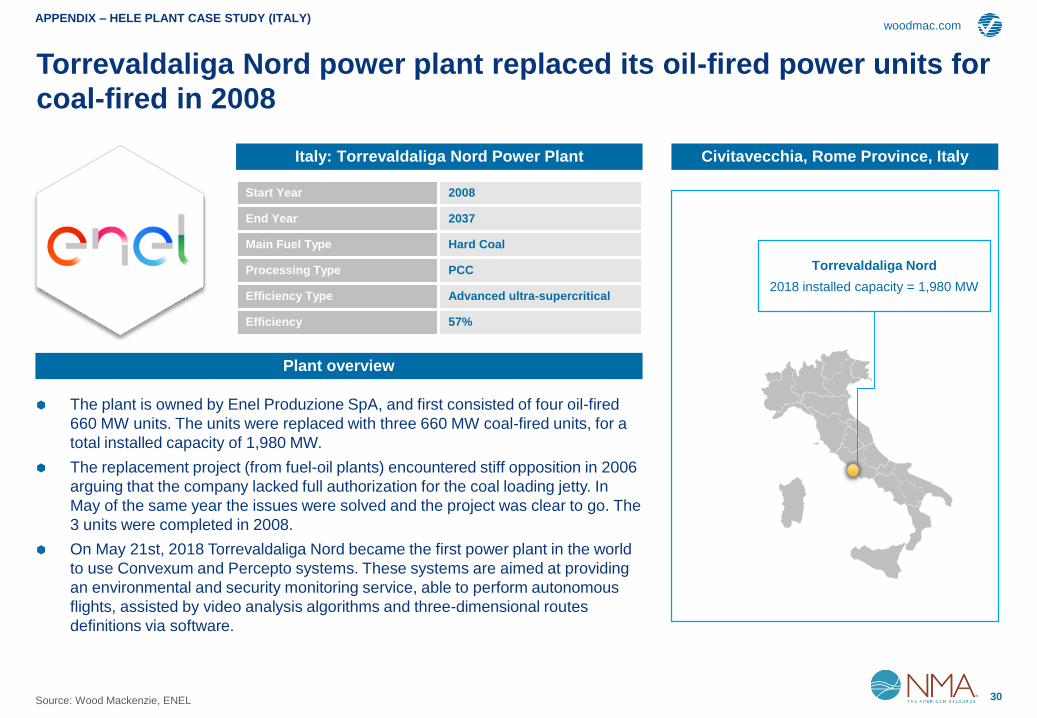
Torrevaldaliga Nord power plant replaced its oil-fired power units for
coal-fired in 2008
Civitavecchia, Rome Province, Italy
Source: Wood Mackenzie, ENEL
The plant is owned by Enel Produzione SpA, and first consisted of four oil-fired
660 MW units. The units were replaced with three 660 MW coal-fired units, for a
total installed capacity of 1,980 MW.
The replacement project (from fuel-oil plants) encountered stiff opposition in 2006
arguing that the company lacked full authorization for the coal loading jetty. In
May of the same year the issues were solved and the project was clear to go. The
3 units were completed in 2008.
On May 21st, 2018 Torrevaldaliga Nord became the first power plant in the world
to use Convexum and Percepto systems. These systems are aimed at providing
an environmental and security monitoring service, able to perform autonomous
flights, assisted by video analysis algorithms and three-dimensional routes
definitions via software.
Plant overview
Italy: Torrevaldaliga Nord Power Plant
Start Year 2008
End Year 2037
Main Fuel Type Hard Coal
Processing Type PCC
Efficiency Type Advanced ultra-supercritical
Efficiency 57%
Torrevaldaliga Nord
2018 installed capacity = 1,980 MW
APPENDIX – HELE PLANT CASE STUDY (ITALY)

woodmac.com
31
Agenda
Appendix
HELE Plant Definitions
Benchmarking of US HELE Plants
HELE Plant Case Studies
Scenario Analysis
woodmac.com
32
woodmac.com
0
5
10
15
20
20302015 20252020 2035
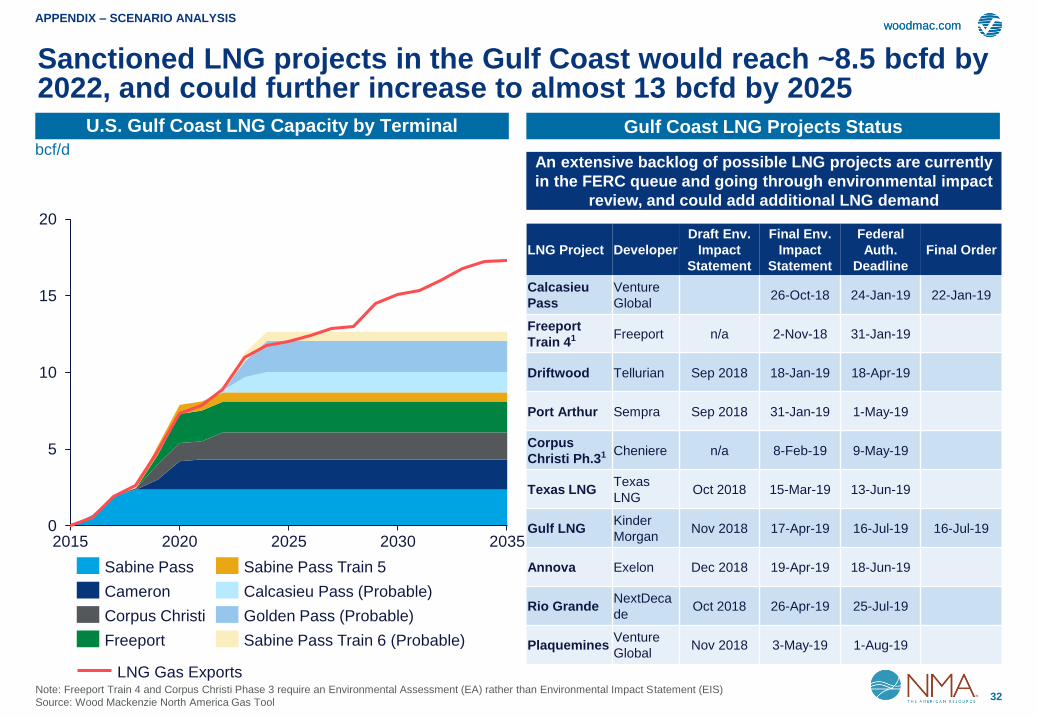
Sanctioned LNG projects in the Gulf Coast would reach ~8.5 bcfd by 2022, and could further increase to almost 13 bcfd by 2025
Golden Pass (Probable)
Sabine Pass
Corpus Christi
Sabine Pass Train 6 (Probable)
Cameron
Freeport
Sabine Pass Train 5
Calcasieu Pass (Probable)
Note: Freeport Train 4 and Corpus Christi Phase 3 require an Environmental Assessment (EA) rather than Environmental Impact Statement (EIS)
Source: Wood Mackenzie North America Gas Tool
LNG Project Developer
Draft Env.
Impact
Statement
Final Env.
Impact
Statement
Federal
Auth.
Deadline
Final Order
Calcasieu
Pass
Venture
Global26-Oct-18 24-Jan-19 22-Jan-19
Freeport
Train 41 Freeport n/a 2-Nov-18 31-Jan-19
Driftwood Tellurian Sep 2018 18-Jan-19 18-Apr-19
Port Arthur Sempra Sep 2018 31-Jan-19 1-May-19
Corpus
Christi Ph.31 Cheniere n/a 8-Feb-19 9-May-19
Texas LNGTexas
LNGOct 2018 15-Mar-19 13-Jun-19
Gulf LNGKinder
MorganNov 2018 17-Apr-19 16-Jul-19 16-Jul-19
Annova Exelon Dec 2018 19-Apr-19 18-Jun-19
Rio GrandeNextDeca
deOct 2018 26-Apr-19 25-Jul-19
PlaqueminesVenture
GlobalNov 2018 3-May-19 1-Aug-19
An extensive backlog of possible LNG projects are currently
in the FERC queue and going through environmental impact
review, and could add additional LNG demand
LNG Gas Exports
APPENDIX – SCENARIO ANALYSIS
U.S. Gulf Coast LNG Capacity by Terminal Gulf Coast LNG Projects Statusbcf/d

woodmac.comwoodmac.com
33
Mexico-US Gas Pipeline Capacity and Exports
4
2
0
6
12
10
16
8
14
203020202010 2015 2025 2035
+5.4+0.8
New projects are set to anticipate the expanding U.S. gas volumes, adding ~3 bcfd of cross-border pipeline capacity in 2019
Declines in US imports are
uncertain, dependent on Mexico
unconventional oil development
Source: Wood Mackenzie North America Gas Tool
South Texas US Export to MexicoCalifornia West Texas Noroeste
Sur de Texas comes
online in 2019
APPENDIX – SCENARIO ANALYSIS
bcf/d

woodmac.com
34
woodmac.com
The fuel consumption from a massive buildout of industrial plants, pipelines and LNGs drives the US Gulf Coast gas demand
Source: Wood Mackenzie North America Gas Tool
12
8
2
0
6
4
10
14
16
18
20
22
24
204020352018 2020 2025 2030
1.9%
Industrial Consumption Gas Losses
2.0
1.5
0.0
2.5
0.5
1.0
3.0
3.5
4.0
202520232019202020212022 2024 20262027202820292030
Ethylene
Methanol
Fertilizers
Speculative (Mostly Chemical)
Other Chemicals
Gas Losses include:
1) Lease and plant fuel
2) Pipe fuel or transmission losses
3) LNG liquefaction losses
APPENDIX – SCENARIO ANALYSIS
Texas/Louisiana Industrial Related Demand Forecast Gulf Coast Industrial Project Capacity Additions1
bcf/d bcf/d

woodmac.com
35
Forecast
0
2
4
6
8
10
12
14
In the alternative scenario, Henry Hub price forecast is doubled as a result of potential gas supply restrictions and demand upside
APPENDIX – SCENARIO ANALYSIS
US Natural Gas Production and Consumption vs Henry Hub Price – Historical and Forecasts
0
10
20
30
40
50
60
70
80
90
100
110
120
130
bcf/d
Production Consumption
2000 2005 2010 2015 2020 2025 2030 2035
Henry Hub Price 2X Henry Hub Price - Gas Constrained Scenario
$/mmbtu, nominal
Henry Hub price reached almost
$9/mmbtu in 2005-2008 period, with the
market expectation that domestic gas
production continued to shrink and had
to rely on gas imports, with several LNG
import projects proposed
Source: EIA, Wood Mackenzie
In the base case, WM forecast gas price to be flat in the next five years
and then increases modestly (to certain degree due to inflation), primarily
driven by growing gas production from “unlimited” shale reserves
However, domestic gas supply is subject to uncertainty, e.g. well performance,
government regulations and global gas demand… and these could result in gas
shortfall and increase of henry hub price back to the 2005-2008 level

woodmac.com
36
In California, the aggressive adoption of renewables has already turned the load profile to one with drastic “duck curve”
Jan Feb Mar Apr May Jun Jul Aug Sep Oct Nov Dec
(5)
0
5
10
15
20
Ho
url
y L
oa
d / G
en
era
tio
n (
Av
g.
GW
)
Net Trade (+ imports, - exports) Electric Vehicles Solar Distributed
Solar Utility Wind Other
Hydro Energy Storage Oil, Coal and Nuclear
Gas Gross Load (before DG and EV) Market Load (after DG and EV)
APPENDIX – SCENARIO ANALYSIS
CAISO SP15 Monthly “Average Day” Hourly Energy Balance – 2018
Source: Wood Mackenzie

woodmac.com
37
Renewables expansion puts pressure on the grid; the transformation depends on successful integration and energy storage technology
Jan Feb Mar Apr May Jun Jul Aug Sep Oct Nov Dec
(10)
(5)
0
5
10
15
20
25
30
35
Ho
url
y L
oa
d / G
en
era
tio
n (
Av
g.
GW
)
Net Trade (+ imports, - exports) Electric Vehicles Solar Distributed
Solar Utility Wind Other
Hydro Energy Storage Oil, Coal and Nuclear
Gas Gross Load (before DG and EV) Market Load (after DG and EV)
APPENDIX – SCENARIO ANALYSIS
CAISO SP15 Monthly “Average Day” Hourly Energy Balance – 2040
Source: Wood Mackenzie

woodmac.com
38
This not only poses questions on grid reliability, but also creates significant fluctuation of energy price throughout the day
0
5
10
15
20
25
30
35
40
45
50
55
60
65
0
10
20
30
40
50
60
70
80
90
100
0 2 4 6 8 10 12 14 16 18 20 22 24
Hour
Wind Production Profile (LHS)
2040 Energy Price (RHS)Solar Production File (LHS)
2018 Energy Price (RHS)
16.1$/MWh
21.8$/MWh
Wind production is
assumed to be 30%~50% of
the facility’s name plate
capacity
Wind peak production is
reached when the energy
price is the highest, at 8-
9pm
Significant addition of utility
scale solar capacity is
expected to further diverge
the low and peak energy
pricing
APPENDIX – SCENARIO ANALYSIS
CAISO SP15 “Average Day” Wind/Solar Production Profile vs Energy Price
Source: Wood Mackenzie, CAISO
% of Total Capacity Utilized Average Energy Price
($/MWh, Real 2018)

woodmac.com
39
New HELE Capacity Addition in the US Capital Investment for HELE Power Plant
Total US Power Generation from Coal Plants Coal Consumption in the US Power Sector
GW
50
0
10
20
40
30
60
70
80
2018-2020 2021-2025
49
2026-2030 2031-2035
46
78
39 39
28
79
27
Scenario 2Scenario 1 Scenario 5Scenario 3 Scenario 4
$Billion, Real 2018
PWh Billion metric ton
In the alternative scenarios, competitive coal power plant economics stimulate new HELE capacity and higher coal consumption in the US
Source: Wood Mackenzie
APPENDIX – SCENARIO ANALYSIS
3
146
3
146
26
44
1628
45
16
0
20
40
60
80
100
120
140
160
2018-2020 2021-2025 2026-2030 2031-2035
0
10
2
4
6
8
12
2018-2020 2021-2025 2026-2030 2031-2035
4
6
0
2
1
3
5
2018-2020 2021-2025 2026-2030 2031-2035
woodmac.com
40
Disclaimer
Strictly Private & Confidential
These materials, including any updates to them, are published by and remain subject to the copyright of the Wood Mackenzie group ("Wood
Mackenzie"), and are made available to clients of Wood Mackenzie under terms agreed between Wood Mackenzie and those clients. The use of
these materials is governed by the terms and conditions of the agreement under which they were provided. The content and conclusions
contained are confidential and may not be disclosed to any other person without Wood Mackenzie's prior written permission. Wood Mackenzie
makes no warranty or representation about the accuracy or completeness of the information and data contained in these materials, which are
provided 'as is'. The opinions expressed in these materials are those of Wood Mackenzie, and nothing contained in them constitutes an offer to
buy or to sell securities, or investment advice. Wood Mackenzie's products do not provide a comprehensive analysis of the financial position or
prospects of any company or entity and nothing in any such product should be taken as comment regarding the value of the securities of any
entity. If, notwithstanding the foregoing, you or any other person relies upon these materials in any way, Wood Mackenzie does not accept, and
hereby disclaims to the extent permitted by law, all liability for any loss and damage suffered arising in connection with such reliance.
Copyright © 2018, Wood Mackenzie Limited. All rights reserved. Wood Mackenzie is a Verisk business.

woodmac.com
Wood Mackenzie™, a Verisk business, is a trusted intelligence provider, empowering decision-makers with unique insight
on the world’s natural resources. We are a leading research and consultancy business for the global energy, power and
renewables, subsurface, chemicals, and metals and mining industries. For more information visit: woodmac.com
WOOD MACKENZIE is a trademark of Wood Mackenzie Limited and is the subject of trademark registrations and/or
applications in the European Community, the USA and other countries around the world.
Europe
Americas
Asia Pacific
Website
+44 131 243 4400
+1 713 470 1600
+65 6518 0800
www.woodmac.com


