1 Outlook and Market Review – Fourth Quarter 2014 Real GDP grew only 2.2% in the fourth quarter of 2014 according to the revised estimate released by the Bureau of Economic Analysis. The original estimate of 2.6% was revised downward. The revised third quarter GDP growth rate was a robust 5%. On an annual basis real GDP continues to grow at a rate well below the long run trend rate of 3.2%. Real GDP increased 2.3% for all of 2014 compared with an increase of 2.2% in 2013. While the U.S. economy continues to improve slowly, the global economy is weak with Japan and most of Europe in recession. Consumer spending in the U.S. was a bright spot in the fourth quarter. Consumers have more disposable income due to low energy prices and more available jobs. Low inflation has helped consumers offset low wage growth and consumer confidence is at a seven year high. The saving rate slipped to 4.6% as spending in the fourth quarter of 2014 grew at the fastest rate in more than eight years. The unemployment rate (U-3) ticked up to 5.7% but an increase in the labor participation rate to 62.9% was largely responsible for reversal in the unemployment rate trend. Going forward, there will likely be more workers returning to the labor force, making it harder to achieve reductions in the unemployment rate. Wages have started to increase but the strength of wage gains depends on the offsetting increases in the labor pool. It will take time before a full employment labor force will put significant pressure on compensation and consumer income. Low inflation and low interest rates are forecasted for 2015, even though there will be upward pressure on short term rates in the second half of the year. Fed policy will seek neutral ground while central banks in most other developed countries are using quantitative easing to combat deflation. Global “deflationary” pressure should keep U.S. inflation low as the strong dollar keeps imports relatively cheap and domestic prices stays in line with low international prices. Private investment spending is modest and is not expected to pick up significantly. Better returns on business investment will likely occur in merger and acquisition activity. The future of the Eurozone may be a significant topic in 2015. The shift to a more leftist political leadership in Greece last month threatens fulfillment of agreements for Greek debt repayment of 320 billion euros to foreign lenders. The table below offers a brief summary of 2015 expectations relative to 2014 performance. Item Expectations for 2015 Performance for 2014 Real GDP 3% 2.3% Unemployment 5.3% @ year end 5.6% @ year end Interest Rates-10 yr. note 2.4% @ year end 2.12% @ year end Inflation 2% 0.9% Crude Oil bbl. $70-$75 end spring $53 end of 2014 Trade Deficit $550 billion $505 billion
Transcript
1
Outlook and Market Review – Fourth Quarter 2014
Real GDP grew only 2.2% in the fourth quarter of 2014 according to the revised estimate released by the Bureau of Economic Analysis. The original estimate of 2.6% was revised downward. The revised third quarter GDP growth rate was a robust 5%. On an annual basis real GDP continues to grow at a rate well below the long run trend rate of 3.2%. Real GDP increased 2.3% for all of 2014 compared with an increase of 2.2% in 2013. While the U.S. economy continues to improve slowly, the global economy is weak with Japan and most of Europe in recession.
Consumer spending in the U.S. was a bright spot in the fourth quarter. Consumers have more disposable income due to low energy prices and more available jobs. Low inflation has helped consumers offset low wage growth and consumer confidence is at a seven year high. The saving rate slipped to 4.6% as spending in the fourth quarter of 2014 grew at the fastest rate in more than eight years. The unemployment rate (U-3) ticked up to 5.7% but an increase in the labor participation rate to 62.9% was largely responsible for reversal in the unemployment rate trend. Going forward, there will likely be more workers returning to the labor force, making it harder to achieve reductions in the unemployment rate. Wages have started to increase but the strength of wage gains depends on the offsetting increases in the labor pool. It will take time before a full employment labor force will put significant pressure on compensation and consumer income.
Low inflation and low interest rates are forecasted for 2015, even though there will be upward pressure on short term rates in the second half of the year. Fed policy will seek neutral ground while central banks in most other developed countries are using quantitative easing to combat deflation. Global “deflationary” pressure should keep U.S. inflation low as the strong dollar keeps imports relatively cheap and domestic prices stays in line with low international prices. Private investment spending is modest and is not expected to pick up significantly. Better returns on business investment will likely occur in merger and acquisition activity.
The future of the Eurozone may be a significant topic in 2015. The shift to a more leftist political leadership in Greece last month threatens fulfillment of agreements for Greek debt repayment of 320 billion euros to foreign lenders.
The table below offers a brief summary of 2015 expectations relative to 2014 performance.
Item Expectations for 2015 Performance for 2014 Real GDP 3% 2.3% Unemployment 5.3% @ year end 5.6% @ year end Interest Rates-10 yr. note 2.4% @ year end 2.12% @ year end Inflation 2% 0.9% Crude Oil bbl. $70-$75 end spring $53 end of 2014 Trade Deficit $550 billion $505 billion
2
Fed Policy – Flatter Yield Curve In the last policy meeting, Federal Reserve officials signaled their intent to keep short-term interest rates unchanged until mid-2015. The consensus view is that the Fed will begin a series of gradual increases in the fed funds rate target at the end of June with a year-end target rate of about 50 basis points, unless there is a significant economic slowdown. Figure 1 below illustrates three different forecasts of the time path for the fed fund rate. The Goldman Sachs estimate is generated with proprietary methods. The Fed forecast is taken from a “median” technique based on Fed estimates. The third technique is taken from market pricing of Eurodollar futures pricing. Goldman’s forecast calls for a much higher increase of the fed fund target in 2015 with a higher path resulting in a 3.75% rate in 2019. The U.S. economy would need to improve significantly to make this forecast likely. Given the low inflation pressures globally, such a “restrictive” move in monetary policy seems out of synch with current conditions. All three forecasts are similar in the near term but deviate significantly beyond 2015. The market forecast (dotted line) is likely to be the most realistic path for the fed fund rate given global economic conditions.
Figure 1. Projected Path of the U.S. Fed Fund Rate – Three Forecasts
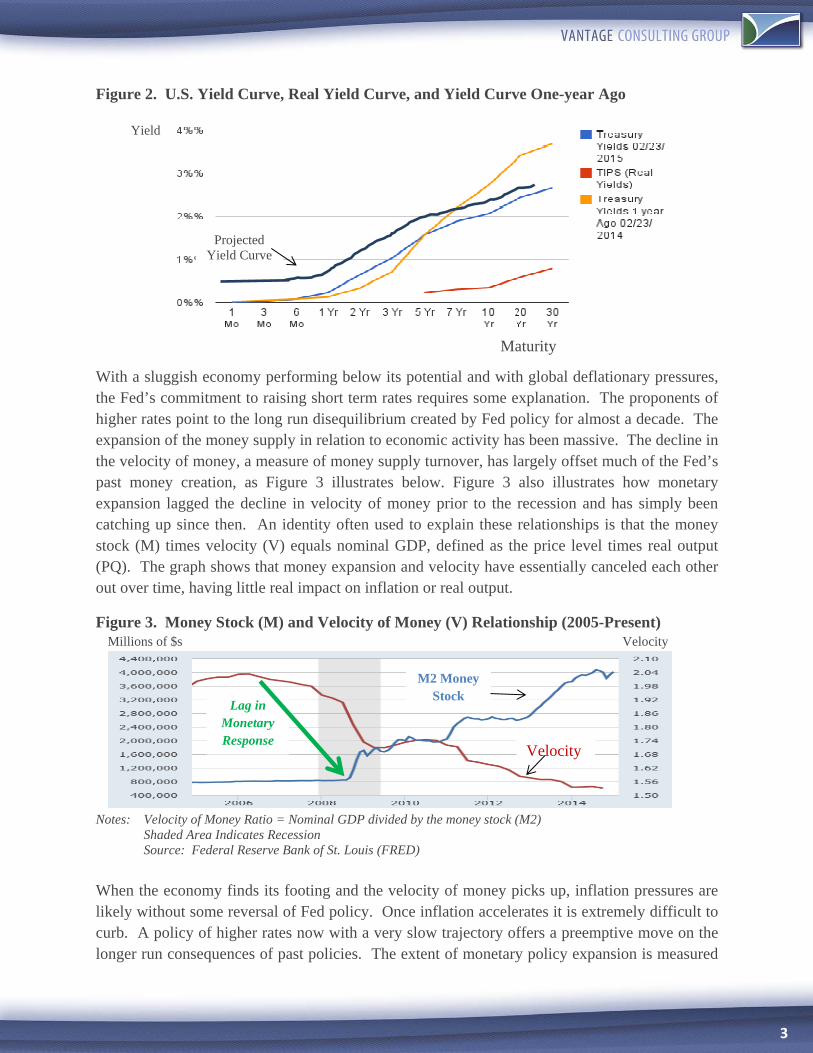
Estimate by Goldman Sachs Feds Summary Estimate (Mid-2019 Fed Projection – 5th lowest point) Eurodollar Futures – Fed Fund Basis Swap The Fed clearly dictates short term rates but longer term rates are affected by many factors that are out of the Fed’s control. In the Outlook and Market Review for the third quarter of 2014 we presented the case for downward pressures on longer term rates from the strong dollar, low interest rates in other countries, risk aversion, reduced supply of government bonds, and low inflation pressures. While downward pressures on long term rates will eventually wane, most analysts do not expect strong enough economic growth to push long term rates up much. The general expectation is that the 10-year Treasury will be about 30 to 40 basis points higher at the end of 2015. These overall pressures are likely to result in a flatter yield curve, which is also fully consistent with an expectation of lower inflation rates. Figure 2 below illustrates the current yield curve at the end as of February 23, 2015 along with the TIPS yield curve, representing real yields net of inflation, and the Treasury yield curve one-year ago. With low inflation the “real” yield curve based on TIPs will not move up much in 2015.
%
3
Figure 2. U.S. Yield Curve, Real Yield Curve, and Yield Curve One-year Ago
With a sluggish economy performing below its potential and with global deflationary pressures, the Fed’s commitment to raising short term rates requires some explanation. The proponents of higher rates point to the long run disequilibrium created by Fed policy for almost a decade. The expansion of the money supply in relation to economic activity has been massive. The decline in the velocity of money, a measure of money supply turnover, has largely offset much of the Fed’s past money creation, as Figure 3 illustrates below. Figure 3 also illustrates how monetary expansion lagged the decline in velocity of money prior to the recession and has simply been catching up since then. An identity often used to explain these relationships is that the money stock (M) times velocity (V) equals nominal GDP, defined as the price level times real output (PQ). The graph shows that money expansion and velocity have essentially canceled each other out over time, having little real impact on inflation or real output.
Figure 3. Money Stock (M) and Velocity of Money (V) Relationship (2005-Present) Millions of $s Velocity
Notes: Velocity of Money Ratio = Nominal GDP divided by the money stock (M2)
Shaded Area Indicates Recession Source: Federal Reserve Bank of St. Louis (FRED)
When the economy finds its footing and the velocity of money picks up, inflation pressures are likely without some reversal of Fed policy. Once inflation accelerates it is extremely difficult to curb. A policy of higher rates now with a very slow trajectory offers a preemptive move on the longer run consequences of past policies. The extent of monetary policy expansion is measured
Lag in Monetary Response
Projected Yield Curve
M2 Money Stock
Velocity
Maturity
Yield
4
relative to a “neutral” position on interest rates, defined as a long term rate equal to the GDP growth rate plus expected inflation. Currently, this would be approximately 4.5%. Given current 10-year Treasury yields just above 2.3%, monetary expansion is still at work to support rates about 220 basis points below a neutral policy. This expansionary gap has been long standing and will need to be corrected eventually before “normal” economic growth in the 3.2% to 3.5% range is established.
Deflation Contagion – Global Adjustments from Falling Prices Anemic economic growth and low inflation in Europe has now turned to outright deflation. In December the Eurozone’s year-to-year “inflation rate” for 2014 was -.2% coupled with an average unemployment rate in the Eurozone of 11.5%. The negative inflation rate is the first since 2009. An inflation rate of 2% is generally accepted as a healthy benchmark consistent with well-functioning markets. The Eurozone is not alone in the deflation experience. Of the 90 world economies that are tracked, about one-fourth have inflation rates below 1% with about half of those in deflation.
Deflationary Cycle
With deflation, general price levels actually fall due to insufficient demand. Deflation is more than just a symptom of a depressed economy; it is also a cause of further depression. Business profits decline with deflation as both sales and sales prices fall. Wages do not tend to fall as fast as prices, squeezing profit margins and encouraging reductions in employment. Purchases are delayed since lower prices can be obtained by waiting and production must be scaled back. Layoffs and unemployment occur which further reduces the ability to purchase goods. Borrowers are hurt by deflation since loans must be repaid with currency that is worth more at lower prices, causing a reduction in borrowing that supports spending. Historically, the Great Depression and the severe stagnation in Japan over the last two decades are examples of how a deflationary spiral destroys wealth and lowers living standards.
Quantitative easing throughout Europe and Japan is designed to flood the markets with currency to generate spending due to liquidity, easy credit, and lower interest rates. It is not clear whether these massive monetary responses to deflation, which will be about 1.1 trillion euros for the Eurozone, will have the desired effects. For Europe, it can be argued that monetary easing is coming very late, given the prolonged economic weakness there. In the U.S. the three rounds of quantitative easing had mixed results and any real stimulation of economic activity occurred with a significant lag. History suggests that monetary easing will not generate a quick turnaround even when it is initiated promptly. Figure 4 below shows the relationship between quantitative easing, the 10-year Treasury Yield, and the $/Euro exchange rate since the Great Recession.
5
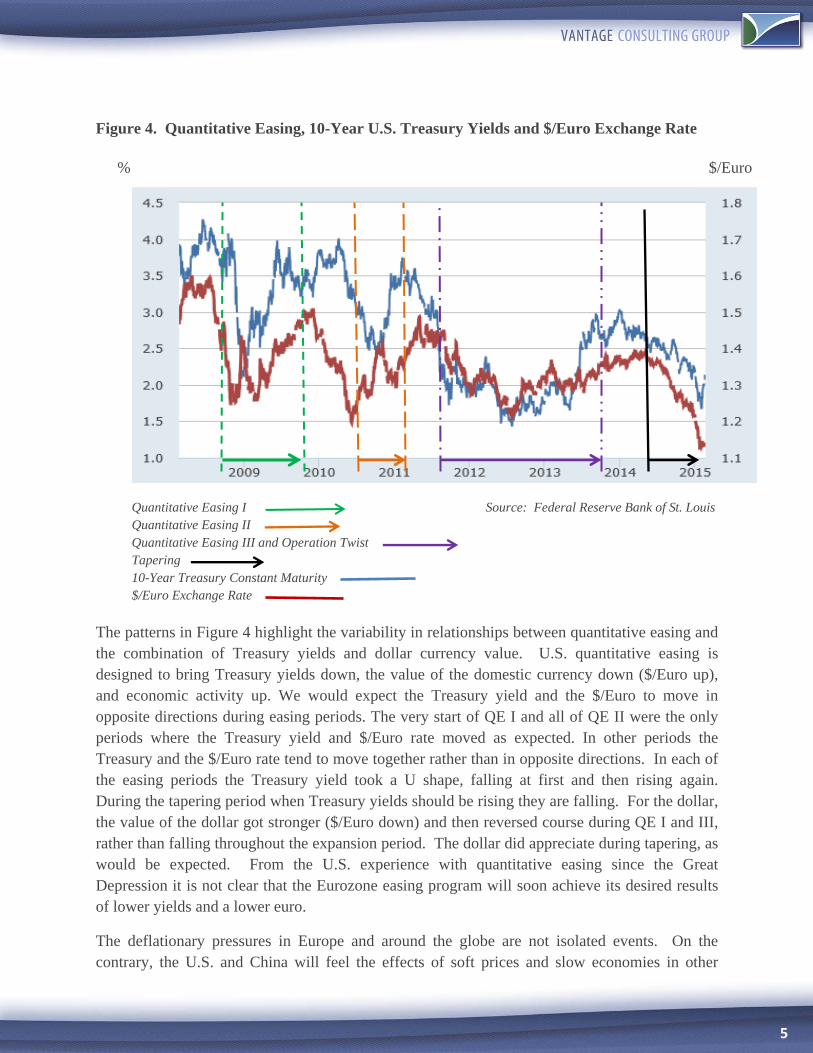
Figure 4. Quantitative Easing, 10-Year U.S. Treasury Yields and $/Euro Exchange Rate
Quantitative Easing I Source: Federal Reserve Bank of St. Louis Quantitative Easing II Quantitative Easing III and Operation Twist Tapering 10-Year Treasury Constant Maturity $/Euro Exchange Rate
The patterns in Figure 4 highlight the variability in relationships between quantitative easing and the combination of Treasury yields and dollar currency value. U.S. quantitative easing is designed to bring Treasury yields down, the value of the domestic currency down ($/Euro up), and economic activity up. We would expect the Treasury yield and the $/Euro to move in opposite directions during easing periods. The very start of QE I and all of QE II were the only periods where the Treasury yield and $/Euro rate moved as expected. In other periods the Treasury and the $/Euro rate tend to move together rather than in opposite directions. In each of the easing periods the Treasury yield took a U shape, falling at first and then rising again. During the tapering period when Treasury yields should be rising they are falling. For the dollar, the value of the dollar got stronger ($/Euro down) and then reversed course during QE I and III, rather than falling throughout the expansion period. The dollar did appreciate during tapering, as would be expected. From the U.S. experience with quantitative easing since the Great Depression it is not clear that the Eurozone easing program will soon achieve its desired results of lower yields and a lower euro.
The deflationary pressures in Europe and around the globe are not isolated events. On the contrary, the U.S. and China will feel the effects of soft prices and slow economies in other
% $/Euro
6
countries. Europe alone is about 25% of the global economy and is large enough to export its deflation. For example, as goods from European countries become cheaper and as quantitative easing leads to a weaker value of the euro, goods from the U.S. and China will be more expensive to consumers in Europe. Export driven industries in the U.S. and China will lose sales. Goods from the European countries will be cheaper to consumers in the U.S. and China leading to higher imports there. Domestic producers in the U.S. and China will be required to match the lower prices of imports to maintain domestic sales, linking the deflated prices of Europe to the domestic prices in the domestic U.S and Chinese markets. In this way, deflation is exported from one country to another.
The Eurozone has other complications that may retard an economic recovery and a return to normal price pressures. A common currency zone has three requirements: free trade, common currency, and coordinated monetary and fiscal policies. For the Eurozone to survive all three conditions must be maintained. The economic benefits of a common currency and a common euro are generally recognized but countries are balking at the need to follow common fiscal policies. The most recent complication comes from the unwillingness of the recently elected leftist government in Greece to repay debt from prior bailout agreements. Other countries such as Italy are watching the developments in the Greece debt negotiations to guide their response to austerity requirements they face. The will to adhere to uniform fiscal policies required to keep the Eurozone in place is also waning in France, as the socialist government is trying to appease its core supporters while also implementing reforms to reduce fiscal deficits and entitlements.
China, the second largest economy, is not immune to deflation and slow global growth. While China achieved 7% economic growth in 2014, it fell below the official target of 7.5% for the first time in nearly 15 years. Inflation in China was 1.5%, a five-year low. The high growth in China is supported with large amounts of loans on bank balance sheets, making it necessary to maintain high growth to preserve financial asset values. To further maintain an export advantage the Chinese government has nudged the yuan down by 2% against the U.S. dollar since early November. With low oil prices, a falling yuan, and overcapacity in China there will be downward pressures on prices of Chinese goods for U.S. consumers, contributing further to deflationary pressures in the U.S. market.
Investment Scenarios
A number of investment ideas are consistent with the economic outlook presented for 2015. The points summarized below present overall investment market expectations for 2015.
Flat Yield Curve – The spread between long term and short term bonds is expected to decrease. Higher “roll over” investment rates for shorter term fixed income securities are expected, consistent with shorter durations in fixed income portfolios.
High Yield Investing – High yield and high risk bonds should provide attractive credit risk premiums since default rates are expected to be low. Higher yield bonds also offer some cushion if interest rates go up overall. This approach should be selective to avoid sectors such as energy.
7
U.S. Equity Markets – Stock market gains in 2014 are not likely to be repeated in 2015. Current valuations are high and stock prices will be hurt by higher interest rates (higher discount rates) This does not mean stocks will necessarily fall, but the tailwinds for stocks in 2014 will not be in place for 2015.
Volatility – Global monetary expansion and pending currency adjustments along with political risks in Europe over fiscal alignment of member countries will contribute to volatility in equities, bonds, and currencies.
International Equities – Just as U.S. equities gained from monetary expansion over the last six years, valuations of stocks in countries with monetary expansion should be helped. Equity values in the Eurozone have been beaten down with slumping economies and deflation pressures. Going forward, weaker currencies favoring export driven industries along with lower interest rates in these countries open the door for improved equity valuation. Selectivity will be needed to identify those opportunities that will benefit most from lower domestic interest rates, lower value of the euro, and a return to moderately rising prices.
8
Summary of Recent Economic Data
GDP – According to the revised estimate released by the Bureau of Economic Analysis, real gross domestic product (GDP) increased at an annual rate of 2.2% in the fourth quarter of 2014 following a revised 5% growth rate for the third quarter. Real gross domestic purchases, defined as purchases by U.S. residents of goods and services without regard to where the goods were produced, increased 3.6% in the fourth quarter, compared with an increase of 4.1% in the third. Real GDP increased 2.3% in 2014 compared with an increase of 2.2% in 2013.
GDP grew at a lower than expected 2.2% in the fourth quarter of 2014. Slower real GDP growth was linked to higher imports, a reduction in federal government spending, falling nonresidential fixed investment, and lower exports. Positive contributions to growth came from private inventory adjustment and strong growth in personal consumption expenditures. Figure 5 shows the pattern of GDP growth relative to the long term growth trend rate of 3.2%
Figure 5. Real Quarterly GDP Growth Relative to Trend Growth of 3.2% %
Real personal consumption expenditures increased 4.3% in the fourth quarter, compared with an increase of 3.2% in the third. Durable goods increased 7.4%, compared with an increase of 9.2% in the third quarter. Nondurable goods increased 4.4%, compared with an increase of 2.5%. Services increased 3.7%, compared with an increase of 2.5%.
Real nonresidential fixed investment increased 1.9% in the fourth quarter, compared with an 8.9% increase in the third. Investment in nonresidential structures increased 2.6%, compared with an increase of 4.8%. Investment in equipment fell 1.9% in contrast to an increase of 11.0%. Investment in intellectual property increased 7.1%, compared with an
3.2% Trend
9
increase of 8.8%. Real residential fixed investment increased 4.1%, compared with an increase of 3.2%.
Real federal government consumption expenditures and gross investment decreased 7.5% in the fourth quarter, in contrast to an increase of 9.9% in the third. National defense decreased 12.5%, in contrast to an increase of 16.0%. Nondefense increased 1.7%, compared with an increase of 0.4%. Real state and local government consumption expenditures and gross investment increased 1.3%, compared with an increase of 1.1%.
Real exports of goods and services increased 2.8% in the fourth quarter, compared with an increase of 4.5% in the third. Real imports of goods and services increased 8.9%, in contrast to a decrease of 0.9% in the third quarter.
The change in real private inventories added 0.82% to the fourth-quarter change in real GDP after subtracting 0.03% in the third-quarter. Private businesses increased inventories $113.1 billion in the fourth quarter, following increases of $82.2 billion in the third quarter and $84.8 billion in the second. Real final sales of domestic product -- GDP less change in private inventories -- increased 1.8% in the fourth quarter, compared with an increase of 5.0% in the third.
Consumer Income, Consumption and Saving – Real disposable personal income increased 3.8% in the fourth quarter following a 2% increase in the third quarter. The personal saving rate was stable with a 4.6% rate in the fourth quarter compared to 4.7% rate in the third quarter of 2014. However, at the end of the quarter spending tanked and the saving rate increased, raising concerns about the strength of consumer spending going into the first quarter of 2015.
Fourth quarter consumer spending was strong overall, increasing by a 4.3% annual rate following a 3.2% increase in the third quarter. Fourth quarter spending was fueled by an annualized 3.8% increase in real disposable income along with lower gas prices and higher wealth from mortgage refinancing. Table 2 summarizes fourth quarter monthly changes in personal income, disposable income, real personal consumption, the personal saving rate, and the change in the personal consumption expenditure price index.
10
Table 2. Fourth Quarter Consumer Income, Saving, and Inflation
October November December Personal Income 0.4% 0.3% 0.3%
Current Dollar Disposable Income 0.4% 0.3% 0.3% Real Personal Consumption Expenditure 0.3% 0.7% -0.1% Personal Saving Rate 4.5% 4.3% 4.9% PCE Price Index Change 0.0% -0.2% -0.2%
Consumer spending slowed at the end of the fourth quarter, falling 0.3% in December even though real disposable income grew by 0.5%. Figure 6 below illustrates the monthly relationship between real disposable personal income and real consumer spending.
Figure 6. Real Disposable Personal Income and Real Consumer Spending
% Change
Real Disposable Income Real Consumer Spending
The personal saving rate was 4.6% in the fourth quarter following a 4.7% rate in the third quarter.
Retail sales were up 5.3% for 2014 but declined 0.9% in December. Sales should pick
back up in 2015 if job growth and low fuel prices are maintained.
Production and Manufacturing - Factory activity cooled in December and January. The economy is growing but the rate is slowing going into 2015. Capacity utilization remains below the long run average. Export demand is shrinking and competition from imports is picking up due to the strong dollar and deflation pressures abroad.
Sep. ’14 Oct. ’14 Nov. ’14 Dec. ‘14
11
The Institute for Supply Management (ISM) said its national factory activity index fell to 53.5 in January from 55.1 in December. A reading above 50 suggests an expansion in the manufacturing sector. The decline of the index in December was largely due to a fall in export orders and order backlogs due largely to slowing global demand and weak demand for energy industry-related equipment.
Business spending on equipment in the fourth quarter was the weakest since mid-2009.
Industrial production fell 0.1% in December following a rise of 1.3% in November.
December’s decline was influenced by a sharp drop in the output of utilities due to warmer-than-usual temperatures. Without utilities industrial production rose 0.7% in December.
For the fourth quarter of 2014 as a whole, industrial production advanced at an annual
rate of 5.6%, with widespread gains among the major market and industry groups.
Manufacturing posted a gain of 0.3% in December, marking the fourth consecutive monthly increase. Total industrial production in December was 4.9% above the level on year ago.
Capacity utilization for the industrial sector fell 0.3% in December to 79.7%, a rate that is 0.4% below its long-run average (1972–2013).
Table 3 below summarizes the trends in the ISM data to include changes and trends.
Table 3. Summary of the Institute of Manufacturing Survey (ISM) (January 2015)
Index Series Index
(December)
Series Index
(January)
% Change
Direction and Rate of Change
# Months in Current
Direction PMI® 55.1 53.5 -1.6 Up Slower 20 New Orders 57.8 52.9 -4.9 UP Slower 20 Production 57.7 56.5 -1.2 Up Slower 11 Employment 56.0 54.1 -1.9 UP Slower 19 Supplier Deliveries 58.6 52.9 -5.7 Down Slower 20 Inventories 45.5 51.0 +5.5 UP from Contracting 1 Customers' Inventories 44.5 42.5 -2.0 Down 2 Prices 38.5 35.0 -3.5 Down Faster 3 Backlog of Orders 52.5 46.0 -6.5 Down from Growing 1 Exports 52.0 49.5 -2.5 Down from Growing 1 Imports 55.0 55.5 +0.5 UP Faster 24 Overall Economy Up Slower 68
Manufacturing UP Slower 20
Note: An index over 50 suggests growth and a decline (increase) in the index suggests slower (faster) growth.
12
Labor, Employment, Productivity, and Wages – The civilian unemployment rate edged up to 5.7% in January of 2015 due largely to an increase in the labor participation rate. The broader U-6 unemployment rate, adjusted for marginally attached and part time workers, declined to 11.3%. Labor productivity edged lower in the fourth quarter as hours worked increased faster than output but hourly wages are showing signs of a long awaited upward trend. Unit labor costs are rising at a modest 1.9% over the last four quarters and should continue to rise as the labor market improves.
The U-3 unemployment rate increased to 5.7% in January of 2015 from 5.6% in
December of 2014. For comparison purposes the U.S. unemployment rate averaged 5.83% from 1948 until 2015, reaching a high of 10.8% in November of 1982 and a record low of 2.5% in May of 1953.
The U-6 unemployment rate reached 11.3% in January of 2015. The U-6 rate includes
marginally attached workers and part time employment as well as the traditional civilian unemployment rate U-3. Figure 7 below illustrates the time series of both U-3 and U-6 as well as the varying spread between the U-6 and U-3 rates. A wider spread is due to more marginally attached and part time workers in the labor force.
Figure 7. U-3 and U-6 Unemployment Rates and Spreads Percent
Notes:
Shaded area represents recessions U-3 = Civilian Unemployment Rate U-6 = U-3 plus Marginally Attached plus Total Employed Part Time
U-6 minus U-3 = spread =
5.6%
7.2%
3.8% 3.8%3.8%
13
The labor force participation rate rose by 0.2% to 62.9% in January, reversing a long
pattern of decline. Total employment increased by 435,000 in January and the employment-population ratio remained stable at 59.3%. The number of unemployed persons remained at 9.0 million in January.
Approximately 2.95 million jobs were created in 2014 for an average of about 245,800 jobs per month. In December, companies hired 252,000 workers with gains widespread across nearly all industries
The average workweek for all employees on private nonfarm payrolls was unchanged at 34.6 hours in January. The manufacturing workweek edged up by 0.1 hour to 41.0 hours, and factory overtime edged down by 0.1 hour to 3.5 hours. The average workweek for production and nonsupervisory employees on private nonfarm payrolls edged down by 0.1 hour to 33.8 hours.
Average hourly earnings for all employees on private nonfarm payrolls increased by 12 cents to $24.75 in January following a decline of 5 cents in December. On a year over year basis, average hourly earnings are up 2.2%. For January, average hourly earnings of private-sector production and nonsupervisory employees increased by 7 cents to $20.80. Monthly increases in average hourly earnings averaged .2% from 2006 to 2015, as shown in Figure 8.
Figure 8. Monthly Increase in Average Hourly Earnings % %
Wages in the United States have improved very slowly since mid-year, as shown in
Figure 9. Wages increased to $10.40 in December of 2014 from $10.39 in November of 2014. Wages in the United States averaged $10.23 from 2006 until 2014, reaching an all-time high of $10.41 in December of 2008 and a record low of $9.88 in July of 2008.
Long run Average
14
Figure 9. Average Hourly Wages ($s)
Nonfarm business sector labor productivity fell at a 1.8% annual rate during the fourth quarter of 2014 as output increased 3.2% and hours worked increased 5.1%. The increase in hours worked is the largest increase in this series since a gain of 5.7% in the fourth quarter of 1998.
From the fourth quarter of 2013 to the fourth quarter of 2014, productivity was unchanged as output and hours worked both increased 3.1%.
Unit labor costs in the nonfarm business sector increased 2.7% in the fourth quarter of 2014, reflecting a 0.9% increase in hourly compensation and a 1.8% decline in productivity. Unit labor costs increased 1.9% over the last four quarters. BLS calculates unit labor costs as the ratio of hourly compensation to labor productivity.
Inflation - Inflation is tracking below the Fed’s 2% target. Even so, the Fed remains committed to modest increases in the fed funds rate later in 2015. The Fed may plan to stay on track based on the view that the oil-driven decline in inflation is transitory. Nevertheless, there is a danger that falling oil prices combined with a strong dollar will push down the price of imports leading to even lower inflation. Declining prices in Europe may well lead to lower prices in the U.S. as well. Real deflation, negative inflation rates rather than declining rates, is unlikely due to stronger labor markets and expected upward wage pressures.
In the 12 months through December, the personal consumption expenditures (PCE) price index rose only 0.7%, the lowest since October 2009. The core PCE price index, which excludes food and energy, increased 1.3% in the 12 months through December, the smallest gain since March.
$s $s
15
The price index for gross domestic purchases increased 1.4% in 2014, compared with an increase of 1.3% in 2013.
The GDP deflator fell 0.3% in the fourth quarter of 2014 following an increase of 1.4% in
the third quarter. Excluding food and energy prices, the price index for gross domestic purchases increased 0.7% in the fourth quarter compared with an increase of 1.6% in the third quarter.
The Consumer Price Index for All Urban Consumers (CPI-U) declined 0.4% in
December on a seasonally adjusted basis.
The core CPI index, excluding food and energy, was unchanged in December, following a 0.2% increase in October and a 0.1% rise in November. This was only the second time since 2010 that the CPI index did not increase.
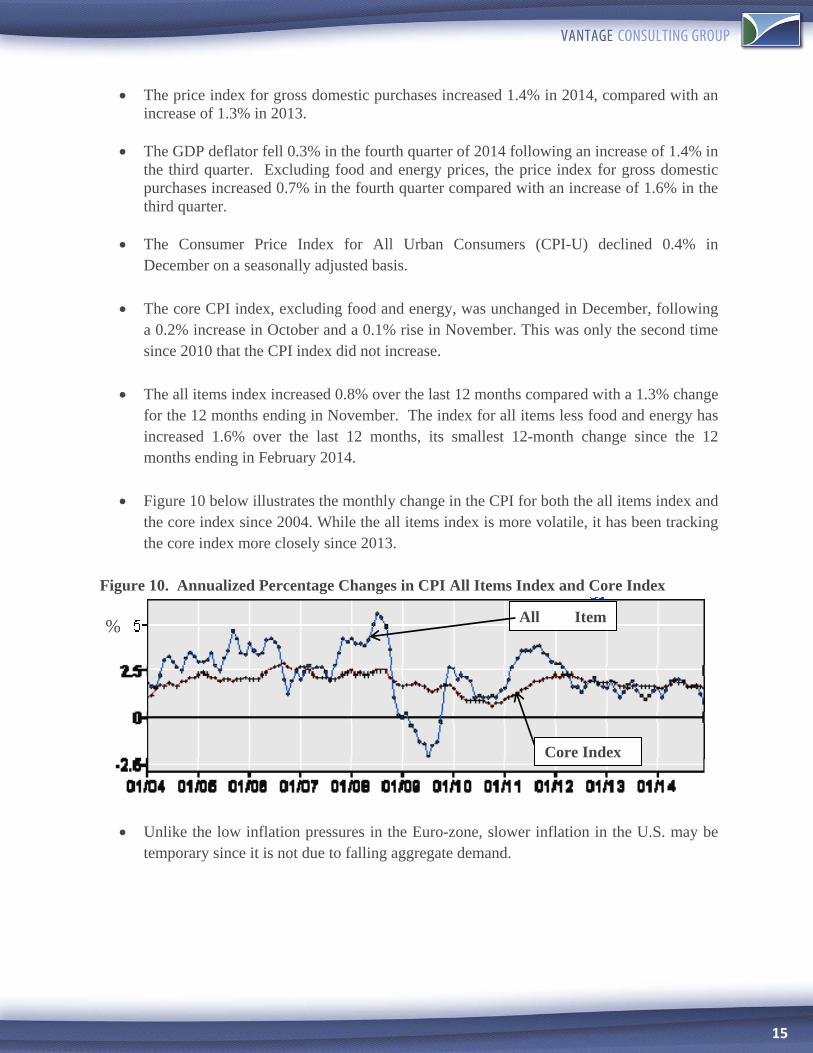
The all items index increased 0.8% over the last 12 months compared with a 1.3% change for the 12 months ending in November. The index for all items less food and energy has increased 1.6% over the last 12 months, its smallest 12-month change since the 12 months ending in February 2014.
Figure 10 below illustrates the monthly change in the CPI for both the all items index and the core index since 2004. While the all items index is more volatile, it has been tracking the core index more closely since 2013.
Figure 10. Annualized Percentage Changes in CPI All Items Index and Core Index
Unlike the low inflation pressures in the Euro-zone, slower inflation in the U.S. may be temporary since it is not due to falling aggregate demand.
All Item
Core Index
%
16
Sentiment and Confidence – Consumer sentiment reached an 11-year high in January but there was a pullback in February. Weaker sentiment in February and slower sales raise some concerns that growth will be slower in the first quarter.
The Thomson Reuters / University of Michigan's overall index of consumer sentiment fell unexpectedly to 93.6 in February following an 11-year high of 98.1 in January of 2015. Figure 11 illustrates the pattern of the index since April of 2014.
Figure 11. Consumer Sentiment Index (January 2014 - January 2015)
Source: Thomson Reuters/University of Michigan
Consumer Confidence in the United States averaged 85.06 from 1952 until 2014, reaching a high of 111.40 in January of 2000 and a record low of 51.70 in May of 1980.
The University of Michigan barometer of current economic conditions increased to 109.3
from a preliminary 108.3. In December, the current conditions index marked 104.8.
The University of Michigan gauge of consumer expectations fell slightly to 91 from a preliminary 91.6, but was up from 86.4 in December.
The one-year inflation expectations from the University of Michigan survey increased to 2.5% from a preliminary 2.4% but were down compared to 2.8% in the previous month. The five-to-ten-year inflation outlook was recorded at 2.8%, unchanged from both preliminary estimate and the previous month.
The Conference Board Leading Economic Index® (LEI) for the U.S. increased 0.5% in December to 121.1 (2010 = 100), following a 0.4% increase in November, and a 0.6% increase October. December’s gain was supported by broad increases in all of the index components, suggesting momentum for the economy going into 2015.
Coincident indicators suggest that employment gains are beginning to support growth but slow residential construction and low average work weeks are a concern.
17
Housing - Housing sales picked up at the end of the year following a sluggish start in 2014. Home sales were 8% higher in the second half of the year. While mortgage rates are low, housing prices are growing faster than wages. The relatively low supply of housing and strong price pressure is likely to dampen sales in 2015. First-time home buyers are a declining proportion of the buying market, suggesting that a stronger housing market depends on stronger job markets, especially at the lower levels.
New single-family home sales in December 2014 reached 481,000 on a seasonally adjusted basis. December sales were 11.6 % above the revised November sales and 8.8% above the December 2013 estimate of 442,000. Despite low inventory existing home sales were above a 5 million annual pace for the sixth time in seven months. Nevertheless, total sales fell 3.1% from 2013.
New home sales in 2014 increased 1.2% to about 429,000.
The median sales price of new houses sold in December 2014 was $298,100 while the average sales price was $377,800. Median home prices for 2014 were the highest since 2007.
Healthy home price increases in 2012 and 2013 are likely to be over for the near future. Home prices were up 4% in 2014 and are expected to increase at a moderate rate of 3.5% in 2015.
The number of new home sales at the end of December represents a 5.5 months of supply at the current sales rate. Total housing inventory at the end of December was 1.85 million units. Overall, unsold inventory is 0.5% lower than a year ago.
For all of 2014 there were 4.93 million sales of existing homes (single-family homes, townhomes, condominiums, and co-ops), which is a 3.1% decline from 2013.
First-time home buyers represented 29% of the housing demand in December compared to 31% in November. A National Association of Realtors survey found that the annual share of purchases by first-time home buyers is at its lowest level in nearly three-decades.
18
Global Economic Issues – The U.S. trade deficit for 2014 was about $500 billion and the deficit with likely widen by as much as 10% in 2015. Stronger U.S. economic performance relative to the rest of the world, downward pressures on prices abroad, and downward pressure on income abroad all contribute to higher U.S. imports and lower U.S. exports.
U.S. monthly international trade deficit increased from $39.8 billion in November
(revised) to $46.6 billion in December. The goods deficit increased by $6.9 billion from November to $66.0 billion in December. The services surplus increased by $0.1 billion from November to $19.5 billion in December. The figure below shows the pattern of the U.S. deficit in goods and services since 1996. The deficit is expected to get worse due to the strong dollar and declining prices abroad.
Figure 12. U.S. Balance of Goods and Services (Billions of Dollars)
Oil prices likely will stabilize in the range of $70-$75 a barrel in the spring of 2015.
China - The world’s second largest economy had GDP growth of 7.3% in the third quarter of 2014 following a 7.5% rate in the prior quarter. Third quarter growth in China was the slowest since 2009 and fourth quarter growth is likely to be even lower. China is now one of over a dozen economies to adopt monetary easing to stimulate economic activity and combat deflation. The central bank recently cut the reserve requirement by 50 basis points. Figure 13 below illustrates the trend of debt outpacing GDP growth in China along with the declining trend in both growth and debt.
$s
19
Figure 13. Slowing GDP Growth and Rising Debt in China % Change 1-year Ago
Source: Chinese National Bureau of Statistics
Eurozone – Most of the economies in the region are either in or at the brink of recession. Germany, the region’s biggest economy, recently staved off a recession when it announced third-quarter GDP growth of 0.1%. In the previous quarter, the economy contracted 0.1%. France, the region’s second-biggest economy, reported third-quarter GDP growth of only 0.3%, which is the fastest pace in more than a year. Unemployment in France is near 10%. Italy, the third-largest economy in the Eurozone, returned to a recession in the third quarter after its economy fell 0.1%. Italy’s economy has suffered through 13 consecutive quarters without growth. Consumer prices in the Euro-zone were down 0.6% from the previous January, the largest decline since the immediate aftermath of the 2008-09 financial crisis. Monetary easing is underway to combat weak spending and slumping prices in the Eurozone.
Japan – The world’s third-largest economy fell further into recession in the third quarter with an annual growth rate of a negative 1.9%. Monetary easing has not been able to lift the economy out of recession.
Russia – The Russian economy has been hit hard by declining oil prices and by sanctions
linked to the Ukraine conflict. Approximately 16% of Russia’s GDP comes from oil and gas. Unlike most of the rest of the world, inflation is on the rise in Russia. The central bank has raised its key interest rate five times from 5.5% at the beginning of 2014 to 10.5% in December. The Russian ruble has plummeted 40% against the U.S. dollar since the start of 2014. Russia is expected to slip into a recession in 2015 with a small contraction. The fiscal deficit is mounting in Russia and cuts in government spending are likely, but such cuts will also slow growth.
Switzerland – The Swiss central bank triggered turmoil in the currency markets when it
unexpectedly lifted its cap on the Swiss franc's exchange rate against the euro. The Swiss move spurred more volatility in credit and currency markets around the world.
Nominal GDP
Total Social Debt
20
The central bank move led to a 30% collapse in the euro relative to the franc. The Swiss central bank also cut interest rates in anticipation of monetary expansion by the European central bank.
Bailout talks between Greek leaders and their country's European creditors have been contentious. The negotiations for a six-month extension of Greece's bailout fell apart when the new leftist government leaders, who have vowed to dismantle austerity measures demanded by lenders, rejected the proposed terms for the extension. Negotiations are ongoing.