Page 1
The Outlook for Precious Metals
Mining On Top
Intierra/Raw Material Group
Stockholm
27 November 2013
30 Broad Street, 37th Floor
New York, NY 10004
www.cpmgroup.com
Jeffrey M. Christian Managing Partner [email protected]
Page 2
Slower Real Economic Growth Globally Long Term
Source: IMF, CPM Group
Note: Historical data are IMF statistics. Projections are made by CPM Group. Projections for "Emerging and Developing Economies are only for BRIC countries, which account for
approximately 52.8% of this category. Projections for "Advanced Economies" are only for the U.S., U.K., Eurozone, and Japan. These countries accounted for 82.2% of this category.
2
-6
-4
-2
0
2
4
6
8
10
-6
-4
-2
0
2
4
6
8
10
1980 1985 1990 1995 2000 2005 2010 2015p 2020p
World
Emerging and Developing Economies
Advanced Economies
Real Gross Domestic Product
Annual, Projected Through 2022
Percent Change Percent Change
Actual Projected
Page 3
The Outlook For Gold
3
Page 4
Gold Prices
4
1 000
1 100
1 200
1 300
1 400
1 500
1 600
1 700
1 800
1 900
2 000
1 000
1 100
1 200
1 300
1 400
1 500
1 600
1 700
1 800
1 900
2 000
jan-10 maj-10 sep-10 jan-11 maj-11 sep-11 jan-12 maj-12 sep-12 jan-13 maj-13 sep-13
$/Ounce $/Ounce
Nearby Active Comex Gold Futures High, Low, and Settlement Prices
Daily, Through 19 November 2013
Page 5
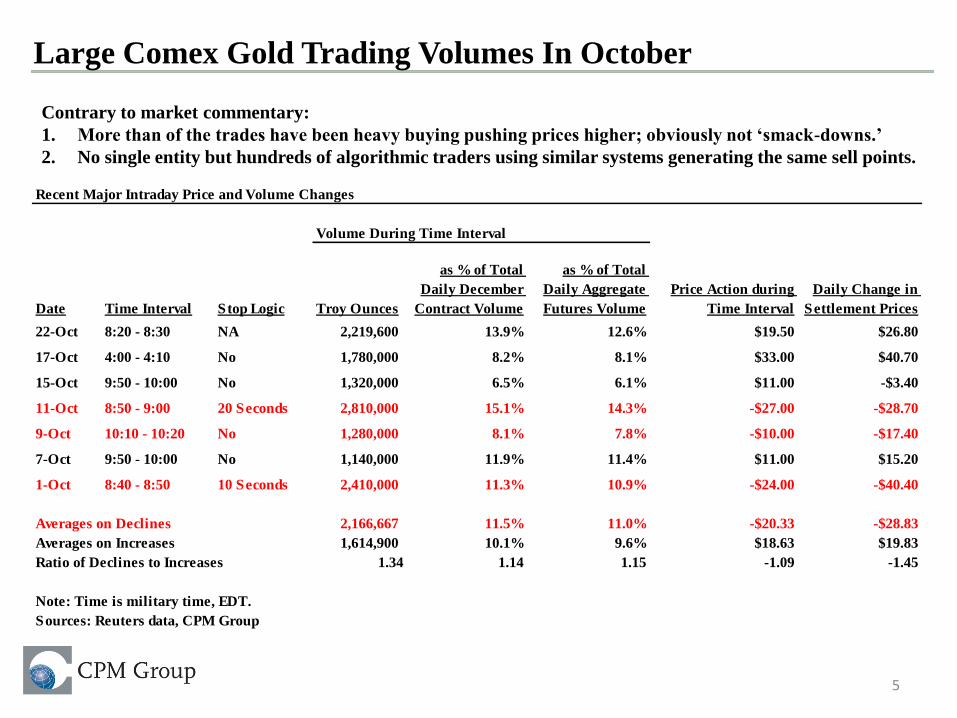
Large Comex Gold Trading Volumes In October
5
Contrary to market commentary:
1. More than of the trades have been heavy buying pushing prices higher; obviously not ‘smack-downs.’
2. No single entity but hundreds of algorithmic traders using similar systems generating the same sell points.
Recent Major Intraday Price and Volume Changes
Volume During Time Interval
Date Time Interval Stop Logic Troy Ounces
as % of Total
Daily December
Contract Volume
as % of Total
Daily Aggregate
Futures Volume
Price Action during
Time Interval
Daily Change in
Settlement Prices
22-Oct 8:20 - 8:30 NA 2,219,600 13.9% 12.6% $19.50 $26.80
17-Oct 4:00 - 4:10 No 1,780,000 8.2% 8.1% $33.00 $40.70
15-Oct 9:50 - 10:00 No 1,320,000 6.5% 6.1% $11.00 -$3.40
11-Oct 8:50 - 9:00 20 Seconds 2,810,000 15.1% 14.3% -$27.00 -$28.70
9-Oct 10:10 - 10:20 No 1,280,000 8.1% 7.8% -$10.00 -$17.40
7-Oct 9:50 - 10:00 No 1,140,000 11.9% 11.4% $11.00 $15.20
1-Oct 8:40 - 8:50 10 Seconds 2,410,000 11.3% 10.9% -$24.00 -$40.40
Averages on Declines 2,166,667 11.5% 11.0% -$20.33 -$28.83
Averages on Increases 1,614,900 10.1% 9.6% $18.63 $19.83
Ratio of Declines to Increases 1.34 1.14 1.15 -1.09 -1.45
Note: Time is military time, EDT.
Sources: Reuters data, CPM Group
Page 6
The Outlook for Gold
6
Gold prices have fallen to what CPM Group sees as a base. Prices may consolidate for a
couple of years around $1,300 - $1,400 on an annual average basis, and may not fall much
further.
For prices to fall further economic conditions would have to improve dramatically
more, which we do not see happening.
For prices to rise more forcefully than we envision, economic conditions would have
to deteriorate very sharply. This seems more possible than stronger than expected growth.
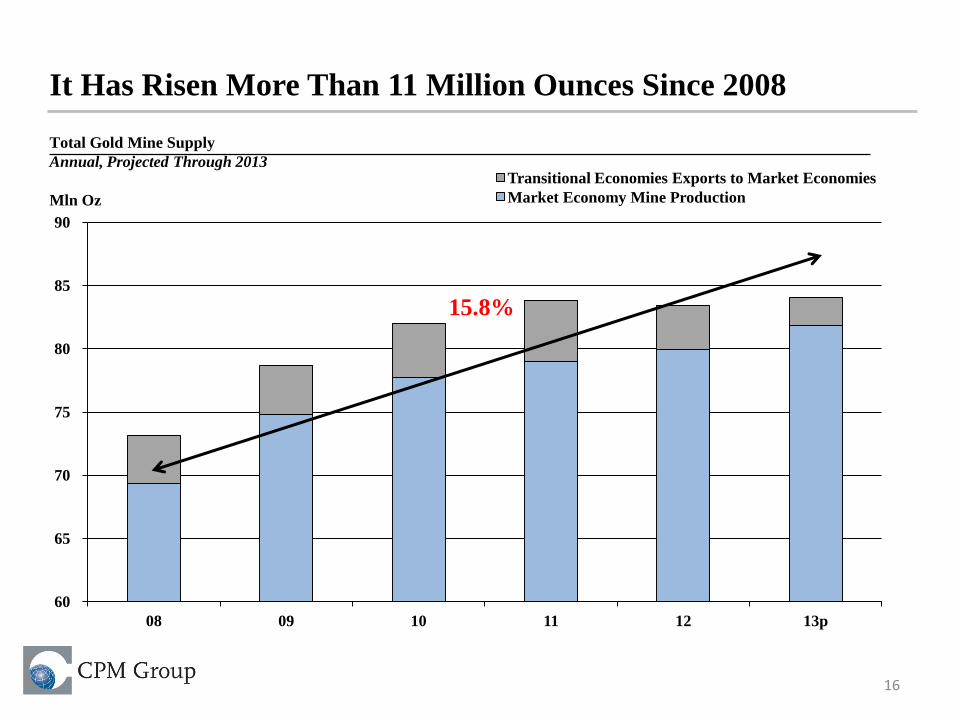
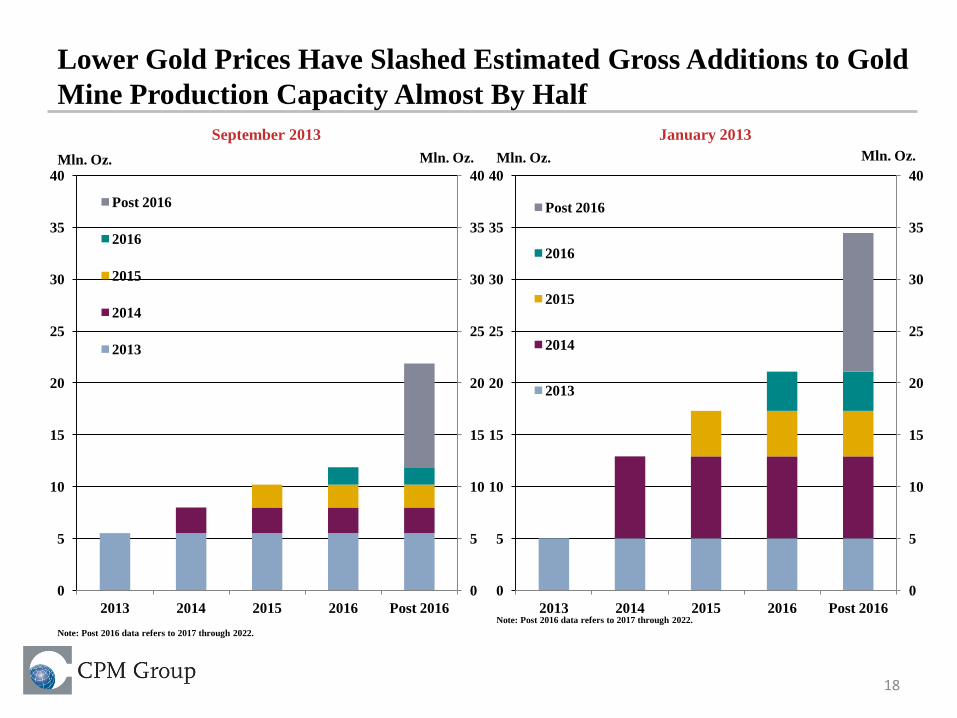
Mine production continues to rise, but the growth expectations have been cut in half by lower
gold prices and investor disenchantment with gold mining companies.
Secondary supply has fallen sharply as prices declined – 17% in 2013 alone.
Investors have sharply reduced their gold buying. Still high, net purchases are off 25% in 2013.
Those few central banks that were buying gold have pulled back on purchases, waiting to see
how low prices will fall.
Fabrication demand is rising modestly in line with lower gold prices and slow economic
recovery.
Page 7
Gold Investment Demand
7
Page 8
-10
0
10
20
30
40
50
60
-30
-10
10
30
50
70
90
110
66 69 72 75 78 81 84 87 90 93 96 99 02 05 08 11
Percent Change Million Ounces
Investment Demand's Effect on Gold Prices
Price Change Through 19 November 2013
Net Investment Demand (Right) Price Change
Investors Physical Gold Purchases Are Sharply Lower
13p
Page 9
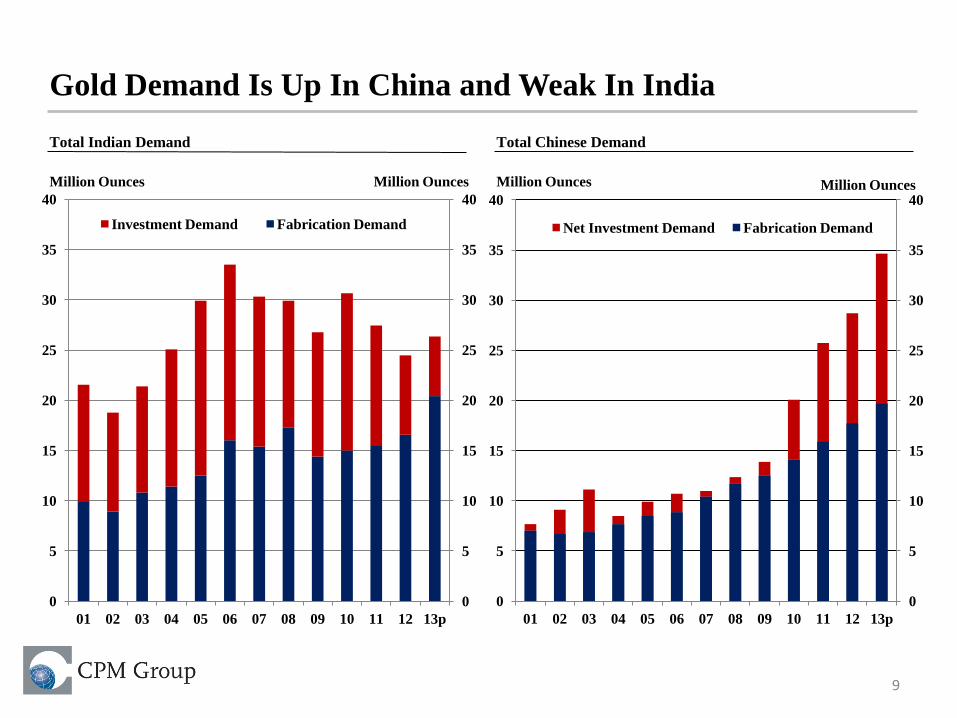
Gold Demand Is Up In China and Weak In India
9
0
5
10
15
20
25
30
35
40
0
5
10
15
20
25
30
35
40
01 02 03 04 05 06 07 08 09 10 11 12 13p
Net Investment Demand Fabrication Demand
Million Ounces Million Ounces
Total Chinese Demand
0
5
10
15
20
25
30
35
40
0
5
10
15
20
25
30
35
40
01 02 03 04 05 06 07 08 09 10 11 12 13p
Investment Demand Fabrication Demand
Million Ounces Million Ounces
Total Indian Demand
Page 10
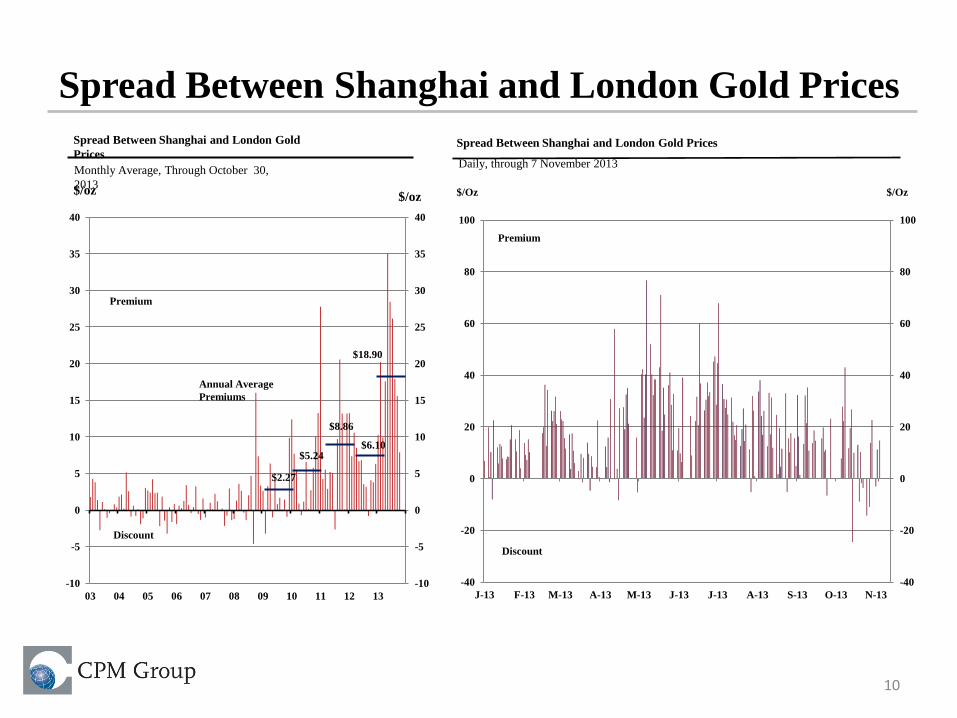
Spread Between Shanghai and London Gold Prices
10
-10
-5
0
5
10
15
20
25
30
35
40
-10
-5
0
5
10
15
20
25
30
35
40
03 04 05 06 07 08 09 10 11 12 13
Premium
Discount
$/oz $/oz
Monthly Average, Through October 30,
2013
$8.86
$2.27
$5.24 $6.10
$18.90
Annual Average
Premiums
Spread Between Shanghai and London Gold
Prices
-40
-20
0
20
40
60
80
100
-40
-20
0
20
40
60
80
100
J-13 F-13 M-13 A-13 M-13 J-13 J-13 A-13 S-13 O-13 N-13
Spread Between Shanghai and London Gold Prices
Daily, through 7 November 2013
$/Oz $/Oz
Premium
Discount
Page 11
Gold ETFs: Easy To Buy, Easy To Sell ETF Gold Holdings Through 30 October 2013
-
10
20
30
40
50
60
70
80
90
-
10
20
30
40
50
60
70
80
90
2003 2004 2005 2006 2007 2008 2009 2010 2011 2012 2013
Million Ounces Million Ounces
-30
-25
-20
-15
-10
-5
0
5
10
15
20
25
-30
-25
-20
-15
-10
-5
0
5
10
15
20
25
03 04 05 06 07 08 09 10 11 12 13YTD
Million Ounces Million Ounces
Annual Net Changes to Gold ETP Holdings
Through October 2013
Page 12
Record Investor Short Positions on Comex Earlier in 2013
-15
-10
-5
0
5
10
15
20
25
30
35
-15
-10
-5
0
5
10
15
20
25
30
35
A-95 J-97 S-98 J-00 M-02 D-03 A-05 M-07 F-09 O-10 J-12
Long
Short
Net Fund Position in Comex
Million Ounces Million Ounces
Non-Commerical Positions in Comex Gold Futures & Options. Weekly Data, through 12 November2013
Page 13
Gold Supply, Fabrication Demand,
and Official Transactions
13
Page 14
Total Supply Declining, But Mine Production Is Rising
0
20
40
60
80
100
120
140
0
20
40
60
80
100
120
140
73 75 77 79 81 83 85 87 89 91 93 95 97 99 01 03 05 07 09 11 13p
Secondary Supply
Transitional Economies Exports to Market
Economies
Market Economy Mine Production
Total Gold Supply
Annual, Projected Through 2013
Mln Oz Mln Oz
Page 15
Gold Mine Supply In Fact Was Flat Between 2000 and 2012
15
0
10
20
30
40
50
60
70
80
90
00 01 02 03 04 05 06 07 08 09 10 11 12 13p
Transitional Economies Exports to Market Economies
Market Economy Mine Production
Total Gold Mine Supply
Annual, Projected Through 2013
Mln Oz 3.3%
Page 16
It Has Risen More Than 11 Million Ounces Since 2008
16
60
65
70
75
80
85
90
08 09 10 11 12 13p
Transitional Economies Exports to Market Economies
Market Economy Mine Production
Total Gold Mine Supply
Annual, Projected Through 2013
Mln Oz
15.8%
Page 17
Mine Supply Is Forecast To Be The Second Highest On Record in 2013
17
0
10
20
30
40
50
60
70
80
90
73 75 77 79 81 83 85 87 89 91 93 95 97 99 01 03 05 07 09 11 13p
Transitional Economies Exports to Market Economies
Market Economy Mine Production
Total Gold Supply
Annual, Projected Through 2013
Mln Oz
Page 18
Lower Gold Prices Have Slashed Estimated Gross Additions to Gold
Mine Production Capacity Almost By Half
18
0
5
10
15
20
25
30
35
40
0
5
10
15
20
25
30
35
40
2013 2014 2015 2016 Post 2016
Post 2016
2016
2015
2014
2013
September 2013
Mln. Oz. Mln. Oz.
Note: Post 2016 data refers to 2017 through 2022.
0
5
10
15
20
25
30
35
40
0
5
10
15
20
25
30
35
40
2013 2014 2015 2016 Post 2016
Post 2016
2016
2015
2014
2013
Mln. Oz. Mln. Oz.
Note: Post 2016 data refers to 2017 through 2022.
January 2013
Page 19
Effective Hedging Is Needed, But Faces The Same Old Obstacles
19
600
800
1 000
1 200
1 400
1 600
1 800
2 000
600 800 1 000 1 200 1 400 1 600 1 800 2 000
Market Price
Spot Sales
Gold HedgeFor Dec 2014 Indicatively priced on 10 October 2013
$1,100 Floor
US$ / Ounce - Sales Price
Producers this month could lock in a guaranteed floor of $1,110 per ounce and
given up only $60 of any upside.
Obstacles To Effective Hedging
• Mining companies often lack
financial expertise to evaluate,
counter-bid, and effectively manage
hedging programs.
• Banks offer less than ideal hedges
to mining companies, which lack the
internal capacity to evaluate proposed
hedges and counter-bid.
• Conflicts of interest and obstacles
from the 1990s still exist in the
market.
Page 20
Gold Fabrication Demand
0
20
40
60
80
100
120
0
20
40
60
80
100
120
77 80 83 86 89 92 95 98 01 04 07 10 13p
Other Uses
Dental/ Medical
Electronics
Gold Fabrication Demand
Projected Through 2013
Million Ounces Million Ounces
Jewelry - Developing Countries
Jewelry -
Developed Countries
Page 21
Official Transactions, Adjusted for Turkish Central Bank Additions
-35
-30
-25
-20
-15
-10
-5
0
5
10
15
20
-35
-30
-25
-20
-15
-10
-5
0
5
10
15
20
80 83 86 89 92 95 98 01 04 07 10 13p
Million Ounces Million Ounces
Net Additions
Net Reductions
Official Transactions
Annual Data, Projected through 2013
Note: Turkey introduced a policy in 2011 that allowed commercial banks to use gold to meet a portion of their reserve requirements. The bank included this gold in its monetary
reserves. Because these additions were not outright central bank purchases and no ownership has been transferred from the actual owner to the central bank, annual official transactions
have been adjusted to exclude Turkish central bank gold additions since 2011.
Adjusted for Turkish Central Bank's ROM Gold
Page 22
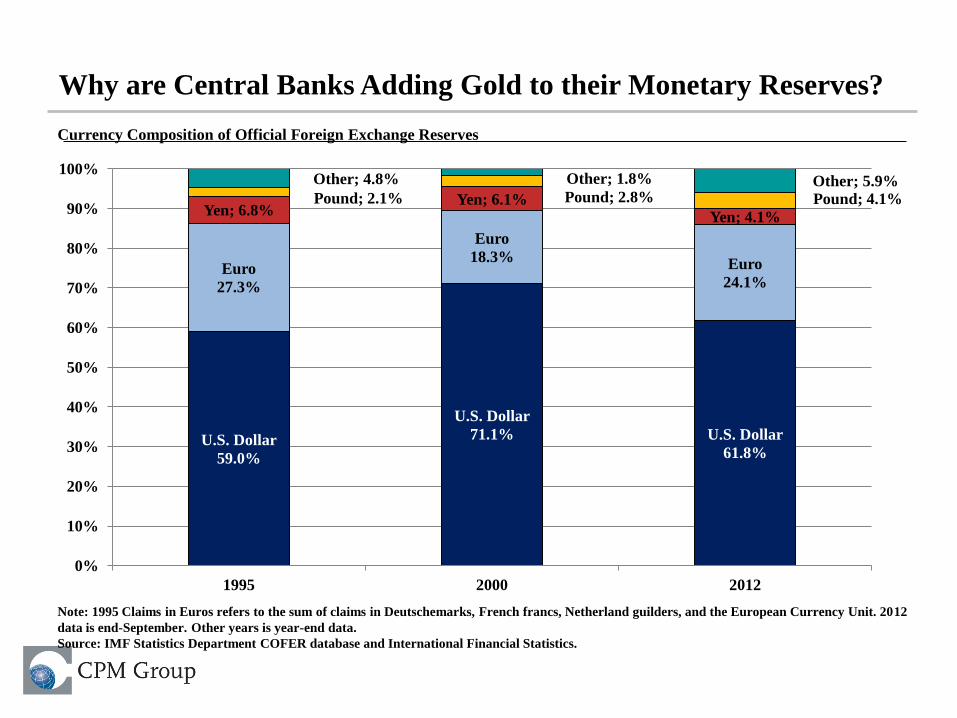
Why are Central Banks Adding Gold to their Monetary Reserves?
Note: 1995 Claims in Euros refers to the sum of claims in Deutschemarks, French francs, Netherland guilders, and the European Currency Unit. 2012
data is end-September. Other years is year-end data.
Source: IMF Statistics Department COFER database and International Financial Statistics.
U.S. Dollar
59.0%
U.S. Dollar
71.1% U.S. Dollar
61.8%
Euro
27.3%
Euro
18.3% Euro
24.1%
Yen; 6.8% Yen; 6.1%
Yen; 4.1%
Pound; 2.1% Pound; 2.8% Pound; 4.1%
Other; 4.8% Other; 1.8% Other; 5.9%
0%
10%
20%
30%
40%
50%
60%
70%
80%
90%
100%
1995 2000 2012
Currency Composition of Official Foreign Exchange Reserves
Page 24
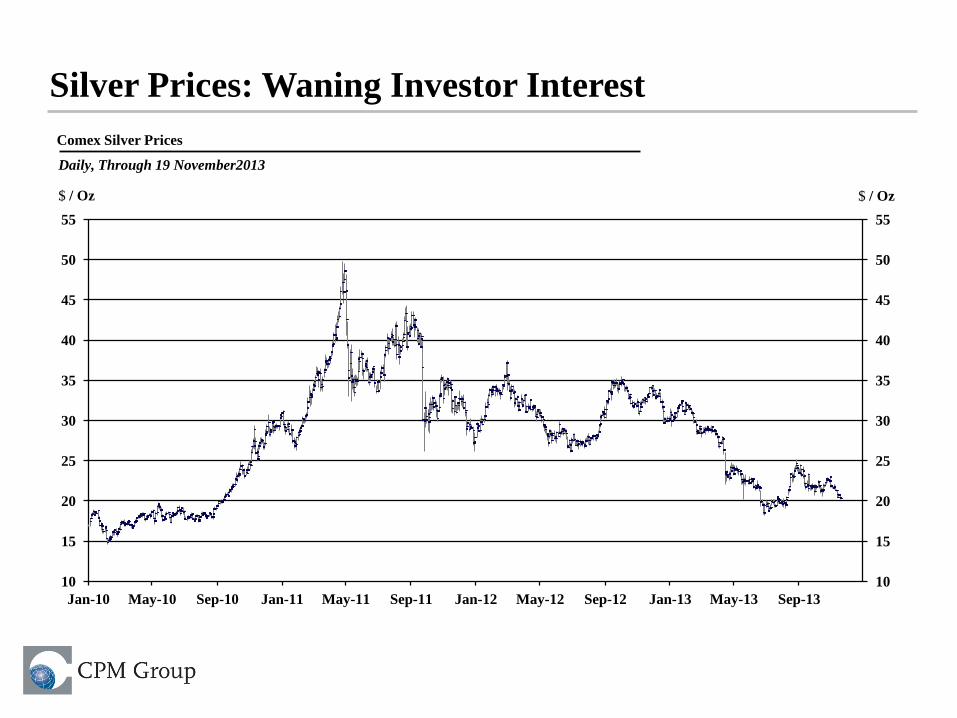
Silver Prices: Waning Investor Interest
10
15
20
25
30
35
40
45
50
55
10
15
20
25
30
35
40
45
50
55
Jan-10 May-10 Sep-10 Jan-11 May-11 Sep-11 Jan-12 May-12 Sep-12 Jan-13 May-13 Sep-13
Comex Silver Prices
$ / Oz $ / Oz
Daily, Through 19 November2013
Page 25
Key Silver Market Trends
• Investment Demand is projected to
decline 43% to 97.5 million ounces in
2013, despite an expected 30 million
ounce increase in coin demand. Large
institutional and high net worth
individuals with short to medium term
investment horizons appear to be selling
their bullion due to cyclical weakness.
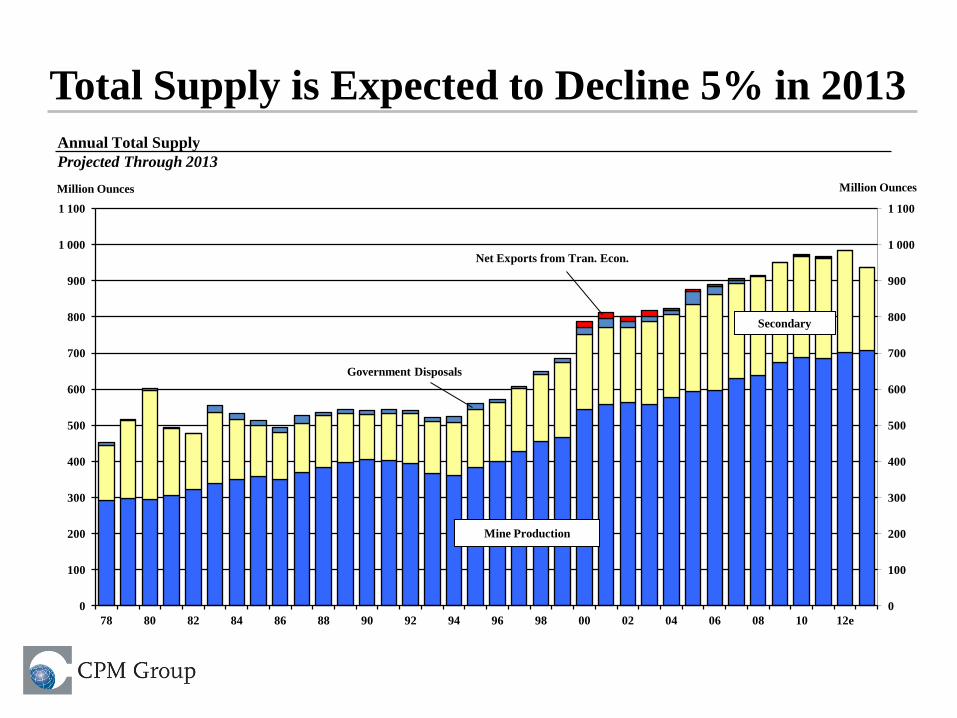
• Total Newly Refined Supply may
decline 5% in 2013, mostly due to the
19% drop in old scrap, a highly price-
sensitive source of supply.
• Fabrication Demand is expected to
rise to 838.7 million ounces this year,
up 3% from a year ago. This increase is
almost entirely driven by the 17.6
million ounces increase in jewelry and
silverware demand, which has
benefitted from lower silver prices.
200
300
400
500
600
700
800
900
1000
1100
200
300
400
500
600
700
800
900
1000
1100
60 63 66 68 72 75 78 81 84 87 90 93 96 99 02 05 08 11
Supply
Fabrication Demand
Silver Supply and Demand Balance
Projected Through 2013
Million Ounces Million Ounces
Page 26
Silver Investment Demand to Drop 43% This Year
-250
-200
-150
-100
-50
0
50
100
150
200
250
0
5
10
15
20
25
30
35
40
45
50
60 64 68 72 76 80 84 88 92 96 00 04 08 12e
Million Ounces $/Ounce
Price (LHS)
Net Changes in Inventories
Silver Market Balance
Projected Through 2013, Prices through 2012
Net Additions
Net Withdrawals
Page 27
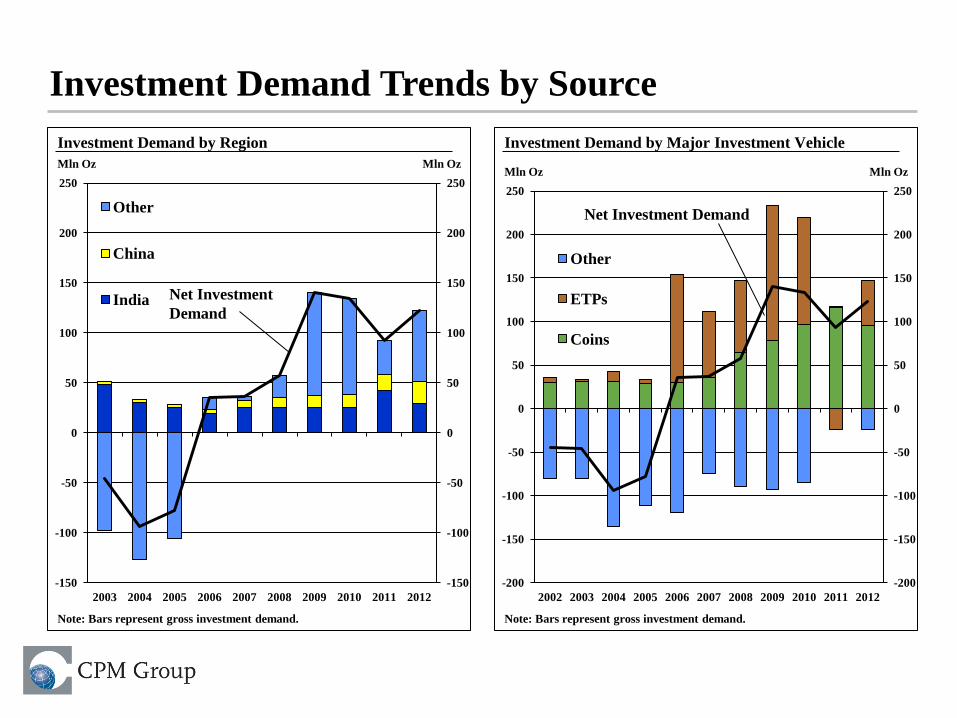
Investment Demand Trends by Source
-150
-100
-50
0
50
100
150
200
250
-150
-100
-50
0
50
100
150
200
250
2003 2004 2005 2006 2007 2008 2009 2010 2011 2012
Other
China
India Net Investment
Demand
Investment Demand by Region
Mln Oz Mln Oz
Note: Bars represent gross investment demand.
-200
-150
-100
-50
0
50
100
150
200
250
-200
-150
-100
-50
0
50
100
150
200
250
2002 2003 2004 2005 2006 2007 2008 2009 2010 2011 2012
Other
ETPs
Coins
Net Investment Demand
Investment Demand by Major Investment Vehicle
Mln Oz Mln Oz
Note: Bars represent gross investment demand.
Page 28
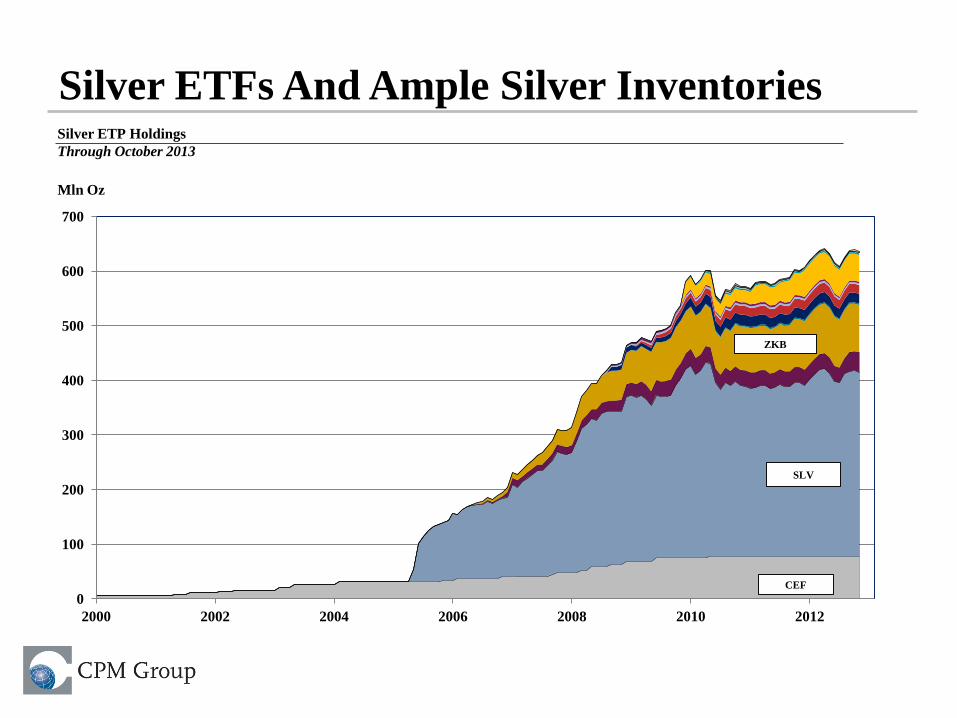
Silver ETFs And Ample Silver Inventories
0
100
200
300
400
500
600
700
2000 2002 2004 2006 2008 2010 2012
SLV
CEF
ZKB
Silver ETP Holdings
Through October 2013
Mln Oz
Page 29
Major Short Building in 2012 and 2013
-200
-150
-100
-50
0
50
100
150
200
250
300
350
400
-200
-150
-100
-50
0
50
100
150
200
250
300
350
400
A-95 M-97 J-99 A-01 S-03 N-05 D-07 J-10 F-12
Long
Short
Net Fund Position in Comex
Mln Ozs
Gross Long and Short Positions of Non-Commercial Positions
Comex Silver Futures and Options. Weekly Data, Through 12 November 2013
Mln Ozs
Page 30
Total Supply is Expected to Decline 5% in 2013
0
100
200
300
400
500
600
700
800
900
1 000
1 100
0
100
200
300
400
500
600
700
800
900
1 000
1 100
78 80 82 84 86 88 90 92 94 96 98 00 02 04 06 08 10 12e
Secondary
Mine Production
Million Ounces Million Ounces
Net Exports from Tran. Econ.
Government Disposals
Annual Total Supply
Projected Through 2013
Page 31
Secondary Supply Rose in 2012, but is Projected to Decline 19% in 2013
0
50
100
150
200
250
300
350
0
50
100
150
200
250
300
350
77 78 79 80 81 82 83 84 85 86 87 88 89 90 91 92 93 94 95 96 97 98 99 00 01 02 03 04 05 06 07 08 09 10 11 12e 13p
Annual Secondary Supply
Projected Through 2013
South Asian Exports
Indian Scrap
Demonetized Coins
Old Scrap
Million Ounces Million Ounces
Page 32
Fabrication Demand Expected to Rise 3% in 2013
0
100
200
300
400
500
600
700
800
900
1 000
0
100
200
300
400
500
600
700
800
900
1 000
77 79 81 83 85 87 89 91 93 95 97 99 01 03 05 07 09 11 13p
Annual Total Fabrication Demand
Projected Through 2013
Net Imports into Transitional Economies
Super Conductors
Biocides
Other Countries
Photovoltaic
Million Ounces Million Ounces
Photography
Jewelry and Silverware
Electronics
Other Uses
Page 33
Electronics Demand Growth is Slowing
0
20
40
60
80
100
120
140
160
180
200
220
240
260
0
20
40
60
80
100
120
140
160
180
200
220
240
260
77 79 81 83 85 87 89 91 93 95 97 99 01 03 05 07 09 11 13p
Silver Fabrication Demand for Electronics and Batteries
Annual, Projected Through 2013
U.S.
Europe
Million Ounces Million Ounces
Other Countries
Japan
China
Note: Prior to 2000, China was excluded from market economy demand statistics.
Page 34
First Drop in Silver Demand from Photovoltaics in 2012, Recovered in 2013
0
10
20
30
40
50
60
0
10
20
30
40
50
60
00 01 02 03 04 05 06 07 08 09 10 11 12 13p
PV Silver Demand (Left Scale)
Solar Panel Installations
Solar Panel Silver Demand, Installations, and Production
Projected Through 2013
Million Ounces Gigawatts
Page 35
Chinese Silver Imports are Down 40% This Year Through September
-25
-20
-15
-10
-5
0
5
10
15
20
25
-25
-20
-15
-10
-5
0
5
10
15
20
25
J-05 S-05 M-06 J-07 S-07 M-08 J-09 S-09 M-10 J-11 S-11 M-12 J-13
Gross Imports Gross Exports
Net Trade
Monthly, Through September 2013
Chinese Silver Imports and Exports
Moz Moz
Page 36
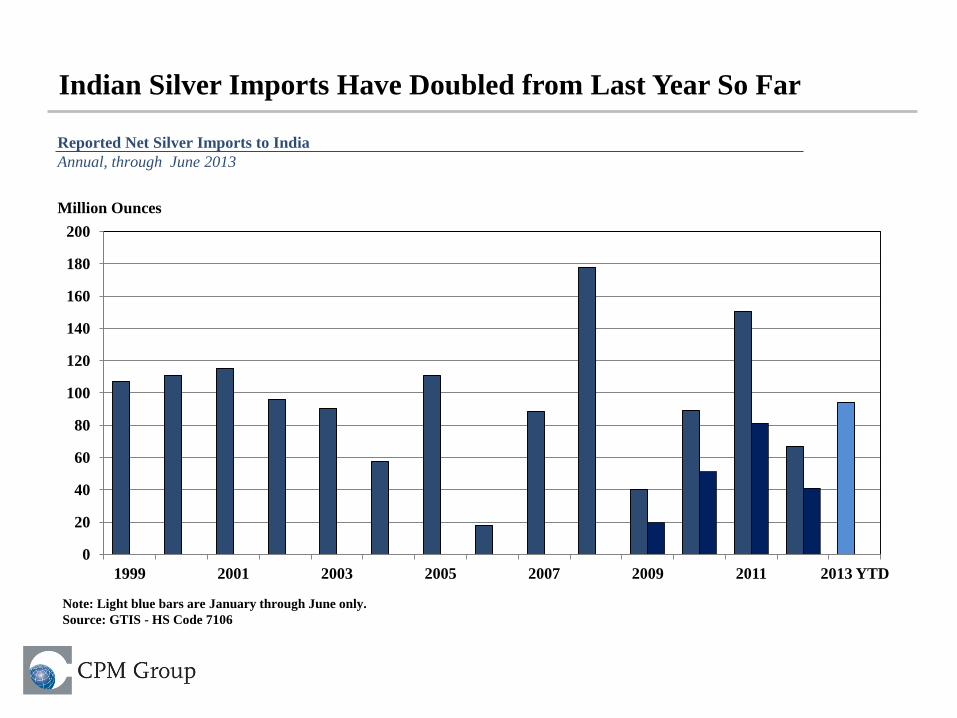
Indian Silver Imports Have Doubled from Last Year So Far
0
20
40
60
80
100
120
140
160
180
200
1999 2001 2003 2005 2007 2009 2011 2013 YTD
Reported Net Silver Imports to India
Annual, through June 2013
Million Ounces
Note: Light blue bars are January through June only.
Source: GTIS - HS Code 7106
Page 37
CPM Group Precious Metals Yearbooks & Other Reports
37
For general inquiries, email [email protected]