CROSS-SECTOR OUTLOOK 28 February 2019 TABLE OF CONTENTS Summary 1 Pace of monetary policy normalization will slow in 2019 2 Global growth will continue to weaken after peaking in 2018 3 Waning fiscal impulse will moderate US growth momentum 4 Euro area economy will continue to expand at a slower pace 6 UK’s economic outlook clouded by higher likelihood of a no-deal Brexit 6 Japan's economy is also slowing 8 Deteriorating conditions are straining South Korea's economy 8 In China, growth is slowing as expected, despite significant fiscal and monetary stimulus 9 Growth will be steady in India and Indonesia 10 Growth momentum will improve in Latin America, but differences persist 11 Turkey’s economy continues to shrink 12 Risks to our global growth forecasts are biased firmly to the downside 12 Moody's related publications 14 Contacts Madhavi Bokil +1.212.553.0062 VP-Sr Credit Officer/CSR [email protected]Youngjoo Kang +1.212.553.1124 Analyst [email protected]Elena H Duggar +1.212.553.1911 Associate Managing Director [email protected]Anne Van Praagh +1.212.553.3744 MD-Gbl Strategy & Research [email protected]» Contacts continued on last page Global Macro Outlook 2019-20 (February 2019 Update) Global economy will continue to weaken throughout 2019 and into 2020 Summary » The pace of monetary policy normalization will slow in 2019. We expect the major central banks to adopt a more cautious approach as the pace of economic expansion moderates and with the balance of risks tilted to the downside. We now believe that the US Federal Reserve will raise the federal funds rate once or twice this year instead of three or four times, and that the European Central Bank (ECB) will start increasing deposit and refinancing rates only in 2020, instead of in the second half of 2019. In Japan, there is little scope for tighter monetary policy this year or in 2020 given that low inflation will likely persist. » The global economy weakened significantly in the fourth quarter of 2018 and will continue to weaken throughout 2019 and into 2020. After real GDP growth of 3.2% in 2018, the G-20 economies’ growth will slow to 2.9% in 2019 and 2.8% in 2020. Advanced economies’ growth will moderate toward potential, while growth in a number of emerging markets will remain weak. Momentum in China will slow to a multi-decade low, and Turkey and Argentina will remain in recessions. » Risks to global growth are tilted to the downside. Key risks include a sharper- than-expected slowdown in China with negative spillovers for global growth, a further escalation of US-China tensions and a renewed tightening of financial conditions. While US President Donald Trump has postponed a March 2 deadline for an increase in tariffs on imports from China, disagreements between the two countries over intellectual property, technology and investment are likely to persist. Potential US tariffs on imported autos and parts represent a key risk to our current macro baseline view. Additionally, a range of events could spark a deterioration in sentiment, including a “no-deal” Brexit, increased political risks in the euro area and a flare-up of geopolitical tensions in the Middle East, South Asia and East Asia. THIS REPORT WAS REPUBLISHED ON 28 FEB 2019 WITH CORRECTIONS TO RUSSIA’S GROWTH FORECASTS IN EXHIBIT 7.
Transcript
CROSS-SECTOR
OUTLOOK28 February 2019
TABLE OF CONTENTSSummary 1Pace of monetary policynormalization will slow in 2019 2Global growth will continue toweaken after peaking in 2018 3Waning fiscal impulse will moderateUS growth momentum 4Euro area economy will continue toexpand at a slower pace 6UK’s economic outlook clouded byhigher likelihood of a no-deal Brexit 6Japan's economy is also slowing 8Deteriorating conditions are strainingSouth Korea's economy 8In China, growth is slowing asexpected, despite significant fiscaland monetary stimulus 9Growth will be steady in India andIndonesia 10Growth momentum will improve inLatin America, but differences persist 11Turkey’s economy continues to shrink 12Risks to our global growth forecastsare biased firmly to the downside 12Moody's related publications 14
Global Macro Outlook 2019-20 (February 2019 Update)
Global economy will continue to weakenthroughout 2019 and into 2020Summary
» The pace of monetary policy normalization will slow in 2019. We expect the majorcentral banks to adopt a more cautious approach as the pace of economic expansionmoderates and with the balance of risks tilted to the downside. We now believe that theUS Federal Reserve will raise the federal funds rate once or twice this year instead of threeor four times, and that the European Central Bank (ECB) will start increasing deposit andrefinancing rates only in 2020, instead of in the second half of 2019. In Japan, there islittle scope for tighter monetary policy this year or in 2020 given that low inflation willlikely persist.
» The global economy weakened significantly in the fourth quarter of 2018 andwill continue to weaken throughout 2019 and into 2020. After real GDP growth of3.2% in 2018, the G-20 economies’ growth will slow to 2.9% in 2019 and 2.8% in 2020.Advanced economies’ growth will moderate toward potential, while growth in a numberof emerging markets will remain weak. Momentum in China will slow to a multi-decadelow, and Turkey and Argentina will remain in recessions.
» Risks to global growth are tilted to the downside. Key risks include a sharper-than-expected slowdown in China with negative spillovers for global growth, a furtherescalation of US-China tensions and a renewed tightening of financial conditions. WhileUS President Donald Trump has postponed a March 2 deadline for an increase in tariffs onimports from China, disagreements between the two countries over intellectual property,technology and investment are likely to persist. Potential US tariffs on imported autosand parts represent a key risk to our current macro baseline view. Additionally, a range ofevents could spark a deterioration in sentiment, including a “no-deal” Brexit, increasedpolitical risks in the euro area and a flare-up of geopolitical tensions in the Middle East,South Asia and East Asia.
THIS REPORT WAS REPUBLISHED ON 28 FEB 2019 WITH CORRECTIONS TO RUSSIA’S GROWTH FORECASTS IN EXHIBIT7.
Pace of monetary policy normalization will slow in 2019As global growth slows, central banks across both developed and developing countries will either pause or reverse policy tightening (seeThe pace of monetary policy normalization will likely slow in 2019, 25 January 2019). In 2018, the actions of the Fed were instrumentalin tightening financial conditions both in the US and globally. A more dovish turn in the Fed’s communication since December impliesthat the central bank is less likely to become a catalyst for tighter financial conditions. That said, we will very likely see elevatedfinancial market volatility in 2019 and tighter financial conditions through asset price corrections, particularly if growth in majoreconomies such as China, the euro area or the US disappoints further.
A downward shift in global growth expectations and a tilt in the balance of risks to the downside, while inflation expectations remainstrongly anchored around the target, prompted the Fed to signal a softening of its policy stance. Minutes of the January policy meetingclearly show that most FOMC members view the rate cycle as close to ending. The minutes also indicate that normalization of theFed's balance sheets could end as early as the fourth quarter of this year. The emphasis on patience with regard to interest rates andflexibility with regard to balance sheet normalization reflects a desire to elongate the current cycle by maintaining a supportive policystance (see Exhibit 3). Accordingly, we expect the federal funds rate to increase once, or at the most twice this year, thereby keepingthe upper bound of the effective federal funds rate below 3% through much of the year (see Exhibit 4).
Exhibit 3
G3 central bank balance sheets% of aggregated G3 GDP
Sources: Moody's Investors Service, Haver Analytics
This publication does not announce a credit rating action. For any credit ratings referenced in this publication, please see the ratings tab on the issuer/entity page onwww.moodys.com for the most updated credit rating action information and rating history.
2 28 February 2019 Global Macro Outlook 2019-20 (February 2019 Update): Global economy will continue to weaken throughout 2019 and into 2020
The ECB ended new asset purchases in December. We expect the central bank to maintain assets at the current level of around €4.7trillion by reinvesting maturing securities well into 2021. We further expect the ECB to hold interest rates on the deposit facility as wellas the refinancing rate at current levels for the rest of the year, with the first rate hike not occurring until the first half of 2020. The ECBwill likely continue to provide cheap long-term funding to banks by extending the targeted longer-term refinancing operations (TLTRO)program, given the substantial marking down of growth expectations in the euro area’s largest economies and the continuing concernsaround monetary policy transmission in weaker economies such as Italy.
Meanwhile, for the Bank of Japan (BoJ), although the economy is performing at full capacity, the 2% medium-term inflation targetremains elusive. In January, the BoJ left its monetary policy unchanged, with the short-term rate at minus 0.1% and the target 10-yearbond yield at zero percent. The BoJ lowered its inflation forecast yet again in its January outlook report, with core inflation (excludingfood) now expected to increase to 1%-1.3% by the end of 2019, down from the prior projection of 1.5%-1.7%. With inflation likely tobe persistently low, there is little scope for tighter monetary policy in Japan this year or in 2020.
The pause in the US interest rate cycle may ease pressure on central banks elsewhere. In addition to Argentina and Turkey, othercountries including Chile, Indonesia, India, Mexico, the Philippines, Russia, South Africa and Thailand raised rates in 2018. The movesrepresented an attempt to stabilize their currencies as financial inflows to emerging market countries dried up. The pause in the Fed’sinterest rate cycle may give some of these countries room to tailor monetary policy to domestic economic conditions.
Global growth will continue to weaken after peaking in 2018In sharp contrast to a year ago, economic data across a wide range of countries suggests that a global slowdown is underway, in linewith our long-standing view that global growth will lose pace in 2019 after peaking in 2018. Softer data on industrial activity includingglobal industrial production, PMI and trade growth point to a weakening of momentum on the production side, particularly in the euroarea and China (see Exhibits 5 and 6). Manufacturing activity has also visibly slowed in Germany, Japan and Korea. The US economyhas defied the slowing trend so far. Nonetheless, it is likely to moderate over the next two years because of cooling fiscal impulse andcapital spending.
Exhibit 5
Growth in industrial activity has slowedThree-month moving average
Exhibit 6
Momentum is weakening, particularly in Europe and China50+ = Expansion, Three-month moving average
-4%
-3%
-2%
-1%
0%
1%
2%
3%
4%
5%
6%
2013 2014 2015 2016 2017 2018 2019
Ind
ustr
ial P
rod
uctio
n e
x.
Co
nstr
uctio
nY
oY
%,
3-m
o m
ovin
g a
vg
.
World Advanced EconomiesEmerging Economies United States
Source: Haver Analytics
-25%
-20%
-15%
-10%
-5%
0%
5%
10%
15%
20%
25%
35
40
45
50
55
60
65
2013 2014 2015 2016 2017 2018 2019
Yo
Y %
Cha
ng
e (
3-m
o m
ovin
g a
vg
.)
New
Exp
ort
Ord
er
(Vo
lum
e)
Ind
ex
50
+ =
Exp
an
sio
n, 3
-mo m
ovin
g a
vg.
US China EU 28 (RHS)
Source: Haver Analytics
Momentum in many emerging market countries moderated in the second half of 2018 as a result of financial stress brought on bytightening financial conditions and slowing global growth (see Emerging Markets - Global: 2019 outlook broadly stable; higher rates,politics and trade tensions pose some risks, November 15, 2018). A slowdown in China, primarily brought on by domestic policiesaimed at deleveraging and de-risking, further weighed on growth in some countries, particularly externally oriented economies. As theweak momentum has carried through into 2019, we expect growth in emerging market countries in aggregate to slow significantlythis year, dragged down by a weakening in China, as well as recessions in Turkey and Argentina. But in 2020, a slight upturn in growthis likely in emerging markets outside of China, given that many of these countries have large negative output gaps. Rapid adjustmenthas been underway in Turkey and Argentina since last year, when external and internal financial conditions tightened significantly.In the case of Brazil, economic momentum remains weak but is picking up, more than a year after its recession ended. Mexico’s
3 28 February 2019 Global Macro Outlook 2019-20 (February 2019 Update): Global economy will continue to weaken throughout 2019 and into 2020
economy, while continuing to grow, is barely keeping pace with that of its main trading partner, the US. South Africa’s economy hasalso struggled to gain traction. By contrast, growth rates in emerging market economies in Asia, particularly India and Indonesia, haveheld up reasonably well. But without strong external drivers, there is limited upside.
In many advanced economies, including the US, the euro area and Japan, strengthening labor markets are one of the most importantfactors supporting domestic demand. Rising employment and increasing incomes should continue to support consumption dynamics,which remain the most important driver of growth. A delay in global monetary policy normalization should help prolong the currentexpansion. Positive fiscal impulse in a number of economies, including China, the euro area, Japan, South Korea, India and Indonesia,may additionally mitigate the risk of a sharp slowdown.
Exhibit 7
Global macroeconomic outlook for G-20 countries, 2019-20(February 2019 update)
Economies
18E 19F 20F Target 17 18E 19F 20F 17 18E 19F 20F 18E 19F 20F
Real GDP Growth Inflation 2 Unemployment Rate Monetary
Policy
Growth Forecast Adjustment from the previous outlook 4
-3.0
-2.0
-1.0
0.0
1.0
2.0
3.0
4.0
5.0
6.0
7.0
8.0
18E 19F
TighteningAccommodative Maintain current policyAn upward adjustment ≥ 0.3 pp A downward adjustment ≥ 0.3 pp
1. G-20 euro area forecasts include 19 countries. 2. Dec-to-Dec % change. 3. Exchange rate arrangement is conventional peg to the US dollar. 4. See our previous Global MacroeconomicOutlook, Global growth to decelerate amid tightening global liquidity and elevated trade tensions, November 8, 2018. 5. Argentina's central bank replaced its inflation targeting regimewith a target of zero growth in nominal terms in the monthly average of the monetary base from October 2018 until June 2019.Source: Moody's Investors Service
Waning fiscal impulse will moderate US growth momentumAfter recording 2.9% growth in 2018, the US economy will likely grow at a slower pace of 2.5% in 2019 followed by 1.7% in 2020.We forecast that the partial government shutdown that ended on January 31 shaved about one-fourth of a percentage point off thefirst-quarter annualized growth rate, although much of that will be made up in the second quarter. There is reason to believe that
4 28 February 2019 Global Macro Outlook 2019-20 (February 2019 Update): Global economy will continue to weaken throughout 2019 and into 2020
there was strong underlying momentum in domestic demand going into 2019. Labor market data and the ISM manufacturing surveycorroborate this view. In fact, the rebound in the ISM manufacturing PMI to 56.6 in January, after dropping 4.5 percentage points to54.3 in December, has dispelled fears of a rapid deceleration in the industrial sector.
The strength of the household sector, which is by far the most important driver of US growth, stems from ongoing gains inemployment and income. The positive fundamentals, highlighted by the January increase in nonfarm payrolls to 304,000, underpinthe view that the current expansion has legs. We expect employment growth and hours worked to slow over time given the limitedscope for further employment gains when the unemployment rate is already very low around 4%. Nominal wages are showing signs ofstrengthening, with growth in average hourly earnings of production and nonsupervisory employees up almost one percentage pointto 3.4% in January from 2.5% a year earlier. The positive labor market backdrop should continue to support solid consumer spendingthis year, provided that consumer confidence, which declined in January amid financial market volatility and the partial governmentshutdown, stabilizes. But the economy could slow much more rapidly than we currently forecast if consumers pull back on theirspending. Such a pullback could occur if households start worrying about multiple sources of uncertainty, including financial marketvolatility, changing US trade policies and employment prospects.
Several factors could drag down economic growth in the coming quarters, including slower capital spending and trade, both of whichhave likely peaked. Financial conditions are supportive overall but less so than a year ago. Additionally, waning fiscal impulse willfurther weigh on economic momentum later in 2019 and in the first half of 2020. The synchronous slowdown in major economiesoutside the US will further dampen growth.
We see both internal and external risks to the US economy. Capacity constraints are becoming evident with businesses increasinglyreporting labor shortages and higher employment costs. Together, these factors could limit companies’ revenue growth potential andsqueeze profit margins. Also, the unusually high degree of policy uncertainty with regard to trade is dampening business optimism andcould impede investment. There is anecdotal evidence that this has occurred. In the December and January publications of the Fed’sBeige Book, a few respondents are reported to have expressed concern that trade uncertainty is weighing on business decisions andoptimism.
As discussed above, the FOMC adopted a more dovish stance at its January meeting by promising patience with future rate increases.With the economy at full employment and inflation firmly anchored around the Fed's medium-term objective, the central bank islooking to expand the duration of the economic cycle. Financial markets have interpreted this to mean that the interest rate cyclehas ended and that the Fed's next move will be a rate cut when the economy slows further in 2020. Tame inflationary pressuresshould allow the central bank to take time and adopt a “wait and watch” approach to monetary policy normalization. One or two rateincreases of 25 basis points each are still very likely given the strong underlying wage pressures associated with labor supply shortagesacross a wide range of sectors and prospects of eventual overheating. We believe that even with one or two rate hikes the policy stancewill remain broadly neutral.
Exhibit 8
Signs of US labor market pressuresYoY % change | quits rate
Exhibit 9
Weak EA Q4 data point to slowdown% change | 50+ = expansion
3.7%
2.6%
-1%
0%
1%
2%
3%
0%
1%
2%
3%
4%
5%
2004 2007 2010 2013 2016 2019
Qu
its R
ate
Yo
Y %
Cha
ng
e
Wage growth gap for job switchers vs job stayers
Avg Weekly Earnings: Prod & Nonsupervisory
JOLTS: Quits Rate: Total Private [RHS]
Sources: Havers Analytics, JOLTS, ECI
0.6% 0.9%
0.1%
40
45
50
55
60
-4%
-3%
-2%
-1%
0%
1%
2%
3%
4%
5%
2014 2016 2018 2014 2016 2018 2014 2016 2018
50
+ =
Exp
an
sio
n
Yo
Y %
Ch
an
ge
GDP Growth PMI Manufacturing (RHS)
Germany France Italy
Sources: Haver Analytics, national sources, IHS Markit
5 28 February 2019 Global Macro Outlook 2019-20 (February 2019 Update): Global economy will continue to weaken throughout 2019 and into 2020
MOODY'S INVESTORS SERVICE CROSS-SECTOR
Euro area economy will continue to expand at a slower paceThe recent economic performance in the euro area was disappointing. Although we fully expected a deceleration from the well-abovetrend growth rates in early 2018, we did not expect the virtual stalling of growth momentum in the second half of 2018. A host offactors collectively weighed on sentiment and growth in the euro area. These factors included trade uncertainty, weak demand fromChina, uncertainty regarding the outcome of Brexit negotiations, recriminations between the European Union and Italy, France’s“yellow vest” movement and specific problems in Germany’s auto industry. While some of these factors are transitory, we do notexpect a return to previous peaks.
Economic activity in the euro area economies moderated to 1.4% year-over-year in the second half of 2018 compared with 2.3% inthe first half. Incoming data indicates that the weakness has carried into 2019. Of the three largest euro area economies, Italy is inrecession while Germany narrowly missed a technical recession. Domestic demand in France was likely muted, with the “yellow vest”protests severely affecting consumption and investment. However, strong exports helped the economy maintain growth.
We expect the euro area economy overall to grow at a slower pace in 2019 and 2020 at 1.6% and 1.5%, respectively, down from1.9% in 2018. The unpredictability of trade policy, particularly with regard to the auto sector and Brexit, will continue to pose externalchallenges. In addition to a difficult external environment, downside risks to the euro area economy also come from fragile sentiment.Economic confidence indicators recently have slipped in Germany, France and Italy, and a persistent deterioration could dent domesticdemand. Political noise in individual countries and the associated increase in political risk also inject policy uncertainty, which couldweigh on sentiment and growth.
Given the backdrop of an increasingly uncertain growth environment, we expect the ECB to maintain its current accommodative policystance. The central bank already ended new purchases under its quantitative easing program in December. It now seems unlikely thatthe ECB will take any additional measures to reduce the policy stimulus it is currently providing. Moreover, with core inflation stillaround only 1%, there is little urgency for further normalization. We now expect the ECB to raise its benchmark rate only in 2020,provided the growth outlook stabilizes. We also believe the ECB will continue to provide liquidity to the banking system through a newTLTRO program.
Italy’s economy struggled to maintain traction in 2018, which ended with a recession in the second half with two consecutive quartersof negative quarterly growth. One of the main reasons for weaker economic activity was the slump in domestic demand triggeredby a pullback in sentiment and tighter financial conditions on the back of widening yield spreads. Spreads eased somewhat after thegovernment and the EU reached a budget agreement in December, but they remain elevated. We expect Italy’s economic growth toremain anemic at around 0.4% in 2019 and 0.8% in 2020, compared with 0.8% in 2018. However, political uncertainty will remainhigh through 2019, and there is a risk of much-weaker growth than our forecasts anticipate. Deteriorating economic conditions couldfurther reinforce political instability and strain investor and consumer confidence. Thus, political and economic dynamics are creatingsignificant downside risks to Italy’s economy.
According to preliminary estimates, Germany's economy appears to have grown by only 1.5% in 2018, one percentage point lowerthan the 2017 rate. The fourth-quarter recovery was weak at an estimated 0.02% on a quarterly basis after a 0.2% decline in the thirdquarter. External demand was weak, while domestic demand largely held up. Investment spending remained fairly robust throughthe second half of the year. Domestic drivers of growth remain intact, supported by an ultra-easy monetary policy stance in the euroarea. Nonetheless, we expect Germany's economy to grow by around 1.5% again this year, followed by 1.3% in 2020, on account ofdecelerating global growth.
The French economy slowed to 1.5% growth in 2018 from 2.2% in 2017. We expect the economy to continue to grow around 1.5%this year and in 2020, mainly supported by solid domestic demand. In particular, low inflation and fiscal measures, including a hike tominimum wages, should boost household consumption in the coming quarters.
UK’s economic outlook clouded by higher likelihood of a no-deal BrexitThe UK’s economic growth outlook is predicated on the outcome of negotiations regarding its exit from the EU. The odds of the UKleaving without a deal have significantly increased since the January 15 vote in the House of Commons against a government motionto approve the draft withdrawal agreement and framework for the UK’s future relationship with the EU. We have laid out four potentialscenarios in our latest Brexit Monitor. The scenarios on either end are a no-deal Brexit or a revocation of Article 50, in which the UK
6 28 February 2019 Global Macro Outlook 2019-20 (February 2019 Update): Global economy will continue to weaken throughout 2019 and into 2020
remains in the EU. Alternatively, the Article 50 process could be extended, allowing more time for negotiations, or parliament couldhave a second vote to allow the country to leave the EU and enter a two-year transition period until December 2021.
The impact of persistent uncertainty around the Brexit outcome is evident in worsening business and consumer sentiment in the UK.Investment in effect stalled in 2018. Businesses are simply not investing amid prevailing uncertainty. Recent data also shows that theuncertainty has now started to weigh on consumption and the housing market. We forecast real GDP growth in the UK of 1.4% in2019 and 1.4% in 2020, up from an estimate of 1.4% in 2018. Our baseline forecasts assume there will be some sort of an agreementand, most importantly, greater clarity on the broad contours of the UK’s future relationship with the EU, which will facilitate decisionmaking.
No-deal outcome would be deterimental to the UK
What is Moody's baseline scenario? We still expect the UK's parliament to eventually approve an agreement between the UK and the
EU to ensure an orderly Brexit.1 At the moment, the UK is due to leave the EU on March 29, and the fear of a no-deal Brexit could persuadewavering MPs to support Prime Minister Theresa May’s draft agreement. However, if parliament does not support an agreement then thedefault position will be for the UK to leave the EU without a deal. There appears to be a clear majority in the UK parliament that oppose thisoutcome, but it is currently unclear how they can ensure it is avoided. With time running out, the chance of an extension of the two-year
negotiation period for Brexit is increasing, as both the UK and the EU want to avoid a no-deal outcome.2
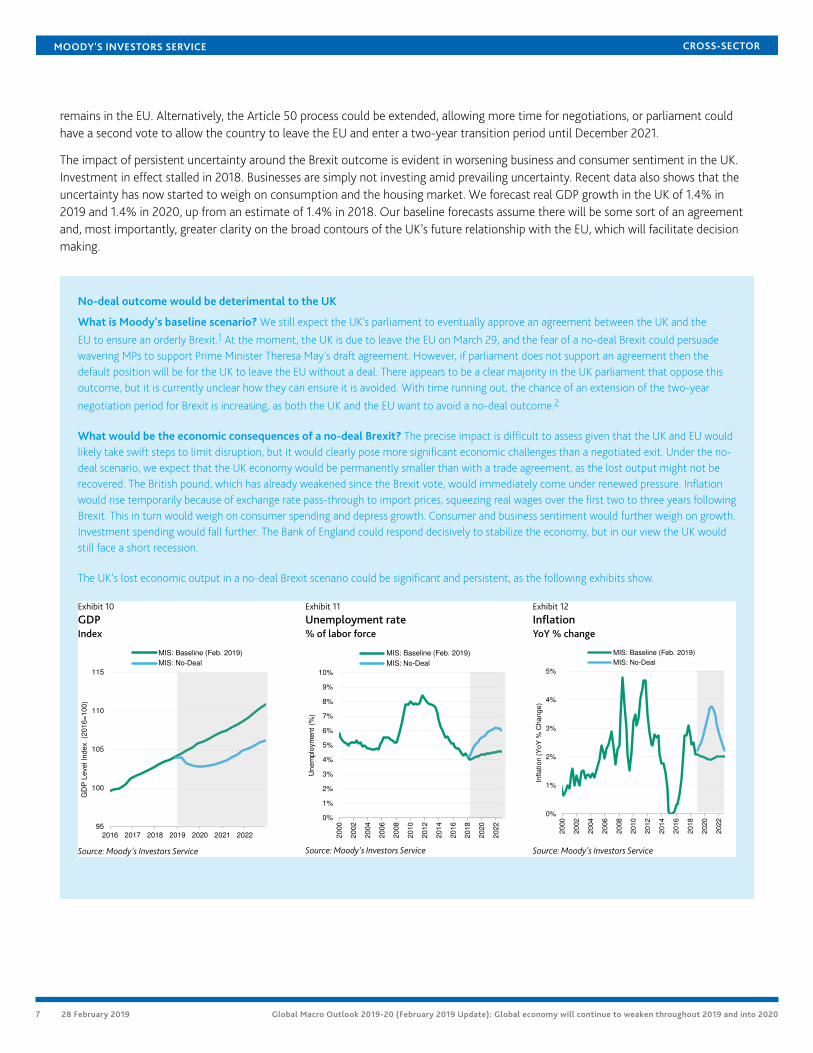
What would be the economic consequences of a no-deal Brexit? The precise impact is difficult to assess given that the UK and EU wouldlikely take swift steps to limit disruption, but it would clearly pose more significant economic challenges than a negotiated exit. Under the no-deal scenario, we expect that the UK economy would be permanently smaller than with a trade agreement, as the lost output might not berecovered. The British pound, which has already weakened since the Brexit vote, would immediately come under renewed pressure. Inflationwould rise temporarily because of exchange rate pass-through to import prices, squeezing real wages over the first two to three years followingBrexit. This in turn would weigh on consumer spending and depress growth. Consumer and business sentiment would further weigh on growth.Investment spending would fall further. The Bank of England could respond decisively to stabilize the economy, but in our view the UK wouldstill face a short recession.
The UK’s lost economic output in a no-deal Brexit scenario could be significant and persistent, as the following exhibits show.
Exhibit 10
GDPIndex
Exhibit 11
Unemployment rate% of labor force
Exhibit 12
InflationYoY % change
95
100
105
110
115
2016 2017 2018 2019 2020 2021 2022
GD
P L
eve
l In
de
x
(20
16
=1
00
)
MIS: Baseline (Feb. 2019)
MIS: No-Deal
Source: Moody's Investors Service
0%
1%
2%
3%
4%
5%
6%
7%
8%
9%
10%
20
00
20
02
20
04
20
06
20
08
20
10
20
12
20
14
20
16
20
18
20
20
20
22
Un
em
plo
ym
en
t (%
)
MIS: Baseline (Feb. 2019)
MIS: No-Deal
Source: Moody's Investors Service
0%
1%
2%
3%
4%
5%
20
00
20
02
20
04
20
06
20
08
20
10
20
12
20
14
20
16
20
18
20
20
20
22
Infla
tio
n (
Yo
Y %
Cha
ng
e)
MIS: Baseline (Feb. 2019)
MIS: No-Deal
Source: Moody's Investors Service
7 28 February 2019 Global Macro Outlook 2019-20 (February 2019 Update): Global economy will continue to weaken throughout 2019 and into 2020
MOODY'S INVESTORS SERVICE CROSS-SECTOR
Japan's economy is also slowingThe slowdown in global growth and trade is having a detrimental impact on business investment in Japan. The economy reboundedat a quarterly annualized rate of 1.4% in the fourth quarter of 2018, after dipping by 2.6% in the third quarter. The third-quarterweakness was mainly driven by a drop in exports and one-off factors, including a typhoon, torrential rains and an earthquake. A revivalin domestic demand, both consumption and investment spending, offset the additional decline in net exports in the fourth quarter. Themodest but steady rise in wage growth should remain supportive of domestic household spending. Japan's economy remains at riskfrom US-China trade friction and slower external demand growth. However, the fiscal and monetary policy mix will remain supportive.The government is planning ¥101.5 trillion ($931.45 billion) in additional spending to offset the impact of the planned sales tax hikescheduled for October.
We expect Japan's real GDP to grow by 0.8% in 2019 and 0.4% in 2020, after registering 0.7% growth in 2018. Our forecasts assumethat the government will follow through with the proposed consumption tax increase in October 2019. Similarly to the previousepisode, private consumption will likely be pulled forward, ahead of the tax hike, and be followed by a temporary slump in 2020.We expect the consumption sales tax increase to push the inflation rate temporarily above 2.0% at the end of 2019. But a sustainedstrengthening of the inflation rate remains elusive despite the elimination of cyclical slack.
Inflation expectations remain stubbornly low despite the extraordinary monetary accommodation, which includes a massive expansionof the central bank’s balance sheet through purchases of Japanese government bonds (JGBs), corporate bonds, real estate investmenttrusts, and exchange-traded funds, and the yield curve control framework, with negative short-term rates and the 10-year JGB yield atzero.
Exhibit 13
Real GDP growthContribution to GDP growth
Exhibit 14
Japan's labor market is strengtheningYoY % change | Ratio
Exhibit 15
Investment is weakening in South KoreaYoY contribution to real GDP growth
-3%
-2%
-1%
0%
1%
2%
3%
4%
5%
6%
2010 2012 2014 2016 2018
Co
ntr
ibu
tio
n to
GD
P g
row
th (
%)
Net ExportInvestmentGovernment ConsumptionPrivate ConsumptionGDP
Source: Moody's Analytics
0.0
0.5
1.0
1.5
2.0
2.5
3.0
-3%
-2%
-1%
0%
1%
2%
3%
4%
2010 2012 2014 2016 2018
Ratio
Yo
Y %
ch
an
ge
Cash Earning
Ratio of New Job Openings toApplications (RHS)
Sources: Haver Analytics, Ministry of Economy, Trade &Industry in Japan
-4%
-2%
0%
2%
4%
6%
8%
2009 2011 2013 2015 2017 2019
Co
ntr
ibu
tio
n to
GD
P g
row
th (
%)
Contribution from Private InvestmentReal GDP Growth
Source: Moody's Analytics
Deteriorating conditions are straining South Korea's economyWe forecast real GDP growth in South Korea slightly above 2.0% in both 2019 and 2020, markedly lower than the 2.7% growth in2018. The weakening of the investment cycle and the deceleration in global trade have hurt economic momentum. Subdued demandfor intermediate products from China, especially semiconductors, has had an adverse impact on exports as well as on the investmentoutlook. A minimum-wage increase is largely blamed for the lackluster employment growth, with small businesses viewing the hikes asa challenge to their competitiveness. Minimum wages rose 16% in 2018, to be followed by an additional 10.9% this year.
On the policy front, expansionary fiscal and monetary policy will partially offset the impact of deteriorating domestic and externalconditions. The government plans to spend as much as $21 billion, or KRW 23.5 trillion, an increase of 22% from the 2018 budgetproposal, to boost job growth through subsidies and other measures to facilitate new hiring and job training. High household debtabove 160% of disposable income is constraining the outlook for consumer spending. However, the higher minimum wages willsupport consumer spending, as will better job prospects if fiscal measures work.
8 28 February 2019 Global Macro Outlook 2019-20 (February 2019 Update): Global economy will continue to weaken throughout 2019 and into 2020
MOODY'S INVESTORS SERVICE CROSS-SECTOR
Inflation in South Korea remains contained. We expect the Bank of Korea (BoK) to maintain a relatively accommodative monetarypolicy stance. The BoK raised its benchmark policy rate by 25 basis points at the end of November to 1.75%, while Governor Lee Ju-yeol said that it remained below the neutral rate. The central bank remains concerned about the financial stability implications of highhousehold debt, voicing a preference for reduced policy accommodation to lean against further deterioration in household balancesheets. But given the deterioration in the expectations around the domestic economic outlook, we expect the central bank to pause thetightening cycle until at least the end of 2019.
In China, growth is slowing as expected, despite significant fiscal and monetary stimulusGrowth in China’s industrial sector moderated in 2018 mainly because of deliberate deleveraging measures put in place to correctinternal imbalances and to contain financial risk associated with credit-fueled growth. A tighter supply of credit through 2018dampened economic activity after a long period of high economic growth sustained by credit creation. Uncertainty about US tradepolicies further compounded the adverse impact of deleveraging measures, resulting in a rapid slowdown of the economy in the secondhalf of 2018. Real GDP growth slowed to 6.6% in 2018 from 6.9% in 2017, with the deceleration more pronounced toward the end ofthe year. We expect the pace of economic activity to slow further in 2019 to around 6.0% and to hold steady around that rate in 2020.
The latest high frequency data continues to point downward (see Exhibits 16 and 17). The pace of retail sales growth has steadilydeclined over the last year, ending at 8.2% growth in December. This is lower than the average growth rate of more than 10% in 2017.On the production side, industrial production appears to be holding up. But the China Caixin Manufacturing PMI, which capturesactivity of small, externally focused private sector companies, fell to 48.3 in January 2019 from 49.7 in December. The January readingof the latest Official NBS Manufacturing PMI, which places a greater weight on state-owned companies, came in at 49.5, also a lowlevel by historical standards.
Exhibit 16
Contraction in the manufacturing sector50+ = Expansion, CAIXIN vs. official PMI
Exhibit 17
Continued deceleration in Chinese retail salesYoY % change
46
48
50
52
54
56
46
48
50
52
54
56
2010 2011 2012 2013 2014 2015 2016 2017 2018 2019
50
+ =
Exp
an
sio
n
PMI Official Manufacturing Caixin PMI Manufacturing
Source: Haver Analytics, IHS Markit
0%
5%
10%
15%
20%
25%
30%
35%
0%
2%
4%
6%
8%
10%
12%
2010 2011 2012 2013 2014 2015 2016 2017 2018
Yo
Y %
Cha
ng
e
Real GDP Growth
Investment in Fixed Assets (RHS)
Retail Sales (RHS)
Sources: Haver Analytics, China National Bureau of Statistics
The government is attempting to engineer a gentle deceleration by simultaneously pursuing policies to provide economic support,while also reducing overall leverage in the nonfinancial sector and reducing risks to the financial sector. The downward shift in growthmomentum has prompted Chinese authorities to adopt a set of stimulative fiscal and monetary measures to support the slowingeconomy.
On the fiscal side, instead of relying on higher spending on infrastructure as it has done in the past, the Chinese government hasannounced tax cuts and fee reductions for households and companies totaling around 2 trillion yuan ($300 billion). Monetarypolicy measures have focused on increasing liquidity to the banking system through open market operations, lower required reserverequirements and a targeted medium-term lending facility to provide stable funds to commercial banks. The government has alsomade efforts to spur lending to small and medium-sized entities.
To what degree the fiscal and monetary measures support growth remains to be seen. While the fiscal measures will support householddisposable incomes and corporate cash flow, the impact may be limited if households and businesses hold back spending amidprevailing economic uncertainty. Similarly, the growth-supportive impact of easier liquidity could be limited if banks are unwilling
9 28 February 2019 Global Macro Outlook 2019-20 (February 2019 Update): Global economy will continue to weaken throughout 2019 and into 2020
MOODY'S INVESTORS SERVICE CROSS-SECTOR
to lend to small and medium-sized entities, which are inherently riskier. Banks may be cautious about such lending, despite theencouragement of the authorities, because of concerns over potential damage to their balance sheets. The measures are yet to havethe intended stabilizing impact on the private manufacturing sector. We believe that substantial policy support will remain in placewith the potential for easing in the pace of deleveraging of the economy.
Exhibit 18
People's Bank of China's interest rate corridor% rate | trillion yuan
Exhibit 19
Boost in credit through various lending facilities in China% of GDP | reserve requirement ratio (RRR)
Medium Term Leding Facility (MLF) RRR (Small/Medium, RHS)
RRR (Large, RHS) RRR (Rural, RHS)
Sources: Haver Analytics, People's Bank of China
Growth will be steady in India and IndonesiaBoth India and Indonesia are poised to grow at a relatively stable pace in 2019 and 2020. We expect India's economy to grow around7.3% in both years, while only a modest slowdown is likely in Indonesia, to just under 5.0% from around 5.2% in 2018. While high byinternational standards, these growth rates are at or slightly below India's and Indonesia's potential.
While not immune, India and Indonesia are less exposed to a slowdown in global manufacturing trade growth than other majorAsian economies and emerging markets. In India, government spending announced ahead of elections this year will support near-term growth. Central banks in both countries are also likely to be able to maintain their current monetary policy stance after sometightening last year.
Indian household spending growth will remain stable. A recent positive development is a pickup in investment spending and exports,after weak growth in 2017. In fact, with rangebound oil prices, export growth has outpaced import growth for the last two years. Fiscalspending on infrastructure and the rural economy should continue to support domestic activity. Ahead of the upcoming elections andamid financial distress among small farmers from prolonged low food price increases, the government included a special relief packagefor farmers in the interim budget. The budget also includes tax breaks for middle-class earners through tax rebates and an increasedstandard deduction. Together, the direct cash transfer program for farmers and the middle-class tax relief measures will contribute afiscal stimulus of about 0.45% of GDP. These measures will support growth through consumption over the near term, albeit at a fiscalcost (see Cross-Sector - India: Interim budget measures aimed at boosting growth pose risks to fiscal consolidation, February 4, 2019).
The Reserve Bank of India cut its benchmark policy rate in February and changed the policy stance to “neutral” from “calibratedtightening.” Inflation measures have steadily declined since the middle of 2018. The headline inflation rate declined to only 2.04%in January, largely because of declining food prices, even though core inflation at 5.6% remains only slightly below the central bank’starget.
Although the overall strength of the banking system is improving, it remains a constraint on the economy. In February 2019, thegovernment provided further capital infusions to public sector banks. These measures, combined with the application of the PromptCorrective Action framework, which requires timely recognition of bad loans, and resolution of bad loans through the Insolvencyand Bankruptcy Code, are helping to address solvency and asset quality challenges. However, a complete turnaround of the bankingsystem requires more time amid slower-than-expected resolution of legacy problem loans. According to the Reserve Bank of India,
10 28 February 2019 Global Macro Outlook 2019-20 (February 2019 Update): Global economy will continue to weaken throughout 2019 and into 2020
nonperforming assets declined to 10.8% in September 2018 from a peak of 11.5% in March 2018. The central bank expects this ratio toimprove further to 10.3% in March 2019. As Exhibit 20 shows, bank credit has also started to flow, with growth of outstanding creditfrom commercial banks at 12.8% in December 2018.
Exhibit 20
India's monetary policy stance has shifted to “neutral” from“calibrated tightening”% rate | YoY % change
Exhibit 21
Indonesian central bank likely to pause the rate hike cycle for anextended period% rate | YoY % change
Growth momentum will improve in Latin America, but differences persistAmong the three G-20 Latin American countries, only Brazil’s economy is likely to accelerate. Argentina’s economy will shrink againthis year, while Mexico's has decelerated sharply amid political transition but should pick up modestly in 2020.
We forecast Brazil's real GDP growth will rise to 2.3% in 2019 followed by 2.5% in 2020, from 1.8% in 2018, spurred by improvingeconomic sentiment. Our forecasts assume that improved business sentiment, strengthened by expectations of pension reformsand a pro-business agenda, will foster investment and strengthen the growth cycle. The central bank will likely continue its fairlyaccommodative policy agenda given that the inflation rate remains well within target.
Multiple shocks hit Argentina’s economy hard last year, including a historic drought, a prolonged currency crisis and a contractionaryfiscal and monetary policy response. The economy is undergoing a painful adjustment process. We estimate that the economycontracted by 2.5% in 2018 and that it will shrink an additional 1.5% in 2019, followed by positive but weak growth of 1.5% in 2020.A stringent policy framework together with an IMF program has eased financial market sentiment vis-a-vis Argentina. While the pausein the US interest rate cycle will provide much-needed relief, we expect Argentina’s central bank to continue to follow a very tightmonetary policy in an attempt to restore policy credibility. Thus, we do not expect an easing of its policy stance anytime soon.
Mexico's economic momentum has decelerated in recent months, in part because of the political transition. The country's entirebureaucracy tends to get replaced with each administration. It is widely believed that this lack of continuity dampens growth in the firstyear after elections. In addition, a tight monetary policy has weighed on investment spending. Given the weak outlook, we believe thatthe central bank will look to ease interest rates this year. The Fed's pause in additional rate hikes may provide space for the Mexicancentral bank to ease. Among emerging market countries, Mexico is the most vulnerable to a protracted slowing of the US economy. Italso stands out in the region as the most exposed to weaker global trade, although ratification of the US-Mexico-Canada Agreementwould be positive for the economy because it would reduce some of the uncertainty surrounding Mexico's trade relationship with theUS and Canada. In the medium term, Mexico could benefit from trade diversion away from China.
11 28 February 2019 Global Macro Outlook 2019-20 (February 2019 Update): Global economy will continue to weaken throughout 2019 and into 2020
MOODY'S INVESTORS SERVICE CROSS-SECTOR
Exhibit 22
Brazil's industrial production lags strong business sentiment50+ = Expansion | Index [2012=100]
Exhibit 23
Mexico's investment remains weakYoY % change
80
85
90
95
100
105
110
115
30
35
40
45
50
55
60
65
2013 2014 2015 2016 2017 2018 2019
Index [
2012=
100]
50+
=G
row
th
Business Confidence Index IP (excl. Construction, RHS)
Source: Haver Analytics
-8%
-4%
0%
4%
8%
12%
16%
-4%
-2%
0%
2%
4%
6%
8%
2010 2011 2012 2013 2014 2015 2016 2017 2018 2019
Yo
Y %
Cha
ng
e
Economic Activity IndicatorIndustrial Production Gross Fixed Capital Formation
Source: Haver Analytics
Turkey’s economy continues to shrinkLike Argentina, Turkey is also undergoing a painful adjustment to last year’s currency crisis. Real GDP declined by 1.1% on a quarterlybasis in the third quarter of 2018, in line with our expectations. We expect the economy to shrink a further 2.0% this year, followedby a recovery in 2020, with a real GDP growth forecast of 3%. As expected, according to the third-quarter data, domestic demand hasfallen sharply. Higher interest rates have curtailed investment, which decreased by 3.6% in the third quarter, while consumer spendingdecreased by 3.9%. The unemployment rate rose to 12.0% in November from 9.9% in January. Consumer confidence has plunged sinceJuly. While the current account deficit has turned to surplus since August, it is in large part because of a steep fall in imports and loweroil prices. On a positive note, the inflation rate has edged lower since October 2018 and it should decline further as aggregate demandcontinues to fall. But we do not expect the inflation rate to fall fast enough to allow for policy easing any time soon.
Risks to our global growth forecasts are biased firmly to the downsideGlobal growth is at risk from three main triggers: (1) a sharper slowing of China's economy, (2) an escalation of trade hostilities, and (3)financial market turbulence along with a rapid tightening in financial conditions.
Risk of a sharper slowing of China's economyAs discussed above, Chinese authorities are engaged in policies aimed at reducing risks associated with excessive credit growth whilealso preventing the economy from slowing too sharply with the help of offsetting fiscal and monetary policy stimulus measures. Thepolicy objective of reducing financial sector risk and preserving a steady growth momentum are inherently at odds with each other.There is a risk that while maintaining growth and employment, including through more proactive monetary and fiscal policy, existingimbalances are unaddressed and further imbalances will build, such as overproduction in certain export sectors or new technologysectors. Further significant misallocation of resources would have longer-term consequences for growth.
There is also a risk of a sharper slowdown resulting from less effective policy than we currently assume. If the economy sharplydecelerates, it would have negative spillovers on the global economy through trade channels, commodity prices and sentiment. Apotentially large depreciation of the renminbi would be similarly disruptive, particularly for emerging market countries. Lastly, internalimbalances typically magnify in a slowing growth environment as servicing legacy debt becomes more onerous.
Escalation of US-China trade tensions seems less likelyUS trade policy is in flux. Two main areas of concern have been the proposed additional tariffs on imports from China and tariffs onauto and auto parts. With regard to the former, President Trump has postponed a March 2 deadline for raising tariffs on $200 billionof Chinese goods to 25% from 10% currently. The postponement suggests that trade talks between the two countries are progressingand that the US and China could reach a compromise on some trade issues in the coming months. But while economic incentivesto strike a deal are high for both governments, the process is unlikely to be smooth or without hurdles. We continue to expect US-China relations to swing between conflict and compromise over a multiyear period (see Cross-Sector - Global: US-China relations toremain contentious, clouding global credit conditions, December 2018 and Global Trade Monitor - January 2019: Trade uncertainty
12 28 February 2019 Global Macro Outlook 2019-20 (February 2019 Update): Global economy will continue to weaken throughout 2019 and into 2020
is beginning to affect investment decisions, January 2019). National interests of the two countries diverge in several areas, and bothare strong enough to resist compromising on their key executive and national goals. Frictions center on trade, technology, investmentand geopolitics. We believe that the US and China will be more amenable to compromise on trade policies than on technology andnational economic strategy. Thus, tensions will persist over the long run.
Meanwhile, the US administration has considered imposing 25% tariffs on all imported autos and parts, which could pose enormousrisk. The damage resulting from such tariffs would not just be restricted to the US and global auto industries with their extensive supplychains and linkages to other sectors. The tariffs would also harm economic momentum in advanced economies including Germany,Japan and Korea.
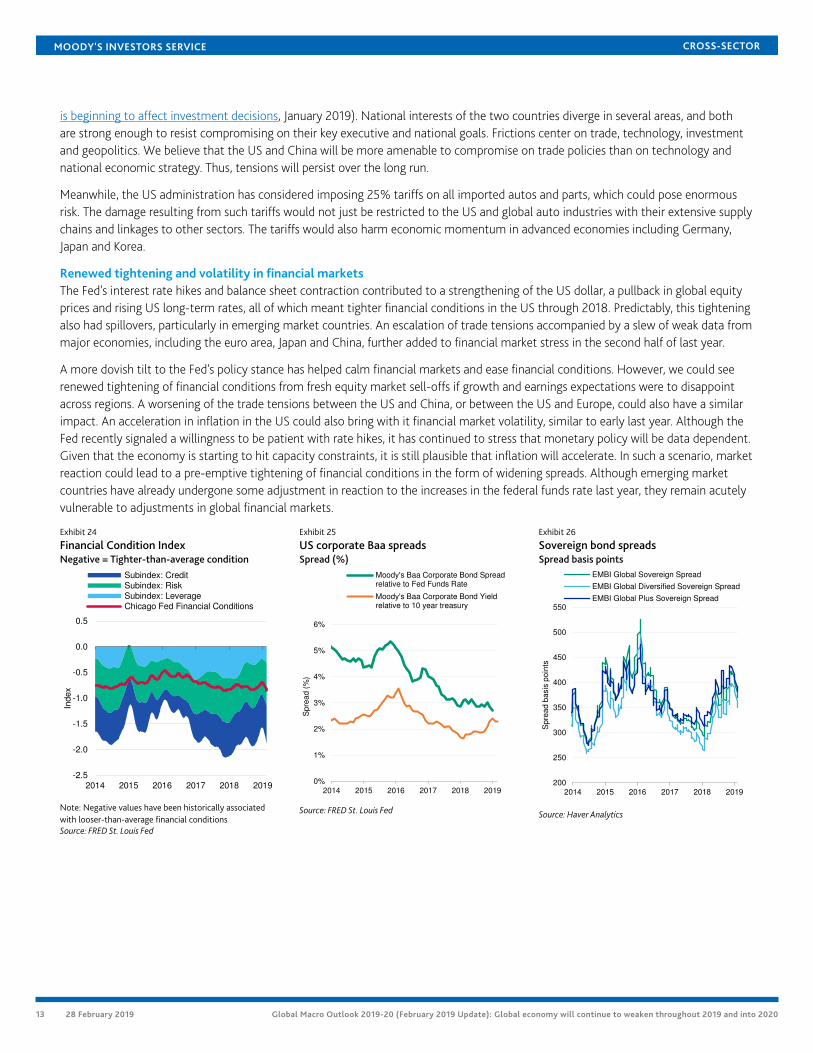
Renewed tightening and volatility in financial marketsThe Fed's interest rate hikes and balance sheet contraction contributed to a strengthening of the US dollar, a pullback in global equityprices and rising US long-term rates, all of which meant tighter financial conditions in the US through 2018. Predictably, this tighteningalso had spillovers, particularly in emerging market countries. An escalation of trade tensions accompanied by a slew of weak data frommajor economies, including the euro area, Japan and China, further added to financial market stress in the second half of last year.
A more dovish tilt to the Fed's policy stance has helped calm financial markets and ease financial conditions. However, we could seerenewed tightening of financial conditions from fresh equity market sell-offs if growth and earnings expectations were to disappointacross regions. A worsening of the trade tensions between the US and China, or between the US and Europe, could also have a similarimpact. An acceleration in inflation in the US could also bring with it financial market volatility, similar to early last year. Although theFed recently signaled a willingness to be patient with rate hikes, it has continued to stress that monetary policy will be data dependent.Given that the economy is starting to hit capacity constraints, it is still plausible that inflation will accelerate. In such a scenario, marketreaction could lead to a pre-emptive tightening of financial conditions in the form of widening spreads. Although emerging marketcountries have already undergone some adjustment in reaction to the increases in the federal funds rate last year, they remain acutelyvulnerable to adjustments in global financial markets.
» Cross-Sector - Global: The pace of monetary policy normalization will likely slow in 2019, January 2019
» Cross-Sector - Global: US-China relations to remain contentious, clouding global credit conditions, December 2018
» Sovereigns – Global 2019 outlook still stable, but slowing growth signals increasingly diverging prospects, November 2018
» Global Macro Outlook: 2018-2019 (November 2018 Update): Growth will remain solid in the near term, but early indicationssuggest it has peaked, August 2018
» Global Trade Monitor (July 2018): Escalation of global trade tensions becomes the baseline expectation, July 2018
» Moody’s Financial Monitor: Current conditions mask risks that will crystallize when the cycle turns, July 2018
» Global Macro Outlook: 2018-2019 (May 2018 Update): Near-term global economic outlook remains strong, but downside risks riseto the surface, May 2018
» Corporates - Global: High corporate leverage signals future credit stress even as the default rate remains very low, May 2018
Trade
» Global Trade Monitor – January 2019: Trade uncertainty is beginning to affect investment decisions, January 2019
» Autos - North America: NAFTA replacement deal is modestly negative for North American auto sector, October 2018
» Corporates - Europe: Trade tensions will modestly disrupt Europe's trade flow with the US and China, October 2018
» State and local government - US: North American trade deal benefits border economies and large auto-producing states, October2018
» Cross-Sector – Global: Escalating tensions will have unintended consequences for supply chains, October 2018
» Cross-Sector - US and China: Tariff escalation will take a toll on Chinese and US industries, particularly for US companies with largeChina exposure, September 2018
» Government of Germany: Auto tariffs would dampen German growth somewhat, but have no material credit implications for thesovereign, July 2018
» Retail & Business Products –US: China tariff would be credit negative for furniture & home goods retailers, July 2018
» Trade -US and Mexico: FAQ on NAFTA Renegotiation, US-Mexico Trade and US Economy, June 2018
» US: Looming US restrictions on technology transfer to China will moderately disrupt certain US industries, June 2018
» Automotive —Global: Potential US tariffs on imported vehicles, parts credit negative for most of industry, June 2018
» US and China:China tariff proposal has mixed credit implications for US sectors, May 2018
» Trade - China: Tech most exposed to US tariffs; supply chains to amplify effect on other sectors, April 2018
» US and Canada: NAFTA exit would weigh on states and provinces more than national economies, March 2018
» Trade -US: Steel and aluminum tariffs would hit heavy manufacturing sector the hardest, March 2018
» Sovereign - Global: US tariffs, if they prompt more trade restrictions, will hurt sovereigns globally, March 2018
» Steel - Europe: US import tariff is credit negative for the European steel industry, March 2018
14 28 February 2019 Global Macro Outlook 2019-20 (February 2019 Update): Global economy will continue to weaken throughout 2019 and into 2020
To access any of these reports, click on the entry above. Note that these references are current as of the date of publication of thisreport and that more recent reports may be available. All research may not be available to all clients.
Endnotes1 See FAQ on possible Brexit scenarios and their credit impact, December 5, 2019.
2 See UK parliamentary votes prolong Brexit uncertainty, January 29, 2019.
15 28 February 2019 Global Macro Outlook 2019-20 (February 2019 Update): Global economy will continue to weaken throughout 2019 and into 2020
CREDIT RATINGS ISSUED BY MOODY'S INVESTORS SERVICE, INC. AND ITS RATINGS AFFILIATES (“MIS”) ARE MOODY’S CURRENT OPINIONS OF THE RELATIVE FUTURE CREDITRISK OF ENTITIES, CREDIT COMMITMENTS, OR DEBT OR DEBT-LIKE SECURITIES, AND MOODY’S PUBLICATIONS MAY INCLUDE MOODY’S CURRENT OPINIONS OF THERELATIVE FUTURE CREDIT RISK OF ENTITIES, CREDIT COMMITMENTS, OR DEBT OR DEBT-LIKE SECURITIES. MOODY’S DEFINES CREDIT RISK AS THE RISK THAT AN ENTITYMAY NOT MEET ITS CONTRACTUAL FINANCIAL OBLIGATIONS AS THEY COME DUE AND ANY ESTIMATED FINANCIAL LOSS IN THE EVENT OF DEFAULT OR IMPAIRMENT. SEEMOODY’S RATING SYMBOLS AND DEFINITIONS PUBLICATION FOR INFORMATION ON THE TYPES OF CONTRACTUAL FINANCIAL OBLIGATIONS ADDRESSED BY MOODY’SRATINGS. CREDIT RATINGS DO NOT ADDRESS ANY OTHER RISK, INCLUDING BUT NOT LIMITED TO: LIQUIDITY RISK, MARKET VALUE RISK, OR PRICE VOLATILITY. CREDITRATINGS AND MOODY’S OPINIONS INCLUDED IN MOODY’S PUBLICATIONS ARE NOT STATEMENTS OF CURRENT OR HISTORICAL FACT. MOODY’S PUBLICATIONS MAYALSO INCLUDE QUANTITATIVE MODEL-BASED ESTIMATES OF CREDIT RISK AND RELATED OPINIONS OR COMMENTARY PUBLISHED BY MOODY’S ANALYTICS, INC. CREDITRATINGS AND MOODY’S PUBLICATIONS DO NOT CONSTITUTE OR PROVIDE INVESTMENT OR FINANCIAL ADVICE, AND CREDIT RATINGS AND MOODY’S PUBLICATIONSARE NOT AND DO NOT PROVIDE RECOMMENDATIONS TO PURCHASE, SELL, OR HOLD PARTICULAR SECURITIES. NEITHER CREDIT RATINGS NOR MOODY’S PUBLICATIONSCOMMENT ON THE SUITABILITY OF AN INVESTMENT FOR ANY PARTICULAR INVESTOR. MOODY’S ISSUES ITS CREDIT RATINGS AND PUBLISHES MOODY’S PUBLICATIONSWITH THE EXPECTATION AND UNDERSTANDING THAT EACH INVESTOR WILL, WITH DUE CARE, MAKE ITS OWN STUDY AND EVALUATION OF EACH SECURITY THAT IS UNDERCONSIDERATION FOR PURCHASE, HOLDING, OR SALE.
MOODY’S CREDIT RATINGS AND MOODY’S PUBLICATIONS ARE NOT INTENDED FOR USE BY RETAIL INVESTORS AND IT WOULD BE RECKLESS AND INAPPROPRIATE FORRETAIL INVESTORS TO USE MOODY’S CREDIT RATINGS OR MOODY’S PUBLICATIONS WHEN MAKING AN INVESTMENT DECISION. IF IN DOUBT YOU SHOULD CONTACTYOUR FINANCIAL OR OTHER PROFESSIONAL ADVISER. ALL INFORMATION CONTAINED HEREIN IS PROTECTED BY LAW, INCLUDING BUT NOT LIMITED TO, COPYRIGHT LAW,AND NONE OF SUCH INFORMATION MAY BE COPIED OR OTHERWISE REPRODUCED, REPACKAGED, FURTHER TRANSMITTED, TRANSFERRED, DISSEMINATED, REDISTRIBUTEDOR RESOLD, OR STORED FOR SUBSEQUENT USE FOR ANY SUCH PURPOSE, IN WHOLE OR IN PART, IN ANY FORM OR MANNER OR BY ANY MEANS WHATSOEVER, BY ANYPERSON WITHOUT MOODY’S PRIOR WRITTEN CONSENT.
CREDIT RATINGS AND MOODY’S PUBLICATIONS ARE NOT INTENDED FOR USE BY ANY PERSON AS A BENCHMARK AS THAT TERM IS DEFINED FOR REGULATORY PURPOSESAND MUST NOT BE USED IN ANY WAY THAT COULD RESULT IN THEM BEING CONSIDERED A BENCHMARK.
All information contained herein is obtained by MOODY’S from sources believed by it to be accurate and reliable. Because of the possibility of human or mechanical error as wellas other factors, however, all information contained herein is provided “AS IS” without warranty of any kind. MOODY'S adopts all necessary measures so that the information ituses in assigning a credit rating is of sufficient quality and from sources MOODY'S considers to be reliable including, when appropriate, independent third-party sources. However,MOODY’S is not an auditor and cannot in every instance independently verify or validate information received in the rating process or in preparing the Moody’s publications.
To the extent permitted by law, MOODY’S and its directors, officers, employees, agents, representatives, licensors and suppliers disclaim liability to any person or entity for anyindirect, special, consequential, or incidental losses or damages whatsoever arising from or in connection with the information contained herein or the use of or inability to use anysuch information, even if MOODY’S or any of its directors, officers, employees, agents, representatives, licensors or suppliers is advised in advance of the possibility of such losses ordamages, including but not limited to: (a) any loss of present or prospective profits or (b) any loss or damage arising where the relevant financial instrument is not the subject of aparticular credit rating assigned by MOODY’S.
To the extent permitted by law, MOODY’S and its directors, officers, employees, agents, representatives, licensors and suppliers disclaim liability for any direct or compensatorylosses or damages caused to any person or entity, including but not limited to by any negligence (but excluding fraud, willful misconduct or any other type of liability that, for theavoidance of doubt, by law cannot be excluded) on the part of, or any contingency within or beyond the control of, MOODY’S or any of its directors, officers, employees, agents,representatives, licensors or suppliers, arising from or in connection with the information contained herein or the use of or inability to use any such information.
NO WARRANTY, EXPRESS OR IMPLIED, AS TO THE ACCURACY, TIMELINESS, COMPLETENESS, MERCHANTABILITY OR FITNESS FOR ANY PARTICULAR PURPOSE OF ANY CREDITRATING OR OTHER OPINION OR INFORMATION IS GIVEN OR MADE BY MOODY’S IN ANY FORM OR MANNER WHATSOEVER.
Moody’s Investors Service, Inc., a wholly-owned credit rating agency subsidiary of Moody’s Corporation (“MCO”), hereby discloses that most issuers of debt securities (includingcorporate and municipal bonds, debentures, notes and commercial paper) and preferred stock rated by Moody’s Investors Service, Inc. have, prior to assignment of any rating,agreed to pay to Moody’s Investors Service, Inc. for ratings opinions and services rendered by it fees ranging from $1,000 to approximately $2,700,000. MCO and MIS also maintainpolicies and procedures to address the independence of MIS’s ratings and rating processes. Information regarding certain affiliations that may exist between directors of MCO andrated entities, and between entities who hold ratings from MIS and have also publicly reported to the SEC an ownership interest in MCO of more than 5%, is posted annually atwww.moodys.com under the heading “Investor Relations — Corporate Governance — Director and Shareholder Affiliation Policy.”
Additional terms for Australia only: Any publication into Australia of this document is pursuant to the Australian Financial Services License of MOODY’S affiliate, Moody’s InvestorsService Pty Limited ABN 61 003 399 657AFSL 336969 and/or Moody’s Analytics Australia Pty Ltd ABN 94 105 136 972 AFSL 383569 (as applicable). This document is intendedto be provided only to “wholesale clients” within the meaning of section 761G of the Corporations Act 2001. By continuing to access this document from within Australia, yourepresent to MOODY’S that you are, or are accessing the document as a representative of, a “wholesale client” and that neither you nor the entity you represent will directly orindirectly disseminate this document or its contents to “retail clients” within the meaning of section 761G of the Corporations Act 2001. MOODY’S credit rating is an opinion as tothe creditworthiness of a debt obligation of the issuer, not on the equity securities of the issuer or any form of security that is available to retail investors.
Additional terms for Japan only: Moody's Japan K.K. (“MJKK”) is a wholly-owned credit rating agency subsidiary of Moody's Group Japan G.K., which is wholly-owned by Moody’sOverseas Holdings Inc., a wholly-owned subsidiary of MCO. Moody’s SF Japan K.K. (“MSFJ”) is a wholly-owned credit rating agency subsidiary of MJKK. MSFJ is not a NationallyRecognized Statistical Rating Organization (“NRSRO”). Therefore, credit ratings assigned by MSFJ are Non-NRSRO Credit Ratings. Non-NRSRO Credit Ratings are assigned by anentity that is not a NRSRO and, consequently, the rated obligation will not qualify for certain types of treatment under U.S. laws. MJKK and MSFJ are credit rating agencies registeredwith the Japan Financial Services Agency and their registration numbers are FSA Commissioner (Ratings) No. 2 and 3 respectively.
MJKK or MSFJ (as applicable) hereby disclose that most issuers of debt securities (including corporate and municipal bonds, debentures, notes and commercial paper) and preferredstock rated by MJKK or MSFJ (as applicable) have, prior to assignment of any rating, agreed to pay to MJKK or MSFJ (as applicable) for ratings opinions and services rendered by it feesranging from JPY125,000 to approximately JPY250,000,000.
MJKK and MSFJ also maintain policies and procedures to address Japanese regulatory requirements.
REPORT NUMBER 1161581
16 28 February 2019 Global Macro Outlook 2019-20 (February 2019 Update): Global economy will continue to weaken throughout 2019 and into 2020