International Journal of Antimicrobial Agents 43 (2014) 279–283
Contents lists available at ScienceDirect
International Journal of Antimicrobial Agents
j o ur nal ho me pag e: ht tp : / /www.e lsev ier .com/ locate / i jant imicag
utpatient influenza antiviral prescription trends with influenza-likellness in the USA, 2008–2010�
atie J. Sudaa,∗, Sloan M. Regena, Todd A. Leeb, Jennifer L. Easterlinga, Robert J. Hunklerc,arry H. Danzigerb
Department of Clinical Pharmacy, University of Tennessee Health Science Center, 881 Madison Avenue #340, Memphis, TN 38163, USADepartment of Pharmacy Practice, University of Illinois at Chicago, 833 South Wood Street, Room 164, MC 886, Chicago, IL 60612, USADepartment of External Affairs, IMS Health, 83 Wooster Heights, Danbury, CT 06810, USA
r t i c l e i n f o
rticle history:eceived 4 June 2013ccepted 27 October 2013
eywords:ntiviral
nfluenzarescribing patternsrescription
a b s t r a c t
The 2009 novel H1N1 influenza A virus (H1N1) became a global pandemic. Data on antiviral prescrip-tions by location from 2008 to 2010 have not been reported. The purpose of this study was to assessantiviral geographic trends and correlation with influenza-like illness (ILI) over 3 years. Percent of out-patient ILI visits and antiviral prescriptions from 1 January 2008 to 31 December 2010 were included.Linear regression was used to assess correlation. In total, 14 million antivirals were dispensed during thisperiod. A 115% increase was observed in 2009 compared with prescriptions dispensed in 2008, and an 84%decrease was observed in 2010 compared with 2009. The rate of antivirals was 1.32 prescriptions/100persons in 2008, 2.85/100 persons in 2009 and 0.435/100 persons in 2010. 2009 regional growth was
observed in most states and was highest in the West (293%) and the Northeast (272%). A positive cor-relation was observed between antivirals and ILI visits (R2 = 0.7853; P < 0.0001). With the 2009 H1N1pandemic, antivirals increased compared with 2008 or 2010. Without the concern of H1N1, antiviralsdecreased in 2010 to levels lower than 2008. Geographic trends were also observed, which may be aresult of the different intensity of influenza transmission and difference practice patterns. ILI diagnoses
Each year, morbidity and mortality in the USA are significantlympacted by the influenza virus [1,2]. It is estimated that ca. 41,000eaths are attributed to infection with the seasonal influenza virusnnually [1]. Seasonal influenza, which usually peaks in the winteronths, is responsible for an annual average of more than 225,000
ospitalisations [2]. Seasonal influenza has a significant economicmpact both in direct and indirect costs. Disease-associated costsn the USA may total $10 billion yearly [3].
On 17 April 2009, the US Centers for Disease Control and Pre-ention (CDC) identified two cases of respiratory illness in childrenn California caused by a novel influenza A 2009 H1N1 virus [4]. By
9 April 2009, the CDC reported human-to-human transmission ofhe 2009 H1N1 virus, confirmed in 91 cases in several states acrosshe USA [5]. The virus spread rapidly across the globe, and on 11
� Part of this manuscript was presented in poster format at the 49th Annual Meet-ng of the Infectious Diseases Society of America (IDSA), 20–23 October 2011, Boston,
ral prescription use in the USA.r B.V. and the International Society of Chemotherapy. All rights reserved.
June 2009 the World Health Organization (WHO) declared a phase6 pandemic alert after the H1N1 virus was confirmed in almost30,000 influenza cases in 74 countries [6].
The 2009 H1N1 pandemic struck the USA in two waves.Although the first wave peaked in late May to early June anddeclined over the summer months, the amount of influenza activ-ity remained elevated compared with what is considered normalfor the second and third quarters of the calendar year [7]. The sec-ond 2009 H1N1 peak started in the Southeastern United States inlate August [8]. By the time the second wave peaked in October,the 2009 H1N1 pandemic was extensive in the USA, with all butone state reporting widespread influenza [9]. In December, theCDC reported that the 2009 H1N1 virus was the causative agentin >99% of all influenza in the USA [10]. Interestingly, in Januaryand February 2010, influenza activity levels were below normalfor the winter months [11]. Although the exact number of cases isunknown, the CDC approximates that 36–89 million cases of the2009 H1N1 influenza occurred between April 2009 and April 2010and it was responsible for ca. 195,000–403,000 hospitalisations and
8870–18,300 deaths [11].
Unlike seasonal influenza, which primarily causes hospitalisa-tions and deaths in people aged ≥65 years, 90% of hospitalisationsand 87% of deaths in patients with the 2009 H1N1 influenza were
n those <65 years of age [11]. Antiviral therapy is recommendedor people requiring hospitalisation and people at a high risk foromplications, such as children under the age of 5 years, pregnantomen, immunosuppressed patients, and people with chronic dis-
ase states such as diabetes and asthma [10]. Since the 2009 H1N1irus is resistant to the adamantine class, including amantadinend rimantadine [8], the CDC recommends that the neuraminidasenhibitors oseltamivir and zanamivir are the first-line medicationsor the treatment of 2009 H1N1 influenza and influenza-like ill-ess (ILI) in children and adults [10]. Antiviral agents indicated
or the treatment and prevention of influenza have been shown toecrease disease severity, duration of illness, hospitalisation andealthcare costs [12–15].
Influenza antivirals have been shown to be an early indicatorf 2008–2009 seasonal influenza in northern California [16] and in
national chain of community pharmacies [17]. Currently, therere no studies investigating geographic differences of dispensednfluenza antivirals from 2008 to 2010 and the impact of the 20091N1 influenza pandemic in the USA. The purpose of this study was
o evaluate outpatient trends in influenza antivirals by month andocation dispensed and correlation with ILI from 2008 to 2010.
. Materials and methods
This study is a population-level analysis of a nationally repre-entative database of outpatient antiviral prescriptions. Data onntiviral prescriptions dispensed between 1 January 2008 and 31ecember 2010 were extracted from IMS Health Xponent, a pro-rietary prescription database. This database reflects prescriptionedications dispensed from a representative sample of 73% of US-
nd includes products sourced from traditional commercial supplyhains. Medications dispensed from the strategic national stockpilere not included in the Xponent database. Xponent data are extrap-lated proportionately and represent a statistically valid projectionf all prescriptions, across all payers, filled in retail pharmacies inhe USA.
Outpatient visits of ILI diagnoses were obtained from CDC Flu-iew [18] as reported by the US Outpatient Influenza-like Illnessurveillance Network (ILINet). ILINet is a national influenza surveil-ance system composed of more than 3000 healthcare providers inll 50 states [19]. ILI diagnoses were adjusted for overall number ofutpatient visits.
Dispensed antiviral agents used for the treatment or preventionf influenza (oseltamivir, rimantadine and zanamivir) as defined bydriaenssens et al. were included in the analysis [20]. Data includedumber of prescriptions dispensed from community pharmacies,
ncluding chains, independents, mass merchandisers and foodtores. Patient and provider demographics were not available. Datef the prescription or outpatient visit was grouped into calendaronth and year. Winter months were defined as the first and fourth
uarters of the calendar year.Antiviral use was adjusted for population size by calculating the
nnual population-based rate. This rate is defined as the annualumber of antiviral prescriptions divided by US population mid-ear estimates as reported by the US Census Bureau. Geographicrea was defined by the zip code as recorded in the patient’sharmacy record. Regional grouping of states was categorised intoidwest, Northeast, South and West as defined by the US Census
ureau [21].
SAS 9.3 (SAS Institute Inc., Cary, NC) was used for data and sta-
istical analysis. Linear regression was used to determine whetherrends in systemic influenza antivirals correlated with percent ofutpatient visits with ILI diagnoses. The study was granted exempt
status by the University of Tennessee Health Science Center Insti-tutional Review Board (Memphis, TN).
3. Results
Over the 3-year period (2008–2010), 14 million antiviral pre-scriptions were dispensed (Table 1). The majority (8.7 million; 62%)of prescriptions were dispensed in 2009. 2008 prescriptions wereless than one-half of 2009 levels (4 million; 29% of total antivi-ral prescriptions) and were even fewer in 2010 (1.3 million; 9%).In total number of prescriptions and by rate, 2009 still exceededother years. When adjusted for population, 1.52 prescriptions (Rx)were utilised per 100 persons over the study period. Using 2008 asa baseline, Rx rates in 2009 were double the rate of the previousyear, and 2010 rates were below levels observed in 2008.
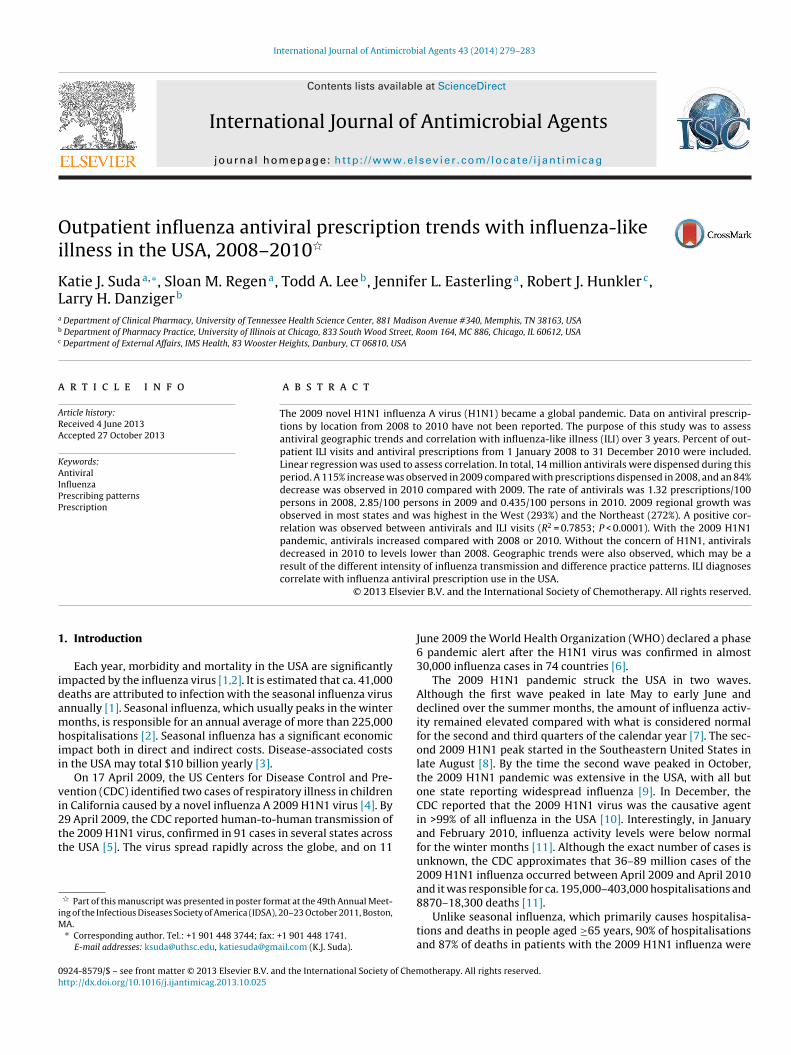
When adjusted for population, regional use was highest inthe South during the study period (2008 = 2.23 Rx/100 persons;2009 = 4.14 Rx/100 persons; 2010 = 0.794 Rx/100 persons) andwere lowest in the West in 2009 (1.77 Rx/100 persons) and theMidwest in 2008 and 2010 (1.26 Rx/100 persons and 0.123 Rx/100persons, respectively) as shown in Table 2. In 2009 and 2010, theten states with the highest Rx rate were all in the Southern USA:Mississippi (2009 = 6.80 Rx/100 persons; 2010 = 2.39 Rx/100 per-sons), Alabama (2009 = 6.24 Rx/100 persons; 2010 = 1.97 Rx/100persons) and Louisiana (2009 = 5.50 Rx/100 persons; 2010 = 1.34Rx/100 persons) were highest overall. A pictorial representation ofprescription rates adjusted for population dispensed in 2009 and2010 is shown in Fig. 1.
Compared with 2008, a 115% growth in the total number ofinfluenza antiviral prescriptions dispensed was observed in 2009compared with 2008 (Fig. 2; Table 2). 2009 regional growth washighest in the West (293%), followed by the Northeast (272%), South(86%) and Midwest (73%). From 2008 to 2009, growth of antivi-rals was seen in almost all 50 states (Fig. 2). The largest growthin dispensed antiviral prescriptions was in Utah (442%), California(397%) and New Mexico (361%). South Dakota, Nebraska and Kansaswere the only states that experienced decreases (28%, 8% and 5%,respectively). From 2009 to 2010, antiviral prescriptions decreasedby 84%. This decrease was observed in all regions of the USA:Midwest (94% decrease); Northeast (89%); West (88%); and South(81%). In 2010 every state had fewer antiviral prescriptions dis-
pensed, with 47 states and the District of Columbia experiencinga >75% decrease (Fig. 2). The greatest decreases were observed inNorth Dakota (96%), Wyoming (95%) and Minnesota (95%) and the
K.J. Suda et al. / International Journal of Antimicrobial Agents 43 (2014) 279–283 281
tion (R
s(
wapDtpdrq
((a
Fig. 1. Antiviral prescrip
mallest decreases in Georgia (63%), Mississippi (66%) and Alabama68%).
Peaks in the total number of antiviral prescriptions dispensedere observed in October 2009, February 2008, February 2009
nd May 2009 (Fig. 3). Annually, the greatest number of antiviralrescriptions was dispensed in February 2008, October 2009 andecember 2010. In 2008 and 2010, a decline in antiviral prescrip-
ions was observed in the second quarter, with minimal antiviralrescriptions dispensed in the summer months. 2009 had a similarecrease in the second quarter, but the number of influenza antivi-als remained elevated for the third quarter through the fourthuarter of the calendar year.
Similarly, peaks in ILI visits were reported in February 20085.08% of all visits), October 2009 (7.04%) and December 20102.79%) (Fig. 3). Additional months with an increase in influenzactivity occurred in February 2009 (3.15%) and May 2009 (3.36%).
Fig. 2. Growth in antiviral p
x) use per 100 persons.
Except for 2009, minimal influenza activity was observed duringthe second and third quarters of the calendar year. Consistentlyover the 3-year study period, annual trends in the use of pre-scription influenza antivirals correlate with outpatient visits for ILI(R2 = 0.7853; P < 0.0001).
4. Discussion
In a nationally representative sample of outpatient influenzaantiviral prescriptions, significantly more antivirals were dis-pensed during the 2009 H1N1 pandemic compared with 2008 and2010. This equalled an incremental increase of 4.7 million influenza
antiviral prescriptions. During the pandemic, this increase was astrain on the healthcare system and resulted in drug shortages[22]. Throughout the study period, the southern USA used moreantivirals, with the highest growth in prescriptions observed in
rescription (Rx) use.
282 K.J. Suda et al. / International Journal of Antimicrobial Agents 43 (2014) 279–283
0
1
2
3
4
5
6
7
8
0
500,000
1,000,000
1,500,000
2,000,000
2,500,000
3,000,000
Jan
08eb
08
ar 0
8pr
08
ay 0
8Ju
n 08
Jul 0
8ug
08
ep 0
8ct
08
ov 0
8ec
08
Jan
09eb
09
ar 0
9pr
09
May
09
Jun
09Ju
l 09
ug 0
9ep
09
ct 0
9ov
09
ec 0
9Ja
n 10
eb 1
0ar
10
pr 1
0ay
10
Jun
10Ju
l 10
ug 1
0ep
10
ct 1
0ov
10
ec 1
0
% o
f Out
pa�e
nt V
isits
with
ILI
Diag
nosi
s
Num
ber o
f pre
scrip
�ons
# Prescrip�ons %VisitsILI
rescri
tsldaaapt2cdoA2d[ar1tcaogtNga
iiupwnbrFcncTftbrgp
F M A M A S O N D F M A
Fig. 3. Antiviral p
he West and Northeast. A decrease in influenza antiviral con-umption was observed in 2010 even below baseline (2008). Lowerevels of prescriptions dispensed in 2010 could be as a result ofeclined influenza activity [23], lessening concern by consumersnd healthcare providers, decreased emphasis by the lay press,nd reduced education by public health officials to consumersnd the healthcare community. Annual trends in the number ofrescriptions dispensed were observed, with annual peaks in theotal number of antiviral prescriptions in February 2008, October009 and December 2010. According to influenza surveillanceonducted by the CDC, outpatient visits for ILI parallel trends inispensed antiviral prescriptions. The current results reflect that ofther investigators evaluating trends in antiviral use and influenza.tkins et al. found that oseltamivir and zanamivir from September009 through March 2010 correlated with the 2009 H1N1 pan-emic curve [15]. Studies evaluating a specific geographic area16] and the entire USA [17,24,25] found corresponding trends inntiviral prescriptions and influenza diagnoses. A nationally rep-esentative database equally robust to our source found that from991 to 2010 influenza antivirals typically peaked in the first quar-er of the calendar year [25]. Similar to the current results, antiviralsontinued to be dispensed in the second and third quarters of 2009t levels higher than observed in other seasons [25]. However, nonef the national studies illustrated an insight to prescribing by geo-raphic area. We observed the greatest overall prescription rates inhe southern USA, but dramatic growth was observed in 2009 in theortheast and West, areas with lower rates in 2008. Knowledge ofeographic prescribing during past pandemics can assist with drugllocation during future pandemics.
From the available data, we are unable to determine thendication for the prescription (i.e. prevention or treatment ofnfluenza or a non-infectious indication) or appropriateness ofse. Therefore, we are unable to determine whether the increasedrescriptions represent overprescribing or inappropriate use. Weere also unable to assess whether indicated populations didot receive influenza antivirals. Underprescribing of antivirals haseen reported during the 2009 H1N1 pandemic owing to concernsegarding adverse drug events, efficacy and severity of illness [26].inally, we were unable to assess whether increased antivirals inertain geographic areas was a reflection of differing socioeco-omic status, healthcare access or practice patterns (i.e. a providerhoosing outpatient antiviral treatment versus hospitalisation).he literature is limited on differing thresholds for hospitalisationsor influenza by geographic region. Dao et al. found that hospitalisa-ion rates differed by location of the Emerging Infections Program,
ut the highest rates by geographic area were variable over threeeported influenza seasons (2005–2008) [27]. Therefore, our geo-raphic variability results could be a reflection of differences inractice patterns by state.
A S O N D F M A M A S O N D
ptions by month.
Although rimantadine was included in this analysis, we do notexpect this to significantly impact the results. CDC recommenda-tions only include the neuraminidase inhibitors oseltamivir andzanamivir as the first-line medications for the treatment of 2009H1N1 influenza. Also, non-infectious use of antivirals accountsfor minimal use of the antiviral class (unpublished data, IMSHealth) and should not be influenced by seasonal variability. How-ever, amantadine is the only US Food and Drug Administration(FDA)-approved agent for non-influenza indications (treatmentof Parkinson’s disease and associated movement disorders) andwas not included in our prescription data. However, recent datahave shown that prescribing of the adamantanes for influenza stilloccurs regardless of surveillance indicating viral resistance as wellas CDC guidelines discouraging their use for influenza treatmentor prophylaxis [26]. The study published by Dharan et al. proba-bly underestimates the overall use of adamantanes for influenzabecause it describes practice patterns of infectious diseases physi-cians [26]. Providers without an infectious diseases specialty maynot be as familiar with continuously changing influenza treatmentguidelines or local or national viral resistance patterns.
Interestingly, the current results are in conflict with a 2011publication evaluating written antiviral prescriptions and visitsto outpatient providers for influenza from 2006 to 2010. Hershand Stafford found no increase in antiviral prescribing during the2009 H1N1 influenza pandemic compared with three previousinfluenza seasons despite a large increase in influenza visits [24].This discordance in results is intriguing because ca. 22% of writtenprescriptions are never dispensed [28], so data on drug prescribingcompared with prescriptions dispensed may overestimate med-ication use. Thus, dispensed prescriptions are thought to be abetter reflection of medication consumption. However, Hersh andStafford used a nationally representative survey of visits to ambu-latory physicians that did not include the practice patterns of otherproviders or physicians outside the ambulatory setting and con-tained limited information on emergency or urgent care visits ortelephone consultations. In addition, this data source only includedpatient visits during two consecutive work days for each calen-dar quarter [24]. To evaluate the treatment of influenza, a rapidlychanging infectious disease that typically occurs in the fourth andfirst quarter of the calendar year, two days per quarter may notbe sufficient to evaluate treatment patterns when susceptibilitiesand treatment guidelines are routinely updated as viral suscepti-bilities emerge. Therefore, we feel our data source is more robustfor estimating consumption of influenza antivirals.
Increased antiviral dispensing in 2009 could be a reflection of
increased education to the public regarding influenza treatment bypublic health authorities and/or concern of increased morbidity andmortality by healthcare providers and consumers. Decreased pre-scriptions in 2010 could have been a result of lower intensity of the
of Ant
inttbnaabOfp
5
pu2Gdtt2aasts
FHe
UB
R
[
[
[
[
[
[
[
[
[
[
[
[
[
[
[
[
[
[
[
[
[
K.J. Suda et al. / International Journal
nfluenza season, public perception that the H1N1 pandemic wasot as severe as originally anticipated, and decreased public educa-ion campaigns by health authorities regarding influenza. However,hese numbers could be a conservative estimate of antiviral useecause our data do not reflect prescriptions written that wereot dispensed, and some prescribers do not routinely prescribentivirals for influenza [26]. However, data on non-prescriptionnd prescription medication use from community pharmacies haveeen shown to be more real-time than data on diagnoses [29–31].ur data also do not account for state and federal use and release
rom stockpiles. However, according to the CDC, release from stock-iles was minimal [15].
. Conclusion
With the circulation of 2009 novel H1N1, twice as many antiviralrescriptions were dispensed overall and when adjusted for pop-lation as compared to 2008. Without the circulation of H1N1 in010, antiviral prescriptions decreased to levels lower than 2008.eographic trends were also observed, which may be a result of theifferent intensity of influenza transmission in different regions ofhe USA. Outpatient visits with an ILI diagnosis parallel prescrip-ion antiviral trends, including the first and second outbreaks of the009 novel H1N1 influenza strain. Healthcare providers may not bes concerned during typical seasonal influenza and do not prescribes many antivirals compared with pandemic influenza. Surveillanceystems should include dispensed influenza antiviral prescrip-ions to forecast the occurrence and intensity of the influenzaeason.
Funding: No funding sources.Competing interests: LHD has served on speaker’s bureaus for
orest and Cubist Pharmaceuticals; RJH is an employee of IMSealth (Danbury, CT). All other authors declare no competing inter-sts.
Ethical approval: This study was granted exempt status by theniversity of Tennessee Health Science Center Institutional Reviewoard (Memphis, TN).
eferences
[1] Dushoff J, Plotkin JB, Viboud C, Earn DJD, Simonsen L. Mortality due to influenzain the United States—an annualized regression approach using multiple-causemortality data. Am J Epidemiol 2006;163:181–7.
[2] Thompson W, Shay D, Weintraub E, Brammer L, Bridges CB, Cox NJ,et al. Influenza-associated hospitalizations in the United States. JAMA2004;292:1333–40.
[3] US Homeland Security Council. National strategy for pandemic influenza; 2005http://www.pandemicflu.gov/professional/federal/pandemic-influenza.pdf[accessed 13.01.12].
[4] Centers for Disease Control and Prevention (CDC). Swine influenza A (H1N1)infection in two children—Southern California, March–April 2009. MMWRMorb Mortal Wkly Rep 2009;58:400–2.
[5] Centers for Disease Control and Prevention (CDC). Update: infections with aswine-origin influenza A (H1N1) virus—United States and other countries, April28, 2009. MMWR Morb Mortal Wkly Rep 2009;58:431–3.
[6] World Health Organization. New influenza A (H1N1) virus: global epidemio-logical situation, June 2009. Wkly Epidemiol Rec 2009;84:249–57.
[7] Centers for Disease Control and Prevention (CDC). Update: influenza
[8] Centers for Disease Control and Prevention (CDC). Update: influenzaactivity—United States, August 30–October 31, 2009. MMWR Morb MortalWkly Rep 2009;58:1236–41.
[
imicrobial Agents 43 (2014) 279–283 283
[9] Centers for Disease Control and Prevention (CDC). Update: influenzaactivity—United States, August 30, 2009–January 9, 2010. MMWR Morb MortalWkly Rep 2010;59:38–43.
10] US Centers for Disease Control and Prevention. Updated interim recom-mendations for the use of antiviral medications in the treatment andprevention of influenza for the 2009–2010 season. http://www.cdc.gov/h1n1flu/recommendations.htm [accessed 06.01.12].
11] US Centers for Disease Control and Prevention. Updated CDC estimates of 2009H1N1 influenza cases, hospitalizations and deaths in the United States, April2009–April 10, 2010. http://www.cdc.gov/h1n1flu/estimates 2009 h1n1.htm[accessed 10.01.12].
12] Siston AM, Rasmussen SA, Honein MA, Fry AM, Seib K, Callaghan WM, et al.Pandemic 2009 influenza A(H1N1) virus illness among pregnant women in theUnited States. JAMA 2010;303:1517–25.
13] Yu H, Feng Z, Uyeki TM, Liao Q, Zhou L, Feng L. Risk factors for severe illnesswith 2009 pandemic influenza A (H1N1) virus infection in China. Clin Infect Dis2011;52:457–65.
14] Burch J, Corbett M, Stock C, Nicholson K, Elliot AJ, Duffy S, et al. Prescription ofanti-influenza drugs for healthy adults: a systematic review and meta-analysis.Lancet Infect Dis 2009;9:537–45.
15] Atkins CY, Patel A, Taylor TH, Biggerstaff M, Merlin TL, Dulin SM. Estimatingeffect of antiviral drug use during pandemic (H1N1) 2009 outbreak, UnitedStates. Emerg Infect Dis 2011;17:1591–8.
16] Greene SK, Kulldorff M, Huang J, Brand RJ, Kleinman KP, Hsu J, et al.Timely detection of localized excess influenza activity in Northern Californiaacross patient care, prescription, and laboratory data. Stat Med 2011;30:549–59.
17] Patwardhan A, Bilkovski R, Comparison. Flu prescription sales data from a retailpharmacy in the US with Google Flu trends and US ILINet (CDC) data as fluactivity indicator. PLoS ONE 2012;7:e43611.
18] US Centers for Disease Control and Prevention. A weekly influenza surveil-lance report prepared by the Influenza Division. http://gis.cdc.gov/grasp/fluview/fluportaldashboard.html [accessed 12.04.12].
19] US Centers for Disease Control and Prevention. Overview of influenza surveil-lance in the United States. http://www.cdc.gov/flu/weekly/overview.htm[accessed 12.04.12].
20] Adriaenssens N, Coenen S, Kroes AC, Versporten A, Vankerckhoven V,Muller A, et al. European surveillance of antimicrobial consumption(ESAC): systemic antiviral use in Europe. J Antimicrob Chemother 2011;66:1897–905.
21] US Census Bureau. Census regions and divisions of the United States.http://www.census.gov/geo/maps-data/maps/pdfs/reference/us regdiv.pdf[accessed 22.11.13].
22] American Society of Health-System Pharmacists. Oseltamivir phosphateoral suspension. http://www.ashp.org/DrugShortages/ResolvedShortages/Bulletin.aspx?id=71 [accessed 05.01.12].
23] Centers for Disease Control and Prevention (CDC). Update: Influenzaactivity—United States, 2010–11 season, and composition of the 2011–12influenza vaccine. MMWR Morb Mortal Wkly Rep 2011;60:705–12.
24] Hersh AL, Stafford RS. Antiviral prescribing by office-based physicians duringthe 2009 H1N1 pandemic. Ann Intern Med 2011;154:74–5.
25] Borders-Hemphill V, Mosholder A. U.S. utilization patterns of influenza antiviralmedications during the 2009 H1N1 influenza pandemic. Influenza Other RespirViruses 2012;6:e129–33.
26] Dharan NJ, Beekmann SE, Fiore A, Finelli L, Uyeki TM, Polgreen PM, et al.Influenza antiviral prescribing practices during the 2007–08 and 2008–09influenza seasons in the setting of increased resistance to oseltamivir amongcirculating influenza viruses. Antiviral Res 2010;88:182–6.
27] Dao CN, Kamimoto L, Nowell M, Reingold A, Gershman K, Meek J, et al.Adult hospitalizations for laboratory-positive influenza during the 2005–2006through 2007–2008 seasons in the United States. J Infect Dis 2010;202:881–8.
28] Fisher MA, Stedman MR, Lii J, Vogeli C, Shrank WH, Brookhart MA, et al. Primarymedication non-adherence: analysis of 195,930 electronic prescriptions. J GenIntern Med 2010;25:284–90.
29] Copeland KR, Allen AE. Basic models for mapping prescription drug data. In:Proceedings of the survey research methods section, American Statistical Asso-ciation 2005. Alexandria, VA: The American Statistical Association; 2005. p.2904–9.
30] Hogan WR, Tsui FC, Ivanov O, Gesteland PH, Grannis S, Overhage M, et al.Detection of pediatric respiratory and diarrheal outbreaks from sales of
over-the-counter electrolyte products. J Am Med Inform Assoc 2003;10:555–62.
31] Liu TY, Sanders JL, Tsui FC, Espino JU, Dato VM, Suyama J. Association ofover-the-counter pharmaceutical sales with influenza-like-illnesses to patientvolume in an urgent care setting. PLoS ONE 2013;8:e59273.